mackenzie river basin bilateral water management agreement...
TRANSCRIPT

AB‐NWT BWMA Appendices 2015‐02‐24
1
APPENDICES
MACKENZIE RIVER BASIN BILATERAL WATER MANAGEMENT AGREEMENT
Between the
Government of Alberta
And the
Government of the Northwest Territories
2015‐02‐24
FINAL

AB‐NWT BWMA Appendices 2015‐02‐24
2
List of Appendices
Appendix A – Risk Informed Management ........................................................................................... 4
A1. Overview ..................................................................................................................................... 4
A2. Classifying Transboundary Waters ............................................................................................... 4
A3. Bilateral Water Management Actions ........................................................................................... 7
A4. Annual Transboundary Meeting ...................................................................................................8
Appendix B – List of Transboundary Waters......................................................................................... 9
Appendix C – Use of Traditional and Local Knowledge........................................................................ 11
C1. Practices for the Use of Traditional and Local Knowledge in Bilateral Water Management ........ 11
C2. Framework ................................................................................................................................. 12
Appendix D – Surface Water Quantity ................................................................................................ 13
D1. Surface Water Quantity Classification ........................................................................................ 13
D2. Learning Plans ............................................................................................................................ 13
D3. Approach to Setting Transboundary Water Quantity Triggers ................................................... 14
D4. Approach to Setting Transboundary Water Quantity Objectives ............................................... 14
D5. Water Quantity Triggers and Objectives for Class 3 Water Bodies .............................................. 15
D6. Water Quantity Conditions and Actions ..................................................................................... 16
Appendix E – Surface Water Quality ................................................................................................... 18
E1. Surface Water Quality Classification ........................................................................................... 18
E2. Learning Plans ............................................................................................................................ 19
E3. Approach to Setting Water Quality Triggers ............................................................................... 20
E4. Interim Water Quality Triggers ................................................................................................... 22
E5. Approach to Setting Transboundary Water Quality Objectives .................................................. 31
E6. Toxic, Bioaccumulative and Persistent Substances ..................................................................... 33
Appendix F – Groundwater ................................................................................................................. 36
F1. Classification of Transboundary Groundwater ............................................................................ 36
F2. Learning Plans ............................................................................................................................ 36
F3. Triggers and Objectives .............................................................................................................. 37
Appendix G – Biological ...................................................................................................................... 39
G1. Classification .............................................................................................................................. 39

AB‐NWT BWMA Appendices 2015‐02‐24
3
G2. Learning Plans ............................................................................................................................ 39
G3. Biological Monitoring and Indicators .......................................................................................... 39
G4. Transboundary Biological Objectives ......................................................................................... 41
Appendix H – Learning Plans............................................................................................................... 42
H1 Surface Water Learning Plan ....................................................................................................... 42
H2. Groundwater Learning Plan ....................................................................................................... 45
Appendix I – Monitoring ...................................................................................................................... 47
I1. Summary of Commitments .......................................................................................................... 47
I2. Joint Monitoring Arrangements ................................................................................................... 47
I3. Water Quantity ............................................................................................................................ 48
I4. Water Quality .............................................................................................................................. 54
I5 Groundwater ................................................................................................................................. 75
I6 Biology ......................................................................................................................................... 75
Appendix J – Costs to Administer and Implement the Agreement ...................................................... 77

AB‐NWT BWMA Appendices 2015‐02‐24
4
Appendix A – Risk Informed Management
A1. Overview Risk Informed Management (RIM) is an approach that guides the identification and implementation of management actions and that is informed by an understanding of the risks to and uses of a transboundary water body. It applies to all Transboundary Waters, including both surface and Groundwater. The goals of the RIM approach are:
To support the achievement of the principles of the Master Agreement;
To facilitate joint learning and proactive and adaptive actions;
To apply human and financial resources in an efficient and effective manner.
Key principles include:
The nature and intensity of Bilateral Water Management is commensurate with the nature and intensity of the risks to and uses of Transboundary Waters;
Bilateral Water Management is based on a mutual understanding of the Ecological Integrity of the Aquatic Ecosystem;
Bilateral Water Management builds on the Jurisdictional Water Management actions of each Party as required to achieve the commitments of the Agreement.
The RIM approach will be implemented in a manner consistent with these goals and principles. The RIM approach is one of several tools for collectively meeting the Master Agreement principles. It complements the oversight provided by the Board as well as each Party’s Jurisdictional Water Management practices. The specific RIM Commitments are documented in section 4.3 of the Agreement. This appendix provides an overview of the approach, which will guide the implementation of this Agreement. Additional details that guide the implementation of this approach for surface water quantity, surface water quality, Groundwater and biological components are outlined in respective appendices and supplementary bilateral‐specific RIM documents. RIM details will be further developed by the Bilateral Management Committee (BMC) over time.
A2. Classifying Transboundary Waters Operationally, the RIM approach involves assigning Transboundary Waters to one of four classes (Figure 1), defining Bilateral Water Management actions commensurate with the class, and establishing a structured and transparent process for Bilateral Water Management. Classifications will be applied to Transboundary Waters at the border. The classification will consider development and use in the contributing basin as well as downstream needs. Bilateral Water Management actions may be directed at those contributing water bodies, but the classification is applied at the border. Criteria for classifying Transboundary Waters will be based on the type and magnitude of development along with other quantitative and qualitative factors. Classification will

AB‐NWT BWMA Appendices 2015‐02‐24
5
consider both existing and projected development, based on a detailed five‐year development forecast, as well as consider the longer‐term (ten‐year) outlook. Assignment of a transboundary water body to a particular class will be a joint decision by the Parties. Figure 1: Risk Informed Management Approach
Table 1 provides a high‐level summary of the four classes, including key commitments at each class, and some considerations for classification. To improve the transparency and consistency of classification, the Appendices of each Bilateral Water Management Agreement may contain more specific criteria and representative conditions that correspond to each class. However, the Parties recognize the need to retain flexibility in the future, as it will be impossible to identify every possible consideration. In general, as described in Table 1, water bodies with no or very low development/use are class 1. At class 1, it is expected that the Jurisdictional Water Management practices of each Party will be sufficient to meet transboundary commitments. Other than reporting, no Bilateral Water Management actions are required in this class. As warranted by increased development/use and other factors, Transboundary Waters will be moved to higher classes, where Bilateral Water Management actions are identified to complement Jurisdictional Water Management practices. Some level of current or planned development/use is necessary for a water body to move from class 1 to class 2, but there is no single threshold of development/use that causes a water body to move to class 2 or 3. To move from a class 1 to 2 or from class 2 to 3, the level of development/use is considered along with other factors to classify water bodies using a risk‐informed approach. Other factors beyond development levels that may influence the assignment of a water body to class 2 or class 3 include, but are not limited to:
Natural or other anthropogenic stressors or vulnerabilities;
Sensitive water or ecosystem uses (e.g., traditional uses, drinking waters, heritage sites or parks);
Use conflicts or controversy;
Water quality and quantity conditions or trends;
Aquatic Ecosystem (e.g., biological, human health or traditional use) conditions or trends.

AB‐NWT BWMA Appendices 2015‐02‐24
6
In other words, a water body that is stressed or vulnerable (e.g., low flows, etc.), supports sensitive uses (e.g., traditional use, drinking water, etc.), experiences water use conflicts (e.g., conflicts among users or public controversy about water or ecosystem conditions), and/or demonstrates negative conditions or trends in water quality, water quantity or Aquatic Ecosystem Indicators may move up in class at a lower level of development/use than a water body that does not. The intensity of Bilateral Water Management will increase as required to support continued achievement of RIM goals and Transboundary Objectives. At class 2, a Learning Plan tailored to the needs of the water body will be developed. Learning Plans will be developed using an integrated approach and will address relevant water quality, water quantity, Groundwater and biological considerations. As part of the Learning Plan, Triggers may be established to support learning, to prepare for setting and assessing the achievement of Transboundary Objectives, and to proactively address any negative trends. Triggers are defined in the Agreement as specific conditions defined by the Parties that will require a Jurisdictional and/or Bilateral Water Management response. More specifically, in the context of RIM, a Trigger is a pre‐defined early warning of change in typical or extreme conditions that results in confirmation of the change and Jurisdictional and/or Bilateral Water Management to address the change/trend. Multiple Triggers can be set to invoke additional actions as necessary (e.g., degrading conditions). At class 3, Transboundary Objectives will be established based on detailed, site‐specific analysis. Transboundary Objectives establish conditions that the responsible Party or Parties commit to meet. If the BMC determines that Transboundary Objectives are not met, the water body will be designated class 4, at which point the responsible Party or Parties will identify and implement action as in section 4.3 j) through m) of the Agreement with the goal of returning the water body to class 3. Table 1: Transboundary Classes
Class Key Commitments Classification Considerations
1 Reporting
Ensure that each Party’s Jurisdictional Water Management practices meet transboundary commitments and that its policy/regulatory processes include a provision to check for transboundary impacts. Report on Developments and Activities and share available information on Aquatic Ecosystems. No additional Bilateral Water Management actions are required.
Examples of Transboundary Waters in this class include those characterized by no or very little existing and projected development.
2 Learning
Initiate a Learning Plan (e.g., issue scoping, monitoring, data analysis, investigations into potential effect pathways) to improve our understanding of the requirements for protecting the Ecological Integrity of the Aquatic Ecosystem. A Learning Plan will include the compilation and review of existing data and information and, if necessary, the collection of additional baseline data. The Learning Plan will form the basis for the setting of Transboundary Objectives, should they be required. As part of the Learning Plan, Triggers may be established to initiate various kinds of management oversight or action.
Examples of Transboundary Waters in this class include water bodies with a moderate level of existing and/or projected development. Water bodies that are stressed or vulnerable (e.g., low flows), support sensitive uses (e.g., traditional uses, drinking water supply, etc.), experience a high degree of conflict or controversy, and/or demonstrate negative conditions or trends may be moved to class 2 at a lower level of development/use than other water bodies.
AB‐NWT BWMA Appendices 2015‐02‐24
7
Class Key Commitments Classification Considerations
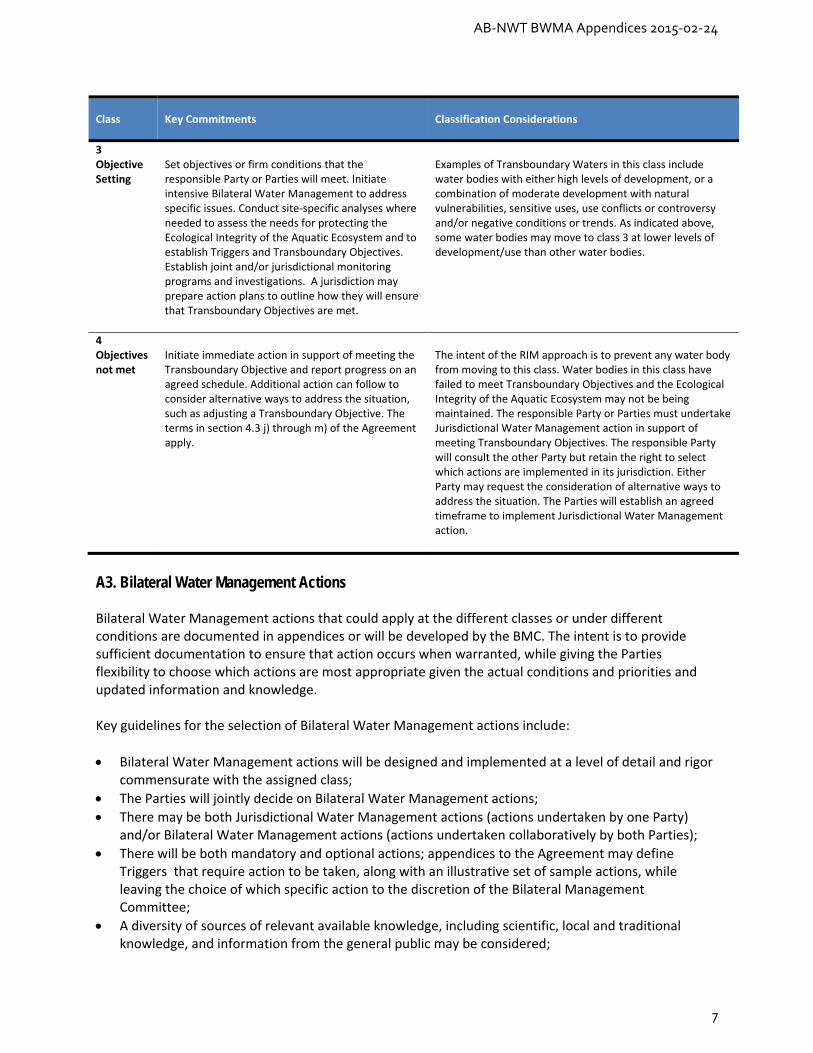
3 Objective Setting
Set objectives or firm conditions that the responsible Party or Parties will meet. Initiate intensive Bilateral Water Management to address specific issues. Conduct site‐specific analyses where needed to assess the needs for protecting the Ecological Integrity of the Aquatic Ecosystem and to establish Triggers and Transboundary Objectives. Establish joint and/or jurisdictional monitoring programs and investigations. A jurisdiction may prepare action plans to outline how they will ensure that Transboundary Objectives are met.
Examples of Transboundary Waters in this class include water bodies with either high levels of development, or a combination of moderate development with natural vulnerabilities, sensitive uses, use conflicts or controversy and/or negative conditions or trends. As indicated above, some water bodies may move to class 3 at lower levels of development/use than other water bodies.
4 Objectives not met
Initiate immediate action in support of meeting the Transboundary Objective and report progress on an agreed schedule. Additional action can follow to consider alternative ways to address the situation, such as adjusting a Transboundary Objective. The terms in section 4.3 j) through m) of the Agreement apply.
The intent of the RIM approach is to prevent any water body from moving to this class. Water bodies in this class have failed to meet Transboundary Objectives and the Ecological Integrity of the Aquatic Ecosystem may not be being maintained. The responsible Party or Parties must undertake Jurisdictional Water Management action in support of meeting Transboundary Objectives. The responsible Party will consult the other Party but retain the right to select which actions are implemented in its jurisdiction. Either Party may request the consideration of alternative ways to address the situation. The Parties will establish an agreed timeframe to implement Jurisdictional Water Management action.
A3. Bilateral Water Management Actions Bilateral Water Management actions that could apply at the different classes or under different conditions are documented in appendices or will be developed by the BMC. The intent is to provide sufficient documentation to ensure that action occurs when warranted, while giving the Parties flexibility to choose which actions are most appropriate given the actual conditions and priorities and updated information and knowledge. Key guidelines for the selection of Bilateral Water Management actions include:
Bilateral Water Management actions will be designed and implemented at a level of detail and rigor commensurate with the assigned class;
The Parties will jointly decide on Bilateral Water Management actions;
There may be both Jurisdictional Water Management actions (actions undertaken by one Party) and/or Bilateral Water Management actions (actions undertaken collaboratively by both Parties);
There will be both mandatory and optional actions; appendices to the Agreement may define Triggers that require action to be taken, along with an illustrative set of sample actions, while leaving the choice of which specific action to the discretion of the Bilateral Management Committee;
A diversity of sources of relevant available knowledge, including scientific, local and traditional knowledge, and information from the general public may be considered;

AB‐NWT BWMA Appendices 2015‐02‐24
8
Bilateral Water Management actions will be designed in recognition of data availability constraints, opportunities and needs (e.g., Transboundary Waters with limited data availability may be subject to different actions than water bodies with more sufficient data).
A4. Annual Transboundary Meeting The RIM approach includes a mandatory annual meeting of the Parties to discuss transboundary issues. At this meeting the Parties will:
Share information about the condition of, and trends in, the Ecological Integrity of the Aquatic Ecosystem, including but not limited to hydrological, meteorological, and ecological science, traditional knowledge and input from the general public of either Party;
Share updated information about current and future Developments and Activities that could affect the Ecological Integrity of the Aquatic Ecosystem of the other Party;
Share information about relevant activities, policies and programs (e.g., conservation programs, policy changes that could affect transboundary water management, etc.).
Based on updated information, the Parties will:
Jointly determine the classification for Transboundary Waters and update the relevant appendices to this Agreement;
Jointly develop and/or update Learning Plans, tracking metrics, Triggers and Transboundary Objectives, monitoring and other studies or investigations as required and update the relevant appendices;
Review the effectiveness of Bilateral Water Management and Jurisdictional Water Management actions and identify additional or revised actions;
Identify any other issues that need to be addressed.

AB‐NWT BWMA Appendices 2015‐02‐24
9
Appendix B – List of Transboundary Waters
A list of Transboundary Waters relevant to the Agreement is provided in Table 2. This list does not include Groundwater which is described in Appendix F. These water bodies were identified using 1:250,000 National Topographical System (NTS) maps available from Natural Resources Canada. All major Transboundary Waters are included on the list. The list is not exhaustive; all small Transboundary Waters may not be included. If development or water use occurs on Transboundary Waters that are not listed in Table 2, the water body will be added. All Transboundary Waters with current or projected (1‐5 years) development or use must be listed. Table 2: List of AB‐NWT Transboundary Waters
No. Water Body Crossing at 60° N Latitude Flow
Direction Longitude West
Area (km²)
1 Kakisa River tributary (Unnamed) AB to NWT ‐119.982 ‐1
2 Kakisa River 2 (final crossing into NWT) AB to NWT ‐119.948 ‐
3 Kakisa River 1 (first crossing into AB) NWT to AB ‐119.558 ‐
4 Unnamed Lake (tributary to Bistcho Lake and Petitot River)
NWT to AB ‐119.117 to ‐119.033
‐
5 Petitot River 2 (Spawn Lake) NWT to AB ‐118.467 ‐
6 Petitot River 1 AB to NWT ‐118.158 ‐
7 Esmond Creek NWT to AB ‐117.867 ‐
8 Unnamed Creek (tributary to Hay River) NWT to AB ‐117.400 ‐
9 Hay River tributaries (several) (from the Cameron Hills) NWT to AB ‐117.317 to ‐117.083
‐
10 Hay River AB to NWT ‐116.942 48,800
11 Swan Lake (tributary to Hay River) AB to NWT ‐116.767 ‐
12 Unnamed Creeks (2) (tributaries to Buffalo Lake) AB to NWT ‐116.500 and ‐116.433
‐
13 Yates River AB to NWT ‐116.071 ‐
14 Unnamed Creek (tributary to Yates River) AB to NWT ‐115.961 ‐
15 Unnamed Creek (tributary to Whitesand River) AB to NWT ‐115.736 ‐
16 Whitesand River AB to NWT ‐115.592 3,410
17 Tourangeau Creek tributary (Unnamed) AB to NWT ‐115.508 ‐
18 Tourangeau Creek AB to NWT ‐115.442 ‐
19 Buchan Lake AB to NWT ‐114.983 to ‐114.900
‐
1 Indicates the drainage area upstream of the boundary crossing has yet to be determined.

AB‐NWT BWMA Appendices 2015‐02‐24
10
No. Water Body Crossing at 60° N Latitude Flow
Direction Longitude West
Area (km²)
20 Buffalo River tributaries (Unnamed) AB to NWT ‐114.817 to ‐114.700
‐
21 Buffalo River 3 (meander‐final crossing into NWT) AB to NWT ‐114.508 4,350
22 Buffalo River 2 (meander into AB) NWT to AB ‐114.500 ‐
23 Buffalo River 1 (first crossing into NWT) AB to NWT ‐114.492 ‐
24 Unnamed lake (tributary to Buffalo River) AB to NWT ‐114.317 ‐
25 Copp River AB to NWT ‐114.161 ‐
26 Unnamed Lake (tributary to Copp River) AB to NWT ‐114.033 to ‐113.967
‐
27 Preble Creek AB to NWT ‐113.271 ‐
28 Little Buffalo River AB to NWT ‐112.871 3,330
29 Salt River AB to NWT ‐112.367 1,700
30 Slave River AB to NWT ‐111.833 to ‐111.783
606,000
31 Tethul River (tributary to Taltson River) AB to NWT ‐111.488 ‐
32 Donovan Lake (Tethul River) NWT to AB ‐111.225 ‐
33 Unnamed Lake (tributary to Donovan Lake) AB to NWT ‐111.167 ‐
34 Leland Lakes (Dog River) NWT to AB ‐110.983 to ‐110.967
‐
35 Charles Lake (Tethul River) AB to NWT ‐110.600 to ‐110.583
‐
36 Tethul River outflow from Disappointment Lake NWT to AB ‐110.483 ‐
37 Bayonet Lake (Tethul River) AB to NWT ‐110.308 ‐
38 Tethul River inflow to Largepike Lake AB to NWT ‐110.300 ‐
39 Harker Lake (Tethul River) AB to NWT ‐110.233 ‐
40 Wells Lake (Tethul River) AB to NWT ‐110.198 ‐
41 Miles Lake (tributary to Bedareh Lake and Hill Island River)
AB to NWT ‐110.022 ‐
Note: Table 2 is sorted west to east by longitude. The drainage area in the upstream jurisdiction that contributes water to the boundary crossing is provided.

AB‐NWT BWMA Appendices 2015‐02‐24
11
Appendix C – Use of Traditional and Local Knowledge
The Master Agreement acknowledges the need to consider traditional knowledge in cooperative water management decisions within the Basin. Traditional knowledge and local knowledge are not capitalized in this Agreement or appendices because they are not currently defined herein. Traditional and local knowledge will be defined as per the practices in section C1 below. Traditional and local knowledge are of critical importance to many Aboriginal and/or local communities. When peer reviewed by knowledge holders, traditional knowledge and local knowledge contribute to a greater understanding and more comprehensive analysis of the environment. Traditional knowledge has been considered as evidence under Canadian law. The following practices will guide the meaningful inclusion of traditional and local knowledge under the RIM approach in Bilateral Water Management (as per the Agreement and appendices). This guidance is adapted from the Board’s Traditional Knowledge & Strengthening Partnerships Committee and other published sources. The Parties see this appendix as a living document that will be informed by the future work of numerous parties, including the Parties, the Board, First Nations and Aboriginal organizations, and academics. C1. Practices for the Use of Traditional and Local Knowledge in Bilateral Water Management 1. Acknowledge the value of traditional and local knowledge and the importance of traditional use; 2. Engage in dialogue and collaborative pursuits to better understand the basis, scope, and meanings
of traditional and local knowledge and traditional use; 3. Identify the conclusions reached by the Parties regarding traditional and local knowledge; 4. Identify and implement ways to synthesize and blend traditional and local knowledge, western
science and other forms of knowledge in decision‐making under the RIM approach in Bilateral Water Management;
5. Establish and apply agreed definitions of traditional and local knowledge and traditional use with knowledge holders.
6. When requested by knowledge holders, ensure that the Parties protect sensitive traditional and local knowledge within the limits of a Party’s applicable legislation, including; (a) Ensuring knowledge holders provide their informed consent for the use of their traditional and
local knowledge; (b) Where consent is not given, respecting knowledge holders ownership and control of their
traditional and local knowledge; 7. Where they exist, adhere to Party and Aboriginal community guidelines, policies or protocols
regarding the collection and use of traditional and local knowledge, including: (a) Culturally appropriate methods of engaging with traditional and local knowledge holders when
gathering knowledge; (b) Culturally appropriate methods of presenting traditional and local knowledge; (c) Culturally appropriate methods of presenting western science information related to Bilateral
Water Management; (d) Providing reasonable benefits (e.g., cost reimbursement for participation) when working with
traditional and local knowledge holders; (e) Following formal research licensing guidelines.

AB‐NWT BWMA Appendices 2015‐02‐24
12
C2. Framework The BMC will develop a framework toward meaningful inclusion of traditional and local knowledge in decision making related to Bilateral Water Management.
AB‐NWT BWMA Appendices 2015‐02‐24
13
Appendix D – Surface Water Quantity
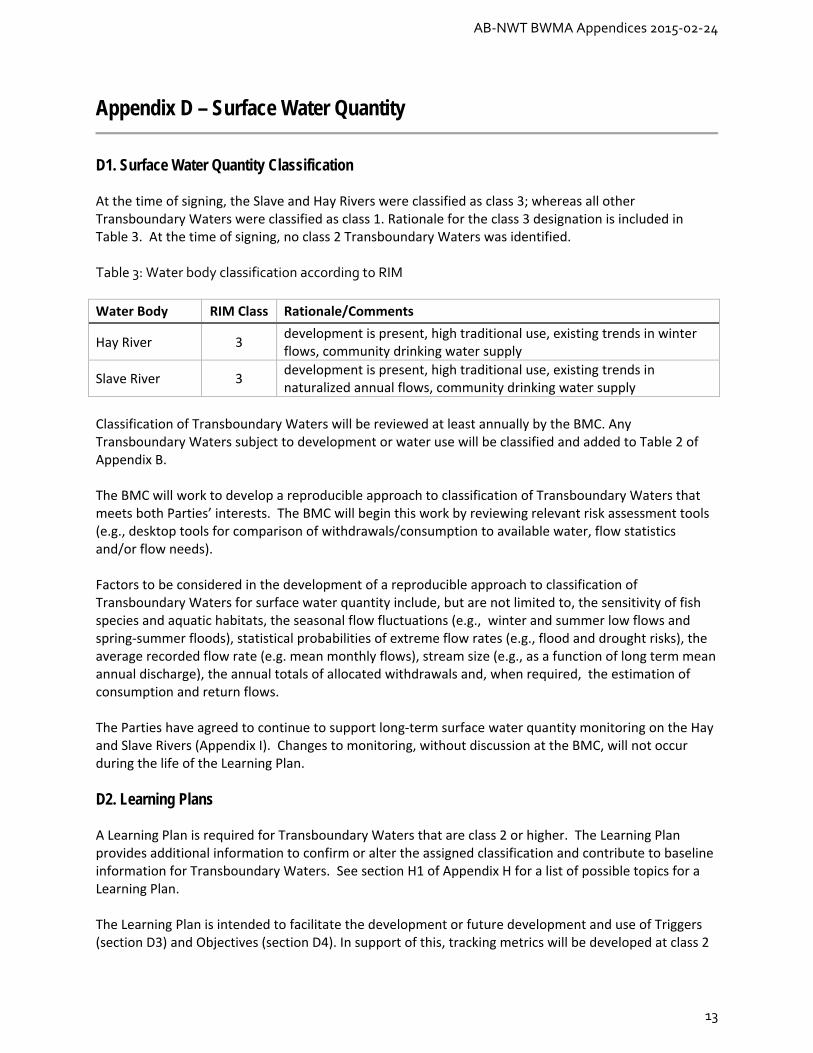
D1. Surface Water Quantity Classification At the time of signing, the Slave and Hay Rivers were classified as class 3; whereas all other Transboundary Waters were classified as class 1. Rationale for the class 3 designation is included in Table 3. At the time of signing, no class 2 Transboundary Waters was identified. Table 3: Water body classification according to RIM
Water Body RIM Class Rationale/Comments
Hay River 3 development is present, high traditional use, existing trends in winter flows, community drinking water supply
Slave River 3 development is present, high traditional use, existing trends in naturalized annual flows, community drinking water supply
Classification of Transboundary Waters will be reviewed at least annually by the BMC. Any Transboundary Waters subject to development or water use will be classified and added to Table 2 of Appendix B. The BMC will work to develop a reproducible approach to classification of Transboundary Waters that meets both Parties’ interests. The BMC will begin this work by reviewing relevant risk assessment tools (e.g., desktop tools for comparison of withdrawals/consumption to available water, flow statistics and/or flow needs). Factors to be considered in the development of a reproducible approach to classification of Transboundary Waters for surface water quantity include, but are not limited to, the sensitivity of fish species and aquatic habitats, the seasonal flow fluctuations (e.g., winter and summer low flows and spring‐summer floods), statistical probabilities of extreme flow rates (e.g., flood and drought risks), the average recorded flow rate (e.g. mean monthly flows), stream size (e.g., as a function of long term mean annual discharge), the annual totals of allocated withdrawals and, when required, the estimation of consumption and return flows. The Parties have agreed to continue to support long‐term surface water quantity monitoring on the Hay and Slave Rivers (Appendix I). Changes to monitoring, without discussion at the BMC, will not occur during the life of the Learning Plan.
D2. Learning Plans A Learning Plan is required for Transboundary Waters that are class 2 or higher. The Learning Plan provides additional information to confirm or alter the assigned classification and contribute to baseline information for Transboundary Waters. See section H1 of Appendix H for a list of possible topics for a Learning Plan. The Learning Plan is intended to facilitate the development or future development and use of Triggers (section D3) and Objectives (section D4). In support of this, tracking metrics will be developed at class 2

AB‐NWT BWMA Appendices 2015‐02‐24
14
for information, assessment and learning purposes. Tracking metrics in water quantity conditions will include stream flow and amount of water allocated for various uses. Ratios of allocated withdrawals (or of actual consumption) to stream flow will be tracked on an instantaneous, daily, weekly, monthly or annual basis as required to support development or future development of Triggers and Objectives. Learning Plans should help to understand baseline water quantity and reflect the seasonal site‐specific characteristics of each water body. This information will be used to aid with evaluation of whether a Transboundary Water should change RIM classification. The Parties agree, as part of the first five‐year work plan, to conduct a scoping study to examine the potential methods, feasibility and benefits of a broader study to inform the Bilateral Management Committee about how to take account of the effects of climate change in the setting and monitoring of Transboundary Objectives.
D3. Approach to Setting Transboundary Water Quantity Triggers This section describes the general approach to setting Transboundary Water Quantity Triggers. Specific Triggers are defined in section D5. As described in Appendix A, a Trigger is a pre‐defined early warning of change that results in confirmation of change and Jurisdictional and/or Bilateral Water Management to address the change/trend. Multiple Triggers can be set to invoke additional actions as necessary (e.g., degrading conditions). Triggers may be set for class 2 Transboundary Waters (where data is available) and will be set for class 3 Transboundary Waters, using the results of the Learning Plan if available, according to the RIM Approach. For water quantity, the Parties have defined a Trigger as a percentage of the Available Water (e.g., 50%) that, if exceeded, results in Jurisdictional and/or Bilateral Water Management that will be determined by the BMC. See section D5 for specific Triggers for Hay and Slave Rivers.
D4. Approach to Setting Transboundary Water Quantity Objectives This section describes the general approach to setting Transboundary Water Quantity Objectives. Specific Objectives are defined in section D5. Available Water will be shared as per section 6.1 c) of the Agreement and the sharing will be formalized into a Transboundary Water Quantity Objective if the relevant Transboundary Water reaches class 3. The setting of Transboundary Water Quantity Objectives requires site‐specific knowledge of stream flow and Available Water. Long‐term continuous monitoring of stream flow is important to characterize hydrology of a water body and to estimate Available Water. For class 3 Transboundary Waters, the BMC will set Transboundary Water Quantity Objectives and identify, based on the best available scientific information and/or a desktop method and/or an instream flow needs study, the amount of water needed to maintain the Ecological Integrity of the Aquatic Ecosystem and, hence, the Available Water.

AB‐NWT BWMA Appendices 2015‐02‐24
15
D5. Water Quantity Triggers and Objectives for Class 3 Water Bodies For the Hay and Slave Rivers, which have been designated class 3, the following has been determined. a) Slave River The Parties agree to defer determination of Available Water as per section 6.3 of the Agreement with the following addition: The Parties acknowledge that, at the time of signing, 2 billion cubic meters is equivalent to 1.9% of the average annual flow of the Slave River at Fitzgerald. If there is a significant change in the average annual flow of the Slave River at Fitzgerald that results in a change from 1.9% consumptive use, it will trigger related discussions at the BMC.
b) Other Class 3 Rivers This section currently includes the Hay River but will apply to any other rivers designated class 3, with the exception of the Slave River, unless otherwise agreed by the BMC. The Parties agree that:
There are vulnerabilities associated with winter flows and drought conditions;
The determination of Available Water will be guided by the “modified” (see below) Alberta Desktop Method;
The Alberta Desktop Method recommends allocating 85% of the instantaneous flow for ecosystem use, and that no abstractions of water be permitted below the weekly 20th percentile of flows; however, there are practical constraints associated with monitoring winter flows, precluding access to real time winter flow data;
They will endeavor to avoid abstractions from flowing waters during low flow conditions;
They will seek to improve their understanding of and ability to monitor winter flow conditions over time with the goal of improving management over time.
For the purposes of this section, “modified” means:
Modified according to the recommendations by the Department of Fisheries and Oceans2, which recommends allocating 90% of the instantaneous flow for ecosystem use;
Modified to acknowledge that the goal is to achieve the lowest abstractions practicable during low flow conditions, but that abstractions may be greater than zero due to practical considerations, such as type of use, availability and extent of risk plans, and infrastructure (e.g., storage).
Given that the Parties agree that the determination of Available Water will be guided by the “modified” Alberta Desktop Method, and that the Available Water will be shared equally, the Parties define the following interim Triggers for the Hay River: Trigger 1 is defined as water allocations reaching 50% of a Party’s share of Available Water. Trigger 2 is defined as water consumption reaching 80% of a Party’s share of Available Water. This approach will be used for other class 3 rivers unless agreed otherwise by the BMC.
2Framework for Assessing the Ecological Flow Requirements to Support Fisheries in Canada. DFO Can. Sci. Advis. Sec. Sci. Advis. Rep. 2013/017.

AB‐NWT BWMA Appendices 2015‐02‐24
16
Exceedance of these Triggers will result in management action as outlined in Table 4.
Elements of water quantity for the Learning Plan for the Slave River and Hay River may include, but are not limited to:
Identification of science and monitoring gaps;
Hydrometric monitoring of flow rate;
Key hydrologic features, such as lakes;
Trends in total annual and seasonal flows;
Frequency and severity of flood and drought;
Licensed allocation as compared to above, or other key tracking metrics;
Key conditions and mitigation measures included in water licenses;
Groundwater and surface water interactions;
Understanding the relationship between flow and water quality;
Understanding the relationship between flow and biology.
D6. Water Quantity Conditions and Actions Table 4 outlines some of the required responses to certain water quantity conditions that may arise in Transboundary Waters. This list was not exhaustive at the time of signing and the BMC will add to it as it deems necessary. It includes Water Quantity Triggers from section D5, as well as other conditions. Table 4: Conditions and Associated Actions
Water Quantity Condition Required Response Sample Actions /
Comments
Development and/or water use occurs in the Transboundary Water not listed in Appendix B
The Transboundary Water will be added to the list in Appendix B.
Transboundary Water is classified
Licensed withdrawals are tracked.
Transboundary Water is designated as a class 2
Learning Plan is developed and implemented.
Tracking metrics are determined.
Triggers may be developed
Amounts of withdrawals and return flows are estimated.
Compile baseline data and assess need for new information.
Track ratios of licensed, other authorized, or actual withdrawals to stream flow.
Improve understanding of Aquatic Ecosystem.
Prepare for the setting of Transboundary Water Quantity Objectives, if required.

AB‐NWT BWMA Appendices 2015‐02‐24
17
Water Quantity Condition Required Response Sample Actions /
Comments
A drought (or flood) event occurs in any classified Transboundary Water
Notify other jurisdiction of event and identify any actions that will be taken immediately or if event persists.
If required, assess impact to water quality, Groundwater and biological components of the Aquatic Ecosystem.
Determine whether a Trigger or Transboundary Water Quantity Objective (if applicable) has been reached.
Suspend uses as required to maintain Aquatic Ecosystem health
Transboundary Water is designated as a class 3
Learning Plans and/or Tracking metrics adjusted as needed
Develop or apply Triggers and set Transboundary Water Quantity Objectives based on an agreed desktop method or an instream flow needs study.
Tracking metrics changed from licensed allocations to actual withdrawals
Assess need to conduct instream flow needs study.
Total allocated water (licenses and other authorized withdrawals) in upstream jurisdiction exceeds Trigger 1 and/or 2.
The BMC will seek confirmation of actual withdrawals and estimated return flows.
Refine estimate of return flows
Actual water consumption exceeds Trigger 2 (approaches Transboundary Water Quantity Objective)
If Transboundary Water Quantity Objectives have not been set using an instream flow needs study, revise Trigger and/or Transboundary Water Quantity Objectives based on a refined desktop method or proceed with the determination of the Available Water through an Instream Flow Needs Study.
Jurisdictional Water Management
Actual water consumption exceeds Transboundary Water Quantity Objective
Clauses in sections 4.3 j) through m) Agreement apply.
Transboundary Water may be designated a class 4
Class 4 Jurisdictional Water Management actions, if designated.

AB‐NWT BWMA Appendices 2015‐02‐24
18
Appendix E – Surface Water Quality
E1. Surface Water Quality Classification At the time of signing, the Slave and Hay Rivers were classified as a class 3 for water quality (Table 5). All other Transboundary Waters listed in Table 2 were classified as class 1 and no class 2 Transboundary Waters were identified. Table 5: Water body classification according to RIM
Water Body RIM Class Rationale/Comments
Hay River 3 Development is present, high traditional use, existing annual trends in water quality, community drinking water supply
Slave River 3 Development is present, high traditional use, existing trends in water quality, community drinking water supply
Ongoing monitoring of water quality in Transboundary Waters is essential for refining the approach used to assess risk to surface water quality. The Parties have agreed to continue long‐term surface water quality monitoring on the Slave and Hay Rivers as per Appendix I. Changes to monitoring, without discussion at the BMC, will not occur during the life of the Learning Plan. The water quality monitoring on the Salt, Little Buffalo and Buffalo Rivers was discontinued in 2010. To date, no water quality monitoring has taken place on the Whitesand and Yates Rivers. Classification of Transboundary Waters will be reviewed at least annually by the BMC. The Parties agree that a reproducible approach for classification of Transboundary Waters is warranted. The BMC will develop an approach that meets both Parties’ interests. The BMC will begin this work by reviewing the existing draft Water Quality Ranking System to Classify Transboundary Water Bodies provided by British Columbia and the Receiving Water Classification System for the NWT provided by the Northwest Territories. Other relevant approaches will also be considered.

AB‐NWT BWMA Appendices 2015‐02‐24
19
E2. Learning Plans A Learning Plan is required for Transboundary Waters that are class 2 or higher. The Learning Plan provides additional information to confirm or alter the assigned classification and contribute to baseline information for Transboundary Waters. See section H1 of Appendix H for a list of candidate topics for a Learning Plan. The Learning Plan will include a screening level risk assessment which will incorporate a monitoring strategy, dependent upon the availability of information, and the level of risk to receptors. A key objective of the Learning Plan will be to evaluate the current and projected level of risk posed to water quality, quantity, biology and the Aquatic Ecosystem. This will involve the review of all available relevant watershed information (e.g., land and water use, ongoing and proposed resource development, existing water quality, quantity, biological Indicators data, and traditional use values) and the preparation of a conceptual model that describes the:
Point and non‐point source discharges;
Parameters of concern and their environmental fate and transport pathways;
Human, biological and ecological receptors. The Learning Plan is intended to facilitate the development or future development and use of Triggers (sections E3 and E4) and Objectives (section E5). In support of this, tracking metrics will be developed at class 2 for information, assessment and learning purposes. They will be developed using valid methods to help understand baseline water quality, identify changes in water quality conditions, assess the risk of development, and enable the BMC to identify potential provincial/territorial water quality issues. Generally, they will be based on the same or complementary methods as those used for Triggers (see section E3), although there may be additional tracking metrics that require different methods (e.g., ratios). Tracking metrics will aid with the evaluation of whether a water body should change RIM classification. The Learning Plan and the information gathered from tracking metrics will be useful to support the development of Triggers and Transboundary Water Quality Objectives (section E3 and E5), as required (see section H1 of Appendix H). The Parties agree, as part of the first five‐year work plan, to conduct a scoping study to examine the potential methods, feasibility and benefits of a broader study to inform the Bilateral Management Committee about how to take account of the effects of climate change in the setting and monitoring of Transboundary Objectives.

AB‐NWT BWMA Appendices 2015‐02‐24
20
E3. Approach to Setting Water Quality Triggers This section describes the general approach to setting Water Quality Triggers. Triggers are defined specifically in section E4. As described in Appendix A, a Trigger is a pre‐defined early warning of change that results in confirmation of change and Jurisdictional and/or Bilateral Water Management to address the change/trend. Water Quality Triggers may be defined for class 2 and will be defined for class 3. Triggers may include water quality parameters as well as human, biological, or ecological Indicators. Triggers will help to understand ambient water quality conditions, identify changes in water quality conditions and enable the BMC to identify potential interprovincial/territorial water quality issues. The Triggers also help to assess the impact of proposed or existing developments on water quality and enable the BMC to identify and discuss potential water quality issues. The Parties agree that their intent is to manage water quality within the range of natural variability. Triggers are an aid to this. It is understood that Water Quality Objectives, when they are set, may be beyond the range of natural variability, while still being suitably precautionary (per section 7 of the Agreement) and in accordance with section E5 below. Triggers will reflect the site‐specific characteristics of each water body. Where possible, seasonal site‐specific ambient water quality data will be used. Triggers will be established based on existing scientific literature (Table 6). They will cover a broad range of parameters to facilitate learning.

AB‐NWT BWMA Appendices 2015‐02‐24
21
Table 6: Definitions, examples and potential management actions for Triggers that have been or will be set for water quality parameters as identified through the Learning Plan.
Definition Examples Potential Management Actions
Trigger 1
A pre‐defined early warning of potential changes in typical conditions which results in Jurisdictional and/or Bilateral Water Management to confirm that change. Multiple Triggers can be set to invoke additional actions if conditions decline.
Exceedance of a water quality concentration based on background conditions, beyond what is statistically expected.
Shift in central tendency (e.g., 50th percentile) and/or some other percentile (e.g., 75th)
A statistically significant degrading trend in water quality
A change in the dissolved:total ratio.
A pre‐defined degree of change in land or water use.
Trigger 1 can be used either alone or in conjunction with Trigger 2
Jointly review water quality data/changes
Confirm the change is real
Jointly investigate cause and risk (e.g., land uses change)
Investigate other media (hydrometric, sediment and/or biota), as appropriate, to provide supporting evidence
Trigger 2
A second early warning indication that extreme conditions are changing which results in Jurisdictional and/or Bilateral Water Management
A second pre‐defined early warning to provide additional information to confirm changes in conditions
For water quality or biological parameters, this would be defined statistically (e.g., 90th percentile background or 95 upper prediction limits)
Trigger 2 can be used either alone or in conjunction with Trigger 1
Continue investigation using an ecosystem approach using all available evidence (i.e., weight of evidence approach)
Adjust monitoring design (e.g., increase frequency, parameters, and/or sites) as necessary
Compare to upstream, downstream and/or regional sites
Discuss the need to change to class 3

AB‐NWT BWMA Appendices 2015‐02‐24
22
E4. Interim Water Quality Triggers The Parties have agreed to use the best currently available sources of information to establish Interim Water Quality Triggers. For these interim triggers, they have agreed to use the method defined in (HDR, 20143, 20154). They acknowledge that there are a number of outstanding methodological questions, including but not limited to:
Number of seasons and their definition
Which percentile is the best to use
How to use the triggers (e.g., separately and/or together) to draw conclusions about trends They expect that mutual learning will occur through implementation and that they may modify the approach based on implementation experience. The Parties have defined the following interim triggers for the parameters in Tables 7 and 8:
Trigger 1 is defined as exceedance of the 50th percentile value beyond what is statistically expected (potential changes in typical conditions)
Trigger 2 is defined as exceedance of the 90th percentile value beyond what is statistically expected (potential changes in extreme conditions)
When these values are exceeded at a frequency beyond what is statistically expected, the actions in Table 6 will be initiated. Trigger 1 and 2 may be considered separately and/or together in order to improve understanding and identify appropriate action. The 50th and 90th percentiles have been calculated for water quality parameters that are part of the Slave River (at Fitzgerald) and Hay River (near the Alberta/NWT Boundary) water quality monitoring programs (Tables 7 and 8; HDR, 2014 & 2015). Methods will be explored to develop Triggers for organic compounds (e.g., hydrocarbons, pesticides and herbicides) not already listed in Table 10 during the first Learning Plan. Some of the data from total and dissolved mercury samples collected on the Slave and Hay Rivers historically has been deemed suspect (i.e., problems with field sampling techniques) by the organization that collected the samples. The BMC will review all total, dissolved and methyl mercury data collected from the Slave and Hay Rivers to determine appropriate interim Triggers for mercury within the first two years of signing.
3 HDR, Decision Economics. Site Specific Water Quality Objectives at Six Transboundary Rivers in the Northwest Territories: Technical Report. March 2014. 4 HDR, Decision Economics. Site Specific Water Quality Objectives at the Hay and Slave Transboundary Rivers: Technical Report. February 2015.

AB‐NWT BWMA Appendices 2015‐02‐24
23
Table 7. Reference Percentiles for Surface Water Quality Triggers for the Slave River at Fitzgerald
Slave River at Fitzgerald
Objective Class Seasonal Open Water/Under Ice Annual
Objective SubClass Spring Summer Fall Winter Open Water Under Ice
Percentile 50thP 90thP 50thP 90thP 50thP 90thP 50thP 90thP 50thP 90thP 50thP 90thP 50thP 90thP
Alkalinity (mg/L) 84.7 93.5 85.9 97.0 81.0 92.3 84.4 93.6 * * * * * *
Dissolved Oxygen (mg/L) ‐‐ ‐‐ ‐‐ ‐‐ ‐‐ ‐‐ ‐‐ ‐‐ 9.70 12.35 13.10 14.07 * *
pH (pH units) 7.91 8.10 7.99 8.18 7.97 8.14 7.89 8.06 * * * * * *
Specific Conductance (µS/cm) 212 262 212 256 200 247 210 240 * * * * * *
Total Dissolved Solids (mg/L) ‐‐ ‐‐ ‐‐ ‐‐ ‐‐ ‐‐ ‐‐ ‐‐ 146 209 130 164 * *
Total Suspended Solids (mg/L) 210 1370 148 1117 59 141 18 360 * * * * * *
Turbidity (NTU) 141 850 81 1591 49 81 14 211 * * * * * *
Calcium – dissolved (mg/L) 28.9 33.9 28.8 34.3 26.8 30.7 28.3 31.9 * * * * * *
Chloride – dissolved (mg/L) 4.40 7.02 3.77 5.90 5.97 7.27 5.24 7.60 * * * * * *
Magnesium – dissolved (mg/L) 6.49 7.40 6.91 7.94 6.52 7.42 6.58 7.06 * * * * * *
Sodium – dissolved (mg/L) 6.50 8.12 5.96 7.30 6.90 8.61 6.09 7.74 * * * * * *
Potassium – dissolved (mg/L) 1.20 2.16 0.95 1.26 0.86 1.00 0.84 1.50 * * * * * *
Sulphate ‐ dissolved (mg/L) 20.5 27.2 18.5 28.1 17.4 21.5 17.5 20.8 * * * * * *
Ammonia ‐ dissolved (mg/L) ‐‐ ‐‐ ‐‐ ‐‐ ‐‐ ‐‐ ‐‐ ‐‐ 0.013 0.052 0.018 0.107 * *
Nitrogen – dissolved (mg/L) 0.270 0.544 0.240 0.425 0.180 0.356 0.206 0.527 * * * * * *
Nitrate + Nitrite (mg/L) ‐‐ ‐‐ ‐‐ ‐‐ ‐‐ ‐‐ ‐‐ ‐‐ ‐‐ ‐‐ ‐‐ ‐‐ 0.070 0.201
Organic Carbon – dissolved (mg/L) 8.11 13.24 7.84 12.36 5.80 9.04 4.00 6.22 * * * * * *
Organic Carbon – particulate (mg/L) 4.16 12.98 3.80 26.97 1.70 2.90 0.72 8.85 * * * * * *

AB‐NWT BWMA Appendices 2015‐02‐24
24
Slave River at Fitzgerald
Objective Class Seasonal Open Water/Under Ice Annual
Objective SubClass Spring Summer Fall Winter Open Water Under Ice
Percentile 50thP 90thP 50thP 90thP 50thP 90thP 50thP 90thP 50thP 90thP 50thP 90thP 50thP 90thP
Phosphorus – dissolved (mg/) 0.016 0.061 0.012 0.033 0.010 0.014 0.008 0.020 * * * * * *
Phosphorus – total (mg/L) 0.207 0.695 0.189 1.718 0.078 0.140 0.030 0.382 * * * * * *
Aluminum – dissolved (µg/L) ‐‐ ‐‐ ‐‐ ‐‐ ‐‐ ‐‐ ‐‐ ‐‐ ‐‐ ‐‐ ‐‐ ‐‐ 29.1 90.4
Aluminum – total (µg/L) ‐‐ ‐‐ ‐‐ ‐‐ ‐‐ ‐‐ ‐‐ ‐‐ 1395 6192 223 5132 * *
Antimony – dissolved (µg/L) ‐‐ ‐‐ ‐‐ ‐‐ ‐‐ ‐‐ ‐‐ ‐‐ ‐‐ ‐‐ ‐‐ ‐‐ 0.155 0.359
Antimony – total (µg/L) ‐‐ ‐‐ ‐‐ ‐‐ ‐‐ ‐‐ ‐‐ ‐‐ ‐‐ ‐‐ ‐‐ ‐‐ 0.130 0.291
Arsenic – dissolved (µg/L) ‐‐ ‐‐ ‐‐ ‐‐ ‐‐ ‐‐ ‐‐ ‐‐ ‐‐ ‐‐ ‐‐ ‐‐ 0.410 0.560
Arsenic – total (µg/L) ‐‐ ‐‐ ‐‐ ‐‐ ‐‐ ‐‐ ‐‐ ‐‐ ‐‐ ‐‐ ‐‐ ‐‐ 1.08 3.53
Barium – dissolved (µg/L) ‐‐ ‐‐ ‐‐ ‐‐ ‐‐ ‐‐ ‐‐ ‐‐ ‐‐ ‐‐ ‐‐ ‐‐ 47.0 54.3
Barium – total (µg/L) 116 391 108 541 73 102 80 160 * * * * * *
Beryllium – dissolved (µg/L) ‐‐ ‐‐ ‐‐ ‐‐ ‐‐ ‐‐ ‐‐ ‐‐ ‐‐ ‐‐ ‐‐ ‐‐ 0.005 0.011
Beryllium – total (µg/L) ‐‐ ‐‐ ‐‐ ‐‐ ‐‐ ‐‐ ‐‐ ‐‐ 0.110 0.686 0.050 0.318 * *
Bismuth – dissolved (µg/L) ‐‐ ‐‐ ‐‐ ‐‐ ‐‐ ‐‐ ‐‐ ‐‐ ‐‐ ‐‐ ‐‐ ‐‐ 0.0020 0.0063
Bismuth – total (µg/L) ‐‐ ‐‐ ‐‐ ‐‐ ‐‐ ‐‐ ‐‐ ‐‐ ‐‐ ‐‐ ‐‐ ‐‐ 0.018 0.052
Boron – dissolved (µg/L) ‐‐ ‐‐ ‐‐ ‐‐ ‐‐ ‐‐ ‐‐ ‐‐ ‐‐ ‐‐ ‐‐ ‐‐ 12.7 17.9
Boron – total (µg/L) ‐‐ ‐‐ ‐‐ ‐‐ ‐‐ ‐‐ ‐‐ ‐‐ ‐‐ ‐‐ ‐‐ ‐‐ 13.9 18.9
Cadmium – dissolved (µg/L) ‐‐ ‐‐ ‐‐ ‐‐ ‐‐ ‐‐ ‐‐ ‐‐ ‐‐ ‐‐ ‐‐ ‐‐ 0.021 0.112
Cadmium – total (µg/L) 0.40 1.45 0.30 3.52 0.10 0.94 0.11 1.00 * * * * * *
Chromium – dissolved (µg/L) ‐‐ ‐‐ ‐‐ ‐‐ ‐‐ ‐‐ ‐‐ ‐‐ ‐‐ ‐‐ ‐‐ ‐‐ 0.130 0.480
Chromium – total (µg/L) ‐‐ ‐‐ ‐‐ ‐‐ ‐‐ ‐‐ ‐‐ ‐‐ 2.21 14.70 0.64 8.70 * *

AB‐NWT BWMA Appendices 2015‐02‐24
25
Slave River at Fitzgerald
Objective Class Seasonal Open Water/Under Ice Annual
Objective SubClass Spring Summer Fall Winter Open Water Under Ice
Percentile 50thP 90thP 50thP 90thP 50thP 90thP 50thP 90thP 50thP 90thP 50thP 90thP 50thP 90thP
Cobalt – dissolved (µg/L) ‐‐ ‐‐ ‐‐ ‐‐ ‐‐ ‐‐ ‐‐ ‐‐ ‐‐ ‐‐ ‐‐ ‐‐ 0.060 0.144
Cobalt – total (µg/L) 2.15 8.41 1.76 14.30 0.80 1.72 0.50 3.25 * * * * * *
Copper – dissolved (µg/L) ‐‐ ‐‐ ‐‐ ‐‐ ‐‐ ‐‐ ‐‐ ‐‐ ‐‐ ‐‐ ‐‐ ‐‐ 2.07 4.21
Copper – total (µg/L) 7.05 23.91 5.00 41.10 2.78 4.57 2.00 10.42 * * * * * *
Iron – dissolved (µg/L) ‐‐ ‐‐ ‐‐ ‐‐ ‐‐ ‐‐ ‐‐ ‐‐ * * * * 91 211
Iron – total (µg/L) ‐‐ ‐‐ ‐‐ ‐‐ ‐‐ ‐‐ ‐‐ ‐‐ 2910 16160 473 11180 * *
Lead – dissolved (µg/L) ‐‐ ‐‐ ‐‐ ‐‐ ‐‐ ‐‐ ‐‐ ‐‐ ‐‐ ‐‐ ‐‐ ‐‐ 0.129 0.417
Lead – total (µg/L) 3.18 11.72 2.77 24.40 1.25 3.06 0.90 6.62 * * * * * *
Lithium – dissolved (µg/L) ‐‐ ‐‐ ‐‐ ‐‐ ‐‐ ‐‐ ‐‐ ‐‐ ‐‐ ‐‐ ‐‐ ‐‐ 3.90 5.30
Lithium – total (µg/L) ‐‐ ‐‐ ‐‐ ‐‐ ‐‐ ‐‐ ‐‐ ‐‐ 7.22 21.04 4.00 11.86 * *
Manganese – dissolved (µg/L) ‐‐ ‐‐ ‐‐ ‐‐ ‐‐ ‐‐ ‐‐ ‐‐ ‐‐ ‐‐ ‐‐ ‐‐ 3.12 9.07
Manganese – total (µg/L) ‐‐ ‐‐ ‐‐ ‐‐ ‐‐ ‐‐ ‐‐ ‐‐ 72 361 16 359 * *
Mercury – dissolved (µg/L) ‐‐ ‐‐ ‐‐ ‐‐ ‐‐ ‐‐ ‐‐ ‐‐ ‐‐ ‐‐ ‐‐ ‐‐ ‐‐ ‐‐
Mercury – total (µg/L) ‐‐ ‐‐ ‐‐ ‐‐ ‐‐ ‐‐ ‐‐ ‐‐ ‐‐ ‐‐ ‐‐ ‐‐ ‐‐ ‐‐
Molybdenum – dissolved (µg/L) ‐‐ ‐‐ ‐‐ ‐‐ ‐‐ ‐‐ ‐‐ ‐‐ ‐‐ ‐‐ ‐‐ ‐‐ 0.770 0.954
Molybdenum – total (µg/L) ‐‐ ‐‐ ‐‐ ‐‐ ‐‐ ‐‐ ‐‐ ‐‐ 0.631 1.124 0.606 0.800 * *
Nickel – dissolved (µg/L) ‐‐ ‐‐ ‐‐ ‐‐ ‐‐ ‐‐ ‐‐ ‐‐ ‐‐ ‐‐ ‐‐ ‐‐ 1.24 2.16
Nickel – total (µg/L) 6.85 26.44 5.55 41.00 2.80 6.21 1.70 9.97 * * * * * *
Selenium – dissolved (µg/L) ‐‐ ‐‐ ‐‐ ‐‐ ‐‐ ‐‐ ‐‐ ‐‐ ‐‐ ‐‐ ‐‐ ‐‐ 0.210 0.310
Selenium – total (µg/L) ‐‐ ‐‐ ‐‐ ‐‐ ‐‐ ‐‐ ‐‐ ‐‐ ‐‐ ‐‐ ‐‐ ‐‐ 0.230 0.382

AB‐NWT BWMA Appendices 2015‐02‐24
26
Slave River at Fitzgerald
Objective Class Seasonal Open Water/Under Ice Annual
Objective SubClass Spring Summer Fall Winter Open Water Under Ice
Percentile 50thP 90thP 50thP 90thP 50thP 90thP 50thP 90thP 50thP 90thP 50thP 90thP 50thP 90thP
Silver – dissolved (µg/L) ‐‐ ‐‐ ‐‐ ‐‐ ‐‐ ‐‐ ‐‐ ‐‐ ‐‐ ‐‐ ‐‐ ‐‐ 0.0022 0.015
Silver – total (µg/L) ‐‐ ‐‐ ‐‐ ‐‐ ‐‐ ‐‐ ‐‐ ‐‐ 0.048 0.133 0.100 0.157 * *
Strontium – dissolved (µg/L) ‐‐ ‐‐ ‐‐ ‐‐ ‐‐ ‐‐ ‐‐ ‐‐ ‐‐ ‐‐ ‐‐ ‐‐ 134 157
Strontium – total (µg/L) ‐‐ ‐‐ ‐‐ ‐‐ ‐‐ ‐‐ ‐‐ ‐‐ 147 192 133 158 * *
Thallium – dissolved (µg/L) ‐‐ ‐‐ ‐‐ ‐‐ ‐‐ ‐‐ ‐‐ ‐‐ ‐‐ ‐‐ ‐‐ ‐‐ 0.009 0.024
Thallium – total (µg/L) ‐‐ ‐‐ ‐‐ ‐‐ ‐‐ ‐‐ ‐‐ ‐‐ ‐‐ ‐‐ ‐‐ ‐‐ 0.030 0.138
Uranium ‐ dissolved (µg/L) ‐‐ ‐‐ ‐‐ ‐‐ ‐‐ ‐‐ ‐‐ ‐‐ ‐‐ ‐‐ ‐‐ ‐‐ 0.409 0.539
Uranium ‐ total (µg/L) ‐‐ ‐‐ ‐‐ ‐‐ ‐‐ ‐‐ ‐‐ ‐‐ ‐‐ ‐‐ ‐‐ ‐‐ 0.510 1.060
Vanadium – dissolved (µg/L) ‐‐ ‐‐ ‐‐ ‐‐ ‐‐ ‐‐ ‐‐ ‐‐ ‐‐ ‐‐ ‐‐ ‐‐ 0.351 0.537
Vanadium – total (µg/L) 5.28 19.47 3.78 39.85 1.80 4.71 0.70 8.40 * * * * * *
Zinc – dissolved (µg/L) ‐‐ ‐‐ ‐‐ ‐‐ ‐‐ ‐‐ ‐‐ ‐‐ ‐‐ ‐‐ ‐‐ ‐‐ 1.00 7.80
Zinc – total (µg/L) 20.0 79.4 13.2 146.5 6.7 14.9 7.4 38.8 * * * * * *
Notes:
1. 50thP: Trigger 1 (50th percentile; median); 90thP: Trigger 2 (90th percentile) 2. "‐‐" Less than 30 observations. Trigger values will be calculated and tested during the Learning Plan when sufficient data (n≥30) is available. 3. "*"In accordance with section E3, only the most detailed trigger values are included in this table. All subclass trigger values are included in the Technical Appendix entitled: Site
Specific Water Quality Objectives at the Hay and Slave Transboundary Rivers: Technical Report (HDR Decision Economics, February 2015) and are available for testing during the Learning Plan.
4. Spring: May and June, Summer: July and August, Fall: September and October, Winter: November to April 5. Open Water: Spring, Summer and Fall; Ice Covered: Winter

AB‐NWT BWMA Appendices 2015‐02‐24
27
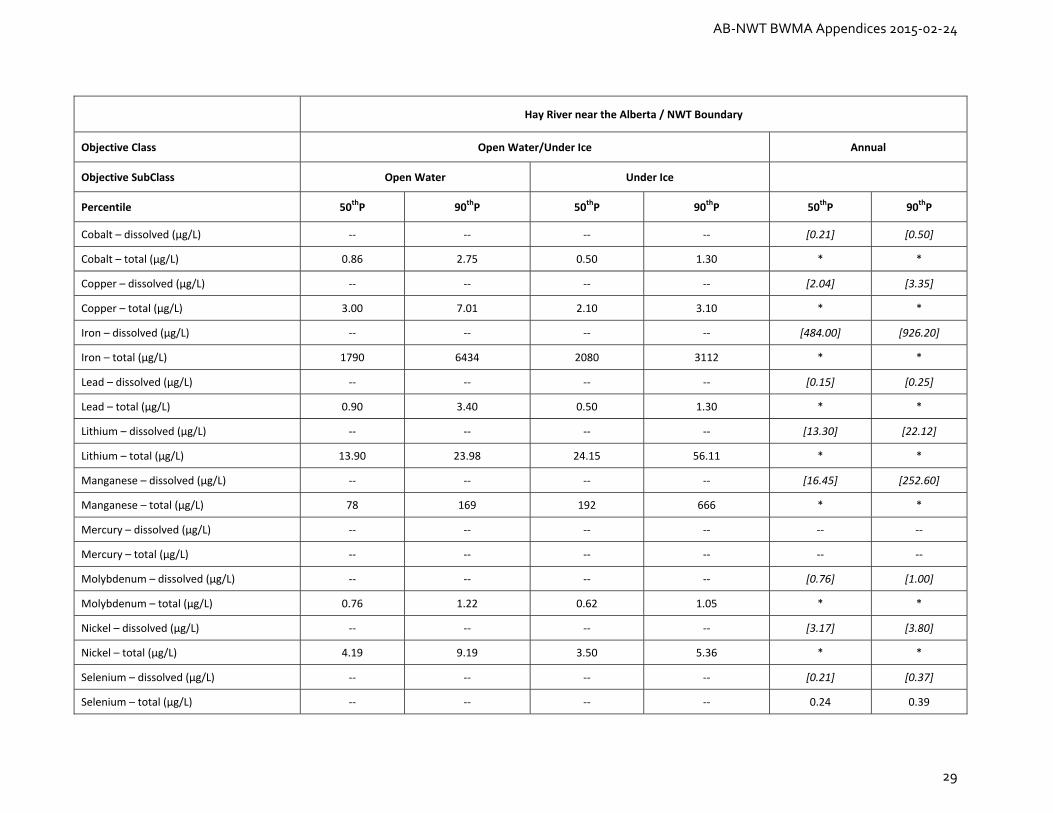
Table 8. Reference Percentiles for Surface Water Quality Triggers for the Hay River near the Alberta/NWT Boundary
Hay River near the Alberta / NWT Boundary
Objective Class Open Water/Under Ice Annual
Objective SubClass Open Water Under Ice
Percentile 50thP 90thP 50thP 90thP 50thP 90thP
Alkalinity (mg/L) 93 127 191 272 * *
Dissolved Oxygen (mg/L) 8.80 11.22 5.75 10.10 * *
pH (pH units) 7.81 8.12 7.46 7.79 * *
Specific Conductance (µS/cm) 322 401 584 793 * *
Total Dissolved Solids (mg/L) 249 302 414 549 * *
Total Suspended Solids (mg/L) 41.0 218.0 6.0 12.0 * *
Turbidity (NTU) 33.1 149.0 12.5 20.5 * *
Calcium – dissolved (mg/L) 40.0 49.0 73.7 99.5 * *
Chloride – dissolved (mg/L) 2.84 5.21 7.42 12.27 * *
Magnesium – dissolved (mg/L) 11.3 14.4 21.4 29.3 * *
Sodium – dissolved (mg/L) 12.5 15.9 21.5 32.7 * *
Potassium – dissolved (mg/L) 1.90 2.67 2.42 3.12 * *
Sulphate ‐ dissolved (mg/L) 61.0 88.4 105.0 141.4 * *
Ammonia ‐ dissolved (mg/L) 0.018 0.054 0.070 0.217 * *
Nitrogen – dissolved (mg/L) 0.617 1.009 0.924 1.498 * *
Nitrate + Nitrite (mg/L) ‐‐ ‐‐ ‐‐ ‐‐ 0.090 0.587
Organic Carbon – dissolved (mg/L) 25.6 32.7 28.2 37.2 * *
Organic Carbon – particulate (mg/L) 2.10 4.77 0.68 1.57 * *

AB‐NWT BWMA Appendices 2015‐02‐24
28
Hay River near the Alberta / NWT Boundary
Objective Class Open Water/Under Ice Annual
Objective SubClass Open Water Under Ice
Percentile 50thP 90thP 50thP 90thP 50thP 90thP
Phosphorus – dissolved (mg/) 0.025 0.050 0.027 0.049 * *
Phosphorus – total (mg/L) 0.107 0.256 0.054 0.113 * *
Aluminum – dissolved (µg/L) ‐‐ ‐‐ ‐‐ ‐‐ [22.00] [47.69]
Aluminum – total (µg/L) 436 2086 89 211 * *
Antimony – dissolved (µg/L) ‐‐ ‐‐ ‐‐ ‐‐ [0.16] [0.20]
Antimony – total (µg/L) ‐‐ ‐‐ ‐‐ ‐‐ 0.108 0.168
Arsenic – dissolved (µg/L) ‐‐ ‐‐ ‐‐ ‐‐ [0.765] [1.153]
Arsenic – total (µg/L) ‐‐ ‐‐ ‐‐ ‐‐ [1.49] [3.27]
Barium – dissolved (µg/L) ‐‐ ‐‐ ‐‐ ‐‐ [41.40] [58.84]
Barium – total (µg/L) 60 102 80 110
Beryllium – dissolved (µg/L) ‐‐ ‐‐ ‐‐ ‐‐ [0.01] [0.02]
Beryllium – total (µg/L) 0.050 0.176 0.050 0.050
Bismuth – dissolved (µg/L) ‐‐ ‐‐ ‐‐ ‐‐ [0.003] [0.005]
Bismuth – total (µg/L) ‐‐ ‐‐ ‐‐ ‐‐ [0.01] [0.03]
Boron – dissolved (µg/L) ‐‐ ‐‐ ‐‐ ‐‐ [30.00] [49.49]
Boron – total (µg/L) ‐‐ ‐‐ ‐‐ ‐‐ 31.95 47.25
Cadmium – dissolved (µg/L) ‐‐ ‐‐ ‐‐ ‐‐ [0.03] [0.06]
Cadmium – total (µg/L) 0.120 0.500 0.200 0.520 * *
Chromium – dissolved (µg/L) ‐‐ ‐‐ ‐‐ ‐‐ [0.14] [0.21]
Chromium – total (µg/L) 0.790 3.370 0.344 0.660 * *
AB‐NWT BWMA Appendices 2015‐02‐24
29
Hay River near the Alberta / NWT Boundary
Objective Class Open Water/Under Ice Annual
Objective SubClass Open Water Under Ice
Percentile 50thP 90thP 50thP 90thP 50thP 90thP
Cobalt – dissolved (µg/L) ‐‐ ‐‐ ‐‐ ‐‐ [0.21] [0.50]
Cobalt – total (µg/L) 0.86 2.75 0.50 1.30 * *
Copper – dissolved (µg/L) ‐‐ ‐‐ ‐‐ ‐‐ [2.04] [3.35]
Copper – total (µg/L) 3.00 7.01 2.10 3.10 * *
Iron – dissolved (µg/L) ‐‐ ‐‐ ‐‐ ‐‐ [484.00] [926.20]
Iron – total (µg/L) 1790 6434 2080 3112 * *
Lead – dissolved (µg/L) ‐‐ ‐‐ ‐‐ ‐‐ [0.15] [0.25]
Lead – total (µg/L) 0.90 3.40 0.50 1.30 * *
Lithium – dissolved (µg/L) ‐‐ ‐‐ ‐‐ ‐‐ [13.30] [22.12]
Lithium – total (µg/L) 13.90 23.98 24.15 56.11 * *
Manganese – dissolved (µg/L) ‐‐ ‐‐ ‐‐ ‐‐ [16.45] [252.60]
Manganese – total (µg/L) 78 169 192 666 * *
Mercury – dissolved (µg/L) ‐‐ ‐‐ ‐‐ ‐‐ ‐‐ ‐‐
Mercury – total (µg/L) ‐‐ ‐‐ ‐‐ ‐‐ ‐‐ ‐‐
Molybdenum – dissolved (µg/L) ‐‐ ‐‐ ‐‐ ‐‐ [0.76] [1.00]
Molybdenum – total (µg/L) 0.76 1.22 0.62 1.05 * *
Nickel – dissolved (µg/L) ‐‐ ‐‐ ‐‐ ‐‐ [3.17] [3.80]
Nickel – total (µg/L) 4.19 9.19 3.50 5.36 * *
Selenium – dissolved (µg/L) ‐‐ ‐‐ ‐‐ ‐‐ [0.21] [0.37]
Selenium – total (µg/L) ‐‐ ‐‐ ‐‐ ‐‐ 0.24 0.39

AB‐NWT BWMA Appendices 2015‐02‐24
30
Hay River near the Alberta / NWT Boundary
Objective Class Open Water/Under Ice Annual
Objective SubClass Open Water Under Ice
Percentile 50thP 90thP 50thP 90thP 50thP 90thP
Silver – dissolved (µg/L) ‐‐ ‐‐ ‐‐ ‐‐ [0.004] [0.008]
Silver – total (µg/L) ‐‐ ‐‐ ‐‐ ‐‐ 0.013 0.066
Strontium – dissolved (µg/L) ‐‐ ‐‐ ‐‐ ‐‐ [138.00] [264.60]
Strontium – total (µg/L) 126 156 224 305 * *
Thallium – dissolved (µg/L) ‐‐ ‐‐ ‐‐ ‐‐ [0.008] [0.014]
Thallium – total (µg/L) ‐‐ ‐‐ ‐‐ ‐‐ 0.017 0.066
Uranium ‐ dissolved (µg/L) ‐‐ ‐‐ ‐‐ ‐‐ [0.54] [1.47]
Uranium ‐ total (µg/L) ‐‐ ‐‐ ‐‐ ‐‐ 0.645 1.494
Vanadium – dissolved (µg/L) ‐‐ ‐‐ ‐‐ ‐‐ [0.42] [0.54]
Vanadium – total (µg/L) 1.60 6.32 0.50 0.86 * *
Zinc – dissolved (µg/L) ‐‐ ‐‐ ‐‐ ‐‐ [1.28] [12.03]
Zinc – total (µg/L) 6.3 22.5 4.9 17.0 * *
Notes:
1. 50thP: Trigger 1 (50th percentile; median); 90thP: Trigger 2 (90th percentile) 2. "‐‐" Less than 30 observations. Trigger values will be calculated and tested during the Learning Plan when sufficient data (n≥30) is available. 3. "*"In accordance with section E3, only the most detailed trigger values are included in this table. All subclass trigger values are included in the Technical Appendix entitled:
Site Specific Water Quality Objectives at the Hay and Slave Transboundary Rivers: Technical Report (HDR Decision Economics, February 2015) and are available for testing during the Learning Plan.
4. Spring: May and June, Summer: July and August, Fall: September and October, Winter: November to April 5. Open Water: Spring, Summer and Fall; Ice Covered: Winter 6. Values in square brackets are preliminary calculations based on n=26 or 27. They will be recalculated when n=30.

AB‐NWT BWMA Appendices 2015‐02‐24
31
E5. Approach to Setting Transboundary Water Quality Objectives This section describes the general approach to setting Water Quality Objectives. For class 3 Transboundary Waters, Transboundary Water Quality Objectives will be set to protect the most sensitive use/user of the water body which includes:
Drinking water;
Traditional uses;
Aquatic life;
Wildlife;
Agriculture (irrigation and livestock watering);
Recreation and aesthetics;
Industrial water supplies including food processing. In setting Transboundary Water Quality Objectives, the Parties will:
Consider a range of relevant methods;
Select methods that are credible and transparent;
Utilize relevant science and traditional and local knowledge;
Ensure that methods and resulting Transboundary Water Quality Objectives are based on a weight‐of‐evidence approach (including science and traditional knowledge);
Use best available data and information, and improve / adapt over time;
Consider the ecological significance of trends in water quality and quantity;
Design Transboundary Water Quality Objectives to protect all uses, including traditional uses;
For the protection of aquatic life, design Transboundary Water Quality Objectives to protect the most sensitive species at all life stages;
Consider the potential for synergistic and cumulative effects from multiple sources and parameters;
Recognize each Party’s right to use water and equitably share the assimilative capacity;
Recognize that NWT has obligations to the terms of land claims agreements, which the Parties have reviewed and understood;
Meaningfully engage other interested third parties and bring their input to the BMC.
The Parties agree that the approach to develop and implement Transboundary Water Quality Objectives requires further discussion and resources (Table 9). The Parties also agree that the task to develop Transboundary Water Quality Objectives is of utmost priority and work will begin on objective development within the first year of the Agreement being signed.

AB‐NWT BWMA Appendices 2015‐02‐24
32
Table 9: Definitions, examples and potential management actions for Transboundary Water Quality Objectives
Definition Examples Potential Management Actions
A Transboundary Water Quality Objective is a conservative value that is protective of all uses of the water body, including the most sensitive use.
Exceedance of a Transboundary Water Quality Objective identifies an unacceptable change and results in Jurisdictional and/or Bilateral Water Management including the responsible jurisdiction taking necessary action to stop trend and/or exceedance(s).
A defined numerical value agreed to by both Parties through the BMC
A narrative statement describing the biological characteristics of the ecosystem e.g., healthy fish populations
Responsible jurisdiction takes necessary Jurisdictional Water Management action to stop trend and/or exceedance(s).
Exceedance of a Transboundary Water Quality Objective may move the water body from a class 3 to a class 4.

AB‐NWT BWMA Appendices 2015‐02‐24
33
E6. Toxic, Bioaccumulative and Persistent Substances
As per section 7 d) of the Agreement, the Parties are committed to pollution prevention and sustainable development to meet the objective of virtual elimination for substances that are human‐made, toxic, bioaccumulative and persistent. Virtual elimination refers to reducing, in the medium‐ to long‐term, the concentration of designated substances to levels below or at the limits of measurable concentrations. To meet this commitment, the Parties agree as follows.
a) The BMC will maintain and periodically update a list of substances that are subject to this commitment. A number of organizations and delegations including but not limited to those listed below have identified several human‐made substances that have been slated for virtual elimination.
Health Canada (Pest Management Regulatory Agency's Strategy for Implementing the Toxic Management Substances Policy)
Environment Canada (Environment Canada's Risk Management Program: Toxic Substances
Management Policy) Stockholm Convention (Persistent Organic Pollutants requiring control, Canada is a
signatory) The BMC will consider these and other relevant lists in developing and updating a list of substances subject to section 7 d) of the Agreement.
b) The current list of substances subject to section 7 d) of the Agreement is shown in Table 10, along with locations of monitoring. Those substances marked with a currently form part of the Slave River and Hay River Water Quality Monitoring Programs. Monitoring will continue unless a risk assessment demonstrates that a change is warranted. Substances may move from “monitored’ to “not monitored” status upon agreement by the BMC. Substances that are not currently monitored are marked with an X in Table 10. Should an unmonitored substance be detected by another party, this information will be evaluated by the BMC to determine if the substance should be monitored. Monitoring of these substances will be prioritized commensurate with the level of risk.
c) The BMC will assess the risks associated with the substances in Table 10 as part of Learning Plans. Monitoring efforts commensurate with that level of risk should be undertaken. If any of these substances are detected at the Transboundary Waters5 monitoring sites and have the potential to alter the Ecological Integrity of the Aquatic Ecosystem, the Party will identify and implement appropriate courses of action, including continued prioritised monitoring of that substance. Monitoring priorities (i.e., species, frequencies) and management will be discussed at BMC and given to the substances that result from ongoing anthropogenic activities in the basins. It is recognized that, in some cases, it will take time to identify and implement alternative courses of action. The Parties will promote the use of safer chemical substances by supporting
5 Presently, water quality monitoring for VE substances occurs at three AB‐NWT transboundary water quality monitoring sites: 1) Slave River at Fitzgerald (AB), 2) Slave River at Fort Smith (NWT) and 3) Hay River near the Alberta‐NWT Boundary (NWT).
AB‐NWT BWMA Appendices 2015‐02‐24
34
technologies that reduce or eliminate the use and release of substances that have been deemed toxic, bioaccumulative and persistent.
d) The transboundary monitoring results of these substances will be shared with the Government of Canada’s Chemicals Management Plan (CMP) Stakeholder Advisory Council (Health Canada) to raise awareness and, within reason, help to understand potential sources. The CMP describes the Government of Canada’s existing monitoring commitments (such as the Great Lakes Water Quality Agreement, Stockholm Convention on Persistent Organic Pollutants) as well as being responsive to newer emerging contaminants of concern.

AB‐NWT BWMA Appendices 2015‐02‐24
35
Table 10: Substances that have been listed as persistent, bioaccumulative and toxic in accordance with E6 (a).
Substance Monitored at
Slave/Fitzgerald Monitored at Slave/Smith
Monitored at Hay/Boundary
Not Monitored
Aldrin
Chlordane
Dieldrin
Endosulfan
Endrin
Heptachlor
Hexachlorobenzene
Hexachlorobutadiene
Hexachlorcyclohexane (HCH; alpha, beta, )
Mirex
DDD, DDE, DDT
Toxaphene
PCBs
Pentachlorobenzene
Dioxins and Furans X
Chlordecone X
Heptabromodiphenyl ether (Hepta‐BDE) X
Hexabromobiphenyl (HBB) X
Hexabromobiphenyl ether (Hexa BDE) X
Octachlorostyrene X
Pentabromodiphenyl ether (Penta‐BDE) X
Perfluorooctane sulfonate X
Tetrabromodiphenyl ether (Tetra‐BDE) X
AB‐NWT BWMA Appendices 2015‐02‐24
36
Appendix F – Groundwater
F1. Classification of Transboundary Groundwater Hydrogeological information to delineate Transboundary Groundwater is scarce and aquifers in this area have not been fully defined and mapped. However, watershed boundaries can be used as a surrogate for delineating Transboundary Groundwater at the sub‐basin level. These surrogates are referred to as Groundwater areas, which will be used until more information is available and aquifers are mapped. Groundwater areas provide an area‐based framework for data collection and synthesis and identification of key information gaps. It is assumed that topographic slope reflects shallow Groundwater flow directions and that surface sub‐basins generally reflect Groundwater flow patterns within the smaller discrete sub‐watershed units in order to facilitate management and investigations of Groundwater. In this Appendix, use of the term Transboundary Groundwater refers to aquifers when they have been mapped or surrogate Groundwater areas when Groundwater has not yet been mapped. Given the very limited use and lack of available hydrogeological information, all Transboundary Groundwater will be assigned to class 1 at time of signing. The Parties will work towards gathering information and delineating Transboundary Groundwater at the BMC. The Parties will reassess classification as information becomes available. The BMC will work to develop a reproducible approach for classification of Transboundary Groundwater that meets both Parties’ interests. Factors to be considered will include, but will not be limited to, Groundwater quality, Groundwater quantity, domestic well density, community wells, irrigation and other large production wells, water source wells, surficial geology, hydrogeology and subsurface geology data, and land use (including assessment of risk from hydraulic fracturing and deep water injection, etc.). F2. Learning Plans Learning Plans are initiated for class 2 Transboundary Groundwater, where there is some concern that current conditions or predicted conditions resulting from a proposed land use will pose a risk to Groundwater quantity and/or quality and associated aquatic resources. Learning Plans provide additional information needed to confirm or alter the assigned classification and contribute to the baseline information for Transboundary Groundwater. A Learning Plan provides a screening level risk assessment which may include an assessment and monitoring strategy, dependent upon the availability of information, and the level of risk to receptors. A key objective of the Learning Plan will be to evaluate the current level of risk posed to Groundwater quantity and/or quality and the Aquatic Ecosystem. This will involve the review of available relevant information (e.g., land use, ongoing and proposed resource development, water quality, and biological Indicators data where applicable, etc.) and the preparation of a conceptual model that describes the:
Sources of point and non‐point discharges and substances of concern;
Environmental fate and transport pathways for these substances;
Human, biological and ecological receptors (including traditional use values where appropriate).

AB‐NWT BWMA Appendices 2015‐02‐24
37
As part of the Learning Plan, surficial and subsurface geological mapping to outline the physical structure and extent of the different rock and soil units that cover the Transboundary Groundwater may be conducted. This could include an assessment of local surficial and bedrock geology, including stratigraphy, depth, thickness, composition, permafrost distribution, water‐bearing potential and lateral continuity. As part of the Learning Plan, tracking metrics will be developed to help understand baseline Groundwater quality and quantity. These tracking metrics will be used to aid with evaluation of whether a water body should change RIM classification. The Groundwater Learning Plan is further described in section H2 of Appendix H: Groundwater Learning Plan.
F3. Triggers and Objectives The Parties will work towards preventing, better understanding and, potentially, resolving Transboundary Groundwater issues. Triggers, Groundwater Transboundary Objectives and management actions will be determined at the BMC after signing. A Trigger is a pre‐defined early warning of change that results in confirmation of change and Jurisdictional and/or Bilateral Water Management to address the change/trend. Multiple Triggers can be set to invoke additional actions as necessary (e.g., degrading conditions). As defined in the Agreement, a Transboundary Groundwater Objective identifies a change in conditions that, if exceeded, results in Bilateral Water Management. Methods to develop Transboundary Groundwater Objectives for both quantity and quality will be discussed at the BMC. Transboundary Groundwater Objectives will be set for class 3 Transboundary Groundwater in accordance with the RIM approach. Transboundary Groundwater Objectives for quantity will be based on the equitable sharing of the sustainable yield of Transboundary Groundwater. Conditions that could be used to assess if Transboundary Groundwater should be reclassified are included, but not limited to, the quantity and quality sections below. These will be further developed by the BMC. F3.1 Quantity
Temporal (and statistically significant) change in Groundwater level, at an established monitoring location, in Transboundary Groundwater; Impact to sensitive water body or wetland as demonstrated by water level changes;
Decrease in base flow at a hydrometric station;
Decreasing well supplies due to overall Groundwater‐level decline;
Accuracy of modeled versus measured conditions in established monitoring wells;
Increase in Development and Activities.
F3.2 Quality
A significant trend in Groundwater quality indicating a general degradation in quality.
Occurrence of specific contaminants at levels above background at monitoring stations.

AB‐NWT BWMA Appendices 2015‐02‐24
38
Groundwater‐quality results indicating that health‐related maximum acceptable concentration(s) have been exceeded or treatment limits for aesthetic parameters have been exceeded due to anthropogenic activities.
Increase in Development and Activities.

AB‐NWT BWMA Appendices 2015‐02‐24
39
Appendix G – Biological
G1. Classification The Parties agree to develop biological Indicators for class 3 Transboundary Waters (Slave and Hay Rivers) using interim Indicators at time of signing. Biological Indicators may be developed for class 2 Transboundary Waters. The Parties agree that biological monitoring is not dependent on a change in water quality and/or water quantity and will be considered separately for the following reasons:
Considering that biota are sensitive Indicators, biological monitoring can be used as an early warning that a change in the environment is occurring, which allows for an adaptive response.
Biota can be affected by factors other than the quality or quantity of water such as cumulative effects, climate change, and loss of habitat or habitat degradation which can affect access, cover, substrate and food.
The presence of exotic species cannot be detected through water quality or quantity monitoring.
Contaminants can cause harm to aquatic life or pose a health hazard such as to people eating fish well before contaminant concentrations in water indicate there is a problem.
G2. Learning Plans The biological component is incorporated into section H1 of Appendix H: Surface Water Learning Plan. class 2 and 3 Transboundary Waters must have Learning Plans that include learning about the biological component. As part of the Learning Plan, biological Indicators will be discussed at the BMC. A biological Indicator is a species, community or biological process used to provide qualitative and/or quantitative information on the state of the Ecological Integrity of the Aquatic Ecosystem and how it changes over time.
G3. Biological Monitoring and Indicators Biological Indicators are used to track the status/conditions of living organisms in order to inform Bilateral Water Management, primarily the setting of Transboundary Objectives. Monitoring biological Indicators (e.g., plants, invertebrates, fish) provides complementary information to physical and chemical monitoring programs to assess ecosystem health with respect to the cumulative effects of multiple substances, water withdrawals, climate change and habitat alteration. It can also provide an early warning of change or stress in the aquatic environment. The early warning allows for a proactive and adaptive response to ensure the protection of all uses and to ensure the protection of the health of aquatic organisms, wildlife and humans. In developing biological Indicators, the Parties will apply the following guidelines:
Biological Indicators and associated measurements will be identified through the use of conceptual models developed for a water body as part of a Learning Plan;
The number of Indicators and intensity of monitoring will be guided by site‐specific needs and risks;

AB‐NWT BWMA Appendices 2015‐02‐24
40
Biological Indicators apply to all components (i.e., water quality, quantity and Groundwater) and will be used to track conditions and/or monitor Transboundary Objectives for other components;
Biological Indicators will employ the use of statistical methods to identify when conditions are moving outside of natural variability and/or reference sites; the management framework described in Tables 11 and 12 will apply to biological Indicators and/or be adopted as Transboundary Objectives;
Methods that will be explored by the BMC for the monitoring of biological Indicators include but are not limited to:
o Comparison to historical tissue metal concentrations, nutrients and organic compounds and guidelines for large or small bodied fish and benthic invertebrates;
o Presence/absence of fish compared to historical accounts for large and small‐bodied fish;
o Hepatosomatic Index (HSI) and Gonadosomatic Index (GSI), weight at age, condition of fish for large‐bodied fish;
o Critical effects size;
o Benthic invertebrate bio‐monitoring (e.g., CABIN protocol, BACI design). Interim biological Indicators for this Agreement have been identified in Table 11. Tracking metrics will be developed as part of the Learning Plan. Table 11: List of Interim Biological Indicators and Measurement Methods (where data are available)
Water Body Indicator Measurement methods
Slave and Hay River
Large‐bodied fish comparison to historical metals and OCs and guidelines, HSI, GSI, condition of fish; presence/absence of fish compared to historical accounts
Small‐bodied fish presence/absence when compared to historical accounts
Invertebrates comparison to historical contaminant concentrations and guidelines, presence/absence when compared to historical accounts
Aquatic mammals (muskrat, mink)
comparison to historical metals and OCs (liver, muscle, kidney) and guidelines
The Parties will establish Triggers and associated management actions for biological Indicators. The intent is to be suitably precautionary and protective of the Ecological Integrity of the Aquatic Ecosystem and to proactively initiate appropriate Bilateral Water Management. Table 12 describes the general approach to Triggers and management actions, which can be applied to any biological Indicator.

AB‐NWT BWMA Appendices 2015‐02‐24
41
Table 12: Triggers and Actions for Biological Indicators
Triggers Management Action Comments
1 Effect detected (statistically significant change)
The BMC will seek confirmation Check other biological sampling locations and other Indicators for similar response.
2 Confirmation of effect (statistical change in same direction)
The BMC will investigate to improve understanding of the nature and causes of the effect(s)
Increase spatial/temporal resolution, study source of effect, etc. If the nature and causes are well understood directly or by weight of evidence, the BMC goes to trigger #3b; if not, go to #3a.
3a Moving toward thresholds, causes not well understood
The BMC will jointly define and implement Bilateral Water Management action, with actions and cost sharing agreed on a case‐by‐case basis, informed by what is known about the nature and causes of effects and based on a weight‐of‐evidence approach.
Joint actions could include engaging other Parties, doing research, increasing monitoring, implementing mitigation, changing water management, etc.
3b
Moving toward thresholds, causes and responsibility understood directly or by weight‐of‐evidence
The BMC will set or revise Transboundary Objectives that the responsible Party or Parties must meet. These may include water quantity, water quality, Groundwater or Biological Objectives. Costs would normally be borne by the responsible party.
Any actions determined by the responsible Party as required to achieve the Transboundary Objectives (e.g., change water management, implement mitigation, etc.). Note that the nature of Transboundary Objectives may vary. They may not always be quantitative; they may refer to trends, qualitative descriptions etc., as appropriate on a case‐by‐case basis.
4 Objective exceeded Clauses in sections 4.3 j, k, l, mapplies
G4. Transboundary Biological Objectives Biological Objectives may be established in the future as deemed necessary and appropriate by the BMC. Biological Objectives would have specific associated management actions. Metrics produced for biological Indicators could be used as Biological Objectives when required, with different associated management actions. There are many international examples of the use of Biological Objectives. These would be reviewed by the BMC as needed.

AB‐NWT BWMA Appendices 2015‐02‐24
42
Appendix H – Learning Plans
H1 Surface Water Learning Plan
This appendix provides a draft Surface Water Learning Plan table of contents for typical class 2 Transboundary Waters. This table of contents is not exhaustive. The BMC will jointly decide where to place effort on a case‐by‐case basis. The Surface Water Learning Plan will be developed in conjunction with other components, such as Groundwater, to ensure an overall ecosystem approach. Traditional knowledge and use information will be considered in every aspect of the Learning Plan.
1.0 Watershed Profile
1.1 Introduction
1.1.1 Climate
1.1.2 Topography
1.1.3 Geomorphology and geology
1.1.4 Vegetation
1.1.5 Demographics
1.1.6 History
1.2 Existing and proposed Developments and Activities (e.g., agriculture, forestry, transportation, infrastructure, resource extraction, and industries)
2.0 Water Uses
2.1 Water licenses and short‐term use approvals
2.2 Traditional/cultural use
2.3 Aquatic ecosystem & wildlife
2.4 Tourism and recreation
2.5 Community water supplies
2.6 Navigation (including barge traffic)
2.7 Other designated uses
3.0 Influences on Water Resources
3.1 Licensed water withdrawals and return flows
3.2 Point source discharges
3.3 Non‐point source loadings
3.4 Fisheries (commercial and recreational)
3.5 Air emissions (local and long‐range transport of atmospheric pollutants)
3.6 Climate change
3.7 Cumulative effects
3.8 Future development
3.9 Other (e.g., wildfires)
4.0 Ambient Environmental Conditions
4.1 Existing traditional knowledge related to aquatic ecological health
4.2 Hydrology
4.2.1 Regional and Basin‐wide water quantity
4.2.1.1 Trends in total annual and seasonal flows
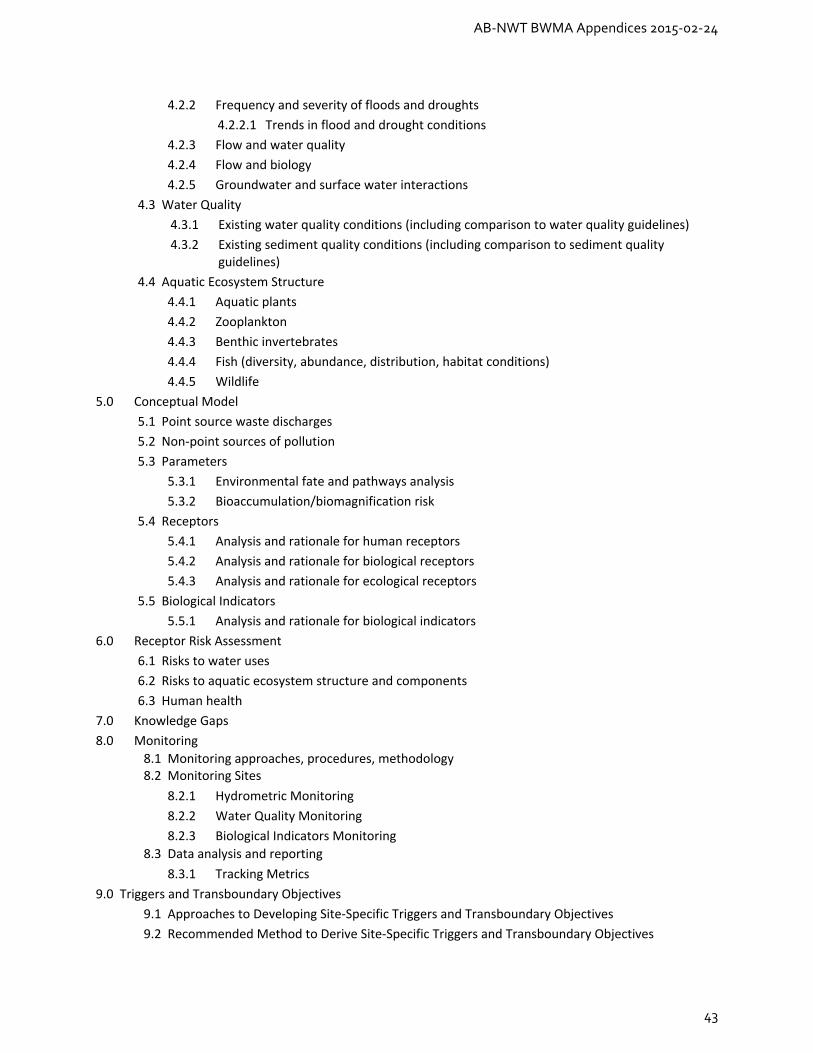
AB‐NWT BWMA Appendices 2015‐02‐24
43
4.2.2 Frequency and severity of floods and droughts
4.2.2.1 Trends in flood and drought conditions
4.2.3 Flow and water quality
4.2.4 Flow and biology
4.2.5 Groundwater and surface water interactions
4.3 Water Quality
4.3.1 Existing water quality conditions (including comparison to water quality guidelines)
4.3.2 Existing sediment quality conditions (including comparison to sediment quality guidelines)
4.4 Aquatic Ecosystem Structure
4.4.1 Aquatic plants
4.4.2 Zooplankton
4.4.3 Benthic invertebrates
4.4.4 Fish (diversity, abundance, distribution, habitat conditions)
4.4.5 Wildlife
5.0 Conceptual Model
5.1 Point source waste discharges
5.2 Non‐point sources of pollution
5.3 Parameters
5.3.1 Environmental fate and pathways analysis
5.3.2 Bioaccumulation/biomagnification risk
5.4 Receptors
5.4.1 Analysis and rationale for human receptors
5.4.2 Analysis and rationale for biological receptors
5.4.3 Analysis and rationale for ecological receptors
5.5 Biological Indicators
5.5.1 Analysis and rationale for biological indicators
6.0 Receptor Risk Assessment
6.1 Risks to water uses
6.2 Risks to aquatic ecosystem structure and components
6.3 Human health
7.0 Knowledge Gaps
8.0 Monitoring
8.1 Monitoring approaches, procedures, methodology 8.2 Monitoring Sites
8.2.1 Hydrometric Monitoring
8.2.2 Water Quality Monitoring
8.2.3 Biological Indicators Monitoring
8.3 Data analysis and reporting
8.3.1 Tracking Metrics
9.0 Triggers and Transboundary Objectives
9.1 Approaches to Developing Site‐Specific Triggers and Transboundary Objectives
9.2 Recommended Method to Derive Site‐Specific Triggers and Transboundary Objectives

AB‐NWT BWMA Appendices 2015‐02‐24
44
9.3 Data Preparation (cleaning, period of record, outliers)
9.4 Trend Assessment (long term and seasonal)
9.5 Derivation of Site‐Specific Triggers and Transboundary Objectives
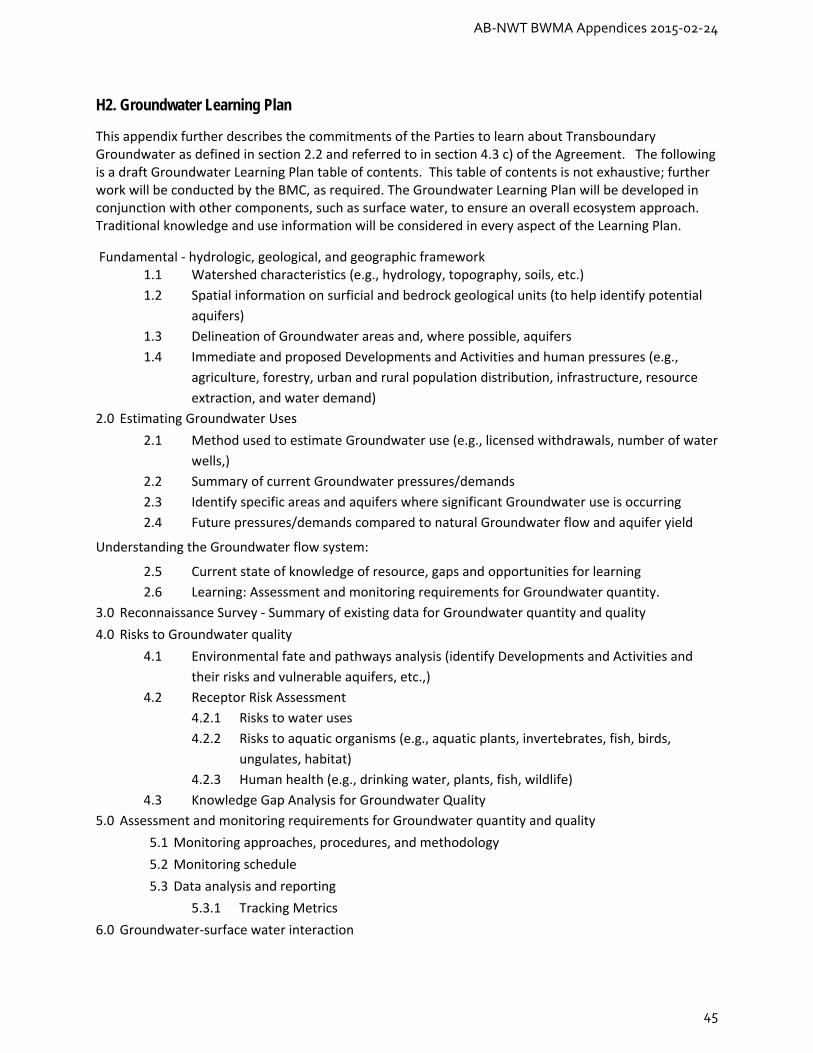
AB‐NWT BWMA Appendices 2015‐02‐24
45
H2. Groundwater Learning Plan
This appendix further describes the commitments of the Parties to learn about Transboundary Groundwater as defined in section 2.2 and referred to in section 4.3 c) of the Agreement. The following is a draft Groundwater Learning Plan table of contents. This table of contents is not exhaustive; further work will be conducted by the BMC, as required. The Groundwater Learning Plan will be developed in conjunction with other components, such as surface water, to ensure an overall ecosystem approach. Traditional knowledge and use information will be considered in every aspect of the Learning Plan.
Fundamental ‐ hydrologic, geological, and geographic framework 1.1 Watershed characteristics (e.g., hydrology, topography, soils, etc.)
1.2 Spatial information on surficial and bedrock geological units (to help identify potential
aquifers)
1.3 Delineation of Groundwater areas and, where possible, aquifers
1.4 Immediate and proposed Developments and Activities and human pressures (e.g.,
agriculture, forestry, urban and rural population distribution, infrastructure, resource
extraction, and water demand)
2.0 Estimating Groundwater Uses
2.1 Method used to estimate Groundwater use (e.g., licensed withdrawals, number of water
wells,)
2.2 Summary of current Groundwater pressures/demands
2.3 Identify specific areas and aquifers where significant Groundwater use is occurring
2.4 Future pressures/demands compared to natural Groundwater flow and aquifer yield
Understanding the Groundwater flow system:
2.5 Current state of knowledge of resource, gaps and opportunities for learning
2.6 Learning: Assessment and monitoring requirements for Groundwater quantity.
3.0 Reconnaissance Survey ‐ Summary of existing data for Groundwater quantity and quality
4.0 Risks to Groundwater quality
4.1 Environmental fate and pathways analysis (identify Developments and Activities and
their risks and vulnerable aquifers, etc.,)
4.2 Receptor Risk Assessment
4.2.1 Risks to water uses
4.2.2 Risks to aquatic organisms (e.g., aquatic plants, invertebrates, fish, birds,
ungulates, habitat)
4.2.3 Human health (e.g., drinking water, plants, fish, wildlife)
4.3 Knowledge Gap Analysis for Groundwater Quality
5.0 Assessment and monitoring requirements for Groundwater quantity and quality
5.1 Monitoring approaches, procedures, and methodology
5.2 Monitoring schedule
5.3 Data analysis and reporting
5.3.1 Tracking Metrics
6.0 Groundwater‐surface water interaction

AB‐NWT BWMA Appendices 2015‐02‐24
46
6.1 Potential for cumulative effects affecting Groundwater quantity or quality (pace and scale of development, proximity of development projects, etc.)
7.0 Groundwater vulnerability assessment and mapping
8.0 Triggers and Transboundary Objectives 8.1 Approaches to Developing Site‐Specific Triggers and Transboundary Objectives 8.2 Recommended Method to Derive Site‐Specific Triggers and Transboundary Objectives
8.2.1 Physical, Chemical and Biological Triggers and Transboundary Objectives
8.3 Data Preparation (cleaning, period of record, outliers)
8.4 Trend Assessment (long‐term and seasonal)
8.5 Derivation of Site‐Specific Triggers and Transboundary

AB‐NWT BWMA Appendices 2015‐02‐24
47
Appendix I – Monitoring
This appendix describes the commitments of the Parties for both direct Agreement implementation monitoring as well as broader regional and Basin‐level monitoring as defined in section 10.2 of the Agreement.
I1. Summary of Commitments Long‐term monitoring is critical to understanding whether significant changes are taking place in the natural environment. Long‐term datasets reveal important patterns, which allow trends, cycles, and rare events to be identified. This is particularly important for complex, large systems where signals may be subtle and slow to emerge. Long‐term datasets are essential to test hypotheses that may have been overlooked at the time the monitoring was started. With increasing variability in hydrological regimes associated with increasing climatic variability, long‐term monitoring is critically important. Transboundary Monitoring includes:
Stations at which monitoring for Transboundary Objectives will occur;
Stations that support transboundary management as well as broader regional and Basin‐level monitoring network.
The Parties have agreed to continue to support long‐term surface water quantity and quality monitoring in the Basin. Existing stations are shown in Tables 13 and 14. Those marked with an asterisk * are considered a priority for long‐term monitoring. Those marked with a + are expected to be the stations at which monitoring to assess whether Transboundary Objectives are being met will occur. The Parties have agreed that:
They will continue to support those stations marked with an * in Tables 13 and 14 for which they are currently responsible, including working with delegate agencies as required;
They will not make changes to monitoring at the stations marked with * or + without discussion at the BMC during the life of the Learning Plan for the Slave and Hay Rivers (which has not been determined, but has been estimated to be about ten years);
They will encourage and support the continued surface water monitoring conducted in the Basin by Environment Canada (See Table 13 and 14).
As part of the Learning Plan for class 2 and 3 Transboundary Waters, the Parties will assess monitoring needs and priorities as well as appropriate locations for monitoring Transboundary Waters with regard to surface water quantity and quality, Groundwater quantity and quality, and biology. They may consider the addition of social and/or air monitoring in the future. The identification of long‐term monitoring stations for the Agreement will be based on a scientific and traditional and local knowledge assessment. Monitoring stations in unclassified and class 1 water bodies may be included to provide comparisons to background or reference conditions.
I2. Joint Monitoring Arrangements There are currently several existing hydrometric and water quality agreements currently in place between Alberta, the Northwest Territories and Environment Canada. The applicable agreements include:

AB‐NWT BWMA Appendices 2015‐02‐24
48
Canada‐Alberta Hydrometric Agreement;
Canada‐NWT Hydrometric Agreement;
Joint Canada‐Alberta Implementation Plan for Oil Sands Monitoring
I3. Water Quantity
The primary goals of water quantity monitoring of Transboundary Waters are to track changes in water quantity over time, determine anthropogenic and natural drivers for changes in water quantity, and ensure that sufficient water is available for downstream uses. Table 13 and Map 1 summarize key water quantity monitoring sites in the AB‐NWT transboundary basins. They include:
Sites located at or near the border that may be useful for monitoring Transboundary Objectives and ensuring the upstream jurisdiction does not cause unreasonable harm;
Sites upstream of the border that may provide an early warning of change and/or help to diagnose reasons for changes observed at the border;
Sites downstream of the border that may provide information about downstream conditions relevant for setting Transboundary Objectives or demonstrating that the downstream jurisdiction is not causing unreasonable harm.
Table 13 summarizes the key hydrometric monitoring stations in the Peace, Athabasca, Slave, Hay and other transboundary basins that record either flow or water level data.
There are currently 309 stations in the Mackenzie River basin within Alberta, and 84 within NWT. Table 13 lists 146 key stations in Alberta, 48 of which are discontinued but they either have long records of historical data, or data from pre‐regulation of the Peace River. Also included are 2 key stations in the Hay River basin that are located in NWT. Of the 100 active stations, and as outlined in section I1, those marked with a + are thought to be key for long‐term regional and Basin‐level monitoring, and those marked with an * are expected to be the stations at which monitoring for Transboundary Objectives will occur. In addition, 4 recommendations are made for additional monitoring in the Hay River basin.
Some additional stations in Saskatchewan, BC, and NWT are listed as "Other Stations". The listed stations within BC are currently included on Alberta's River Basins webpage and are of interest. Current Water Survey of Canada monitoring also includes additional stations in Saskatchewan in the Lake Athabasca sub‐basins 07M and 07L, besides the one Lake Athabasca station listed. Current WSC monitoring also includes 17 stations in NWT and Saskatchewan in basin 07Q that are not listed, in addition to the stations listed in sub‐basins 07U and 07P.
Snow stations may be added to this Appendix by the BMC after the time of signing.

AB‐NWT BWMA Appendices 2015‐02‐24
49
Table 13: Present (2014) Status of Major Transboundary Hydrometric Stations in the AB‐NWT transboundary basin.
Station
No.
Station Name Status Prov Lat. Long. Years of
Data
From To Flow Level Operating
Schedule
Real‐
Time
Desig‐
nation
07AA001 MIETTE RIVER NEAR JASPER Active AB 52.864 ‐118.107 47 1914 2011 True False Continuous True F4
+ 07AA002 ATHABASCA RIVER NEAR JASPER Active AB 52.910 ‐118.059 61 1913 2011 True False Continuous True F4
07AD001 ATHABASCA RIVER AT ENTRANCE Disc. AB 53.377 ‐117.695 33 1915 1974 True False Continuous False
+ 07AD002 ATHABASCA RIVER AT HINTON Active AB 53.424 ‐117.569 51 1961 2011 True False Continuous True FP2
+ 07AE001 ATHABASCA RIVER NEAR WINDFALL Active AB 54.208 ‐116.063 53 1960 2012 True False Seasonal True C‐AB
+ 07BE001 ATHABASCA RIVER AT ATHABASCA Active AB 54.722 ‐113.288 93 1913 2011 True False Continuous True P1
07BJ002 LESSER SLAVE LAKE AT FAUST Disc. AB 55.322 ‐115.642 71 1923 1995 False True Seasonal False
07BJ006 LESSER SLAVE LAKE AT SLAVE LAKE Active AB 55.306 ‐115.772 33 1979 2011 False True Continuous False FP3
+ 07BK001 LESSER SLAVE RIVER AT SLAVE LAKE Active AB 55.305 ‐114.756 50 1915 2011 True False Continuous False FP3
07BK006 LESSER SLAVE RIVER AT HIGHWAY NO. 2A Disc. AB 55.294 ‐114.591 27 1962 1988 True False Continuous False
07BK010 LESSER SLAVE LAKE AT SAWRIDGE Disc. AB 55.300 ‐114.767 27 1914 1962 False True Continuous False
07CC002 ATHABASCA RIVER AT MCMURRAY Disc. AB 56.733 ‐111.375 23 1937 1997 False True Seasonal False
+ 07CD001 CLEARWATER RIVER AT DRAPER Active AB 56.685 ‐111.255 58 1930 2011 True False Continuous True FP1
07CD002 CLEARWATER RIVER BELOW WATERWAYS Disc. AB 56.719 ‐111.347 26 1950 1975 False True Seasonal False
07CD003 CLEARWATER RIVER AT UPPER WINGDAM Disc. AB 56.700 ‐111.333 15 1960 1974 False True Seasonal False
07CD004 HANGINGSTONE RIVER AT FORT MCMURRAY Active AB 56.709 ‐111.356 48 1965 2012 True False Continuous True FP1
+ 07CD005 CLEARWATER RIVER ABOVE CHRISTINA RIVER Active AB 56.664 ‐110.929 46 1966 2011 True False Continuous True JOSM/P1
+ 07CE002 CHRISTINA RIVER NEAR CHARD Active AB 55.837 ‐110.869 31 1982 2012 True False Continuous True JOSM/FP3
+ 07CE005 JACKFISH RIVER BELOW CHRISTINA LAKE Active AB 55.674 ‐111.100 14 1982 1995 True False JOSM
07CE906 CHRISTINA LAKE NEAR WINEFRED LAKE Active AB 55.625 ‐110.773 12 2001 2012 False True Continuous True C‐AB
+ 07DA001 ATHABASCA RIVER BELOW MCMURRAY Active AB 56.780 ‐111.402 55 1957 2011 True False Continuous True F4
+ 07DA006 STEEPBANK RIVER NEAR FORT MCMURRAY Active AB 56.999 ‐111.407 41 1972 2012 True False Continuous True JOSM/FP1
+ 07DA007 POPLAR CREEK at Highway 63 Active AB 56.914 ‐111.460 15 1972 1986 True False JOSM
+ 07DA008 MUSKEG RIVER NEAR FORT MACKAY Active AB 57.191 ‐111.570 39 1974 2012 True False Continuous True JOSM/FP1
+ 07DA009 JACKPINE CREEK AT CANTERRA ROAD Active AB 57.259 ‐111.465 19 1975 1993 True False JOSM
07DA010 ELLS RIVER BELOW GARDINER LAKES Disc. AB 57.375 ‐112.561 5 1975 1979 True False Continuous False
+ 07DA011 Big Creek near the Mouth Active AB 57.661 ‐111.520 19 1975 1993 True False JOSM
07DA012 ASPHALT CREEK NEAR FORT MACKAY Disc. AB 57.539 ‐111.677 3 1975 1977 True False Continuous False
+ 07DA013 PIERRE RIVER NEAR FORT MACKAY Active AB 57.465 ‐111.654 3 1975 1977 True False JOSM
07DA014 CALUMET RIVER NEAR FORT MACKAY Disc. AB 57.403 ‐111.683 3 1975 1977 True False Continuous False
+ 07DA015 TAR RIVER NEAR the mouth Active AB 57.354 ‐111.758 3 1975 1977 True False JOSM
07DA016 JOSLYN CREEK NEAR FORT MACKAY Disc. AB 57.274 ‐111.742 19 1975 1993 True False Seasonal False
+ 07DA017 ELLS RIVER NEAR THE MOUTH Disc. AB 57.268 ‐111.714 12 1975 1986 True False Continuous False
+ 07DA018 BEAVER RIVER ABOVE SYNCRUDE Active AB 56.945 ‐111.566 38 1975 2012 True False Continuous True JOSM/FP1
+ 07DB001 MACKAY RIVER NEAR FORT MACKAY Active AB 57.210 ‐111.695 41 1972 2012 True False Continuous True JOSM/FP1
+ 07DB002 DOVER RIVER NEAR THE MOUTH Active AB 57.170 ‐111.794 3 1975 1977 True False JOSM
+ 07DB003 DUNKIRK RIVER NEAR FORT MACKAY Active AB 56.856 ‐112.711 5 1975 1979 True False JOSM
+ 07DC001 FIREBAG RIVER NEAR THE MOUTH Active AB 57.651 ‐111.203 42 1971 2012 True False Continuous True JOSM/FP1
+ 07DD001 ATHABASCA RIVER AT EMBARRAS AIRPORT Active AB 58.205 ‐111.390 14 1971 1990 True False JOSM, F4
+ 07DD002 RICHARDSON RIVER NEAR THE MOUTH Active AB 58.360 ‐111.240 42 1970 2011 True False Seasonal True FP1
07DD003 EMBARRAS RIVER BELOW DIVERGENCE Active AB 58.422 ‐111.551 23 1971 2011 True False Seasonal False FP1

AB‐NWT BWMA Appendices 2015‐02‐24
50
+ 07DD007 ATHABASCA RIVER ABOVE JACKFISH CREEK Active AB 58.417 ‐110.917 38 1971 2011 False True Continuous False C‐AB
+ 07DD011 ATHABASCA RIVER NEAR OLD FORT Active AB 58.374 ‐111.522 37 1975 2011 False True Continuous False FP‐1
+ 07FD003 PEACE RIVER AT DUNVEGAN BRIDGE Active AB 55.919 ‐118.607 48 1960 2011 True False Seasonal True FP3
07FD006 SADDLE RIVER NEAR WOKING Active AB 55.644 ‐118.700 45 1967 2011 True False Seasonal False FP3
+ 07FD009 CLEAR RIVER NEAR BEAR CANYON Active AB 56.308 ‐119.681 41 1971 2011 True False Seasonal True FP3
07FD011 HINES CREEK ABOVE GERRY LAKE Active AB 56.334 ‐118.265 38 1974 2011 True False Seasonal False FP3
+ 07FD012 MONTAGNEUSE RIVER NEAR HINES CREEK Active AB 56.383 ‐118.712 37 1975 2011 True False Seasonal False FP3
07FD013 EUREKA RIVER NEAR WORSLEY Active AB 56.453 ‐119.134 37 1975 2011 True False Seasonal False FP3
07FD020 SPIRIT RIVER NEAR SPIRIT RIVER Active AB 55.741 ‐118.837 5 2005 2009 True False Seasonal False C‐AB
+ 07FD901 PEACE RIVER ABOVE SMOKY RIVER CONFLUENCE Active AB 56.155 ‐117.443 13 2000 2012 False True Continuous True P1
07FD908 GRIMSHAW DRAINAGE NEAR GRIMSHAW Active AB 56.167 ‐117.600 19 1991 2009 True False Seasonal False C‐AB
07FD910 RYCROFT SURVEY NO. 3 NEAR RYCROFT Active AB 55.750 ‐118.583 28 1982 2009 True False Seasonal False C‐AB
07FD912 WHITBURN DRAINAGE PROJECT NEAR SPIRIT RIVER Disc. AB 55.850 ‐119.133 22 1988 2009 True False Seasonal False
07FD913 YOUNG DRAINAGE PROJECT NEAR SPIRIT RIVER Disc. AB 55.812 ‐118.794 28 1982 2009 True False Seasonal False
+ 07FD934 PEACE RIVER NEAR ELK ISLAND PARK Active AB 55.915 ‐117.986 13 2000 2012 False True Continuous True P1
07GA001 SMOKY RIVER ABOVE HELLS CREEK Active AB 53.947 ‐119.161 45 1967 2012 True True Seasonal True FP2
07GA002 MUSKEG RIVER NEAR GRANDE CACHE Active AB 53.926 ‐118.816 40 1972 2011 True False Seasonal False FP3
07GB001 CUTBANK RIVER NEAR GRANDE PRAIRIE Active AB 54.516 ‐118.963 42 1970 2011 True False Seasonal False FP3
07GB002 KAKWA RIVER NEAR GRANDE PRAIRIE Disc. AB 54.372 ‐118.594 20 1975 1994 True False Seasonal False
07GB003 KAKWA RIVER AT HIGHWAY NO. 40 Active AB 54.422 ‐118.554 18 1994 2011 True False Seasonal True FP2
07GC002 PINTO CREEK NEAR GRANDE PRAIRIE Active AB 54.842 ‐119.390 24 1986 2009 True False Seasonal True C‐AB
07GD001 BEAVERLODGE RIVER NEAR BEAVERLODGE Active AB 55.189 ‐119.437 45 1968 2012 True True Seasonal False P1
07GD002 BEAVERTAIL CREEK NEAR HYTHE Disc. AB 55.316 ‐119.643 27 1983 2009 True False Seasonal False
07GD004 REDWILLOW RIVER NEAR RIO GRANDE Active AB 55.079 ‐119.702 19 1993 2011 True False Continuous True P1
+ 07GE001 WAPITI RIVER NEAR GRANDE PRAIRIE Active AB 55.071 ‐118.803 54 1917 2011 True False Continuous True FP3
07GE002 KLESKUN HILLS MAIN DRAIN NEAR GRANDE PRAIRIE Active AB 55.225 ‐118.462 46 1966 2011 True False Seasonal False P1
07GE003 GRANDE PRAIRIE CREEK NEAR SEXSMITH Active AB 55.375 ‐118.916 43 1969 2011 True False Seasonal False FP3
07GE004 BEAR LAKE NEAR CLAIRMONT Disc. AB 55.233 ‐118.950 41 1969 2009 False True Seasonal False
07GE007 BEAR RIVER NEAR VALHALLA CENTRE Active AB 55.400 ‐119.384 28 1984 2011 True False Seasonal False P1
07GF001 SIMONETTE RIVER NEAR GOODWIN Active AB 55.140 ‐118.182 43 1969 2011 True False Seasonal False FP3
07GF002 SPRING CREEK NEAR VALLEYVIEW Disc. AB 54.918 ‐117.849 23 1965 1987 True False Seasonal False
07GF003 WOLVERINE CREEK NEAR VALLEYVIEW Disc. AB 54.921 ‐117.809 22 1966 1987 True False Seasonal False
07GF004 SPRING CREEK (UPPER) NEAR VALLEYVIEW Disc. AB 54.929 ‐117.706 21 1967 1987 True False Seasonal False
07GF005 BRIDLEBIT CREEK NEAR VALLEYVIEW Disc. AB 54.936 ‐117.734 32 1967 2003 True False Seasonal False
07GF006 ROCKY CREEK NEAR VALLEYVIEW Disc. AB 54.935 ‐117.776 29 1967 2000 True False Seasonal False
07GF007 HORSE CREEK NEAR VALLEYVIEW Disc. AB 54.922 ‐117.813 18 1970 1987 True False Seasonal False
07GF008 DEEP VALLEY CREEK NEAR VALLEYVIEW Active AB 54.430 ‐117.721 28 1985 2013 True True Seasonal False ComR
07GG001 WASKAHIGAN RIVER NEAR THE MOUTH Active AB 54.752 ‐117.206 44 1968 2012 True True Continuous False FP3
07GG002 LITTLE SMOKY RIVER AT LITTLE SMOKY Active AB 54.740 ‐117.180 45 1967 2011 True False Seasonal False FP3
07GG003 IOSEGUN RIVER NEAR LITTLE SMOKY Active AB 54.745 ‐117.152 44 1969 2012 True True Seasonal False FP3
07GH002 LITTLE SMOKY RIVER NEAR GUY Active AB 55.456 ‐117.162 53 1959 2011 True False Continuous True P1
07GH003 STURGEON LAKE NEAR VALLEYVIEW Active AB 55.118 ‐117.559 41 1972 2012 False True Seasonal False P1
07GH004 PEAVINE CREEK NEAR FALHER Active AB 55.629 ‐117.260 28 1984 2011 True False Seasonal False FP3
+ 07GJ001 SMOKY RIVER AT WATINO Active AB 55.715 ‐117.623 66 1915 2012 True True Continuous True FP2

AB‐NWT BWMA Appendices 2015‐02‐24
51
+ 07HA001 PEACE RIVER AT PEACE RIVER Active AB 56.245 ‐117.314 72 1915 2011 True False Continuous True F4
+ 07HA003 HEART RIVER NEAR NAMPA Active AB 56.056 ‐117.130 49 1963 2011 True False Continuous True FP3
+ 07HA005 WHITEMUD RIVER NEAR DIXONVILLE Active AB 56.511 ‐117.661 41 1971 2011 True False Seasonal False FP3
07HB001 CADOTTE RIVER AT OUTLET CADOTTE LAKE Active AB 56.488 ‐116.434 28 1984 2011 True False Seasonal False FP3
07HC001 NOTIKEWIN RIVER AT MANNING Active AB 56.920 ‐117.618 51 1961 2011 True False Continuous False FP3
07HC002 BUCHANAN CREEK NEAR MANNING Active AB 56.895 ‐117.489 27 1985 2011 True False Seasonal False FP3
07HC907 NORTH STAR DRAINAGE NEAR NORTH STAR Active AB 56.829 ‐117.569 19 1991 2009 True False Seasonal False C‐AB
+ 07HD001 PEACE RIVER NEAR CARCAJOU Active AB 57.742 ‐117.033 8 1960 2011 True True Continuous False P1
+ 07HF001 PEACE RIVER AT FORT VERMILION Active AB 58.388 ‐116.029 32 1915 2011 True True Continuous False P1
+ 07HF002 KEG RIVER AT HIGHWAY NO. 35 Active AB 57.746 ‐117.628 42 1971 2012 True True Seasonal True FP3
07JA001 UTIKUMA LAKE NEAR NIPISI Disc. AB 55.914 ‐115.171 41 1969 2009 False True Seasonal False
07JA002 SOUTH WABASCA LAKE NEAR DESMARAIS Active AB 55.940 ‐113.805 40 1972 2011 False True Seasonal False P1
07JA003 WILLOW RIVER NEAR WABASCA Active AB 55.917 ‐113.921 27 1985 2011 True False Seasonal False FP3
07JC001 LAFOND CREEK NEAR RED EARTH CREEK Active AB 57.073 ‐115.097 37 1975 2011 True False Seasonal True FP3
07JC002 REDEARTH CREEK NEAR RED EARTH CREEK Active AB 56.547 ‐115.240 25 1987 2011 True False Seasonal False FP3
07JD001 WABASCA RIVER ABOVE PEACE RIVER Disc. AB 58.292 ‐115.383 8 1963 1970 True False Continuous False
+ 07JD002 WABASCA RIVER AT HIGHWAY NO. 88 Active AB 57.875 ‐115.389 43 1970 2012 True True Continuous False F4
+ 07JD003 JACKPINE CREEK AT HIGHWAY NO. 88 Active AB 58.193 ‐115.749 41 1971 2011 True False Seasonal False P1
07JD004 TEEPEE CREEK NEAR LA CRETE Active AB 58.137 ‐116.250 31 1981 2011 True False Seasonal False FP3
+ 07JF002 BOYER RIVER NEAR FORT VERMILION Active AB 58.449 ‐116.264 50 1962 2011 True False Seasonal False P1
+ 07JF003 PONTON RIVER ABOVE BOYER RIVER Active AB 58.464 ‐116.256 50 1962 2011 True False Seasonal False FP3
07JF004 BOYER RIVER NEAR PADDLE PRAIRIE Disc. AB 57.908 ‐117.613 29 1979 2007 True False Seasonal False
07JF005 BOYER RIVER AT PADDLE PRAIRIE Active AB 57.948 ‐117.481 4 2008 2011 True False Seasonal False FP3
07KA002 PEACE RIVER AT FIFTH MERIDIAN Disc. AB 58.650 ‐114.022 7 1960 1967 True False Seasonal False
+ 07KC001 PEACE RIVER AT PEACE POINT (ALBERTA) Active AB 59.118 ‐112.437 54 1959 2012 True True Continuous True F2
+ 07KC005 PEACE RIVER BELOW CHENAL DES QUATRE FOURCHES Active AB 58.900 ‐111.583 39 1972 2011 False True Continuous False F1
+ 07KE001 BIRCH RIVER BELOW ALICE CREEK Active AB 58.325 ‐113.065 45 1967 2011 True False Seasonal True F1
07KF001 CHENAL DES QUATRE FOURCHES AT QUATRE FOURCHEDisc. AB 58.647 ‐111.289 20 1960 1991 False True Seasonal False
+ 07KF002 LAKE CLAIRE NEAR OUTLET TO PRAIRIE RIVER Active AB 58.633 ‐111.697 42 1970 2011 False True Continuous False F1
+ 07KF003 MAMAWI LAKE CHANNEL AT OLD DOG CAMP Active AB 58.633 ‐111.333 41 1971 2011 False True Continuous False F1
07KF004 CHENAL DES QUATRE FOURCHES ABOVE PEACE RIVER Disc. AB 58.878 ‐111.603 2 1960 1971 False True Seasonal False
07KF005 BARIL LAKE AT CENTRE OF LAKE Disc. AB 58.783 ‐111.683 1 1971 1971 False True Seasonal False
07KF006 CHENAL DES QUATRE FOURCHES BELOW FOUR FORKS Disc. AB 58.651 ‐111.297 10 1971 1981 False False Seasonal False
07KF007 CHENAL DES QUATRE FOURCHES AT RANGER'S CABIN Disc. AB 58.794 ‐111.478 1 1971 1971 False True Seasonal False
07KF008 CHENAL DES QUATRE FOURCHES AT HIGH ROCK TOWEDisc. AB 58.814 ‐111.558 1 1971 1971 False True Seasonal False
07KF010 MAMAWI LAKE CHANNEL AT DOG CAMP Disc. AB 58.647 ‐111.311 7 1971 1980 False False Seasonal False
07KF013 PRAIRIE RIVER AT FISH STUDY CAMP Disc. AB 58.621 ‐111.636 1 1971 1971 False True Seasonal False
07KF014 PRAIRIE RIVER NEAR LAKE CLAIRE Disc. AB 58.624 ‐111.681 8 1971 1981 False False Miscellaneous False
+ 07KF015 EMBARRAS RIVER BREAKTHROUGH TO MAMAWI LAKE Active AB 58.480 ‐111.444 24 1987 2011 True False Seasonal False F1
+ 07MD001 LAKE ATHABASCA AT FORT CHIPEWYAN Active AB 58.711 ‐111.147 76 1930 2011 False True Continuous False F1
07MD002 LAKE ATHABASCA AT BUSTARD ISLAND Disc. AB 58.782 ‐110.778 21 1975 1995 False True Continuous False
+ 07NA001 RIVIERE DES ROCHERS ABOVE SLAVE RIVER Active AB 58.992 ‐111.400 43 1960 2011 False True Continuous False F1
07NA002 RIVIERE DES ROCHERS AT BEN HOULE'S CABIN Disc. AB 58.819 ‐111.275 11 1971 1981 False False Miscellaneous False
07NA003 RIVIERE DES ROCHERS ABOVE REVILLON COUPE Disc. AB 58.842 ‐111.267 12 1971 1985 False True Continuous False
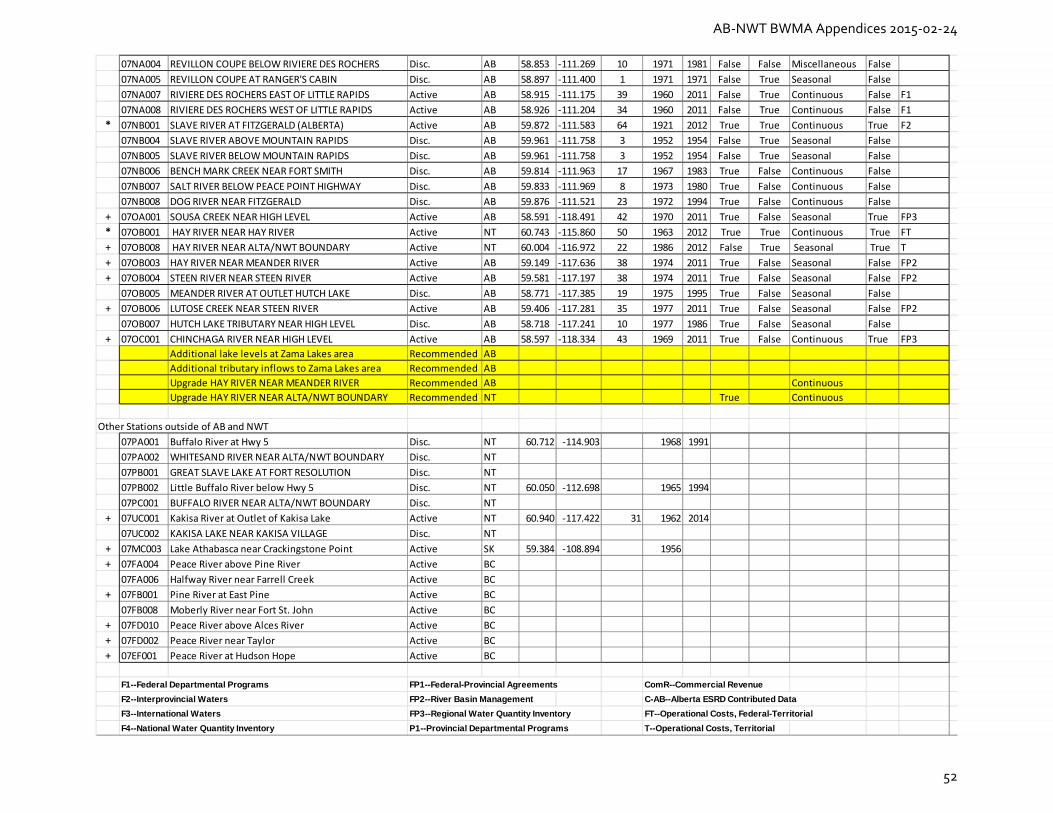
AB‐NWT BWMA Appendices 2015‐02‐24
52
07NA004 REVILLON COUPE BELOW RIVIERE DES ROCHERS Disc. AB 58.853 ‐111.269 10 1971 1981 False False Miscellaneous False
07NA005 REVILLON COUPE AT RANGER'S CABIN Disc. AB 58.897 ‐111.400 1 1971 1971 False True Seasonal False
07NA007 RIVIERE DES ROCHERS EAST OF LITTLE RAPIDS Active AB 58.915 ‐111.175 39 1960 2011 False True Continuous False F1
07NA008 RIVIERE DES ROCHERS WEST OF LITTLE RAPIDS Active AB 58.926 ‐111.204 34 1960 2011 False True Continuous False F1
* 07NB001 SLAVE RIVER AT FITZGERALD (ALBERTA) Active AB 59.872 ‐111.583 64 1921 2012 True True Continuous True F2
07NB004 SLAVE RIVER ABOVE MOUNTAIN RAPIDS Disc. AB 59.961 ‐111.758 3 1952 1954 False True Seasonal False
07NB005 SLAVE RIVER BELOW MOUNTAIN RAPIDS Disc. AB 59.961 ‐111.758 3 1952 1954 False True Seasonal False
07NB006 BENCH MARK CREEK NEAR FORT SMITH Disc. AB 59.814 ‐111.963 17 1967 1983 True False Continuous False
07NB007 SALT RIVER BELOW PEACE POINT HIGHWAY Disc. AB 59.833 ‐111.969 8 1973 1980 True False Continuous False
07NB008 DOG RIVER NEAR FITZGERALD Disc. AB 59.876 ‐111.521 23 1972 1994 True False Continuous False
+ 07OA001 SOUSA CREEK NEAR HIGH LEVEL Active AB 58.591 ‐118.491 42 1970 2011 True False Seasonal True FP3
* 07OB001 HAY RIVER NEAR HAY RIVER Active NT 60.743 ‐115.860 50 1963 2012 True True Continuous True FT
+ 07OB008 HAY RIVER NEAR ALTA/NWT BOUNDARY Active NT 60.004 ‐116.972 22 1986 2012 False True Seasonal True T
+ 07OB003 HAY RIVER NEAR MEANDER RIVER Active AB 59.149 ‐117.636 38 1974 2011 True False Seasonal False FP2
+ 07OB004 STEEN RIVER NEAR STEEN RIVER Active AB 59.581 ‐117.197 38 1974 2011 True False Seasonal False FP2
07OB005 MEANDER RIVER AT OUTLET HUTCH LAKE Disc. AB 58.771 ‐117.385 19 1975 1995 True False Seasonal False
+ 07OB006 LUTOSE CREEK NEAR STEEN RIVER Active AB 59.406 ‐117.281 35 1977 2011 True False Seasonal False FP2
07OB007 HUTCH LAKE TRIBUTARY NEAR HIGH LEVEL Disc. AB 58.718 ‐117.241 10 1977 1986 True False Seasonal False
+ 07OC001 CHINCHAGA RIVER NEAR HIGH LEVEL Active AB 58.597 ‐118.334 43 1969 2011 True False Continuous True FP3
Additional lake levels at Zama Lakes area Recommended AB
Additional tributary inflows to Zama Lakes area Recommended AB
Upgrade HAY RIVER NEAR MEANDER RIVER Recommended AB Continuous
Upgrade HAY RIVER NEAR ALTA/NWT BOUNDARY Recommended NT True Continuous
Other Stations outside of AB and NWT
07PA001 Buffalo River at Hwy 5 Disc. NT 60.712 ‐114.903 1968 1991
07PA002 WHITESAND RIVER NEAR ALTA/NWT BOUNDARY Disc. NT
07PB001 GREAT SLAVE LAKE AT FORT RESOLUTION Disc. NT
07PB002 Little Buffalo River below Hwy 5 Disc. NT 60.050 ‐112.698 1965 1994
07PC001 BUFFALO RIVER NEAR ALTA/NWT BOUNDARY Disc. NT
+ 07UC001 Kakisa River at Outlet of Kakisa Lake Active NT 60.940 ‐117.422 31 1962 2014
07UC002 KAKISA LAKE NEAR KAKISA VILLAGE Disc. NT
+ 07MC003 Lake Athabasca near Crackingstone Point Active SK 59.384 ‐108.894 1956
+ 07FA004 Peace River above Pine River Active BC
07FA006 Halfway River near Farrell Creek Active BC
+ 07FB001 Pine River at East Pine Active BC
07FB008 Moberly River near Fort St. John Active BC
+ 07FD010 Peace River above Alces River Active BC
+ 07FD002 Peace River near Taylor Active BC
+ 07EF001 Peace River at Hudson Hope Active BC
F1--Federal Departmental Programs FP1--Federal-Provincial Agreements ComR--Commercial Revenue
F2--Interprovincial Waters FP2--River Basin Management C-AB--Alberta ESRD Contributed Data
F3--International Waters FP3--Regional Water Quantity Inventory FT--Operational Costs, Federal-Territorial
F4--National Water Quantity Inventory P1--Provincial Departmental Programs T--Operational Costs, Territorial

AB‐NWT BWMA Appendices 2015‐02‐24
53
Map 1. Present (2014) Location of Transboundary Water Quantity Sites within AB‐NWT Transboundary
Basins

AB‐NWT BWMA Appendices 2015‐02‐24
54
I4. Water Quality
The primary goals of monitoring Transboundary Waters are to track changes in water quality over time, determine anthropogenic and natural drivers for changes in water quality, and ensure that water quality is protected for all water uses. Table 14 and Map 2 summarize key water quality monitoring sites in the AB‐NWT transboundary basins. They include:
Sites located at or near the border that may be useful for monitoring Transboundary Objectives and ensuring the upstream jurisdiction does not cause unreasonable harm;
Sites upstream of the border that may provide an early warning of change and/or help to diagnose reasons for changes observed at the border;
Sites downstream of the border that may provide information about downstream conditions relevant for setting Transboundary Objectives or demonstrating that the downstream jurisdiction is not causing unreasonable harm.
Among the 275 water quality monitoring sites in listed in Table 14, 265 sites are located in Alberta and 9 sites are within NWT. The water quality monitoring sites marked with a "*" will be used for assessment related to Transboundary Objectives. The sites marked with a "+" are key for long‐term regional and basin level monitoring and will inform transboundary conditions. The Table also lists some water quality monitoring sites that have been discontinued but they were included due to their long‐term historical data records. One additional site located in BC is also included given its special interest to the Board and downstream jurisdictions. This site is marked with a "‐".

AB‐NWT BWMA Appendices 2015‐02‐24
55
Table 14: Present (2014) Status of Water Quality Monitoring Sites in the AB‐NWT Transboundary Region.
Class Station No. River Reach Water Quality Monitoring Site Prov. Lat. Long. From To Years of Data
# of Samples
Latest Frequency
* NW07OB0002 HAY RIVER NEAR AB/NWT BOUNDARY NWT 60.004 ‐116.969 1988 2014 26 >104 6X/yr
* NW07QA0004 SLAVE RIVER SLAVE RIVER AT FORT SMITH (JOSM M11B)
NWT 60.016 ‐111.890 1982 2014 32 >96 12X/yr
* AL07NB0001 SLAVE RIVER SLAVE RIVER AT FITZGERALD (JOSM M11A)
AB 59.872 ‐111.583 1960 2014 54 >230 12X/yr
+ AB07DD0010 ATHABASCA RIVER
AT OLD FORT (JOSM M9A) AB 58.383 ‐111.518 1987 2014 28 255 12X/yr
+ AB07DA0980 ATHABASCA RIVER
ABOVE THE FIREBAG RIVER (JOSM M8)
AB 57.724 ‐111.379 1989 2014 14 97 12X/yr
+ AB07CC0030 ATHABASCA RIVER
U/S FORT MCMURRAY, ABOVE HORSE R. (JOSM M2)
AB 56.720 ‐111.406 1960 2014 39 369 12X/yr
+ AB07BE0010 ATHABASCA RIVER
ABOVE TOWN OF ATHABASCA (JOSM M0)
AB 54.722 ‐113.286 1957 2014 51 524 12X/yr
+ AB07AD0110 ATHABASCA RIVER
U/S OF HINTON, 0.2 KM U/S OF MUSKUTA CREEK
AB 53.380 ‐117.656 1960 2003 7 65 12X/yr
+ AB07AD0100 ATHABASCA RIVER
AT OLD ENTRANCE TOWN SITE AB 53.368 ‐117.723 1985 2014 18
12X/yr
+ AL07DD0001 ATHABASCA RIVER
AT BASELINE 27 (JOSM M9) AB 58.173 ‐111.370 1989 2014
9X/yr
+ AL07DD0007 ATHABASCA RIVER
BELOW ELLS RIVER (JOSM M7) AB 57.314 ‐111.672 2012 2014 3
12X/yr
+ AL07DD0009 ATHABASCA RIVER
BELOW MACKAY RIVER (JOSM M6)
AB 57.215 ‐111.612 2011 2014 4
12X/yr
+ AL07DD0005 ATHABASCA RIVER
ABOVE MACKAY RIVER (JOSM M5)
AB 57.157 ‐111.627 2011 2014 4
12X/yr
+ AL07DD0004 ATHABASCA RIVER
ABOVE MUSKEG RIVER (JOSM M4)
AB 57.127 ‐111.602 2011 2014 4
12X/yr

AB‐NWT BWMA Appendices 2015‐02‐24
56
Class Station No. River Reach Water Quality Monitoring Site Prov. Lat. Long. From To Years of Data
# of Samples
Latest Frequency
+ AL07DD0008 ATHABASCA RIVER
6.5 KM BELOW WSC GAUGE 07DA001 (JOSM M3 )
AB 56.839 ‐111.416 2011 2014 4
12X/yr
+ ‐‐ ATHABASCA RIVER
OIL SANDS BIOMONITORING STATION (JOSM M1)
AB 56.650 ‐111.609 2011 2014 4
12X/yr
+ AL07AA0023 ATHABASCA RIVER
ATHABASCA @HWY 16 BELOW SNARING RIVER
AB 53.042 ‐118.087 1973 2014
7X/yr
+ AL07AA0015 ATHABASCA RIVER
ABOVE ATHABASCA FALLS AB 52.664 ‐117.881 1972 2014
7X/yr
+ ‐‐ BUFFALO RIVER AT HWY #5 BRIDGE NWT 60.716 ‐114.907 1982 2010 28 56 2X/yr
+ ‐‐ HAY RIVER HAY RIVER AT WEST CHANNEL BRIDGE
NWT 60.825 ‐115.779 1982 2010 28 56 2X/yr
+ AB07OB0010 HAY RIVER AT HWY 35 NEAR MEANDER RIVER
AB 59.133 ‐117.633 1987 1987 1 2
+ NW07UC0002 KAKISA RIVER AT HWY #1 BRIDGE NWT 60.986 ‐117.245 1982 2010 28 56 2X/yr
+ AB07MD0040 LAKE ATHABASCA
7 KM SE OF CYPRESS POINT AB 59.153 ‐110.136 1987 1993
40
+ NW07PB0002 LITTLE BUFFALO RIVER
AT HWY #5 BRIDGE NWT 60.047 ‐112.771 1982 2010 28 56 2X/yr
+ WSC 07KF003 MAMAWI LAKE CHANNEL
SOUTHERN MAMAWI LK CHANNEL (JOSM QU1)
AB 58.633 ‐111.333 2012 2014 3
12X/yr
+ AL07KC0001 PEACE RIVER AT PEACE POINT (JOSM M12) AB 59.122 ‐112.452 1967 2014
12X/yr
+ AB07HF0010 PEACE RIVER AT FORT VERMILION AB 58.404 ‐116.128 1988 2014 27 349 12X/yr
+ AB07HA0030 PEACE RIVER AT PEACE RIVER, ABOVE HEART RIVER
AB 56.224 ‐117.300 1970 1983 7 21
+ AB07FD0135 PEACE RIVER U/S SMOKY RIVER NEAR SHAFTESBURY FERRY
AB 56.093 ‐117.566 2008 2014 7 74 12X/yr

AB‐NWT BWMA Appendices 2015‐02‐24
57
Class Station No. River Reach Water Quality Monitoring Site Prov. Lat. Long. From To Years of Data
# of Samples
Latest Frequency
+ AB07FD0090 PEACE RIVER AT DUNVEGAN BRIDGE AB 55.920 ‐118.606 1958 1978 14 51
+ AL07NA0001 RIVIERE DES ROCHERS
RIVIÈRE DES ROCHER BELOW LITTLE RAPIDS (JOSM M10)
AB 58.922 ‐111.183 2012 2014 3
12X/yr
+ NW07NB0001 SALT RIVER AT HWY #5 BRIDGE NWT 60.021 ‐112.351 1982 2010 28 56 2X/yr
+ NW07NC0004 SLAVE RIVER AT THE MOUTH (JOSM SL2) NWT 61.321 ‐113.611 2012 2014 3 12 12X/yr
+ NW07NC0003 SLAVE RIVER SLAVE RIVER ABOVE THE MOUTH (JOSM SL1)
NWT 61.260 ‐113.459 1982 2014 32 64 12X/yr
‐ BC07FD0005 PEACE RIVER PEACE RIVER ABOVE ALCES AB 56.126 ‐120.056 1984 2014 21 >481 12X/yr
AB07BJ0030
ASSINEAU RIVER
NEAR CONFLUENCE WITH LESSER SLAVE LAKE
AB 55.388 ‐115.196 1990 2008 5 16
AB07DD0150
ATHABASCA RIVER
EMBARRAS RIVER NEAR LAKE ATHABASCA
AB 58.652 ‐111.046 1976 2008 6 27
AB07DD0360
ATHABASCA RIVER
BIG POINT CHANNEL OUTLET ‐ DELTA SITE
AB 58.640 ‐110.774 1976 1984 9 54
AB07DD0220
ATHABASCA RIVER
GOOSE ISLAND CHANNEL NEAR LAKE ATHABASCA
AB 58.621 ‐110.834 1976 2008 5 24
AB07DD0230
ATHABASCA RIVER
BIG POINT CHANNEL NEAR LAKE ATHABASCA
AB 58.607 ‐110.807 1987 2008 10 43
AB07DD0110
ATHABASCA RIVER
U/S OF CONFLUENCE OF FLETCHER CHANNEL
AB 58.453 ‐111.089 1989 1994 6 7
AB07DD0105
ATHABASCA RIVER
D/S OF DEVILS ELBOW AT WINTER ROAD CROSSING
AB 58.447 ‐111.186 1997 2014 18 66
AB07DD0040
ATHABASCA RIVER
AT EMBARRAS AIRPORT AB 58.205 ‐111.390 1968 1990 11 63
‐‐
ATHABASCA RIVER
ATR‐DD AB 57.446 ‐111.605 ≤2011 2014 ≥4
4X/yr
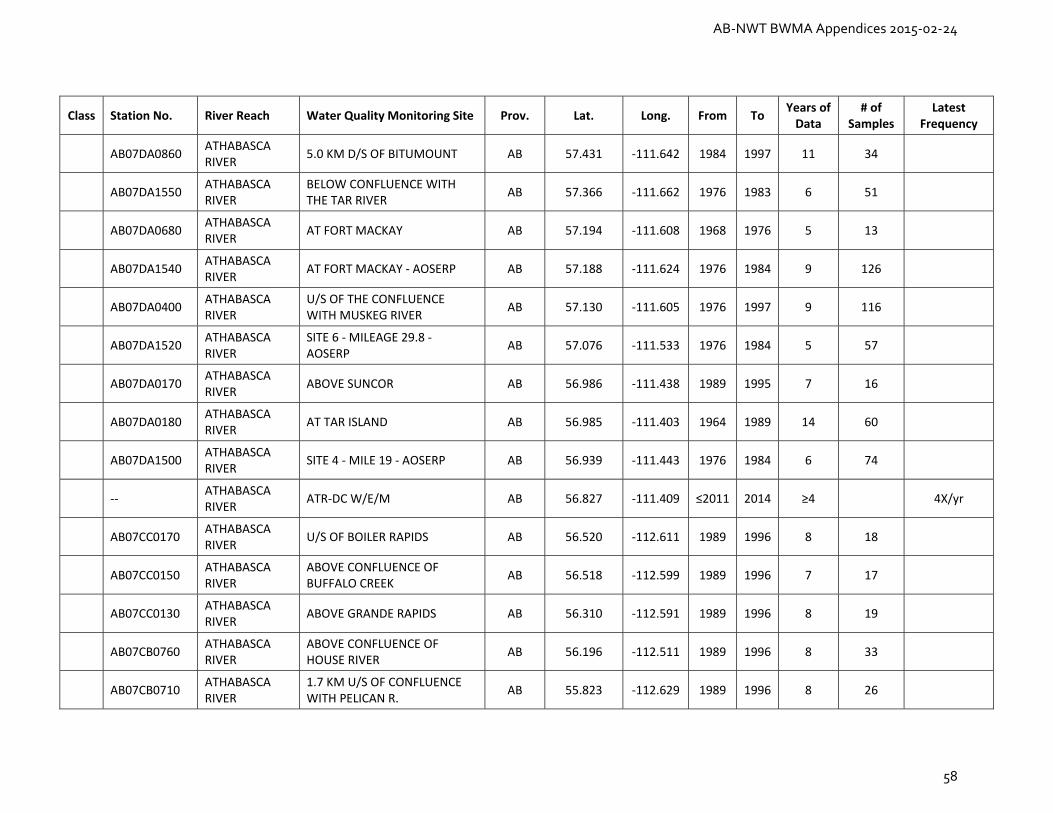
AB‐NWT BWMA Appendices 2015‐02‐24
58
Class Station No. River Reach Water Quality Monitoring Site Prov. Lat. Long. From To Years of Data
# of Samples
Latest Frequency
AB07DA0860
ATHABASCA RIVER
5.0 KM D/S OF BITUMOUNT AB 57.431 ‐111.642 1984 1997 11 34
AB07DA1550
ATHABASCA RIVER
BELOW CONFLUENCE WITH THE TAR RIVER
AB 57.366 ‐111.662 1976 1983 6 51
AB07DA0680
ATHABASCA RIVER
AT FORT MACKAY AB 57.194 ‐111.608 1968 1976 5 13
AB07DA1540
ATHABASCA RIVER
AT FORT MACKAY ‐ AOSERP AB 57.188 ‐111.624 1976 1984 9 126
AB07DA0400
ATHABASCA RIVER
U/S OF THE CONFLUENCE WITH MUSKEG RIVER
AB 57.130 ‐111.605 1976 1997 9 116
AB07DA1520
ATHABASCA RIVER
SITE 6 ‐ MILEAGE 29.8 ‐ AOSERP
AB 57.076 ‐111.533 1976 1984 5 57
AB07DA0170
ATHABASCA RIVER
ABOVE SUNCOR AB 56.986 ‐111.438 1989 1995 7 16
AB07DA0180
ATHABASCA RIVER
AT TAR ISLAND AB 56.985 ‐111.403 1964 1989 14 60
AB07DA1500
ATHABASCA RIVER
SITE 4 ‐ MILE 19 ‐ AOSERP AB 56.939 ‐111.443 1976 1984 6 74
‐‐
ATHABASCA RIVER
ATR‐DC W/E/M AB 56.827 ‐111.409 ≤2011 2014 ≥4
4X/yr
AB07CC0170
ATHABASCA RIVER
U/S OF BOILER RAPIDS AB 56.520 ‐112.611 1989 1996 8 18
AB07CC0150
ATHABASCA RIVER
ABOVE CONFLUENCE OF BUFFALO CREEK
AB 56.518 ‐112.599 1989 1996 7 17
AB07CC0130
ATHABASCA RIVER
ABOVE GRANDE RAPIDS AB 56.310 ‐112.591 1989 1996 8 19
AB07CB0760
ATHABASCA RIVER
ABOVE CONFLUENCE OF HOUSE RIVER
AB 56.196 ‐112.511 1989 1996 8 33
AB07CB0710
ATHABASCA RIVER
1.7 KM U/S OF CONFLUENCE WITH PELICAN R.
AB 55.823 ‐112.629 1989 1996 8 26

AB‐NWT BWMA Appendices 2015‐02‐24
59
Class Station No. River Reach Water Quality Monitoring Site Prov. Lat. Long. From To Years of Data
# of Samples
Latest Frequency
AB07CB0700
ATHABASCA RIVER
11.7 KM D/S OF CONFLUENCE WITH DUNCAN CRK
AB 55.418 ‐112.729 1989 1996 8 28
AB07BE0020
ATHABASCA RIVER
D/S OF THE LESSER SLAVE RIVER AT SMITH
AB 55.168 ‐114.043 1989 1994 6 12
AB07BD0100
ATHABASCA RIVER
ABOVE SMITH D/S OF RAILWAY BRIDGE
AB 55.161 ‐114.056 1955 1984 20 75
AB07CB0660
ATHABASCA RIVER
3 KM D/S OF CALLING RIVER AB 55.116 ‐112.864 1991 1998 7 44
AB07BD0050
ATHABASCA RIVER
ABOVE TOWN OF SMITH AT HWY #2 BRIDGE
AB 55.071 ‐114.093 1985 2003 18 128
AB07BE0310
ATHABASCA RIVER
45 KM ABOVE TOWN OF ATHABASCA
AB 55.033 ‐113.478 1984 1996 11 32
AB07CB0580
ATHABASCA RIVER
0.5 KM U/S OF CONFLUENCE WITH LABICHE R.
AB 55.010 ‐112.733 1989 1996 8 26
AB07BD0020
ATHABASCA RIVER
0.5 KM U/S OF CONFLUENCE WITH PEMBINA R.
AB 54.741 ‐114.288 1989 1996 8 21
AB07BD0010
ATHABASCA RIVER
AT VEGA FERRY (KLONDYKE) AB 54.431 ‐114.461 1989 1996 5 8
AB07AH0370
ATHABASCA RIVER
NEAR FORT ASSINIBOINE AB 54.317 ‐114.788 1960 1999 13 115
AB07AE0130
ATHABASCA RIVER
NEAR WINDFALL 1.5 KM D/S OF TWO CREEK
AB 54.248 ‐116.239 1988 1993 6 17
AB07AH0320
ATHABASCA RIVER
5.0 KM D/S FIVE MILE ISLAND AB 54.238 ‐115.023 1989 1996 8 24
AB07AE0160
ATHABASCA RIVER
AT WINDFALL BRIDGE AB 54.208 ‐116.060 1960 2005 18 120
AB07AH0130
ATHABASCA RIVER
3 KM D/S OF MCLEOD RIVER CONFLUENCE
AB 54.165 ‐115.660 1988 1996 6 20
AB07AH0220
ATHABASCA RIVER
10 KM D/S MCLEOD RIVER CONFLUENCE
AB 54.159 ‐115.550 1988 2000 12 35

AB‐NWT BWMA Appendices 2015‐02‐24
60
Class Station No. River Reach Water Quality Monitoring Site Prov. Lat. Long. From To Years of Data
# of Samples
Latest Frequency
AB07AH0280
ATHABASCA RIVER
AT BRIDGE NORTH OF BLUE RIDGE
AB 54.159 ‐115.391 1988 1996 7 37
AB07AH0255
ATHABASCA RIVER
14 KM D/S MCLEOD RIVER CONFLUENCE
AB 54.159 ‐115.508 1999 2005 7 33
AB07AE0040
ATHABASCA RIVER
AT KNIGHT BRIDGE ON HWY #947
AB 54.153 ‐116.593 1980 1996 6 12
AB07AE0360
ATHABASCA RIVER
AT WHITECOURT AT HWY #43 BRIDGE
AB 54.149 ‐115.721 1955 1996 32 157
AB07AE0020
ATHABASCA RIVER
BELOW CONFLUENCE OF BERLAND RIVER
AB 54.010 ‐116.837 1989 1994 5 8
AB07AD0570
ATHABASCA RIVER
BEFORE CONFLUENCE OF BERLAND RIVER
AB 54.002 ‐116.844 1959 1996 11 49
AB07AD0530
ATHABASCA RIVER
6.2 KM D/S OF OLDMAN CREEK AB 53.795 ‐117.184 1988 1995 5 13
AB07AD0460
ATHABASCA RIVER
50 KM BELOW HINTON AT EMERSON L. BRDGE
AB 53.703 ‐117.163 1974 1986 6 19
AB07AD0490
ATHABASCA RIVER
5 KM U/S OF CONFLUENCE OF OLDMAN CREEK
AB 53.701 ‐117.161 1986 1996 8 26
AB07AD0440
ATHABASCA RIVER
AT OLD OBED FERRY AB 53.625 ‐117.202 1960 1996 15 69
AB07AD0360
ATHABASCA RIVER
AT OBED MOUTAIN COALS BRIDGE
AB 53.524 ‐117.363 1960 2005 22
AB07AD0320
ATHABASCA RIVER
BELOW HINTON 2.3 KM. D/S OF TRAIL CREEK
AB 53.485 ‐117.463 1985 1996 7 13
AB07AD0280
ATHABASCA RIVER
BELOW HINTON 1.7 KM D/S OF CENTRE CREEK
AB 53.454 ‐117.503 1957 1996 15
AB07AD0240
ATHABASCA RIVER
BELOW HINTON AT BRIDGE, WELDWOOD HAUL RD
AB 53.430 ‐117.557 1957 1991 11 75
AB07AD0260
ATHABASCA RIVER
BELOW HINTON AT BRIDGE, CHAMPION HAUL RD
AB 53.429 ‐117.556 1984 1993 5 16

AB‐NWT BWMA Appendices 2015‐02‐24
61
Class Station No. River Reach Water Quality Monitoring Site Prov. Lat. Long. From To Years of Data
# of Samples
Latest Frequency
AB07AD0120
ATHABASCA RIVER
U/S OF PULP MILL WATER INTAKE
AB 53.413 ‐117.588 1970 1995 8 35
AB07AD0160
ATHABASCA RIVER
0.1 KM U/S OF HINTON PUMPHOUSE
AB 53.411 ‐117.588 1956 1999 27 319
‐‐
ATHABASCA RIVER
ATR‐SR AB 26.192 ‐120.183 ≤2011 2014 ≥4
1X/yr
AB07GE0190 BEAR RIVER
AT CONFLUENCE WITH WAPITI RIVER
AB 55.108 ‐118.472 1989 1998 5 13
‐‐ BEAVER RIVER BER‐1 AB 57.120 ‐111.600 ≤2011 2014 ≥4
1X/yr (fall)
‐‐ BEAVER RIVER BER‐2 AB 56.944 ‐111.567 ≤2011 2014 ≥4
1X/yr (fall)
AB07GB0105
BEAVERDAM CREEK
2KM D/S OF SMOKY RIVER COALS POND 12S‐5
AB 54.064 ‐119.307 2009 2014 16 72 4X/yr
AB07GD0020
BEAVERLODGE RIVER
U/S OF BEAVERTAIL CREEK AB 55.338 ‐119.640 1994 2007 6 30
AB07GD0040
BEAVERLODGE RIVER
U/S OF BEAVERLODGE AB 55.201 ‐119.482 1994 2007 6 31
AB07GD0070
BEAVERLODGE RIVER
AT GRAVEL PIT AB 55.113 ‐119.335 1994 2007 6 31
AB07GD0030
BEAVERTAIL CREEK
AT THE MOUTH AB 55.318 ‐119.635 1995 2007 5 29
AB07AC0010 BERLAND RIVER
BEFORE CONFLUENCE WITH ATHABASCA RIVER
AB 54.004 ‐116.847 1984 1996 11 42
AB07AF0230 BERRY'S CREEK
NEAR CONFLUENCE WITH GREGG RIVER
AB 53.094 ‐117.447 1985 2008 7 19
‐‐ BIRCH CREEK BRC‐1 AB 55.615 ‐111.124 2013 2014 2
4X/yr
‐‐ BIRCH RIVER BI1 AB 58.315 ‐113.069 2013 2014 2
12X/yr

AB‐NWT BWMA Appendices 2015‐02‐24
62
Class Station No. River Reach Water Quality Monitoring Site Prov. Lat. Long. From To Years of Data
# of Samples
Latest Frequency
AB07DA1440
BRIDGE CREEK DIVERSION
AT HWY #63 AB 57.121 ‐111.625 1976 1980 5 36
AB07GF0230
BRIDLEBIT CREEK
NEAR VALLEYVIEW AT WSC GAUGE
AB 54.936 ‐117.734 2000 2004 5 300
AB07CB0620
CALLING LAKE INLET
LAKE INLET AB 55.291 ‐113.405 1987 1996 8 20
AB07CB0640 CALLING RIVER
NEAR CONFLUENCE WITH ATHABASCA RIVER
AB 55.090 ‐112.883 1984 1996 10 29
‐‐ CALUMET CAR‐2 AB 57.438 ‐111.754 ≤2011 2014 ≥4
1X/yr (fall)
‐‐ CALUMET CA1/CAR‐1 AB 57.406 ‐111.673 ≤2011 2014 ≥4
1X/yr (fall)
AB07KF0060
CHENAL DES QUATRE FOURCHERS
6.5 KM D/S FROM FOUR FORKS SITE 75
AB 58.665 ‐111.357 1977 1983 7 36
‐‐
CHRISTINA LAKE
CHL‐1 AB 55.632 ‐111.044 ≤2011 2014 ≥4
4X/yr
‐‐
CHRISTINA RIVER
CH1/CHR‐1 AB 56.667 ‐111.066 ≤2011 2014 ≥4
12X/yr
‐‐
CHRISTINA RIVER
CHR‐4 AB 55.888 ‐111.543 ≤2011 2014 ≥4
4X/yr
‐‐
CHRISTINA RIVER
CHR‐2 AB 55.886 ‐110.802 ≤2011 2014 ≥4
12X/yr
‐‐
CHRISTINA RIVER
CHR‐3 AB 55.719 ‐111.220 ≤2011 2014 ≥4
4X/yr
AB07CD0100
CLEARWATER RIVER
NEAR WATERWAYS AB 56.701 ‐111.329 1973 1997 14 54
AB07CD0210
CLEARWATER RIVER
3 KM ABOVE WATERWAYS AB 56.689 ‐111.318 1970 1981 7 54
‐‐
CLEARWATER RIVER
CL3/CLR‐2 AB 56.669 ‐111.064 ≤2011 2014 ≥4
12X/yr

AB‐NWT BWMA Appendices 2015‐02‐24
63
Class Station No. River Reach Water Quality Monitoring Site Prov. Lat. Long. From To Years of Data
# of Samples
Latest Frequency
AB07BK0105
DRIFTWOOD RIVER
ABOVE CONFLUENCE WITH LESSER SLAVE R.
AB 55.254 ‐114.239 1999 2007 5 16
‐‐ ELLS RIVER EL1/ELR‐1/ELLS RIFF 3 AB 57.308 ‐111.679 ≤2011 2014 ≥4
12X/yr
AB07DA0750 ELLS RIVER AT THE MOUTH AB 57.304 ‐111.676 1972 1996 12 36
‐‐ ELLS RIVER
EL2/ELLS/RIFF 2/ELR‐2/ELLS RIFF 2
AB 57.245 ‐111.737 ≤2011 2014 ≥4
12X/yr
‐‐ ELLS RIVER ELR‐2A (RAMP) AB 57.233 ‐111.754 ≤2011 2012 ≥2 ≥2
‐‐ ELLS RIVER ELLS/RIFF 5/ELLS RIFF 5 AB 57.228 ‐111.959 2013 2014 2
12X/yr
‐‐ ELLS RIVER ELR‐3 (RAMP) AB 57.221 ‐111.989 2013 2014 2
4X/yr
AB07AF0380
EMBARRAS RIVER
NEAR CONFLUENCE WITH MCLEOD RIVER
AB 53.459 ‐116.617 1984 2006 10 57
AB07AF0255 FALLS CREEK
NEAR CONFLUENCE WITH GREGG RIVER
AB 53.101 ‐117.471 1998 2008 5 11
‐‐ FIREBAG RIVER FI1 AB 57.743 ‐111.351 2012 2014 3
12X/yr
‐‐ FIREBAG RIVER FI WSC AB 57.651 ‐111.202 ≤2011 2014 ≥4
12X/yr
‐‐ FIREBAG RIVER FI2/FIR‐2/FIR UPPER AB 57.335 ‐110.476 ≤2011 2014 ≥4
1X/yr (fall)
‐‐ FORT CREEK FOC‐1 AB 57.409 ‐111.640 ≤2011 2014 ≥4
1X/yr (fall)
‐‐ GARDINER LAKE GAL‐1 AB 57.537 ‐112.510 2014 2014 1
4X/yr
AB07AH0410
GOOSE LAKE INFLOW
LAKE INFLOW AB 54.324 ‐115.158 1992 1996 5 65

AB‐NWT BWMA Appendices 2015‐02‐24
64
Class Station No. River Reach Water Quality Monitoring Site Prov. Lat. Long. From To Years of Data
# of Samples
Latest Frequency
AB07GE0940
GRANDE PRAIRIE CREEK
NW OF SEXSMITH ON HWY #59 AB 55.374 ‐118.914 1999 2007 9 116
AB07AF0330 GREGG RIVER
8 KM U/S CONFLUENCE WITH MCLEOD RIVER
AB 53.252 ‐117.359 1984 2000 6 33
AB07AF0262 GREGG RIVER 9.5 D/S OF SPHINX CREEK AB 53.185 ‐117.506 2001 2014 14 76 4X/yr
AB07AF0260 GREGG RIVER
NEAR HWY #40 AND D/S FALLS CREEK
AB 53.102 ‐117.471 1984 1998 5 22
AB07AF0210 GREGG RIVER
ABOVE LUSCAR VALLEY (CRC) MINE
AB 53.059 ‐117.451 1985 2014 21 95 4X/yr
‐‐ GREGOIRE LAKE GRL‐1 AB 56.449 ‐111.127 ≤2011 2014 ≥4
4X/yr
‐‐
GREGOIRE RIVER (LOWER)
GRR‐1 AB 56.484 ‐110.835 2014 2014 1
4X/yr
AB07BF0050
GROUARD CHANNEL
AT HWY #750 BRIDGE AB 55.514 ‐116.165 1990 2008 6 24
AB07CD0110
HANGINGSTONE CREEK
AT HWY #63 AB 56.705 ‐111.356 1976 1983 8 73
‐‐
HANGINGSTONE RIVER
HAR‐1A AB 56.708 ‐111.358 2013 2014 2
1X/yr (fall)
‐‐
HANGINGSTONE RIVER
HAR1 AB 56.632 ‐111.350 2013 2014 2
1X/yr (fall)
AB07DA1090
HARTLEY (JACKPINE) CREEK
3 KM ABOVE CONFLUENCE WITH MUSKEG R.
AB 57.238 ‐111.415 1976 2008 5 21
‐‐
HIGH HILLS RIVER
HIHI1/HHR‐1/HIGH HILLS AB 56.743 ‐110.511 ≤2011 2014 ≥4
4X/yr
AB07FD1390 HINES CREEK
ABOVE GERRY LAKE NW OF GRIMSHAW
AB 56.334 ‐118.263 1999 2007 9 129
AB07CB0770 HOUSE RIVER
BEFORE CONFLUENCE WITH ATHABASCA RIVER
AB 56.200 ‐112.496 1984 1996 10 37

AB‐NWT BWMA Appendices 2015‐02‐24
65
Class Station No. River Reach Water Quality Monitoring Site Prov. Lat. Long. From To Years of Data
# of Samples
Latest Frequency
‐‐ ISADORE'S LAKE ISL‐1 AB 57.230 ‐111.607 ≤2011 2014 ≥4
1X/yr (fall)
‐‐ IYINIMIN CREEK IYC‐1 AB 57.250 ‐111.175 ≤2011 2014 ≥4
1X/yr (fall)
‐‐
JACK PINE RIVER
TR3.1/JAC‐1 AB 57.239 ‐111.414 ≤2011 2014 ≥4
12X/yr
‐‐
JACK PINE RIVER
TR3.2 AB 57.206 ‐111.390 2012 2014 3
12X/yr
‐‐
JACK PINE RIVER
JA2/JAC‐2 AB 57.067 ‐111.329 ≤2011 2014 ≥4
1X/yr (fall)
‐‐
JACKFISH RIVER (OUTLET OF CHRISTINA L.)
JAR‐1 AB 55.672 ‐111.098 2012 2014 3
4X/yr
AB07DA0600
JACKPINE (HARTLEY) CREEK
0.4 KM ABOVE CONFLUENCE WITH MUSKEG R.
AB 57.259 ‐111.465 1976 2014 17 156 12X/yr
‐‐ JOHNSON LAKE JOL‐1 AB 57.657 ‐110.389 ≤2011 2014 ≥4
4X/yr
‐‐ KEARL LAKE KL1/KEL‐1 AB 57.298 ‐111.251 ≤2011 2014 ≥4
1X/yr (fall)
AB07GE0930
KLESKUN HILLS MAIN DRAIN
NEAR GRANDE PRAIRIE NEAR HWY #34
AB 55.225 ‐118.460 1999 2007 9 80
AB07CA0040 LA BICHE RIVER
BEFORE CONFLUENCE WITH ATHA. RIVER
AB 55.016 ‐112.726 1984 1996 10 35
AB07BK0010
LESSER SLAVE RIVER
AT BRIDGE NEAR OUTFLOW AB 55.306 ‐114.760 1988 2008 18 121
AB07BK0020
LESSER SLAVE RIVER
BELOW WEIR, NEAR OUTFLOW AB 55.305 ‐114.753 1988 2007 6 23
AB07BK0030
LESSER SLAVE RIVER
AT MITSUE BRIDGE AB 55.293 ‐114.589 1989 2007 11 29

AB‐NWT BWMA Appendices 2015‐02‐24
66
Class Station No. River Reach Water Quality Monitoring Site Prov. Lat. Long. From To Years of Data
# of Samples
Latest Frequency
AB07BK0070
LESSER SLAVE RIVER
U/S OF THE OTAUWAU RIVER AB 55.281 ‐114.419 1989 2007 6 14
AB07BK0100
LESSER SLAVE RIVER
0.5 KM U/S OF DRIFTWOOD RIVER
AB 55.254 ‐114.246 1989 2007 11 24
AB07BK0120
LESSER SLAVE RIVER
14.5 KM U/S CONFLUENCE WITH ATHA. R.
AB 55.229 ‐114.148 1965 1984 6 24
AB07BK0125
LESSER SLAVE RIVER
9.5 KM U/S OF ATHA. R. CONFLUENCE
AB 55.207 ‐114.123 1996 2014 17 99 6X/yr
AB07BK0130
LESSER SLAVE RIVER
AT CONFLUENCE WITH ATHABASCA RIVER
AB 55.166 ‐114.062 1985 2007 15 123
AB07GH0050
LITTLE SMOKY RIVER
RIVER NEAR THE MOUTH AB 55.680 ‐117.592 1989 1998 5 19
AB07GH0020
LITTLE SMOKY RIVER
5 M D/S OF ROAD 669 BRIDGE AB 55.083 ‐117.129 1990 1996 7 15
‐‐
LOWER BUCKTON
BU2 AB 58.128 ‐111.889 2013 2014 2
12X/yr
AB07AF0088 LUSCAR CREEK D/S HWY #40 BRIDGE AB 53.062 ‐117.301 1998 2014 17 85 4X/yr
AB07AF0065 LUSCAR CREEK
ABOVE LUSCAR VALLEY (CRC) MINE
AB 53.052 ‐117.421 1998 2014 17 80 4X/yr
‐‐ MACKAY RIVER MA1/PC MA2/MAR‐1 AB 57.176 ‐111.656 ≤2011 2014 ≥4
12X/yr
AB07DB0060 MACKAY RIVER AT HWY #63 AB 57.168 ‐111.640 1976 1997 6 42
‐‐ MACKAY RIVER MAR‐2A (RAMP) AB 57.021 ‐111.828 ≤2011 2014 ≥4
1X/yr (fall)
‐‐ MACKAY RIVER MA2/PC MA5/MAR‐2 AB 56.967 ‐111.908 ≤2011 2014 ≥4
12X/yr
AB07AE0030
MARSH HEAD CREEK
NEAR CONFLUENCE WITH ATHA. R.
AB 54.152 ‐116.596 1989 1996 8 25

AB‐NWT BWMA Appendices 2015‐02‐24
67
Class Station No. River Reach Water Quality Monitoring Site Prov. Lat. Long. From To Years of Data
# of Samples
Latest Frequency
AB07BG0020 MARTEN CREEK AT HWY #88 AB 55.533 ‐114.890 1990 2008 5 18
‐‐ MCIVOR RIVER MC1 AB 58.059 ‐111.905 2013 2014 2
12X/yr
‐‐ MCLEAN CREEK MCC‐1 AB 56.897 ‐111.416 ≤2011 2014 ≥4
1X/yr (fall)
‐‐
MCLELLAND LAKE
MCL‐1 AB 57.491 ‐111.278 ≤2011 2014 ≥4
1X/yr (fall)
AB07AG0390 MCLEOD RIVER
AT WHITECOURT ‐ HWY #43 BRIDGE
AB 54.136 ‐115.696 1955 2014 43 223 4X/yr
AB07AG0260 MCLEOD RIVER D/S OF ROSEVEAR FERRY AB 53.700 ‐116.156 1986 2006 10 43
AB07AG0045 MCLEOD RIVER SOUTH OF EDSON AB 53.531 ‐116.482 1998 2006 9 42
AB07AF0350 MCLEOD RIVER
U/S CONFLUENCE WITH EMBARRAS RIVER
AB 53.458 ‐116.621 1984 2001 7 40
AB07AF0340 MCLEOD RIVER
BELOW CONFLUENCE WITH GREGG RIVER
AB 53.307 ‐117.268 1984 2014 16 74 4X/yr
AB07AF0200 MCLEOD RIVER
U/S CONFLUENCE WITH THE GREGG RIVER
AB 53.290 ‐117.279 1984 2000 5 28
AB07AF0100 MCLEOD RIVER 3.5 KM D/S OF LUSCAR CREEK AB 53.071 ‐117.278 1985 2001 5 13
AB07AF0050 MCLEOD RIVER U/S OF CADOMIN AB 53.010 ‐117.332 1985 1998 5 18
AB07AF0045 MCLEOD RIVER
0.1 KM U/S OF CADOMIN CREEK
AB 52.990 ‐117.333 1998 2014 17 69 4X/yr
AB07AF0041 MCLEOD RIVER
0.1 KM U/S OF WHITEHORSE CREEK
AB 52.984 ‐117.336 2009 2014 6 25 4X/yr
AB07AF0010 MCLEOD RIVER U/S OF MOUNTAIN PARK AB 52.899 ‐117.277 1995 2014 12 51 4X/yr

AB‐NWT BWMA Appendices 2015‐02‐24
68
Class Station No. River Reach Water Quality Monitoring Site Prov. Lat. Long. From To Years of Data
# of Samples
Latest Frequency
‐‐
MONDAY CREEK
MOC‐1 AB 55.585 ‐110.823 2013 2014 2
4X/yr
AB07DA2755 MUSKEG CREEK
AT CONFLUENCE WITH MUSKEG RIVER
AB 57.308 ‐111.389 2008 2014 7 61
AB07DA0440 MUSKEG RIVER 11 KM U/S STANLEY CREEK AB 57.417 ‐111.221 2008 2014 12 106 12X/yr
AB07DA0475 MUSKEG RIVER U/S STANLEY CREEK AB 57.353 ‐111.336 2003 2014 12 107 12X/yr
‐‐ MUSKEG RIVER MUR‐6 AB 57.344 ‐111.131 ≤2011 2014 ≥4
4X/yr
‐‐ MUSKEG RIVER M7 AB 57.332 ‐111.120 2012 2014 3
12X/yr
AB07DA2750 MUSKEG RIVER D/S OF STANLY CREEK AB 57.331 ‐111.374 1996 2002 6 27
AB07DA2754 MUSKEG RIVER
ABOVE CONFLUENCE WITH MUSKEG CREEK
AB 57.307 ‐111.394 2010 2014 5 58 12X/yr
AB07DA0595 MUSKEG RIVER
U/S OF JACKPINE (HARTLEY) CREEK
AB 57.264 ‐111.473 1998 2014 14 143 12X/yr
‐‐ MUSKEG RIVER MU1/M2/MU1 WSC AB 57.192 ‐111.573 ≤2011 2014 ≥4
12X/yr
AB07DA0610 MUSKEG RIVER
AT WSC GAUGE D/S OF KEARL LAKE ROAD
AB 57.192 ‐111.568 ≤2011 2014 23 290 12X/yr
AB07DA0620 MUSKEG RIVER NEAR THE MOUTH AB 57.135 ‐111.602 1972 2002 21 71
‐‐ MUSKEG RIVER MU0/MUR‐1 AB 57.134 ‐111.601 2013 2014 2
12X/yr
‐‐ NAMUR LAKE NAL‐1 AB 57.436 ‐112.650 2014 2014 1
4X/yr
‐‐
NORTH MUSKEG RIVER
NM1/MUC‐1 AB 57.284 ‐111.316 ≤2011 2014 ≥4
1X/yr (fall)
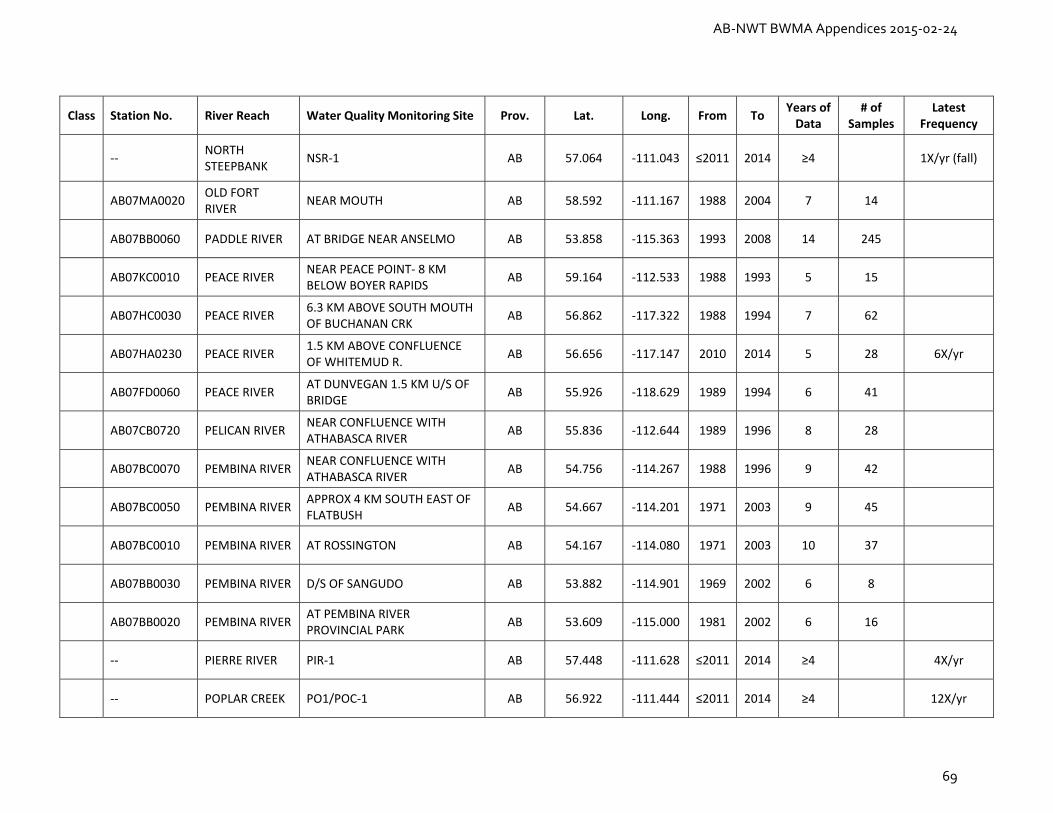
AB‐NWT BWMA Appendices 2015‐02‐24
69
Class Station No. River Reach Water Quality Monitoring Site Prov. Lat. Long. From To Years of Data
# of Samples
Latest Frequency
‐‐
NORTH STEEPBANK
NSR‐1 AB 57.064 ‐111.043 ≤2011 2014 ≥4
1X/yr (fall)
AB07MA0020
OLD FORT RIVER
NEAR MOUTH AB 58.592 ‐111.167 1988 2004 7 14
AB07BB0060 PADDLE RIVER AT BRIDGE NEAR ANSELMO AB 53.858 ‐115.363 1993 2008 14 245
AB07KC0010 PEACE RIVER
NEAR PEACE POINT‐ 8 KM BELOW BOYER RAPIDS
AB 59.164 ‐112.533 1988 1993 5 15
AB07HC0030 PEACE RIVER
6.3 KM ABOVE SOUTH MOUTH OF BUCHANAN CRK
AB 56.862 ‐117.322 1988 1994 7 62
AB07HA0230 PEACE RIVER
1.5 KM ABOVE CONFLUENCE OF WHITEMUD R.
AB 56.656 ‐117.147 2010 2014 5 28 6X/yr
AB07FD0060 PEACE RIVER
AT DUNVEGAN 1.5 KM U/S OF BRIDGE
AB 55.926 ‐118.629 1989 1994 6 41
AB07CB0720 PELICAN RIVER
NEAR CONFLUENCE WITH ATHABASCA RIVER
AB 55.836 ‐112.644 1989 1996 8 28
AB07BC0070 PEMBINA RIVER
NEAR CONFLUENCE WITH ATHABASCA RIVER
AB 54.756 ‐114.267 1988 1996 9 42
AB07BC0050 PEMBINA RIVER
APPROX 4 KM SOUTH EAST OF FLATBUSH
AB 54.667 ‐114.201 1971 2003 9 45
AB07BC0010 PEMBINA RIVER AT ROSSINGTON AB 54.167 ‐114.080 1971 2003 10 37
AB07BB0030 PEMBINA RIVER D/S OF SANGUDO AB 53.882 ‐114.901 1969 2002 6 8
AB07BB0020 PEMBINA RIVER
AT PEMBINA RIVER PROVINCIAL PARK
AB 53.609 ‐115.000 1981 2002 6 16
‐‐ PIERRE RIVER PIR‐1 AB 57.448 ‐111.628 ≤2011 2014 ≥4
4X/yr
‐‐ POPLAR CREEK PO1/POC‐1 AB 56.922 ‐111.444 ≤2011 2014 ≥4
12X/yr

AB‐NWT BWMA Appendices 2015‐02‐24
70
Class Station No. River Reach Water Quality Monitoring Site Prov. Lat. Long. From To Years of Data
# of Samples
Latest Frequency
AB07DA0110 POPLAR CREEK
21.6 KM NORTH OF FORT MCMURRAY VIA HWY #63
AB 56.914 ‐111.458 1976 1996 10 73
‐‐ RED CLAY RCC‐1 AB 57.697 ‐111.405 ≤2011 2014 ≥4
4X/yr
AB07CA0020
RED DEER CREEK
BEFORE ENTERING LAC LA BICHE LAKE
AB 54.768 ‐111.994 1985 1999 7 40
AB07DD0120
RICHARDSON RIVER
AT THE MOUTH AB 58.363 ‐111.237 1989 1996 8 28
‐‐
RICHARDSON RIVER
RI1 AB 58.360 ‐111.241 2012 2014 3
12X/yr
AB07NA0030
RIVIERE DES ROCHERS
150 M U/S OF REVILLION COUPE
AB 58.845 ‐111.259 1976 1991 13 80
AB07AH0010
SAKWATAMAU RIVER
NEAR THE CONFLUENCE WITH ATHA. R.
AB 54.158 ‐115.722 1990 1997 8 79
‐‐
SAWBONES CREEK (NORTH OF CHISTINA L )
SAC‐1 AB 55.650 ‐110.818 2012 2014 3
4X/yr
AB07BK0025
SAWRIDGE CREEK
AT HWY #88 BRIDGE AB 55.285 ‐114.758 1999 2007 5 15
‐‐ SHIPYARD LAKE SHL‐1 AB 56.961 ‐111.435 ≤2011 2014 ≥4
1X/yr (fall)
AB07GF0090
SIMONETTE RIVER
NEAR THE MOUTH AB 55.159 ‐118.255 1989 1998 5 18
AB07GJ0260 SMOKY RIVER AT MOUTH AB 56.159 ‐117.348 1983 1998 6 18
AB07GA0010 SMOKY RIVER
U/S OF MCINTYRE PORCUPINE MINES
AB 55.919 ‐119.183 1971 1975 5 17
AB07GJ0010 SMOKY RIVER AT WATINO AB 55.716 ‐117.622 1976 2014 35 444 12X/yr
AB07GJ0110 SMOKY RIVER
0.1 KM U/S OF PUSKWASKAU RIVER CONFLUENCE
AB 55.484 ‐118.159 1989 1998 5 16

AB‐NWT BWMA Appendices 2015‐02‐24
71
Class Station No. River Reach Water Quality Monitoring Site Prov. Lat. Long. From To Years of Data
# of Samples
Latest Frequency
AB07GJ0080 SMOKY RIVER
AT BEZANSON BRIDGE, HWY #34
AB 55.237 ‐118.257 1966 1998 17 45
AB07GF0050 SMOKY RIVER U/S OF WAPITI RIVER AB 55.135 ‐118.298 1989 1997 5 17
AB07GA0020 SMOKY RIVER
D/S OF MCINTYRE PORCUPINE MINES
AB 54.833 ‐119.167 1971 1975 5 16
AB07GB0125 SMOKY RIVER AT WANYANDIE FLATS EAST AB 54.070 ‐118.895 2002 2006 5 16
AB07BF0020
SOUTH HEART RIVER
AT HIGH PRAIRIE AB 55.529 ‐116.517 1990 1996 7 17
AB07AF0250 SPHINX CREEK
NEAR CONFLUENCE WITH GREGG RIVER
AB 53.119 ‐117.496 1985 2008 6 14
‐‐ STANLEY CREEK STC‐1 AB 57.352 ‐111.376 ≤2011 2014 ≥4
1X/yr (fall)
AB07DA0260
STEEPBANK RIVER
AT THE MOUTH AB 57.025 ‐111.460 1972 1997 7 16
‐‐
STEEPBANK RIVER
ST1/ST1/STR‐1/STB RIFF 1 AB 57.023 ‐111.476 ≤2011 2014 ≥4
12X/yr
AB07DA1000
STEEPBANK RIVER
7KM U/S FROM THE MOUTH AB 57.005 ‐111.415 1976 1980 5 39
‐‐
STEEPBANK RIVER
ST WSC AB 56.999 ‐111.407 2012 2014 3
12X/yr
‐‐
STEEPBANK RIVER
STRIFF7/STB RIFF 7 AB 56.980 ‐111.299 2012 2014 3
12X/yr
‐‐
STEEPBANK RIVER
STR‐2 (RAMP)/STB RIFF 20 AB 56.927 ‐111.233 ≤2011 2014 ≥4
12X/yr
AB07DA2720
STEEPBANK RIVER
6 KM D/S OF NORTH STEEPBANK RIVER
AB 56.870 ‐111.146 1996 2001 5 25
‐‐
STEEPBANK RIVER
STRIFF10/STB RIFF 10 AB 56.869 ‐111.143 2013 2014 2
12X/yr

AB‐NWT BWMA Appendices 2015‐02‐24
72
Class Station No. River Reach Water Quality Monitoring Site Prov. Lat. Long. From To Years of Data
# of Samples
Latest Frequency
‐‐
STEEPBANK RIVER
ST2/STR‐3 AB 56.846 ‐111.082 2014 2014 1
1X/yr (fall)
‐‐
STEEPBANK RIVER
STR‐3/STB RIFF 11 AB 56.821 ‐110.991 ≤2011 2013 ≥3 ≥3
‐‐
SUNDAY CREEK (INLET TO CHISTINA L.)
SUC‐1 AB 55.584 ‐110.893 2012 2014 3
4X/yr
‐‐
SUNDAY CREEK (UPPER)
SUC‐2 AB 55.553 ‐111.095 2013 2014 2
4X/yr
AB07CE0040
SURMONT CREEK
APPROX 2 MILES ABOVE GREGOIRE LAKE
AB 56.450 ‐111.063 1978 1983 6 48
‐‐ TAR RIVER TA1/TAR‐2 AB 57.394 ‐111.992 ≤2011 2014 ≥4
1X/yr (fall)
‐‐ TAR RIVER TAR‐1 AB 57.323 ‐111.683 ≤2011 2014 ≥4
1X/yr (fall)
AB07BB0110
THUNDER LAKE ‐ INFLOW (DIVERSION)
AT STAFF GAUGE U/S OF DAIRY FARM
AB 54.151 ‐114.810 1992 1996 5 52
‐‐
UNNAMED CREEK (BIG CREEK)
UN1/BIC‐1 AB 57.631 ‐111.474 ≤2011 2014 ≥4
1X/yr (fall)
‐‐
UNNAMED CREEK (EAST OF CHRISTINA L.)
UNC‐2 AB 55.619 ‐110.717 2013 2014 2
4X/yr
‐‐
UPPER BUCKTON
BU1 AB 57.979 ‐111.772 2013 2014 2
12X/yr
AB07BC0540 WABASH CREEK
NEAR PIBROCH NW OF WESTLOCK
AB 54.224 ‐113.924 1999 2008 10 114
‐‐ WAPASU CREEK WA1 AB 57.378 ‐111.292 2014 2014 1
12X/yr

AB‐NWT BWMA Appendices 2015‐02‐24
73
Class Station No. River Reach Water Quality Monitoring Site Prov. Lat. Long. From To Years of Data
# of Samples
Latest Frequency
‐‐ WAPASU CREEK WAC‐1 AB 57.346
‐111.161
≤2011 2014 ≥4
1X/yr (fall)
AB07GJ0030 WAPITI RIVER
ABOVE CONFLUENCE WITH SMOKY RIVER
AB 55.137 ‐118.308 1983 2014 27 297 12X/yr
AB07GE0180 WAPITI RIVER
0.1 KM U/S OF BEAR RIVER CONFLUENCE
AB 55.107 ‐118.471 1989 1998 6 32
AB07GE0030 WAPITI RIVER 75 M D/S HWY #40 BRIDGE AB 55.082 ‐119.821 1990 1996 7 17
AB07GE0170 WAPITI RIVER
10 KM D/S G.P. PULP MILL EFFLUENT
AB 55.081 ‐118.536 1989 1998 6 20
AB07GE0060 WAPITI RIVER
5.0 KM D/S GRANDE PRAIRIE STP EFFLUENT
AB 55.078 ‐118.727 1989 1998 5 12
AB07GE0020 WAPITI RIVER AT HWY #40 BRIDGE AB 55.072 ‐118.805 1966 2014 38 317 12X/yr
AB07GE0070 WAPITI RIVER
D/S OF G.P. PULP MILL HAUL ROAD
AB 55.068 ‐118.705 1989 1998 6 23
AB07GB0110
WEST BEAVERDAM CREEK
NEAR CONFLUENCE WITH BEAVERDAM CREEK
AB 54.095 ‐119.322 1999 2014 16 71 4X/yr

AB‐NWT BWMA Appendices 2015‐02‐24
74
Map 2: Present (2014) Location of Transboundary Water Quality Sites within AB‐NWT Transboundary Basins

AB‐NWT BWMA Appendices 2015‐02‐24
75
I5 Groundwater Presently there is no monitoring of Transboundary Groundwater. Monitoring would be established as agreed by the BMC using the RIM process.
I6 Biology
Ecosystem health and diversity is evaluated by monitoring biological Indicators, hence it is important to incorporate these in this Agreement and regional and Basin‐level monitoring programs.
Some biological monitoring has taken place in the AB‐NWT border region as summarized below. Additional biological monitoring may have occurred in the region. Further research on past and current monitoring will be done as part of the Hay River and Slave River Learning Plans at the BMC after signing.
I4.1 Benthic Invertebrates Until recently, benthic invertebrates monitoring has been very limited in the NWT‐AB border region to date. Under the Slave Watershed Environmental Effects Program (SWEEP) benthic invertebrate sampling began in 2013. Led by Dr. Lorne Doig (University of Saskatchewan) and the Slave River and Delta Partnership (SRDP), this sampling is examining animal abundance, taxa/species richness, evenness of species abundance, and undertaking spatial comparisons across the Slave River and Delta. Sites were established in and around the Slave River Delta in 2013‐14, and additional sites will be established on the river main stem, near Fort Smith, in 2014. Additional benthic sampling, including a focus on genetic biodiversity analysis, is currently underway in the Slave River watershed. This work is being led by Dr. Donald Baird (Environment Canada/University of New Brunswick). Studies involving comparison to historical contaminant concentrations and guidelines, presence/absence when compared to historical accounts have also been undertaken6. I4.2 Fish In 1990, the Slave River Environmental Quality Monitoring Program (SREQMP) was established and measured the baseline condition of the aquatic ecosystem to compare to with future samples7. The program provided baseline data on contaminant levels in Slave River fish, water and suspended sediment to ensure that any present hazards were known and to support transboundary water negotiations. The program gave special attention to contaminants likely to result from development activities upstream in Northern Alberta. In 2010 and 2011, Dr. Paul Jones (University of Saskatchewan) collaborated with ENR‐GNWT and the Department of Fisheries and Oceans (SWEEP) to undertake a regional fish health study, which included sampling locations on the Athabasca, Slave and Peace Rivers.
6 Tripp et al. 1981, Paterson et al. 1992, McCarthy et al. 1997, Culp et al. 2005 7 Sanderson, J., C. Lafontaine and K. Robertson. Slave River Environmental Quality Monitoring Program: Final Five Year Study Report (1990‐1995). Water Resources Division, Department of Indian Affairs and Northern Development (DIAND). 1997.

AB‐NWT BWMA Appendices 2015‐02‐24
76
The fish health study is continuing under the SWEEP program, with focus on sampling locations in the Slave River and Slave River Delta. Studies involving comparison to historical metals and OCs and guidelines, HSI, GSI, condition of fish; presence/absence of fish compared to historical accounts has also been undertaken8. I4.3 Biomonitoring Indicators and Locations The Parties acknowledge the importance of monitoring biological components and agree that it will be considered when developing a monitoring program at the regional and Basin‐wide level. Biological Indicators and sampling locations will be further assessed as part of the Hay River and Slave River Learning Plans at the BMC after signing. The work on the Joint Oil Sands Monitoring Program will also inform this work. The SRDP undertook monitoring of key furbearer species in 2011‐2012. The study focused on population distribution, abundance and health of beaver, mink, muskrat and hare. Building on this work, monitoring of wildlife and wildlife habitat began in summer of 2014 as a part of the SWEEP program.
8 McCarthy et al. 1995, Sanderson et al. 1998, Jones et al. 2011, Tripp et al. 1981, Scott and Crossman 1998.

AB‐NWT BWMA Appendices 2015‐02‐24
77
Appendix J – Costs to Administer and Implement the Agreement
Section 13.2 of this Agreement states: The Parties agree that the costs to administer and implement this Agreement (as described in Appendix J) are subject to each Party’s appropriation, allocation of resources, and the 3‐5‐year work plan approved under section 13.1.2 f) of this Agreement. Although it is impossible to identify every cost that may arise, the Parties provide this partial list to clarify the nature of envisioned costs. For the purpose of this Agreement, associated costs are anticipated in three categories: administration, bilateral implementation, and jurisdictional implementation. Tasks may be completed by a Party with either in‐kind effort or direct resourcing (allocated from within a Party) or externally sub‐contracted services, and may involve both capital and operating costs. The following is provided for illustration of anticipated costs: 1. Administration of Agreement [costs to be borne by each jurisdiction separately] Each Party is responsible for payment of its:
• Participation on the BMC and its technical committees (e.g., staff time, travel, meeting costs, etc.);
• Documentation and reporting with respect to this Agreement; • Participation on any related committees as might be convened by the BMC or the Board(e.g.,
staff time, travel, meeting costs, etc.) under BMC direction; • Share of resources for administration of any committees convened by the BMC or the Board.
2. Bilateral Implementation of Agreement
The Parties agree to share bilateral implementation costs equally (50/50), with modifications on a case‐by‐case basis. As required by this Agreement or as determined by the BMC in accordance with section 13.2 of the Agreement, costs will be shared as required for the following:
• Monitoring: Capital and operating costs associated with the maintenance of existing or purchase, installation and operation of new monitoring and gauging stations related to:
o developing and implementing Learning Plans; o setting, monitoring, and revising (as required) Transboundary Objectives; o other monitoring or research as directed by the BMC or agreed to through any technical
committee of the Board; • Learning Plans: Costs associated with preparation, development and implementation of
Learning Plans (e.g., studies, monitoring, fieldwork, research, analysis); • Board: Resources allocated as a Party's share to support any technical committee of the Board,
under BMC direction, for Agreement implementation;
AB‐NWT BWMA Appendices 2015‐02‐24
78
• Research: Costs associated with research as directed by the BMC or agreed to through a technical committee of the Board.
3. Jurisdictional Implementation of Agreement [costs to be borne by each jurisdiction separately]
Each party is responsible for the cost of implementing its jurisdictional commitments under this Agreement, including costs associated with:
• Consultation; • Coordination with other jurisdictions (upstream and downstream); • Information sharing, notification and consultation (i.e., section 5 and 12 of this Agreement); • On‐going assessment of Triggers; • Meeting Transboundary Objectives:
o Regulatory actions or changes; o Policy or planning actions or changes; o Additional monitoring or studies; o Mitigation, enhancement or other conciliative measures as prescribed in section 4.3 k)
and m) of this Agreement.