machine learning from concept to clinic: reliable
TRANSCRIPT
MACHINE LEARNING FROM CONCEPT TO CLINIC: RELIABLE DETECTION OF BRAF
V600E DNA MUTATIONS IN THYROID NODULES USING HIGH-DIMENSIONAL RNA
EXPRESSION DATA
JAMES DIGGANS1, SU YEON KIM1, ZHANZHI HU1, DANIEL PANKRATZ1, MEI WONG1, JESSICA
REYNOLDS1, ED TOM1, MORAIMA PAGAN1, ROBERT MONROE1, JUAN ROSAI2, VIRGINIA A. LIVOLSI3,
RICHARD B. LANMAN1, RICHARD T. KLOOS1, P. SEAN WALSH1, AND GIULIA C. KENNEDY1
1. Veracyte, Inc., South San Francisco, California, USA (email: [email protected])
2. Centro Diagnostico Italiano, Milan, Italy
3. Department of Pathology, Perelman School of Medicine
University of Pennsylvania, Philadelphia, Pennsylvania, USA
The promise of personalized medicine will require rigorously validated molecular diagnostics developed on minimally invasive, clinically relevant samples. Measurement of DNA mutations is increasingly common in clinical settings but only higher-prevalence mutations are cost-effective. Patients with rare variants are at best ignored or, at worst, misdiagnosed. Mutations result in downstream impacts on transcription, offering the possibility of broader diagnosis for patients with rare variants causing similar downstream changes. Use of such signatures in clinical settings is rare as these algorithms are difficult to validate for commercial use. Validation on a test set (against a clinical gold standard) is necessary but not sufficient: accuracy must be maintained amidst interfering substances, across reagent lots and across operators. Here we report the development, clinical validation, and diagnostic accuracy of a pre-operative molecular test (Afirma BRAF) to identify BRAF V600E mutations using mRNA expression in thyroid fine needle aspirate biopsies (FNABs). FNABs were obtained prospectively from 716 nodules and more than 3,000 features measured using microarrays. BRAF V600E labels for training (n=181) and independent test (n=535) sets were established using a sensitive quantitative PCR (qPCR) assay. The resulting 128-gene linear support vector machine was compared to qPCR in the independent test set. Clinical sensitivity and specificity for malignancy were evaluated in a subset of test set samples (n=213) with expert-derived histopathology. We observed high positive- (PPA, 90.4%) and negative (NPA, 99.0%) percent agreement with qPCR on the test set. Clinical sensitivity for malignancy was 43.8% (consistent with published prevalence of BRAF V600E in this neoplasm) and specificity was 100%, identical to qPCR on the same samples. Classification was accurate in up to 60% blood. A double-mutant still resulting in the V600E amino acid change was negative by qPCR but correctly positive by Afirma BRAF. Non-diagnostic rates were lower (7.6%) for Afirma BRAF than for qPCR (24.5%), a further advantage of using RNA in small sample biopsies. Afirma BRAF accurately determined the presence or absence of the BRAF V600E DNA mutation in FNABs, a collection method directly relevant to solid tumor assessment, with performance equal to that of an established, highly sensitive DNA-based assay and with a lower non-diagnostic rate. This is the first such test in thyroid cancer to undergo sufficient analytical and clinical validation for real-world use in a personalized medicine context to frame individual patient risk and inform surgical choice.
1. Background and Significance
Thyroid nodules are solid or cystic growths found with increasing frequency with age. These
nodules are evaluated using ultrasound-guided fine-needle aspirate biopsy (FNAB) because some
nodules are malignant, and in 62 to 85%1 of cases are diagnosed benign by cytopathology. The
remainder of cases have an indeterminate or malignant cytopathology diagnosis and, historically,
have undergone diagnostic surgery to remove part- (hemithyroidectomy) or all (total thyroidectomy)
of the thyroid gland. Although the cytopathologically malignant nodules are almost always
confirmed as cancer post-operatively, in upwards of 75% of operated nodules with indeterminate
cytopathology2, the nodule is found to be benign yet these patients have born the risks and costs of
diagnostic surgery and are relegated to a lifetime of thyroid hormone replacement therapy (HRT) to
replace the missing organ. Conversely, for patients found to have cancer after an initial
hemithyroidectomy, many must return for a completion thyroidectomy, difficult in a neck scarred
from the initial surgery, to remove the rest of the thyroid tissue so that post-operative radioiodine
ablation of remnant cancer will be effective.
Deciding on the extent of surgery in the initial operation on a cytologically indeterminate thyroid
nodule remains a vexing question. Physicians must weigh the risk of missing active cancer or
performing incomplete surgery against risks of overtreatment that compromise patients’ long-term
quality of life when making this choice.
Here, molecular diagnostics have a powerful role to play in providing personalized estimated
risks of malignancy, thereby enabling physicians to accurately balance risk and reward in selecting
a treatment strategy. These diagnostics can be categorized as either ‘rule-out’ tests with high
sensitivity and negative predictive value (NPV, providing a confident declaration of benignity) or
‘rule-in’ tests with high specificity and positive predictive value (PPV, providing a confident
declaration of malignancy3).
One example of a rule out test enabling observation in lieu of surgery on cytologically
indeterminate but genomically benign FNABs is the Afirma GEC4. The GEC makes use of the gene
expression of 167 genes in the cells of an FNAB to preoperatively predict whether a given FNAB
is from a benign or malignant nodule2. Given the high NPV and moderate PPV of this test, a negative
result is reported as ‘benign’ while a positive result is reported as ‘suspicious’ rather than malignant.
Several DNA mutations and gene fusions have been well-studied in thyroid cancer and used as
‘rule-in’ markers (i.e. their presence is highly specific to malignancy although they are not sensitive
due to their low prevalence in thyroid cancers). Among the most widely studied of these are
mutations in BRAF, a member of the mitogen-activated protein kinase (MAPK) cascade involved
in cell signaling and proliferation5,6. The most common activating mutation (comprising 97% of
BRAF mutations in thyroid carcinomas7) results in a thymine to adenine transversion at nucleotide
1,799 (1799T>A) resulting in a substitution of valine (V) at codon 600 with glutamate (E). This
V600E mutation is highly specific for papillary thyroid carcinoma (PTC) diagnosis but has low
sensitivity (i.e. V600E absence is not itself diagnostic of benignity).

The presence or absence of BRAF V600E in FNABs is usually assessed using DNA via PCR-
or sequencing-based methods but these approaches all share three major limitations. These include
(1) they traditionally have low analytical sensitivity requiring that a large proportion (up to 20%) of
a given nodule have the relevant mutation before detection is possible. In addition, (2) reliance upon
a single, well-studied mutation cannot detect patients with alternate, lower-frequency mutations that
result in the same pattern of pathway activation. Finally, (3) PCR-based approaches with high
analytical sensitivity (i.e. <5% mutant allele) often require a large amount of DNA that is frequently
difficult to isolate from the small number of cells in an FNAB. This requirement leads to a high
proportion of non-diagnostic FNABs, forcing patients to return to their physician for additional
sample collection.
Gene expression signatures have been used to predict the presence or absence of point mutations
or rearrangements in DNA in several cancers8,9 but these studies were performed on cell cultures or
on blood, collection methods not directly relevant to solid tumor assessment. A gene expression
signature detecting BRAF V600E in a small cohort of PTC nodules has previously been reported10
but the classifier was built on tissue samples rather than FNABs, the generalization of these
classifiers to independent test sets was not evaluated and analytical verification studies were not
performed. In the current work, we demonstrate the analytical and clinical validity of a gene
expression signature in accurately classifying BRAF V600E mutation status in thyroid nodule
FNABs. We also show that mRNA-based methods can improve upon all three of the shortcomings
of DNA methods and accurately detect the presence of BRAF V600E with high analytical sensitivity
using input amounts consistently recovered from FNABs. In addition, we show that at least one low
prevalence mutation in BRAF results in the same gene expression pattern and is detected by Afirma
BRAF (and is not detected by 1799T>A-specific assays).
2. Methods
FNABs were obtained prospectively from 716 patients as either part of a previously-reported
collection2 (n=360) or from de-identified samples consecutively referred to the Veracyte CLIA-
certified clinical laboratory for GEC testing (n=356). Institutional Review Board (IRB) approvals
were obtained from all applicable local or central IRBs including consent for validation of the GEC
and additional molecular testing research. For the CLIA-certified laboratory samples, review and
IRB-exempt status was obtained (Liberty IRB, DeLand, FL).
Each patient had a slide prepared from an FNAB and read by a cytopathologist. FNABs collected
spanned Bethesda cytopathology categories11 II through VI (II: Benign, III: Atypia of Undetermined
Significance, IV: Follicular Neoplasm or Suspicious for Follicular Neoplasm, V: Suspicious for
Malignancy and VI: Malignant). A second FNAB for molecular testing was collected from the same
nodule. RNA and DNA from FNABs were extracted using the AllPrep Micro kit (QIAGEN) per
manufacturer's instructions. Total RNA was amplified, hybridized to a custom microarray, and gene
expression measured as previously described2.

A Competitive Allele-Specific TaqMan PCR (castPCR™, Life Technologies, Carlsbad, CA)
assay specific to the BRAF 1799T>A mutation was used to determine the percent mutation (%
MUT) of BRAF 1799T>A–derived V600E present in each DNA sample as previously reported12.
Training samples with % MUT greater than 2.5% were labeled BRAF V600E-positive (BRAF-
positive) and samples with % MUT of 2.5% or less were labeled BRAF V600E-negative (BRAF-
negative). This threshold for the analytical sensitivity of the castPCR assay in FNAB-derived
thyroid DNA was established to minimize unreliable training class labels due to stochastic effects
on amplification in low copy-number samples.
Table 1: Sample counts by Bethesda cytology category. VERA001: samples prospectively collected in a previously-reported study; CLIA: samples from patients consecutively referred to the Veracyte CLIA laboratory. Risk of malignancy increases with increasing Bethesda category ranging from benign (Bethesda II) to malignant (Bethesda VI). Training set labels derived from castPCR results at a threshold of 2.5%; independent test set labels shown using a threshold of 5% (although results were evaluated at 0%, 2.5% and 5%; see Table 3).
Training Set Independent Test Set
Cytology Source BRAF- BRAF+ Prevalence BRAF- BRAF+ Prevalence
Bethesda II All Samples 18 1 5.3% 32 1 3.0%
CLIA 0 0 - 0 0 -
VERA001 18 1 5.3% 32 1 3.0%
Bethesda III/IV All Samples 37 4 9.8% 298 3 1.0%
CLIA 12 2 14.3% 131 2 1.5%
VERA001 25 2 7.4% 167 1 0.6%
Bethesda V All Samples 34 27 44.3% 61 28 31.5%
CLIA 17 14 45.2% 41 21 33.9%
VERA001 17 13 43.3% 20 7 25.9%
Bethesda VI All Samples 25 35 58.3% 29 83 74.1%
CLIA 17 19 52.8% 20 60 75.0%
VERA001 8 16 66.7% 9 23 71.9%
Total 114 67 37.0% 420 115 21.5%
181 535
2.1. Classifier training and validation
Samples were randomized into training and independent test sets to ensure Bethesda cytology
category-specific representation in both training and test performance evaluation. Patient age and
gender, nodule size, cytology sub-type (PTC, etc.) and % MUT were evaluated for homogeneity
between sets after randomization. Investigators responsible for test set scoring were not involved in
randomization and were blind to test set castPCR results.

Training of the Afirma BRAF RNA classifier was carried out using Robust Multichip Average
(RMA)-normalized transcript cluster-level gene expression summaries and 10-fold cross-validation
(CV) across a variety of classification methods and gene counts. Gene selection occurred within
each CV loop via limma13 to identify genes distinguishing BRAF-positive from BRAF-negative
samples. Classifiers were evaluated for positive- (PPA) and negative percent agreement (NPA)14
with castPCR-derived training set labels. PPA and NPA are utilized when a surrogate comparison
is made to results from a second test (in this case, castPCR) in lieu of a clinical reference standard.
They are computed identically to sensitivity and specificity, respectively. The highest scoring
classification method and gene set were then used in a final round of model building with all 181
training samples resulting in the Afirma BRAF RNA classifier.
As use of this classifier in a ‘rule in’ context prioritized specificity over sensitivity, a series of
simulations were conducted using training set scores (under 10-fold CV) over a range of assumed
levels of run-to-run variability. For each level of variability, 5,000 simulated technical replicates of
the training data were generated and, in each, the resulting number of false positives and false
negatives were counted. The classifier decision threshold was then adjusted to minimize the
probability of false positives (maximizing specificity and PPV) while maintaining acceptable false
negative risk.
The classifier and this adjusted decision threshold were then locked prior to scoring the test set
and evaluating performance against castPCR. To strike a balance between assay analytical
sensitivity and clinical relevance of predictions, we evaluated the PPA and NPA of Afirma BRAF
calls with castPCR at % MUT thresholds ranging from 0% to 10%. Additional experiments
characterized the accuracy, reproducibility (inter-laboratory and inter- and intra-run), and robustness
of the Afirma BRAF classifier.
For a subset (n=213) of FNABs in the test set for which GEC and castPCR results were
previously reported12 and for which expert-derived histopathology was available, the histopathology
served as a clinical gold standard and was used to evaluate the clinical sensitivity and specificity of
both Afirma BRAF and castPCR to detect malignancy via detection of the BRAF V600E mutation
or gene expression signature.
In order to evaluate the underlying biological pathways affected by the V600E mutation,
over/under-representation analyses (ORA) were performed using GeneTrail15 with either Afirma
BRAF signature genes or all genes differentially expressed between BRAF-negative and –positive
samples (n=2,502, false discovery rate (FDR) < 0.1 by limma) as the ORA test sets. The ORA
reference set included all human genes (n=44,829) and annotation in the KEGG pathways
database16. Significance was evaluated via Fisher’s exact test with a corrected FDR threshold of p
< 0.05.
3. Results
3.1. Classifier comparison to castPCR
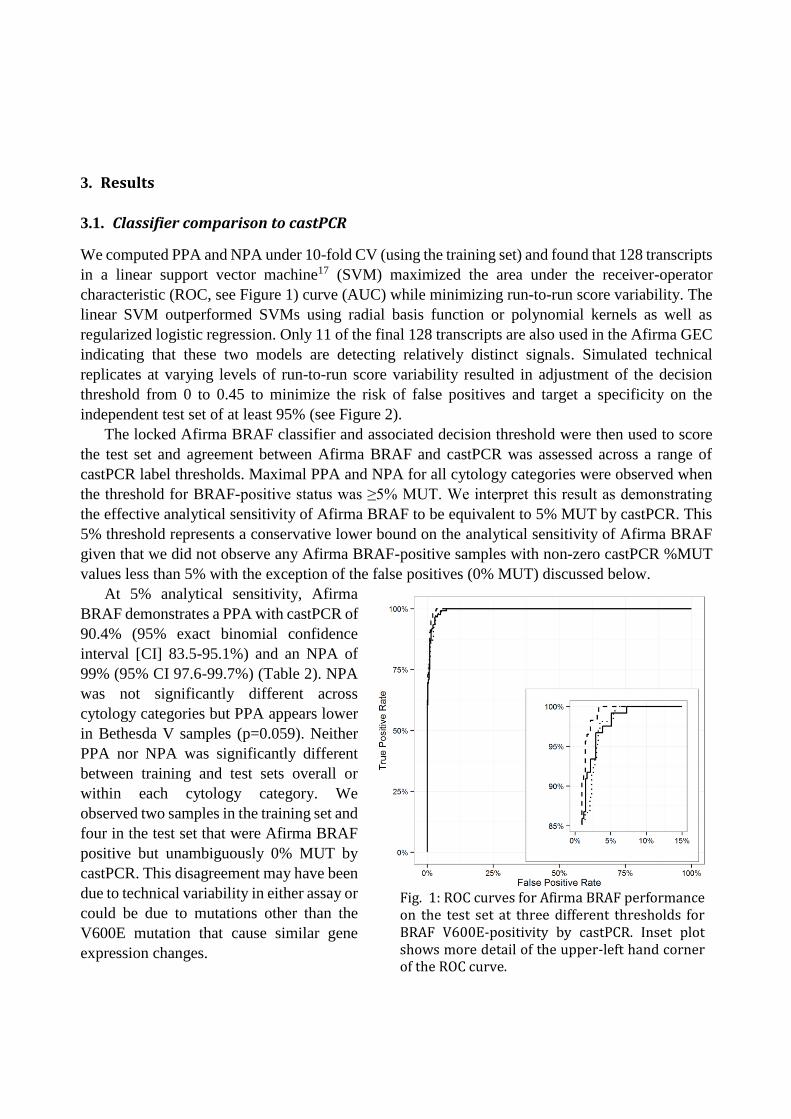
We computed PPA and NPA under 10-fold CV (using the training set) and found that 128 transcripts
in a linear support vector machine17 (SVM) maximized the area under the receiver-operator
characteristic (ROC, see Figure 1) curve (AUC) while minimizing run-to-run score variability. The
linear SVM outperformed SVMs using radial basis function or polynomial kernels as well as
regularized logistic regression. Only 11 of the final 128 transcripts are also used in the Afirma GEC
indicating that these two models are detecting relatively distinct signals. Simulated technical
replicates at varying levels of run-to-run score variability resulted in adjustment of the decision
threshold from 0 to 0.45 to minimize the risk of false positives and target a specificity on the
independent test set of at least 95% (see Figure 2).
The locked Afirma BRAF classifier and associated decision threshold were then used to score
the test set and agreement between Afirma BRAF and castPCR was assessed across a range of
castPCR label thresholds. Maximal PPA and NPA for all cytology categories were observed when
the threshold for BRAF-positive status was ≥5% MUT. We interpret this result as demonstrating
the effective analytical sensitivity of Afirma BRAF to be equivalent to 5% MUT by castPCR. This
5% threshold represents a conservative lower bound on the analytical sensitivity of Afirma BRAF
given that we did not observe any Afirma BRAF-positive samples with non-zero castPCR %MUT
values less than 5% with the exception of the false positives (0% MUT) discussed below.
At 5% analytical sensitivity, Afirma
BRAF demonstrates a PPA with castPCR of
90.4% (95% exact binomial confidence
interval [CI] 83.5-95.1%) and an NPA of
99% (95% CI 97.6-99.7%) (Table 2). NPA
was not significantly different across
cytology categories but PPA appears lower
in Bethesda V samples (p=0.059). Neither
PPA nor NPA was significantly different
between training and test sets overall or
within each cytology category. We
observed two samples in the training set and
four in the test set that were Afirma BRAF
positive but unambiguously 0% MUT by
castPCR. This disagreement may have been
due to technical variability in either assay or
could be due to mutations other than the
V600E mutation that cause similar gene
expression changes.
Fig. 1: ROC curves for Afirma BRAF performance on the test set at three different thresholds for BRAF V600E-positivity by castPCR. Inset plot shows more detail of the upper-left hand corner of the ROC curve.
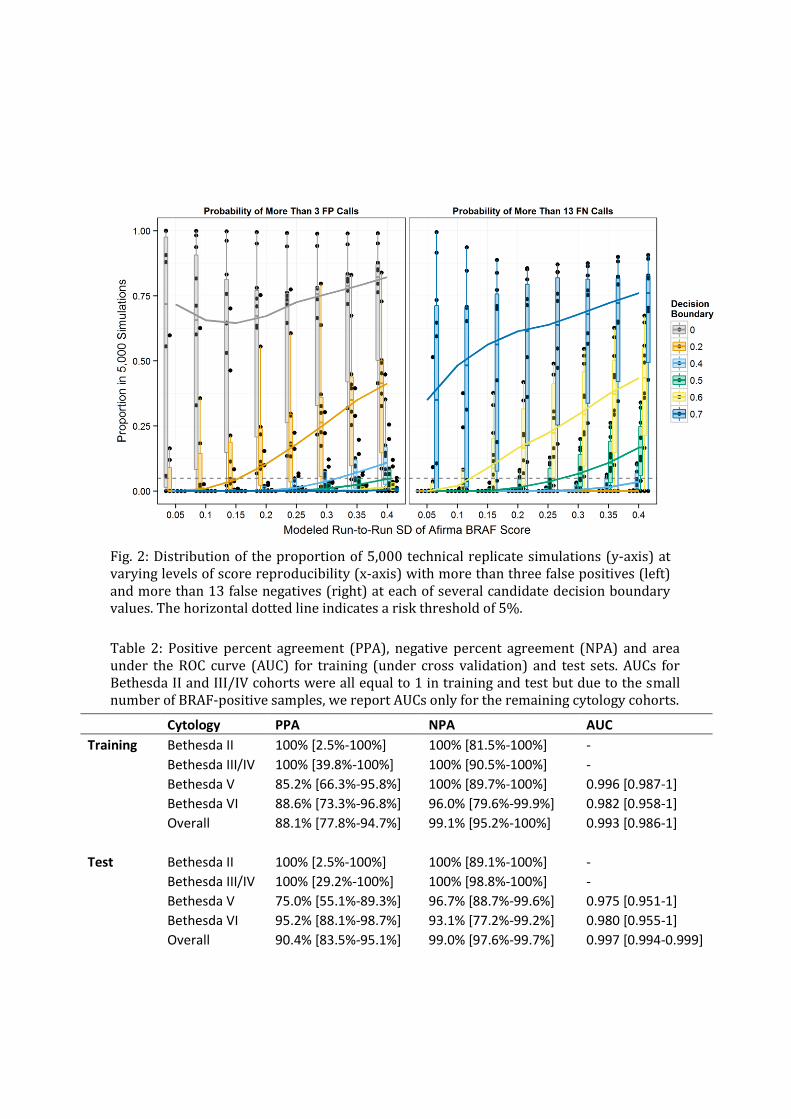
Table 2: Positive percent agreement (PPA), negative percent agreement (NPA) and area under the ROC curve (AUC) for training (under cross validation) and test sets. AUCs for Bethesda II and III/IV cohorts were all equal to 1 in training and test but due to the small number of BRAF-positive samples, we report AUCs only for the remaining cytology cohorts.
Cytology PPA NPA AUC
Training Bethesda II 100% [2.5%-100%] 100% [81.5%-100%] -
Bethesda III/IV 100% [39.8%-100%] 100% [90.5%-100%] -
Bethesda V 85.2% [66.3%-95.8%] 100% [89.7%-100%] 0.996 [0.987-1]
Bethesda VI 88.6% [73.3%-96.8%] 96.0% [79.6%-99.9%] 0.982 [0.958-1]
Overall 88.1% [77.8%-94.7%] 99.1% [95.2%-100%] 0.993 [0.986-1]
Test Bethesda II 100% [2.5%-100%] 100% [89.1%-100%] -
Bethesda III/IV 100% [29.2%-100%] 100% [98.8%-100%] -
Bethesda V 75.0% [55.1%-89.3%] 96.7% [88.7%-99.6%] 0.975 [0.951-1]
Bethesda VI 95.2% [88.1%-98.7%] 93.1% [77.2%-99.2%] 0.980 [0.955-1]
Overall 90.4% [83.5%-95.1%] 99.0% [97.6%-99.7%] 0.997 [0.994-0.999]
Fig. 2: Distribution of the proportion of 5,000 technical replicate simulations (y-axis) at varying levels of score reproducibility (x-axis) with more than three false positives (left) and more than 13 false negatives (right) at each of several candidate decision boundary values. The horizontal dotted line indicates a risk threshold of 5%.
We evaluated these samples via deep, targeted DNA sequencing of the BRAF gene along with
several other true BRAF-positive and BRAF-negative samples to serve as controls (data not shown).
We found one of these six discrepant samples to have a double mutation at nucleotide positions
1798 (T>A) and 1799 (T>A), leading, via codon degeneracy, to the same valine to glutamate amino
acid change found in the most common BRAF mutation. We found no mutations within BRAF in
the other five discrepant samples. All samples positive by Afirma BRAF with 0% MUT by castPCR
were called ‘suspicious’ by the Afirma GEC so the positive finding by Afirma BRAF is consistent
with an elevated risk for malignancy. In addition, two samples negative by Afirma BRAF and
castPCR were found to have identical mutations in NRAS, 182A>G (Q61R), previously reported in
melanoma18. An additional Afirma BRAF/castPCR-negative sample was found to have a mutation
in KRAS, 35G>T (G12V), previously reported in colorectal cancer19. That all three samples were
negative by Afirma BRAF suggests a lack of cross-reactivity with mutations in other genes upstream
of BRAF in the MAPK pathway.
3.2. Clinical performance
We assessed the diagnostic value of BRAF V600E status for evaluation of nodules with Bethesda
III-VI cytopathology using a subset of samples with associated gold-standard histopathology truth
as previously described2. Expert pathologists were blinded to the molecular results. Both Afirma
BRAF and castPCR called all histopathologically benign samples as BRAF V600E-negative
(specificity 100%, 95% CI 97.4%-100%), recapitulating the previously reported high specificity of
the BRAF V600E mutation12,20–25. Of the 73 histopathologically malignant samples, and at castPCR
thresholds ranging from 0 to 2.5%, both assays identified a total of 32 as BRAF-positive (sensitivity
43.8%, 95% CI 32.2%-55.9%, Table 3). Sensitivity was not significantly different between the two
assays across Bethesda cytology sub-classes. While both Afirma BRAF and castPCR identified 32
malignant samples as BRAF-positive, two samples called BRAF-positive by castPCR (with 4.2%
and 20.2% MUT detected) were Afirma BRAF-negative. Two additional samples were called
positive by Afirma BRAF but showed 0% MUT by castPCR. All four of these samples were
malignant by histopathology.
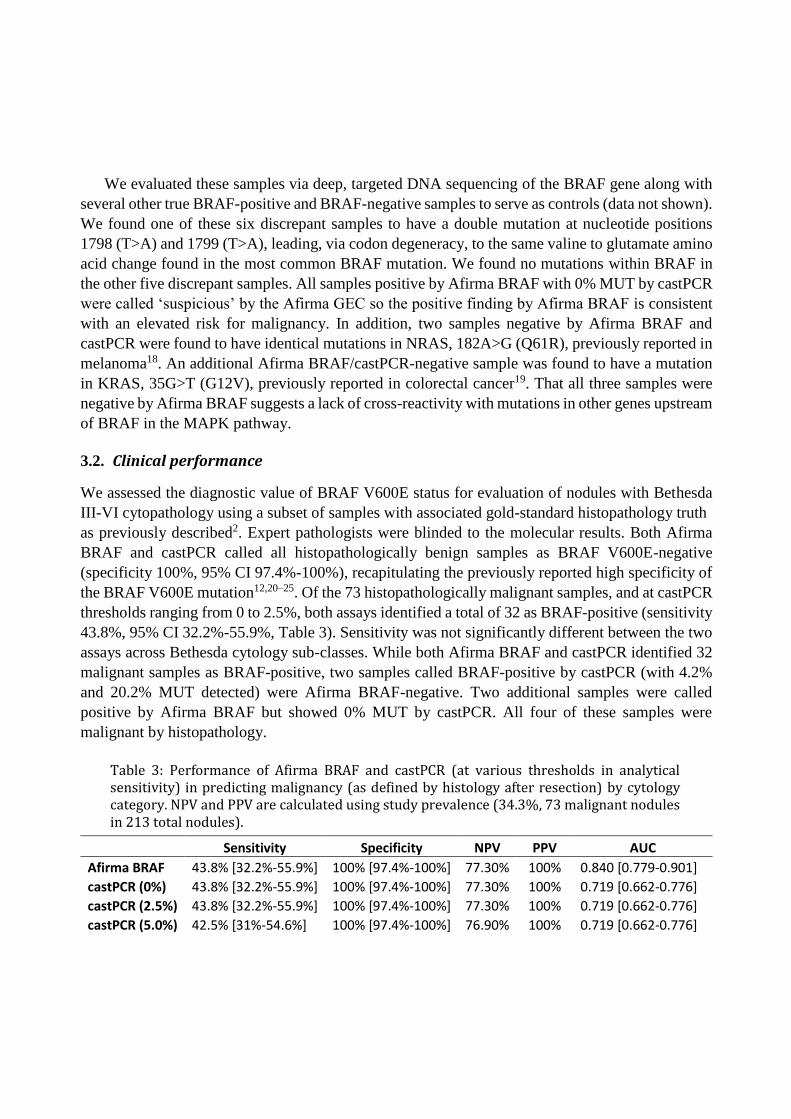
Table 3: Performance of Afirma BRAF and castPCR (at various thresholds in analytical sensitivity) in predicting malignancy (as defined by histology after resection) by cytology category. NPV and PPV are calculated using study prevalence (34.3%, 73 malignant nodules in 213 total nodules).
Sensitivity Specificity NPV PPV AUC
Afirma BRAF 43.8% [32.2%-55.9%] 100% [97.4%-100%] 77.30% 100% 0.840 [0.779-0.901]
castPCR (0%) 43.8% [32.2%-55.9%] 100% [97.4%-100%] 77.30% 100% 0.719 [0.662-0.776]
castPCR (2.5%) 43.8% [32.2%-55.9%] 100% [97.4%-100%] 77.30% 100% 0.719 [0.662-0.776]
castPCR (5.0%) 42.5% [31%-54.6%] 100% [97.4%-100%] 76.90% 100% 0.719 [0.662-0.776]
3.3. Reproducibility and analytical specificity
Intra- and inter-run reproducibility of the classifier was evaluated using 9 FNABs and three tissue
controls selected from among training samples with high (BRAF-positive) or low (BRAF-negative)
classifier scores and scores near the classifier decision boundary. Each FNAB and tissue was
processed from total RNA in triplicate in each of three different runs across days, operators and
reagent lots. The intra-assay standard deviation (SD) of Afirma BRAF scores is 0.171 (95% CI
0.146-0.204). Of the 106 Afirma BRAF calls produced (two arrays failed quality control
requirements), 106 resulted in concordant calls across all three runs (100% concordance). The inter-
assay SD of scores is 0.204 (95% CI 0.178-0.237) for scores measured on a six point scale.
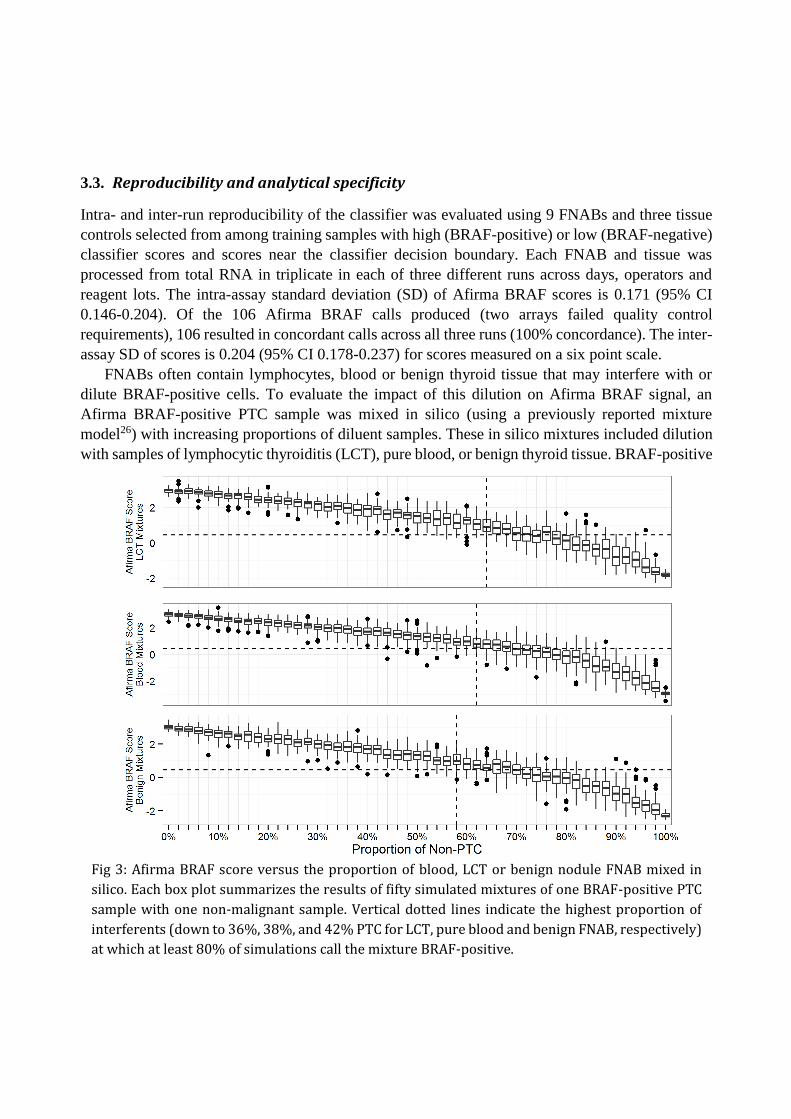
FNABs often contain lymphocytes, blood or benign thyroid tissue that may interfere with or
dilute BRAF-positive cells. To evaluate the impact of this dilution on Afirma BRAF signal, an
Afirma BRAF-positive PTC sample was mixed in silico (using a previously reported mixture
model26) with increasing proportions of diluent samples. These in silico mixtures included dilution
with samples of lymphocytic thyroiditis (LCT), pure blood, or benign thyroid tissue. BRAF-positive
Fig 3: Afirma BRAF score versus the proportion of blood, LCT or benign nodule FNAB mixed in
silico. Each box plot summarizes the results of fifty simulated mixtures of one BRAF-positive PTC
sample with one non-malignant sample. Vertical dotted lines indicate the highest proportion of
interferents (down to 36%, 38%, and 42% PTC for LCT, pure blood and benign FNAB, respectively)
at which at least 80% of simulations call the mixture BRAF-positive.
samples were called correctly at least 80% of the time in mixtures representing 36%, 38% and 42%
BRAF-positive PTC content, respectively. Afirma BRAF results for the pure blood, LCT and benign
thyroid tissue samples were all BRAF-negative and all BRAF-negative FNAB mixtures were
correctly called BRAF-negative regardless of mixture proportion, thus the presence of diluents
commonly encountered in thyroid FNABs does not result in Afirma BRAF false positives.
4. Discussion
The current work is the first to describe the analytical verification and clinical validation of an
RNA-based BRAF expression signature using a sample type relevant for clinical assessment of solid
tumors. We developed an mRNA-based classifier that detects the gene expression signature of the
BRAF V600E mutation in FNABs with high diagnostic accuracy. The classifier demonstrates both
high PPA and NPA in comparison with a sensitive DNA-based assay for the BRAF V600E
mutation. Clinical validation of Afirma BRAF using a cohort of samples with expert-derived post-
surgical truth found no false positives identified in a cohort of 140 histopathologically benign
nodules. The sensitivity of Afirma BRAF on this cohort was identical to that of castPCR, and both
assays have clinical sensitivity for thyroid malignancy (43.8%) limited by the prevalence of BRAF
V600E, as not all malignant nodules harbor this mutation.
Afirma BRAF had decreased PPA and NPA with castPCR for samples with less than 5% MUT
indicating that castPCR is a slightly more analytically sensitive assay. The clinical relevance of low
level BRAF mutation in thyroid nodules is unclear and the therapeutic benefit of early, aggressive
treatment of such lesions is not well-defined27,28. Given the equivalent performance of Afirma
BRAF and castPCR on the clinical validation set, analytical sensitivity at less than 5% MUT may
not translate into more accurate prediction of clinical outcome and may only contribute to rare false
positives.
Indeed, one challenge in using increasingly sensitive PCR-based assays to detect individual
mutations like BRAF V600E is the risk of an analytical true positive that has no clinical significance
at the time of resection29. Highly sensitive BRAF mutation assays (down to 0.1%) may find
mutations in 80% of papillary thyroid microcarcinomas30, even though these generally do not
behave like cancers and may regress spontaneously28.
We observed six samples that were Afirma BRAF positive but 0% MUT by castPCR. Since
Afirma BRAF detects gene expression patterns associated with V600E, we considered whether a
sample can exhibit a BRAF-positive-like profile caused by non-T1799A DNA alterations and
indeed observed a sample with a double mutation at positions 1798-1799 in the BRAF gene. Due to
the primer design of the castPCR assay, such double mutants would not be detected as BRAF
V600E-positive by castPCR even though the resulting protein still contains glutamate at position
600. This provides evidence that the Afirma BRAF classifier correctly identified the downstream
transcriptional effects of the mutated BRAF protein. Another advantage to using RNA-based
analysis over DNA-based testing is that Afirma BRAF had a significantly lower non-diagnostic rate

due to sample insufficiency compared to castPCR (7.6% vs. 24.5, p<0.001), thus allowing a
reportable result for more samples.
Additionally, it is important to consider that gene expression is a better approximation of the
biological functions of relevance to thyroid malignancy, and is downstream of possible epigenetic
regulatory mechanisms (e.g. gene silencing or allele-specific expression) that may prevent the
expected phenotypic expression of a DNA mutation. We also hypothesize that the Afirma BRAF
classifier may potentially recognize non-canonical cell signaling with an expression signature
similar to BRAF activation. Conversely, epistatic down-regulation of the V600E expression
signature by other mutations or signaling pathways remains a formal possibility. In such cases, the
Afirma BRAF classifier may register a result consistent with the absence of an active V600E
expression signal.
Previous studies have found that 1.3-8.3% of cytology benign nodules may harbor BRAF V600E
mutations (range 1.3%-8.3%)27,31,32. In the cohort reported here, we also found that 2 of 52 (3.8%,
95% CI 0.5%-13.2%) cytology benign FNABs which were malignant by histology were positive by
both castPCR and Afirma BRAF.
Analytical validity studies of Afirma BRAF show that the test is accurate and precise and are
reported in accordance with the STARD (STAndards for Reporting of Diagnostic Accuracy)
guidelines. These studies demonstrate that Afirma BRAF has low intra- and inter-run variability and
is highly robust to diluents potentially encountered in routine clinical testing. Taken as a whole,
these studies meet Evaluation of Genomic Applications in Practice and Prevention (EGAPP) level
1 for analytical verification (inter-laboratory comparison) and EGAPP level 1 for clinical validity
(well-designed longitudinal cohort studies)33. To our knowledge, this is the first mRNA expression-
based multivariate classifier to meet these STARD and EGAPP levels of evidence for accurate
identification of a DNA mutation.
Pathway analysis of Afirma BRAF classifier genes reveals enrichment of tight junction, cell
adhesion, and ECM-receptor molecules. These molecules are not only involved in apico-basal
architectural changes34, but are also increasingly implicated as mediators in cancer signaling35–37. A
broader analysis using all differentially expressed genes on the array identifies pathways involved
in MAPK, ErbB, Wnt, and p53 cancer signaling as overrepresented in BRAF V600E nodules.
Preoperative treatment decisions that may be affected by the presence of BRAF V600E may
include extent of thyroidectomy (hemi- versus total), performance of central neck dissection, and
administration of radioactive iodine. The ability of Afirma BRAF to accurately detect V600E status
may assist physicians in making these treatment decisions and potentially improve patient care.
Acknowledgments
The authors would like to thank Sharlene Velichko, Julie Mathison and Matthew Muller for
technical assistance, Lyssa Friedman for protocol, accrual and regulatory assistance, and Emma
Caoili and Tami Wong for sample accessioning.

References
1. Aschebrook-Kilfoy, B., Ward, M. H., Sabra, M. M. & Devesa, S. S. Thyroid. 21, 125
(2011).
2. Alexander, E. K. et al. NEJM. 705 (2012).
3. Xing, M., Haugen, B. R. & Schlumberger, M. Lancet. 381, 1058–69 (2013).
4. National Comprehensive Cancer Network Thyroid Carcinoma Guidelines. (2013).
5. Reuter, C. W., Catling, A. D., Jelinek, T. & Weber, M. J. J. Biol. Chem. 270, 7644–55
(1995).
6. Weber, C. K., Slupsky, J. R., Kalmes, H. A. & Rapp, U. R. Cancer Res. 61, 3595–8 (2001).
7. Barollo, S. et al. Thyroid. (2014).
8. Kote-Jarai, Z. et al. Clin. Cancer Res. 12, 3896–901 (2006).
9. Van Vliet, M. H. et al. Genet. Test. Mol. Biomarkers. 17, 395–400 (2013).
10. Giordano, T. J. et al. Oncogene. 24, 6646–56 (2005).
11. Cibas, E. S. & Ali, S. Z. Am. J. Clin. Pathol. 132, 658–65 (2009).
12. Kloos, R. T. et al. J. Clin. Endocrinol. Metab. 98, E761–8 (2013).
13. Smythe, G. (eds. Gentleman, R. et al) (Springer, 2005).
14. FDA CDRH. Statistical Guidance on Reporting Results from Studies Evaluating Diagnostic
Tests. 1–39 (2007).
15. Backes, C. et al. Nucleic Acids Res. 35, W186–92 (2007).
16. Kanehisa, M. et al. Nucleic Acids Res. 38, D355–60 (2010).
17. Cortes, C. & Vapnik, V. Mach. Learn. 20, 273–297 (1995).
18. Curtin, J. A. et al. N. Engl. J. Med. 353, 2135–47 (2005).
19. Faulkner, N. et al. ASCO Mol. Markers. (2010).
20. Zeiger, M. A. & Schneider, E. B. Ann. Surg. Oncol. 20, 3–4 (2013).
21. Howell, G. M. et al. Ann. Surg. Oncol. 20, 47–52 (2013).
22. Joo, J.-Y. et al. J. Clin. Endocrinol. Metab. 97, 3996–4003 (2012).
23. Colanta, A. et al. Acta Cytol. 55, 563–9 (2011).
24. Cañadas-Garre, M. et al. Ann. Surg. 255, 986–92 (2012).
25. Xing, M. et al. JAMA. 309, 1493–501 (2013).
26. Chudova, D. et al. J. Clin. Endocrinol. Metab. 95, 5296–304 (2010).
27. Rossi, M. et al. J. Clin. Endocrinol. Metab. 97, 2354–61 (2012).
28. Ross, D. S. & Tuttle, R. M. Thyroid. 24, 3–6 (2014).
29. Dilorenzo, M. M. et al. Endocr. Pract. 20, e8–e10
30. Lee, S.-T. et al. J. Clin. Endocrinol. Metab. 97, 2299–306 (2012).
31. Nikiforov, Y. E. et al. J. Clin. Endocrinol. Metab. 94, 2092–8 (2009).
32. Cantara, S. et al. J. Clin. Endocrinol. Metab. 95, 1365–9 (2010).
33. Teutsch, S. M. et al. Genet. Med. 11, 3–14 (2009).
34. Gardiol, D. et al. Int. J. Cancer. 119, 1285–90 (2006).
35. Rangel, L. B. A. et al. Clin. Cancer Res. 9, 2567–75 (2003).
36. Nagano, M. et al. Int. J. Cell Biol. 2012, 310616 (2012).
37. Lu, P., Weaver, V. M. & Werb, Z. J. Cell Biol. 196, 395–406 (2012).