macatawa watershed management plan, chapters 3
TRANSCRIPT

Macatawa Watershed Management Plan (2012)
54
3.0 WATER QUALITY CONDITIONS
In this SECTION you will understand:
How water quality is assessed
The extent of impaired waterways in the watershed
The historic, volunteer and current monitoring efforts underway
the priority pollutants, sources and causes affecting lake Macatawa water quality

Macatawa Watershed Management Plan (2012)
55
3.1 ASSESSING WATER QUALITY
The Macatawa Watershed has undergone a myriad of studies, assessments and monitoring efforts over
the last 15 years in an effort to assess and track water quality over time. Ultimately, the data collected
by the MDEQ determines the official water quality status of the Macatawa Watershed. During the
development of this management plan several more in-depth analyses were completed and are
described below. In addition, the MACC involved a tremendous variety of stakeholders in the planning
process. Many of these stakeholders contributed their invaluable personal watershed knowledge. All of
these resources were pooled in an effort to develop the most complete and comprehensive
management recommendations possible.
3.2 EARLY MONITORING AND RESEARCH
Researchers from Hope College, state and national environmental agencies, local public and private
groups and individuals have studied the quality of water in Lake Macatawa, the Macatawa River, and
their tributaries for over a century. Research on biological communities, sediment quality, waste
discharges, nutrients, and toxic measurements in the Macatawa Watershed have long signaled the
presence of water quality impairments.
The majority of studies performed since the mid-1960’s
indicate that Lake Macatawa and its tributaries have
struggled for decades with high levels of sediment and
nutrients, indicating highly trophic (hypereutrophic)
conditions (Van Fassen et al 2008).
As early as 1965, the Michigan Department of Conservation
made various reports of fish kills. Each report suggests that
the events were precipitated by low oxygen levels, caused by
various waste discharges to the tributaries. The low oxygen levels
again suggest hypereutrophic conditions. In 1971, the Michigan
Water Resources Commission conducted a biological survey of
the Black River and Lake Macatawa (Jackson 1971). Twelve sites
were monitored and the results indicated poor water quality due
to the number and types of aquatic life observed.
Don Williams, Ph.D., Hope College, submitted a report of water quality observations taken from 1966-
1971. Williams worked with the Hope College Institute for Environmental Quality and volunteers from
the Macatawa Bay Yacht Club to collect weekly lake water samples from June through September. One
of the group’s conclusions was that erosion and overabundance of organic matter was a problem,
evidenced by high coliform counts (Williams 1975).
Macatawa Watershed Management Plan (2012)
56
In 1996, the Clean Water Committee of the Lake Macatawa Shoreline Association assembled a
document containing communications and background information on water quality studies
performed on Lake Macatawa. Much of the information contained in that document points to
excessive sediment and nutrients as sources of the Lake’s historical problems (Lake Macatawa
Shoreline Association 1996).
In 1995, the MDEQ performed a study of the waters in the East Basin of Lake Macatawa. The
Department concluded that the dissolved oxygen levels in the lake were unsatisfactory, and that a
probable cause of the low levels was nutrient overenrichment. This study by the MDEQ contained the
findings that led to the development of the current Macatawa Watershed Project (Mustata 1996).
A consultant for The Lake Macatawa Shoreline Association, Water Quality Investigators, completed a
study of the Lake Macatawa Watershed in 1999 (Fusilier and Fusilier 1999). The report includes
historical information, water quality and sediment analyses, discussion and recommendations for
remedial action in the Macatawa Watershed. A Water Quality Index was used to rank the overall water
quality in Lake Macatawa. The Index was comprised of scores for temperature, dissolved oxygen,
chlorophyll-a, secchi disk depth, nitrate, alkalinity, pH, specific conductivity, and total phosphorus.
Scores for the index follow an academic letter-grading scheme, A, B, C, D, and E, from highest quality to
lowest. Lake Macatawa was tested over sixty times from 1993 to 1997. Scores for all dates, with the
exception of five, were E (poorest water quality). The Water Quality Investigators found an average of
101 micrograms per liter phosphorus concentration over their five year sampling period.
Macatawa Watershed Management Plan (2012)
57
3.3 WATER QUALITY STANDARDS, DESIGNATED USES AND P TMDL
The development of a Phosphorus Total Maximum Daily Load (TMDL) for the Macatawa Watershed is a
direct result of the water quality impairments described above and violations of State Water Quality
Standards, as described below.
The MDEQ routinely monitors waters of the State to determine compliance with State of Michigan
water quality standards (WQS) of Part 4 (promulgated pursuant to Part 31 of the Natural Resources
Environmental Protection Act, 1994 PA451, as amended known as NREPA).
Rule 323.1100 covers Designated Uses and states that at a minimum all surface waters of the state are
designated for, and shall be protected for, all of the following uses:
a) Agriculture b) Navigation c) Industrial water supply d) Warmwater fishery e) Other indigenous aquatic wildlife f) Partial body contact recreation g) Fish consumption
In addition, all surface waters of the state are designated for and shall be protected for total body
recreation from May 1 to October 31. Rule 323.1050 states that the waters of the state shall not have
any of the following unnatural physical properties in quantities which are or may become injurious to
any of the designated uses listed above: including turbidity, color, oil films, floating solids, foams,
settable solids, suspended solids and deposits. Complete definitions and specific water quality criteria
for designated uses are included in Appendix E. According to the MDEQ’s 2010 Integrated Report, the
Macatawa Watershed has approximately 329 miles of waterways that are impaired and not meeting
several designated uses (Table 11, Appendix F).

Macatawa Watershed Management Plan (2012)
58
Table 11. Summary of attainment status of State Designated Uses for the Macatawa Watershed.
According to the MDEQ, the waters of the Macatawa Watershed do not meet several water quality
standards. Turbidity, color, settable solids, suspended solids, and deposits were all identified as
properties which contributed to Lake Macatawa's non-attainment of designated uses (d) and (e) above.
This formal designation of impaired water quality was first made in 1998. Almost every mile of
waterway in the Macatawa Watershed is included on the State’s 303(d) list for non attaining water
quality due to nonpoint source pollution (Figure 26). While only the Dunton Park Beach area (north
Subbasin Name
Subbasin HUC Code
# impaired stream miles from
Designated Uses
War
mw
ater
Fis
her
y
Oth
er A
qu
atic
Lif
e/W
ildlif
e
Par
tial
Bo
dy
Co
nta
ct
Tota
l Bo
dy
Co
nta
ct
Fish
Co
nsu
mp
tio
n
Agr
icu
ltu
ral U
se
Ind
ust
rial
Wat
er S
up
ply
Nav
igat
ion
Upper Macatawa
40500020401 50.2
Not supporting
(excessive sediment
noted)
Not supporting
(excessive sediment
and phosphorus
noted)
Not assessed
Not assessed
Not assessed
Fully Supporting
Fully Supporting
Fully Supporting
South Branch Macatawa
40500020402 45.9
Middle Macatawa
40500020403 56.8
North Branch
40500020404 44.4
Noordeloos Creek
40500020405 52.1
Lower Macatawa
40500020406 32.1
Pine Creek 40500020407 26.2
Kelly Lake Drain
40500020408-03
20.7
Lake Macatawa
40500020408-01
1799 (acres)
Not Assessed
Not Assessed
Not Assessed
Not Assessed
Not Supporting (PCBs and mercury)
Dunton Park Beach
40500020408-02
0.2 Not Supporting (E.coli bacteria)
Not Supporting (E.coli bacteria)
Not assessed
Huizenga Park Pond
40500020405-02
0.2 Not Supporting (E.coli bacteria)
Not Supporting (E.coli bacteria)
Not assessed
Holland State Park Beach
40500020408-03
NA Fully Supporting
Fully Supporting
Not assessed
Total 328.8

Macatawa Watershed Management Plan (2012)
59
shore of Lake Macatawa) is failing to meet requirements for total and partial body contact due to
elevated levels of E.coli bacteria. The fish consumption designated use is only impaired for Lake
Macatawa (carp and walleye), as it was not assessed throughout the entire watershed. Note that the
only waterway not included on this list is Winstrom Creek (subwatershed #48) which is a direct
tributary to Lake Macatawa (northwest end of the lake).
Figure 26. Impaired waterways within the Macatawa Watershed (MDEQ 2010). See Figure 5 to reference subbasin names.

Macatawa Watershed Management Plan (2012)
60
To review the complete set of listings see Appendix F for an
excerpt from MDEQ’s 2010 Integrated Report. Please note that
MDEQ recently released a draft 2012 Integrated Report that has
not yet been finalized. From preliminary review, it does not
appear that there have been any changes to the listing of impaired
waterbodies in the Macatawa Watershed.
The MDEQ does not conduct any specific monitoring to assess the
agricultural, industrial water supply and navigation designated
uses and makes the general assumption that they are being met
statewide (unless data can be presented to the contrary). In the
MACC’s best professional judgment, we feel that the navigation
designated use may be “threatened”. In 2010, members of the
Watershed Planning Committee submitted their comments about
the issue (left).
To maintain navigation on Lake Macatawa and maintain a
navigable connection to Lake Michigan, the Army Corps of
Engineers (ACOE) must conduct frequent dredging. Without
critical dredging projects, Lake Macatawa will remain inaccessible
to large ships and recreational watercraft. Although the MDEQ
does not recognize the navigation designated use as being
threatened, the MACC feels it is a valid community concern.
Therefore, we plan to address navigation and recreation issues as
a “desired use”. For more information, see Chapter 4, Watershed
Action Plan.
“Excessive siltation requires
annual dredging of the outer
channel and way too frequent
dredging of the inner channel.
While the outer channel is
certainly driven more by Lake
Michigan currents, there is a
contribution of many tons of
sediment per day that is due
to fluvial deposits there. The
inner channel is entirely due
to excess sediment from the
Macatawa River, and causes
the Army Core of Engineers to
visit us regularly to keep
commercial shipping channels
open. I would argue that this
is not meeting a designated
use for navigation.”
“There are several segments
of the Macatawa, Noordeloos
Creek, and Pine Creek that
could be navigable but are not
because of sedimentation.”
“Canoes and kayaks, no
problem. Large vessels that
bring in coal and aggregate:
the low water levels and silt
accumulation combine to
threaten safe passage. It is
crucial that the USACE
continue to fund inner and
outer Holland Harbor
maintenance so that
commercial shipping activity
thrives.”
“Lots of snags and places
where canoeing is not viable”
Comments from members of the
Watershed Planning Committee
regarding navigation
•Public Water Supply
•Coldwater Fishery Not Applicable
•Agricultural Use
•Industrial Water Supply
•Navigation
Meeting Standards
•Warmwater Fishery
•Other Aquatic life/Wildlife
•Total Body Contact
•Partial Body Contact
•Fish Consumption
Impaired
Macatawa Watershed Management Plan (2012)
61
The monitoring data and observations indicate that the watershed is being impaired by excessive levels
of sediment and nutrients (especially phosphorus) which cause extremely low dissolved oxygen levels,
turbidity and nuisance algae blooms. Small portions of the watershed are impaired by elevated levels
of E.coli bacteria. The MDEQ continues to monitor the watershed, and as recently as 2010, biological
communities and water quality parameters indicated poor conditions (Holden 2012).
In 1998, the MDEQ developed a Total Maximum Daily Load (TMDL) for phosphorus for Lake Macatawa,
which was approved by EPA in 2000 (Walterhouse 1999). The MDEQ conducted monitoring to assess
the total annual phosphorus load and estimated it to 138,000 pounds annually. The MDEQ also
reported that the total amount of phosphorus contributed to the Macatawa Watershed by nonpoint
sources was 91% of the total phosphorus load (approximately 126,000 lbs; Walterhouse 1998). They
set an allowable phosphorus loading goal of 55,200 lbs annually with a phosphorus concentration in
Lake Macatawa of 50 parts per billion (ppb). Major point source dischargers of phosphorus were
allowed to use 20,000 lbs of that allotment. Therefore the nonpoint source portion of the 55,000 lbs of
phosphorus is roughly 35,000 lbs annually, which indicates that the annual nonpoint source
phosphorus load to Lake Macatawa must be reduced by 70% to meet water quality standards.
According to MDEQ’s 2010 Integrated Report, there are two main areas in the watershed that are
suffering from elevated levels of E.coli bacteria and are scheduled to have a TMDL developed in 2017.
Those areas are Dunton Park Beach on the north shore of Lake Macatawa and Huizenga Park Pond
which is a separate inland waterbody located within the City of Zeeland.

Macatawa Watershed Management Plan (2012)
62
3.4 MORE WATER QUALITY INFORMATION
BIOSURVEYS AND WATER CHEMISTRY
One of the ways that the MDEQ assesses whether the State’s waterbodies are meeting water quality
standards is by performing regular monitoring. The MDEQ performs regular monitoring in the
Macatawa Watershed via two methods including TMDL-related water quality monitoring every other
year and biological monitoring every 5 years.
The MDEQ is committed to monitoring the Macatawa
Watershed frequently to assess progress in relation to
achieving the Phosphorus TMDL. Monitoring began in the late
1990s and continued annually until 2006 (Walterhouse 2007).
Since 2006, the monitoring has been conducted every other
year and was most recently conducted in 2008 and 2010
(Walterhouse 2009; Walterhouse 2011, Appendix G). The
phosphorus concentration in Lake Macatawa has ranged from
127 µg/l in 1997, to 470 µg/l in 2000 and is strongly
dependent on spring precipitation totals.
Figure 27. Historical average spring phosphorus levels in Lake Macatawa (MDEQ data, Walterhouse 2010).
The historical average spring phosphorus levels in Lake Macatawa vary widely (Figure 27). In 2010, the
average spring phosphorus level was 227 parts per billion (ppb) which was lower than levels in 2008
but higher than levels in 2005 and 2006. The phosphorus levels in 2010 were 4 times greater than the
TMDL goal of 50 ppb.
0
50
100
150
200
250
300
350
400
450
500
Ph
osp
ho
rus
in p
pb
Sampling Year
Average Spring Phosphorus Levels in Lake Macatawa
P
TMDL
Macatawa Watershed Management Plan (2012)
63
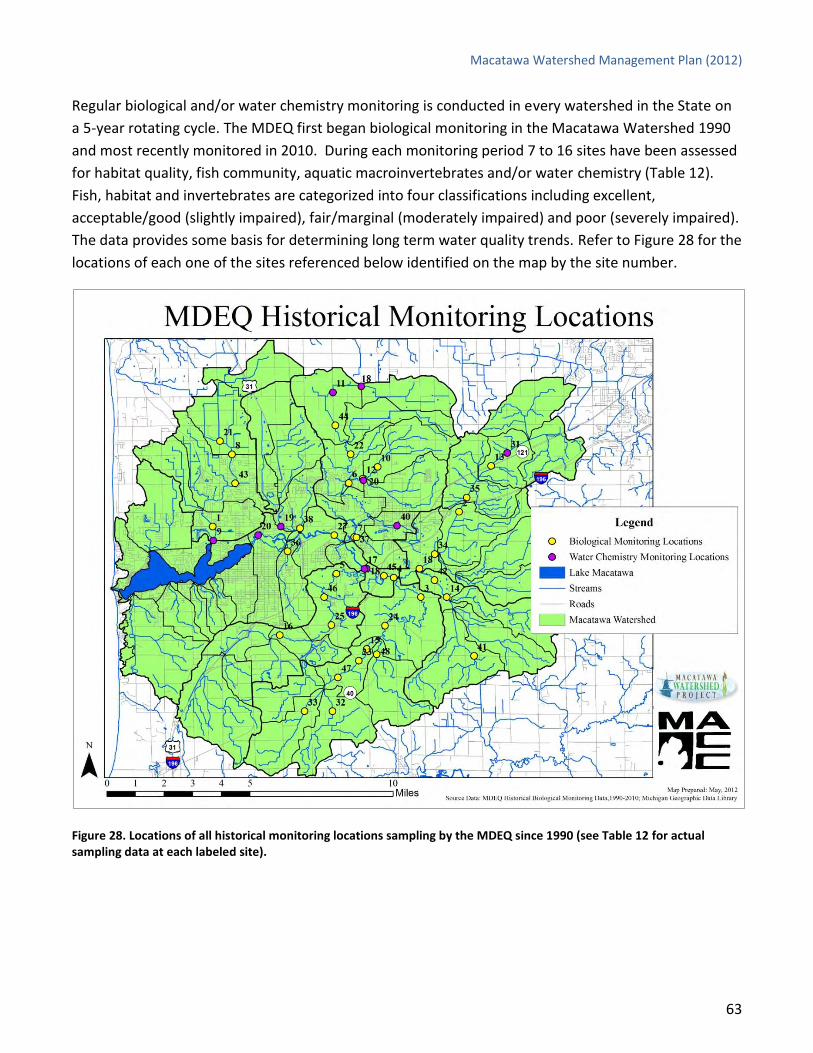
Regular biological and/or water chemistry monitoring is conducted in every watershed in the State on
a 5-year rotating cycle. The MDEQ first began biological monitoring in the Macatawa Watershed 1990
and most recently monitored in 2010. During each monitoring period 7 to 16 sites have been assessed
for habitat quality, fish community, aquatic macroinvertebrates and/or water chemistry (Table 12).
Fish, habitat and invertebrates are categorized into four classifications including excellent,
acceptable/good (slightly impaired), fair/marginal (moderately impaired) and poor (severely impaired).
The data provides some basis for determining long term water quality trends. Refer to Figure 28 for the
locations of each one of the sites referenced below identified on the map by the site number.
Figure 28. Locations of all historical monitoring locations sampling by the MDEQ since 1990 (see Table 12 for actual sampling data at each labeled site).

Macatawa Watershed Management Plan (2012)
64
Table 12. History of biological surveys conducted by MDEQ in the Macatawa Watershed (TP=total phosphorus).
Site No.
Locations Subbasin Sampled For: Prev site?
Fish Inverts Habitat Water Temp
Total Phos
(mg/l) Trends
1990 (Wuycheck 1995) 1
Pine Creek at Lakewood Blvd
Pine Creek habitat, fish, bugs, temp
Good Fair Poor 59°F
2 Macatawa River at Byron Road
Upper Macatawa
habitat, fish, bugs, temp
Fair Fair Poor 68°F
3 South Branch of the Macatawa at Ottogan Road
South Branch
habitat, fish, bugs, temp
Good Fair Poor 72°F
4 Macatawa River at 96th Lower Macatawa
habitat, fish, bugs, temp
Fair Fair Poor 72°F
5 North Branch of the Macatawa River at 112th Ave
North Branch
habitat, fish, bugs, temp
Good Fair Fair 76°F
6 Noordeloos Creek at Riley Street
Noordeloos habitat, fish, bugs, temp
Poor Fair Poor 66°F
7 Noordeloos Creek at 106th Avenue
Noordeloos habitat, fish, bugs, temp
Fair Fair Poor 73°F
Aug-Oct 1995 (Walterhouse 1997) 8 Pine Creek at Quincy Street Pine Creek habitat, bugs,
water chemistry No Poor Fair 67°F 0.136
9 Pine Creek at Ottawa Beach Road
Pine Creek water chemistry No 0.105
10 Brower Dr at 100th ave (Noordeloos Creek subshed)
Noordeloos habitat, fish, bugs, water chemistry
No Accept Fair 72°F 0.139
11 Noordeloos Creek at 112th Noordeloos water chemistry No 1.2
12 Noordeloos Creek at 104th Noordeloos water chemistry No 0.095
13 Macatawa River at M-21 (Chicago Drive)
Upper Macatawa
habitat, bugs, water chemistry
No Accept Poor 70°F 0.154
14 Drenthe Creek/Drain at Ottogan Rd
Upper Macatawa
habitat, bugs, water chemistry
No Accept Fair 73°F 0.089
15 South Branch of Macatawa at 50th Street
South Branch
habitat, bugs, water chemistry
No Accept Fair 75°F 0.35
16 North Branch of Macatawa River at 56th Ave
North Branch
habitat, bugs, water chemistry
No Poor Fair 72°F 0.074
17 North Branch Macatawa River at Adams
North Branch
water chemistry No 0.119
18 Macatawa River at Adams Lower Macatawa
water chemistry No 0.082
19 North Holland Drain at Lakewood Blvd
Lower Macatawa
water chemistry No 0.105
20 Macatawa River at River Drive
Lower Macatawa
water chemistry No 0.22
August-September 2000 (Rockafellow 2002) 21 Pine Creek at 144th Avenue Pine Creek habitat, bugs,
water chemistry No Accept Fair 68°F 0.05
1 Pine Creek at Lakewood Blvd
Pine Creek habitat, bugs, water chemistry
Yes Accept Fair 70°F 0.04 Scored better than 1990
22 Bosch and Hulst at Quincy (Noordeloos Subshed)
Noordeloos habitat, bugs, water chemistry
No Poor Fair 74°F 0.28
12 Noordeloos at 104th Noordeloos habitat, bugs, water chemistry
Yes Accept Fair 68°F 0.16 More phosphorus than 1995
2 Macatawa River at Byron Road
Upper Macatawa
habitat, bugs, water chemistry
Yes Poor Fair 62°F 0.138 Insects worse, better habitat than 1990
23 South Branch Macatawa River at Russcher Road
South Branch
habitat, bugs, water chemistry
No Accept Good 75°F n/a

Macatawa Watershed Management Plan (2012)
65
Site No.
Locations Subbasin Sampled For: Prev site?
Fish Inverts Habitat Water Temp
Total Phos
(mg/l) Trends
24 South Branch Macatawa River at 146th
South Branch
habitat, bugs, water chemistry
No Poor Fair 76°F 0.18
4 Macatawa River at 96th Lower Macatawa
habitat, bugs, water chemistry
Yes Accept Fair 62°F 0.084 Scored better than 1990
25 North Branch Macatawa River at 146th
North Branch
habitat, bugs, water chemistry
No Accept Fair 72°F 0.08
26 North Branch Macatawa River at 52nd
North Branch
habitat, bugs, water chemistry
No Accept Fair 72°F 0.08
27 Macatawa River @ 112th (Paw Paw)
Lower Macatawa
habitat, bugs, water chemistry
No Accept Fair 70°F 0.1
28 Bosch & Hulst @ 104th Noordeloos water chemistry No 0.138
10 Bosch & Hulst @ 100th Noordeloos water chemistry No 0.5
30 Bosch & Hulst Trib @104th Noordeloos water chemistry No 0.83
31 Macatawa River at 64th Upper Macatawa?
water chemistry No 0.146
32 Kleinheksel Drain at 140th (trib to South Branch)
South Branch
water chemistry No 0.16
33 Jaarda Drain @140th (trib to South Branch)
South Branch
water chemistry No 0.07
16 North Branch Macatawa at 56th
North Branch
water chemistry Yes 0.11 Higher phosphorus than 1995
June 2005 (Faivor and Hanshue2007) 4 Macatawa River at 96th Lower
Macatawa habitat, bugs, fish Yes Accept Accept Marginal 70°F Scored better than
1990
34 Macatawa River at 84th Upper Macatawa
habitat, bugs, fish No Poor Poor Poor 70°F
35 Macatawa River at Riley Upper Macatawa
habitat, fish No Poor Marginal
1 Pine Creek at Lakewood Blvd
Pine Creek habitat, bugs, fish Yes Poor Accept Good 68°F Fish getting worse, habitat getting better, insects about same
36 Maplewood Drain at 6th Street
Lower Macatawa
habitat, bugs, fish No Accept Accept Marginal 66°F
3 South Branch Macatawa River at 108th (Ottogan)
South Branch
habitat, bugs, fish Yes Poor Accept Marginal 66°F Fish getting worse , Habitat getting better
37 Noordeloos Creek at 107th Noordeloos habitat, bugs, fish No Poor Accept Good 73°F
2 Macatawa River at Byron Upper Macatawa
habitat, bugs Yes Poor Marginal 69°F About the same as 2000
12 Noordeloos Creek at 104th Noordeloos habitat, bugs, water chemistry
Yes Accept Marginal 70°F 0.15 Insects habitat about same, less phosphorus than 2000
38 Railroad Tributary Lower Macatawa
habitat, fish, bugs No Accept Accept Good 70°F
39 North Branch at 112th North Branch
bugs, habitat No Accept Good 64°F
40 Zeeland Wastewater Treatment Plant
Noordeloos water chemistry No 0.36
August 2010 (Holden 2012) 35 Macatawa River at Riley St Upper
Macatawa habitat, bugs Yes Accept Marginal 68°F About the same as
2005
41 Peters Creek at 144th Peters Creek
habitat, bugs No Accept Marginal 64°F Better than 2005
42 Peters Creek at 84th Peters Creek
habitat, bugs No Accept Marginal 68°F
34 Macatawa River at 84th Upper Macatawa
habitat, bugs Yes Accept Marginal 74°F Habitat and insects better
18 Macatawa River at Adams Lower Macatawa
habitat, bugs Yes Accept Marginal 70°F Not comparable data
Macatawa Watershed Management Plan (2012)
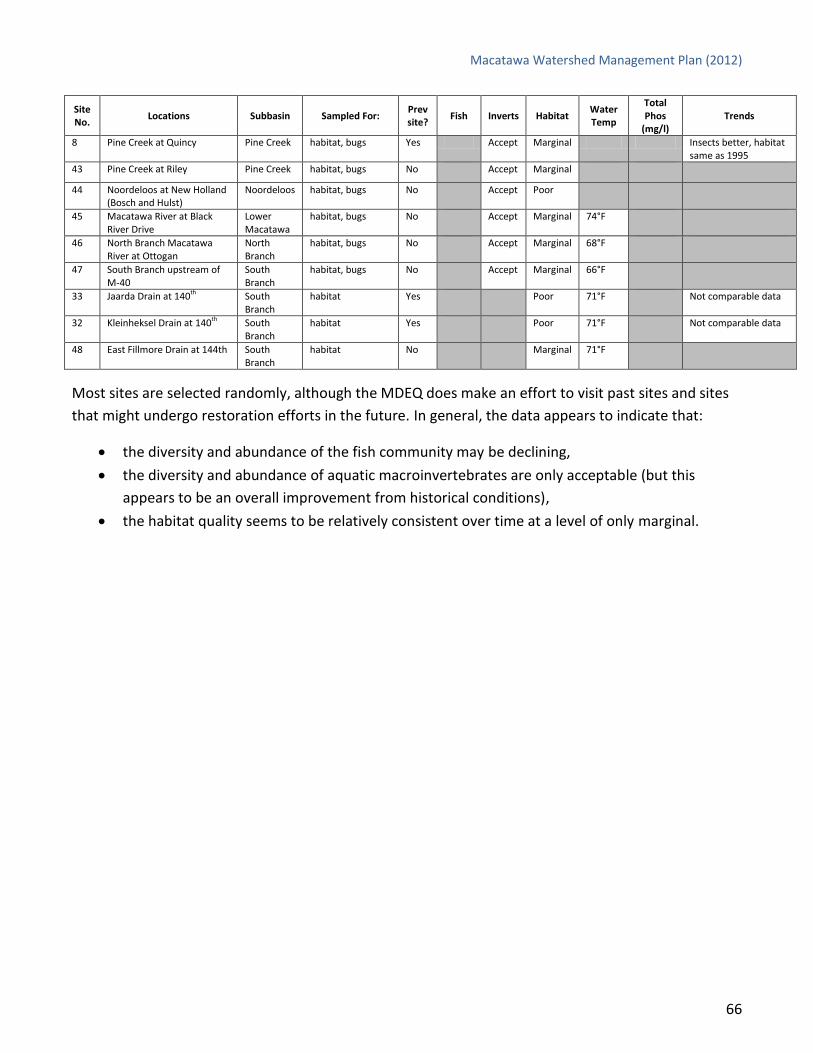
66
Site No.
Locations Subbasin Sampled For: Prev site?
Fish Inverts Habitat Water Temp
Total Phos
(mg/l) Trends
8 Pine Creek at Quincy Pine Creek habitat, bugs Yes Accept Marginal Insects better, habitat same as 1995
43 Pine Creek at Riley Pine Creek habitat, bugs No Accept Marginal
44 Noordeloos at New Holland (Bosch and Hulst)
Noordeloos habitat, bugs No Accept Poor
45 Macatawa River at Black River Drive
Lower Macatawa
habitat, bugs No Accept Marginal 74°F
46 North Branch Macatawa River at Ottogan
North Branch
habitat, bugs No Accept Marginal 68°F
47 South Branch upstream of M-40
South Branch
habitat, bugs No Accept Marginal 66°F
33 Jaarda Drain at 140th South Branch
habitat Yes Poor 71°F Not comparable data
32 Kleinheksel Drain at 140th South Branch
habitat Yes Poor 71°F Not comparable data
48 East Fillmore Drain at 144th South Branch
habitat No Marginal 71°F
Most sites are selected randomly, although the MDEQ does make an effort to visit past sites and sites
that might undergo restoration efforts in the future. In general, the data appears to indicate that:
the diversity and abundance of the fish community may be declining,
the diversity and abundance of aquatic macroinvertebrates are only acceptable (but this
appears to be an overall improvement from historical conditions),
the habitat quality seems to be relatively consistent over time at a level of only marginal.

Macatawa Watershed Management Plan (2012)
67
ONGOING VOLUNTEER MONITORING
Since the inception of the MWP in the late 1990s, volunteer
monitoring efforts have played an important role in long-term
data collection efforts. In 2002, the Secchi Disk Group was
established and includes community members who collect weekly
water quality data (seven months a year) including Secchi depth (a
measure of water clarity, pictured at bottom right), temperature
and water levels from several locations on Lake Macatawa.
Currently, Dr. Graham Peaslee with the Chemistry Department at
Hope College provides guidance for the group who has
continuously collected data since 2002! Remaining group
members, Bruce Panse and Allen Walters (pictured top right),
each received the 2011 Watershed Stakeholder of the
Year Award.
Since 2002, is appears that water clarity in Lake
Macatawa, measured with the Secchi Disk, has been
declining (Figure 29). In recent years, the best water
clarity has occurred in the Channel connecting Lake
Macatawa to Lake Michigan (4 feet of visibility). The
worst water clarity has been consistently recorded at
Paw Paw Park Preserve on the main branch of the
Macatawa River. However, average visibility tends to be
around 1 to 1.5 feet.

68
Figure 29. Historical Secchi Disk readings (water clarity) in Lake Macatawa based on Volunteer Monitoring Data.
0.00
1.00
2.00
3.00
4.00
5.00
6.00
7.00
8.00
9.00
10.00
7/1
4/2
00
2
10
/14
/20
02
1/1
4/2
00
3
4/1
4/2
00
3
7/1
4/2
00
3
10
/14
/20
03
1/1
4/2
00
4
4/1
4/2
00
4
7/1
4/2
00
4
10
/14
/20
04
1/1
4/2
00
5
4/1
4/2
00
5
7/1
4/2
00
5
10
/14
/20
05
1/1
4/2
00
6
4/1
4/2
00
6
7/1
4/2
00
6
10
/14
/20
06
1/1
4/2
00
7
4/1
4/2
00
7
7/1
4/2
00
7
10
/14
/20
07
1/1
4/2
00
8
4/1
4/2
00
8
7/1
4/2
00
8
10
/14
/20
08
1/1
4/2
00
9
4/1
4/2
00
9
7/1
4/2
00
9
10
/14
/20
09
1/1
4/2
01
0
4/1
4/2
01
0
7/1
4/2
01
0
Secc
hi D
isk
De
pth
(ft
)
Date of Collection
Macatawa Watershed Historical Secchi Disk Data
Paw Paw
Dunton Park
Al's Dock
Channel

69
Members of the Secchi Disk Group have recently started
collecting water samples for the monitoring of harmful algal
blooms in Lake Macatawa, in partnership with the Great
Lakes Environmental Research Laboratory and Michigan Sea
Grant . Harmful algal blooms are composed of cyanobacteria
or blue-green algae that can release a toxin called
microcystin. Microcystin can be toxic to some animals if
ingested and can also cause skin rashes and other afflictions
in humans. Harmful algal blooms are being studied
throughout the Midwest and are a public health concern.
Due to the excessive levels of phosphorus, Lake Macatawa frequently experiences intense blue-green
algae blooms (leftmost bottle pictured above).
Monitoring for harmful algal blooms has occurred during the summers of 2009, 2010 and 2011. Results
have indicated that although detectable levels of microcystin are found, most of the time the results
are below the World Health Organization limits for public contact (Figure 30 and Table 13).
Figure 30. Harmful algal bloom sampling on Lake Macatawa based on Volunteer Monitoring Data analyzed by NOAA. Data can be accessed at http://www.glerl.noaa.gov/res/Centers/HABS/lake_macatawa.html
0
10
20
30
40
50
60
70
Mic
rocy
stin
Co
nce
ntr
atio
n in
ug/
L
Sampling Date
Microcystin levels from all Station Locations
Dunton Park Beach
Mid-Lake
Holland State Park Beach (Lake Macatawa)
WHO Recommended Guidelines Drinking water = 1µg/L Low risk recreational = 2-4µg/L Moderate risk recreational - 20µg/L
Macatawa Watershed Management Plan (2012)
70
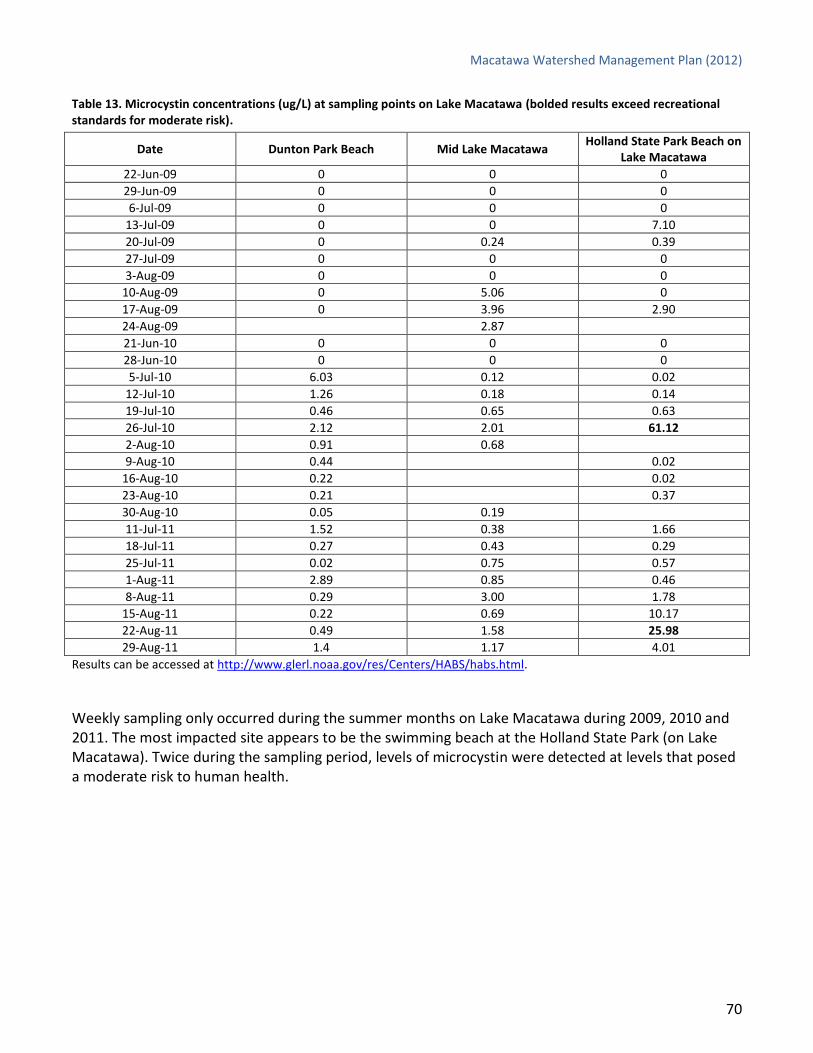
Table 13. Microcystin concentrations (ug/L) at sampling points on Lake Macatawa (bolded results exceed recreational standards for moderate risk).
Date Dunton Park Beach Mid Lake Macatawa Holland State Park Beach on
Lake Macatawa
22-Jun-09 0 0 0
29-Jun-09 0 0 0
6-Jul-09 0 0 0
13-Jul-09 0 0 7.10
20-Jul-09 0 0.24 0.39
27-Jul-09 0 0 0
3-Aug-09 0 0 0
10-Aug-09 0 5.06 0
17-Aug-09 0 3.96 2.90
24-Aug-09 2.87
21-Jun-10 0 0 0
28-Jun-10 0 0 0
5-Jul-10 6.03 0.12 0.02
12-Jul-10 1.26 0.18 0.14
19-Jul-10 0.46 0.65 0.63
26-Jul-10 2.12 2.01 61.12
2-Aug-10 0.91 0.68
9-Aug-10 0.44 0.02
16-Aug-10 0.22 0.02
23-Aug-10 0.21 0.37
30-Aug-10 0.05 0.19
11-Jul-11 1.52 0.38 1.66
18-Jul-11 0.27 0.43 0.29
25-Jul-11 0.02 0.75 0.57
1-Aug-11 2.89 0.85 0.46
8-Aug-11 0.29 3.00 1.78
15-Aug-11 0.22 0.69 10.17
22-Aug-11 0.49 1.58 25.98
29-Aug-11 1.4 1.17 4.01
Results can be accessed at http://www.glerl.noaa.gov/res/Centers/HABS/habs.html.
Weekly sampling only occurred during the summer months on Lake Macatawa during 2009, 2010 and 2011. The most impacted site appears to be the swimming beach at the Holland State Park (on Lake Macatawa). Twice during the sampling period, levels of microcystin were detected at levels that posed a moderate risk to human health.

Macatawa Watershed Management Plan (2012)
71
RECENT MONITORING AND RESEARCH
Over the course of three years, the MACC has worked to update the Macatawa Watershed
Management Plan. This work was partially funded by a Section 319 grant from the MDEQ (Tracking
Number 2008-0016). The following studies were completed during this time frame, specifically to aid in
the development of the management plan including:
Hydrology Study (MDEQ 2009)
Pollutant Loading Report (MDEQ 2009)
Bank Erosion Hazard Index (MACC 2009)
Conservation Priority Map (Fraser 2010)
Farmland Protection Priority Map (Fraser 2010)
Septic System Priority Inventory (MACC 2010)
2010 Landscape Level Functional Wetlands Assessment (MDEQ 2010)
Agricultural Survey (MACC 2010)
2011 Geomorphology Study (FTCH 2011)
2011 Critical Area Analysis (FTCH 2011)
This management plan will reference the above reports (contents, conclusions and recommendations)
where appropriate.
In addition to the myriad of recent research studies and analyses, the MACC has also partnered with
Hope College and the Outdoor Discovery Center Macatawa Greenway (ODCMG) to conduct watershed-
wide sampling for suspended sediments and E.coli bacteria. This work is partially funded by the State
of Michigan’s Clean Michigan Initiative (via the Water Quality Monitoring grants) and other private
donors.
The Suspended Sediment Sampling Project includes a network
of 45 monitoring locations (Figure 31) throughout the
Macatawa Watershed that allow us to measure the amount of
fine sediment particles in our local waterways during rain
events. In addition, once the samples are collected they are
retained for forensic analysis which differentiates the soil
based on a variety of physical, chemical, biological and
radiological factors.

Macatawa Watershed Management Plan (2012)
72
Figure 31. Suspended sediment sampling locations in the Macatawa Watershed.
Preliminary results indicate that a large quantity of suspended sediment is collected from locations
around the outer ring of the watershed in predominantly agricultural areas (Figure 32). When
normalized for the size of the contributing area for each sample site, the results are even more
dramatic (sediment mass per total upstream area, Figure 33).

Macatawa Watershed Management Plan (2012)
73
Figure 32. Sediment sampling results (mass) during a rain event in the Macatawa Watershed.
The data provides direct evidence that most of the suspended sediment originates from agricultural,
headwater areas around the outer ring of the watershed. Sediment enters waterways via two main
processes, surface runoff (overland flow) or streambank erosion. One of the forensic radiological
techniques used to fingerprint the sediment samples, can differentiate sediment sources (surface
runoff or streambank erosion) based on the presence of different radioisotopes. Preliminary analyses
by Hope College have indicated that the vast majority of the suspended sediment in local waterways
comes from surface runoff and overland flow (data is not yet published).

Macatawa Watershed Management Plan (2012)
74
Figure 33. Sediment sampling results (mass per upstream area) for a typical rain event in the Macatawa Watershed.
In addition to the ongoing study of suspended sediment, Hope College, ODCMG and the MACC are also
partnering to monitor the watershed for levels of E.coli bacteria. Finding high levels of E.coli bacteria
in surface water samples can indicate the presence of other potentially harmful microorganisms that
are associated with fecal contamination. Fecal contamination has certainly become a concern in Lake
Macatawa as the number and length of beach closings has increased over the past 10 years. Identifying
where the E. coli originates (point source or non-point source) is the first step in understanding the
problem. Eleven sampling sites in the Macatawa Watershed were selected for microbial testing (Figure
34).

Macatawa Watershed Management Plan (2012)
75
Figure 34. Bacteriological sampling locations in the Macatawa Watershed.
Preliminary results (in a study and analyses conducted by Hope College) show an interesting pattern of
bacteria levels that differ drastically based on weather conditions (results not yet published). Dry
sampling events (Figure 35) show very low E. coli counts that are generally below the level set for safe
body contact by the State of Michigan (<300 cfu/ 100 ml of sample).
Wet sampling events (Figure 36) produce higher E.coli counts (sometimes even >10,000 cfu/100 ml of
sample). The E.coli seem to be originating from widely distributed upstream sources whose presence is
continually replenished and washed down during precipitation events.
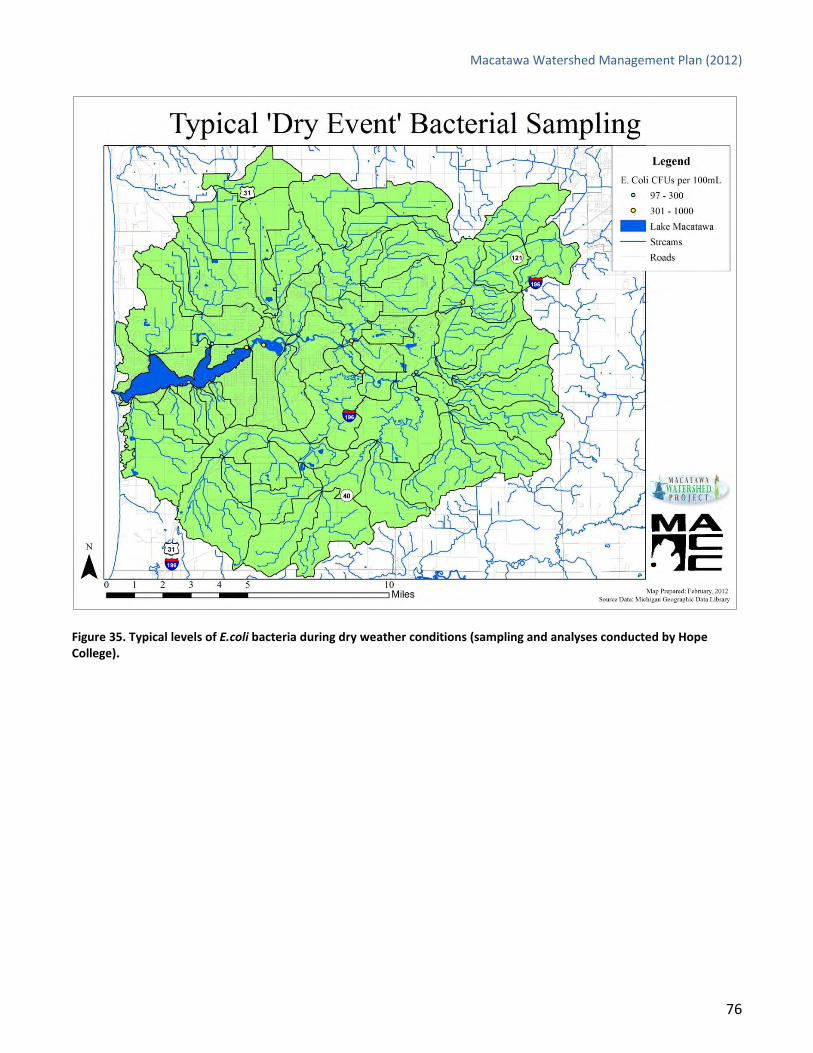
Macatawa Watershed Management Plan (2012)
76
Figure 35. Typical levels of E.coli bacteria during dry weather conditions (sampling and analyses conducted by Hope College).

Macatawa Watershed Management Plan (2012)
77
Figure 36. Typical levels of E.coli bacteria after a rain event (sampling and analyses conducted by Hope College).
The source of these bacteria may include leaking septic tanks, agricultural applications of manure,
wildlife, or indigenously growing microorganisms within the watershed. Preliminary results of DNA
source tracking indicate that human-specific markers are strongly present in raw municipal sewage,
but only present in small quantities in environmental samples. Pig and cow-specific markers are almost
completely absent in routine environmental samples which leaves a large percentage of E. coli that has
not yet been attributed to a specific source. Further sampling and analysis is needed to determine the
primary source of E.coli bacteria in the Macatawa Watershed.

Macatawa Watershed Management Plan (2012)
78
3.5 WATER QUALITY: POLLUTANTS, SOURCES AND CAUSES
The Macatawa Watershed faces a variety of
challenges as described above. When considered
together, the problems seem overwhelming.
Prioritization of these water quality problems is a
crucial part of the watershed planning process.
The ultimate goal of this watershed management
plan is to improve water quality per State
standards by restoring all required designated uses
(as described above). To restore each impaired
designated use, we must work to reduce the
pollutants, sources and causes specific to that use.
With the input from the members of the MACC’s
various committees, we have prioritized the
designated uses and the pollutants affecting those uses (below).
•Impaired for all reaches of watershed
•Not assessed in Lake Macatawa itself
Warmwater Fishery,
Other Aquatic Life
•Impaired at Dunton Park and Huizenga Pond beaches only
•Not impaired at Holland State Park Beach
•Not assessed anywhere else in watershed
Partial/Total Body Contact
•Impaired in Lake Macatawa Only
•Not assessed anywhere else in watershed
•Not attributed to non point source pollution Fish Consumption
1st Priority
2nd Priority
Last Priority
Pollutants
Sources
Causes
Macatawa Watershed Management Plan (2012)
79
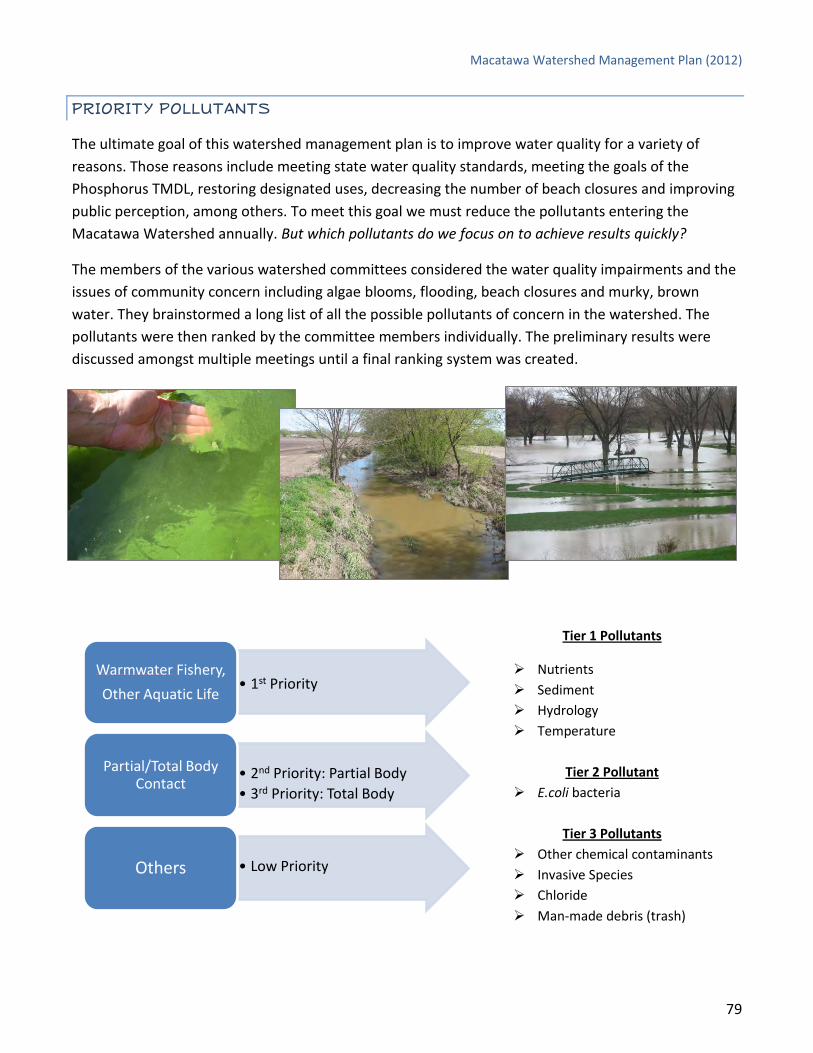
PRIORITY POLLUTANTS
The ultimate goal of this watershed management plan is to improve water quality for a variety of
reasons. Those reasons include meeting state water quality standards, meeting the goals of the
Phosphorus TMDL, restoring designated uses, decreasing the number of beach closures and improving
public perception, among others. To meet this goal we must reduce the pollutants entering the
Macatawa Watershed annually. But which pollutants do we focus on to achieve results quickly?
The members of the various watershed committees considered the water quality impairments and the
issues of community concern including algae blooms, flooding, beach closures and murky, brown
water. They brainstormed a long list of all the possible pollutants of concern in the watershed. The
pollutants were then ranked by the committee members individually. The preliminary results were
discussed amongst multiple meetings until a final ranking system was created.
Tier 1 Pollutants
Nutrients
Sediment
Hydrology
Temperature
Tier 2 Pollutant
E.coli bacteria
Tier 3 Pollutants
Other chemical contaminants
Invasive Species
Chloride
Man-made debris (trash)
• 1st Priority
Warmwater Fishery,
Other Aquatic Life
• 2nd Priority: Partial Body
• 3rd Priority: Total Body
Partial/Total Body Contact
• Low Priority
Others

Macatawa Watershed Management Plan (2012)
80
Please note that the Fish Consumption designated use will not be addressed by this plan. This
designated use is impaired in Lake Macatawa (for carp and walleye) based on the presence of
polychlorinated biphenyls (PCBs) and mercury which are persistent, bioaccumulative chemicals (MDEQ
2010 Integrated Report). This phenomenon is seen statewide in Michigan and is thought to be caused
by atmospheric deposition. Since this designated use impairment is not caused by local nonpoint
source pollution, the remediation of this designated use is outside the scope of this watershed
management plan.
High Priority Pollutants: The first priority of this plan is to restore the Warmwater Fishery and Other
Aquatic Life impaired designated uses. In addition, we must comply with the phosphorus TMDL that
was developed by the MDEQ and approved by EPA (Walterhouse 1999). Therefore the two pollutants
of highest concern are phosphorus and sediment. Other factors that contribute to the non-attainment
of these designated uses are flashiness (extreme and sudden changes in water level and velocity) and
excessive summer temperatures. Therefore, we will also focus on addressing hydrology and
temperature. Nutrients (mainly phosphorus), sediment, hydrology and temperature are the Tier 1
Pollutants. These are also the pollutants that contribute to murky brown water, nuisance algae
blooms, flooding and poor fish communities which are major concerns of the local community.
Moderate Priority Pollutants: The second priority of this plan is to restore the Partial and Total Body
Contact impaired designated uses. In addition, an E.coli TMDL will be developed by the MDEQ in the
future (2017). Therefore we must reduce the amount of E.coli bacteria in some parts of the watershed.
E.coli bacteria is considered a Tier 2 pollutant. It is also the pollutant that causes frequent beach
closures of Dunton Park Beach and a poor public health perception of Lake Macatawa which is a major
concern of the local community.
Low Priority Pollutants: The secondary goals of this plan are to protect natural areas of the watershed
and to enhance the watershed based on local community concerns, sometimes called Desired Uses
(See Section 4.6 and 4.7). Desired Uses are not required by the State of Michigan and they are specific
to each community. The members of the watershed committees decided that protecting open land
and improving recreation, public access and native fish and wildlife habitat were desirable activities.
The pollutants impacting desired uses and the pollutants with an unknown distribution and impact are
included in the low priority category. Tier 3 pollutants include other chemical contaminants (ex.
pharmaceuticals, metals, volatile organic compounds etc), invasive species, chloride and man-made
debris. In general, the extent and impact of these pollutants is not readily understood, although many
are of general concern to the local community. Note that this plan primarily addresses Tier 1 and Tier 2
pollutants.
Macatawa Watershed Management Plan (2012)
81
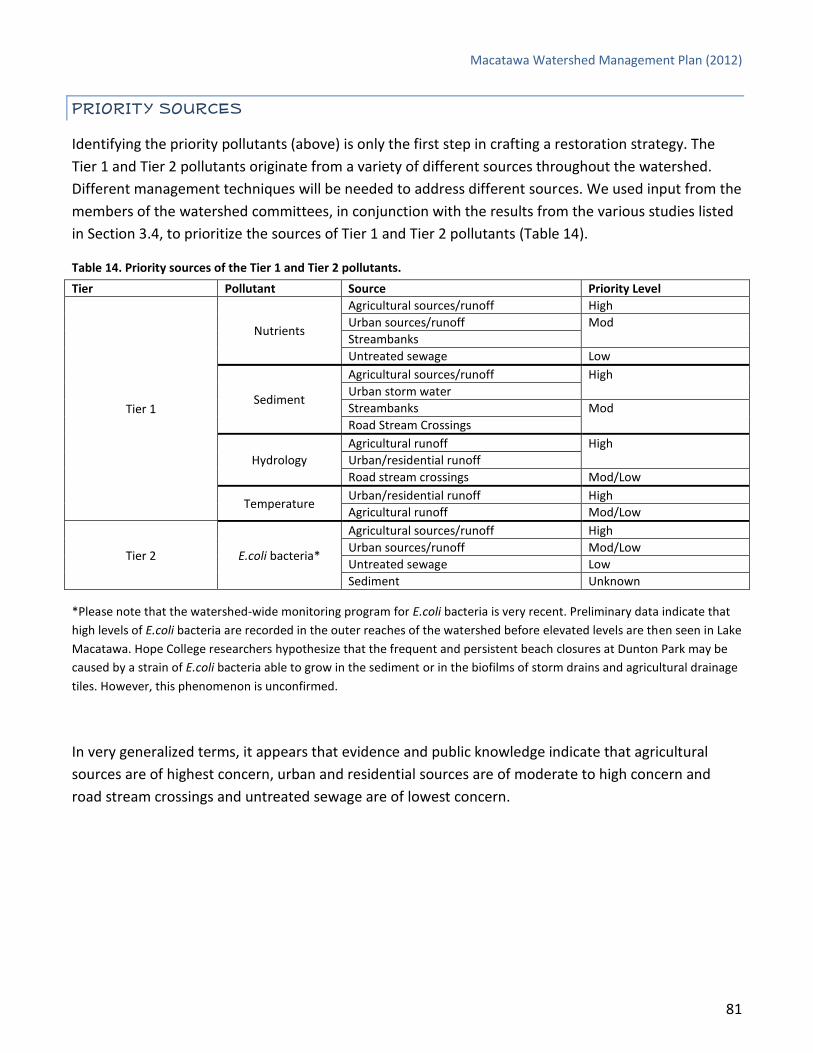
PRIORITY SOURCES
Identifying the priority pollutants (above) is only the first step in crafting a restoration strategy. The
Tier 1 and Tier 2 pollutants originate from a variety of different sources throughout the watershed.
Different management techniques will be needed to address different sources. We used input from the
members of the watershed committees, in conjunction with the results from the various studies listed
in Section 3.4, to prioritize the sources of Tier 1 and Tier 2 pollutants (Table 14).
Table 14. Priority sources of the Tier 1 and Tier 2 pollutants.
Tier Pollutant Source Priority Level
Tier 1
Nutrients
Agricultural sources/runoff High
Urban sources/runoff Mod
Streambanks
Untreated sewage Low
Sediment
Agricultural sources/runoff High
Urban storm water
Streambanks Mod
Road Stream Crossings
Hydrology
Agricultural runoff High
Urban/residential runoff
Road stream crossings Mod/Low
Temperature Urban/residential runoff High
Agricultural runoff Mod/Low
Tier 2 E.coli bacteria*
Agricultural sources/runoff High
Urban sources/runoff Mod/Low
Untreated sewage Low
Sediment Unknown
*Please note that the watershed-wide monitoring program for E.coli bacteria is very recent. Preliminary data indicate that
high levels of E.coli bacteria are recorded in the outer reaches of the watershed before elevated levels are then seen in Lake
Macatawa. Hope College researchers hypothesize that the frequent and persistent beach closures at Dunton Park may be
caused by a strain of E.coli bacteria able to grow in the sediment or in the biofilms of storm drains and agricultural drainage
tiles. However, this phenomenon is unconfirmed.
In very generalized terms, it appears that evidence and public knowledge indicate that agricultural
sources are of highest concern, urban and residential sources are of moderate to high concern and
road stream crossings and untreated sewage are of lowest concern.

Macatawa Watershed Management Plan (2012)
82
PRIORITY CAUSES
Once pollutants and sources are identified, the next important step is to accurately identify causes of
the various pollutant sources. Tier 1 and Tier 2 pollutants are caused by a variety of different
conditions or processes. Different management techniques will be needed to address these varying
causes. We used input from the members of the watershed committees, in conjunction with the
results from the various studies listed in Section 3.4, to prioritize the causes of Tier 1 and Tier 2
pollutants (Table 15). For a more detailed list of sources, causes, affected waterbodies and supporting
evidence see Appendix H.
Table 15. Priority causes of Tier 1 and Tier 2 pollutants.
Pollutant and Source Causes Priority Level
Tier 1 Pollutant: Nutrients
Agricultural sources/runoff Loss of wetlands
High
Lack of riparian buffers
Lack of BMPs (including excessive tillage and poor soil coverage)
Improper use or over application of manure
Urban sources/runoff Loss of wetlands
Improper use or over application of fertilizers
Mod Lack of riparian buffers
Poor Storm Water Management
Streambanks Erosion (loss of vegetation and logjams)
Agricultural sources/runoff Livestock Access
Low
Untreated sewage Illicit Connections
Failing Septic Systems
Urban sources/runoff Marinas/Boating
Car washing
Tier 1 Pollutant : Sediment
Agricultural Runoff Loss of wetlands
High
Lack of riparian buffers
Lack of BMPs (including excessive tillage and poor soil coverage)
Urban sources/runoff Impervious surfaces
Storm drains
Streambanks Erosion (loss of vegetation and logjams)
Mod Urban sources/runoff Loss of wetlands
Road Stream Crossings
Improper design, alignment, maintenance causing erosion
Erosion at private crossings with no road stream crossing structure
Low Urban sources/runoff Construction Sites
Streambanks Livestock access
Tier 1 Pollutant : Hydrology
Agricultural runoff Drain tiles and other artificial drainage
High Wetland loss
Urban sources/runoff Impervious surfaces and Storm Drains
Wetland loss
Road Stream Crossings Improper design, alignment (hydraulics) Mod
Tier 1 Pollutant : Temperature
Urban sources/runoff Impervious surfaces/storm drains High
Lack of riparian buffers Mod
Agricultural sources/runoff Lack of riparian buffers
Tiling and artificial drainage Low
Tier 2 Pollutant: E.coli bacteria*
Agricultural sources/runoff Application of manure High
Biofilms in drain tiles and artificial drainage
Urban sources/runoff Biofilms in storm drains
Improper disposal of pet waste Low

Macatawa Watershed Management Plan (2012)
83
Pollutant and Source Causes Priority Level
Birds and Animals
Agricultural sources/runoff Livestock Access
Low
Untreated Sewage Sewer Overflows
Failing Septic Systems
Illicit Connections
Sediment Harbor and grow bacteria
*Please note that the watershed-wide monitoring program for E.coli bacteria is very recent. Preliminary data indicate that
high levels of E.coli bacteria are recorded in the outer reaches of the watershed before elevated levels are then seen in Lake
Macatawa. In addition, preliminary source tracking indicates that a small amount of human-derived E.coli bacteria can be
detected everywhere (which likely comes from illicit connections and failing septic systems). However, when high levels of
E.coli are detected above state water quality standards, the human-derived portion is very small. The source tracking also
indicated that the majority of the E.coli bacteria could not be traced to bovine or porcine sources. Hope College
researchers hypothesize that the there may be a new strain of E.coli bacteria able to live in sediments or the biofilms in
agricultural tile drains and urban storm drains. However, this phenomenon is unconfirmed.

Macatawa Watershed Management Plan (2012)
84
3.6 QUANTIFICATION OF NUTRIENTS AND SEDIMENT
It is clear from the vast majority of historical and recent studies and analyses, that sediment, nutrients,
temperature, hydrology and E.coli bacteria are pollutants of great concern in the Macatawa
Watershed. These pollutants directly impact the ability of the Macatawa Watershed to meet State
designated uses and water quality standards. But how much of a problem are each of these pollutants?
Determining the relative pollutant loads of each identified pollutant of concern is critical. In 2009, the
MDEQ developed a Hydrology Study of the Macatawa Watershed (Appendix I) and used that
information to create a Pollutant Loading Report (Fongers 2009a; Appendix J). Quantification of all high
and moderate priority pollutants (by subbasin) is detailed in Appendix K.
The pollutant loading model first estimates annual runoff volumes (based on precipitation, land use
and soil data) and then applies event mean concentrations for pollutants of concern including total
phosphorus, total suspended solids and total nitrogen. Since this model is based on runoff it only
estimates pollutants from overland flow (and not streambank erosion). This model does not contain
loading information for temperature or E.coli bacteria. The pollutant load information is summarized in
Tables 16 and 17.
Table 16. Summary of 1978 and 2005 sediment and nutrient pollutant loads for the Macatawa Watershed based on MDEQ Pollutant Loading Model (Fongers, 2009a).
Parameter 1978 Total (pounds)
2005 Total (pounds)
% Increase Pounds per acre (2005)
Total Phosphorus (TP) 42,910 51,820 21 0.5
Total Suspended Solids (TSS) 14,394,694 15,676,877 9 145
Total Kjeldahl Nitrogen (TKN) 235,426 296,488 26 2.8
In 1978, the total volume of suspended solids would have filled about 554 ten-wheeler truck loads! In
2005, the total sediment load would have filled about 603 truck loads! Tables 17 and 18 also relate the
total volume of sediment in terms of truck loads for each subbasin.
Table 17. Summary of 2005 sediment and nutrient pollutant loads by subbasin based on MDEQ Pollutant Loading Model.
Subbasin Area
(acres) TP (lbs)
TP lbs/ acre
TSS (lbs) Total
truckloads (TSS)
TSS lbs/acre
TKN (lbs) TKN
(lbs/acre)
Pine Creek 11,136 4,185 0.4 990,697 38 88 25,416 2.2
Lower Macatawa 10,991 7,192 0.7 2,194,907 84 194 41,696 3.8
Noordeloos Creek 16,977 8,245 0.5 2,446,193 94 143 48,067 3.0
Upper Macatawa 18,528 8,196 0.4 2,686,070 103 138 44,885 2.4
Peters Creek 9,102 3,440 0.4 1,280,554 49 127 18,359 3.5
South Branch Macatawa 14,993 6,109 0.4 2,183,074 84 143 33,271 2.2
North Branch Macatawa 11,989 6,533 0.6 2,235,480 86 206 35,774 3.2
Lake Macatawa Direct Drainage
15,967 7,920 0.5 1,659,901 64 115 49,020 3.3
Macatawa Watershed Management Plan (2012)
85
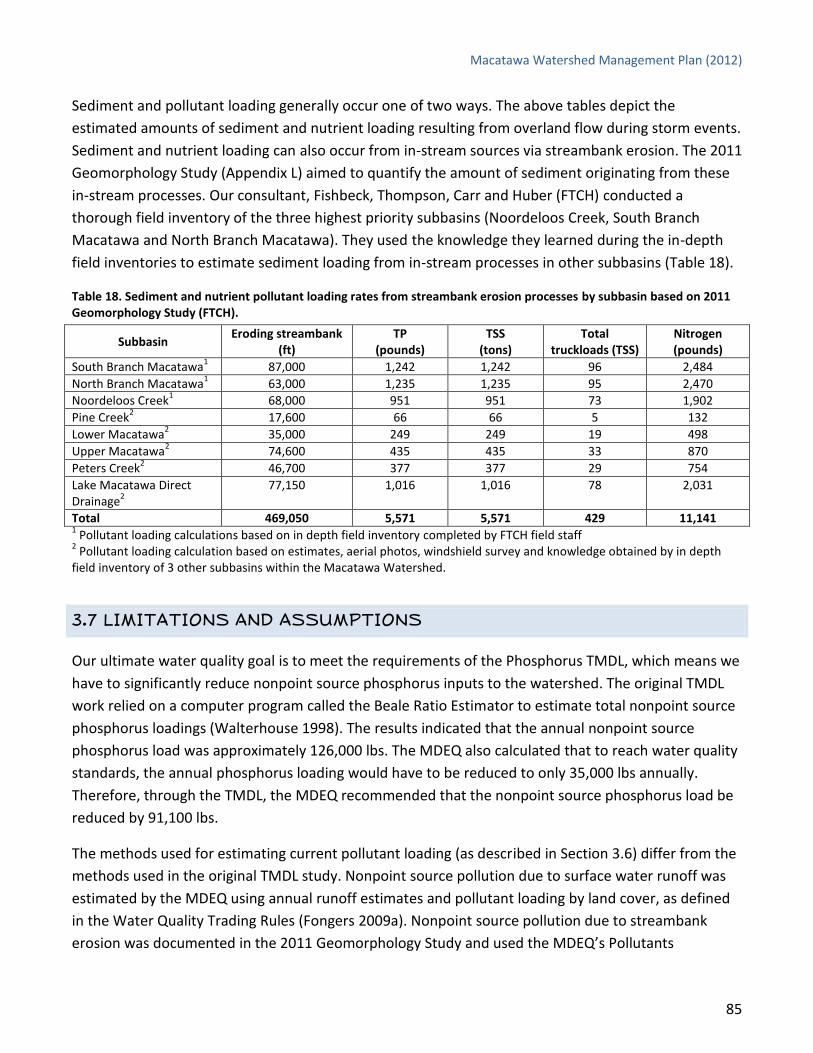
Sediment and pollutant loading generally occur one of two ways. The above tables depict the
estimated amounts of sediment and nutrient loading resulting from overland flow during storm events.
Sediment and nutrient loading can also occur from in-stream sources via streambank erosion. The 2011
Geomorphology Study (Appendix L) aimed to quantify the amount of sediment originating from these
in-stream processes. Our consultant, Fishbeck, Thompson, Carr and Huber (FTCH) conducted a
thorough field inventory of the three highest priority subbasins (Noordeloos Creek, South Branch
Macatawa and North Branch Macatawa). They used the knowledge they learned during the in-depth
field inventories to estimate sediment loading from in-stream processes in other subbasins (Table 18).
Table 18. Sediment and nutrient pollutant loading rates from streambank erosion processes by subbasin based on 2011 Geomorphology Study (FTCH).
Subbasin Eroding streambank
(ft) TP
(pounds) TSS
(tons) Total
truckloads (TSS) Nitrogen (pounds)
South Branch Macatawa1 87,000 1,242 1,242 96 2,484
North Branch Macatawa1 63,000 1,235 1,235 95 2,470
Noordeloos Creek1 68,000 951 951 73 1,902
Pine Creek2 17,600 66 66 5 132
Lower Macatawa2 35,000 249 249 19 498
Upper Macatawa2
74,600 435 435 33 870
Peters Creek2 46,700 377 377 29 754
Lake Macatawa Direct Drainage
2
77,150 1,016 1,016 78 2,031
Total 469,050 5,571 5,571 429 11,141 1 Pollutant loading calculations based on in depth field inventory completed by FTCH field staff
2 Pollutant loading calculation based on estimates, aerial photos, windshield survey and knowledge obtained by in depth
field inventory of 3 other subbasins within the Macatawa Watershed.
3.7 LIMITATIONS AND ASSUMPTIONS
Our ultimate water quality goal is to meet the requirements of the Phosphorus TMDL, which means we
have to significantly reduce nonpoint source phosphorus inputs to the watershed. The original TMDL
work relied on a computer program called the Beale Ratio Estimator to estimate total nonpoint source
phosphorus loadings (Walterhouse 1998). The results indicated that the annual nonpoint source
phosphorus load was approximately 126,000 lbs. The MDEQ also calculated that to reach water quality
standards, the annual phosphorus loading would have to be reduced to only 35,000 lbs annually.
Therefore, through the TMDL, the MDEQ recommended that the nonpoint source phosphorus load be
reduced by 91,100 lbs.
The methods used for estimating current pollutant loading (as described in Section 3.6) differ from the
methods used in the original TMDL study. Nonpoint source pollution due to surface water runoff was
estimated by the MDEQ using annual runoff estimates and pollutant loading by land cover, as defined
in the Water Quality Trading Rules (Fongers 2009a). Nonpoint source pollution due to streambank
erosion was documented in the 2011 Geomorphology Study and used the MDEQ’s Pollutants

Macatawa Watershed Management Plan (2012)
86
Controlled Calculations and Documentation for Section 319 Watersheds Training Manual (MDEQ
1999).
In addition, the pollutant loading
reductions estimated for each of the
proposed best management practices
(described in Section 4.0) utilize a
variety of other methods including EPA’s
Spreadsheet Tool for Estimating
Pollutant Loads 4.1 (STEPL), MDEQ’s
Pollutants Controlled Calculations and
Documentation for Section 319
Watersheds Training Manual (MDEQ
1999), Chesapeake Bay Model and the
Simple Method.
The use of these different models to estimate
pollutant loadings and reductions in the Macatawa
Watershed does present a limitation to this
management plan because the results cannot be
compared directly. Each of these models relies on
different parameters, equations, input data and
assumptions. Therefore, the original TMDL goal of
reducing 91,000 lbs of phosphorus is relevant only
when using the original model. The comprehensive
implementation actions described in Section 4.0 will result in reduction of phosphorus and sediment
loading to the Macatawa Watershed; however the total reduction will not equal 91,000 lbs of
phosphorus. The more applicable goal is to aim to meet the phosphorus concentration
recommendations set forth in the TMDL, which was to reach an average phosphorus concentration of
50 ppm in Lake Macatawa.
It is also possible that Designated Uses may be restored prior to meeting the phosphorus concentration
of 50 ppm. Designated Uses are measured via water quality and narrative standards (Appendix E).
Regular monitoring of the Macatawa Watershed (as described in Section 5.0) will be the best method
to determine if and when the Designated Uses are restored.

Macatawa Watershed Management Plan (2012)
87
3.8 QUANTIFICATION OF HYDROLOGY AND TEMPERATURE
Runoff volumes and the amount of impervious surface in
each subwatershed were calculated by the MDEQ as part of
the 2009 Hydrology Study (Fongers 2009, Appendix I). They
found that approximately half (27) of the 55 subwatersheds
exceeds an estimated 10% imperviousness. Of these 27,
almost half (12) exceeds an estimated 25% imperviousness.
Runoff volumes and the amount of impervious surface are
one part of the hydrology equation. Another important part is
the peak flood flow yield, or the time it takes for runoff to
flow through the drainage network. Taken together, annual
runoff volumes, impervious surfaces, peak yields and total
wetland loss can help estimate hydrology loads in the
Macatawa Watershed (Table 19). The historical record of
annual peak streamflow, measured at the United States Geological Survey Gage Station along the main
branch of the Macatawa River near Adams Street, is shown in Figure 37.
Table 19. Runoff volumes, impervious surfaces, wetland loss and peak yield by subbasin based on the MDEQ Hydrology Study (Appendix I).
Subbasin
Total Impervious Area (Acres)
Impervious Area (%)
Total Wetland Loss
(acres)
Total Runoff Volume
(ft3)
Runoff Volume per
acre (ft3/acre)
Average Peak Flood Flow Yield
(ft3/sec/acre)
Pine Creek 1,527 14 2,672 114 million 10,244 0.024
Lower Macatawa 3,130 28 2,119 276 million 25,106 0.057
Noordeloos Creek 2,265 13 3,315 443 million 26,105 0.048
Upper Macatawa 1,335 7 2,121 475 million 25,636 0.057
Peters Creek 98 1 0 97 million 10,634 0.048
South Branch Macatawa
356 2 3,104
273 million 18,203 0.048
North Branch Macatawa
1,908 16 1,498
256 million 21,368 0.063
Lake Macatawa Direct Drainage
3,145 20 1,749
372 million 23,266 0.089
Totals 13,765 16,578 2.31 billion
The total impervious area in
the entire watershed would
cover about 10,410 football
fields (including the end zones).
The total runoff volume would
fill about 26,172 Olympic size
swimming pools.

Macatawa Watershed Management Plan (2012)
88
Figure 37. Historical record of annual peak streamflow at the USGS gage station.
Figure 38. Historical water temperatures at four watershed locations collected by local volunteers.
Macatawa Watershed Management Plan (2012)
89
Storm water runoff (characteristics described above) also contributes to the temperature load in Lake
Macatawa. The MWP has several sources of historical temperature data including volunteer
monitoring data (since 2006, Figure 38) and MDEQ biosurveys (since 1990, see Table 12). Refer to
Section 3.4 to learn more about ongoing Monitoring Programs in the Macatawa Watershed. The
MACC’s temperature data can be accessed via the website at http://www.the-
macc.org/watershed/water-quality/.
Three of the four sites sampled by volunteers are on Lake Macatawa (Paw Paw Park is on the main
branch of the Macatawa River). The data shows that water near the Dunton Park and Al’s Dock
locations, on the north shore of Lake Macatawa, tends to undergo the warmest summer temperatures,
sometimes near 85°F. The highest temperatures measured at each site are 87°F at Dunton Park, 83.5°F
at Al’s Dock, 82°F at the Channel, and 82°F at Paw Paw Park.
In the tributaries of the Macatawa River and Lake Macatawa, records indicate that the highest
temperatures have been detected in the North Branch Macatawa River, South Branch Macatawa River
and Noordeloos Creek. The lowest temperatures have been detected in Pine Creek and the upper
portions of the Macatawa River. The historical data provides convincing evidence that temperature is
indeed a pollutant of high priority in the Macatawa Watershed.

Macatawa Watershed Management Plan (2012)
90
3.9 QUANTIFICATION OF E.COLI BACTERIA
As described in Section 3.3 and 3.4, E.coli bacteria is an emerging problem in the Macatawa Watershed
that has caused frequent and persistent beach closures at Dunton Park Beach on the north side of Lake
Macatawa. The Ottawa County Health Department is the agency responsible for monitoring Lake
Macatawa beaches and they have provided sampling results from 2009, 2010 and 2011 (Table 20). The
data can be requested directly from the Ottawa County Health Department at 616-738-4000 or
http://www.miottawa.org/SwimmingAdvisory/beach.jsp.
Table 20. E.coli sampling results provided by Ottawa County Health Department (bolded results exceed standards for total body contact according to State of Michigan Water Quality Standards).
Sampling Date Dunton Park Holland State Park (on Lake Macatawa)
Type of Sample
7/7/2011 52 57.3 Individual Sample
7/7/2011 51 62.7 Individual Sample
7/7/2011 47 75.2 Individual Sample
07/12/2011 345 56.3 Individual Sample
07/12/2011 328 75.9 Individual Sample
07/12/2011 308 45 Individual Sample
07/20/2011 1120 41.4 Individual Sample
07/20/2011 980 32.7 Individual Sample
07/20/2011 1046 28.8 Individual Sample
7/26/2011 649 3.1 Individual Sample
7/26/2011 579 2 Individual Sample
7/26/2011 436 3 Individual Sample
8/2/2011 2420 39.7 Individual Sample
8/2/2011 1986 21.1 Individual Sample
8/2/2011 1986 30.9 Individual Sample
08/09/2011 548 23.1 Individual Sample
08/09/2011 488 26.5 Individual Sample
08/09/2011 326 28.8 Individual Sample
8/15/2011 1414 4.1 Individual Sample
8/15/2011 1733 16.9 Individual Sample
8/15/2011 2420 10.9 Individual Sample
8/24/2011 575 59.8 Individual Sample
8/24/2011 388 55.6 Individual Sample
8/24/2011 549 53.7 Individual Sample
8/29/2011 78 4.1 Individual Sample
8/29/2011 96 6.2 Individual Sample
8/29/2011 111 7.5 Individual Sample
6/1/2010 >2419.6 203 Daily Mean
6/7/2010 1855 42 Daily Mean
6/14/2010 110 5 Daily Mean
6/23/2010 1800 51 Daily Mean
6/30/2010 122 9 Daily Mean
7/7/2010 96 17 Daily Mean
7/14/2010 No sample collected 21 Daily Mean
7/21/2010 52 11 Daily Mean
7/28/2010 64 21 Daily Mean
8/4/2010 294 52 Daily Mean
8/13/2010 67 37 Daily Mean
8/18/2010 846 15 Daily Mean
8/25/2010 126 4 Daily Mean
5/27/2009 >410.02 4 Daily Mean
6/2/2009 66 1 Daily Mean
6/10/2009 82 297 Daily Mean
Macatawa Watershed Management Plan (2012)
91
Sampling Date Dunton Park Holland State Park (on Lake Macatawa)
Type of Sample
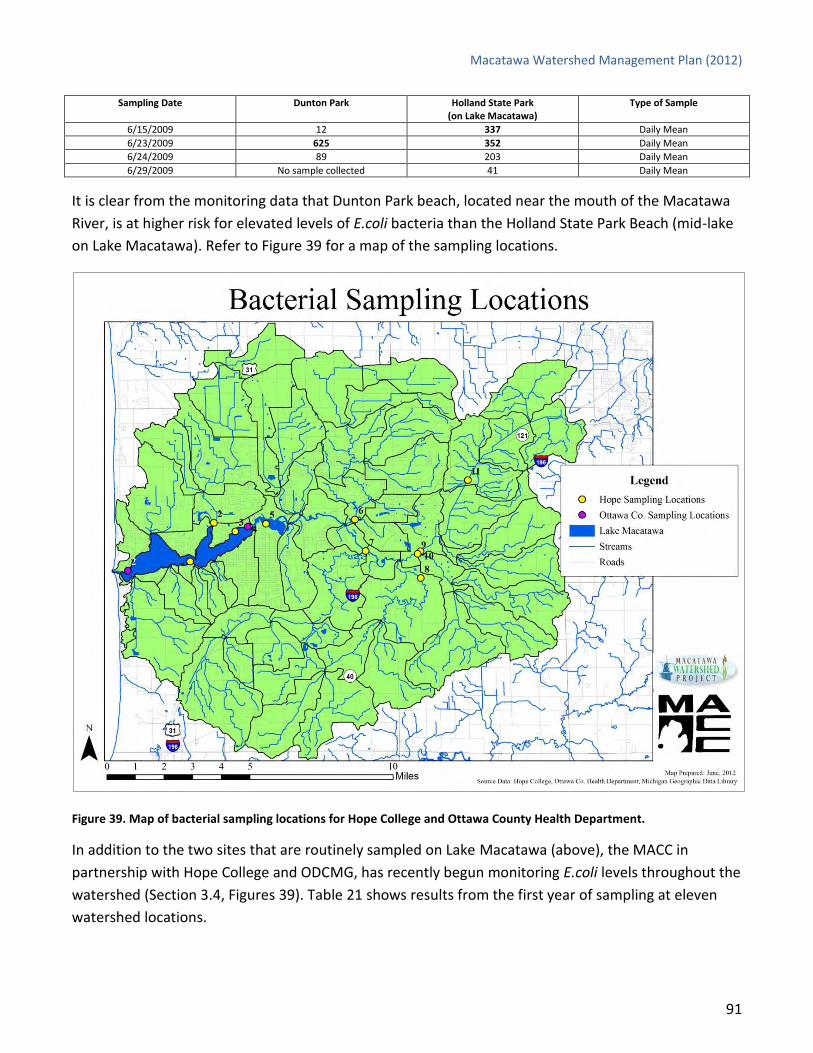
6/15/2009 12 337 Daily Mean
6/23/2009 625 352 Daily Mean
6/24/2009 89 203 Daily Mean
6/29/2009 No sample collected 41 Daily Mean
It is clear from the monitoring data that Dunton Park beach, located near the mouth of the Macatawa
River, is at higher risk for elevated levels of E.coli bacteria than the Holland State Park Beach (mid-lake
on Lake Macatawa). Refer to Figure 39 for a map of the sampling locations.
Figure 39. Map of bacterial sampling locations for Hope College and Ottawa County Health Department.
In addition to the two sites that are routinely sampled on Lake Macatawa (above), the MACC in
partnership with Hope College and ODCMG, has recently begun monitoring E.coli levels throughout the
watershed (Section 3.4, Figures 39). Table 21 shows results from the first year of sampling at eleven
watershed locations.

Macatawa Watershed Management Plan (2012)
92
Table 21. E.coli results from 2011 sampling study (Hope College) at eleven locations throughout the Macatawa Watershed (bolded results exceed standards for total body contact).
No. on Map
Sampling Location
2011 Sampling Dates
18-May 24-May 1-Jun 7-Jun 16-Jun 21-Jun 6-Jul 12-Jul
Wet1 Wet1 Dry2 Dry2 Dry2 Wet1 Dry2 Wet1
E.coli sample results (Colony Forming Units per 100 mL of sample)
1 Fire Dock (south side Lake Macatawa)
377 60 157 17 37 not done 17 100
2 Pine Creek (north side Lake Macatawa)
220 783 97 223 387 437 483 1,243
3 Keizer Dock (north side Lake Macatawa)
1,015 14,000 210 53 7 150 3 57
4 Dunton Park (north side Lake Macatawa)
1,000 14,000 550 87 87 377 20 250
5 Window on Waterfront (Macatawa River marsh area)
745 11,733 465 350 260 1,547 590 13,200
6 Noordeloos Creek 285 1,555 765 733 847 1,967 747 7,300
7 North Branch Macatawa River
385 2,133 350 167 293 8,867 463 6,300
8 South Branch Macatawa River
235 1,080 285 303 487 2,033 537 6,067
9 Peters Creek 295 963 250 783 477 1,067 1,867 not done
10 Poppen Woods (Main Branch of the Macatawa River)
867 2,700 215 460 463 8,333 940 15,933
11 Felch Street (Upper Macatawa River)
567 3,966 460 653 913 4,267 977 6,367
# of exceedances 7 sites exceed
standards
10 sites exceed
standards
5 sites exceed
standards
6 sites exceed
standards
6 sites exceed
standards
9 sites exceed
standards
8 sites exceed
standards
7 sites exceed
standards 1 Refers to a “wet” sampling condition during or just after a “wet” event or a rain event.
2 Refers to a “dry“ sampling condition during normal, baseflow conditions during a period of time when it has not been raining for at least three days prior
to sampling.
Sampling sites cover almost all of the major subbasins except for the Lower Macatawa and several
direct tributaries of Lake Macatawa. Surprisingly, elevated levels of E.coli bacteria are present
throughout the sampling season at all eleven sampling sites. Results from sampling sites located
highest up in the watershed (Felch St, Poppen Woods, and Peters Creek) indicate that E.coli bacteria
are present in significant quantities even in mostly agricultural areas of the watershed.
As stated previously, preliminary source tracking indicates that a small amount of human-derived E.coli
bacteria can be detected everywhere (which likely comes from illicit connections and failing septic
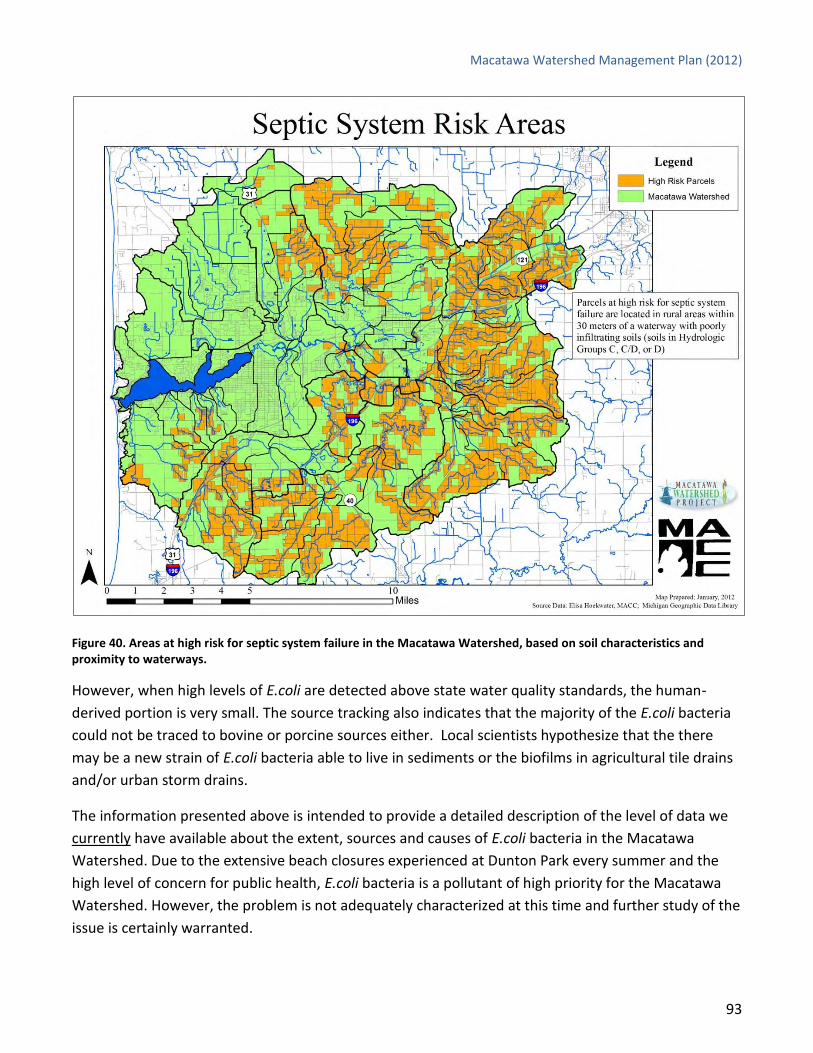
systems). The MACC has created a map that indicates where septic systems, at high risk for failure, are
most likely located (Figure 40). Parcels were categorized as being at high risk for septic system failure if
they were not serviced by municipal sewer system and were located within 30 meters of a waterway
on poorly infiltrating soils (soils in Hydrologic Groups C, C/D or D).
Macatawa Watershed Management Plan (2012)
93
Figure 40. Areas at high risk for septic system failure in the Macatawa Watershed, based on soil characteristics and proximity to waterways.
However, when high levels of E.coli are detected above state water quality standards, the human-
derived portion is very small. The source tracking also indicates that the majority of the E.coli bacteria
could not be traced to bovine or porcine sources either. Local scientists hypothesize that the there
may be a new strain of E.coli bacteria able to live in sediments or the biofilms in agricultural tile drains
and/or urban storm drains.
The information presented above is intended to provide a detailed description of the level of data we
currently have available about the extent, sources and causes of E.coli bacteria in the Macatawa
Watershed. Due to the extensive beach closures experienced at Dunton Park every summer and the
high level of concern for public health, E.coli bacteria is a pollutant of high priority for the Macatawa
Watershed. However, the problem is not adequately characterized at this time and further study of the
issue is certainly warranted.
Macatawa Watershed Management Plan (2012)
94
3.10 SECTION 3.0 REFERENCES
Faivor, L. and S. Hanshue. 2007. A biological survey in the Lake Macatawa Watershed Allegan and
Ottawa Counties, Michigan, June 2005. Report No. Mi/DEQ/WB-07/014.
Fongers, D. 2009. Macatawa Watershed Hydrologic Study. Hydrologic Studies Unit. Land and Water
Management Division. Michigan Department of Environment Quality.
Fongers, D. 2009a. Macatawa Watershed Modeled Pollutant Loads. Hydrologic Studies Unit. Land and
Water Management Division. Michigan Department of Environmental Quality.
Fusilier, W.E. and B.M. Fusilier. 1999. Lake Macatawa Holland and Park Townships Ottawa County,
Michigan: A Water Quality and Watershed Management Study. Water Quality Investigators,
The Lake Macatawa Shoreline Association, Holland, Michigan.
Holden, S. 2012. A biological survey of Macatawa River, Pigeon River, and the Little Pigeon River
Watersheds, Allegan and Ottawa Counties, Michigan, August 2010. Report No. MI/DEQ/WRD-
12-016.
Jackson, G. 1971. A biological survey of the Black River and Lake Macatawa, Vicinity of Holland,
Michigan. Michigan Water Resources Commission, Bureau of Water Management, Michigan
Department of Natural Resources.
Lake Macatawa Shoreline Association. 1996. Toward a Cleaner Lake 1988-1996. Clean Water
Committee, Lake Macatawa Shoreline Association, Holland, Michigan.
MDEQ (Michigan Department of Environmental Quality). 1999. Pollutants controlled calculation and
documentation for Section 319 watersheds training manual.
MDEQ (Michigan Department of Environmental Quality). 2010. Water quality and pollution control in
Michigan 2010 Sections 303(d), 305(b), and 314. Integrated Report. Report No. MI/DEQ/WB-
10/001.
Mustata, E. 1996. Dissolved Oxygen Study of Lake Macatawa’s Eastern-Basin, Ottawa County,
Michigan, June-August, 1995. Michigan Department of Environmental Quality, Surface
Water Quality Division, Report No. MI/DEQ/SWQ-96/043.
Rockafellow, D. 2002. A biological survey of the Lake Macatawa Watershed and selected tributaries,
Ottawa and Allegan Counties, Michigan, August and September 2000. Michigan Department of
Environmental Quality. Report No. MI/DEQ/SWQ-02/026.
Macatawa Watershed Management Plan (2012)
95
Walterhouse, M. 1997. A survey of the macroinvertebrate communities and water chemistry at sites in
the Lake Macatawa Watershed Allegan and Ottawa Counties, Michigan, August 24 and October
13, 1995. Report No. MI/DEQ/SWQ-97/067.
Walterhouse, M. 1998. Phosphorus loading assessment for Lake Macatawa, 1995 through 1997. Report
No. MI/DEQ/SWQ-98/015.
Walterhouse, M.1999. Total maximum daily load (TMDL) for phosphorus in Lake Macatawa. Michigan Department of Environmental Quality.
Walterhouse, M. 2007. Monthly water quality assessment of Lake Macatawa and its tributaries 2006.
Michigan Department of Environmental Quality. Report No. MI/DEQ/WB-07/086.
Walterhouse, M. 2009. Monthly water quality assessment of Lake Macatawa and its tributaries 2008.
Michigan Department of Environmental Quality. Report No. MI/DEQ/WB-09/076.
Walterhouse, M. 2011. Monthly water quality assessment of Lake Macatawa and its tributaries 2010.
Michigan Department of Environmental Quality. Report No. MI/DEQ/WRD-11/018.
Walterhouse, M. 2012. Monthly water quality assessment of Lake Macatawa and its tributaries 2008.
Michigan Department of Environmental Quality. Report No. MI/DEQ/WB-09/076.
Williams, D.H. 1975. A Study of the Water Quality of Lake Macatawa (1966-1974). Hope College,
Institute for Environmental Quality for the Macatawa Bay Yacht Club Volunteer Samplers and
Concerned Agencies and Groups.
Wuycheck, J. 1995. Biological survey of the Macatawa River, its tributaries and Pine Creek, a triburtary
to Lake Macatawa, Ottawa and Allegan Counties, Michigan. July 10-11 1990. Michigan
Department of Natural Resources. Report No. MI/DNR/SWQ-95/044.

Macatawa Watershed Management Plan (2012)
96

Macatawa Watershed Management Plan (2012)
97
4.0 WATERSHED ACTION PLAN
In this SECTION you will understand:
The water quality goals and objectives
How critical Areas of the Watershed have been identified
The range of best management practices recommended
The information and education strategy
How this plan is coordinated with state storm water permit requirements
Macatawa Watershed Management Plan (2012)
98
4.1 WATER QUALITY GOALS AND OBJECTIVES
The watershed management plan provides a detailed outline of the strategy that will be employed as
we strive to meet the plan goals of restoration, protection and enhancement. In general, the
implementation plan can be summarized by the following set of objectives and desired outcomes
(Table 22).
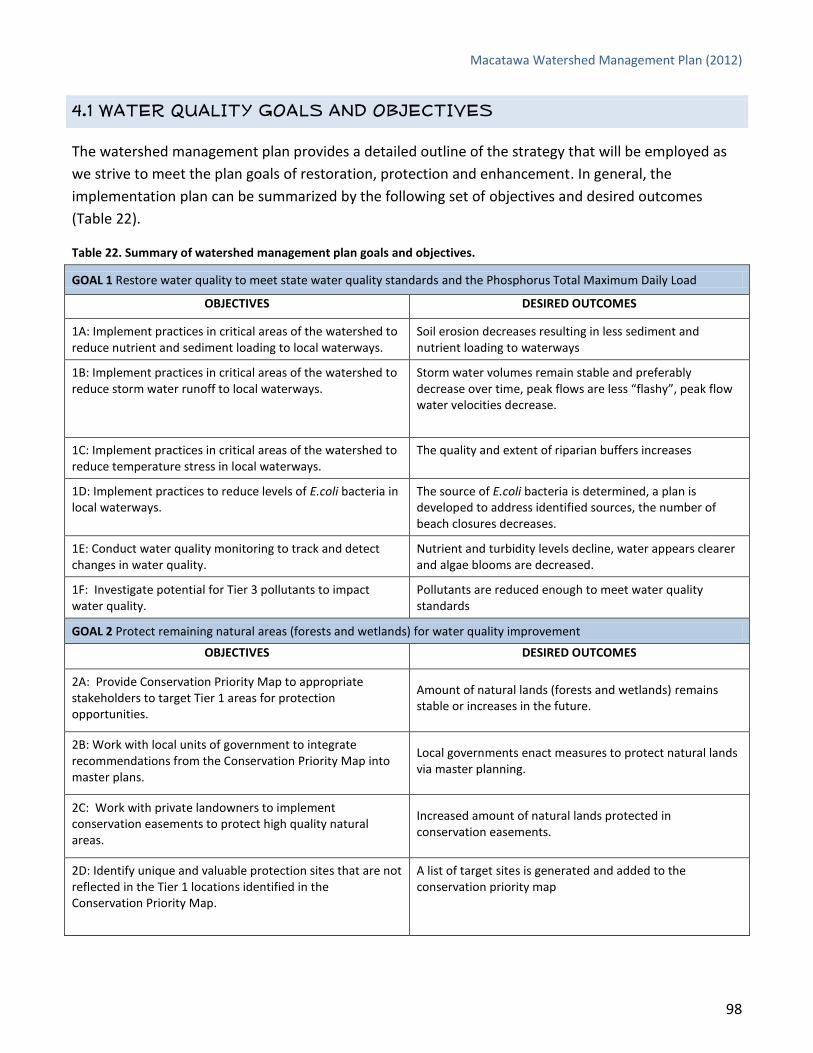
Table 22. Summary of watershed management plan goals and objectives.
GOAL 1 Restore water quality to meet state water quality standards and the Phosphorus Total Maximum Daily Load
OBJECTIVES DESIRED OUTCOMES
1A: Implement practices in critical areas of the watershed to reduce nutrient and sediment loading to local waterways.
Soil erosion decreases resulting in less sediment and nutrient loading to waterways
1B: Implement practices in critical areas of the watershed to reduce storm water runoff to local waterways.
Storm water volumes remain stable and preferably decrease over time, peak flows are less “flashy”, peak flow water velocities decrease.
1C: Implement practices in critical areas of the watershed to reduce temperature stress in local waterways.
The quality and extent of riparian buffers increases
1D: Implement practices to reduce levels of E.coli bacteria in local waterways.
The source of E.coli bacteria is determined, a plan is developed to address identified sources, the number of beach closures decreases.
1E: Conduct water quality monitoring to track and detect changes in water quality.
Nutrient and turbidity levels decline, water appears clearer and algae blooms are decreased.
1F: Investigate potential for Tier 3 pollutants to impact water quality.
Pollutants are reduced enough to meet water quality standards
GOAL 2 Protect remaining natural areas (forests and wetlands) for water quality improvement
OBJECTIVES DESIRED OUTCOMES
2A: Provide Conservation Priority Map to appropriate stakeholders to target Tier 1 areas for protection opportunities.
Amount of natural lands (forests and wetlands) remains stable or increases in the future.
2B: Work with local units of government to integrate recommendations from the Conservation Priority Map into master plans.
Local governments enact measures to protect natural lands via master planning.
2C: Work with private landowners to implement conservation easements to protect high quality natural areas.
Increased amount of natural lands protected in conservation easements.
2D: Identify unique and valuable protection sites that are not reflected in the Tier 1 locations identified in the Conservation Priority Map.
A list of target sites is generated and added to the conservation priority map
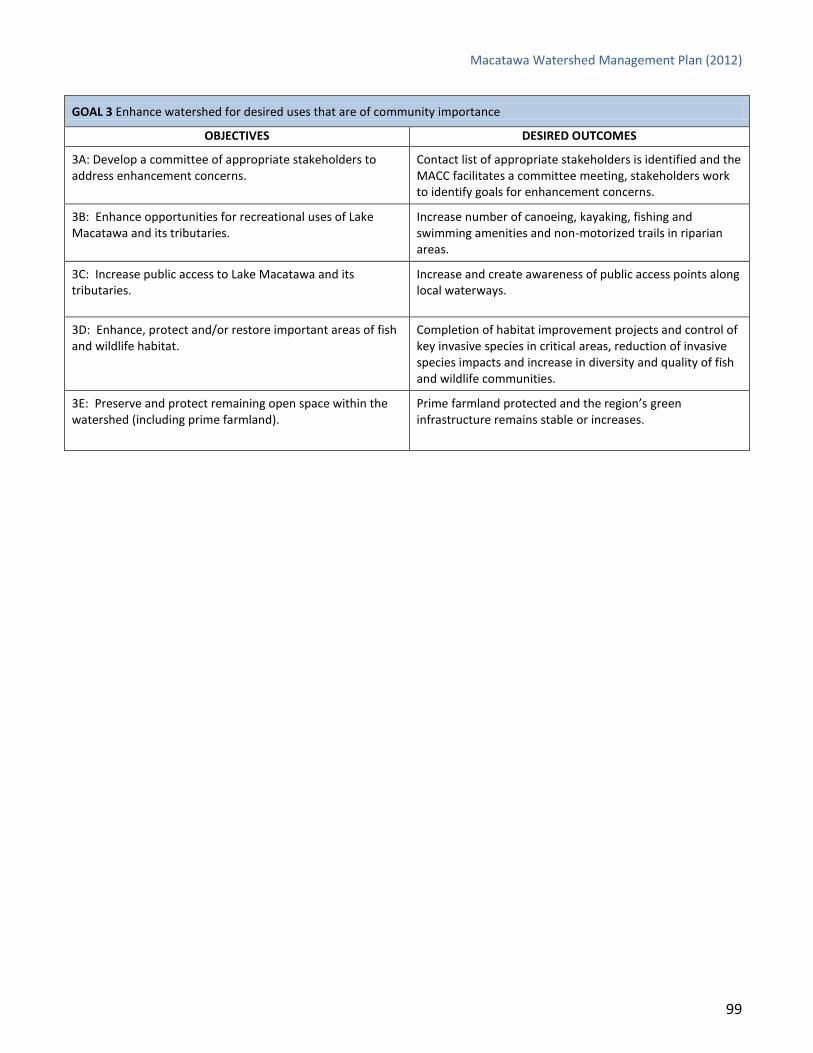
Macatawa Watershed Management Plan (2012)
99
GOAL 3 Enhance watershed for desired uses that are of community importance
OBJECTIVES DESIRED OUTCOMES
3A: Develop a committee of appropriate stakeholders to address enhancement concerns.
Contact list of appropriate stakeholders is identified and the MACC facilitates a committee meeting, stakeholders work to identify goals for enhancement concerns.
3B: Enhance opportunities for recreational uses of Lake Macatawa and its tributaries.
Increase number of canoeing, kayaking, fishing and swimming amenities and non-motorized trails in riparian areas.
3C: Increase public access to Lake Macatawa and its tributaries.
Increase and create awareness of public access points along local waterways.
3D: Enhance, protect and/or restore important areas of fish and wildlife habitat.
Completion of habitat improvement projects and control of key invasive species in critical areas, reduction of invasive species impacts and increase in diversity and quality of fish and wildlife communities.
3E: Preserve and protect remaining open space within the watershed (including prime farmland).
Prime farmland protected and the region’s green infrastructure remains stable or increases.
Macatawa Watershed Management Plan (2012)
100
4.2 CRITICAL AREAS OF THE WATERSHED
One of the last steps of prioritizing implementation activities is to spatially identify areas of critical
importance in relation to the goals of the watershed management plan (restoration, protection and
enhancement). The restoration and protection goals are most closely tied to water quality and
restoring designated uses in the Macatawa Watershed. A critical area analysis was completed to
identify critical restoration areas and critical protection areas.
FOR RESTORATION
The Macatawa Watershed is composed of relatively distinct urban and agricultural areas. Since the
best management practices that can typically be implemented in urban areas are very different from
those implemented in agricultural areas, two separate analyses were performed. The MACC, in
consultation with the various watershed committees, identified a host of variables to help identify the
most critical urban areas for restoration and the most critical agricultural areas for restoration. In
general the following factors were used to determine critical areas by calculating a score for each of
the 55 subwatersheds:
Percent (urban or agricultural) land
Percent (urban or agricultural) land within 200 ft of a waterway1
Percent impervious surface2
Percent soils with high potential for erosion1
Percent land with high risk for septic system failure1
Priority level for in-stream BMPs
Priority level for upland BMPs1
Runoff volume (inches)2
Percent increase in runoff volume from 1978-2005
Number of high risk road stream crossings
Total suspended solids loading (lbs/acre)
Percent wetland loss2
Percent poor riparian buffer1 1 Factors that were double-weighted in the agricultural critical area analysis 2 Factors that were double-weighted in the urban critical area analysis
For a complete description of the methodology of the critical areas analysis see Appendix M (FTCH
2011a). The resulting maps indicate high priority (red) and moderate priority (orange) zones for both
the critical agricultural areas (Figure 41) and the critical urban areas (Figure 42).

Macatawa Watershed Management Plan (2012)
101
Figure 41. Critical agricultural areas of the Macatawa Watershed (FTCH 2011a).
High Priority
•18,846 acres
•17%
Mod Priority
•15,976 acres
•15%
Low Priority
•74,891 acres
•68%
High Priority
•30,681 acres
•28%
Mod Priority
•40,052 acres
•36.5%
Low Priority
•38,981 acres
•35.5%
Critical Agricultural Areas Critical Urban Areas

Macatawa Watershed Management Plan (2012)
102
The most critical agricultural areas are scattered around the outside ring of the watershed in the Upper
Macatawa River subbasin and in the headwater areas of Noordeloos Creek, Peters Creek, the South
Branch of the Macatawa River and the North Branch of the Macatawa River (Table 23). In general these
areas are characterized by highly erodible soils, a large amount of cultivated land within 200 ft of
waterways, poor riparian buffers, elevated risk of septic system failure and a significant amount of
historical wetland loss.
Table 23. Summary of critical agricultural areas in the Macatawa Watershed.
No. Subwatershed Subbasin Area (acres)
3 Macatawa River at 72nd Avenue
Upper Macatawa
1,713
4 Macatawa River at I-196 Overpass 2,902
7 Hunderman Creek to Big Creek 2,298
10 Unnamed tributary to Peters Drain Peters Creek
2,326
12 Unnamed tributary to Peters Creek 2,503
14 Kleinheksel Drain to South Branch
South Branch Macatawa
2,868
15 Jaarda Drain to South Branch 2,413
16 South Branch Macatawa River to Jaarda Drain 1,652
18 East Fillmore Drain (including Eskes Drain) 2,605
20 Uppermost North Branch Macatawa River North Branch Macatawa
4,073
21 Vanderbie Drain and Rotman Drain 848
27 Bosch and Hulst Drain to Noordeloos Creek
Noordeloos Creek
2,727
28 Tributary to Bosch and Hulst Drain (Southwest of Blendon Drain)
1,754
Total 30,681
Table 24. Summary of critical urban areas in the Macatawa Watershed.
No. Subwatershed Subbasin Area (acres)
22 North Branch Macatawa River to Den Bleyker Drain North Brach Macatawa
1,290
23 Den Bleyker Drain 1,415
24 North Branch Macatawa River at M-40 1,314
30 Brower Drain to Hunters Creek Noordeloos
2,499
32 Cedar Drain to Noordeloos Creek 932
38 Drain #15 and #17 to Drain #40
Lower Macatawa
2,309
39 Drain #40 to Macatawa River 1,406
40 Macatawa River to Windmill Island 1,825
41 Maplewood Intercounty Drain to Macatawa River 1,603
47 Macatawa River marsh Lake Macatawa Direct Drainage
2,283
54 East Lake Macatawa Direct Drainage 1,969
Total 18,846
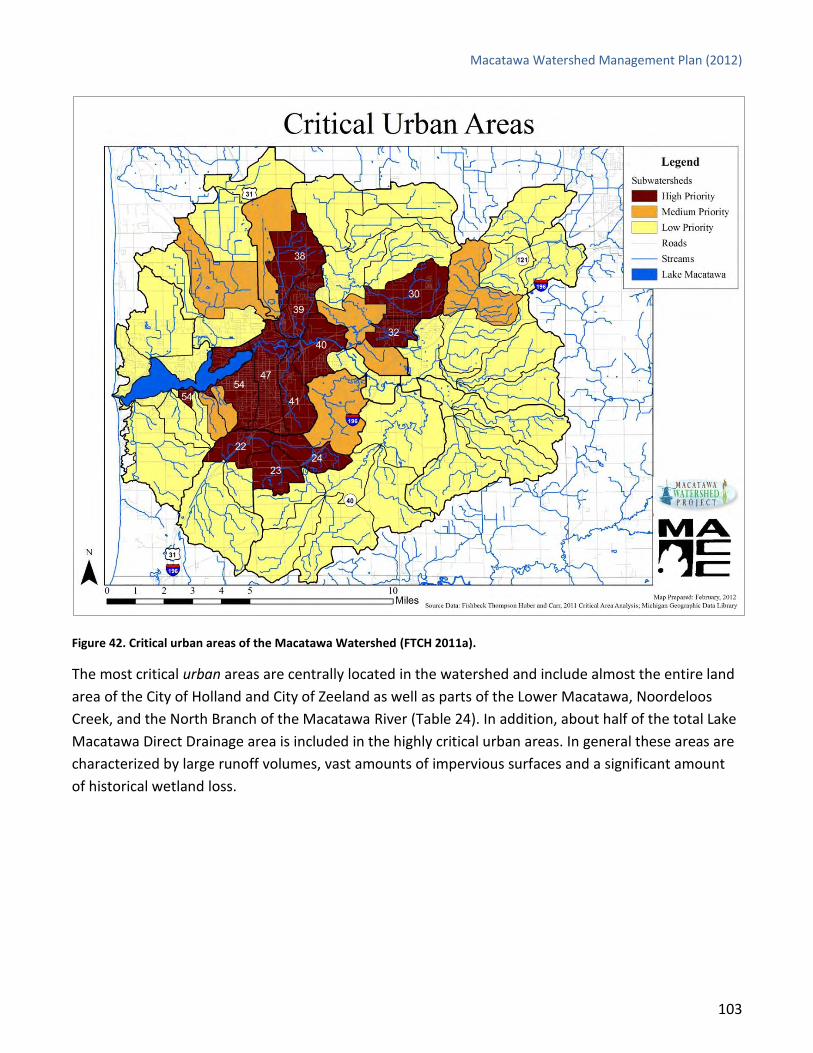
Macatawa Watershed Management Plan (2012)
103
Figure 42. Critical urban areas of the Macatawa Watershed (FTCH 2011a).
The most critical urban areas are centrally located in the watershed and include almost the entire land
area of the City of Holland and City of Zeeland as well as parts of the Lower Macatawa, Noordeloos
Creek, and the North Branch of the Macatawa River (Table 24). In addition, about half of the total Lake
Macatawa Direct Drainage area is included in the highly critical urban areas. In general these areas are
characterized by large runoff volumes, vast amounts of impervious surfaces and a significant amount
of historical wetland loss.
Macatawa Watershed Management Plan (2012)
104
FOR PROTECTION
The Macatawa Watershed has very few natural areas, including forest and wetland, remaining
compared to presettlement times. In fact, only about 15,422 acres of forested land and 551 acres of
wetlands remain (based on 2009 land use). Forests and wetlands have immense water quality benefits
because they can reduce storm water runoff and take up nutrients. Therefore, it is crucial that we
protect the remaining natural lands in the Macatawa Watershed.
The MACC, in consultation with the various watershed committees, identified a host of variables to
help identify the most critical areas for protection. In general the following factors were used to
determine critical protection areas by calculating a score for each quarter-quarter section of land in the
watershed (40 acre blocks):
Type of land cover (forest and wetland areas were scored highest)
Presence of a waterway
Potential presence of rare species (Biorarity index)
Development pressure
Proximity to already protected land
Groundwater recharge
Presence of prime farmland1 1 The presence of prime farmland decreased the value of land for protection
For a complete description of the methodology of the protection area analysis see Appendix N (Fraser
2010). The resulting map (Figure 43 and Table 25) indicates a range of recommended protection
priorities (from Tier 1 to Tier 5).

Macatawa Watershed Management Plan (2012)
105
Figure 43. Natural land protection priority map (Fraser 2010).

Macatawa Watershed Management Plan (2012)
106
Table 25. Summary of Tier 1 and Tier 2 natural land recommended for protection in the Macatawa Watershed.
Subwatershed Subbasins Tier 1 (acres) Total Tier 1 (acres) Tier 2 (acres) Total Tier 2 (acres)
1
Upper Macatawa
68
173
2
3
4
5
63
6
7
8
15
9 68 96
10
Peters Creek
100
69 11 41 40
12 18
13 41 29
14
South Branch
81
217
15
16
123
17 41
18
19 40 94
20
North Branch
30
30
96
328
21
22
23
40
24
25
192
26
Noordeloos Creek
80
120
27
14
28
2
29
30
31 46 98
32
33
34 35 6
35
Lower Macatawa
77
14
142
36
89
37
38
39
40 43 40
41 34
42
Pine Creek
40
40
282
43
6
44
20
45
86
46 40 130
47
Lake Macatawa Direct Drainage
43
689
199
758
48 129 314
49
50
51
52 40
53 442 224
54 9 1
55 26 20
Totals
1,166 1,166 2,089 2,089
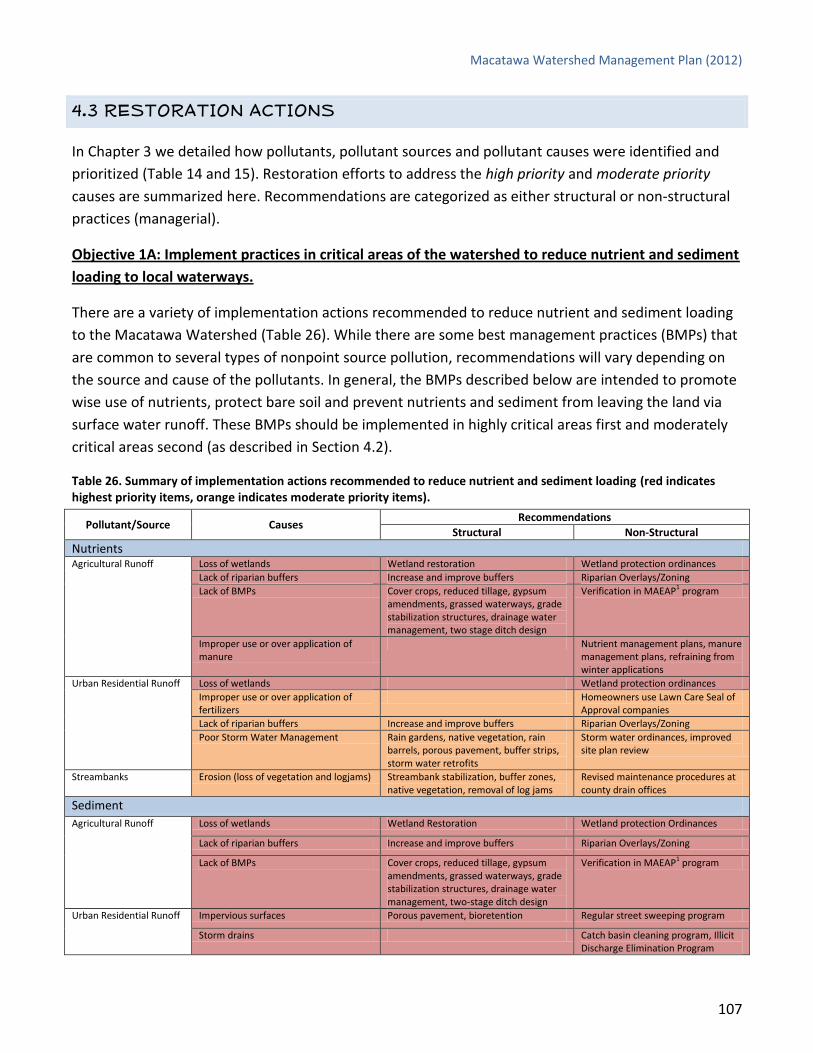
Macatawa Watershed Management Plan (2012)
107
4.3 RESTORATION ACTIONS
In Chapter 3 we detailed how pollutants, pollutant sources and pollutant causes were identified and
prioritized (Table 14 and 15). Restoration efforts to address the high priority and moderate priority
causes are summarized here. Recommendations are categorized as either structural or non-structural
practices (managerial).
Objective 1A: Implement practices in critical areas of the watershed to reduce nutrient and sediment
loading to local waterways.
There are a variety of implementation actions recommended to reduce nutrient and sediment loading
to the Macatawa Watershed (Table 26). While there are some best management practices (BMPs) that
are common to several types of nonpoint source pollution, recommendations will vary depending on
the source and cause of the pollutants. In general, the BMPs described below are intended to promote
wise use of nutrients, protect bare soil and prevent nutrients and sediment from leaving the land via
surface water runoff. These BMPs should be implemented in highly critical areas first and moderately
critical areas second (as described in Section 4.2).
Table 26. Summary of implementation actions recommended to reduce nutrient and sediment loading (red indicates highest priority items, orange indicates moderate priority items).
Pollutant/Source Causes Recommendations
Structural Non-Structural
Nutrients
Agricultural Runoff Loss of wetlands Wetland restoration Wetland protection ordinances
Lack of riparian buffers Increase and improve buffers Riparian Overlays/Zoning
Lack of BMPs Cover crops, reduced tillage, gypsum amendments, grassed waterways, grade stabilization structures, drainage water management, two stage ditch design
Verification in MAEAP1 program
Improper use or over application of manure
Nutrient management plans, manure management plans, refraining from winter applications
Urban Residential Runoff Loss of wetlands Wetland protection ordinances
Improper use or over application of fertilizers
Homeowners use Lawn Care Seal of Approval companies
Lack of riparian buffers Increase and improve buffers Riparian Overlays/Zoning
Poor Storm Water Management Rain gardens, native vegetation, rain barrels, porous pavement, buffer strips, storm water retrofits
Storm water ordinances, improved site plan review
Streambanks Erosion (loss of vegetation and logjams) Streambank stabilization, buffer zones, native vegetation, removal of log jams
Revised maintenance procedures at county drain offices
Sediment
Agricultural Runoff Loss of wetlands Wetland Restoration Wetland protection Ordinances
Lack of riparian buffers Increase and improve buffers Riparian Overlays/Zoning
Lack of BMPs Cover crops, reduced tillage, gypsum amendments, grassed waterways, grade stabilization structures, drainage water management, two-stage ditch design
Verification in MAEAP1 program
Urban Residential Runoff Impervious surfaces Porous pavement, bioretention Regular street sweeping program
Storm drains Catch basin cleaning program, Illicit Discharge Elimination Program

Macatawa Watershed Management Plan (2012)
108
Pollutant/Source Causes Recommendations
Structural Non-Structural Loss of wetlands Wetland protection Ordinances
Streambanks Erosion (loss of vegetation and logjams) Streambank stabilization, buffer zones, native vegetation, removal of log jams
Revised maintenance procedures at county drain offices
Road Stream Crossings Improper design, alignment, maintenance causing erosion
Replacement or correction of problem road stream crossings
1 MAEAP: Michigan Agricultural Environmental Assurance Program
Objective 1B: Implement practices in critical areas of the watershed to reduce storm water runoff to
local waterways.
There are a variety of implementation actions recommended to reduce storm water runoff and reduce
the harmful effects of extreme hydrology on the Macatawa Watershed (Table 27). While there are
some best management practices (BMPs) that are common to several types of nonpoint source
pollution, recommendations will vary depending on the source and cause of the pollutants. In general,
the BMPs described below are intended to promote infiltration of storm water on land, reduce storm
water velocities and remove “pinch points” along the stream channel. These BMPs should be
implemented in highly critical areas first and moderately critical areas second (as described in Section
4.2).
Table 27. Summary of implementation actions recommended to address hydrology (red indicates highest priority items, orange indicates moderate priority items).
Source Causes Recommendations
Structural Non-Structural
Hydrology
Agricultural Sources Drain tiles and other artificial drainage Two stage ditch design, drainage water management, gypsum amendments
Wetland loss Wetland restoration Wetland protection ordinances
Urban/Residential Sources
Impervious surfaces and Storm Drains Porous pavement, storm water detention/retention, conversion to native vegetation
Storm water ordinances
Wetland loss Wetland protection ordinances
Road Stream Crossings Improper design, alignment (hydraulics) Replacement or correction of problem road stream crossings
Objective 1C: Implement practices in critical areas of the watershed to reduce temperature stress in
local waterways.
There are a variety of implementation actions recommended to reduce temperature stress on the
waterways of the Macatawa Watershed (Table 28). In general, the BMPs described below are intended
to increase the length of stream that is protected by vegetation canopy cover and reduce storm water
runoff by promoting infiltration of storm water on land. These BMPs should be implemented in highly
critical areas first and moderately critical areas second (as described in Section 4.2).
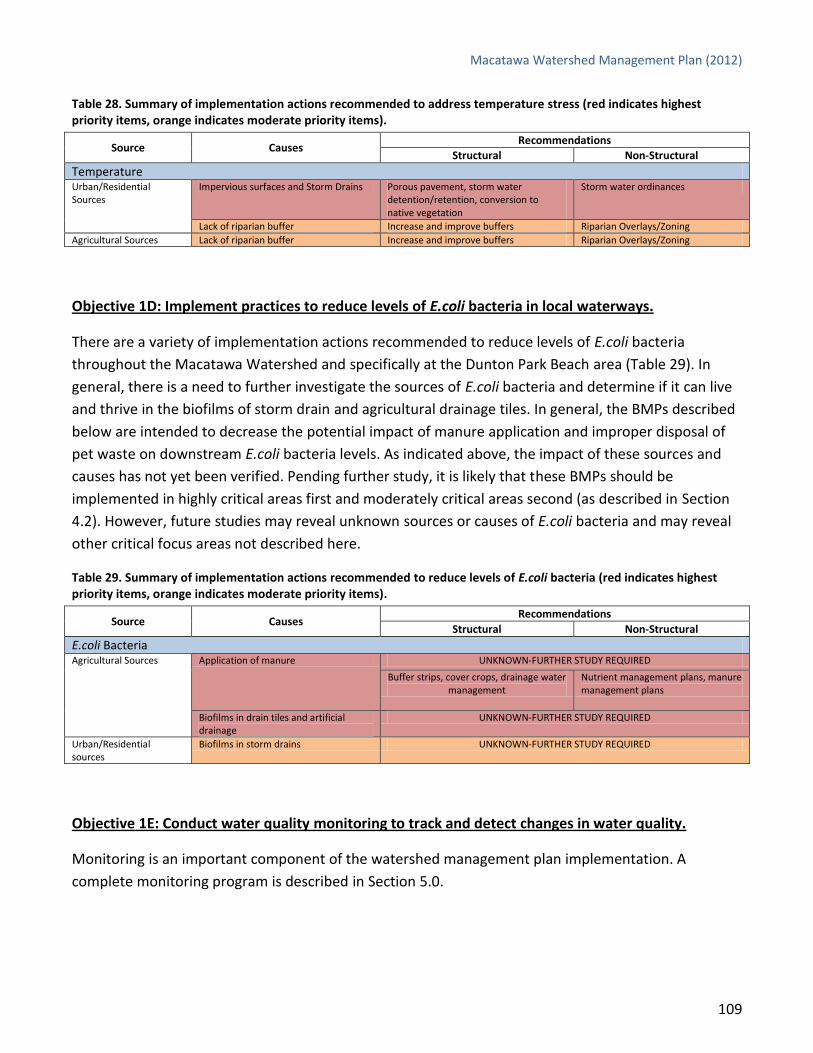
Macatawa Watershed Management Plan (2012)
109
Table 28. Summary of implementation actions recommended to address temperature stress (red indicates highest priority items, orange indicates moderate priority items).
Source Causes Recommendations
Structural Non-Structural
Temperature
Urban/Residential Sources
Impervious surfaces and Storm Drains Porous pavement, storm water detention/retention, conversion to native vegetation
Storm water ordinances
Lack of riparian buffer Increase and improve buffers Riparian Overlays/Zoning
Agricultural Sources Lack of riparian buffer Increase and improve buffers Riparian Overlays/Zoning
Objective 1D: Implement practices to reduce levels of E.coli bacteria in local waterways.
There are a variety of implementation actions recommended to reduce levels of E.coli bacteria
throughout the Macatawa Watershed and specifically at the Dunton Park Beach area (Table 29). In
general, there is a need to further investigate the sources of E.coli bacteria and determine if it can live
and thrive in the biofilms of storm drain and agricultural drainage tiles. In general, the BMPs described
below are intended to decrease the potential impact of manure application and improper disposal of
pet waste on downstream E.coli bacteria levels. As indicated above, the impact of these sources and
causes has not yet been verified. Pending further study, it is likely that these BMPs should be
implemented in highly critical areas first and moderately critical areas second (as described in Section
4.2). However, future studies may reveal unknown sources or causes of E.coli bacteria and may reveal
other critical focus areas not described here.
Table 29. Summary of implementation actions recommended to reduce levels of E.coli bacteria (red indicates highest priority items, orange indicates moderate priority items).
Source Causes Recommendations
Structural Non-Structural
E.coli Bacteria
Agricultural Sources Application of manure UNKNOWN-FURTHER STUDY REQUIRED
Buffer strips, cover crops, drainage water management
Nutrient management plans, manure management plans
Biofilms in drain tiles and artificial drainage
UNKNOWN-FURTHER STUDY REQUIRED
Urban/Residential sources
Biofilms in storm drains UNKNOWN-FURTHER STUDY REQUIRED
Objective 1E: Conduct water quality monitoring to track and detect changes in water quality.
Monitoring is an important component of the watershed management plan implementation. A
complete monitoring program is described in Section 5.0.

Macatawa Watershed Management Plan (2012)
110
Objective 1F: Investigate potential for Tier 3 pollutants to impact water quality.
As stated above, this watershed management plan is designed to address Tier 1 (nutrients, sediment,
hydrology, and temperature) and Tier 2 pollutants (E.coli bacteria) because these pollutants directly
impact impaired Designated Uses. There were a variety of other pollutants that were of concern, as
identified by members of the watershed committees. These Tier 3 pollutants include:
Invasive Species (KNOWN POLLUTANT)
Other chemical contaminants
Chloride
Man-made debris (trash)
Invasive species, which include both non-native plants and aquatic wildlife, are known to impact water
quality and habitat in the Macatawa Watershed. Invasive species were not listed as a Tier 1 or 2
pollutant because it is unlikely that invasive species are impacting attainment of Designated Uses in the
Macatawa Watershed. However, the control of invasive species is a desired goal of the watershed
management plan and will be addressed under Objectives 3D and 3E below. The extent and severity of
invasive species in the Macatawa Watershed is not fully documented and deserves further study.
The remaining Tier 3 pollutants (chemical contaminants, chloride and trash) may be problems in the
Macatawa Watershed. There is very little data concerning these pollutants. At this time, there are no
other pollutants that are known to be impacting attainment of Designated Uses. The extent and
severity of these potential pollutants in the Macatawa Watershed is not fully documented and
deserves further study.
This objective will be addressed in the long-term and is a secondary priority to the restoration actions
detailed for Objectives 1A-1D.

Macatawa Watershed Management Plan (2012)
111
4.4 IMPLEMENTATION OF BEST MANAGEMENT PRACTICES
The success of the watershed management plan depends upon implementation of many structural and
non-structural BMPs. In the previous section, a range of BMPs were prioritized and tied to specific
pollutant sources and causes. These BMPs are intended to help meet the first goal of the watershed
management plan which is restoration of water quality. Refer to Appendix O for detailed pollutant load
reductions for each recommended practice. Refer to Appendix P for a proposed implementation
schedule of restoration activities, interim measurable milestones and estimated implementation costs.
WETLAND RESTORATION
The MDEQ conducted a Landscape Level Functional Wetlands Assessment for the Macatawa
Watershed in 2009 (Appendix Q). The study indicated that the Macatawa Watershed has lost 86% of its
original wetlands. The water quality benefits of wetlands are numerous and well documented.
Wetland restoration has been shown to be an effective practice for reducing storm water flows,
reducing water velocities and capturing nutrients and sediment. In addition, wetlands provide crucial
habitat to birds, fish and other wildlife. This practice should be very applicable in the Macatawa
Watershed because of the high capacity for wetland restoration and the presence of an estimated
21,070 acres suitable for restoration (Table 30). The land areas with the highest potential for successful
wetland restoration projects were wetlands in presettlement times and are still characterized by hydric
soils today (Figure 44).
Table 30. Summary of potential wetland restoration in the Macatawa Watershed.
Subbasin High Potential for
Restoration (acres) Moderate Potential for
Restoration (acres) Total Restoration Potential (acres)
Noordeloos Creek 2,036 2,580 4,616
Upper Macatawa 1,583 1,091 2,674
South Branch Macatawa 1,582 1,502 3,084
Pine Creek 1,503 2,336 3,839
Lower Macatawa 659 1,628 2,287
North Branch Macatawa 645 2,024 2,669
Lake Macatawa Direct Drainage 85 921 1,006
Peters Creek 0 896 1,080
Totals 8,093 12,977 21,070

Macatawa Watershed Management Plan (2012)
112
Figure 44. Potential wetland restoration in the Macatawa Watershed.
Wetland restoration is most feasible in critical agricultural areas that are currently undeveloped. With
the help of MDEQ, we estimated that we should aim to restore approximately 50% of the total high
potential acres in the most critical agricultural areas (4,050 acres). One of the biggest obstacles to
implementing wetland restoration is acquiring land or landowner permission. Therefore wetland
restoration in critical urban areas is likely prohibitive. If wetland restoration opportunities arise in
critical urban areas or moderately critical agricultural areas, we would certainly support such a project
and consider it a high priority for implementation.
ESTIMATED ANNUAL LOAD REDUCTION*: 3,755 lbs P, 13,285 lbs N, 1,927 tons Sediment
* Load reductions were calculated using the EPA’s STEPL Model (Appendix O).

Macatawa Watershed Management Plan (2012)
113
TRADITIONAL AGRICULTURAL BEST MANAGEMENT PRACTICES
The Macatawa Watershed is predominantly agricultural with an expansive amount of land categorized
as prime farmland (Figure 13). Farmland has the potential to contribute a significant amount of
nutrients and sediment via overland flow, depending on its soil type, slope and management practices.
There are many traditional agricultural BMPs that are effective for reducing soil erosion and surface
water runoff. These BMPs include grassed waterways, buffer strips, cover crops, reduced or
conservation tillage, grade stabilization structures, and critical area plantings among others. Several
agricultural areas of the watershed were evaluated for BMP needs by the Allegan Conservation District
by conducting in-depth field inventory (Allegan Conservation District 2011). The Allegan Conservation
district used these field inventories to extrapolate recommendations to other areas of the watershed.
The focus area for agricultural BMPs is in highly and moderately critical agricultural areas. See
Appendix R for a copy of the agricultural inventory reports conducted by the Allegan Conservation
District in 2002 and 2010. Refer to Appendix O for a detailed list of pollutant load reductions for
traditional agricultural BMPs as described here.
ESTIMATED ANNUAL LOAD REDUCTION*: 66,184 lbs P, 137,909 lbs N, 48,909 tons Sediment
* Load reductions were calculated by Allegan Conservation District using RUSLE and MDEQ’s Pollutant Loading Spreadsheet (Appendix O).
Macatawa Watershed Management Plan (2012)
114
NON-TRADITIONAL AGRICULTURAL BEST MANAGEMENT PRACTICES
In this predominantly agricultural watershed it is important to consider non-traditional agricultural
BMPs to maximize the possibility of successful implementation. Therefore, under this plan we will
consider implementation of drainage water management, gypsum amendments and two stage ditch
design in addition to the BMPs described above. Furthermore, we intend to remain flexible in our
implementation strategy and will consider other new and emerging technologies that are effective in
reducing nonpoint source pollutants as they become available in the future. The focus area for non-
traditional agricultural BMPs is in highly and moderately critical agricultural areas. Refer to Appendix O
for a detailed list of pollutant load reductions for non-traditional agricultural BMPs as described here.
Drainage Water Management
Agricultural drainage water management can be used with traditional agricultural systems and is
somewhat of a retrofit for heavily tiled areas. It reduces surface and subsurface runoff by reducing flow
from agricultural drainage tiles during times of the year when drainage is not necessary (Agricultural
Drainage Management Coalition 2006). In-line control structures can be inserted into drainage pipes
to allow the farmer to periodically adjust the height at which the water table triggers drainage. The
ability to control drainage height enables the farmer to respond to crop needs and reduces the amount
of nitrate and phosphorus (and possibly E.coli bacteria) that escape from the field (Fertilizer Institute
2012, LaLonde et al. 1996).
The water table level may be set high during winter or other periods when crops are not growing,
decreasing the loss of water and nutrients from the field. In spring, the water level may be lowered
enough for planting, while during the growing season farmers are able to make adjustments for
weather conditions. It’s effectiveness at intercepting nutrients is related to the reduced flow and the
amount of dissolved nutrients available for transport. Nitrogen is readily transportable and research
indicates that a general reduction expectation of 16 pounds of nitrate nitrogen can be retained per
acre per year in a typical system (based on retaining 40% of the typical season’s drainage water in the
soil profile). Reduction in the loss of soluble phosphorus has not been sufficiently studied. However,
given the high levels of phosphorus in typical soils in the Macatawa Watershed, some degree of
reduction should be expected. Research indicates that nitrogen and phosphorus may be reduced by
30-50% (Evans et al. 1995).
The goal of this plan is to implement drainage water management systems on approximately 50% of
the drained acres in highly critical subwatersheds (5,298 acres). We assumed a conservative reduction
of nutrients of 30% and a negligible removal of sediment.
ESTIMATED ANNUAL LOAD REDUCTION*: 2,103 lbs P and 9,050 lbs N
* Load reductions were calculated using EPA’s STEPL Model (Appendix O).

Macatawa Watershed Management Plan (2012)
115
Gypsum Amendments
Gypsum or calcium sulfate dehydrate, is a mineral that can be added to heavy soils as a soil
conditioner. It has been shown to improve plant growth and crop yields while reducing phosphorus
losses by directly reducing solubility of phosphorus and by reducing losses of soils containing bound
phosphorus (Fisher 2011). The material also substantially increases infiltration which should reduce
secondary erosion losses due to flowing water by reducing peak stream flows if the material was used
on a substantial proportion of agricultural land in a watershed. The calcium in gypsum also helps clay
particles aggregate together by displacing less favorable cations which cause the particles to repel each
other (Chen and Dick 2011, Favoretto et al. 2006, Fisher 2011, Norton 2006). This improves soil
stability and drainage.
Therefore, gypsum amendments may be effective at reducing runoff, and therefore sediment and
phosphorus loading from agricultural land within the Macatawa Watershed. The goal of this plan is to
treat approximately 50% of the agricultural land in highly critical subwatersheds (10,465 acres). We
assumed a conservative reduction of phosphorus and sediment of 30% (Stout et al. 1999). However,
we were unable to confirm any research to estimate nitrogen reductions.
ESTIMATED ANNUAL LOAD REDUCTION*: 3,381 lbs P and 1,595 tons sediment
* Load reductions were calculated using EPA’s STEPL Model (Appendix O).
Two Stage Ditch Design
The Macatawa Watershed is a heavily drained basin, which has made available an abundant amount of
prime farmland. Many of the waterways that make up the drainage system of the Macatawa
Watershed are artificially constructed county-owned or private drains. These drains are typically
constructed in deep trapezoid-shaped channels characterized by steep banks (Dierks 2010). Much of
the time water flow is low to non-existent in some places. However, during storm events water runs
off the land quickly and water velocities in these straight, confined channels is intense with the
potential to cause great destruction. Bank erosion, scouring, sediment build-up and periodic flooding
are prevalent and indicate that water drainage is a problem. The two-stage ditch design describes an
alternative method for constructing artificial drainage systems in primarily agricultural settings.
The design of a two-stage ditch incorporates a floodplain zone, called benches, into the ditch by
significantly widening stream banks and creating a low-flow channel in the bottom center. This allows
the water to have more area to spread out on and decreases the velocity of the water flowing in the
main channel. This not only improves the water quality, but also improves the biological conditions of
the ditches where this is located. Research has shown that two-stage ditches can remove between 3%
and 27% of sediment, 10% to 40% of total phosphorus and 1% to 45% of nitrogen (Dierks 2010). The

Macatawa Watershed Management Plan (2012)
116
two-stage design improves ditch stability by reducing water flow and the need for maintenance, saving
both labor and money.
The goal of this plan is to reconstruct approximately 20% of the current traditional county-owned and
private drains in highly critical subwatersheds (10,465 acres). We assumed a median reduction of
sediment (15%), phosphorus (25%) and nitrogen (23%) respectively. We also assumed that two-stage
ditches will reduce pollutant loading from streambank erosion and surface runoff.
ESTIMATED ANNUAL LOAD REDUCTION*: 9,191 lbs P, 43,432 lbs N and 1,448 tons sediment
* Load reductions were calculated using EPA’s STEPL Model (Appendix O).
URBAN STORM WATER PRACTICES
Approximately 33% of the Macatawa Watershed is characterized as urban or built-up land which
includes the urban city center as well as the less densely populated suburban areas. Urban areas have
a high percentage of impervious surfaces including roads, parking lots, sidewalks, driveways and roofs,
which create a large volume of storm water runoff. There are many urban BMPs that are effective for
reducing storm water runoff and its associated nutrient and sediment load. Some of these BMPs can
be used in storm water retrofitting (implementing storm water practices where previous practices
were non-existent or ineffective). These urban BMPs include bioretention (such as rain gardens),
extended detention, wet ponds, infiltration practices (such as infiltration trenches), rain barrels, native
vegetation, highly engineered filtration practices, buffer strips, porous pavement, and increasing the
urban tree canopy. These practices and others are considered effective low impact development
practices and they can be implemented in a variety of ways in municipal, commercial, industrial and
residential land uses. The focus area for urban BMPs is in highly critical urban areas. All of the above
practices will be considered as feasible and prudent goals of the watershed management plan.
Pollutant load reduction estimates will be calculated on a site-specific basis as projects become
available for practices that are highly site-specific (such as extended detention, wet ponds, infiltration
trenches, highly engineered filtration practices). Pollutant load reduction estimates for other, more
broadly applicable practices are included below (Table 31).

Macatawa Watershed Management Plan (2012)
117
Table 31. Estimated pollutant reduction goals for urban best management practices.
BMP Targeted Pollutants Goals Total Acres Calculated Pollutant Load Reductions
Sediment (tons/yr)
P (lbs/yr) N (lbs/yr)
Rain Gardens Nutrients Hydrology
Temperature
25% SF (1058 ac) 25% INST (231 ac) 25% COMM (539 ac) 25% MF (222 ac)
Of land in highly critical urban areas
2,050 STEPL MODEL (using bioretention BMP)
0 866 3,204
Turf Grass Converted to Native Vegetation
Nutrients Hydrology
10% COMM (215 ac) 10% IND (264 ac) 10% INST (81 ac) 25% SF (1058 ac) 25% MF (223 ac
Of land In highly critical urban areas
1,841 STEPL MODEL (using vegetated filter strip BMP)
106 474 2,626
Porous Pavement
Nutrients Sediment Hydrology
10% INST (81 acres) 10% IND 9265 acres)
Of land in highly critical urban areas
345 STEPL MODEL (using porous pavement BMP) 43 215 1,744
Rain Barrels Nutrients Hydrology
5,000 barrels In highly critical urban
areas
NA Chesapeake Bay Model1
Negligible 50 500
Buffer Strips (see Figure 45) ** includes natural shoreline projects
Nutrient Sediment Hydrology
Temperature E.coli bacteria
100% COMM (11.9 ac) 100% IND (8.1 ac) 100% INST (1.9 ac) 100% MF (3.1 ac) 100% SF (12 ac)
Of identified poor buffers in highly critical
urban areas2
31.5 STEPL MODEL (using filter/buffer strip BMP)
2 7 46
Increase Urban Tree Canopy3
Nutrients Sediment Hydrology
Temperature
6,000 tree planted In highly critical urban
areas
NA Chesapeake Bay Model4 and EPA STEPL Model
11 180 (over a 20
year period)
1,200 (over a 20
year period)
Totals 162 1,792 9,320
SF: single family residential land use INST: institutional land use COMM: commercial land use MF: multi-family residential land use IND: industrial land use 1: Chesapeake Bay Model assumes 0.1 pounds of phosphorus is removed annually by a single rain barrel, negligible phosphorus removal 2: Assumed 20 ft wide buffers on one side of the waterway only 3: Estimates should be refined after a tree canopy analysis is completed 4: Chesapeake Bay Model assumes one tree can reduce 30,000 gallons of water over the first 20 years of its life and reduce 0.03 lbs of P and 0.2 lbs N over that time period

Macatawa Watershed Management Plan (2012)
118
Figure 45. Poor riparian buffers in the Macatawa Watershed (FTCH 2011).
The figure above denotes the location of waterways within the Macatawa Watershed that suffer from
inadequate or “poor” riparian buffers (FTCH 2011). These areas would be prime candidates for buffer
strip projects and/or conservation easements.

Macatawa Watershed Management Plan (2012)
119
STREAMBANK STABILIZATION
There is a total of 1,716,912 ft of waterway in the Macatawa Watershed and data that shows that
approximately 27% (469,050 ft) is eroding (FTCH 2011, Table 32). Best professional judgement was
used to develop a goal to stabilize 35% of the total eroding streambank (79,503 ft) in three of the most
critical subbasins for instream erosion (South Branch Macatawa, North Branch Macatawa and Lake
Macatawa Direct Drainage) and 15% of the total eroding streambank (21,390 ft) in other subbasins of
lesser concern (Noordeloos Creek, the Upper Macatawa and Peters Creek). Streambank stabilization
projects may include repair of problem road stream crossings and removal of large log jams. There is a
total of 622 road stream crossings in the Macatawa Watershed and we have data that shows that
approximately 10% (62) likely show a high risk for bank erosion and 39% (243) likely show a moderate
risk of bank erosion (MACC 2009; Bank Erosion Hazard Index). The goal is to repair at least 30% of the
total high risk road stream crossings (19) and 10% (24) of the moderate risk crossings with a special
focus on those located in critical agricultural and urban subwatersheds.
Table 32. Estimated pollutant load reductions for streambank stabilization projects.
Estimated Load Reduction
Subbasin Eroding streambank
(ft) Restoration
Goal TP
(pounds) TSS
(tons) Nitrogen (pounds)
South Branch Macatawa1 87,000 30,450
(35%) 435 435 870
North Branch Macatawa1 63,000 22,050
(35%) 395 395 865
Lake Macatawa Direct Drainage
2
77,150 27,003 (35%)
356 356 711
Noordeloos Creek1 68,000 10,200
(15%) 143 143 285
Upper Macatawa2
74,600 11,190 (15%)
65 65 131
Peters Creek2 46,700 7,005 (15%) 57 57 113
Total 469,050 107,898 1,451 1,451 2,975
See Appendix L for a copy of the Geomorphology Report and for a description of several highly critical
streambank erosion sites recommended for immediate stabilization. See Appendix C for a copy of the
2009 Back Erosion Hazard Risk Study.

Macatawa Watershed Management Plan (2012)
120
NON-STRUCTURAL BMPS
The following non-structural BMPs are proposed to support implementation of the structural BMPs.
Pollutant load reductions from these practices are difficult, if not impossible to estimate. We believe
that it is not prudent and/or feasible to calculate pollutant load reductions from such practices
(SWMPC 2008). Instead, pollutant load reductions should be calculated on a case by case basis when
project specific details become available. Consult Appendix P for a schedule of implementation.
Wetland protection ordinances:
Very little wetlands remain in the Macatawa Watershed compared to presettlement times. Wetlands
are primarily threatened by development so one way to ensure long term wetland protection is by
enacting wetland ordinances. These ordinances should be implemented by local units of government
to protect and preserve wetlands by changing the way development is permitted in these areas and by
disallowing certain destructive activities. These rules keep wetlands from being destroyed and help
developers to work around wetlands so they can continue to filter and improve water quality (SEMCOG
2008). Wetland protection ordinances should be enacted throughout the Macatawa Watershed
because all remaining wetlands are critical for water quality, due to historic losses. The focus will be to
implement wetland protection ordinances in local units of government that contain highly critical
urban and/or agricultural areas.
Riparian zoning overlays/conservation easements:
Riparian zones include land that directly borders waterways. Land practices in riparian zones are
important because of their proximity to the water and potential to directly impact (or protect) water
quality. Conservation easements enhance water quality protection via permanent protection of these
sensitive areas, increasing greenbelts along waterways and limiting future development or destruction
that can occur in these areas. Riparian zoning overlays enhance protection of waterways and water
quality by encouraging greenbelts along stream corridors by implementing building setbacks and open
space requirements along the water’s edge (SEMCOG 2008). These types of best management
practices provide local waterways with protection from nonpoint source pollution by reducing runoff,
providing room for flooding, protecting streambanks from erosion, and allowing for adequate tree
canopy or other natural plant cover. These practices would be most useful in the riparian zones of the
watershed. The focus will be to implement riparian zoning overlays or ordinances, or purchase
conservation easements, in areas located in highly critical urban and/or agricultural areas.
Storm water ordinances:
Planning for storm water treatment is usually conducted during the beginning phases of new
development projects. However, one of the most important aspects of storm water treatment and
ensuring long term effectiveness of BMPs is proper operation and maintenance. Storm water
Macatawa Watershed Management Plan (2012)
121
ordinances can be enacted by local units of government to guide proper design and installation of
storm water practices and to mandate that these practices are properly maintained. Ordinances focus
on the design, construction, maintenance, and inspections of storm water BMPs. The focus will be to
implement storm water ordinances in local units of government that contain highly critical urban
and/or agricultural areas.
Site Plan review/Development criteria:
Development of natural areas such as forest, wetlands and open lands increase impervious surfaces.
Unless mitigating designs and practices are employed, storm water runoff and peak flows are
increased. Development plans are typically reviewed and approved at the local unit of government.
Site plan review is highly dependent on the strength of the development and zoning ordinances in a
particular municipality. One goal of this watershed management plan is to review and make
recommendations for improving the strength of the ordinances and development criteria that protect
natural lands and limit storm water runoff (discussed above) in the Macatawa Watershed. Improving
the site plan review process is a complimentary task.
Effective site plan review should include efforts to minimize soil compaction, minimize total disturbed
area, protect natural flow pathways, protect riparian buffers and sensitive areas, reduce impervious
surfaces and disconnect storm water by routing it to natural infiltration areas (SEMCOG 2008).
Street Sweeping and Catch Basin Cleaning:
Street sweeping and catch basin cleaning are pollution prevention activities currently being conducted
by local units of government that are regulated by NPDES Storm Water Permits. Regular street
sweeping along paved roads collects litter, sediment, and pollutants that build up on the road ways
and prevents it from running off into nearby waterways. Catch basins are used in storm drains inlets to
catch debris, chemicals, trash, sediment, leaves, and other pollutants in order to keep the material out
of waterways. The goal of this watershed management plan is to support continued implementation of
these important pollution prevention activities while evaluating and improving the timing, frequency
and location of such practices. The focus will be to implement improved street sweeping and catch
basin activities in local units of government that contain highly and moderately critical urban areas.
Illicit Discharge Elimination Program:
Eliminating illicit discharges to storm drains is a pollution prevention activity that is currently being
conducted by local units of government that are regulated by NPDES Storm Water Permits. Storm
drains and storm drain outfalls are periodically monitored for indicators of pollutants including
wastewater, septic system drainage, illegal dumping, sump pumps and/or grey water discharge.
Conducting a regular screening process for illicit discharges leads to prompt remediation which can
reduce input of nonpoint source pollutants into the Macatawa Watershed. The goal of this watershed

Macatawa Watershed Management Plan (2012)
122
management plan is to support continued implementation of local Illicit Discharge Elimination
Programs (IDEP) while evaluating and improving the timing, frequency and location of such practices.
The focus will be to implement improved IDEP activities in local units of government that contain
highly critical urban and agricultural areas.
Lawn Care Seal of Approval Companies:
Urban and suburban areas in the Macatawa Watershed are usually characterized by high amounts of
impervious surfaces and turf grass. Turf grass (lawns) is a high maintenance land cover that requires
regular cutting, fertilizing and irrigation. All of these practices have the potential for negative water
quality impacts via improper disposal of grass cuttings, over-fertilization and over watering. There are
several ways to reduce impacts from the vast amount of turf grass in the Macatawa Watershed. A long
term goal should be improving soil health in turf grass settings to improve infiltration, water holding
capacity and plant health in order to reduce fertilizer, pesticide and irrigation inputs. Conversion of turf
grass to native vegetation is a structural practice discussed above, and educating homeowners on
proper lawn care is a goal of the Information and Education Strategy (Appendix B). Another goal of this
watershed management plan is to encourage landowners to employ lawn care and landscaping
businesses that use watershed-friendly practices. The MACC operates a Lawn Care Seal of Approval
Program which certifies such companies and works to continually educate these companies on water
quality concerns. Most importantly, these companies have agreed to abide by the applicable county
Phosphorus Fertilizer Ordinances, conduct soil tests, keep grass clippings out of the waterways, mow
grass no shorter than 3 inches to encourage good root development and refrain from fertilizing a three
foot buffer along waterways. The focus will be to promote and increase use of Lawn Care Seal of
Approval Companies in highly and moderately critical urban areas.
MAEAP Verification:
The Macatawa Watershed is predominantly agricultural with many large row crop and livestock
operations. The State of Michigan operates a program that helps farmers reduce environmental risks
on their farms. It’s called Michigan’s Agriculture Environmental Assurance Program (MAEAP) and it’s a
voluntary program meant to promote conservation and reduce agricultural pollution. Interested
farmers go through an extensive farm review with technical assistance from local conservation district
staff. The review process results in a list of actions that the farmer needs to implement in order to
become MAEAP-verified. Producers are provided with a plan that will maintain a productive farming
system while reducing pollution. Depending on each specific case, there is potential for significant
reductions in sediment and nutrient runoff resulting from MAEAP-verification (Department of
Agricultural & Rural Development). The focus will be to promote and increase participation in MAEAP
in all agricultural areas.

Macatawa Watershed Management Plan (2012)
123
Manure Management
Research has shown that the Macatawa Watershed is a storm event and snow melt-driven system
(Fongers 2009 Hydrology Report, Appendix I), which indicates that most nonpoint source pollutants are
carried to waterways via overland flow from rain events and during snowmelt. Since the Macatawa
Watershed has abundant livestock operations there is a constant need to dispose of animal manure by
spreading it on cropland. The constant spreading of manure presents a significant risk of nutrient
runoff to, and possibly bacterial contamination of, local surface waters. At a minimum, we recommend
that farmers follow conventional standards outlined in GAAMPs (Generally Accepted Agricultural
Management Practices, MDARD 2012) and CAFO (Confined Animal Feeding Operations) permits. There
are several other ways to reduce pollution risks from manure application including developing nutrient
or manure management plans and refraining from spreading manure in the winter altogether. We
believe these actions are crucial to properly managing the effects of manure application in the
Macatawa Watershed. The focus will be to increase development of nutrient/manure management
plans and limit winter application in all agricultural areas.
Drain Maintenance Procedures
We estimate that approximately 50% of waterways in the Macatawa Watershed are designated as
county drains. County drains are actively managed and maintained by County Drain Commissioners to
facilitate drainage and reduce flooding. Typical maintenance activities include periodically removing
riparian vegetation and accumulated sediment. Sediment removal is accomplished with heavy
machinery that scoops out these deep, steep channels, often leaving bare stream bottoms and bare
streambanks behind. Removal of in-stream and riparian vegetation has the potential to increase
erosion and downstream sedimentation while elevating water temperatures. The goal of this plan will
be to work cooperatively with County Drain Commissioners to revise maintenance procedures in a way
that will be less harmful to downstream surface water quality. The focus will be to implement revised
maintenance procedures first in highly critical agricultural and urban areas.

Macatawa Watershed Management Plan (2012)
124
4.5 PROTECTION ACTIONS
The ultimate goal of the watershed management plan is restoration of water quality (described above).
A secondary goal is protection of current natural land in the watershed including forest and wetlands.
This section describes the actions that will be taken to meet Protection Objectives 2A through 2D.
Refer to Appendix P for a description of interim milestones and estimated costs.
Objective 2A: Provide Conservation Priority Map to appropriate stakeholders to target Tier 1 areas
for protection opportunities.
The MACC commissioned the development of a Conservation Priority Analysis (see Section 4.2) in 2009
(Fraser 2010, Appendix N) which identifies and prioritizes land for protection. There is approximately
1,200 acres of natural land that is a high priority (Tier 1) for protection. The MACC will identify
appropriate stakeholders and convene an informational meeting to distribute copies of the
Conservation Priority Map.
Potential partners include the local units of government, churches, schools, commercial and industrial
businesses, the Land Conservancy of West Michigan, Outdoor Discovery Center Macatawa Greenway
and DeGraaf Nature Center.
Progress towards meeting this objective will be measured by timely completion of the interim
milestones (Appendix P) and the following indicators:
Increased awareness of the Conservation Priority Analysis and high quality natural land.
No net loss of wetlands and forested land areas.
Increase in permanently protected natural land.
Objective 2B: Work with local units of government to integrate recommendations from the
Conservation Priority Map into master plans.
Local units of government have a large influence on land cover and land use through the
implementation of zoning ordinances and master plans. Under Objective 2A all local units of
government will receive a copy of the Conservation Priority Analysis. The focus of Objective 2B will be
to inventory current protection efforts through the watershed and improve protection efforts in areas
where Tier 1 and Tier 2 land has been identified by the Conservation Priority Map. This will require the
help of local experts who can provide technical assistance to local units of government to revise
planning standards and criteria.
Progress towards meeting this objective will be measured by timely completion of the interim
milestones (Appendix P) and the following indicators:
Increased number of local units of government with formal protection efforts in effect.

Macatawa Watershed Management Plan (2012)
125
Objective 2C: Work with private landowners to implement conservation easements to protect high
quality natural areas.
Many of the high quality natural areas in the Macatawa Watershed are privately owned. Landowners
should be made aware of the presence and value of natural land and the protection methods that can
be utilized to permanently preserve these areas. This will require widespread distribution of
informational material relating to the value of natural land and how to implement conservation
easements. The MACC will partner will appropriate local stakeholders to hold informational meetings
for targeted landowners and provide technical assistance to interested individuals. Technical assistance
will likely take the form of targeted mailings with specially developed informational pieces, followed by
phone calls and then personal, confidential visits.
Potential partners include the Land Conservancy of West Michigan, conservation districts, local units of
government and the Outdoor Discovery Center Macatawa Greenway.
Progress towards meeting this objective will be measured by timely completion of the interim
milestones (Appendix P) and the following indicators:
Increase in the number of conservation easements achieved within the watershed
Conservation easements will be used to permanently protect high quality natural areas (as identified
by Fraser 2010 in Appendix N) in highly and moderately critical urban and agricultural areas (see
Section 4.2).
Objective 2D: Identify unique and valuable protection sites that are not reflected in the Tier 1
locations identified in the Conservation Priority Map.
The Conservation Priority Analysis was completed by a private consultant using the mapping
capabilities of a Geographic Information System (Fraser 2010). Only land characteristics that could be
readily mapped where considered in this analysis. Larger expanses of natural land inherently earned
more points and are more likely to be captured in Tier 1 and Tier 2 protection areas than smaller areas.
We recognize that some high quality, unique natural areas may not be identified on the Conservation
Priority Map but may still be important to protect. It is important to identify these areas and
implement protection efforts when the opportunity arises. The MACC will work to identify other
unique and valuable protection sites that may occur throughout the Macatawa Watershed.
Potential partners include knowledgeable community members, local units of government, Hope
College, Outdoor Discovery Center Macatawa Greenway, DeGraaf Nature Center and the Land
Conservancy of West Michigan.

Macatawa Watershed Management Plan (2012)
126
Progress towards meeting this objective will be measured by timely completion of the interim
milestones (Appendix P) and the following indicators:
Number of specific new sites identified and prioritized for protection
Creation of an updated Conservation Priority Map
4.6 ENHANCEMENT ACTIONS
The third goal of the watershed management plan is enhancing the watershed for recreation, open
space, public access and fish and wildlife habitat. This section describes the actions that will be taken
to meet Enhancement Objectives 3A through 3E. Refer to Appendix P for a description of interim
milestones and estimated costs.
Objective 3A: Develop a committee of appropriate stakeholders to address enhancement concerns.
The main goal of this watershed management plan is to restore water quality to meet state water
quality standards. However, there are many other watershed issues of community concern that do not
directly relate to water quality. These include recreational activities, public access, open space and fish
and wildlife habitat and are commonly referred to as Desired Uses. The Macatawa Watershed Project
is partially supported by funds from local units of government and we feel that is important to address
these concerns, in addition to traditional water quality issues.
Accomplishing this objective will require input from a broad range of partners and development of an
action plan. Potential partners include the Outdoor Discovery Center Macatawa Greenway, DeGraaf
Nature Center, Macatawa Watershed Association, Ottawa and Allegan County Parks, local units of
government, marinas, and local fishing/canoeing outfitters.
Progress towards meeting this objective will be measured by timely completion of the interim
milestones (Appendix P) and the following indicators:
Development of an action plan
Development of an Enhancement Committee
The Enhancement Committee will develop a way to track implementation of the following objectives
and create a list of Indicators of Success (to be added to Appendix U) to track success of Enhancement
Actions over time.
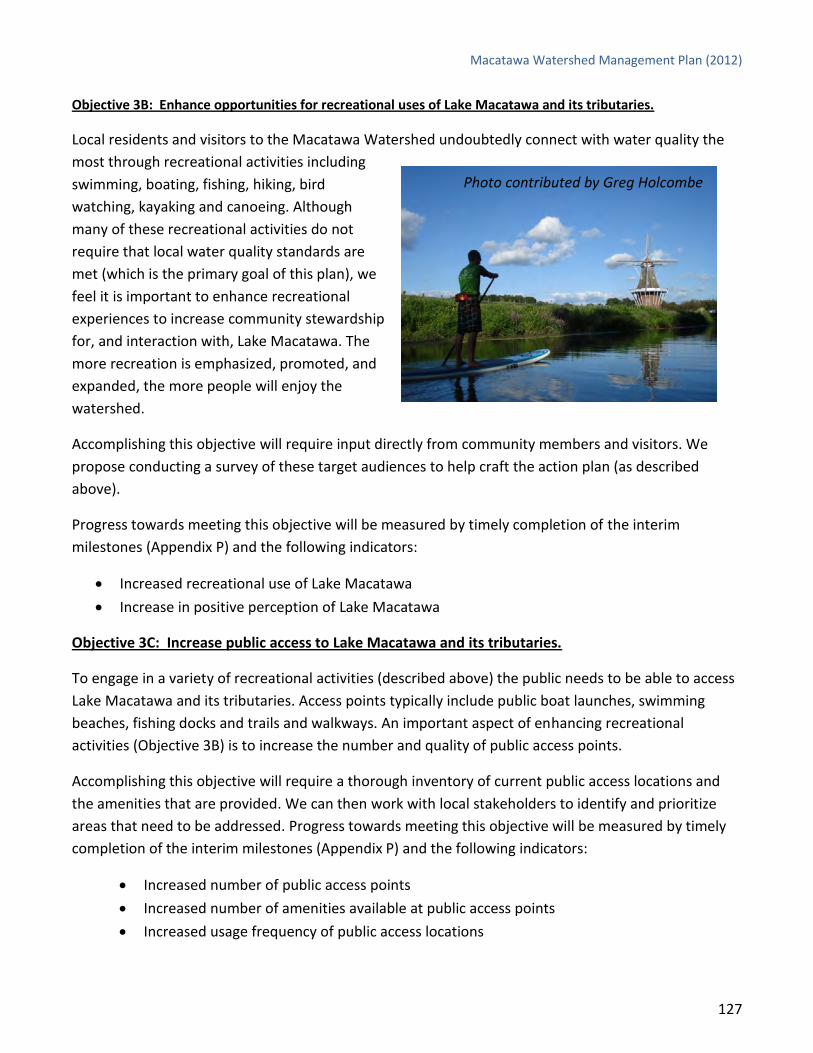
Macatawa Watershed Management Plan (2012)
127
Objective 3B: Enhance opportunities for recreational uses of Lake Macatawa and its tributaries.
Local residents and visitors to the Macatawa Watershed undoubtedly connect with water quality the
most through recreational activities including
swimming, boating, fishing, hiking, bird
watching, kayaking and canoeing. Although
many of these recreational activities do not
require that local water quality standards are
met (which is the primary goal of this plan), we
feel it is important to enhance recreational
experiences to increase community stewardship
for, and interaction with, Lake Macatawa. The
more recreation is emphasized, promoted, and
expanded, the more people will enjoy the
watershed.
Accomplishing this objective will require input directly from community members and visitors. We
propose conducting a survey of these target audiences to help craft the action plan (as described
above).
Progress towards meeting this objective will be measured by timely completion of the interim
milestones (Appendix P) and the following indicators:
Increased recreational use of Lake Macatawa
Increase in positive perception of Lake Macatawa
Objective 3C: Increase public access to Lake Macatawa and its tributaries.
To engage in a variety of recreational activities (described above) the public needs to be able to access
Lake Macatawa and its tributaries. Access points typically include public boat launches, swimming
beaches, fishing docks and trails and walkways. An important aspect of enhancing recreational
activities (Objective 3B) is to increase the number and quality of public access points.
Accomplishing this objective will require a thorough inventory of current public access locations and
the amenities that are provided. We can then work with local stakeholders to identify and prioritize
areas that need to be addressed. Progress towards meeting this objective will be measured by timely
completion of the interim milestones (Appendix P) and the following indicators:
Increased number of public access points
Increased number of amenities available at public access points
Increased usage frequency of public access locations
Photo contributed by Greg Holcombe

Macatawa Watershed Management Plan (2012)
128
Objective 3D: Enhance, protect and/or restore important areas of fish and wildlife habitat.
Water quality and natural lands are not only important to the residents of the Macatawa Watershed,
they are critically important to maintaining diverse and high quality fish and wildlife species. The
ecology of the Macatawa Watershed has been severely compromised by decades of development and
destruction of natural lands. We recognize that it is important to protect the high quality habitat we
currently have and work towards restoring high quality habitat that we have lost. Protection efforts
(Goal 2, Objectives 2A-2D), habitat improvement projects and controlling the growth and expansion of
invasive species will contribute greatly to the enhancement of fish and wildlife habitat.
Accomplishing this objective will require the expert help of naturalists and biologists to assess current
conditions, identify important restoration areas and craft an invasive species action strategy (Higman
and Campbell 2009) which may include policy and regulations, information and education, research
and monitoring and early detection and rapid response (Office of the Great Lakes 2002).
Potential partners include MDEQ, MDNR, Outdoor Discovery Center Macatawa Greenway, Ottawa and
Allegan County Parks, Degraaf Nature Center, Macatawa Watershed Association, Ducks Unlimited,
Holland Fish and Game Club and Land Conservancy of West Michigan.
Progress towards meeting this objective will be measured by timely completion of the interim
milestones (Appendix P) and the following indicators:
Identified areas of high quality habitat
Acres of restored or enhanced habitat
Acres of controlled invasive species
Improved diversity and quality of fish and wildlife communities
Objective 3E: Preserve and protect remaining open space within the watershed (including prime
farmland).
As the Macatawa Watershed continues to become increasingly developed, it is important to protect
and preserve remaining open space to combat the effects of an increasing amount of impervious
surface. Wetlands and forested land are considered open space and have been addressed under
Protection Goal 2 (Objectives 2A-2D). Much of the remaining open land in the Macatawa Watershed is
in agricultural use. While agricultural land use does pose a risk to downstream water quality (via
erosion and overland runoff) this open space provides significantly more infiltration than impervious
surfaces. In addition, agricultural land use is a main economic driver in the area and the land base
supports a variety of other industries. Accomplishing this task may include many of the protection
measures described previously (wetland, riparian ordinances, conservation easements etc) in addition
to implementation of farmland protection programs.

Macatawa Watershed Management Plan (2012)
129
Figure 46. Farmland protection priority map (Fraser 2010a).
In 2009, the MACC commissioned the development of a Farmland Protection Study (Fraser 2010a,
Appendix S). The resulting map (Figure 46) depicts farmland that would likely score well when
evaluated by Ottawa and Allegan County Farmland Preservation Programs. These programs work to
provide funding to purchase the development rights of high quality farmland to ensure the land
remains undeveloped and available for farming in perpetuity.
The MACC will identify appropriate stakeholders and convene an informational meeting to distribute
copies of the Farmland Protection Priority Map. The MACC will also work to generate awareness and
participation in the Healthy Waters Rural Pride Initiative (HWRP), a developing program that provides
funding for purchasing developing rights in return for permanent buffer strips and conservation plans
on participating farms. More information about HWRP can be found at
http://www.wix.com/hwrpinitiative/hwrp.

Macatawa Watershed Management Plan (2012)
130
Potential partners include the county farmland preservation boards, the Natural Resources
Conservation Service, local conservation districts, Michigan State University Extension, Michigan Farm
Bureau, Hamilton Farm Bureau, other Farm Services Agencies and local units of government.
Progress towards meeting this objective will be measured by timely completion of the interim
milestones (Appendix P) and the following indicators:
Increase participation in the county farmland preservation programs
Increase participation with Healthy Waters Rural Pride
Number of permanently preserved acres

Macatawa Watershed Management Plan (2012)
131
4.7 INFORMATION AND EDUCATION STRATEGY
A strong Information and Education Strategy (I & E) will be paramount to accomplishing all of the
watershed management plan goals and objectives. Since the MWP was created in the late 1990s,
outreach and public education has been an important focus. The MWP already employs a variety of I &
E techniques to create awareness of local water quality issues and encourage stewardship. These
techniques include:
Maintaining a recognizable brand via the creation of a
Macatawa Watershed Project Logo
Administering the Lawn Care Seal of Approval Program
Distributing informational material including:
o Three Children’s Books (A Day at the Farm, The
Lake I Didn’t Remember and Springwater Rain)
o General Watershed Brochure
o Lawn Care Brochure
o Award – winning Into the Watershed DVD
o Homeowner’s Handbook
o Project Specific Fact Sheets
o An Environmental History of the Macatawa
Watershed Book
o Quarterly newsletters
o Watershed Maps
Attending and supporting watershed-related events:
o River Cleanups
o Kayak Tours
o Watershed Festival
Bestowing the Annual Watershed Stakeholder of the Year Award
Conducting community presentation accompanied by two tabletop displays and Enviroscapes
Managing a storm drain stenciling program for the community
Maintaining a Facebook Page and website
An updated I & E Strategy has been created that specifically supports the goals and objectives of this
plan, including the recommended management measures. The plan includes milestones, a timeline for
implementation and estimated implementation costs. For a copy of I & E Strategy refer to Appendix B.

Macatawa Watershed Management Plan (2012)
132
4.8 COORDINATION WITH MS4 PERMITTEES
Six of the local units of government in the Macatawa Watershed are regulated by NPDES Phase II MS4
Storm Water Permits. They are the City of Holland, City of Zeeland, Ottawa County Drain Office,
Allegan County Drain Office, Ottawa County Road Commission and Allegan County Road Commission.
Currently, these local units of government are operating under the General Storm Water Permit No.
MIG619000 (Appendix T) until 2017 (at which time they will be required to apply for a new permit).
The 2003 Storm Water Permit requires permittees to address both the quality and quantity of storm
water discharged to the Macatawa Watershed. Required activities are categorized under the Six
Minimum Measures:
1. Public Education and Outreach
2. Public Participation and Involvement
3. Illicit Discharge Detection and Elimination
4. Construction Site Runoff Control
5. Post Construction Runoff Control
6. Pollution Prevention and Good Housekeeping
In addition, the permit requires permittees to participate in the development and implementation of a
watershed management plan and to develop a SWPPI (Storm Water Pollution Prevention Initiative)
based on the watershed management plan.
As described in Section 1.3 all of the storm water permittees were intricately involved in the
development of this watershed management plan. It is assumed that storm water permittees will take
active roles in implementing this watershed management plan and fulfilling the requirements of the
storm water permit. Specific commitments will be itemized and described by each permittee during
the development of their SWPPI (which will be updated when this plan becomes approved). Some
specific commitments have already been described in the Information and Education Strategy
(Appendix B, Table 11).

Macatawa Watershed Management Plan (2012)
133
4.9 SECTION 4.0 REFERENCES
Agricultural Drainage Management Coalition. 2006. Benefits and Costs of a Subsurface Agricultural
Drainage Water Management System to Improve Water Quality and Increase Crop Production
in a Public-Private Partnership.
Allegan Conservation District, 2011. Agricultural priority area inventory and best management
practices recommendations for selected areas in the Macatawa Watershed.
Chen, L. and W. Dick. 2011. Gypsum as an Agricultural Amendment: General Use Guidelines. The Ohio
State University Bulletin 945.
Dierks, S. 2010. Two-stage ditches and water quality solutions for agricultural NPS. Pipeline 19 (1): 32-
35.
Evans, R.O., R.W. Skaggs and J.W. Gilliam. 1995. Controlled versus conventional drainage effects on
water quality. Journal of Irrigation and Drainage Engineering121 (4): 127-133.
Favaretto, N., L. D. Norton, B. C. Joern, and S. M. Brouder. 2006. Gypsum amendment and
exchangeable calcium and magnesium affecting phosphorus and nitrogen in runoff. Soil Science
Society of America Journal 70:1788–1796.
Fertilizer Institute. Subsurface tile drainage management. Accessed in 2012 at
http://www.nutrientstewardship.com/implement-4rs/article/subsurface-tile-drainage-
management#print
Fisher, M. 2011. Amending soils with gypsum. Crop and Soils Magazine, American Society of Agronomy.
Pg 4-9.
Fraser, J. 2010. Land protection priorities in the Macatawa Watershed. Part 1: Natural Land. Prepared
for the Macatawa Area Coordinating Council.
Fraser, J. 2010a. Land protection priorities in the Macatawa Watershed. Part 2: Farmland. Prepared for
the Macatawa Area Coordinating Council.
FTCH (Fishbeck, Thompson, Carr and Huber). 2011. Geomorphic Assessment using the watershed
assessment of river stability and sediment supply (WARSSS). Macatawa Watershed, Ottawa and
Allegan Counties, Michigan.
FTCH (Fishbeck, Thompson, Carr and Huber). 2011a. Macatawa Watershed Critical Area Analysis for
Restoration. Prepared for the Macatawa Area Coordinating Council.

Macatawa Watershed Management Plan (2012)
134
Higman, P. and S. Campbell, Michigan Natural Feature Inventory. 2009. Meeting the challenge of
invasive plants: A framework for action. Prepared for the Michigan Department of Natural
Resources.
Lalonde, V., C.A. Madramootoo, L. Trenholm and R.S. Broughton. 1996. Effects of controlled drainage
on nitrate concentrations in subsurface drain discharge. Agricultural Water Management 29
(2:187-199.
MDARD (Michigan Department of Agricultural and Rural Development). 2012. Generally Accepted
Agricultural and Management Practices for Manure Management and Utilization.
http://www.michigan.gov/gaamps
Norton, L.D. 2006. Reducing runoff volume and concentrations of phosphorus and atrazine with
gypsum amendment. National Soil Erosion Research Laboratory. Findings presented at 9th
Biennial Conference on Storm Water Research and Watershed Management.
Office of the Great Lakes. 2002. Michigan’s Aquatic Nuisance Species State Management Plan.
Michigan Department of Environmental Quality. http://michigan.gov/documents/deq/deq-ogl-
ANSPlan2002_249062_7.pdf
SEMCOG (Southeast Michigan Council of Governments). 2008. Low Impact Development Manual for
Michigan: A Design Guide for Implementers and Reviewers.
Stout, W.L., A.N. Sharpley, W.J. Gburek and H.B. pionke. 1999. Reducing phosphorus export from
croplands with FBC fly ash and FGD gypsum. Fuel (78): 175-178.
SWMPC (Southwestern Michigan Planning Commission). 2008. Paw Paw River Watershed Management
Plan.

Macatawa Watershed Management Plan (2012)
135
5.0 EVALUATION METHODS
In this SECTION you will understand:
How the implementation efforts will be monitored
How effectiveness of these efforts will be assessed

Macatawa Watershed Management Plan (2012)
136
5.1 EVALUATION
A critical aspect of watershed management planning process is tracking progress over time and
measuring water quality improvement. Many resources will be dedicated to implementing the actions
described in this plan. It is important to institute an effective plan to measure the success of these
efforts over time. Results of the evaluation process will play a key role in adaptive watershed
management and will help the MACC and its partners identify strategies that are working and those
that are not. This information will be used to periodically update the watershed management plan as
needed.
The MACC will employ a variety of evaluation techniques to monitor the progress towards
implementing this management plan including water quality monitoring, tracking social indicators and
annual reporting.
5.2 MONITORING
Another method that the MACC will use to evaluate watershed management plan effectiveness is by
directly monitoring water quality. Monitoring will be accomplished via State of Michigan programs,
volunteer efforts, and partnerships with local universities and regional organizations as described
below.
State of Michigan Programs
According to the State of Michigan “environmental monitoring is an essential component of the MDEQ
mission” (MDEQ 2010 Integrated Report) and that “water quality monitoring of Lake Macatawa and its
tributaries is planned, as resources allow, through 2020 to document the effectiveness of phosphorus
reduction efforts (Walterhouse 2011). We expect that Lake Macatawa will continue to be regularly
assessed by MDEQ via at least two monitoring programs:
Water chemistry sampling, approximately every other year, at five locations on Lake Macatawa
and six locations throughout the watershed (Figure 27).
Biological and water chemistry monitoring based on a 5-year rotating cycle (Lake Macatawa
was assessed in 2005 and 2010 and we expect that monitoring will continue in 2015 and 2020).
Typically monitoring occurs at 10-12 sites throughout the watershed (Table 12).
Volunteer Monitoring
Currently, the MACC organizes a volunteer monitoring program for the weekly collection of Secchi Disk
depths and water temperatures at four sites throughout the watershed (Section 3.4, Figure 29). This
data is crucial for assessing the impact of thermal pollution and sedimentation on Lake Macatawa.
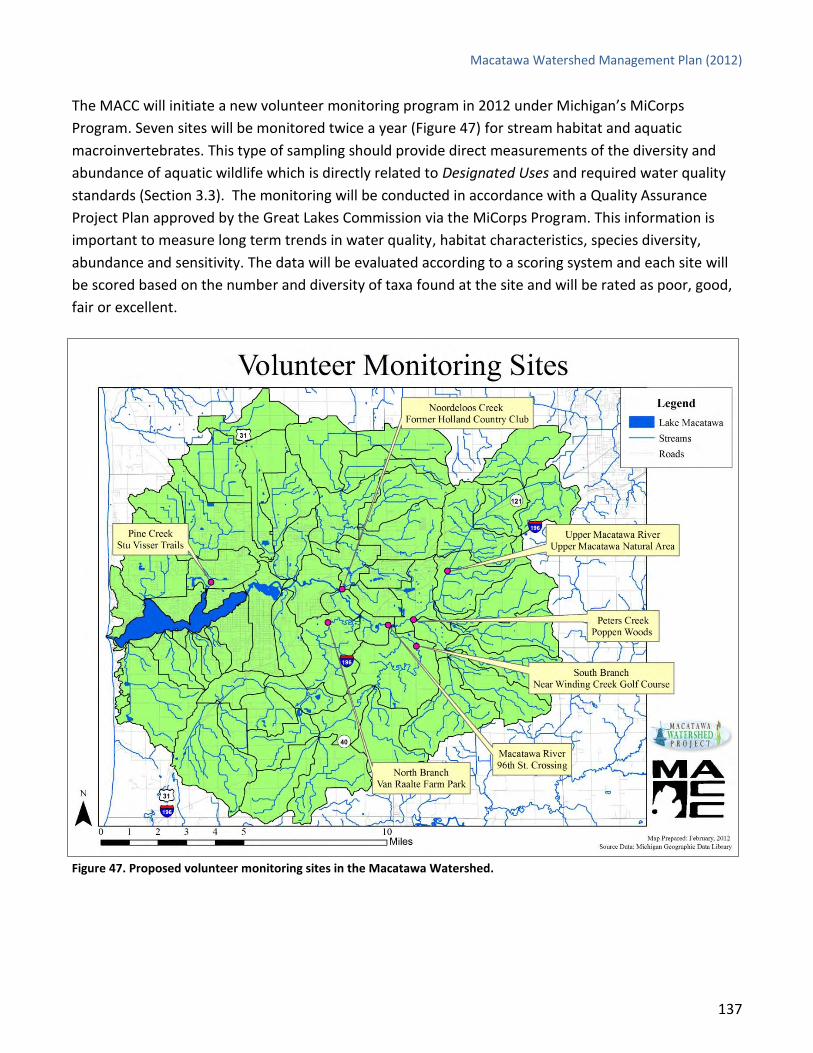
Macatawa Watershed Management Plan (2012)
137
The MACC will initiate a new volunteer monitoring program in 2012 under Michigan’s MiCorps
Program. Seven sites will be monitored twice a year (Figure 47) for stream habitat and aquatic
macroinvertebrates. This type of sampling should provide direct measurements of the diversity and
abundance of aquatic wildlife which is directly related to Designated Uses and required water quality
standards (Section 3.3). The monitoring will be conducted in accordance with a Quality Assurance
Project Plan approved by the Great Lakes Commission via the MiCorps Program. This information is
important to measure long term trends in water quality, habitat characteristics, species diversity,
abundance and sensitivity. The data will be evaluated according to a scoring system and each site will
be scored based on the number and diversity of taxa found at the site and will be rated as poor, good,
fair or excellent.
Figure 47. Proposed volunteer monitoring sites in the Macatawa Watershed.

Macatawa Watershed Management Plan (2012)
138
Partnership Programs
As described in Section 3.4, the MACC partners with several outside agencies to facilitate monitoring of
harmful algal blooms (Figure 30, Table 13), suspended sediment (Figure 31-33) and levels of E.coli
bacteria (Figure 34 – 36). The MACC will make every effort to continue facilitating these sampling
programs. Sampling will be conducted in accordance with applicable Quality Assurance Projects Plans
as approved by the Michigan Department of Environmental Quality.
The quantitative data collected from these monitoring efforts will result in a wealth of information that
will help us measure level of progress towards meeting Goal 1 of this watershed management plan.
The following data will be used to determine compliance with water quality standards:
Average water temperature (F)
Highest water temperature (F)
Total phosphorus (mg/L)
Average spring phosphorus levels (mg/L)
Suspended Sediment Mass and Loading Estimates (mg/L)
E.coli Bacteria (cfu/100 ml)
Habitat rating
Fish community rating
Aquatic Macroinvertebrate rating
Average Secchi Disk Depth
Microcystin Concentration
Highest Peak Stream Flow (ft3/sec)
Average Peak Stream Flow (ft3/sec)
This monitoring data will used to measure compliance with water quality standards to evaluate
achievement of Designated Uses (Appendix E). The MACC will use the following guidance to determine
appropriate water quality monitoring targets:
Nutrients
The Macatawa Watershed is regulated by a Phosphorus Total Maximum Daily Load (TMDL). The TMDL
Document (Appendix A) specifies that the goal for phosphorus concentrations is 0.05 mg/l (as
measured from grab samples in Lake Macatawa). The State of Michigan provides an additional
narrative standard (Appendix E). This information will be used to determine the target goals for
nutrients in the Macatawa Watershed, with a special focus on phosphorus since the Macatawa
Watershed is under a Phosphorus TMDL.

Macatawa Watershed Management Plan (2012)
139
Sediment
State of Michigan water quality standards provide a narrative standard for sediment (Appendix E) with
some additional water quality benchmarks. Excessive sediment is also one of the pollutants that
negatively impact fish and wildlife habitat. The MACC will use the narrative standard to qualitatively
assess sedimentation impacts in the Macatawa Watershed. This assessment will be supported by water
quality data collected via the Suspended Sediment Sampling program (mg/L), Secchi Disk volunteer
monitoring (water clarity in ft) and fish, habitat and insect ratings. Initial baseline estimates are not yet
available for suspended sediment, therefore the MACC aims to show a decreasing sediment load on an
annual basis. The goal for Secchi Disk readings will be to increase water clarity (water depth readings)
by 25%. The goal for fish, habitat and insect ratings will be to increase quality scores of each sampling
site to “acceptable”.
Hydrology
The State of Michigan provides only a very vague narrative standard to assess hydrology (Appendix E).
The MACC proposes to access hydrology impacts by monitoring highest peak flow and average annual
peak stream flow using data from the USGS gauge stations (Figure 37). In addition, extreme hydrology
has significant potential to negatively impact fish and wildlife habitat. The goal for fish, habitat and
insect ratings will be to increase quality scores of each sampling site to “acceptable”.
Temperature
State of Michigan water quality standards provide specific parameters for temperature requirements
(Appendix E). The goal will be to use monitoring data (from State of Michigan and volunteer
monitoring) to determine that lake and river temperatures do not exceed these standards. In addition,
temperature stress is a factor that has the potential to negatively impact fish and wildlife habitat by
decreasing levels of dissolved oxygen. The goal will be to use State of Michigan monitoring data for
dissolved oxygen to show that levels in Lake Macatawa do not decrease below 5 mg/L. In addition, the
goal for fish, habitat and insect ratings will be to increase quality scores of each sampling site to
“acceptable”.
E.coli bacteria
State of Michigan water quality standards provide specific parameters for acceptable levels of E.coli
Bacteria (Appendix E). The MACC will obtain sampling data collected by the Ottawa County health
Department and Hope College to monitor E.coli levels. The goal is show a decreasing annual trend in
E.coli levels and to stay below water quality standards to protect partial and total body contact
designated uses.

Macatawa Watershed Management Plan (2012)
140
5.3 SURVEYS
The implementation strategy described in this watershed management plan depends largely on actions
taken by private landowners, local units of government and businesses to install best management
practices and associated management measures. The MACC will take an active role in advocating these
practices, increasing awareness, pursuing funding and providing technical assistance however, many of
the practices will be privately implemented. To adequately track these actions and changes in
community knowledge, awareness, values and behaviors, the MACC will rely on qualitative means of
assessment, namely surveys.
The MACC has a long history of conducting surveys of local residents, farmers and local units of
government. By continuing to conduct surveys of these target groups we hope to document increased
levels of knowledge and awareness of water quality issues, and increase adoption of recommended
best management practices. See the Information and Education Strategy in Appendix B for a more
complete description of survey goals and objectives. Large formal surveys will be conducted in
accordance with a MDEQ-approved Quality Assurance Plan.
5.4 REPORTING
The MACC will produce an annual report which will document watershed activities accomplished
during the previous year. The report will specifically reference management measures and the
implementation schedule as described in Appendix P and those described in the Information and
Education Strategy (Appendix B per Section IX). The purpose of the report will be to track
implementation efforts, water quality monitoring activities and survey results including:
Number of tasks accomplished
Number of presentations made
Number of documents distributed
Number of committee meetings held
Number of newsletters distributed
Number of workshops, tours, events
Number of participants at workshops, events
Number of newspaper articles
Number of best management practices implemented
Number of ordinances enacted
Acres of land restored, protected or enhanced

Macatawa Watershed Management Plan (2012)
141
Most importantly, the annual report will compare accomplishments to the management indicators as
described in Appendix U. Protection and enhancement indicators are described in Section 4.5 and 4.6.
The annual report will be made available on the MACC’s website at www.the-macc.org.
5.5 SECTION 5.0 REFERENCES
Creal, W., Hanshue, S., Kosek, S., Oemke, M. and M. Walterhouse. 1996. Update of GLEAS Procedure
51 Metric Scoring and Interpretation. Michigan Department of Environmental Quality.
MI/DEQ/SWQ-96/068.
MDEQ (Michigan Department of Environmental Quality). 2010. Water quality and pollution control in
Michigan 2010 Sections 303(d), 305(b), and 314. Integrated Report. Report No. MI/DEQ/WB-
10/001.
Walterhouse, M. 2011. Monthly water quality assessment of Lake Macatawa and its tributaries, 2010.
MDEQ Report No. MI/DEQ/WRD-11/018.

Macatawa Watershed Management Plan (2012)
142

Macatawa Watershed Management Plan (2012)
143
6.0 SUMMARY AND CONCLUSION
This SECTION will provide:
A synopsis of water quality pollutants, sources and causes
A summary of critical implementation areas and practices
A Prioritized list of implementation efforts
Items that need further study
Future steps and watershed planning

Macatawa Watershed Management Plan (2012)
144
6.1 WHAT ARE THE MAIN CONCERNS?
The Environmental Protection Agency, the Michigan Department of Environmental Quality and local
researchers all agree that Lake Macatawa suffers from too much nutrients, too much sediment,
flooding, thermal pollution and too much E.coli bacteria. These conditions result in extreme erosion,
brown muddy water, odors, algae blooms, fish kills, beach closures and road failures.
These pollutants travel to local waterways via storm water runoff which comes primarily from
nonpoint sources like roads, parking lots, rooftops, driveways, lawns and agricultural fields. This is a
major concern because Lake Macatawa and all its tributaries are not meeting the state’s basic water
quality criteria and we have been instructed that we need to reduce phosphorus inputs by 70% to start
improving water quality.
The goal of this watershed management plan is to restore water quality (Designated Uses), protect
remaining natural land and enhance the watershed (Desired Uses).
Tier 1
• Nutrients
• Sediment
• Temperature
• Hydrology
Tier 2
• E.Coli bacteria
Tier 3
• Chemical Contaminants
• Invasive Species
• Chloride
• Man-made debris
• Mercury/PCBs

Macatawa Watershed Management Plan (2012)
145
6.2 WHERE ARE THE CRITICAL AREAS?
The Macatawa Watershed is a mix of urban, suburban and agricultural land uses that pose unique
threats to water quality. Storm water runoff, combined with certain land characteristics makes certain
parts of the watershed more likely to contribute pollutants. These areas have been identified as critical
areas(Figures 48 and 49). Approximately 28% of the watershed is designated as critical agricultural area
while 17% is designated as critical urban area.
Figure 48. Critical agricultural areas of the watershed.

Macatawa Watershed Management Plan (2012)
146
Figure 49. Critical urban areas in the watershed.

Macatawa Watershed Management Plan (2012)
147
6.3 WHAT ACTIONS SHOULD BE IMPLEMENTED?
In general terms, this document presents a three-pronged action plan including an Information and
Education Strategy, and recommendations for structural best management practices and managerial
(non-structural) best management practices (Figure 46). The main focus of this action plan is to restore
water quality by targeting high and moderate priority pollutant sources and associated causes.
Figure 50. Summary of recommended implementation actions included in this plan.
All of the recommended action items outlined in the plan are listed above, however an important
element of this plan is prioritizing these items to create the most effective strategy for water quality
restoration. Therefore, using best professional judgment and input from members of the various
watershed committees, the various action items were prioritized into the following lists.
Note that the following prioritization only addresses the primary focus of this plan which is the water
quality restoration actions. The secondary goals of the plan, protection and enhancement actions, have
not been included.
Information and Education
•Farmers
•Residents
•Local Government
•Institutions
•Environmental Advocacy Groups
•Schools
Structural BMPs
•Wetland Restoration
•Agricultural BMPs
•Cover Crops
•Reduced Tillage
•Gyspum Amendments
•Two Stage Ditch
•Buffer Strips
•Grassed Waterways
•Drainage Water Management
•Urban BMPs
•Native Vegetation
•Rain Gardens
•Porous Pavement
•Buffer Strips
•Tree Planting
•Rain barrels
•Streambank Stabilization
•Road Stream Crossings
Managerial BMPs
•Wetland Protection
•Riparian Overlays/Zoning
•Conservation Easements
•Storm Water Ordinance
•Improved Site Plan Review
•MAEAP verification
•Nutrient/Manure Management Plans
•Lawn Care Seal of Approval Program
•Street Sweeping/Catch Basin Cleaning
•Illicit Discharge Elimination Program
•Revised Drain Maintenance Procedures

Macatawa Watershed Management Plan (2012)
148
High Priority Restoration Actions
Information and Education Strategy
•General Awareness Messages to:
• Farmers, Riparian Residents, School and Local Government
•Taking Action Messages to:
•Row Crop and Riparian Farmers
•Pork/Dairy Producers
•Elected Officials/Managers
•Department Engineers
•Planning/Zoning Commision
•Drains/Road Commissions
•Riparian Landowners
•Suburban Residents
Urban BMPs
•Low Impact Development (LID Practices) and/or Green Infrastructure Practices
•Examples include Rain Barrels, Rain Gardens, Bioretention, Infiltration practices etc
•Streambank Stabilization
Agricultural BMPs
•Wetland Restoration
•Buffer Strips
•Cover Crops
•Conservation Tillage
Managerial BMPs
•Wetland Protection
•Storm Water Ordinance
•MAEAP Verification
•Improved Site Plan Review
•Conservation Easements
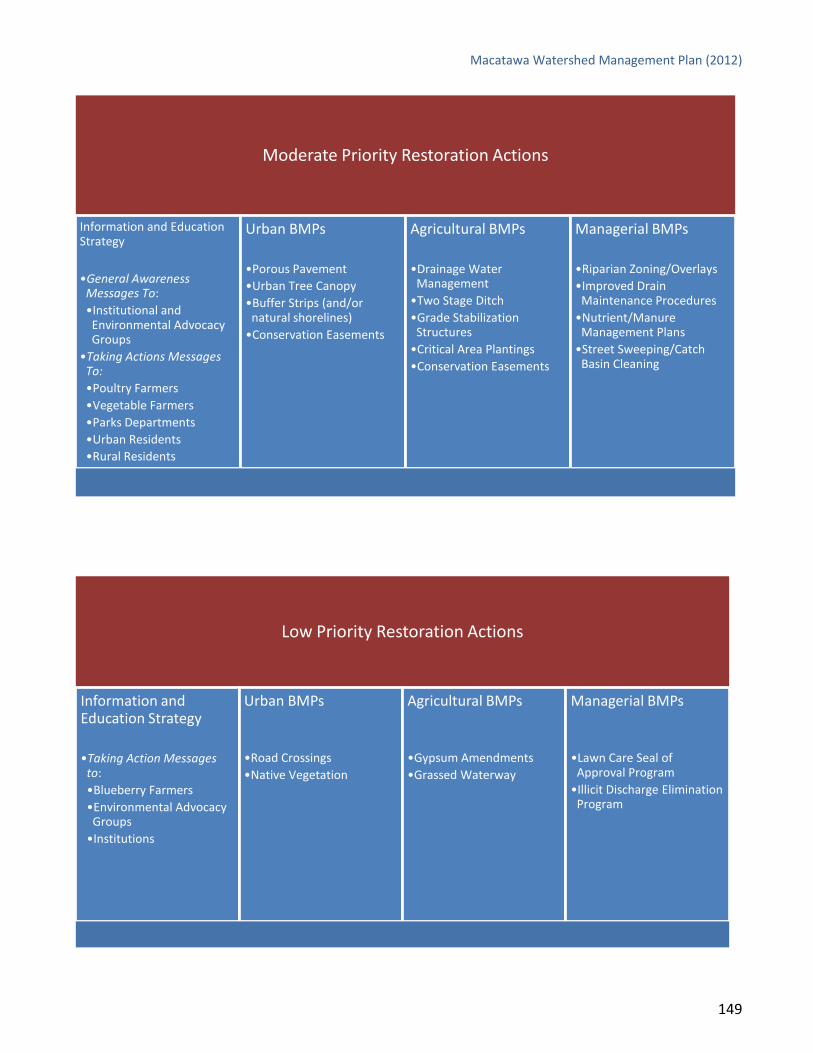
Macatawa Watershed Management Plan (2012)
149
Moderate Priority Restoration Actions
Information and Education Strategy
•General Awareness Messages To:
•Institutional and Environmental Advocacy Groups
•Taking Actions Messages To:
•Poultry Farmers
•Vegetable Farmers
•Parks Departments
•Urban Residents
•Rural Residents
•Spanish Speaking Residents
•Churches
•Schools
Urban BMPs
•Porous Pavement
•Urban Tree Canopy
•Buffer Strips (and/or natural shorelines)
•Conservation Easements
Agricultural BMPs
•Drainage Water Management
•Two Stage Ditch
•Grade Stabilization Structures
•Critical Area Plantings
•Conservation Easements
Managerial BMPs
•Riparian Zoning/Overlays
•Improved Drain Maintenance Procedures
•Nutrient/Manure Management Plans
•Street Sweeping/Catch Basin Cleaning
Low Priority Restoration Actions
Information and Education Strategy
•Taking Action Messages to:
•Blueberry Farmers
•Environmental Advocacy Groups
•Institutions
Urban BMPs
•Road Crossings
•Native Vegetation
Agricultural BMPs
•Gypsum Amendments
•Grassed Waterway
Managerial BMPs
•Lawn Care Seal of Approval Program
•Illicit Discharge Elimination Program

Macatawa Watershed Management Plan (2012)
150
Implementation of the Information and Education Strategy (Appendix B) is of the utmost importance
because it fundamentally supports all other water quality restoration recommendations of this plan. It
is estimated that implementation of the above actions will result in a reductions of approximately
87,857, lbs of phosphorus, 215,971 lbs of nitrogen and 55,492 tons of sediment annually.
6.4 WHAT NEEDS FURTHER STUDY?
The water quality of Lake Macatawa and the Macatawa Watershed is complex. This plan was possible
due to the wealth of information available about the most pressing pollutants of concern. However,
some water quality issues are in need of further study including the sources and causes of E.coli
bacteria (and applicable remediation activities) and the possible impacts of Tier 3 pollutants.
6.5 HOW WILL PROGRESS BE MEASURED?
Progress will be measured periodically via water quality monitoring and community surveys. Progress
will be reported to community stakeholders annually in the form of an annual report. The annual
report will summarize monitoring activities and results, implementation status of all management plan
tasks and objectives and results of social surveys. Surveys will ultimately be the most effective tool for
measuring changes in awareness, values and behavior.
6.6 WHAT WILL HAPPEN IN THE FUTURE?
This plan presents an ambitious work plan and is intended to guide watershed management activities
over the next ten years (until 2022). However, the water quality problems in the Macatawa Watershed
are very serious and successful restoration of water quality will depend on many actions taken by
many community members over the next several decades. The annual reports and associated water
quality monitoring will provide a periodic assessment tool to determine the effectiveness of watershed
activities. The watershed management plan is meant to be an adaptive tool and may be updated with
new information periodically.
The MACC intends to start implementation of the watershed management plan immediately and will
continue to involve as many local stakeholders as possible to achieve our vision for Lake Macatawa. It
is our understanding from the Michigan Department of Environmental Quality that the Phosphorus
TMDL goals will not be revised and that an E.coli TMDL will be developed in approximately 2017.

Macatawa Watershed Management Plan (2012)
151