documentm
DESCRIPTION
TRANSCRIPT

December 2009
M&A MarketAnalysis
Steven M. Bernard, CFADirector of M&A Market [email protected]
MERGER TRACKER
Monthly Overview of Global Middle-Market M&A Activity
Headquarters222 West Adams StreetChicago, IL 60606312.236.1600www.williamblair.com
Two International PlaceSuite 1700Boston, MA 02110617.235.7500
Putnam Place100 Great Meadow RoadSuite 606Wethersfield, CT 061091.800.596.2028
450 East 96th StreetSuite 500Indianapolis, IN 46240317.581.6127
3 St. Helen’s PlaceLondon EC3A 6ABEngland+44 20 7868 4400
666 Fifth Avenue14th FloorNew York, NY 10103212.237.2700
343 Sansome StreetSuite 1210San Francisco, CA 94104415.986.5596
Unit 16-18, 11th FloorBuilding One, Corporate AvenueNo. 222 Hubin RoadShanghai 200021, P.R.C.+86.21.2327.2222
Kamiyacho MT Building 13th Floor4-3-20 ToranomonMinato-ku, Tokyo 105-0001Japan+81.3.5470.0720
Stockerstrasse 468002 ZurichSwitzerland+41.44.287.9020
OFFICE LOCATIONS
William Blair & Company, L.L.C. is a global investment firm offering investment banking,asset management, equity research, institutional and private brokerage, and private capital toindividual, institutional, and issuing clients. Since 1935, we have been committed to helpingclients achieve their financial objectives. As an independent, employee-owned firm, ourphilosophy is to serve our clients’ interests first and foremost. We place a high value on theenduring nature of our client relationships, the quality of our products and services, and thecontinuity and integrity of our people. William Blair & Company is based in Chicago, withoffice locations including Boston, London, New York, San Francisco, Shanghai, Tokyo, andZurich. For more information, please visit www.williamblair.com.

Table of Contents
www.williamblair.com
Commentary 1
Global Activity 3 Regional Transactions 3 Middle-Market Regional Transactions 4 Annual Transactions 5
U.S. M&A Activity 6 Transaction Detail 6 Annual Activity 7 Valuation Multiples 8 Private-Equity Transaction Analysis 9 Transaction Breakdown 11 Industry Breakdown 13 Cross-Border Transaction Analysis 14
U.S. Financing Markets 16 Debt Capital Markets 16 Equity Capital Markets 18
Guest Column 19 Dykema M&A Survey Report 19
Special Situations & Restructuring Market Update 31
European M&A Activity 34 Transaction Detail 34 Annual Activity 35 Valuation Multiples 36 Private-Equity Transaction Analysis 37
Emerging Markets M&A Activity 38
Select William Blair & Company Transactions 39
William Blair & Company Corporate Finance Contact List 42
Notes 44
Disclosures 45

Commentary
www.williamblair.com 1
Commentary
OVERVIEW
Global M&A activity for November reinforced the belief that the M&A markets may have finally turned the corner. For several months we have pointed to the increasingly positive signs that would help fuel the rebound in activity. These signs included a surging stock market, near-record amount of private-equity capital available for investment, and increased optimism that the worst of the economic downturn and financial crisis has passed. While the economic outlook remains uncertain, we sense a more positive tone and outlook among our clients and an increased willingness to entertain and consider acquisition opportunities. These factors have contributed to the recent uptick in the $1 billion-plus transactions announced over the past month several months, including the recent announcements of the third-biggest transaction of the year and the largest private-equity transaction for the year. The $26 billion purchase of Burlington Northern Santa Fe by Warren Buffett and the $4 billion take-private transaction of IMS Health by TPG and the Canadian Pension Plan both took place the first week of November, providing significant year-end momentum that has so far continued in the first half of December and should carry over into the at least the first half of 2010.
GLOBAL M&A HIGHLIGHTS For November, the number of announced global transactions totaled 2,637, a modest decline of 1.6%
compared with the corresponding period last year. The total disclosed dollar volume for the month was $232.9 billion, a gain of 154.2% compared with the
corresponding period last year. This total was the highest monthly dollar volume total since July 2008 and has now exceeded $200 billion in two of the past three months (averaging $195 billion) after averaging just $150 billion for the first eight months.
For the year-to-date period, the total number of transactions remains down double digits both in aggregate and for each individual geographic region compared with the corresponding period last year. Given the current level of activity, it is likely that the 2009 full-year totals will fall far short of the totals reached in 2008. Overall, the year-to-date total number of transactions has declined 15.7%, ranging from an 8.3% decline for Europe to a 29.8% decline for Latin America.
The total number of announced middle-market transactions rose a modest 2.7% compared with the corresponding period last year, driven by modest increases for North America and Asia-Pacific. More impressive, however, was the 48.6% increase in the total announced dollar volume compared with the corresponding period last year, as four of the five regions reported sizable increases.
As is the case with the overall market, all regions remain solidly down for the year-to-date period compared with the corresponding period last year, and will likely fall well short of the 2008 levels.
U.S. M&A HIGHLIGHTS U.S. M&A activity in November showed continued improvement.
Announced U.S. M&A activity in November totaled 683 transactions, a decline of just 7.2% compared with the corresponding period last year and also below the trailing-12-month monthly average of 740.
However, the dollar volume of transactions totaled $98.7 billion, a significant jump from just $30.3 billion last year and 51% above the monthly average of $65.5 billion. The increase in dollar volume reflected a sizable increase in the number of large transactions. The 20 deals valued at more than $750 million was the second highest total since July 2008.
Average deal size for the month was $297.3 million, raising the year-to-date average size to $204.4 million, compared with $220.5 million for all of 2008.
Year-to-date, total U.S. dollar volume has declined 28.9% compared with the corresponding period last year, although the decline in the number of transactions has been slightly less dramatic, down 23.5%.

Commentary (cont'd)
www.williamblair.com 2
Commentary (cont'd)
Middle-market activity for the month was also relatively strong, as the number of deals increased 5.1%
compared with the corresponding period last year, while the announced dollar volume increased 57.1%. For the month, there were just 82 U.S.-related private-equity transactions, almost 15% below the year-ago
period and also well below the monthly average of 110. However, the dollar value of $17.1 billion was more than twice the comparable period last year due to an
almost 140% increase in dollar volume for transactions in excess of $750 million. The computer and electronics sector remains the most active sector for private-equity investors, with 305
announced transactions year-to-date. This total remains more than the next two sectors combined — healthcare and professional services with 145 deals each. These three industries alone continue to represent approximately 50% of the total year-to-date announced deals.
Private companies have continued to take advantage of the market turmoil and increased their acquisition activity relative to the other market participants. Private companies now represent 46.7% of acquirers, up from 38.3% in 2008. This increase has come primarily at the expense of public companies, although private-equity firms and foreign acquirers have also seen their share of the total decline compared with 2008 results. Private companies also continue to account for the majority (62.1%) of all transaction targets, although their share has declined from 2008.
Overall EBITDA multiples continue to decline, reflecting the slowdown in the economy and reduced competition between strategic buyers and private-equity firms. For the overall market, the valuation multiple has declined to 8.1x EBITDA, compared with 9.3x for 2008. In the middle market, the multiple has declined from 8.2x EBITDA in 2008 to 7.3x EBITDA.
EUROPEAN M&A HIGHLIGHTS European M&A activity for November was also quite active, mirroring the U.S. and global activity levels. The total number of announced deals for the month was 1,014, a modest 1.7% increase compared with the
corresponding period last year, although this number was a below the trailing-12-month monthly average of 1,199.
The total dollar volume for the month jumped to $87.9 billion, an increase of 176% compared with the corresponding period last year and significantly above the trailing-12-month monthly average of $64.0 billion.
However, European middle-market activity was just 365 announced deals, down 8.5% compared with the corresponding period last year, while the dollar volume of $21.7 billion represented a 10.8% increase.
The median enterprise value/EBITDA multiple for all European transactions continues to decline, coming in at 7.1x for the LTM period, down from 9.4x for all of 2008 and 11.0x for 2007.
For middle-market deals over the past 12 months, the median enterprise value/EBITDA multiple has declined to 6.9x, from 8.6x EBITDA for 2008.

Global Activity
www.williamblair.com 3
Global Activity Regional Transactions
Global M&A activity finally appears to be turning the corner. For November, the number of announced global transactions totaled 2,637, a modest decline of 1.6%
compared with the corresponding period last year. The total disclosed dollar volume for the month was $232.9 billion, a gain of 154.2% compared with the
corresponding period last year. Global M&A activity turned in its highest monthly dollar volume total since July 2008 and has exceeded
$200 billion in two of the past three months (averaging $195 billion) after averaging just $150 billion. For the year-to-date period, the total number of transactions remains down double digits both in
aggregate and for each individual geographic region compared with the corresponding period last year. Given the current level of activity, it is likely that the 2009 full-year totals will fall far short of the totals reached in 2008. Overall, the year-to-date total number of transactions has declined 15.7%, ranging from an 8.3% decline for Europe to a 29.8% decline for Latin America.
The announced dollar volume has experienced a much steeper decline, with the year-to-date total amounting to just $1.78 trillion, representing a decline of almost 30.0% compared with the corresponding period last year. This decline is primarily attributable to significant declines in the two most active markets, with Europe experiencing a significant decline of 51.4% and North America experiencing a 28.6% decline.
Global M&A Activity Detail
Source: Dealogic and William Blair & Company, L.L.C. Mergers and Acquisitions market analysis.
2007 2008 2009% Change '09 vs. '08 2007 2008 2009
% Change '09 vs. '08
NOVEMBERNorth America 1,106 706 640 (9.3%) $80,043 $21,196 $87,470 312.7%Latin America 98 67 64 (4.5%) $6,836 $15,115 $5,177 (65.8%)Europe 1,239 855 911 6.5% $152,436 $23,633 $62,772 165.6%Africa / Middle East 90 57 58 1.8% $5,320 $2,902 $3,182 9.7%Asia Pacific 1,285 994 964 (3.0%) $56,194 $28,761 $74,250 158.2%TOTAL 3,818 2,679 2,637 (1.6%) $300,829 $91,605 $232,850 154.2%
YTDNorth America 11,475 9,870 7,565 (23.4%) $1,496,388 $921,289 $658,181 (28.6%)Latin America 1,127 989 694 (29.8%) $84,824 $96,511 $75,394 (21.9%)Europe 12,135 12,973 11,890 (8.3%) $1,655,954 $986,914 $479,484 (51.4%)Africa / Middle East 701 937 668 (28.7%) $86,377 $51,476 $56,889 10.5%Asia Pacific 12,871 12,897 10,924 (15.3%) $597,920 $488,404 $514,052 5.3%TOTAL 38,309 37,666 31,741 (15.7%) $3,921,462 $2,544,593 $1,783,999 (29.9%)
LTMNorth America 12,074 10,834 9,097 (16.0%) $1,636,864 $1,040,681 $687,819 (33.9%)Latin America 1,208 1,072 842 (21.5%) $97,953 $105,308 $83,678 (20.5%)Europe 13,057 14,165 13,744 (3.0%) $1,818,208 $1,129,228 $535,282 (52.6%)Africa / Middle East 730 1,010 781 (22.7%) $89,301 $72,326 $60,544 (16.3%)Asia Pacific 14,021 14,263 13,233 (7.2%) $664,684 $549,741 $575,429 4.7%TOTAL 41,090 41,344 37,697 (8.8%) $4,307,010 $2,897,283 $1,942,753 (32.9%)
NUMBER OF DEALS DEAL VALUE

Global Activity (cont'd)
www.williamblair.com 4
Global Activity (cont'd) Middle-Market Regional Transactions
In November, the total number of announced middle-market transactions rose a modest 2.7% compared with the corresponding period last year, driven by modest increases for North America and Asia-Pacific.
More impressive, however, was the 48.6% increase in the total announced dollar volume compared with the corresponding period last year, as four of the five regions reported sizable increases.
As is the case with the overall market, all regions still remain solidly down for the year-to-date period compared with the corresponding period last year, and will likely fall well short of the 2008 levels.
Overall, the total year-to-date number of transactions has declined 19.3% compared with the corresponding period last year, with three of the five regions continuing to show declines in excess of 25%.
The year-to-date disclosed dollar volume also remains significantly below the corresponding period last year. The current dollar volume of $666.4 billion is 35.0% below the corresponding period last year. Latin America has fared the best, experiencing a modest decline of just 1.5%, while Europe continues to struggle and is still down more than down 50.0% compared with last year.
Global Middle-Market M&A Activity Detail
Source: Dealogic and William Blair & Company, L.L.C. Mergers and Acquisitions market analysis.
2007 2008 2009% Change '09 vs. '08 2007 2008 2009
% Change '09 vs. '08
NOVEMBERNorth America 435 301 309 2.7% $32,124 $12,144 $22,675 86.7%Latin America 66 33 31 (6.1%) $3,886 $1,447 $2,992 106.7%Europe 519 314 309 (1.6%) $41,708 $15,553 $17,027 9.5%Africa / Middle East 56 37 34 (8.1%) $4,420 $2,902 $1,682 (42.0%)Asia Pacific 1,013 718 758 5.6% $41,063 $17,993 $29,972 66.6%TOTAL 2,089 1,403 1,441 2.7% $123,200 $50,039 $74,347 48.6%
YTDNorth America 3,846 4,231 3,497 (17.3%) $357,511 $269,231 $181,190 (32.7%)Latin America 605 503 357 (29.0%) $51,079 $33,793 $33,275 (1.5%)Europe 5,059 5,006 3,611 (27.9%) $449,785 $382,016 $181,257 (52.6%)Africa / Middle East 466 520 369 (29.0%) $41,132 $34,282 $20,941 (38.9%)Asia Pacific 9,817 9,620 8,212 (14.6%) $355,520 $305,230 $249,773 (18.2%)TOTAL 19,793 19,880 16,046 (19.3%) $1,255,027 $1,024,552 $666,437 (35.0%)
LTMNorth America 4,088 4,588 3,895 (15.1%) $388,432 $298,977 $198,132 (33.7%)Latin America 640 543 404 (25.6%) $54,941 $38,776 $35,775 (7.7%)Europe 5,512 5,511 3,991 (27.6%) $495,869 $428,818 $200,386 (53.3%)Africa / Middle East 485 556 402 (27.7%) $43,175 $36,843 $23,192 (37.1%)Asia Pacific 10,710 10,715 9,226 (13.9%) $389,855 $343,765 $278,201 (19.1%)TOTAL 21,435 21,913 17,918 (18.2%) $1,372,273 $1,147,180 $735,686 (35.9%)
NUMBER OF DEALS DEAL VALUE

Global Activity (cont'd)
www.williamblair.com 5
Global Activity (cont'd) Annual Transactions
Global M&A Activity
Number of Deals
1998 1999 2000 2001 2002 2003 2004 2005 2006 2007 2008 11/08 YTD
11/09 YTD
>$750M 405 563 645 340 296 293 439 580 800 1,025 601 568 357 Middle Market 11,860 12,932 15,898 13,017 12,421 11,949 13,787 16,796 18,884 21,828 21,753 19,881 16,046 Undisclosed 10,633 13,806 14,248 13,287 12,211 10,571 11,679 13,549 16,540 19,174 18,654 17,280 15,382
Deal Value $2,222 $3,060 $3,032 $1,572 $1,240 $1,356 $1,945 $2,754 $3,632 $4,274 $2,703 $2,545 $1,784
Source: Dealogic and William Blair & Company, L.L.C. Mergers and Acquisitions market analysis.
Undisclosed Middle Market Deal Value>$750M
22,898
27,301 30,791
26,64424,928
22,81325,905
30,925
36,224
42,02741,008
37,729
31,785
$0
$500
$1,000
$1,500
$2,000
$2,500
$3,000
$3,500
$4,000
$4,500
0
5,000
10,000
15,000
20,000
25,000
30,000
35,000
40,000
45,000
Deal Value($ in billions)Number of Deals

U.S. M&A Activity
www.williamblair.com 6
U.S. M&A Activity Transaction Detail
Announced U.S. M&A activity in November totaled 683 transactions, a decline of just 7.2% compared with the corresponding period last year and also below the trailing-12-month monthly average of 740.
The dollar volume of transactions totaled $98.7 billion, a significant jump from just $30.3 billion last year and 51% above the monthly average of $65.5 billion. It was also the third highest total in the past 16 months.
Middle-market activity for the month was also relatively strong, as the number of deals increased 5.1% compared with the corresponding period last year, while the announced dollar volume increased 57.1%.
Year-to-date, total U.S. dollar volume has declined 28.9% compared with the corresponding period last year, although the decline in the number of transactions has been slightly less dramatic, down 23.5%.
Overall, the lower end of the middle market continues to show the most strength, although it has weakened somewhat over the past few months. Transactions in the less-than-$50 million segment have declined just 5.8% year-to-date compared with the corresponding period last year, while the dollar volume of these transactions has declined 19.5%.
U.S. M&A Activity Detail
Source: Dealogic and William Blair & Company, L.L.C. Mergers and Acquisitions market analysis.
2007 2008 2009% Chg.
'09 vs. '08 2007 2008 2009% Chg.
'09 vs. '08
NOVEMBER< $50M 266 231 217 (6.1%) $3,866 $3,092 $2,773 (10.3%)$50M-$250M 116 49 63 28.6% $13,626 $5,338 $6,997 31.1%$250M-$750M 50 17 32 88.2% $20,799 $6,107 $13,063 113.9%Total Middle-Market 432 297 312 5.1% $38,291 $14,537 $22,833 57.1%Monthly Average 368 392 326 (16.8%) $39,059 $31,386 $18,602 (40.7%)> 750M 28 6 20 233.3% $55,491 $15,803 $75,873 380.1%Undisclosed 642 433 351 (18.9%) – – – –Total Deals 1,102 736 683 (7.2%) $93,782 $30,340 $98,707 225.3%Monthly Average 1,074 961 740 (23.0%) $147,917 $99,790 $65,471 (34.4%)
YTD< $50M 2,304 2,798 2,637 (5.8%) $37,736 $40,875 $32,920 (19.5%)$50M-$250M 1,222 1,123 651 (42.0%) $141,291 $126,055 $73,541 (41.7%)$250M-$750M 577 408 241 (40.9%) $248,041 $171,792 $98,247 (42.8%)Total Middle-Market 4,103 4,329 3,529 (18.5%) $427,068 $338,722 $204,708 (39.6%)> 750M 422 220 139 (36.8%) $1,184,100 $716,278 $545,122 (23.9%)Undisclosed 7,658 5,959 4,366 (26.7%) – – – –Total Deals 12,183 10,508 8,034 (23.5%) $1,611,168 $1,055,000 $749,830 (28.9%)
LTM< $50M 2,451 3,018 2,936 (2.7%) $40,684 $44,358 $37,292 (15.9%)$50M-$250M 1,341 1,229 723 (41.2%) $156,037 $138,739 $81,735 (41.1%)$250M-$750M 627 457 257 (43.8%) $271,991 $193,534 $104,196 (46.2%)Total Middle-Market 4,419 4,704 3,916 (16.8%) $468,712 $376,630 $223,223 (40.7%)> 750M 455 260 150 (42.3%) $1,306,297 $820,851 $562,424 (31.5%)Undisclosed 8,017 6,566 4,815 (26.7%) – – – –Total Deals 12,891 11,530 8,881 (23.0%) $1,775,009 $1,197,482 $785,647 (34.4%)
NUMBER OF DEALS DEAL VALUE

U.S. M&A Activity (cont'd)
www.williamblair.com 7
U.S. M&A Activity (cont'd) Annual Activity
U.S. M&A Activity
Number of Deals 1998 1999 2000 2001 2002 2003 2004 2005 2006 2007 2008 11/08
YTD 11/09 YTD
>$750M 265 252 327 190 128 146 233 281 364 462 231 220 139 Middle Market 6,399 5,351 6,791 4,624 4,019 4,237 4,532 4,465 4,524 4,478 4,716 4,329 3,529 Undisclosed 6,435 7,127 5,675 5,277 4,801 4,407 5,163 5,328 7,471 8,265 6,408 5,959 4,366
Deal Value $1,583 $1,719 $1,608 $871 $569 $688 $995 $1,300 $1,657 $1,754 $1,091 $1,055 $750
Source: Dealogic and William Blair & Company, L.L.C. Mergers and Acquisitions market analysis.
U.S. Middle-Market M&A Activity
Number of Deals 1998 1999 2000 2001 2002 2003 2004 2005 2006 2007 2008 11/08
YTD 11/09 YTD
$250-750M 429 527 514 298 291 315 409 427 535 626 424 408 241 $50-250M 1,446 1,426 1,588 1,010 897 1,071 1,226 1,276 1,295 1,328 1,195 1,123 651 <$50M 4,524 3,398 4,689 3,316 2,831 2,851 2,897 2,762 2,694 2,524 3,097 2,798 2,637
Deal Value $403 $441 $463 $280 $259 $293 $354 $366 $420 $465 $357 $339 $205
Source: Dealogic and William Blair & Company, L.L.C. Mergers and Acquisitions market analysis. .
Undisclosed Middle Market Deal Value>$750M
13,099 12,730 12,793
10,0918,948 8,790
9,928 10,074
12,35913,205
11,35510,508
8,034
$0
$600
$1,200
$1,800
$2,400
0
5,000
10,000
15,000
Deal Value($ in billions)
Number of Deals
<$50M $50-250M Deal Value$250-750M
6,399
5,351
6,791
4,6244,019 4,237
4,532 4,4654,524
4,4784,716
4,329
3,529
$0
$100
$200
$300
$400
$500
$600
0
1,000
2,000
3,000
4,000
5,000
6,000
7,000
Deal Value($ in billions)
Number of Deals

U.S. M&A Activity (cont'd)
www.williamblair.com 8
U.S. M&A Activity (cont'd) Valuation Multiples
Overall, acquisition multiples as measured by enterprise value/EBITDA remain well below their 2008 levels, reflecting the uncertain economic outlook, reduced corporate profits, tight credit markets, volatile equity markets, and reduced competition between strategic and financial buyers.
The one-week and four-week acquisition premiums paid for public companies have reached their highest levels in more than a decade. However, given the recent sharp rebound in equity prices, we believe that these premiums will likely begin to trend lower.
U.S. EV/EBITDA Valuation Multiples(1)
Middle Market 9.2x 8.0x 7.4x 6.9x 8.2x 7.4x 8.5x 10.6x 9.6x 9.2x 8.2x 7.3x Overall Market 9.6x 8.5x 7.8x 7.3x 8.0x 8.0x 9.0x 10.4x 10.3x 10.4x 9.3x 8.1x
(1) Effective with the July 2009 issue, we revised our parameters to exclude transactions in the financial institutions sector. All periods have been recalculated and the current results are not comparable to those published prior to July 2009.
Source: Dealogic and William Blair & Company, L.L.C. Mergers and Acquisitions market analysis.
U.S. EV/EBITDA Middle-Market Valuation Multiples(1)
< $50M 8.0x 7.8x 7.0x 6.0x 7.2x 8.3x 8.0x 7.9x 10.2x 7.8x 6.0x 5.6x $50M-$250M 9.9x 8.1x 7.4x 7.8x 7.7x 6.7x 8.2x 11.1x 9.0x 9.3x 10.6x 7.8x $250M-$750M 10.9x 8.5x 8.0x 7.2x 9.6x 7.9x 9.1x 11.2x 9.5x 9.3x 10.1x 7.8x
(1) Effective with the July 2009 issue, we revised our parameters to exclude transactions in the financial institutions sector. All periods have been recalculated and the current results are not comparable to those published prior to July 2009.
Source: Dealogic and William Blair & Company, L.L.C. Mergers and Acquisitions market analysis.
Median Acquisition Premiums
1-Week Premium 38.4% 38.9% 41.2% 47.1% 45.0% 35.3% 26.4% 32.1% 27.6% 29.4% 38.0% 46.0% 4-Week Premium 42.3% 47.0% 49.0% 52.8% 47.5% 41.8% 29.8% 36.0% 30.4% 31.5% 43.0% 55.8%
Source: Dealogic and William Blair & Company, L.L.C. Mergers and Acquisitions market analysis.
3.0x
6.0x
9.0x
12.0x
1998 1999 2000 2001 2002 2003 2004 2005 2006 2007 2008 LTM
Middle Market Overall Market
3.0x
6.0x
9.0x
12.0x
1998 1999 2000 2001 2002 2003 2004 2005 2006 2007 2008 LTM
< $50M $50M-$250M $250M-$750M
20.0%
40.0%
60.0%
1998 1999 2000 2001 2002 2003 2004 2005 2006 2007 2008 LTM
1-Week Premium 4-Week Premium

U.S. M&A Activity (cont'd)
www.williamblair.com 9
U.S. M&A Activity (cont'd) Private-Equity Transaction Analysis
For the month, there were just 82 U.S. related private-equity transactions, almost 15% below the year-ago period and also well below the monthly average of 110.
However, the dollar value of $17.1 billion was more than twice the comparable period last year and 58% above the monthly average. This increase in volume was attributable to a number of larger transactions, resulting in an almost 140% increase in dollar volume for transactions in excess of $750 million.
Year-to-date, there have been just 1,199 announced transactions, 31.3% less than the corresponding period last year. The dollar volume has experienced an even more dramatic decline, down 40.2% year-to-date compared with the corresponding period last year and down a staggering 79.3% compared with 2007.
U.S. Private-Equity Activity Detail
Source: Dealogic and William Blair & Company, L.L.C. Mergers and Acquisitions market analysis.
U.S. Private-Equity Activity
Number of Deals 1998 1999 2000 2001 2002 2003 2004 2005 2006 2007 2008 11/08
YTD 11/09 YTD
>$750M 24 32 29 21 26 34 74 92 119 161 50 49 34 Middle Market 367 546 775 557 618 715 1,013 989 1,094 880 826 765 610 Undisclosed 327 493 510 488 481 633 795 1,007 1,221 1,443 988 932 555 Deal Value $93 $130 $134 $87 $98 $133 $252 $332 $578 $646 $212 $207 $124
Source: Dealogic and William Blair & Company, L.L.C. Mergers and Acquisitions market analysis.
2007 2008 2009% Chg.
'09 vs. '08 2007 2008 2009% Chg.
'09 vs. '08NOVEMBERMiddle-Market 70 40 38 (5.0%) $9,657 $3,147 $6,291 99.9%Monthly Average 73 70 56 (20.1%) $11,813 $8,093 $4,369 (46.0%)> 750M 3 3 5 66.7% $9,900 $4,550 $10,850 138.5%Undisclosed 123 53 39 (26.4%) – – – –Total Deals 196 96 82 (14.6%) $19,557 $7,697 $17,141 122.7%Monthly Average 205 161 110 (31.6%) $54,800 $21,167 $10,755 (49.2%)
YTDMiddle-Market 805 765 610 (20.3%) $127,436 $85,986 $48,590 (43.5%)> 750M 145 49 34 (30.6%) $471,895 $121,184 $75,338 (37.8%)Undisclosed 1,354 932 555 (40.5%) – – – –Total Deals 2,304 1,746 1,199 (31.3%) $599,331 $207,170 $123,928 (40.2%)
LTMMiddle-Market 879 840 671 (20.1%) $141,761 $97,111 $52,426 (46.0%)> 750M 156 65 35 (46.2%) $515,839 $156,893 $76,638 (51.2%)Undisclosed 1,430 1,021 611 (40.2%) – – – –Total Deals 2,465 1,926 1,317 (31.6%) $657,600 $254,004 $129,064 (49.2%)
NUMBER OF DEALS DEAL VALUE
Undisclosed Middle Market Deal Value>$750M
7181,071
1,3141,066 1,125
1,382
1,8822,088
2,434 2,484
1,864 1,746
1,199
$0
$100
$200
$300
$400
$500
$600
$700
0
500
1,000
1,500
2,000
2,500
Deal Value($ in billions)Number of Deals

U.S. M&A Activity (cont'd)
www.williamblair.com 10
U.S. M&A Activity (cont'd) Private-Equity Transaction Analysis (cont’d)
The computer and electronics sector remains the most active sector for private-equity investors, with 305 announced transactions year-to-date. This total remains more than the next two sectors combined — healthcare and professional services with 145 deals each. These three industries alone continue to represent approximately 50% of the total year-to-date announced deals.
Based on dollar volume, the finance sector remains the most active area, with $29.1 billion in announced year-to-date dollar volume and accounting for almost 25% of the total. Remaining in second place is computers and electronics, which has dramatically narrowed the gap and is now less than $2 billion behind the finance industry for most active.
Private Equity Activity by Target Sector
Source: Dealogic and William Blair & Company, L.L.C. Mergers and Acquisitions market analysis.
2006 2007 2008 2009 YTD 2006 2007 2008 2009 YTD
Aerospace 17 19 11 6 $4,947 $7,769 $2,555 $1,050Agribusiness 9 7 7 4 – $75 $150 $52Auto/Truck 57 55 46 35 $5,266 $19,588 $746 $1,113Chemicals 61 83 55 27 $14,190 $18,982 $5,357 $1,457Computers & Electronics 496 412 389 305 $56,687 $44,044 $22,953 $27,143Construction/Building 92 85 77 37 $10,229 $15,784 $3,504 $648Consumer Products 93 138 68 30 $9,650 $15,922 $5,947 $2,320Defense 3 7 4 1 $410 $905 $25 $214Dining & Lodging 49 48 30 14 $19,024 $39,553 $3,710 $896Finance 83 129 97 60 $20,757 $77,639 $33,303 $29,121Food & Beverage 65 57 55 28 $9,952 $16,277 $8,380 $7,082Forestry & Paper 23 28 14 3 $5,136 $7,474 $750 $15Government 2 4 2 – $8 – $8 –Healthcare 244 230 180 145 $81,648 $48,210 $15,431 $13,863Holding Companies 18 25 16 5 $4,172 $6,801 $1,857 $65Insurance 41 60 42 21 $4,775 $13,572 $3,106 $3,319Leisure & Recreation 37 39 27 24 $33,925 $7,456 $2,212 $3,834Machinery 70 81 53 31 $5,374 $4,762 $1,791 $2,077Metal & Steel 61 57 45 23 $8,124 $6,999 $3,027 $662Mining 11 15 11 5 $1,673 $2,630 $911 $14Oil & Gas 74 59 62 33 $12,584 $19,089 $8,272 $3,320Professional Services 327 348 248 145 $29,767 $41,555 $16,103 $5,762Publishing 79 76 34 36 $8,921 $7,247 $1,416 $2,172Real Estate/Property 38 41 45 16 $77,603 $46,315 $4,937 $3,375Retail 73 94 65 47 $37,620 $27,252 $4,527 $4,035Telecommunications 150 118 68 52 $64,281 $66,592 $37,522 $4,560Textile 26 28 17 5 $825 $6,130 $1,206 $228Transportation 73 84 55 27 $20,877 $14,720 $3,230 $1,099Utility & Energy 62 57 41 34 $29,494 $62,826 $19,371 $4,433
TOTAL 2,434 2,484 1,864 1,199 $577,918 $646,166 $212,307 $123,928
NUMBER OF DEALS DOLLAR VOLUME
U.S. M&A Activity (cont'd)
www.williamblair.com 11
U.S. M&A Activity (cont'd) Transaction Breakdown
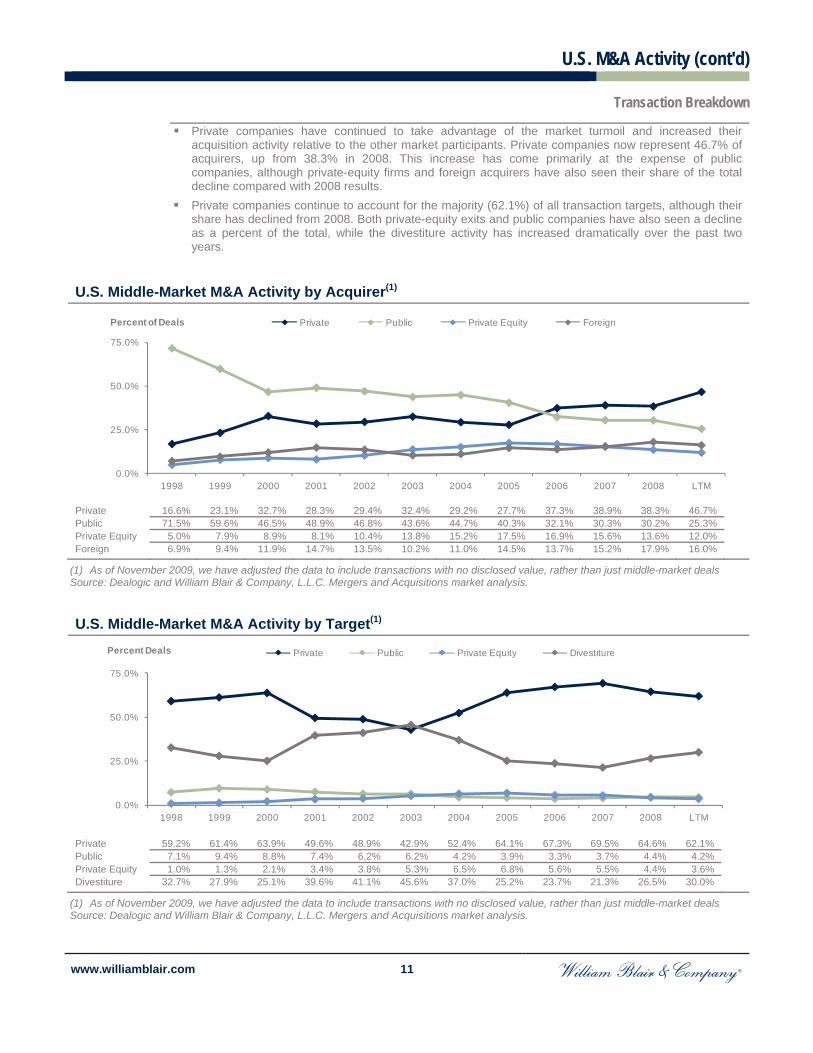
Private companies have continued to take advantage of the market turmoil and increased their acquisition activity relative to the other market participants. Private companies now represent 46.7% of acquirers, up from 38.3% in 2008. This increase has come primarily at the expense of public companies, although private-equity firms and foreign acquirers have also seen their share of the total decline compared with 2008 results.
Private companies continue to account for the majority (62.1%) of all transaction targets, although their share has declined from 2008. Both private-equity exits and public companies have also seen a decline as a percent of the total, while the divestiture activity has increased dramatically over the past two years.
U.S. Middle-Market M&A Activity by Acquirer(1)
Private 16.6% 23.1% 32.7% 28.3% 29.4% 32.4% 29.2% 27.7% 37.3% 38.9% 38.3% 46.7% Public 71.5% 59.6% 46.5% 48.9% 46.8% 43.6% 44.7% 40.3% 32.1% 30.3% 30.2% 25.3% Private Equity 5.0% 7.9% 8.9% 8.1% 10.4% 13.8% 15.2% 17.5% 16.9% 15.6% 13.6% 12.0% Foreign 6.9% 9.4% 11.9% 14.7% 13.5% 10.2% 11.0% 14.5% 13.7% 15.2% 17.9% 16.0%
(1) As of November 2009, we have adjusted the data to include transactions with no disclosed value, rather than just middle-market deals Source: Dealogic and William Blair & Company, L.L.C. Mergers and Acquisitions market analysis.
U.S. Middle-Market M&A Activity by Target(1)
Private 59.2% 61.4% 63.9% 49.6% 48.9% 42.9% 52.4% 64.1% 67.3% 69.5% 64.6% 62.1% Public 7.1% 9.4% 8.8% 7.4% 6.2% 6.2% 4.2% 3.9% 3.3% 3.7% 4.4% 4.2% Private Equity 1.0% 1.3% 2.1% 3.4% 3.8% 5.3% 6.5% 6.8% 5.6% 5.5% 4.4% 3.6% Divestiture 32.7% 27.9% 25.1% 39.6% 41.1% 45.6% 37.0% 25.2% 23.7% 21.3% 26.5% 30.0%
(1) As of November 2009, we have adjusted the data to include transactions with no disclosed value, rather than just middle-market deals Source: Dealogic and William Blair & Company, L.L.C. Mergers and Acquisitions market analysis.
0.0%
25.0%
50.0%
75.0%
1998 1999 2000 2001 2002 2003 2004 2005 2006 2007 2008 LTM
Percent of Deals Private Public Private Equity Foreign
0.0%
25.0%
50.0%
75.0%
1998 1999 2000 2001 2002 2003 2004 2005 2006 2007 2008 LTM
Percent Deals Private Public Private Equity Divestiture

U.S. M&A Activity (cont'd)
www.williamblair.com 12
U.S. M&A Activity (cont'd) Transaction Breakdown (cont’d)
Distressed U.S. M&A Activity
Number of Deals
1998 1999 2000 2001 2002 2003 2004 2005 2006 2007 2008 2009 YTD
>$750M 2 5 1 10 10 13 13 2 2 5 11 14 Middle Market 20 36 24 92 219 230 124 24 14 30 42 142 Undisclosed 7 21 15 45 79 64 47 15 20 35 48 167
Deal Value $7.6 $16.5 $4.0 $31.3 $49.3 $45.6 $30.0 $8.6 $5.6 $18.6 $42.8 $58.7
Source: Dealogic and William Blair & Company, L.L.C. Mergers and Acquisitions market analysis.
U.S. Take Private Transaction Activity
Number of Deals
1997 1998 1999 2000 2001 2002 2003 2004 2005 2006 2007 2008 2009 YTD
>750M 7 4 4 2 2 4 2 10 13 33 35 5 1 Middle Market 16 17 35 19 11 17 22 13 19 30 31 20 16
Deal Value $12.7 $8.7 $13.9 $9.4 $5.2 $8.3 $7.1 $27.6 $49.6 $268.7 $262.0 $10.3 $4.4
Source: Dealogic and William Blair & Company, L.L.C. Mergers and Acquisitions market analysis.
Undisclosed Middle Market Deal Value>$750M
29
6240
147
308 307
184
41 36
70101
323
$0
$20
$40
$60
$80
$100
0
50
100
150
200
250
300
350
Deal Value($ in billions)Number of Deals
Middle Market >750M Deal Value
23 21
39
21
13
2124 23
32
63 66
25
17
$0
$50
$100
$150
$200
$250
$300
0
25
50
75
Deal Value($ in billions)Number of Deals
U.S. M&A Activity (cont'd)
www.williamblair.com 13
U.S. M&A Activity (cont'd) Industry Breakdown
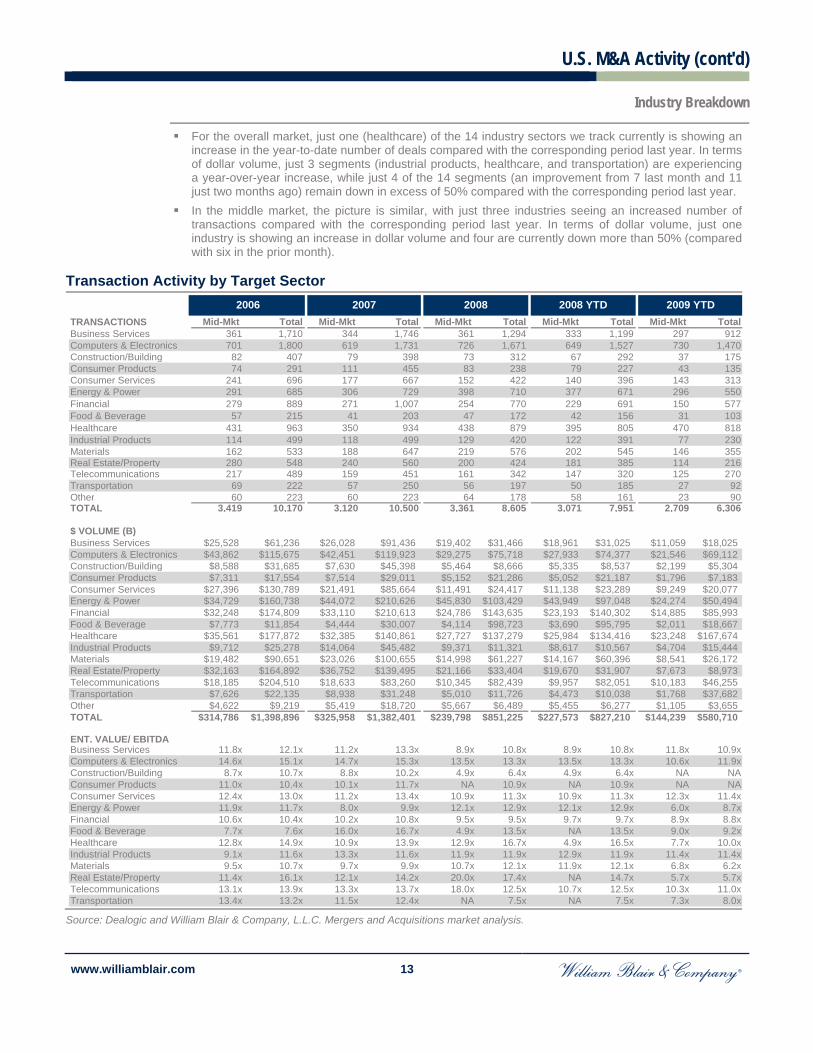
For the overall market, just one (healthcare) of the 14 industry sectors we track currently is showing an increase in the year-to-date number of deals compared with the corresponding period last year. In terms of dollar volume, just 3 segments (industrial products, healthcare, and transportation) are experiencing a year-over-year increase, while just 4 of the 14 segments (an improvement from 7 last month and 11 just two months ago) remain down in excess of 50% compared with the corresponding period last year.
In the middle market, the picture is similar, with just three industries seeing an increased number of transactions compared with the corresponding period last year. In terms of dollar volume, just one industry is showing an increase in dollar volume and four are currently down more than 50% (compared with six in the prior month).
Transaction Activity by Target Sector
Source: Dealogic and William Blair & Company, L.L.C. Mergers and Acquisitions market analysis.
TRANSACTIONS Mid-Mkt Total Mid-Mkt Total Mid-Mkt Total Mid-Mkt Total Mid-Mkt TotalBusiness Services 361 1,710 344 1,746 361 1,294 333 1,199 297 912Computers & Electronics 701 1,800 619 1,731 726 1,671 649 1,527 730 1,470Construction/Building 82 407 79 398 73 312 67 292 37 175Consumer Products 74 291 111 455 83 238 79 227 43 135Consumer Services 241 696 177 667 152 422 140 396 143 313Energy & Power 291 685 306 729 398 710 377 671 296 550Financial 279 889 271 1,007 254 770 229 691 150 577Food & Beverage 57 215 41 203 47 172 42 156 31 103Healthcare 431 963 350 934 438 879 395 805 470 818Industrial Products 114 499 118 499 129 420 122 391 77 230Materials 162 533 188 647 219 576 202 545 146 355Real Estate/Property 280 548 240 560 200 424 181 385 114 216Telecommunications 217 489 159 451 161 342 147 320 125 270Transportation 69 222 57 250 56 197 50 185 27 92Other 60 223 60 223 64 178 58 161 23 90TOTAL 3,419 10,170 3,120 10,500 3,361 8,605 3,071 7,951 2,709 6,306
$ VOLUME (B)Business Services $25,528 $61,236 $26,028 $91,436 $19,402 $31,466 $18,961 $31,025 $11,059 $18,025Computers & Electronics $43,862 $115,675 $42,451 $119,923 $29,275 $75,718 $27,933 $74,377 $21,546 $69,112Construction/Building $8,588 $31,685 $7,630 $45,398 $5,464 $8,666 $5,335 $8,537 $2,199 $5,304Consumer Products $7,311 $17,554 $7,514 $29,011 $5,152 $21,286 $5,052 $21,187 $1,796 $7,183Consumer Services $27,396 $130,789 $21,491 $85,664 $11,491 $24,417 $11,138 $23,289 $9,249 $20,077Energy & Power $34,729 $160,738 $44,072 $210,626 $45,830 $103,429 $43,949 $97,048 $24,274 $50,494Financial $32,248 $174,809 $33,110 $210,613 $24,786 $143,635 $23,193 $140,302 $14,885 $85,993Food & Beverage $7,773 $11,854 $4,444 $30,007 $4,114 $98,723 $3,690 $95,795 $2,011 $18,667Healthcare $35,561 $177,872 $32,385 $140,861 $27,727 $137,279 $25,984 $134,416 $23,248 $167,674Industrial Products $9,712 $25,278 $14,064 $45,482 $9,371 $11,321 $8,617 $10,567 $4,704 $15,444Materials $19,482 $90,651 $23,026 $100,655 $14,998 $61,227 $14,167 $60,396 $8,541 $26,172Real Estate/Property $32,163 $164,892 $36,752 $139,495 $21,166 $33,404 $19,670 $31,907 $7,673 $8,973Telecommunications $18,185 $204,510 $18,633 $83,260 $10,345 $82,439 $9,957 $82,051 $10,183 $46,255Transportation $7,626 $22,135 $8,938 $31,248 $5,010 $11,726 $4,473 $10,038 $1,768 $37,682Other $4,622 $9,219 $5,419 $18,720 $5,667 $6,489 $5,455 $6,277 $1,105 $3,655TOTAL $314,786 $1,398,896 $325,958 $1,382,401 $239,798 $851,225 $227,573 $827,210 $144,239 $580,710
ENT. VALUE/ EBITDA Business Services 11.8x 12.1x 11.2x 13.3x 8.9x 10.8x 8.9x 10.8x 11.8x 10.9xComputers & Electronics 14.6x 15.1x 14.7x 15.3x 13.5x 13.3x 13.5x 13.3x 10.6x 11.9xConstruction/Building 8.7x 10.7x 8.8x 10.2x 4.9x 6.4x 4.9x 6.4x NA NAConsumer Products 11.0x 10.4x 10.1x 11.7x NA 10.9x NA 10.9x NA NAConsumer Services 12.4x 13.0x 11.2x 13.4x 10.9x 11.3x 10.9x 11.3x 12.3x 11.4xEnergy & Power 11.9x 11.7x 8.0x 9.9x 12.1x 12.9x 12.1x 12.9x 6.0x 8.7xFinancial 10.6x 10.4x 10.2x 10.8x 9.5x 9.5x 9.7x 9.7x 8.9x 8.8xFood & Beverage 7.7x 7.6x 16.0x 16.7x 4.9x 13.5x NA 13.5x 9.0x 9.2xHealthcare 12.8x 14.9x 10.9x 13.9x 12.9x 16.7x 4.9x 16.5x 7.7x 10.0xIndustrial Products 9.1x 11.6x 13.3x 11.6x 11.9x 11.9x 12.9x 11.9x 11.4x 11.4xMaterials 9.5x 10.7x 9.7x 9.9x 10.7x 12.1x 11.9x 12.1x 6.8x 6.2xReal Estate/Property 11.4x 16.1x 12.1x 14.2x 20.0x 17.4x NA 14.7x 5.7x 5.7xTelecommunications 13.1x 13.9x 13.3x 13.7x 18.0x 12.5x 10.7x 12.5x 10.3x 11.0xTransportation 13.4x 13.2x 11.5x 12.4x NA 7.5x NA 7.5x 7.3x 8.0x
2009 YTD2006 2007 2008 2008 YTD

U.S. M&A Activity (cont'd)
www.williamblair.com 14
U.S. M&A Activity (cont'd) Cross-Border Transaction Analysis
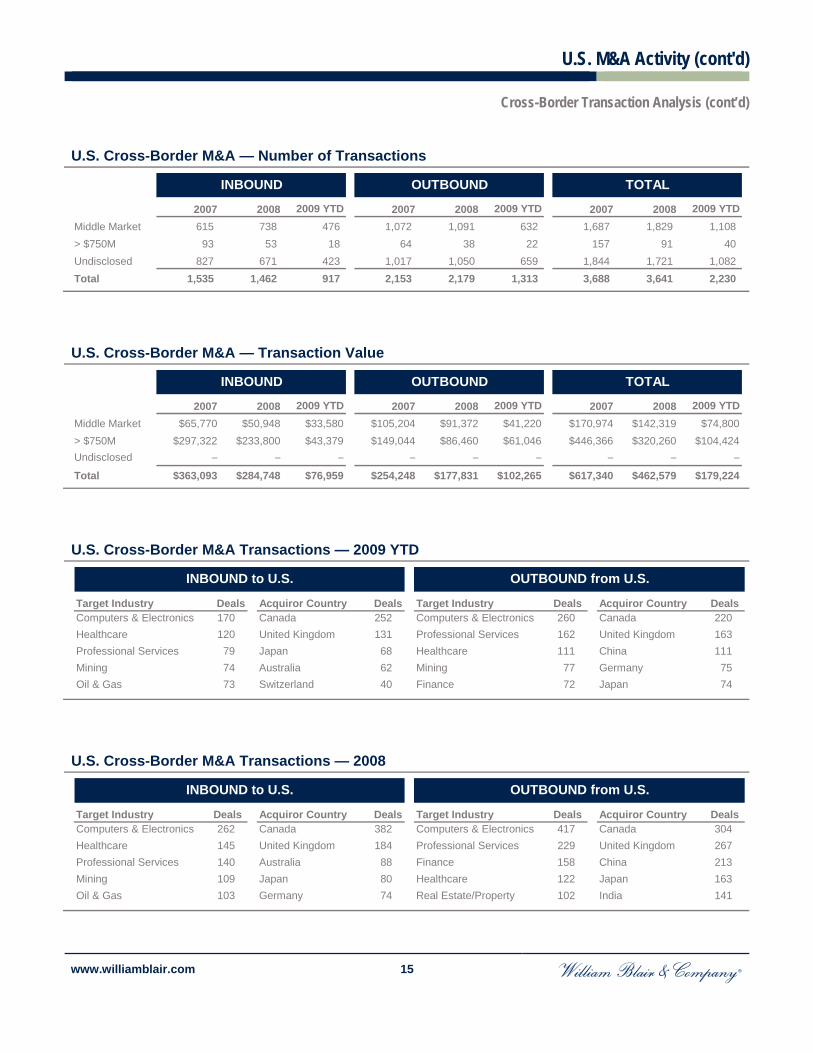
Total U.S. cross-border activity and middle-market cross-border activity continue to decline moderately from prior levels.
For the overall market, the LTM transaction breakdown is about 60%/40% in favor of outbound transactions, similar to the totals for all of 2006 and 2007.
In the middle market, the LTM transaction breakdown favors the outbound transactions 60% to 40%. For middle-market and undisclosed transactions, the most actively targeted U.S. industries by foreign
buyers are computers/electronics, healthcare, and professional services. The most active foreign buyers making acquisitions in the United States remain the same, Canada, the
United Kingdom, and Japan. The top industries outside the United States targeted by U.S. buyers remain the same:
computer/electronics, professional services, and healthcare. The top countries targeted by U.S. buyers were Canada followed by the United Kingdom and China.
U.S. Middle-Market Cross-Border M&A by Number of Deals
Number of Deals
1998 1999 2000 2001 2002 2003 2004 2005 2006 2007 2008 LTM
Inbound Middle Market 383 469 684 572 442 365 434 526 517 615 738 531 Undisclosed 297 398 397 449 409 257 357 526 751 827 671 470 Value $37.2 $46.8 $65.2 $38.5 $30.2 $24.3 $39.9 $44.2 $57.0 $65.8 $50.9 $35.1 Outbound Middle Market 757 844 871 676 557 525 699 748 818 1,072 1,091 703 Undisclosed 946 1,002 1,056 772 562 493 621 673 797 1,017 1,050 727 Value $55.6 $77.5 $71.6 $49.3 $36.2 $39.0 $59.4 $61.2 $71.7 $105.2 $91.4 $45.4
Source: Dealogic and William Blair & Company, L.L.C. Mergers and Acquisitions market analysis.
Outbound Inbound Outbound Deal ValueInbound Deal Value
1,7031,846 1,927
1,448
1,1191,018
1,3201,421
1,615
2,089 2,141
1,430
680 8671,081 1,021
851
622791
1,0521,268
1,442 1,409
1,001
$0
$20
$40
$60
$80
$100
$120
0
500
1,000
1,500
2,000
2,500
Deal Value($ in billions)Number of Deals
U.S. M&A Activity (cont'd)
www.williamblair.com 15
U.S. M&A Activity (cont'd) Cross-Border Transaction Analysis (cont’d)
U.S. Cross-Border M&A — Number of Transactions
U.S. Cross-Border M&A — Transaction Value
U.S. Cross-Border M&A Transactions — 2009 YTD
U.S. Cross-Border M&A Transactions — 2008
2007 2008 2009 YTD 2007 2008 2009 YTD 2007 2008 2009 YTDMiddle Market 615 738 476 1,072 1,091 632 1,687 1,829 1,108 > $750M 93 53 18 64 38 22 157 91 40 Undisclosed 827 671 423 1,017 1,050 659 1,844 1,721 1,082 Total 1,535 1,462 917 2,153 2,179 1,313 3,688 3,641 2,230
TOTALINBOUND OUTBOUND
2007 2008 2009 YTD 2007 2008 2009 YTD 2007 2008 2009 YTDMiddle Market $65,770 $50,948 $33,580 $105,204 $91,372 $41,220 $170,974 $142,319 $74,800> $750M $297,322 $233,800 $43,379 $149,044 $86,460 $61,046 $446,366 $320,260 $104,424Undisclosed – – – – – – – – –Total $363,093 $284,748 $76,959 $254,248 $177,831 $102,265 $617,340 $462,579 $179,224
TOTALINBOUND OUTBOUND
Target Industry Deals Acquiror Country Deals Target Industry Deals Acquiror Country DealsComputers & Electronics 170 Canada 252 Computers & Electronics 260 Canada 220Healthcare 120 United Kingdom 131 Professional Services 162 United Kingdom 163Professional Services 79 Japan 68 Healthcare 111 China 111Mining 74 Australia 62 Mining 77 Germany 75Oil & Gas 73 Switzerland 40 Finance 72 Japan 74
OUTBOUND from U.S.INBOUND to U.S.
Target Industry Deals Acquiror Country Deals Target Industry Deals Acquiror Country DealsComputers & Electronics 262 Canada 382 Computers & Electronics 417 Canada 304Healthcare 145 United Kingdom 184 Professional Services 229 United Kingdom 267Professional Services 140 Australia 88 Finance 158 China 213Mining 109 Japan 80 Healthcare 122 Japan 163Oil & Gas 103 Germany 74 Real Estate/Property 102 India 141
INBOUND to U.S. OUTBOUND from U.S.

U.S. Financing Markets
www.williamblair.com 16
U.S. Financing Markets Debt Capital Markets
The average debt multiple for LBO loans continues to decline, with total debt/EBITDA for transactions with companies below $50 million of EBITDA currently at 3.5x, down from 4.4x at the beginning of the year and 5.3x at the beginning of 2008.
For companies with more than $50 million in EBITDA, the leverage multiples have ticked up slightly, and now stand at 3.9x total debt and 3.2x senior debt. This compares with total debt of 4.0x and senior debt of 3.4x at the beginning of the year.
The average total equity contribution for the LTM period through September 30, 2009, was 43.9% for all transactions, which is at the top end of the historical range.
Average Pro Forma Adjusted Credit Statistics of Middle-Market LBO Loans (Issuers with EBITDA of Less Than $50M)
(1) Total Equity equals common, preferred and rollover equity. Source: S&P’s Leveraged Lending Review.
Average Pro Forma Adjusted Credit Statistics of Middle-Market LBO Loans (Issuers with EBITDA of More Than $50M)
Source: S&P’s Leveraged Lending Review.
3.8x 4.0x3.6x
3.5x
3.9x4.1x
4.4x
5.0x 4.9x5.3x
4.4x
3.5x
3.1x 3.2x3.0x 3.3x
3.4x
2.4x
3.9x4.4x
4.8x 4.6x
3.3x
2.7x2.0x
3.0x
4.0x
5.0x
6.0x
7.0x
2.0x
3.0x
4.0x
5.0x
6.0x
7.0x
1999 2000 2001 2002 2003 2004 2005 2006 2007 2008 2009
Total Debt/EBITDA Senior Debt/EBITDA
4.9x
4.1x3.9x
3.8x
4.5x5.0x
4.6x
5.7x 5.6x
5.8x
4.0x3.9x
3.7x
3.2x 3.3x
2.8x 2.8x 2.9x3.2x
4.4x
5.2x
5.8x
3.4x3.2x
2.0x
3.0x
4.0x
5.0x
6.0x
7.0x
2.0x
3.0x
4.0x
5.0x
6.0x
7.0x
1999 2000 2001 2002 2003 2004 2005 2006 2007 2008 2009
Total Debt/EBITDA Senior Debt/EBITDA

U.S. Financing Markets
www.williamblair.com 17
U.S. Financing Markets (Cont'd)
Average Total Equity Contribution
1997 1998 1999 2000 2001 2002 2003 2004 2005 2006 2007 2008 LTM
10/31/09
(1) Total Equity equals common, preferred and rollover equity. Source: S&P’s Leveraged Lending Review.
28.9% 29.9%
34.2%36.1% 36.3%
40.8% 37.9% 39.7%
35.4%37.0%
34.2%
45.3%43.9%
25.2%26.8%
30.0% 29.6%31.0%
36.7%
32.4% 31.5%29.9%
31.5% 32.3%
41.5%
0.0%
10.0%
20.0%
30.0%
40.0%
50.0%
Less than $50 million EBITDA More than $50 million EBITDA
(1)

U.S. Financing Markets
www.williamblair.com 18
U.S. Financing Markets (cont'd) Equity Capital Markets
IPO Pricings by Sector — Last 4 Quarters: 20 Total Deals
IPO Filings by Sector — Last 4 Quarters: 39 Total Deals
Source: Dealogic and William Blair & Company, L.L.C. Mergers and Acquisitions market analysis.
IPO Backlog(1)
Pricings 22 19 12 4 4 3 2 4 4 2 1 0 0 1 0 0 1 1 2 3 2 0 3 8 11 10 1
Filings 8 16 16 15 3 8 10 16 9 10 6 3 0 3 3 2 0 0 1 1 2 6 13 11 16 12 4 Withdrawn 11 16 8 12 9 7 4 5 5 1 5 6 12 8 11 2 3 4 8 2 2 2 2 1 3 5 2
(1) Backlog defined as IPOs filed or revised within the last 180 days, excluding SPACs, REITs and Rule 144A Offerings. Source: Dealogic and William Blair & Company, L.L.C. Mergers and Acquisitions market analysis.
Q4 20081 Q1 2009
2
Q2 20097
Q3 200910
Technology9
Healthcare3
Consumer2
Business Services
2
Industrial2
Financial Services
1
Other1
Q4 20085
Q1 20092
Q2 20094
Q3 200928
Technology9
Consumer8
Industrial7
Other6
Financial Services
4
Business Services
4
Healthcare1
140124
117 116101
9080
6958 58 63 61 55
47 4434
2113 11 9 7
17 26
39 4652 55
0
5
10
15
20
25
0
20
40
60
80
100
120
140
160
10/0
7
11/0
7
12/0
7
01/0
8
02/0
8
03/0
8
04/0
8
05/0
8
06/0
8
07/0
8
08/0
8
09/0
8
10/0
8
11/0
8
12/0
8
01/0
9
02/0
9
03/0
9
04/0
9
05/0
9
06/0
9
07/0
9
08/0
9
09/0
9
10/0
9
11/0
9
12/0
9
Number of Deals Backlog Pricings Filings Withdrawn

Guest Column
www.williamblair.com 19
Guest Column Dykema M&A Survey Report
We would like to thank the law firm Dykema Gossett PLLC for allowing us to republish this copy of its 5th Annual Dykema Mergers & Acquisitions Outlook Survey. For more information, please contact one of the following:
David Cellitti Jin-Kyu Koh Doug Parker (312) 627-2177 (313) 568-6627 (248) 203-0703 [email protected] [email protected] [email protected]
EXECUTIVE SUMMARY As you know, the coming months represent a critical period for U.S. and international businesses in the M&A market. We are still in the midst of a difficult and unprecedented global financial crisis, and our President and Congress must address the economic climate, as well as numerous domestic and foreign policy issues.
The 5th Annual Dykema Mergers & Acquisitions Outlook Survey was designed to measure the perspectives of leading company executives and outside advisors on the direction of the M&A market in the coming year. Almost half of the survey’s respondents have recently been involved in a transaction that did not close, so they have good reason to keep a close watch on the M&A market.
The conclusions of the survey show increased optimism in both the U.S. economy and the M&A market. Corporate executives, who have in the past few years expressed serious concerns about the strength of the U.S. economy and mergers-and-acquisitions market, have new confidence in the coming year. However, they do not expect a quick and complete turnaround in 2010. Industry leaders told us that they believe:
distressed transactions will increase in the coming year; buyers with access to cash and financing have a lot of opportunities available in the M&A market; general U.S. economic conditions continue to be an important factor in the M&A arena, but the financial
markets are not as much of an issue as they were a year ago; and China will continue to be a principal source for investors in U.S. companies, but India and the UAE have lost
ground to Europe. A more detailed report of our findings is contained in the following pages. We hope you find this information insightful and informative. We plan to periodically re-examine these issues to continue in our effort to remain focused on the challenges that are of critical importance to our clients and the U.S. business community at large.

Guest Column (cont'd)
www.williamblair.com 20
Guest Column (cont'd)
2009 MERGERS & ACQUISITIONS SURVEY RESULTS Respondents were asked to complete a short questionnaire designed to measure their thoughts and perspectives on the direction of the M&A market in 2010. The following charts represent the collective input of all respondents to the survey. A full overview of the survey methodology can be found at the end of this report.
1. HOW STRONG WILL THE OVERALL U.S. M&A MARKET BE DURING THE NEXT 12 MONTHS?
Confidence in the U.S. M&A market is starting to increase after sliding for several years. In 2006, 63% of respondents thought the overall M&A market would be strong. In 2007, 36% thought it would be strong. In 2008, only 16% believed it would be strong, and 46% thought it would be weak in the coming year.
This increase in confidence is likely due to improving U.S. economic conditions, as well as stabilizing financing markets and greater access to credit.
Of respondents who think the M&A market will be weak in the next 12 months, only 5% have a positive outlook on the U.S. economy. Of respondents who think the M&A market will be strong in the next 12 months, 72% have a positive outlook on the economy.
Some respondents said: Credit markets look like they may be easing a bit to help fuel better deal flow. Good deals abound for people who want to move to niches not heeded heretofore. There is a current opportunity to acquire value at depressed prices. There is a significant supply of capital that needs to be put to use. Weakened companies will represent buying opportunities.
2. WHICH OF THE FOLLOWING IS MOST RESPONSIBLE FOR FUELING CURRENT U.S. M&A ACTIVITY?
27.62%
53.33%
19.05%
Strong Neutral Weak
31.43%
41.90%
7.62% 5.71%10.48%
2.86%
General U.S. Economic Conditions
StrategicBuyers
Private EquityBuyers
ForeignBuyers
FinancialMarkets
Other

Guest Column (cont'd)
www.williamblair.com 21
Guest Column (cont'd)
Strategic buyers are playing a more significant role in the current M&A market than in past years, likely resulting from the distressed opportunities available to these buyers who have access to financing and cash. General U.S. economic conditions continue to be an important factor, but the financial markets are not as much of an issue as they were a year ago. Last year, respondents said general economic conditions (32%), financial buyers (24%), and strategic
buyers (23%) were most responsible for fueling current market activity. Private equity buyers, which were once seen as leading drivers, have again reduced their presence in the
U.S. M&A market. In 2006, 47% of respondents thought PE buyers were most responsible for fueling current M&A activity. In 2007, 48% of respondents thought PE buyers were most responsible for fueling current M&A activity. In 2008, only 13% of respondents thought PE buyers were most responsible for fueling current M&A
activity, and for the first time PE buyers were not viewed as the leading driver, dropping to 4th place.
3. WHAT IS YOUR OUTLOOK FOR THE U.S. ECONOMY, GENERALLY, OVER THE NEXT 12 MONTHS?
Almost half of the respondents are neutral about the outlook for the U.S. economy, but approximately one-
third are positive and only 16% are negative. While not overly enthusiastic, responses are encouraging. Like the U.S. M&A market, confidence in the domestic economy is starting to improve. In 2005, 51% had a positive outlook on the economy. In 2006, that number dropped to 37%. In 2007, it dropped again to 28%. In 2008, only 8% had a positive outlook.
4. WHICH OF THE FOLLOWING BUYERS WILL INCREASE THEIR PRESENCE THE MOST IN THE U.S. M&A MARKET OVER THE NEXT 12 MONTHS (AS A PERCENTAGE OF TOTAL TRANSACTIONS)?
34.62%
49.04%
16.35%
Positive Neutral Negative
51.46%
21.36%27.18%
Strategic Buyers Financial Buyers Foreign Buyers

Guest Column (cont'd)
www.williamblair.com 22
Guest Column (cont'd)
5. WHICH OF THE FOLLOWING BUYERS WILL DECREASE THEIR PRESENCE THE MOST IN THE U.S. M&A MARKET OVER THE NEXT 12 MONTHS (AS A PERCENTAGE OF TOTAL TRANSACTIONS)?
There is a continued expectation that financial buyers will again decrease their presence in the market. With
credit markets still tight over the past year, buyers have been more selective about underlying company economics before making investments. In 2006, 36% of respondents believed that financial buyers were most likely to decrease their presence
the most. In 2007, 77% agreed. In 2008, 63% predicted financial buyers would further decrease their role.
Strategic buyers are again expected to increase their presence in the market.
In 2008, 51% of respondents believed that strategic buyers would most increase their presence in the market, up from 34% in 2007.
Many respondents see buying opportunities for strategics with strong balance sheets. Foreign buyers are expected to continue their strong role in the U.S. M&A market as many have cash and
access to deal financing. In 2008, 36% of respondents thought foreign buyers would most increase their presence in the market.
Respondents believe foreign buyers will continue to increase their activity as many have cash and easier access to deal financing.
In an open-ended question asking respondents to explain why they thought a buyer was likely to increase or
decrease market share, comments included: Strategic buyers have the motivation to buy in this kind of market. There appears to be a lot of money on the sidelines right now, particularly in the distressed market. The U.S. has huge excess production capacity right now. Strategic foreign buyers from the outside will
see this as an opportunity to produce within the U.S. Much of the money will come from the outside. With improving financial markets, strong strategic buyers will continue to pursue opportunities. For the
next 12-18 months, I am less sanguine about the ability of pure financial buyers to obtain funding. Strategic consolidation among industry participants will offer incentive beyond pure financial motivations
to complete transactions. Companies with access to capital will take advantage of the M&A market conditions to acquire good
assets/business at discounted valuation, facing less competition. As conditions in the general economy and specific industries become stabilized, the strategic buyers will feel more confident in doing a deal.
17.65%
53.92%
28.43%
Strategic Buyers Financial Buyers Foreign Buyers

Guest Column (cont'd)
www.williamblair.com 23
Guest Column (cont'd)
Strategic buyers are able to buy/fold in deeply distressed assets on an accretive basis as they can rationalize overhead and fixed costs in a manner that financial buyers looking at an opportunity as a stand-alone investment cannot. They also are not constrained by financing for smaller tuck-in deals.
Financial buyers have been almost nonexistent in the market, so they will be the first to benefit from any upturn in the economy and credit markets.
I believe we're on the cusp of a shift from strategic buyers, who sense opportunity in the down economy, to financial buyers, who will enter the market when they fear it is leaving the bottom. It may take more than a one-year window to become clear, but I believe signs will be evident in the coming 12 months.
Values have declined and foreign buyers are more likely to be cash buyers. Due to the shortage of funds from banks and other lenders, financial buyers are less likely to be able to
complete transactions and deliver the returns to which they are accustomed. Many strategic buyers sat on the sidelines during the private equity buying frenzy. These same
companies built up cash and cleaned up their balance sheets over the past few years. Now, they find themselves with less bidding competition for acquisition targets. The survivors are also able to consolidate their markets by scooping up weaker players who have been further weakened by the recession.
Given low percentage of PE activity over the last twelve months, financial buyers have nowhere to go but up.
Fundraising will be difficult; credit markets remain tight and problems with portfolio companies will slow PEG buyers.
Foreign buyers seem susceptible to the U.S. market and most of them are unfamiliar with our short process timelines in an environment that requires greater diligence.
Sovereign wealth funds are reeling from bad U.S. investments made at the peak. China is focusing on investments in its home market, and the dollar should appreciate as the U.S. leads the world out of recession.
The strength of the dollar may decrease the presence of foreign buyers in the next 12 months.
6. WHICH OF THE FOLLOWING TYPES OF BUYERS HAVE MOST INFLUENCED DEAL VALUATIONS OVER THE PAST 12 MONTHS?
For the first time in the survey’s history, strategic buyers were seen as the group most influencing deal
valuations over the previous year, slightly edging out financial buyers. In 2007, 75% of respondents said financial buyers have most influenced deal valuations over the past 12
months. In 2008, financial buyers were still the leading choice (41%), but strategic buyers were closing the gap
(27% compared to 13% in 2007). Responses indicate that financial buyers are still viewed as having an impact on the valuations but to a lesser
degree than they have in the past.
39.81%35.92%
8.74%
15.53%
Strategic Buyers Financial Buyers Foreign Buyers None of the Above
Guest Column (cont'd)
www.williamblair.com 24
Guest Column (cont'd)
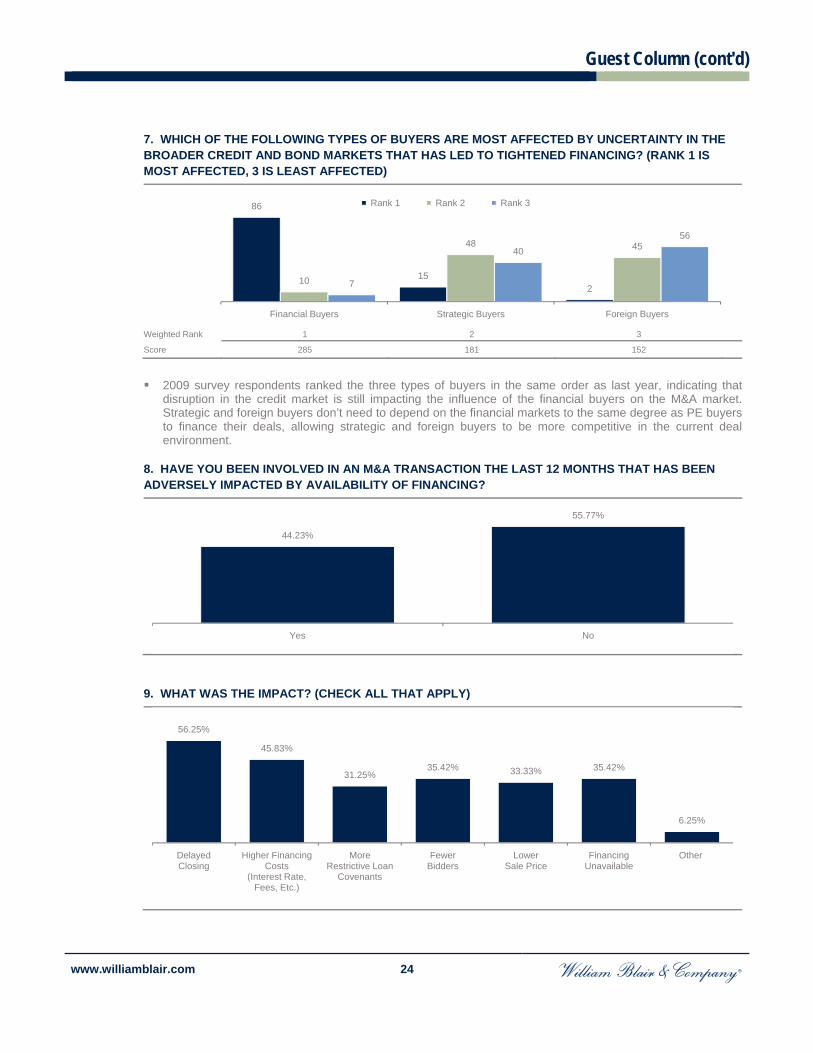
7. WHICH OF THE FOLLOWING TYPES OF BUYERS ARE MOST AFFECTED BY UNCERTAINTY IN THE BROADER CREDIT AND BOND MARKETS THAT HAS LED TO TIGHTENED FINANCING? (RANK 1 IS MOST AFFECTED, 3 IS LEAST AFFECTED)
Weighted Rank 1 2 3 Score 285 181 152
2009 survey respondents ranked the three types of buyers in the same order as last year, indicating that
disruption in the credit market is still impacting the influence of the financial buyers on the M&A market. Strategic and foreign buyers don’t need to depend on the financial markets to the same degree as PE buyers to finance their deals, allowing strategic and foreign buyers to be more competitive in the current deal environment.
8. HAVE YOU BEEN INVOLVED IN AN M&A TRANSACTION THE LAST 12 MONTHS THAT HAS BEEN ADVERSELY IMPACTED BY AVAILABILITY OF FINANCING?
9. WHAT WAS THE IMPACT? (CHECK ALL THAT APPLY)
86
152
10
48 45
7
40
56
Financial Buyers Strategic Buyers Foreign Buyers
Rank 1 Rank 2 Rank 3
44.23%
55.77%
Yes No
56.25%
45.83%
31.25%35.42% 33.33% 35.42%
6.25%
DelayedClosing
Higher FinancingCosts
(Interest Rate, Fees, Etc.)
More Restrictive Loan
Covenants
FewerBidders
LowerSale Price
FinancingUnavailable
Other

Guest Column (cont'd)
www.williamblair.com 25
Guest Column (cont'd)
As last year, more than 40% of respondents said they had at least one M&A transaction in the last year that was adversely impacted by the availability of financing. In 2008, the principal impacts of these financing issues were higher financing costs (66%), more
restrictive loan covenants (59%), lower sale prices (56%), and delayed closings (47%). The number of respondents citing lower sale price resulting from a transaction adversely impacted by the
availability of financing may have dropped due to more “meeting of the minds” between buyers and sellers when it comes to pricing.
10. WHAT SECTOR WILL SEE THE MOST M&A ACTIVITY, NATIONALLY, IN THE NEXT 12 MONTHS?
Automotive Biotechnology And Life Sciences
Energy Financial Services
Healthcare Manufacturing (Non-
Automotive)
Technology Telecommu-nications
Transpor-tation
Other
Given the months of turmoil on Wall Street, it is not surprising that 21% of respondents believe the financial
services industry will see the most M&A activity in the coming year. This is a decrease from the 32% of respondents in 2008 who believed financial services would see the
most activity, despite the significant collapses in industry institutions. Financial service entities continue to pick up distressed organizations. Ongoing FDIC organized
takeovers ultimately result in a sale of the entire institution or pieces of it.
11. WHAT SECTOR WILL SEE THE MOST M&A ACTIVITY, GLOBALLY, IN THE NEXT 12 MONTHS?
Automotive Biotechnology And Life Sciences
Energy Financial Services
Healthcare Manufacturing (Non-
Automotive)
Technology Telecommu-nications
Transpor-tation
Other
Globally, respondents think the financial services, energy, and technology sectors will see the most M&A activity in the coming year. While many companies are trying to crack into the U.S. renewable energy market, that arena is much
more developed internationally in areas such as Europe, Asia, and Africa, where local government regulations encourage the development of wind, solar, and other new power technologies.
No healthcare M&A market exists in countries with government-run health systems, which is likely the reason that healthcare is not anticipated to be as active globally as domestically.
3.92%
14.71%11.76%
20.59% 19.61%
8.82%
16.67%
0.00% 0.00%
3.92%
9.90%11.88%
17.82% 18.81%
5.94%
10.89%
17.82%
4.95%
0.00%1.98%
Guest Column (cont'd)
www.williamblair.com 26
Guest Column (cont'd)
12. WILL THERE BE A CHANGE IN THE NUMBER OF DISTRESSED TRANSACTIONS IN THE COMING YEAR?
13. WHAT INDUSTRY WILL SEE THE MOST DISTRESSED TRANSACTIONS IN THE NEXT 12 MONTHS?
Automotive Biotechnology And Life Sciences
Consumer Products
Energy Financial Services
Healthcare Housing / Construction
Manufacturing (Non-
Automotive)
Technology Telecommu-nications
Transpor-tation
Other
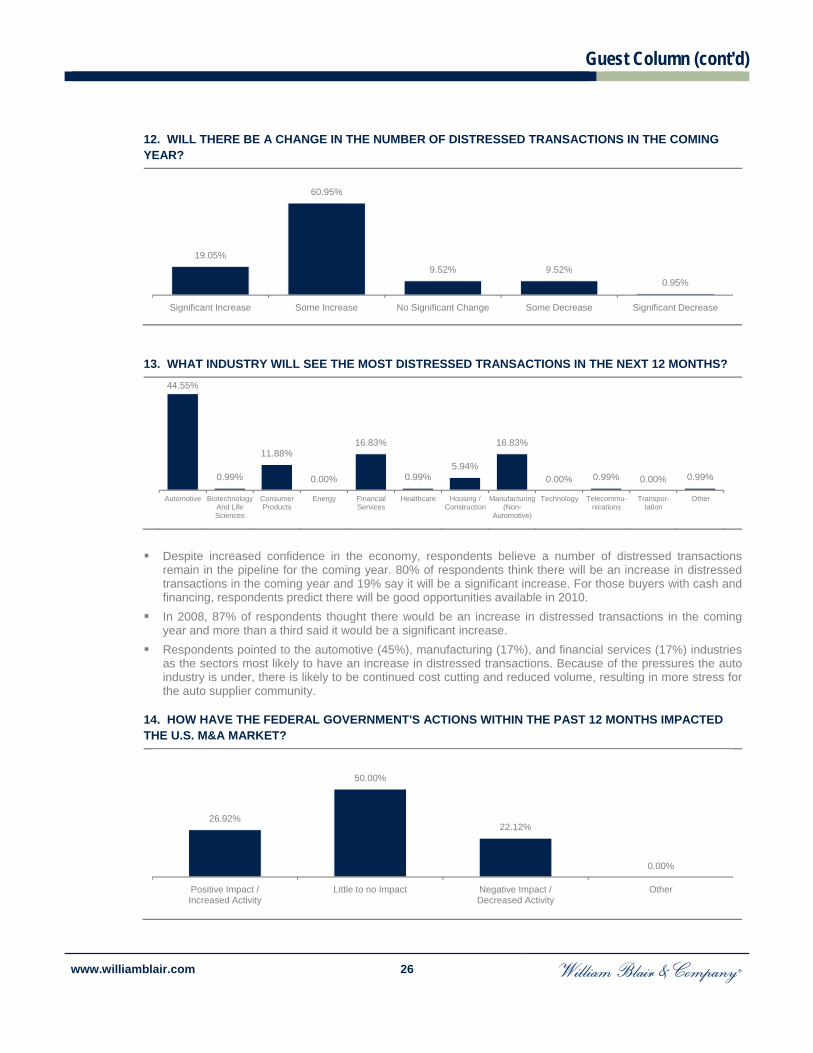
Despite increased confidence in the economy, respondents believe a number of distressed transactions
remain in the pipeline for the coming year. 80% of respondents think there will be an increase in distressed transactions in the coming year and 19% say it will be a significant increase. For those buyers with cash and financing, respondents predict there will be good opportunities available in 2010.
In 2008, 87% of respondents thought there would be an increase in distressed transactions in the coming year and more than a third said it would be a significant increase.
Respondents pointed to the automotive (45%), manufacturing (17%), and financial services (17%) industries as the sectors most likely to have an increase in distressed transactions. Because of the pressures the auto industry is under, there is likely to be continued cost cutting and reduced volume, resulting in more stress for the auto supplier community.
14. HOW HAVE THE FEDERAL GOVERNMENT'S ACTIONS WITHIN THE PAST 12 MONTHS IMPACTED THE U.S. M&A MARKET?
19.05%
60.95%
9.52% 9.52%0.95%
Significant Increase Some Increase No Significant Change Some Decrease Significant Decrease
44.55%
0.99%
11.88%
0.00%
16.83%
0.99%5.94%
16.83%
0.00% 0.99% 0.00% 0.99%
26.92%
50.00%
22.12%
0.00%
Positive Impact /Increased Activity
Little to no Impact Negative Impact /Decreased Activity
Other

Guest Column (cont'd)
www.williamblair.com 27
Guest Column (cont'd)
Respondents were split about whether stimulus spending, efforts to stabilize the financial markets, industry bailouts, and other government initiatives of the past year have impacted the domestic M&A market. Half believe that the actions taken by the U.S. government have made little to no difference in the arena.
In addition to rating the past actions of the federal government, survey respondents were given an opportunity to recommend what action the government should take to improve the U.S. M&A market. Suggestions included: Need to require TARP recipients to put some percentage of the money to work in C&I and transactional
lending. Clearly outline plans for new regulation. Let the markets take care of themselves and more readily adopt laissez-faire practices. Make capital gains tax rates permanent. Lower taxes. Better interest rates and accessibility to capital. Continue to work to improve the lending environment. Incentivize banks for taking risks. Let the market forces decide the activities. In other words, leave it alone. Force low cost loans to flow to the industrial companies and away from the financials. Resolve healthcare reform and provide more visibility to future changes in the tax code. Back out of the market with little fed involvement. Get back to basics of common sense and ethics. Don't overreact. Think long range instead of short range
politics. Every action has a reaction. Providing everything for all for free is no answer. There is always a payback.
None. Credit/capital markets have to free up, government intervention cannot free up risk tolerance, it comes down to risk and there is still plenty of it, with little view into when economy will turn.
15. WHERE WILL THE MOST FOREIGN BUYERS IN THE U.S. M&A MARKET COME FROM IN THE NEXT 12 MONTHS?
Respondents continue to look at China as a principal source for investors in U.S. companies, but India and the UAE have lost ground to Europe. In 2007, respondents said China will be the leading country for foreign buyers in the U.S. M&A market
(39%), followed by the UK (17%), India (14%), and the UAE (9%). In 2008, respondents thought foreign buyers would come from China (28%), the UAE (23%), and India
(12%). Note: In previous surveys, European countries were listed separately. Added together, European nations were selected by 12% of respondents in 2008 and 21% of respondents in 2007.
0.00% 1.03% 2.06%
44.33%38.14%
5.15% 3.09% 1.03% 1.03% 0.00%4.12%
0.00%
Australia Brazil Canada China Europe India Japan Mexico Russia SouthKorea
United ArabEmirates
(UAE)
Other

Guest Column (cont'd)
www.williamblair.com 28
Guest Column (cont'd)
16. WHAT COUNTRY WILL SEE THE MOST OUTBOUND U.S. MERGERS AND ACQUISITIONS?
For the first time, respondents say Europe will be the leading region for U.S. buyers making foreign
acquisitions. China, the second choice of respondents, has been losing ground for several years. 40% of respondents in
2008 thought that nation would see the most outbound M&A, and 53% had that view in 2007. Note: In previous surveys, European countries were listed separately. Added together, European nations were selected by 16% of respondents in 2008 and 17% of respondents in 2007.
17. IN TODAY'S ECONOMY, ARE YOU SEEING MORE DEALS STRUCTURED DIFFERENTLY THAN IN THE PAST? (CHECK ALL THAT APPLY)
Reflective of the turmoil in the M&A market stemming from continued disruption in the credit markets, almost
three-quarters of respondents say they are seeing deals structured differently than in the past. Earnouts are likely becoming more prevalent because buyers want more certainty as to the value of the
target. The increase in seller financing indicates the continued weakness in the M&A financing market.
0.00% 1.10%
8.79%
32.97%
41.76%
6.59%1.10%
6.59%0.00% 0.00% 0.00% 0.00% 0.00% 0.00%
Australia Brazil Canada China Europe India Japan Mexico Poland Romania RussiaSouth KoreaVietnam Other
21.78%
48.51%
5.94%14.85%
4.95%
47.52%
28.71%
3.96% 0.99%
No Yes, Seeing More
Earnouts
Yes, Seeing More
Rollups
Yes,Seeing More
Joint Ventures
Yes, Seeing More
Esops
Yes,Seeing More
Seller Financing
Yes,Seeing MoreSubordinated
Debt Financing
Yes,Seeing MoreAsset Swaps
Other

Guest Column (cont'd)
www.williamblair.com 29
Guest Column (cont'd)
18. IN THE NEXT 12 MONTHS, DO YOU BELIEVE YOUR COMPANY WILL BE INVOLVED IN AN ACQUISITION?
19. IN THE NEXT 12 MONTHS, DO YOU BELIEVE YOUR COMPANY WILL BE SOLD, DOWNSIZED, OR INVOLVED IN A SPINOFF?
In 2007, 52% of respondents thought they would be involved in an acquisition and 16% thought they would
be sold, downsized or involved in a spinoff. In 2008, 45% thought their company would be involved in an acquisition in the next year. 12% thought they
would be sold, downsized or involved in a spinoff.
20. HAVE YOU BEEN INVOLVED IN ONE OR MORE M&A TRANSACTIONS IN THE LAST 12 MONTHS THAT DID NOT CLOSE?
42
62
40.38%59.62%
Yes No
Count %
8
96
7.69%
92.31%
Yes No
Count %
34
16
53
33.01%15.53%
51.46%
Yes, Terminated by Buyer Yes, Terminated by Seller No
Count %
Guest Column (cont'd)
www.williamblair.com 30
Guest Column (cont'd)
21. WHY DID THE TRANSACTION(S) NOT CLOSE? (CHECK ALL THAT APPLY)
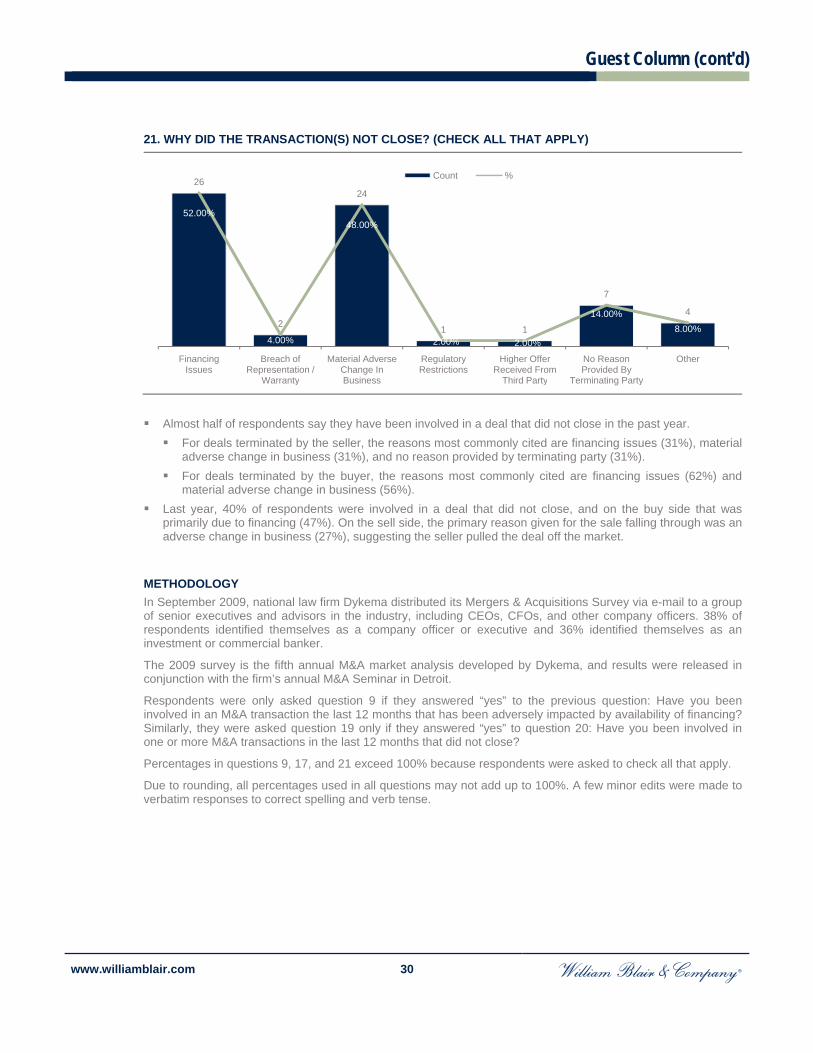
Almost half of respondents say they have been involved in a deal that did not close in the past year. For deals terminated by the seller, the reasons most commonly cited are financing issues (31%), material
adverse change in business (31%), and no reason provided by terminating party (31%). For deals terminated by the buyer, the reasons most commonly cited are financing issues (62%) and
material adverse change in business (56%). Last year, 40% of respondents were involved in a deal that did not close, and on the buy side that was
primarily due to financing (47%). On the sell side, the primary reason given for the sale falling through was an adverse change in business (27%), suggesting the seller pulled the deal off the market.
METHODOLOGY In September 2009, national law firm Dykema distributed its Mergers & Acquisitions Survey via e-mail to a group of senior executives and advisors in the industry, including CEOs, CFOs, and other company officers. 38% of respondents identified themselves as a company officer or executive and 36% identified themselves as an investment or commercial banker.
The 2009 survey is the fifth annual M&A market analysis developed by Dykema, and results were released in conjunction with the firm’s annual M&A Seminar in Detroit.
Respondents were only asked question 9 if they answered “yes” to the previous question: Have you been involved in an M&A transaction the last 12 months that has been adversely impacted by availability of financing? Similarly, they were asked question 19 only if they answered “yes” to question 20: Have you been involved in one or more M&A transactions in the last 12 months that did not close?
Percentages in questions 9, 17, and 21 exceed 100% because respondents were asked to check all that apply.
Due to rounding, all percentages used in all questions may not add up to 100%. A few minor edits were made to verbatim responses to correct spelling and verb tense.
26
2
24
1 1
7
4
52.00%
4.00%
48.00%
2.00% 2.00%
14.00%8.00%
FinancingIssues
Breach ofRepresentation /
Warranty
Material AdverseChange In Business
Regulatory Restrictions
Higher OfferReceived From
Third Party
No ReasonProvided By
Terminating Party
Other
Count %

Special Situations & Restructuring Market Update
www.williamblair.com 31
Special Situations & Restructuring Market Update
CORPORATE DEFAULTS PERSIST Since Standard & Poor’s began continually reporting on corporate default in 1981, 2009 marks the highest number of global defaults. As of November 20, 247 global corporate public debt issuers with debt worth over $570 billion, including 181 corporate public debt issuers from the United States, had defaulted year-to-date. This figure surpasses the 87 defaults during the same period in 2008. For calendar 2008, 126 defaults of public debt occurred worldwide with a face amount of over $430 billion. In addition to the United States, a similar rise in corporate defaults has occurred in Europe, Japan, Canada, and emerging markets.
Number of Global and U.S. Defaults Amount of Global Debt Affected
($ in billions)
Source: Standard & Poor’s.
The dramatic rise in global and domestic defaults has resulted from, among other things, tight credit markets, a decline in general economic activity, and deteriorating borrower credit quality. Further, the frothy debt capital markets resulted in unsustainably high debt levels for a number of companies. U.S. companies carry over $1.4 trillion in high-yield bonds and loans, with more than half of this debt coming due within the next five years, according to S&P. It is also increasingly more difficult in today’s economic environment to refinance this debt, as a result of tighter credit and fewer lenders with more stringent lending standards. Accordingly, amend-and-extend transactions, prepackaged bankruptcies, and §363 asset sales have all become more common solutions.
The number of defaults with speculative-grade debt rating–debt with a credit rating below investment grade–has increased in 2009. The credit rating agencies have similar rating systems, such as Moody’s (Aaa-C), Standard & Poor’s (AAA-C), and Fitch (AAA-C). The main indicator of corporate default used by these agencies is the speculative-grade default rate. This indicator takes data covering the credit experiences of corporate issuers that sold long-term public debt, and shows the percentage of those that have defaulted. The global speculative-grade default rate previously peaked in 2001 and declined throughout 2007. In 2008, the rise in defaults began and has steadily risen each month throughout 2009.
Year-End Global Speculative – Grade Default Rate (2001-2008)
Source: Moody’s.
Global U.S. Only
12687
247
181
0
50
100
150
200
250
300
2008 2009Global U.S. Only
$433
$573
$0
$100
$200
$300
$400
$500
$600
$700
2008 2009
10.2%
8.3%
5.2%
2.2%1.8% 1.7%
0.9%
4.0%
0.0%
2.0%
4.0%
6.0%
8.0%
10.0%
12.0%
2001 2002 2003 2004 2005 2006 2007 2008

Special Situations & Restructuring Market Update (cont'd)
www.williamblair.com 32
Special Situations & Restructuring Market Update (cont'd)
According to Moody’s ratings, the 12-month-trailing global corporate speculative-grade default rate, which includes the United States, increased from 4.8% in January 2009 to 12.4% in October 2009.
Global Speculative – Grade Default Rate (2009)
Source: Moody’s.
Similar to global trends, the U.S. default rate peaked in 2001 and gradually declined through 2007, followed by a steady increase throughout 2009.
Year-End U.S. Speculative – Grade Default Rate (2001-2008)
Source: Moody’s.
Domestically, the 12-month-trailing corporate speculative-grade default rate increased to 11.3% in October 2009 from 5.0% in January 2009. While sporadic positive economic news is buoying some markets, the majority of economic data supports a conclusion that the U.S. economy will remain soft for at least in the near term.
U.S. Speculative – Grade Default Rate (2009)
Source: Standard & Poor’s.
4.8%5.2%
7.4%8.3%
9.2%10.3% 10.7%
12.0% 12.3% 12.4%
4.0%
6.0%
8.0%
10.0%
12.0%
14.0%
January February March April May June July August September October
11.0%
7.3%
5.4%
2.8%2.2%
1.7% 0.9%
4.4%
0.0%
2.0%
4.0%
6.0%
8.0%
10.0%
12.0%
2001 2002 2003 2004 2005 2006 2007 2008
5.0%5.4% 5.5%
7.0%
8.3%9.2% 9.4%
10.2%10.8%
11.3%
4.0%
6.0%
8.0%
10.0%
12.0%
January February March April May June July August September October

Special Situations & Restructuring Market Update (cont'd)
www.williamblair.com 33
Special Situations & Restructuring Market Update (cont'd)
The outlook for 2010, although unsteady, is looking better than it did earlier this fall. Both Standard & Poor’s and Moody’s are forecasting declining default rates in 2010. The reopening of the debt markets, the decline in funding costs, and less volatility should mean better things in 2010 as a result of a moderate economic recovery. Standard & Poor’s projects a U.S. corporate speculative-grade default rate of 6.9% in September 2010, but warns it may reach as high 9.9% in the interim. Moody’s has projected the global speculative-grade default rate to peak at 12.5% in fourth quarter 2009 and decline sharply to sub-5% by fourth quarter 2010, as a result of a continued modest economic recovery.
Global Speculative – Grade Default Rate
U.S. Corporate Speculative – Grade Default Rate
Source: Moody’s. Source: Standard & Poor’s.
The main challenge for many companies remains unsustainable levels of debt (as witnessed by the increasing number of missed interest payments and hence default) in the face of massive debt maturities over the next several years. For instance, in the next five years, more than $440 billion in leveraged loans matures.
We expect that many well-managed companies will seek to deleverage and refinance early. Some companies have addressed the problem head on. There are those companies that had yet to address the prickly issue of unruly debt levels and could find themselves underwater when their debt matures. While we foresee both the global and U.S. default rates lessening in 2010, we expect this to be a gradual decline and overall levels to remain above historical averages.
5.2%
1.8%
12.5%
4.5%
0.0%
2.0%
4.0%
6.0%
8.0%
10.0%
12.0%
14.0%
December 2003
December 2005
December 2009P
December 2010P
5.4%
2.2%
10.8%
6.9%
0.0%
2.0%
4.0%
6.0%
8.0%
10.0%
12.0%
December 2003
December 2005
September 2009
September 2010P
Debt Maturity Schedule ($ in billions)
Investment Grade Leveraged Other
$0
$200
$400
$600
$800
$1,000
$1,200
Q3-Q4 2009
2010 2011 2012
$200
$700
$900$1,000

European M&A Activity
www.williamblair.com 34
European M&A Activity Transaction Detail
European M&A activity also picked up in November. The total number of announced deals for the month was 1,014, a modest 1.7% increase compared with
the corresponding period last year, although this number was a below the trailing-12-month monthly average of 1,199.
The total dollar volume for the month jumped to $87.9 billion, an increase of 176.1% compared with the corresponding period last year and significantly above the trailing-12-month monthly average of $64.0 billion.
However, European middle-market activity was just 365 announced deals, down 8.5% compared with the corresponding period last year, while the dollar volume of $21.7 billion represented a 10.8% increase.
European M&A Activity Detail
Source: Dealogic and William Blair & Company, L.L.C. Mergers and Acquisitions market analysis.
2007 2008 2009% Change '09 vs. '08 2007 2008 2009
% Change '09 vs. '08
NOVEMBER< $50M 382 323 267 (17.3%) $5,602 $3,812 $3,234 (15.1%)$50M-$250M 146 55 74 34.5% $16,325 $6,754 $8,539 26.4%$250M-$750M 64 21 24 14.3% $28,329 $9,008 $9,920 10.1%Total Middle-Market 592 399 365 (8.5%) $50,255 $19,574 $21,694 10.8%Monthly Average 545 553 401 (27.4%) $50,224 $43,902 $22,138 (49.6%)> 750M 41 8 22 175.0% $117,294 $12,277 $66,250 439.6%Undisclosed 769 590 627 6.3% – – – –Total Deals 1,402 997 1,014 1.7% $167,549 $31,850 $87,944 176.1%Monthly Average 1,259 1,361 1,199 (11.9%) $189,158 $124,231 $63,951 (48.5%)
YTD< $50M 3,644 4,007 3,285 (18.0%) $55,019 $53,156 $34,883 (34.4%)$50M-$250M 1,676 1,469 799 (45.6%) $192,882 $172,231 $91,289 (47.0%)$250M-$750M 710 554 267 (51.8%) $302,170 $242,130 $115,368 (52.4%)Total Middle-Market 6,030 6,030 4,351 (27.8%) $550,072 $467,517 $241,539 (48.3%)> 750M 484 317 159 (49.8%) $1,542,587 $827,752 $453,153 (45.3%)Undisclosed 7,544 8,610 8,720 1.3% – – – –Total Deals 14,058 14,957 13,230 (11.5%) $2,092,659 $1,295,269 $694,692 (46.4%)
LTM< $50M 3,931 4,354 3,637 (16.5%) $59,759 $58,390 $39,423 (32.5%)$50M-$250M 1,840 1,642 885 (46.1%) $212,701 $193,014 $101,667 (47.3%)$250M-$750M 774 634 290 (54.3%) $330,232 $275,423 $124,567 (54.8%)Total Middle-Market 6,545 6,630 4,812 (27.4%) $602,693 $526,827 $265,657 (49.6%)> 750M 527 372 179 (51.9%) $1,667,200 $963,945 $501,749 (47.9%)Undisclosed 8,031 9,330 9,392 0.7% – – – –Total Deals 15,103 16,332 14,383 (11.9%) $2,269,893 $1,490,771 $767,406 (48.5%)
NUMBER OF DEALS DEAL VALUE

European M&A Activity (cont'd)
www.williamblair.com 35
European M&A Activity (cont'd) Annual Activity
European M&A Activity
Number of Deals
1998 1999 2000 2001 2002 2003 2004 2005 2006 2007 2008 11/08YTD
11/09YTD
>$750M 163 300 355 163 172 149 199 288 391 539 337 317 159 Middle Market 4,144 5,406 6,581 5,722 5,145 4,653 4,928 5,927 6,215 6,630 6,491 6,030 4,351 Undisclosed 4,041 6,051 7,791 7,233 6,168 5,212 5,489 6,588 7,115 8,264 9,282 8,610 8,720 Deal Value $772 $1,499 $1,535 $679 $639 $625 $842 $1,221 $1,702 $2,288 $1,368 $1,295 $695
Source: Dealogic and William Blair & Company, L.L.C. Mergers and Acquisitions market analysis.
European Middle-Market M&A Activity
Number of Deals
1998 1999 2000 2001 2002 2003 2004 2005 2006 2007 2008 11/08YTD
11/09YTD
$250-750M 279 378 441 306 295 290 398 492 625 790 577 554 267 $50-250M 863 1,092 1,204 895 871 928 1,156 1,386 1,568 1,849 1,555 1,469 799 <$50M 3,006 3,935 4,935 4,523 3,978 3,438 3,373 4,049 4,022 3,991 4,359 4,007 3,285 Deal Value $251 $339 $384 $275 $265 $267 $349 $420 $506 $609 $491 $492 $242
Source: Dealogic and William Blair & Company, L.L.C. Mergers and Acquisitions market analysis.
Undisclosed Middle Market Deal Value>$750M
8,348
11,757
14,72713,118
11,48510,014 10,616
12,80313,721
15,43316,110
14,95713,230
$0
$600
$1,200
$1,800
$2,400
0
5,000
10,000
15,000
20,000
Deal Value($ in billions)Number of Deals
<$50M $50-250M Deal Value$250-750M
4,148
5,405
6,580
5,7245,144
4,656 4,927
5,9276,215
6,630 6,4916,030
4,351
$0
$200
$400
$600
$800
0
1,000
2,000
3,000
4,000
5,000
6,000
7,000
8,000
Deal Value($ in billions)Number of Deals

European M&A Activity (cont'd)
www.williamblair.com 36
European M&A Activity (cont'd) Valuation Multiples
The median enterprise value/EBITDA multiple for all European transactions continues to decline, coming in at 7.1x for the LTM period, down from 9.4x for all of 2008 and 11.0x for 2007.
For middle-market deals over the past 12 months, the median enterprise value/EBITDA multiple has declined to 6.9x, from 8.6x EBITDA for 2008.
One-week and four-week acquisition premiums, recently at record levels, have begun to decline as a result of the sharp rebound in equity valuations.
European EV/EBITDA Valuation Multiples
Middle Market 9.9x 8.8x 8.7x 8.6x 8.3x 8.6x 8.7x 9.7x 10.3x 10.0x 8.6x 6.9x Overall Market 10.2x 9.0x 8.9x 8.9x 8.5x 8.7x 8.8x 10.1x 11.0x 11.0x 9.4x 7.1x
Source: Dealogic and William Blair & Company, L.L.C. Mergers and Acquisitions market analysis.
European EV/EBITDA Middle-Market Valuation Multiples
Size < $50M 8.9x 8.2x 7.8x 7.9x 7.3x 7.8x 7.9x 8.2x 10.0x 8.9x 7.2x 6.5x $50M-$250M 10.2x 8.8x 9.9x 9.4x 9.2x 8.7x 9.2x 10.5x 10.5x 11.6x 8.0x 7.0x $250M-$750M 12.4x 10.9x 9.3x 9.4x 10.8x 10.3x 9.6x 11.8x 11.6x 9.7x 11.4x 6.9x
Source: Dealogic and William Blair & Company, L.L.C. Mergers and Acquisitions market analysis.
European Middle-Market Median Acquisition Premiums
1-Week Premium 23.1% 23.6% 26.4% 23.3% 23.5% 17.0% 17.2% 15.9% 14.4% 19.0% 29.3% 22.4%4-Week Premium 31.1% 30.0% 32.4% 26.3% 23.7% 21.8% 19.3% 20.8% 17.5% 22.5% 30.7% 28.7%
Source: Dealogic and William Blair & Company, L.L.C. Mergers and Acquisitions market analysis.
0.0x
5.0x
10.0x
15.0x
1998 1999 2000 2001 2002 2003 2004 2005 2006 2007 2008 LTM
Middle Market Overall Market
0.0x
5.0x
10.0x
15.0x
1998 1999 2000 2001 2002 2003 2004 2005 2006 2007 2008 LTM
< $50M $50M-$250M $250M-$750M
0.0%
10.0%
20.0%
30.0%
40.0%
1998 1999 2000 2001 2002 2003 2004 2005 2006 2007 2008 LTM
1-Week Premium 4-Week Premium

European M&A Activity (cont'd)
www.williamblair.com 37
European M&A Activity (cont'd) Private-Equity Transaction Analysis
European private-equity activity is down substantially, mirroring the activity in the United States. For the month, there were just 73 announced private-equity transactions, well below the 96 transactions
in the corresponding period last year. The dollar volume for the month was just $3.0 billion, because of the absence of large transactions
occurring in the month.
European Private-Equity Activity
Number of Deals
1998 1999 2000 2001 2002 2003 2004 2005 2006 2007 2008 11/08 YTD
11/09 YTD
>$750M 12 22 29 21 31 38 61 90 102 150 70 66 30 Middle Market 440 572 794 752 729 722 843 983 899 970 783 699 442 Undisclosed 228 391 578 605 537 623 700 1,063 1,141 1,240 1,040 932 566
Deal Value $46 $76 $94 $76 $96 $132 $214 $280 $352 $446 $201 $192 $99
Source: Dealogic and William Blair & Company, L.L.C. Mergers and Acquisitions market analysis.
Average Total Equity Contribution
1997 1998 1999 2000 2001 2002 2003 2004 2005 2006 2007 2008 LTM
2009
(1) Total Equity equals common, preferred and rollover equity. Source: S&P’s Leveraged Lending Review.
Average Debt Multiples of LBO Loans
1999 2000 2001 2002 2003 2004 2005 2006 2007 2008 11/09 YTD
Left Column – less than €50 million EBITDA Right Column – more than €50 million EBITDA
Source: S&P’s Leveraged Lending Review.
668985
1,401 1,378 1,297 1,3831,604
2,136 2,142 2,3601,893
1,697
1,038
$0
$200
$400
$600
$800
0
500
1,000
1,500
2,000
2,500
Number of Deals Undisclosed Middle Market >$750M Deal Value
29.6%35.9% 35.9% 37.4% 37.6% 38.6% 37.3% 35.9% 33.7% 33.7% 33.6%
44.7%
55.9%
0.0%
10.0%
20.0%
30.0%
40.0%
50.0%
60.0%
4.3x3.6x 3.5x 3.4x 3.4x 3.6x 4.2x 4.4x 4.9x
3.9x 3.3x
0.4x0.6x 0.7x 0.6x 0.7x
1.1x0.7x
1.2x1.0x
1.2x0.8x
4.7x4.2x 4.2x 4.0x 4.1x
4.7x 4.9x5.6x 5.9x
5.1x
4.1x
3.5x 3.6x 3.6x 3.4x 3.6x 3.7x4.5x 4.7x
5.6x4.2x
1.2x 0.8x 0.7x 1.0x 0.9x 1.1x1.0x 1.1x
1.0x
1.1x4.7x 4.4x 4.3x 4.4x 4.5x 4.8x
5.5x 5.8x6.6x
5.3x
0.0x
1.0x
2.0x
3.0x
4.0x
5.0x
6.0x
7.0x Senior Debt/EBITDA Non-Senior Debt/EBITDA

Emerging Markets M&A Activity
www.williamblair.com 38
Emerging Markets M&A Activity
Latin American M&A Activity
Number of Deals
1998 1999 2000 2001 2002 2003 2004 2005 2006 2007 2008 11/08 YTD
11/09 YTD
>$750M 16 17 34 9 13 9 13 13 30 33 36 31 26 Middle Market 364 425 389 311 200 289 329 310 440 667 594 540 390 Undisclosed 245 412 326 298 236 222 234 242 414 561 518 488 340
Deal Value $71 $76 $94 $48 $38 $30 $59 $48 $130 $106 $113 $101 $84
Source: Dealogic and William Blair & Company, L.L.C. Mergers and Acquisitions market analysis.
Asian M&A Activity
Number of Deals
1998 1999 2000 2001 2002 2003 2004 2005 2006 2007 2008 11/08 YTD
11/09 YTD
>$750M 26 58 73 51 50 47 86 105 158 196 138 130 115 Middle Market 1,555 2,521 3,429 3,247 3,776 3,588 5,058 7,150 9,044 11,537 11,327 10,265 8,724 Undisclosed 946 1,410 1,993 1,851 2,031 1,640 1,930 2,600 3,061 3,648 3,993 3,645 2,929
Deal Value $122 $305 $389 $254 $199 $226 $398 $523 $673 $832 $688 $625 $597
Source: Dealogic and William Blair & Company, L.L.C. Mergers and Acquisitions market analysis.
Undisclosed Middle Market Deal Value>$750M
625
854749
618
449520 576 565
884
1,2611,148
1,059
756
$0
$20
$40
$60
$80
$100
$120
$140
0
250
500
750
1,000
1,250
1,500Number of Deals
Deal Value($ in billions)
Undisclosed Middle Market Deal Value>$750M
2,5273,989
5,495 5,1495,857
5,275
7,074
9,855
12,263
15,381 15,458
14,040
11,768
$0
$100
$200
$300
$400
$500
$600
$700
$800
$900
0
2,000
4,000
6,000
8,000
10,000
12,000
14,000
16,000Number of Deals
Deal Value($ in billions)

Select William Blair & Company Transactions
www.williamblair.com 39
Select William Blair & Company Transactions
CLOSE DATE BLAIR CLIENT CLIENT DESCRIPTION TRANSACTION DESCRIPTION
DEAL VALUE
11/30/09 Ellicott Dredges Enterprises, LLC
Largest North American manufacturer of dredges and the world leader in the production of medium-sized portable cutter suction dredges.
Markel Ventures, which owns and manages the investment activities of Markel Corporation, a publicly traded insurance company that markets and underwrites specialty insurance products and programs to a variety of niche markets
ND
10/26/09 Ellerbe Becket, Inc. An internationally recognized provider of architecture, engineering, and interior-design services
Sale to AECOM Technology Corp. ND
9/28/09 Auctionpay, Inc. (Appian Ventures, Maveron Equity Partners)
Leading provider of fully integrated payment processing and software solutions that improve and enhance fundraising activities for nonprofit organizations and schools.
Sale to Global Payments, Inc., a provider of electronic payments transaction processing services.
ND
9/24/09* EBEWE Pharma Ges.m.b.H. Nfg.KG
Austrian pharmaceutical company Sale of company’s specialty generic injectables business to Sandoz, the generic pharmaceutical division of Novartis.
$1,300.00
9/10/09 Temcor, Inc. (Solis Capital Partners)
Aluminum geodesic domes design and manufacturing
Sale to CST Industries, Inc., the leading provider of steel tanks for water and wastewater storage and treatment. The company is owned by The Sterling Group.
ND
9/01/09 Vcommerce Corporation SaaS enterprise e-commerce solutions for online retail
Sale to Channel Intelligence, a performance marketing and services company and partner company of Internet Capital Group and Aweida Capital Management
ND
8/27/09* Schulerhilfe GmbH
The leading provider of private tutoring services to the German and Austrian primary and secondary education markets
Sale of Schulerhilfe GmbH, a subsidiary of Educate, Inc., to Paragon Partners GmbH, a Munich-based private-equity firm
ND
8/21/09 Crownline Boats, Inc. Engages in the manufacture, marketing and distribution of boats
Sale to Leisure Properties, LLC ND
8/13/09* LEWA GmbH (Deutsche Beteiligungs AG and Quadriga Capital)
A global leader in the development, design, manufacture, and service of technologically advanced, highly engineered process and metering pumps and systems
Sale to Nikkiso Co., Ltd, a publicly listed company on the Tokyo Stock Exchange, and which operates through four business units: Fluid Technologies, Industrial Solutions, Composite Technologies, and Medical Equipment.
ND
8/10/09 Maximum Performance Group
Manufactures a line of remote HVAC and lighting controllers under the eMAC and uMAC brand names
Sale of Lime Energy Company subsidiary to ELUTIONS, Inc., a provider of wireless enterprise automation solutions that help companies improve their asset performance, energy usage, and workforce productivity
ND
8/07/09* Emerisque Capital Limited and S. Kumars Nationwide Limited
Emerisque is a London-based private-equity firm and SKNL is an Indian textile company listed on the Mumbai Stock Exchange that manufactures and distributes tailored and ready-to-wear men’s and women’s apparel
Acquisition of substantially all of the assets of Chicago-based apparel manufacturer Hartmarx Corporation pursuant to §363 of the United States Bankruptcy Code.
$125.0
7/24/09 Waterworks, Inc. (Berkshire Partners)
Designer, marketer and retailer of high-end bath fixtures, fittings and furnishings, operating 15 showrooms in affluent markets across the United States
Sale to investment firm Design Investors, LLC pursuant to a §363 sale
ND
5/20/09 Robbins Bros. Corporation Chain of engagement ring stores in the United States
Sale of Robbins Bros. Jewelry, Inc. & Spence Diamonds, Inc. jewelry store chains
ND
4/11/09 American Corrective Counseling Services, Inc.
Provider of outsourced educational diversion programs in the U.S.
Sale to Levine Leichtman Capital Partners, a middle market private equity firm
$26.3
* Represents cross-border transaction. ND – Transaction value not disclosed.

Select William Blair & Company Transactions (cont'd)
www.williamblair.com 40
Select William Blair & Company Transactions (cont'd)
CLOSE DATE BLAIR CLIENT CLIENT DESCRIPTION TRANSACTION DESCRIPTION
DEAL VALUE
3/26/09 Filtrona plc (Filtrona Extrusion Holding Companies)
One of the largest extruders of thermoplastic profile, tube and sheet in North America
Divestiture of its North American profile, tube and sheet extrusion business (“Filtrona Extrusion”) to private equity firm Saw Mill Capital Partners, L.P. and Management
$115.0
3/23/09 FCA Inc. Supplies high value-added, industrial heavy-duty packaging and related supply chain services
Sale to Ancor Capital Partners and Prairie Capital Partners
ND
3/18/09* The Cambridge Group Business strategy consulting firm hired by Fortune 1000 companies to design and implement growth strategies
Sale to The Nielsen Company, a global information and media company with leading market positions in marketing and consumer information, television and other media measurement
ND
3/16/09 Allscripts’ Medication Services Group
Provides point-of-care medication management and medical supply services and solutions
Sale to A-S Medication Solutions, a national provider of managed care solutions
$26.0
3/12/09* Pivotal Research Centers Contract research organization with extensive experience in multiple therapeutic areas
Sale of Pivotal Research Centers, a subsidiary of Pioneer Behavioral Health (AMEX: PHC) to Premier Research Group, Limited, a privately-held contract research organization based in the United Kingdom.
ND
3/06/09 ExtruMed, LLC (Inverness Graham Investments, L.P.; Wedbush Capital Partners, L.P.)
Precision thermoplastic medical tubing manufacturer
Sale to Vesta, Inc. which provides products to the OEM medical device industry and is a portfolio company of Roundtable Healthcare Partners
ND
2/27/09* Photo Therapeutics, Limited
Aesthetic dermatological devices Sale to PhotoMedex, Inc. a provider of a wide range of medical products and services
$13.3
2/09/09 Payformance Corporation Healthcare IT Sale to ABS Capital Partners ND
1/30/09 Saleen, Inc. Manufacturer of high-performance niche automobiles and aftermarket parts
Sale to Cyltec LLC, a manufacturer of automotive parts
ND
1/23/09 Niman Ranch Producer of all-natural fresh beef, pork, and lamb, as well as prepared foods
Sale to Natural Food Holdings ND
1/22/09 Xactly Corporation Leading software-as-a-service (SaaS) provider of on-demand sales compensation solutions
Acquisition of Centive, Inc, a provider of on-demand sales compensation solutions
ND
1/18/09* ICON Medical Imaging Medical Imaging CRO Sale to ICON PLC, a clinical research organization
ND
12/31/08 Gateway Ethanol Ethanol plant production Sale to DIP lender Dougherty Funding, LLC $63.0
12/22/08 Pensar Electronic Solutions, LLC
Provider of low-to-medium volume, high mix (broad line of relatively shorter run SKUs) outsourced electronic solutions across a diverse range of end markets
Sale to LaBarge, Inc. a contract manufacturer of electronic, electromechanical, and interconnect systems
$45.0
12/19/08* Sorex Holdings Ltd. (Indigo Capital LLP)
Independent manufacturer and supplier of a broad range of chemical and non-chemical pest-control systems
Sale to BASF SE, the world’s leading chemical company
ND
12/15/08* TDX Group Limited (Blenheim Chalcot)
Multinational provider of proprietary, analytics-based arrears management solutions for defaulted consumer debt.
Sale to private equity firm Investcorp Technology Partners
$110.2
11/20/08 Francisco Partners Global private-equity firm focused exclusively on investments in technology companies
Acquisition of API Software, Inc. which develops labor cost management applications for hospitals and health systems
ND
* Represents cross-border transactions. ND – Transaction value not disclosed.

Select William Blair & Company Transactions (cont'd)
www.williamblair.com 41
Select William Blair & Company Transactions (cont'd)
CLOSE DATE BLAIR CLIENT CLIENT DESCRIPTION TRANSACTION DESCRIPTION
DEAL VALUE
11/18/08* Stainton Metal Company Limited (NVM Private Equity)
Designer, manufacturer and supplier of an extensive Range of galvanized and stainless-steel support structures
Sale to Valmont Industries, Inc., a global designer and manufacturer of poles and towers, irrigation equipment and commercial tubing.
ND
11/14/08 Chockstone, Inc. Loyalty card provider and marketing services
Sale to Heartland Payments Systems, Inc., a provider of credit/debit/prepaid card processing, payroll, check management, and payments solutions
ND
11/06/08 The J.M. Smucker Company Manufactures and markets branded food products
Acquisition of Folgers Coffee Company from Procter & Gamble
$3,425.0
11/05/08 Molex Incorporated Manufactures and sells electronic components
Purchase of related party stockholdings $26.7
10/31/08 TMG Health, Inc. (SCP Partners NewSpring Capital)
Business process outsourcing services firm providing a variety of administrative services to the Medicare and Medicaid health plan markets
Sale to Health Care Service Corporation, the largest customer-owned health insurer in the United States and the fourth-largest health insurer in the country overall
ND
10/24/08 IntelliTax (a division of TRE Financial) (Platform Partners)
Tax software company Sale to CCH Small Firm Services, a leading global information services and publishing company
ND
10/17/08* EBEWE Pharma Ges.m.b.H Nfg.KG.
International pharmaceutical company Acquisition of Liba Laboratuarlari Anonim Sirketi, a distributor of pharmaceutical products for a number of leading international companies within Turkey
ND
10/16/08 Coria Laboratories, Ltd. Pharmaceutical company specializing in research, development and marketing of dermatology products
Sale to specialty pharmaceutical company Valeant Pharmaceuticals International
$95.0
10/08/08 CBOT Metals Complex (a division of CME Group)
Commodities Exchange Sale to securities exchange NYSE Euronext ND
10/06/08 Wm. Wrigley Jr. Company Chewing gum company Sale to Mars, Inc. & Berkshire Hathaway $23,100.0
9/29/08* MicroCal, LLC (Riverside Partners)
Designs and manufacturers micro calorimeters used in drug discovery and the life sciences
Sale to GE Healthcare, Ltd., a provider of medical products and healthcare information technologies
ND
9/23/08 ChartOne, Inc. (Warburg Pincus)
Provider of medical record workflow Solutions to hospitals and physician clinics
Sale to HealthPort Technologies, LLC, a provider of healthcare information technology and strategic solutions
ND
9/22/08* Allied Richard Bertram Marine Group
After sales service and marketing of new and pre-owned motor yachts
Sale to luxury yacht dealer Ferretti, SpA ND
8/29/08 MedVenture Technology Corp.
Medical outsource solutions provider Sale to private equity firm Ampersand Ventures
ND
8/22/08 CME Group International commodities exchange Acquisition of New York Mercantile Exchange
$7,914.0
8/22/08 Habeas (Canaan Partners, Diamondhead Ventures, SkyMoon Ventures)
Provides email reputation intelligence Sale to ReturnPath, provider of integrated e-mail reputation management and deliverability services
ND
8/01/08 Bemrose Booth Specialist in security printing and associated services
Sale to investment firm American Industrial Acquisition Corporation
ND
* Represents cross-border transactions. ND – Transaction value not disclosed.

William Blair & Company Corporate Finance Contact List
www.williamblair.com 42
William Blair & Company Corporate Finance Contact List
Brent Gledhill Global Head of Corporate Finance +1.312.364.5475 [email protected]
Mark Brady Global Head of M&A +1.312.364.8853 [email protected]
Brent Felitto Head of North America Corporate Finance +1.312.364.8013 [email protected]
Matt Gooch Head of European Banking +44 20 7868 4478 U.S. voicemail: [email protected]
Business Services Commercial & Industrial Consumer & Retail
Scott Patterson Group Head +1.312.364.8821 [email protected]
Brett Paschke +1.312.364.8657 [email protected]
Britt Trukenbrod +1.312.364.8840 [email protected]
Laura Van Peenan +1.312.364.8543 [email protected]
Mark Brady Group Head +1.312.364.8853 [email protected]
Shay Brokemond +1.312.364.8920 [email protected]
Kelley Drake +1.312.364.8936 [email protected]
Paul Hindsley +1.312.364.8576 [email protected]
Kelly J. Martin +1.312.364.8832 [email protected]
Phil Reitz +1.312.364.8688 [email protected]
Brent Smith +1.312.364.5392 [email protected]
Sam Tinaglia +1.312.364.8086 [email protected]
Mark Brady Group Head +1.312.364.8853 [email protected]
James Bertram +1.312.364.5426 [email protected]
Shay Brokemond +1.312.364.8920 [email protected]
Tim Carroll +1.312.364.8532 [email protected]
Paul Hindsley +1.312.364.8576 [email protected]
Brent Smith +1.312.364.5392 [email protected]
Chris Spahr +1.312.364.8118 [email protected]
Healthcare Technology Financial Services Special Situations & Restructuring
Brent Felitto Group Head +1.312.364.8013 [email protected]
John Kibler +1.312.364.8535 [email protected]
Dewey Martinelli +1.312.364.8085 [email protected]
Karl Palasz +1.312.364.8932 [email protected]
Brian Scullion, M.D. +1.312.364.8948 [email protected]
Brian Doyle Head of International Healthcare +1.312.364.5388 [email protected]
Rob Metzger Group Head +1.312.364.8517 [email protected]
Dan Connolly +1.312.364.8544 [email protected]
Mark McNay +1.415.986.5596 [email protected]
Daniel Daul +1.312.364.8457 [email protected]
Rob Metzger Group Head +1.312.364.8517 [email protected]
Michael Gebo +1.212.237.2718 [email protected]
Daniel Daul +1.312.364.8457 [email protected]
Geoffrey Richards Group Head +1.312.364.5436 [email protected]
Kelly J. Martin +1.312.364.8832 [email protected]
Phil Reitz +1.312.364.8688 [email protected]
Jeffrey Knopping +1.312.364.8601 [email protected]
Financial Sponsors Debt Finance Equity Capital Markets M&A Market Analysis
Brandon Lower Group Head +1.212.237.2716 [email protected]
Anurag Sharma +1.415.248.5912 [email protected]
Jonathan Skinner +1.617.235.7522 [email protected]
James Wildman +1.312.364.8076 [email protected]
Kenton Brown +1.312.364.8952 [email protected]
Christine Kelly +1.312.364.8383 [email protected]
David Morrison +1.312.364.8387 [email protected]
Michael Ward +1.312.364.8529 [email protected]
Tom Trail +1.312.364.8956 [email protected]
Brett Paschke Group Head +1.312.364.8657 [email protected]
Private Placements
Kelly J. Martin +1.312.364.8832 [email protected]
Confidential Offerings
Fred Johnson +1.312.364.8211 [email protected]
Scott Patterson +1.312.364.8821 [email protected]
Convertible Debt
John Burgess +1.212.237.2731 [email protected]
Corporate & Executive Services
Michael Lee +1.312.364.5357 [email protected]
Steven M. Bernard, CFA Director of M&A Market Analysis +1.312.364.8221 [email protected]
Asia
Andy Kaye Head of Asia +86.21.2327.2233 [email protected]
Henry Lu Head of China +86.216.1357288 [email protected]

William Blair & Company Corporate Finance Contact List (cont'd)
www.williamblair.com 43
William Blair & Company Corporate Finance Contact List (cont'd)
INDUSTRY GROUPS BUSINESS SERVICES
COMMERCIAL & INDUSTRIAL
CONSUMER & RETAIL
FINANCIAL SERVICES HEALTHCARE TECHNOLOGY
Accounts Receivable Management
Business Process Outsourcing
Consulting Distribution Education Government
Services Information Services Legal Services Marketing and
Advertising Services Parking Services Route-based
Services Staffing Transportation &
Logistics Training and HR
Services
Building Products, Technologies & Automation
Capital Goods Mfg. Contract &
Electronics Mfg. Energy Engineering &
Construction Environmental
Technology & Services
Facility Management & Services
Industrial Distribution
Industrial Products Material Handling Manufacturing
Equipment Metal Fabrication Metal Production,
Processing & Distribution
Paper, Plastic & Packaging
Printing and Imaging Process Controls &
Technology Pumps, Valves &
Filtration Safety Products &
Services Test, Measurement
& Metering Water & Waste
Water
Apparel Branded Consumer
Products Cruise Lines and
Resorts Discount Stores Drugstores E-Commerce Fitness Clubs Food Processing &
Distribution Gaming Hardgoods Home Furnishings Leisure Media Power sports Personal Care Restaurants Specialty Retail Toys & Gaming
Asset Management Brokerage Commercial Finance Consumer Finance Specialty Insurance
and Insurance Services
Trust Services
Aesthetics & Dermatology
Animal Health Biotechnology Contract Research
Organizations Dental Products &
Services Diagnostic Products
& Services Healthcare
Distribution Healthcare IT Healthcare Services Imaging Technology
& Services IT-Enabled Services Medical Devices Payer IT Services Pharmaceutical
Outsourcing Pharmaceuticals Revenue Cycle
Management
Application Software Barcode/Auto
Identification Computer/
Telephony Digital Media E-Commerce
Infrastructure Electronic
Components Electronics
Manufacturing Services
ERP Software Financial
Technology HR Outsourcing IT Services Payroll Services Semiconductor
Capital Equipment Software as a
Service (SAAS) Telecom Equipment Telecom Services Transaction
Processing
OFFICES Chicago
Brent Gledhill +1.312.364.5475
London Matt Gooch
+44.20.7868.4478 U.S. voicemail: 312.364.5425
Shanghai Henry Lu
+86.216.1357288 [email protected]
New York Brandon Lower
+1.212.237.2716 [email protected]
Boston Jonathan Skinner +1.617.235.7522
San Francisco Mark McNay
+1.415.986.5596 [email protected]

Notes
www.williamblair.com 44
Notes

Disclosures
THIS IS NOT IN ANY SENSE A SOLICITATION OR OFFER OF THE PURCHASE OR SALE OF SECURITIES. THE FACTUAL STATEMENTS HEREIN HAVE BEEN TAKEN FROM SOURCES WE BELIEVE TO BE RELIABLE, BUT SUCH STATEMENTS ARE MADE WITHOUT ANY REPRESENTATION AS TO ACCURACY OR COMPLETENESS OR OTHERWISE. OPINIONS EXPRESSED ARE OUR OWN UNLESS OTHERWISE STATED. FROM TIME TO TIME, WILLIAM BLAIR & COMPANY, L.L.C. OR ITS AFFILIATES MAY BUY AND SELL THE SECURITIES REFERRED TO HEREIN, MAY MAKE A MARKET THEREIN AND MAY HAVE A LONG OR SHORT POSITION THEREIN. PRICES SHOWN ARE APPROXIMATE. THIS MATERIAL HAS BEEN APPROVED FOR DISTRIBUTION IN THE UNITED KINGDOM AND APPROPRIATELY PASSPORTED COUNTRIES BY WILLIAM BLAIR INTERNATIONAL, LIMITED (“WBIL”), REGULATED BY THE FINANCIAL SERVICES AUTHORITY (FSA), AND IS DIRECTED AT, AND IS ONLY MADE AVAILABLE TO, AUTHORIZED PERSONS AND OTHER PERSONS FALLING WITHIN COB 3.2.5(1)(b) OF THE FSA HANDBOOK, AND MAY NOT BE PASSED ON TO PRIVATE CUSTOMERS IN THE UNITED KINGDOM. ANY UNAUTHORIZED USE IS PROHIBITED. “WBIL” IS REGISTERED IN ENGLAND UNDER COMPANY NUMBER 3619027 AND ITS REGISTERED OFFICE IS LOCATED AT 3 ST HELENS
PLACE, LONDON, ENGLAND ECA6AB. “WILLIAM BLAIR & COMPANY” AND ARE REGISTERED TRADEMARKS OF WILLIAM BLAIR & COMPANY, L.L.C. Copyright 2009, William Blair & Company, L.L.C.
December 21, 2009
www.williamblair.com 45
Disclosures

December 2009
M&A MarketAnalysis
Steven M. Bernard, CFADirector of M&A Market [email protected]
MERGER TRACKER
Monthly Overview of Global Middle-Market M&A Activity
Headquarters222 West Adams StreetChicago, IL 60606312.236.1600www.williamblair.com
Two International PlaceSuite 1700Boston, MA 02110617.235.7500
Putnam Place100 Great Meadow RoadSuite 606Wethersfield, CT 061091.800.596.2028
450 East 96th StreetSuite 500Indianapolis, IN 46240317.581.6127
3 St. Helen’s PlaceLondon EC3A 6ABEngland+44 20 7868 4400
666 Fifth Avenue14th FloorNew York, NY 10103212.237.2700
343 Sansome StreetSuite 1210San Francisco, CA 94104415.986.5596
Unit 16-18, 11th FloorBuilding One, Corporate AvenueNo. 222 Hubin RoadShanghai 200021, P.R.C.+86.21.2327.2222
Kamiyacho MT Building 13th Floor4-3-20 ToranomonMinato-ku, Tokyo 105-0001Japan+81.3.5470.0720
Stockerstrasse 468002 ZurichSwitzerland+41.44.287.9020
OFFICE LOCATIONS
William Blair & Company, L.L.C. is a global investment firm offering investment banking,asset management, equity research, institutional and private brokerage, and private capital toindividual, institutional, and issuing clients. Since 1935, we have been committed to helpingclients achieve their financial objectives. As an independent, employee-owned firm, ourphilosophy is to serve our clients’ interests first and foremost. We place a high value on theenduring nature of our client relationships, the quality of our products and services, and thecontinuity and integrity of our people. William Blair & Company is based in Chicago, withoffice locations including Boston, London, New York, San Francisco, Shanghai, Tokyo, andZurich. For more information, please visit www.williamblair.com.