m road data release user guide - minnesota … release... · traffic data and documentation...
TRANSCRIPT

MNROAD DATA RELEASE USER GUIDE
MnROAD Database and Data Release BackgroundMnROAD, located near Albertville, Minnesota (40 miles northwest of Minneapolis-St. Paul) is one of the most sophisticated, independently operated pavement test facilities of its type in the world. MnROAD has collected data since 1993 on three unique road segments located parallel to Interstate 94:
• A 3.5-mile mainline interstate roadway carrying “live” traffic averaging 28,500 vehicles per day with 12.4 % trucks.
• A 2.5-mile closed-loop low-volume roadway carrying a controlled 5-axle tractor-semi-trailer to simulate conditions of rural roads.
• Farm loop located in the MnROAD stockpile area. MnROAD data is collected in a number of different methods and processes, which impacts how we store the data (both calculated and raw values). The purpose of this document is to describe what data has been collected, where it is stored for research use, and how to access the data.
MnROAD Data Sources Include: • Data Release 1.0 – January 2012 (described in this document) • Oracle Database (database tables and views) • Offline Data (Raw ERD, FWD history, WIM and Dynamic data to name a few) • Web Site (www.mndot.gov/mnroad) • Reports (see MnROAD web site - Reports) • Personal communication with Individual Researchers
Access to the Data MnROAD has developed this data release 1.0 that contains commonly used data spreadsheets, procedures, and tools that we have shared in the past. Right now the data can be supplied using a flash drive but we hope to improve this by placing this data on our web site and making it possible to do individual queries from our database in the future. Some bits of data (i.e. static and dynamic sensor data) can be obtained by contacting MnROAD researchers directly. If you do use MnROAD data/materials we ask you provide the following at a minimum.
• Contact Information (send us an email with the details) • Research Plan (This allows us to help find and explain the data you need) • Acknowledge MnROAD (Reference MnROAD and the data release in your final report) • Final Product (Share the final product with MnROAD) • Test Results (Share any raw lab or field testing data with MnROAD)
Version 1 – January 2012

MnROAD Data Release Overview This release was produced by staff members of the Minnesota Department of Transportation Office of Materials and Road Research to assist researchers (data users) to access the most common data requests that we have had in the past. This data release consists of many of the database tables in the form of spreadsheets and also contains the monitoring documentation explaining the data and how it was collected. This data can be requested as well as other custom data requests related to sensor data and other raw data collected. Researchers (data users) assume the risks of reviewing the data and working with MnROAD key researchers so they understand and use the data correctly. The data release is fully outlined in the full documentation of the MnROAD database and summarized below. Data Release is organized by the following categories
Data Category Description A Introduction Description of the MnROAD facility and its research
B Test Cell
Descriptions Description of the test cells built at MnROAD. This includes excel cell maps, layer schematics, and tabular output from the database.
C Field
Performance Field performance data collection and documentation (Examples include distress, ride, FWD, skid, surface texture, OBSI, etc.)
D Sensor Sensor documentation and location data. Actual sensor data must be requested separately at this time due to its complexity and size requirements.
E Materials
Sampling & Testing Material sampling and laboratory testing data and documentation. (Materials include soils, aggregates, asphalt and concrete mixtures and components, etc.)
F Weather Station
Weather data and documentation from the two onsite weather stations (Temperature, precipitation, humidity, wind speed & direction, solar radiation)
G Traffic
Loading Traffic data and documentation including an ESAL spreadsheet calculator that allows the calculation of ML and LVR traffic for any cell and time period.
H Database
Tables Database schema (tables that make up the MnROAD database) and the data dictionary (describes the fields that make up the tables)
Note that much of the information is provided in the following file formats: PDF documents, comma delimited text files, or Microsoft Excel spreadsheet files. If additional data is needed please contact a researcher below. Disclaimer: The information contained in this release and MnROAD database has been checked and verified to the best of the knowledge and abilities of the authors at the time of publishing. Due to the large volume of data, it is advised that all data should be checked for reasonableness before use in analysis and publications. Please contact MnROAD staff if errors are discovered or questions of organization or accuracy arise. MnROAD Research Contacts Please feel free to contact us related to your research needs.
Benjamin Worel MnROAD Operations Engineer
[email protected] (651) 366-5522
Tim Clyne MnROAD Bituminous Researcher
[email protected] (651) 366-5473
Tom Burnham MnROAD Concrete Researcher
[email protected] (651) 366-5452

MNROAD DATA RELEASE USER GUIDEVERSION 1.0 – JANUARY 2012 This release was produced by staff members of the Minnesota Department of Transportation Office of Materials and Road Research to assist the sharing of MnROAD data. This document will guide you through the organization of the data release. The remainder of this document provides additional information and guidance on the contents within each of the directories “A” though “H” used to organize the information. Note that much of the information is provided in the following file formats: PDF documents, comma delimited text files, or Microsoft Excel spreadsheet files. Table 1 – Types of data collected at MnROAD
Subject Area
Data Type Examples of Data Collected at MnROAD
Cell
Info
Cell Data Design, Construction, Maintenance Events, Cell Layer/Lift Thickness, Elevations, GIS Data, Material Components, Forensics
Fiel
d M
onito
ring
(App
endi
x A)
Rutting Straight Edge, Automated Laser Profile System (ALPS), LISA, Pathways, PaveTech, Dipstick
Ride Pathways, PaveTech, Lightweight, Frost Pins, Faulting, Friction, Ride Quality Index Surface
Characteristics Noise (OBSI), Texture, Sound Absorption
Cracking Distress Surveys, Crack Mapping, Cupping Strength/ Stiffness
Dynamic Cone Penetrometer (DCP), Falling Weight Deflectometer (FWD), Lightweight Deflectometer (LWD), Nuclear Density
Sens
or
Data
Pavement
Biaxial Strain Gage (BS), Concrete Embedment Strain Gage (CD, CE), Linear Variable Differential Transducer (DT), Horizontal Clip Gage (HC), Longitudinal Embedment Strain Gage (LE), Transverse Embedment Strain Gage (TE), Piezo-Accelerometer (PA), Dynamic Soil Pressure Cell (PG, PK), Steel Strain Gage (SS), Tiltmeter (TM), Vibrating Wire Strain Gage (VW)
Subsurface
Thermocouple (TC), Moisture Block (WM), Dynamic Pore Water Pressure Cell (DW), Thermistor (XD,XL,XT,XS), Open Stand Pipe (OS), Static Lateral Pressure Cell (PL), Static Soil Pressure Cell (PT), Resistivity Probe (RP), Static Pore Water Pressure Cell (SW), Tipping Bucket (TB), Time Domain Reflectometer (TD), Electrical Conductivity (EC)
Weather Temperature, Precipitation, Humidity, Wind Speed & Direction, Solar Radiation Traffic ML and LVR Installations of Hydraulic Load Cell & Kistler Weigh In Motion Sensors
Lab
Test
ing Bituminous
Dynamic Shear Rheometer, Bending Beam Rheometer, Direct Tension, Dynamic Modulus, Indirect Tension Test, Mix Designs, Gradations, Hamburg & APA Rutting, Low Temperature & Fatigue Cracking
Concrete Air Voids, Compressive & Flexural Strength, Coefficient of Thermal Expansion, Poisson’s Ratio, Mix Designs
Unbound Resilient Modulus, Proctor Curves, Field Density, Gradations, Unsaturated Material Properties, Soil Classification

A. MnROAD Introduction This area of the data release contains the background information you will need to better understand the MnROAD research facility and our operations. It contains information on the history, funding partners, and timeline of the MnROAD facility. The data used in this data release comes from the MnROAD database. The MnROAD Oracle database is located at the Office of Materials and Road Research in Maplewood, Minnesota. This database stores much of the data collected from MnROAD since the early 1990s but does not contain everything. Much of the data is entered into the database tables using automated data loaders, but it also may be entered by individual researchers or database staff when the data is collected at varying frequencies. From a user perspective an Oracle database is implemented as sets of objects called ‘schemas’. The name of the MnROAD schema is “MNR”. The types of objects, most used by I/T developers, are tables, views, and sequences. There are approximately 450 tables, 200 views, and 40 sequences in the MNR schema. Some data relevant to materials research is stored in other schemas – weigh in motion (WIM) data for example. Currently data is entered into a database front end called PAT (just a name) for cells, layers, material types, samples, lab and field data. The majority of the sensor data is entered from datalogger files through a daily loader. Both systems provide data checks to ensure quality and consistency in our data. More details can be obtained in other documentation.
B. Test Cell Descriptions This area of the data release contains documentation explaining the test sections or “test cells” constructed and tested at the MnROAD facility. This will give you the different designs, lanes, layer materials and thickness. This area is broken into four sections as described below.
• Cell Summary Maps - It is suggested that the user begin by viewing the Cell Summary Maps to better visualize the test cells utilized at the MnROAD facility. Since many test cells have been reconstructed at least one time, several maps have been created to show these progressions and additions over time. While the summary maps can be helpful in narrowing the search for test cells of interest, the information provided is limited to the physical layout only.

Figure 1 – MnROAD Cell Map Example
• Cross Sections by Facility Type - Users can get more detailed information about the different
test cells by looking at the files in the Cross Sections folders organized by facility (location where the cells are located). Note that information is provided in a different format within each of the folder types. This is described in more detail on the next page. MnROAD “facilities” include:
o Mainline facility consists of test cells positioned end to end which receive live interstate traffic diverted from westbound I-94 between the cities of Albertville and Monticello, Minnesota.
o Low Volume facility consists of test cells positioned end to end to create a closed-loop road. Traffic consists of a single semi-tractor trailer truck driving over the test cells approximately 80 times per day during daylight hours.
o Farm Road facility consists of test cells located in the material stockpile area of the MnROAD facility. Test cells are positioned end to end to create a portion of a loop road used primarily for periodic measurement of the pavement’s response when subjected to heavily loaded farm vehicles.
o Other facilities include those test cells located as part of driveway or sidewalks within the overall MnROAD complex.

Each facility folder contains screenshot images from MnROAD’s (online to internal MnDOT staff) database tool from PAT. These images, as shown below, contain summary information of each test cell, the location of cells in terms of survey stationing, the lanes comprising the cell, and the various layers of pavement structuring each cell. Figure 2 – Example of a Cells Layer Structure
• Design Details by Pavement Type - Test cells at MnROAD are categorized into four pavement
types: Aggregate, Composite (HMA & PCC), Asphalt (HMA), and Concrete (PCC). o Aggregate test cells are those with an aggregate type surface layer (gravel road). o Composite test cells are those with combinations of asphalt and concrete surface layers.
Examples include unbonded concrete overlays over old concrete, bonded concrete overlays over old asphalt (whitetopping), thermally insulated concrete (new asphalt over new concrete), and new asphalt overlay over old concrete [no cells yet].
o Asphalt test cells are those with a surface containing asphalt. Examples include hot or warm mix asphalt, oil gravel, porous asphalt, and novachip.
o Concrete test cells are those with a concrete surface layer. These also include pervious concrete test cells.
Each pavement type folder contains a file outlining the design parameters unique to each test cell. Information includes beginning and ending station, dates of construction and demolition, lane widths, mix specifications, layer materials, layer thicknesses, and other components depending on the particular pavement type. Unique to concrete test cells are files containing information on joint and panel identification, as well as locations of each within the test cells.

• Test Cell Maintenance History - The Lane_Events table shows the maintenance performance of
each test cell. Surface treatments, crack sealing, patching, and other maintenance treatments have been applied to particular lanes at various times within each test cell. These treatments may have an impact on field performance data and may explain sudden jumps in various performance trends.
Understanding MnROAD Station and Offset Conventions The following conventions are helpful when viewing cell details. At MnROAD, survey stationing always increases from west to east. Depending on which facility is being looked at, this often means traffic is traveling in the direction of the decreasing station. This occurs on the mainline facility test cells and those cells on the inside lane of the south low volume cells, and the outside lane of the north low volume road. Survey station and offset distances are always referred to with the following convention: Facing in the direction of increasing survey stationing, positive (+) offset distances are located to the right of the roadway centerline. Negative (-) offset distances are located to the left of the roadway centerline. The figure below provides some guidance in understanding the nomenclature.

Figure 3 – MnROAD Station and Offsets
C. Field Performance Data This directory contains files of the field data collected from the field performance measurements taken at MnROAD. The folders in this section are organized by pavement type and measurement type. For each pavement type there are folders containing Load Response data and Physical Measurements.
• Physical Measurements data consists of physical information collected during the construction
of the test cells, as well as those taken during periodic (seasonal) monitoring events. These include Soil Strength and Surface Characteristic measurements.
o Soil Strength measurements consist of results from Dynamic Cone Penetrometer (DCP), Lightweight Deflectometer (LWD), and field moisture content. Nuclear density measurements are also included both from construction and while the cell is in service.
o Surface Characteristic measurements are further divided into the categories shown below.
X Offset in feet from the centerline uses the following orientation.
Roadway Positive Negative Mainline Passing Lane Driving Lane
LVR (north side) Inside Lane Outside Lane LVR (south side) Outside Lane Inside Lane
Farm Loop Eastbound Lane Westbound Lane Y Distance in feet down the road. STA is a “Y” distance and increases as distances move to the
east both on the mainline, LVR, and farm loop. Z Distance is typically a measurement or difference in elevation. When using the ALPS negative is
defined as below the beam.
Y Distance (STA)
X Distance (Offset from centerline)
Z Distance (Up and Down)
Lane Lane
Mainline Facility Low Volume Facility
Sout
h Lo
w V
olum
e ce
lls
Nor
th L
ow V
olum
e ce
lls
Surv
ey st
atio
ning
incr
ease
s tow
ard
the
East
Traf
fic fl
ow
Traf
fic fl
ow
Traf
fic fl
ow
Traf
fic fl
ow
Traf
fic fl
ow
Traf
fic fl
ow
Offset reference
+ -
+
+
-
-
Offset reference

• Load Response Data contains the results from Falling Weight Deflectometer (FWD) testing.
Maps showing FWD test points in each cell are included for the testing conducted during the construction of the various pavement layers, as well as continued (seasonal) testing on the surface of each cell.
• Data Collection Procedures – Written documentation is provided for most of the data types included in the data release. This documentation includes a general description of the measurements at MnROAD, equipment used to collect the data, and data collection and processing procedures.
D. Sensor Information This directory contains the documentation on the instruments installed in MnROAD test cells. Files include the descriptions of sensor model types, MnROAD designation, and manufacturer model numbers. Information on the locations of the sensors in the test cells is provided in two formats:
• Sensor Details by Pavement Type • Sensor Locations (for all cells)
Category Measured Data Type Description So
il St
reng
th Nuclear Density
Data from the measurements of unbound base density obtained with nuclear density test equipment during construction. Other measurements performed on pavement surface of asphalt and concrete.
DCP - Dynamic Cone Penetrometer
Data from the measurements of base and subgrade shear strength using a dynamic cone penetrometer device.
LWD – Lightweight Deflectometer
Data from the measurements of base and subgrade material stiffness and deformation using a lightweight deflectometer device.
Moisture Content Data from materials sampled in the field and measured for moisture content.
Surf
ace
Char
acte
ristic
s
Asphalt Rutting Data from the measurements of wheelpath ruts in test cells with an asphalt surface. Several different methods and devices have been used to gather this data.
Crack Cupping Data from the measurements of the cupping of transverse cracks in asphalt.
Friction Data from the measurements of surface friction on each cell. Several different methods and devices have been used to gather this data.
Joint Faulting Data from the measurements of transverse joint faulting in concrete and composite test cells.
Lane/Shoulder Drop-off
Data from the measurements of the “drop-off” or settlement of the shoulder from travelled lanes.
Noise Data from the measurements of noise generated by tire-pavement interaction. Several different methods and devices have been used to gather this data.
PCC Strength Data from the non-destructive measurements of concrete strength. Permeability Data from the measurements of the permeability of a test cell.
Ride Quality Data from the measurements of ride quality. Several different methods and devices have been used to gather this data.
Texture Data from the measurements of surface texture. Several different methods and devices have been used to gather this data.
Visual Distress Data from the measurements of visual distress. The data release contains both tabular data and scanned maps of each distress survey.

The sensor details for each test section basically lay out the station, offset, and depth for each individual sensor. Please note that in some cases new sensors have been installed into older underlying layers. Thus it may appear that a newer test cell number will be associated with a sensor located in an older underlying layer with a different cell number. Note: Due to the extremely large volume of data collected from the MnROAD sensors has not been included in this version of the data release, but will be added in future versions as data qualification has been accomplished
E. Material Sampling & Testing This directory contains files describing the material samples taken from the MnROAD facility, as well as the results of tests conducted on the samples at MnDOT Materials Research and Engineering Laboratory and by several of our external research partners. The folders in this section are organized by material type (Aggregate & Soil, Asphalt, and Concrete). The laboratory tests include both standard QC/QA tests and specialized research tests. Documentation is also provided to describe the sampling and testing process in greater detail.
F. Weather Station Data This directory contains files summarizing the data gathered from two onsite weather stations at the MnROAD facility. The averages of the combined weather data from the two stations is provided for each year through 2011 at 15 minute intervals. The types of weather data include air temperature, precipitation, wind speed and direction, humidity, and solar radiation.
G. Traffic Loading Data Traffic data is included in the data release under the traffic loading directory. It contains the data and the documentation of traffic loads applied to the MnROAD test cells. The type and volume of traffic loading is different between the two main MnROAD facilities and is documented completely and outlined below.
• Mainline Traffic - Traffic loading on the “Mainline” facility test cells consists of live interstate traffic diverted off of westbound I-94 between the cities of Albertville and Monticello, Minnesota. Traffic loadings are interrupted periodically (traffic is diverted back to the parallel lanes of the old westbound I-94) so that physical measurements can be safely performed by MnROAD personnel. Traffic is also removed during major test cell reconstruction events. MnROAD averages 750,000 Flexible and 1,000,000 Rigid ESALS (not taking into account the traffic switches) a year for the 28,500 ADT and 13% Trucks that travel over MnROAD mainline. The following files are included in the data release, in which the data has been processed up to December 31, 2011:
o ML_Traffic Switches.csv This files documents the dates and times lane closures were done on the mainline.
o Mainline Traffic Summary (Dec 2011).xlsm This file is outlined in the documentation of the mainline traffic. It includes an ESAL calculator that the user can input the date ranges for a particular cell of interest. This calculator takes into account the lane closures for the traffic switches.
o Mainline_Traffic_Summary.pdf This file describes how the data is processed from raw weigh in motion data all the way through to ESALs for each day and lane.

• Low Volume Road - Traffic loading on the Low Volume road consists of a single semi-tractor trailer “MnROAD” truck that passes over test cells an average of 80 times each day during daylight hours. The traffic loadings have stayed consistent over the years with the following parameters.
o 1994 to 2007 During this period MnROAD was studying the effects of overloaded trucks on our low volume roads. To accomplish this study the MnROAD truck traveled over the inside lane loaded at the Minnesota legal gross vehicle weight limit of 80,000 pounds. This loading configuration was used an average of 4 days per week. During the same time period, the MnROAD truck traveled over the outside lane with a total gross vehicle weight of 102,000 pounds. This loading configuration was used on average 1 day per week. This loading scheme produced approximately equal ESALs on the two lanes.
o 2007 to Today MnROAD is now studying the effects of the environment (no traffic) vs. legal loading. The MnROAD truck now travels over the Low Volume inside lane only, loaded with a gross vehicle weight of 80,000 pounds. On average, 80 laps are completed each day, 5 days a week, during daylight hours.
The traffic data files in this data release include the following: o LVR Traffic Summary (Dec 2011).xlsx
This file contains daily and cumulative traffic characterization in the form of laps and 18k Equivalent Single Axle Loads (ESALs) by pavement type.
o Low Volume Road Traffic Descripton.pdf This file contains information on the MnROAD truck dimensions and axle weight measurements.
H. Database Table Descriptions This directory contains two spreadsheets that describe both the data release and database tables and columns. These include:
• Data Release - A glossary file describing the column definitions for all the information presented in this data release. It can be used for reference when using the data, particularly to check column heading abbreviations and measurement units.
• Database Tables and Columns – These are the actual database tables in the MnROAD database queried to create the data release files. The SQL is included in the data release and the files in the release typically come from more than one table. This is why the data release files do not typically have the same names as the database tables.
A listing of all tables and views in the MnROAD database schema MNR and WIM are included in Appendix B of the Data Release User Guide. If you are interested in any of the other tables in the database please contact us for help.
I. Reports This directory contains a file that lists the research reports, conference papers, and technical briefs that have been written about MnROAD research projects. The file can be searched to find a particular author, title, or keyword. The user is encouraged to visit the MnROAD website to view the most current listing of research reports (http://www.dot.state.mn.us/mnroad/reports/index.html).

Appendix A: MnROAD 2011 Data Collection Frequency
Type EquipmentDistressSurvey
Visual Survey 2 / year Modified LTPP distress survey on all cells(Paper distress maps developed and scanned)
Joint FaultingLane Drop-Off
Skid Trailer 2 / year KJ Law profiler used – one test per lane per cell using both smooth and ribbed tire - collected by MnDOT pavements office for MnROAD.
Grip Tester 3 / year Borrowed equipment from FHWADynamic Friction Tester 2 / year MnDOT Owned DFT stating in 2009
Truck 4 / year Dynamic load testing of sensors. Loading from MnROAD truck.FWD 2 / year Dynamic load testing of sensors. Loading from MnROAD FWD.
PCC Testing 6 / year
HMA Testing 8 / year
Relative Calibration 4 / yearReference Calibration 1 / year
ALPS 3 / year Advanced Laser Profile System (ALPS) every 50 feet started in 2003Dipstick Past Data collected 1994-1997
6’ Straight Edge Past Data collected 1997-2003HMA Crack
CuppingALPS 3 / year Advanced Laser Profile System (ALPS) across 3 transverse cracks in each
HMA cell. Used to map profile of crack cupping.
Curl & Warp ALPS2 2 / year Updated Advanced Laser Profile System (ALPS2) use to measure concrete panel over several periods thoughtout the day and different seasons
Lysimeter Maintenance (Empty) 9 / year Empty and reset lysimeters.
Subsurface Ground Penetrating Radar Summary data entered manually into the database. Raw test fi les stored offl ine.
Piezometer Piezometer 4 / year Monitoring well measurements.Permeability Perveometer 2 / year Test permeability of pervious/porous test cells.
Pathways 2 / year Pavement Management office collects ride data summaries using using Pathways equipment.
LISA – Lightweight 4 / year Mn/DOT owned lightweight Profiler. IRI and ERD fi les developed for each lane and cell.
Noise OBSI 3 / year On Board Sound Intensity (OBSI) measurements will be conducted with a Mn/DOT owned system.
Sound Absorption Sound Impedance Tube 2 / year Sound absorption measurements with Mn/DOT-built device.
Sand Patch 4 / yearTexture Meter 4 / year
WIM Continuous Mainline and Low Volume Road WIM data has been collected over the years. Both raw data and summaries are avalible.
Counts Continuous Low Volume Road # of laps and comments collected each day and entered into database, which are then converted to ESALS for each cell.
Cores MnROAD Core Rig Mult Cores taken to monitor aging of HMA mix and PCC joint condition.Lab Testing Many Types Mult Both traditional and non-traditiaonal testing completed
Monitoring Notes
CurrentFreq
Mod-GeorgiaFaultmeter
3 / year
Traffic
Georgia Faultmeter modified in 2012 per modified LTPP testing protocol to measure the concrete joints and lane-shoulder drop off
HMA Rutting
FallingWeight
Deflectometer
MnROAD has 2 Dynatest fall ing weight deflectometers and MnDOT has an additional 2 (4 total). HMA testing includes both lanes roughly every 100’ at marked points. PCC testing includes 5 points/panel per 4 panels/lane for both lanes. Testing schedule varies thoughout the year – multi lple tests per year.
Ride Quality
SurfaceTexture
Sand patch tests on select concrete cells. Circular Texture Meter tests on select asphalt and concrete cells - wil l eventually replace the sand patch
Measurement
Friction
Dynamic Load Testing

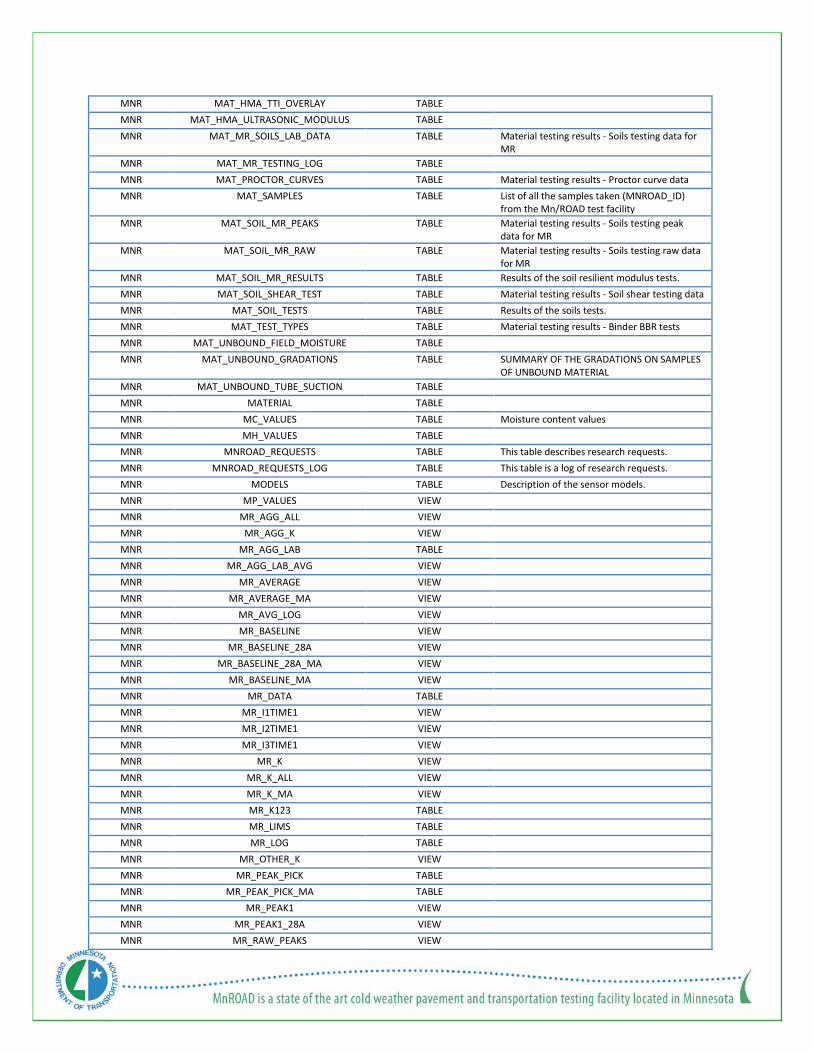
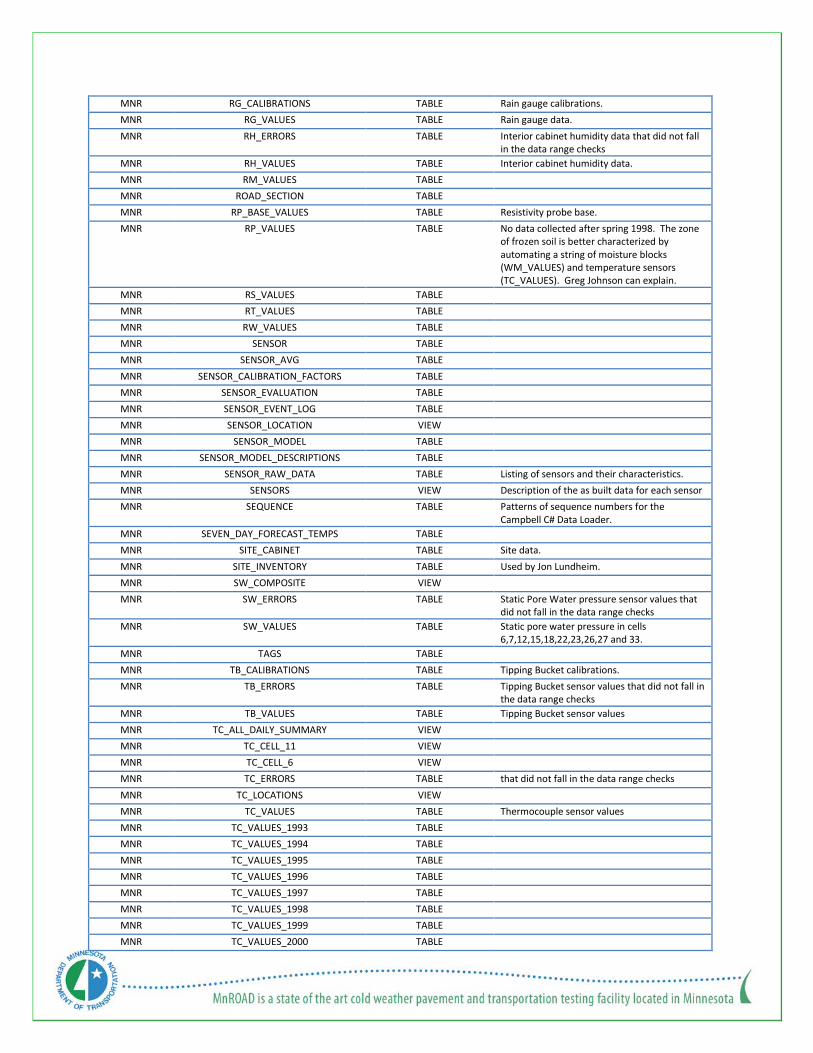
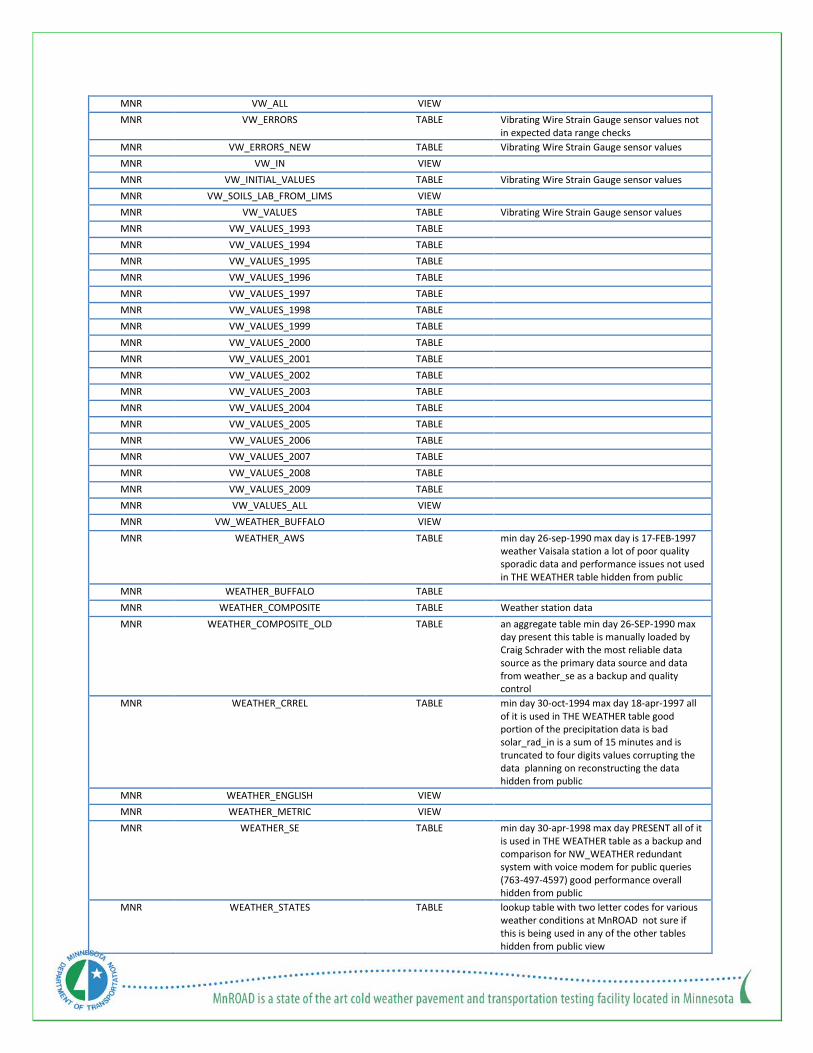
Appendix B: MnROAD Database Tables
OWNER TABLE_NAME TABLE_TYPE COMMENTS MNR ALL_MNROAD_REPORTS TABLE MNR ASBUILT_JOINTS TABLE Locations of all the joints in the PCC sections at
Mn/ROAD. MNR CABINET_EVENT_ACTIONS TABLE Site documentation of the actions taken to
maintain the cabinets and equipment MNR CABINET_EVENTS TABLE Site documentation of the maintenance
activities for the cabinets and equipment MNR CABINET_TEMPS TABLE MnROAD Cabinet documentation MNR CELL TABLE MNR CELL_CELL TABLE MNR CELL_DATES VIEW MNR CELL_DESIGN VIEW MNR CELL_DOWEL_BAR_LOCATIONS TABLE Locations of the dowel bars MNR CELL_HISTORY TABLE What has happened at each of the research
cells MNR CELL_MODEL_SEQ VIEW MNR CELL_ON_CELL VIEW MNR CELL_SENSORS VIEW MNR CELLS VIEW General Cell characteristics (Description-
Stationing-Grades- Drainage) MNR COLUMN_DESCRIPTIONS TABLE Informational table to be used until this
information can be transferred into all_col_comments.
MNR CONCRETE_CRASHES TABLE MNR CR_VALUES TABLE Cracked Tape readings MNR CR_VALUES_STATS VIEW MNR CSI_INV TABLE Campbell Scientific Inventory. MNR CT_ERRORS TABLE Thermocouple in cabinet to read interior
temperatures not within a set data range. MNR CT_VALUES TABLE Thermocouple in cabinet to read interior
temperatures. MNR DAILY_TEMPS TABLE MNR DAILY_TEMPS_FI_TI TABLE MNR DAILY_TEMPS_LOOKUP TABLE MNR DAILY_TEMPS_REFT_LOOKUP TABLE MNR DATABASE_REMOVED_TABLES TABLE List of all tables that have been removed from
the MNR database created by MCHALKLINE 7/15/2002.
MNR DATABASE_TABLE_DESC TABLE List of tables in the MnROAD Database MNR DB_TABLES_DUP_OLD TABLE MNR DCP_LOCATION TABLE DYNAMIC CONE PENETROMETER LOCATION
AND GENERAL INFORMATION (BOTH MN/ROAD AND OTHER STUDIES)
MNR DCP_TESTS_OTHER TABLE DCP tests locations not from MnROAD MNR DCP_VALUES TABLE Data from Mn/ROAD DCP tests including blow
counts and depths. MNR DCP_VALUES_OTHER TABLE Data from non-Mn/ROAD DCP tests including
blow counts and depths MNR DIPSTICK_PIN_ELEV TABLE Dipstick elevations MNR DISTRESS_AC TABLE Asphalt manual distress survey MNR DISTRESS_AGG_SURVEY_SEMI TABLE The results of a one year survey study 7/98 to
7/99. The semi truck driver filled out the survey each day that he drove and recorded the condition of the aggregate cells on the low volume road at the MnROAD project.

MNR DISTRESS_ALPS_DATA TABLE Automated Laser Profile Rutting data traces MNR DISTRESS_ALPS_RESULTS_RUT TABLE Automated Laser Profile Rutting results from
traces MNR DISTRESS_CELL VIEW MNR DISTRESS_CELL_ALL VIEW MNR DISTRESS_CIRCULR_TEXTR_METER TABLE MNR DISTRESS_CUPPING TABLE Field Description MNR DISTRESS_DATES_ML VIEW MNR DISTRESS_DECODE_DATES_ML VIEW MNR DISTRESS_FRICTION_DFT TABLE MNR DISTRESS_FRICTION_GRIP TABLE MNR DISTRESS_FRICTION_TRAILER TABLE MNR DISTRESS_JPCC TABLE Concrete manual distress survey. MNR DISTRESS_LANE_SHOULDER_DROPOFF TABLE MNR DISTRESS_LIGHTWEIGHT_DEFLECT TABLE MNR DISTRESS_NUCLEAR_DENSITY TABLE MNR DISTRESS_OBSI_DATA TABLE MnROAD Noise Data MNR DISTRESS_OBSI_SUMMARY TABLE MnROAD Noise Data Summary MNR DISTRESS_PCC_FAULTS TABLE MNR DISTRESS_PERMEABILITY_DIRECT TABLE MNR DISTRESS_RIDE_LISA TABLE MNR DISTRESS_RIDE_PATHWAYS TABLE MNR DISTRESS_RIDE_PAVETECH TABLE MNR DISTRESS_RUTTING_DIPSTICK TABLE Dipstick data. MNR DISTRESS_RUTTING_STRAIGHT_EDGE TABLE Straight Edge data. MNR DISTRESS_SAND_PATCH TABLE MNR DISTRESS_SCHMIDT_HAMMER TABLE MNR DISTRESS_SOUND_ABSORPTION TABLE MNR DISTRESS_WARP_CURL TABLE Description: Curl and Warp data collected
from concrete cells with ALPS 2 MNR DISTRESS_WATER_PERMEABILITY TABLE MNR DOWEL_BAR TABLE MNR DYNAMIC_LOAD_TEST_DESCRIPTIONS TABLE MNR DYNAMIC_LOAD_TEST_VALUES TABLE MNR EC_VALUES TABLE MNR ERROR_NUMS TABLE Error codes and descriptions. MNR ES_METADATA TABLE MNR ET_VALUES TABLE MNR EW_VALUES TABLE MNR EXT_MR_AGG_K VIEW MNR EXT_MR_AVG_LOG_MA VIEW MNR EXT_MR_K_MA VIEW MNR EXT_MR_K123 TABLE MNR EXT_MR_OTHER_K VIEW MNR EXT_MR_SOILS_K VIEW MNR EXT_MR_SUM_LOG_MA VIEW MNR FACILITY TABLE MNR FG_VALUES TABLE MNR FL_VALUES TABLE Rainfall collected. MNR FORENSIC_DENSITY TABLE RESULTS OF IN PLACE DENSITY TESTING
COMPLETED BY TWIN CITY TESTING MNR FORENSIC_ROD_LEVEL TABLE RESULTS OF ROD AND LEVEL DATA TAKEN
DURING FORENSIC INVESTIGATIONS MNR FORENSIC_RUTTING_SUMMARY TABLE RESULTS OF ROD AND LEVEL DATA TAKEN

DURING FORENSIC INVESTIGATIONS MNR FP_VALUES TABLE Elevations of the frost pins in the roadway. MNR FROST TABLE Calculated frost zones using MnROAD data. MNR FROST_PINS TABLE MnROAD frost pin elevation data MNR FROZEN_SOIL TABLE Frost depth summary for MnROAD MNR FS_VALUES TABLE MNR FT_VALUES TABLE MNR FW_VALUES TABLE MNR FWD_BACKCALC_RESULTS_V50 TABLE FWD back calculation results - Evercalc. MNR FWD_CALIBRATION TABLE MNR FWD_DAILY_LOG TABLE This table is a log of research FWD testing. MNR FWD_DATEFIX_TEMP TABLE MNR FWD_DROP TABLE MNR FWD_HISTORY TABLE MNR FWD_SESSION TABLE MNR FWD_STATION TABLE MNR GROUND_PENETRATING_RADAR TABLE Data from ground penetrating radar runs done
in 1996 MNR HC_ERRORS TABLE Horizontal Clip Gauge sensor values that fail
the data range checks MNR HC_VALUES TABLE Horizontal Clip Gauge sensor values. MNR HD_VALUES TABLE MNR HV_VALUES TABLE MNR KB_VALUES TABLE MNR LANE TABLE MNR LANE_DATES VIEW MNR LANE_DESIGN VIEW MNR LANE_EVENT TABLE MNR LAT_VEHICLES TABLE IRD vehicle data collected for each vehicle that
crosses the WIM - Location Information. MNR LAYER TABLE MNR LAYER_DATES VIEW MNR LAYERS VIEW MNR LVR_DAILY_LOG TABLE DO NOT change the name of this table or the
DATE, TRUCK_ID, LOADINGS, or WEIGHT columns. This table is used by the script for the LVR_DAILY_ESALS view which calculates the number of esals applied to the cells in the low volume road. The TIRE_*_IN and TIRE_*_OUT are the tread depth measurements of the semi tires which are reported to Michelin as part of a study. The tread depth is recorded in 32nds of an inch. This table is loaded by downloading the driver’s notes from a handheld pc at the MnROAD site. See Bob Strommen or Maggi Chalkline for questions.
MNR LVR_ESAL_FACTORS TABLE DO NOT change the name of this table or the COLUMNS OR THE COLUMN FORMATS. This table is used by the script for the LVR_DAILY_ESALS view which calculates the number of esals applied to the low volume road. See the comment on LVR_ESAL.
MNR LVR_ESALS VIEW MNR LVR_ESALS_STAGING VIEW MNR LVR_KWIM TABLE Need a table comment here MNR MAT_BINDER_ABCD_TEST TABLE

MNR MAT_BINDER_BBR_TEST TABLE Material testing results - Binder BBR tests MNR MAT_BINDER_CRITICAL_CRACK_TEMP TABLE Critical crack temperature (low temp) of
asphalt binders MNR MAT_BINDER_DENT_FRACTURE TABLE Results of double edge notched tension
(fracture) testing on asphalt binders MNR MAT_BINDER_DILATOMETR_TST TABLE MNR MAT_BINDER_DSR_TESTS TABLE Results of dynamic shear rheometer (DSR)
tests MNR MAT_BINDER_DT_TEST TABLE DIRECT TENSION TESTING OF ASPHALT
MATERIALS MNR MAT_BINDER_FATIGUE TABLE Results of binder repeated fatigue tests
performed with DSR MNR MAT_BINDER_REPEATED_CREEP TABLE Results of binder repeated creep tests
performed with DSR MNR MAT_BINDER_STRAIN_SWEEPS TABLE Results of binder strain sweep tests performed
with DSR MNR MAT_BINDER_TRAD_TESTS TABLE Material testing results - Binder common tests MNR MAT_CONC_AIR_VOID_RESULTS TABLE Results of concrete air void tests. MNR MAT_CONC_FIELD_RESULTS TABLE Results of concrete testing. MNR MAT_CONC_FLEX_STRENGTH TABLE MNR MAT_CONC_FREEZE_THAW_RESULTS TABLE Results of concrete sample freeze/thaw
testing. MNR MAT_CONC_MIX_GRAD_RESULTS TABLE MNR MAT_CONC_MOD_POISSON_RESULTS TABLE Results of concrete poisson ratio tests MNR MAT_CONC_RAPID_CHLORIDE TABLE MNR MAT_CONC_STRENGTH_RESULTS TABLE Results of concrete sample strength tests. MNR MAT_CONC_THERMAL_EXPANSION TABLE MNR MAT_CONCRETE_MIX_DESIGNS TABLE MNR MAT_HMA_AGING TABLE Results of tests done on extracted binders and
aggregates from HMA cores MNR MAT_HMA_APA TABLE Asphalt Pavement Analyzer laboratory rut
testing MNR MAT_HMA_BBR_TEST TABLE MNR MAT_HMA_BEAM_FATIGUE TABLE HMA lab beam fatigue test results MNR MAT_HMA_COMPLEX_SHEAR_MODU TABLE MNR MAT_HMA_CORE_TESTS TABLE Material testing results - HMA Core testing
results MNR MAT_HMA_DCT_TEST TABLE MNR MAT_HMA_DILATOMETRIC_TEST TABLE MNR MAT_HMA_DYNAMIC_MODULUS TABLE Results of lab dynamic modulus testing on
asphalt mixtures MNR MAT_HMA_FLOW_NUMBER TABLE MNR MAT_HMA_HAMBURG TABLE MNR MAT_HMA_IDT_TEST TABLE Indirect Tension Test Data on asphalt binder
material. MNR MAT_HMA_INDIRECT_TENS_FATI TABLE MNR MAT_HMA_MIX_TESTS TABLE Lab testing results of hot mix asphalt. MNR MAT_HMA_REPEAT_PERM_DEFORM TABLE MNR MAT_HMA_REPEAT_SHEAR TABLE MNR MAT_HMA_SCB_TEST TABLE Results of lab fracture testing on asphalt
mixtures MNR MAT_HMA_SENB_TEST TABLE MNR MAT_HMA_SIEVE_DATA TABLE Asphalt laboratory test results - Aggregate
gradations. MNR MAT_HMA_TRIAXIAL_STATIC_CREEP TABLE MNR MAT_HMA_TRIAXIAL_STRENGTH TABLE MNR MAT_HMA_TSRST_TEST TABLE
MNR MAT_HMA_TTI_OVERLAY TABLE MNR MAT_HMA_ULTRASONIC_MODULUS TABLE MNR MAT_MR_SOILS_LAB_DATA TABLE Material testing results - Soils testing data for
MR MNR MAT_MR_TESTING_LOG TABLE MNR MAT_PROCTOR_CURVES TABLE Material testing results - Proctor curve data MNR MAT_SAMPLES TABLE List of all the samples taken (MNROAD_ID)
from the Mn/ROAD test facility MNR MAT_SOIL_MR_PEAKS TABLE Material testing results - Soils testing peak
data for MR MNR MAT_SOIL_MR_RAW TABLE Material testing results - Soils testing raw data
for MR MNR MAT_SOIL_MR_RESULTS TABLE Results of the soil resilient modulus tests. MNR MAT_SOIL_SHEAR_TEST TABLE Material testing results - Soil shear testing data MNR MAT_SOIL_TESTS TABLE Results of the soils tests. MNR MAT_TEST_TYPES TABLE Material testing results - Binder BBR tests MNR MAT_UNBOUND_FIELD_MOISTURE TABLE MNR MAT_UNBOUND_GRADATIONS TABLE SUMMARY OF THE GRADATIONS ON SAMPLES
OF UNBOUND MATERIAL MNR MAT_UNBOUND_TUBE_SUCTION TABLE MNR MATERIAL TABLE MNR MC_VALUES TABLE Moisture content values MNR MH_VALUES TABLE MNR MNROAD_REQUESTS TABLE This table describes research requests. MNR MNROAD_REQUESTS_LOG TABLE This table is a log of research requests. MNR MODELS TABLE Description of the sensor models. MNR MP_VALUES VIEW MNR MR_AGG_ALL VIEW MNR MR_AGG_K VIEW MNR MR_AGG_LAB TABLE MNR MR_AGG_LAB_AVG VIEW MNR MR_AVERAGE VIEW MNR MR_AVERAGE_MA VIEW MNR MR_AVG_LOG VIEW MNR MR_BASELINE VIEW MNR MR_BASELINE_28A VIEW MNR MR_BASELINE_28A_MA VIEW MNR MR_BASELINE_MA VIEW MNR MR_DATA TABLE MNR MR_I1TIME1 VIEW MNR MR_I2TIME1 VIEW MNR MR_I3TIME1 VIEW MNR MR_K VIEW MNR MR_K_ALL VIEW MNR MR_K_MA VIEW MNR MR_K123 TABLE MNR MR_LIMS TABLE MNR MR_LOG TABLE MNR MR_OTHER_K VIEW MNR MR_PEAK_PICK TABLE MNR MR_PEAK_PICK_MA TABLE MNR MR_PEAK1 VIEW MNR MR_PEAK1_28A VIEW MNR MR_RAW_PEAKS VIEW

MNR MR_RAW_PEAKS_28A VIEW MNR MR_RAW_PEAKS_28A_MA VIEW MNR MR_RAW_PEAKS_MA VIEW MNR MR_SOIL_CODES TABLE MNR MR_SOILS_ALL VIEW MNR MR_SOILS_K VIEW MNR MR_SOILS_LAB TABLE MNR MR_SOILS_LAB_AVG VIEW MNR MR_STATUS_CODES TABLE MNR MR_SUM_LOG VIEW MNR MR_SUM_LOG_MA VIEW MNR MR_TIME_HISTORY TABLE MNR MR_TIME_HISTORY_28A TABLE MNR MR_TIME_HISTORY_CYCLES TABLE MNR MR_TIME_HISTORY_CYCLES_28A TABLE MNR MR_TIME_HISTORY_CYCLES_28A_MA VIEW MNR MR_TIME_HISTORY_CYCLES_MA VIEW MNR MR_TIME_HISTORY_CYCLES_TEMP TABLE MNR MR_TIME_HISTORY_MA VIEW MNR MR_TIME_HISTORY_TEMP TABLE MNR MR_TRXTIME1 VIEW MNR MR_TRXTIME1_28A VIEW MNR MR_X1TIME1 VIEW MNR MR_X2TIME1 VIEW MNR MT_VALUES TABLE MNR NW_WEATHER TABLE min day 21-mar-1997 max day PRESENT all of
it is used in THE WEATHER table good performance overall hidden from public
MNR OFFLINE_BASELINE_SENSOR_VALUES TABLE MNR OFFLINE_DATA_COLLECTION TABLE Offline data summary. MNR OFFLINE_DYNAMIC_TESTS TABLE MNR ORG_AXLE_W9 TABLE WIM traffic data work area. MNR ORG_W9 TABLE WIM traffic data work area. MNR OS_COAX_RAW_VALUES TABLE Open standpipe data MNR OS_MAN_DIFFOVER3 VIEW MNR OS_MAN_MAXDAY VIEW MNR OS_MAN_NEXTMAXDAY VIEW MNR OS_MANUAL_LAST VIEW MNR OS_MANUAL_NEXTLAST VIEW MNR OS_MANUAL_VALUES TABLE Open standpipe data MNR OS_REFERENCE_ELEVATIONS TABLE Open standpipe data MNR OS_TRANS_RAW_VALUES TABLE Open standpipe data MNR OS_WATER_TABLE_ELEVATIONS VIEW MNR OVERLAY_MAINT_HISTORY VIEW MNR PCC_JOINT_LOAD_TRANSFER TABLE MNR PL_ERRORS TABLE Static Lateral Pressure sensor values that did
not fall in the data range checks MNR PL_VALUES TABLE Static Lateral Pressure sensor values MNR PT_ERRORS TABLE Static Soil Pressure sensor values that did not
fall in the data range checks MNR PT_VALUES TABLE Static Soil Pressure sensor values. MNR QHRS TABLE 0, 1, 2 or 3 quarter hour time period. MNR RE_VALUES TABLE
MNR RG_CALIBRATIONS TABLE Rain gauge calibrations. MNR RG_VALUES TABLE Rain gauge data. MNR RH_ERRORS TABLE Interior cabinet humidity data that did not fall
in the data range checks MNR RH_VALUES TABLE Interior cabinet humidity data. MNR RM_VALUES TABLE MNR ROAD_SECTION TABLE MNR RP_BASE_VALUES TABLE Resistivity probe base. MNR RP_VALUES TABLE No data collected after spring 1998. The zone
of frozen soil is better characterized by automating a string of moisture blocks (WM_VALUES) and temperature sensors (TC_VALUES). Greg Johnson can explain.
MNR RS_VALUES TABLE MNR RT_VALUES TABLE MNR RW_VALUES TABLE MNR SENSOR TABLE MNR SENSOR_AVG TABLE MNR SENSOR_CALIBRATION_FACTORS TABLE MNR SENSOR_EVALUATION TABLE MNR SENSOR_EVENT_LOG TABLE MNR SENSOR_LOCATION VIEW MNR SENSOR_MODEL TABLE MNR SENSOR_MODEL_DESCRIPTIONS TABLE MNR SENSOR_RAW_DATA TABLE Listing of sensors and their characteristics. MNR SENSORS VIEW Description of the as built data for each sensor MNR SEQUENCE TABLE Patterns of sequence numbers for the
Campbell C# Data Loader. MNR SEVEN_DAY_FORECAST_TEMPS TABLE MNR SITE_CABINET TABLE Site data. MNR SITE_INVENTORY TABLE Used by Jon Lundheim. MNR SW_COMPOSITE VIEW MNR SW_ERRORS TABLE Static Pore Water pressure sensor values that
did not fall in the data range checks MNR SW_VALUES TABLE Static pore water pressure in cells
6,7,12,15,18,22,23,26,27 and 33. MNR TAGS TABLE MNR TB_CALIBRATIONS TABLE Tipping Bucket calibrations. MNR TB_ERRORS TABLE Tipping Bucket sensor values that did not fall in
the data range checks MNR TB_VALUES TABLE Tipping Bucket sensor values MNR TC_ALL_DAILY_SUMMARY VIEW MNR TC_CELL_11 VIEW MNR TC_CELL_6 VIEW MNR TC_ERRORS TABLE that did not fall in the data range checks MNR TC_LOCATIONS VIEW MNR TC_VALUES TABLE Thermocouple sensor values MNR TC_VALUES_1993 TABLE MNR TC_VALUES_1994 TABLE MNR TC_VALUES_1995 TABLE MNR TC_VALUES_1996 TABLE MNR TC_VALUES_1997 TABLE MNR TC_VALUES_1998 TABLE MNR TC_VALUES_1999 TABLE MNR TC_VALUES_2000 TABLE

MNR TC_VALUES_2001 TABLE MNR TC_VALUES_2002 TABLE MNR TC_VALUES_2003 TABLE MNR TC_VALUES_2004 TABLE MNR TC_VALUES_2005 TABLE MNR TC_VALUES_2006 TABLE MNR TC_VALUES_2007 TABLE MNR TC_VALUES_2008 TABLE MNR TC_VALUES_2009 TABLE MNR TC_VALUES_ALL VIEW MNR TC27 TABLE Thermocouple sensor values MNR TCS_DATA VIEW MNR TCS_TE_01 VIEW MNR TCS_TE_02 VIEW MNR TCS_TE_03 VIEW MNR TCS_TE_04 VIEW MNR TCS_TE_24 VIEW MNR TCS_TE_25 VIEW MNR TCS_TE_26 VIEW MNR TCS_TE_27 VIEW MNR TCS_TE_28 VIEW MNR TCS_TE_29 VIEW MNR TCS_TE_30 VIEW MNR TCS_TE_31 VIEW MNR TCS_TEST_RECORDING_PARAMS TABLE Test Control Software parameters. MNR TCS_TEST_SENS_ENGR_UNITS TABLE Test Control Software units. MNR TCS_TEST_SENSORS TABLE Test Control Software sensors. MNR TCS_TEST_TAG_ENGR_UNITS TABLE Test Control Software engineering units. MNR TCS_TEST_TAGS TABLE Test Control Software tags. MNR TCS_TEST_TRANSFORMS TABLE Test Control Software. MNR TD_AUTOMATED TABLE Time Domain Reflectometer values MNR TD_ERRORS TABLE Time Domain Reflectometer values not in the
expected data range MNR TD_VALUES TABLE Time Domain Reflectometer values. MNR TDR_RECALC TABLE TDR recalculated values MNR TH_VALUES TABLE MNR THREE_DAY_FORECAST_TEMPS TABLE MNR TL_ERRORS TABLE Tiltmeter Longitudinal sensor values that did
not fall in the data range checks MNR TL_VALUES TABLE Tiltmeter Longitudinal sensor values. MNR TM_ERRORS TABLE Cabinet temperature that did not fall in the
data range checks MNR TM_VALUES TABLE Cabinet temperature. MNR TRAFFIC_SWITCHES TABLE Log of dates and times traffic was not on the
mainline. MNR TRAFFIC_SWITCHES_HOUR TABLE Date and hour of traffic switches for
documentation. MNR TT_ERRORS TABLE Tiltmeter Transverse sensor values that fail
the data range checks MNR TT_VALUES TABLE Tiltmeter Transverse sensor values. MNR UNITS TABLE Unit conversion (English to Metric). MNR VG_VALUES TABLE MNR VM_VALUES TABLE MNR VW_ADJ TABLE Vibrating Wire Strain Gauge sensor values -
adjusted
MNR VW_ALL VIEW MNR VW_ERRORS TABLE Vibrating Wire Strain Gauge sensor values not
in expected data range checks MNR VW_ERRORS_NEW TABLE Vibrating Wire Strain Gauge sensor values MNR VW_IN VIEW MNR VW_INITIAL_VALUES TABLE Vibrating Wire Strain Gauge sensor values MNR VW_SOILS_LAB_FROM_LIMS VIEW MNR VW_VALUES TABLE Vibrating Wire Strain Gauge sensor values MNR VW_VALUES_1993 TABLE MNR VW_VALUES_1994 TABLE MNR VW_VALUES_1995 TABLE MNR VW_VALUES_1996 TABLE MNR VW_VALUES_1997 TABLE MNR VW_VALUES_1998 TABLE MNR VW_VALUES_1999 TABLE MNR VW_VALUES_2000 TABLE MNR VW_VALUES_2001 TABLE MNR VW_VALUES_2002 TABLE MNR VW_VALUES_2003 TABLE MNR VW_VALUES_2004 TABLE MNR VW_VALUES_2005 TABLE MNR VW_VALUES_2006 TABLE MNR VW_VALUES_2007 TABLE MNR VW_VALUES_2008 TABLE MNR VW_VALUES_2009 TABLE MNR VW_VALUES_ALL VIEW MNR VW_WEATHER_BUFFALO VIEW MNR WEATHER_AWS TABLE min day 26-sep-1990 max day is 17-FEB-1997
weather Vaisala station a lot of poor quality sporadic data and performance issues not used in THE WEATHER table hidden from public
MNR WEATHER_BUFFALO TABLE MNR WEATHER_COMPOSITE TABLE Weather station data MNR WEATHER_COMPOSITE_OLD TABLE an aggregate table min day 26-SEP-1990 max
day present this table is manually loaded by Craig Schrader with the most reliable data source as the primary data source and data from weather_se as a backup and quality control
MNR WEATHER_CRREL TABLE min day 30-oct-1994 max day 18-apr-1997 all of it is used in THE WEATHER table good portion of the precipitation data is bad solar_rad_in is a sum of 15 minutes and is truncated to four digits values corrupting the data planning on reconstructing the data hidden from public
MNR WEATHER_ENGLISH VIEW MNR WEATHER_METRIC VIEW MNR WEATHER_SE TABLE min day 30-apr-1998 max day PRESENT all of it
is used in THE WEATHER table as a backup and comparison for NW_WEATHER redundant system with voice modem for public queries (763-497-4597) good performance overall hidden from public
MNR WEATHER_STATES TABLE lookup table with two letter codes for various weather conditions at MnROAD not sure if this is being used in any of the other tables hidden from public view

MNR WM_ERRORS TABLE Watermark Moisture Block sensor values that fail the data range checks
MNR WM_VALUES TABLE Present year - Watermark Moisture Block sensor values
MNR WM_VALUES_1993 TABLE MNR WM_VALUES_1994 TABLE MNR WM_VALUES_1995 TABLE MNR WM_VALUES_1996 TABLE MNR WM_VALUES_1997 TABLE MNR WM_VALUES_1998 TABLE MNR WM_VALUES_1999 TABLE MNR WM_VALUES_2000 TABLE MNR WM_VALUES_2001 TABLE MNR WM_VALUES_2002 TABLE MNR WM_VALUES_2003 TABLE MNR WM_VALUES_2004 TABLE MNR WM_VALUES_2005 TABLE MNR WM_VALUES_2006 TABLE MNR WM_VALUES_2007 TABLE MNR WM_VALUES_2008 TABLE MNR WM_VALUES_2009 TABLE MNR WM_VALUES_ALL VIEW MNR WM27 TABLE Watermark Moisture Block sensor values MNR WM28 TABLE Watermark Moisture Block sensor values MNR XB_VALUES TABLE MNR XG_VALUES TABLE MNR XH_VALUES TABLE MNR XL_ERRORS TABLE Lateral Pressure Temperature sensor values
that fail the data range checks MNR XL_VALUES TABLE Lateral Pressure Temperature sensor values. MNR XM_VALUES TABLE MNR XS_ERRORS TABLE Static Water Pressure temperature values that
fail the data range checks MNR XS_VALUES TABLE Static Water Pressure temperature values. MNR XT_ERRORS TABLE Soil Pressure temperature values that fail the
data range checks MNR XT_VALUES TABLE Soil Pressure temperature values. MNR XV_ERRORS TABLE Vibrating Wire Strain Gage Temperature
sensor values that fail the data range checks MNR XV_VALUES TABLE Vibrating Wire Strain Gage Temperature
sensor values MNR XV_VALUES_1993 TABLE MNR XV_VALUES_1994 TABLE MNR XV_VALUES_1995 TABLE MNR XV_VALUES_1996 TABLE MNR XV_VALUES_1997 TABLE MNR XV_VALUES_1998 TABLE MNR XV_VALUES_1999 TABLE MNR XV_VALUES_2000 TABLE MNR XV_VALUES_2001 TABLE MNR XV_VALUES_2002 TABLE MNR XV_VALUES_2003 TABLE MNR XV_VALUES_2004 TABLE MNR XV_VALUES_2005 TABLE MNR XV_VALUES_2006 TABLE

MNR XV_VALUES_2007 TABLE MNR XV_VALUES_2008 TABLE MNR XV_VALUES_2009 TABLE MNR XV_VALUES_ALL VIEW WIM WIM_ADMIN_ALL_DAYS TABLE WIM WIM_ADMIN_ALL_HOURS TABLE WIM WIM_ADMIN_ESAL_FACTORS TABLE WIM WIM_MNRD_TOTAL_ESALS TABLE WIM WIM_MNS04_DATA_ENGLISH TABLE WIM WIM_MNS04_QUAD_AX_BINS TABLE WIM WIM_MNS04_RAW_DATA TABLE WIM WIM_MNS04_SINGLE_AX_BINS TABLE WIM WIM_MNS04_STEER_AX_BINS TABLE WIM WIM_MNS04_TANDEM_AX_BINS TABLE WIM WIM_MNS04_TRIDEM_AX_BINS TABLE WIM WIM_MNS25_ADJ_GVW VIEW WIM WIM_MNS25_ALL_AXLES VIEW WIM WIM_MNS25_ALL_DAYS TABLE WIM WIM_MNS25_ALL_HOURS TABLE WIM WIM_MNS25_C00_QUAD_AX_ESALS VIEW WIM WIM_MNS25_C00_SINGLE_AX_ESALS VIEW WIM WIM_MNS25_C00_STEER_AX_ESALS VIEW WIM WIM_MNS25_C00_TANDEM_AX_ESALS VIEW WIM WIM_MNS25_C00_TRIDEM_AX_ESALS VIEW WIM WIM_MNS25_C50_QUAD_AX_ESALS VIEW WIM WIM_MNS25_C50_SINGLE_AX_ESALS VIEW WIM WIM_MNS25_C50_STEER_AX_ESALS VIEW WIM WIM_MNS25_C50_TANDEM_AX_ESALS VIEW WIM WIM_MNS25_C50_TRIDEM_AX_ESALS VIEW WIM WIM_MNS25_CAR_STATS_DAILY TABLE WIM WIM_MNS25_CAR_STATS_HOURLY TABLE WIM WIM_MNS25_DATA_ENGLISH VIEW WIM WIM_MNS25_FATAL_ERROR_DAILY TABLE WIM WIM_MNS25_FATAL_ERROR_HOURLY TABLE WIM WIM_MNS25_QUAD_AX_ADJ VIEW WIM WIM_MNS25_QUAD_AX_BINS TABLE Counts the quadrem axles by day, lane and 1
kip weight bins. Used for axle load spectrum views and esals by day calculations.
WIM WIM_MNS25_QUAD_AX_ESALS VIEW WIM WIM_MNS25_QUAD_AX_REPLACE VIEW WIM WIM_MNS25_QUAD_AXLES VIEW Combines wim_mns25_quad_ax_replace view
with wim_mns25_quad_ax_adj view to create a continuous stream of weigh-in-motion data. The only gaps are when the traffic has been diverted off the test sections. The replacement data is select from similar days which have been deemed to have good weight data.
WIM WIM_MNS25_RAW_DATA TABLE WIM WIM_MNS25_SINGLE_AX_ADJ VIEW WIM WIM_MNS25_SINGLE_AX_BINS TABLE Counts the single axles by day, lane and 1 kip
weight bins. Used for axle load spectrum views and esals by day calculations.
WIM WIM_MNS25_SINGLE_AX_ESALS VIEW WIM WIM_MNS25_SINGLE_AX_REPLACE VIEW

WIM WIM_MNS25_SINGLE_AXLES VIEW Combines wim_mns25_single_ax_replace view with wim_mns25_single_ax_adj view to create a continuous stream of weigh-in-motion data. The only gaps are when the traffic has been diverted off the test sections. The replacement data is select from similar days which have been deemed to have good weight data.
WIM WIM_MNS25_STEER_AX_ADJ VIEW WIM WIM_MNS25_STEER_AX_BINS TABLE Counts the steer axles by day, lane and 1 kip
weight bins. Used for axle load spectrum views and esals by day calculations.
WIM WIM_MNS25_STEER_AX_ESALS VIEW WIM WIM_MNS25_STEER_AX_REPLACE VIEW WIM WIM_MNS25_STEER_AXLES VIEW Combines wim_mns25_steer_ax_replace view
with wim_mns25_steer_ax_adj view to create a continuous stream of weigh-in-motion data. The only gaps are when the traffic has been diverted off the test sections. The replacement data is select from similar days which have been deemed to have good weight data.
WIM WIM_MNS25_TANDEM_AX_ADJ VIEW WIM WIM_MNS25_TANDEM_AX_BINS TABLE Counts the tandem axles by day, lane and 1 kip
weight bins. Used for axle load spectrum views and esals by day calculations.
WIM WIM_MNS25_TANDEM_AX_ESALS VIEW WIM WIM_MNS25_TANDEM_AX_REPLACE VIEW WIM WIM_MNS25_TANDEM_AXLES VIEW Combines wim_mns25_tandem_ax_replace
view with wim_mns25_tandem_ax_adj view to create a continuous stream of weigh-in-motion data. The only gaps are when the traffic has been diverted off the test sections. The replacement data is select from similar days which have been deemed to have good weight data.
WIM WIM_MNS25_TOTAL_ESALS VIEW WIM WIM_MNS25_TRIDEM_AX_ADJ VIEW WIM WIM_MNS25_TRIDEM_AX_BINS TABLE Counts the tridem axles by day, lane and 1 kip
weight bins. Used for axle load spectrum views and esals by day calculations.
WIM WIM_MNS25_TRIDEM_AX_ESALS VIEW WIM WIM_MNS25_TRIDEM_AX_REPLACE VIEW WIM WIM_MNS25_TRIDEM_AXLES VIEW Combines wim_mns25_tridem_ax_replace
view with wim_mns25_tridem_ax_adj view to create a continuous stream of weigh-in-motion data. The only gaps are when the traffic has been diverted off the test sections. The replacement data is select from similar days which have been deemed to have good weight data.
WIM WIM_MNS25_VEHICLE_CLASS_ONLY TABLE WIM WIM_MNS37_DATA_ENGLISH TABLE WIM WIM_RAW_STAGING_10 TABLE WIM WIM_RAW_STAGING_11 TABLE WIM WIM_RAW_STAGING_12 TABLE