m fund, inc
TRANSCRIPT
M FUND, INC.
M International Equity FundM Large Cap Growth Fund
M Capital Appreciation FundM Large Cap Value Fund
Semi-Annual ReportJune 30, 2021
Beginning in February 2021, as permitted by regulations adopted by the Securities and Exchange Commission, papercopies of the Funds’ shareholder reports like this one will no longer be sent by mail, unless you specifically requestpaper copies of the reports from the Funds or from your financial intermediary, such as a broker-dealer or bank. Instead,the reports will be made available on a website, and you will be notified by mail each time a report is posted andprovided with a website link to access the report.
If you already elected to receive shareholder reports electronically, you will not be affected by this change and youneed not take any action. You may elect to receive shareholder reports and other communications from the Fundselectronically by calling your insurance company. If you own these shares through a financial intermediary, you maycontact your financial intermediary.
You may elect to receive all future reports in paper free of charge. You can inform the Funds that you wish to continuereceiving paper copies of your shareholder reports by sending a request in writing to your insurance company or toyour financial intermediary. Your election to receive reports in paper will apply to all funds held with the fund complex.
The accompanying notes are an integral part of these financial statements.
1
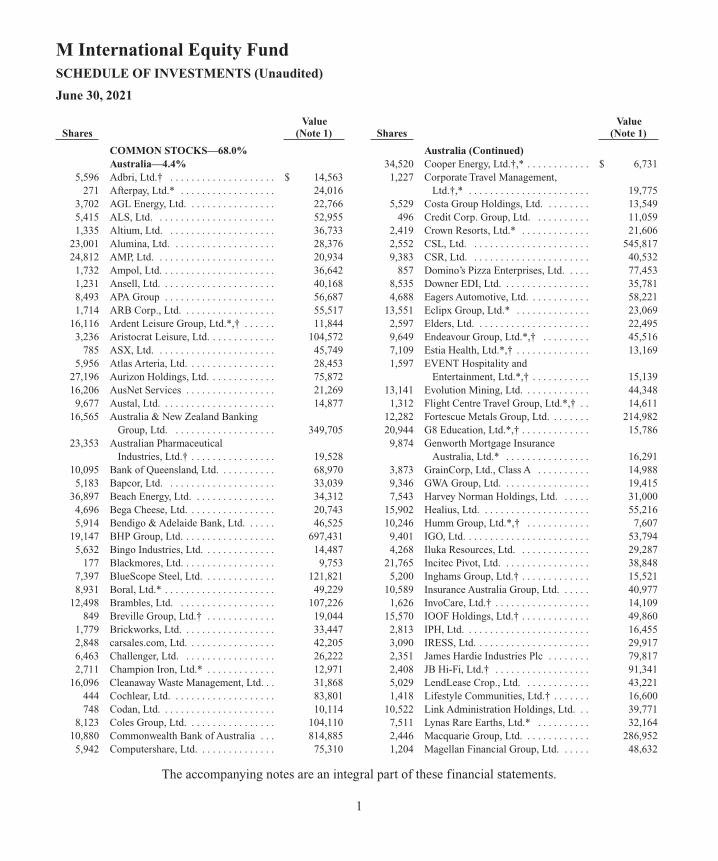
M International Equity FundSCHEDULE OF INVESTMENTS (Unaudited)
June 30, 2021
COMMON STOCKS—68.0%Australia—4.4%
5,596 Adbri, Ltd.† . . . . . . . . . . . . . . . . . . . . $ 14,563 271 Afterpay, Ltd.* . . . . . . . . . . . . . . . . . . 24,016 3,702 AGL Energy, Ltd. . . . . . . . . . . . . . . . . 22,766 5,415 ALS, Ltd. . . . . . . . . . . . . . . . . . . . . . . 52,955 1,335 Altium, Ltd. . . . . . . . . . . . . . . . . . . . . 36,733 23,001 Alumina, Ltd. . . . . . . . . . . . . . . . . . . . 28,376 24,812 AMP, Ltd. . . . . . . . . . . . . . . . . . . . . . . 20,934 1,732 Ampol, Ltd. . . . . . . . . . . . . . . . . . . . . . 36,642 1,231 Ansell, Ltd. . . . . . . . . . . . . . . . . . . . . . 40,168 8,493 APA Group . . . . . . . . . . . . . . . . . . . . . 56,687 1,714 ARB Corp., Ltd. . . . . . . . . . . . . . . . . . 55,517 16,116 Ardent Leisure Group, Ltd.*,† . . . . . . 11,844 3,236 Aristocrat Leisure, Ltd. . . . . . . . . . . . . 104,572 785 ASX, Ltd. . . . . . . . . . . . . . . . . . . . . . . 45,749 5,956 Atlas Arteria, Ltd. . . . . . . . . . . . . . . . . 28,453 27,196 Aurizon Holdings, Ltd. . . . . . . . . . . . . 75,872 16,206 AusNet Services . . . . . . . . . . . . . . . . . 21,269 9,677 Austal, Ltd. . . . . . . . . . . . . . . . . . . . . . 14,877 16,565 Australia & New Zealand Banking
Group, Ltd. . . . . . . . . . . . . . . . . . . . 349,705 23,353 Australian Pharmaceutical
Industries, Ltd.† . . . . . . . . . . . . . . . . 19,528 10,095 Bank of Queensland, Ltd. . . . . . . . . . . 68,970 5,183 Bapcor, Ltd. . . . . . . . . . . . . . . . . . . . . 33,039 36,897 Beach Energy, Ltd. . . . . . . . . . . . . . . . 34,312 4,696 Bega Cheese, Ltd. . . . . . . . . . . . . . . . . 20,743 5,914 Bendigo & Adelaide Bank, Ltd. . . . . . 46,525 19,147 BHP Group, Ltd. . . . . . . . . . . . . . . . . . 697,431 5,632 Bingo Industries, Ltd. . . . . . . . . . . . . . 14,487 177 Blackmores, Ltd. . . . . . . . . . . . . . . . . . 9,753 7,397 BlueScope Steel, Ltd. . . . . . . . . . . . . . 121,821 8,931 Boral, Ltd.* . . . . . . . . . . . . . . . . . . . . . 49,229 12,498 Brambles, Ltd. . . . . . . . . . . . . . . . . . . 107,226 849 Breville Group, Ltd.† . . . . . . . . . . . . . 19,044 1,779 Brickworks, Ltd. . . . . . . . . . . . . . . . . . 33,447 2,848 carsales.com, Ltd. . . . . . . . . . . . . . . . . 42,205 6,463 Challenger, Ltd. . . . . . . . . . . . . . . . . . 26,222 2,711 Champion Iron, Ltd.* . . . . . . . . . . . . . 12,971 16,096 Cleanaway Waste Management, Ltd. . . 31,868 444 Cochlear, Ltd. . . . . . . . . . . . . . . . . . . . 83,801 748 Codan, Ltd. . . . . . . . . . . . . . . . . . . . . . 10,114 8,123 Coles Group, Ltd. . . . . . . . . . . . . . . . . 104,110 10,880 Commonwealth Bank of Australia . . . 814,885 5,942 Computershare, Ltd. . . . . . . . . . . . . . . 75,310
Australia (Continued) 34,520 Cooper Energy, Ltd.†,* . . . . . . . . . . . . $ 6,731 1,227 Corporate Travel Management,
Ltd.†,* . . . . . . . . . . . . . . . . . . . . . . . 19,775 5,529 Costa Group Holdings, Ltd. . . . . . . . . 13,549 496 Credit Corp. Group, Ltd. . . . . . . . . . . 11,059 2,419 Crown Resorts, Ltd.* . . . . . . . . . . . . . 21,606 2,552 CSL, Ltd. . . . . . . . . . . . . . . . . . . . . . . 545,817 9,383 CSR, Ltd. . . . . . . . . . . . . . . . . . . . . . . 40,532 857 Domino’s Pizza Enterprises, Ltd. . . . . 77,453 8,535 Downer EDI, Ltd. . . . . . . . . . . . . . . . . 35,781 4,688 Eagers Automotive, Ltd. . . . . . . . . . . . 58,221 13,551 Eclipx Group, Ltd.* . . . . . . . . . . . . . . 23,069 2,597 Elders, Ltd. . . . . . . . . . . . . . . . . . . . . . 22,495 9,649 Endeavour Group, Ltd.*,† . . . . . . . . . 45,516 7,109 Estia Health, Ltd.*,† . . . . . . . . . . . . . . 13,169 1,597 EVENT Hospitality and
Entertainment, Ltd.*,† . . . . . . . . . . . 15,139 13,141 Evolution Mining, Ltd. . . . . . . . . . . . . 44,348 1,312 Flight Centre Travel Group, Ltd.*,† . . 14,611 12,282 Fortescue Metals Group, Ltd. . . . . . . . 214,982 20,944 G8 Education, Ltd.*,† . . . . . . . . . . . . . 15,786 9,874 Genworth Mortgage Insurance
Australia, Ltd.* . . . . . . . . . . . . . . . . 16,291 3,873 GrainCorp, Ltd., Class A . . . . . . . . . . 14,988 9,346 GWA Group, Ltd. . . . . . . . . . . . . . . . . 19,415 7,543 Harvey Norman Holdings, Ltd. . . . . . 31,000 15,902 Healius, Ltd. . . . . . . . . . . . . . . . . . . . . 55,216 10,246 Humm Group, Ltd.*,† . . . . . . . . . . . . 7,607 9,401 IGO, Ltd. . . . . . . . . . . . . . . . . . . . . . . . 53,794 4,268 Iluka Resources, Ltd. . . . . . . . . . . . . . 29,287 21,765 Incitec Pivot, Ltd. . . . . . . . . . . . . . . . . 38,848 5,200 Inghams Group, Ltd.† . . . . . . . . . . . . . 15,521 10,589 Insurance Australia Group, Ltd. . . . . . 40,977 1,626 InvoCare, Ltd.† . . . . . . . . . . . . . . . . . . 14,109 15,570 IOOF Holdings, Ltd.† . . . . . . . . . . . . . 49,860 2,813 IPH, Ltd. . . . . . . . . . . . . . . . . . . . . . . . 16,455 3,090 IRESS, Ltd. . . . . . . . . . . . . . . . . . . . . . 29,917 2,351 James Hardie Industries Plc . . . . . . . . 79,817 2,408 JB Hi-Fi, Ltd.† . . . . . . . . . . . . . . . . . . 91,341 5,029 LendLease Crop., Ltd. . . . . . . . . . . . . 43,221 1,418 Lifestyle Communities, Ltd.† . . . . . . . 16,600 10,522 Link Administration Holdings, Ltd. . . 39,771 7,511 Lynas Rare Earths, Ltd.* . . . . . . . . . . 32,164 2,446 Macquarie Group, Ltd. . . . . . . . . . . . . 286,952 1,204 Magellan Financial Group, Ltd. . . . . . 48,632
Value Shares (Note 1)
Value Shares (Note 1)
The accompanying notes are an integral part of these financial statements.
2
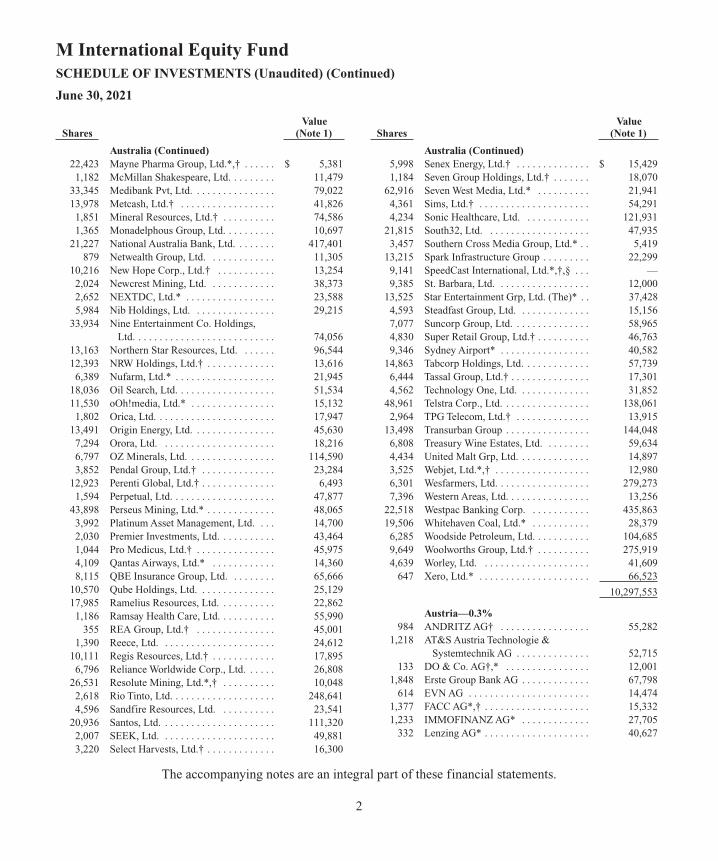
M International Equity FundSCHEDULE OF INVESTMENTS (Unaudited) (Continued)
June 30, 2021
Australia (Continued) 22,423 Mayne Pharma Group, Ltd.*,† . . . . . . $ 5,381 1,182 McMillan Shakespeare, Ltd. . . . . . . . . 11,479 33,345 Medibank Pvt, Ltd. . . . . . . . . . . . . . . . 79,022 13,978 Metcash, Ltd.† . . . . . . . . . . . . . . . . . . 41,826 1,851 Mineral Resources, Ltd.† . . . . . . . . . . 74,586 1,365 Monadelphous Group, Ltd. . . . . . . . . . 10,697 21,227 National Australia Bank, Ltd. . . . . . . . 417,401 879 Netwealth Group, Ltd. . . . . . . . . . . . . 11,305 10,216 New Hope Corp., Ltd.† . . . . . . . . . . . 13,254 2,024 Newcrest Mining, Ltd. . . . . . . . . . . . . 38,373 2,652 NEXTDC, Ltd.* . . . . . . . . . . . . . . . . . 23,588 5,984 Nib Holdings, Ltd. . . . . . . . . . . . . . . . 29,215 33,934 Nine Entertainment Co. Holdings,
Ltd. . . . . . . . . . . . . . . . . . . . . . . . . . . 74,056 13,163 Northern Star Resources, Ltd. . . . . . . 96,544 12,393 NRW Holdings, Ltd.† . . . . . . . . . . . . . 13,616 6,389 Nufarm, Ltd.* . . . . . . . . . . . . . . . . . . . 21,945 18,036 Oil Search, Ltd. . . . . . . . . . . . . . . . . . . 51,534 11,530 oOh!media, Ltd.* . . . . . . . . . . . . . . . . 15,132 1,802 Orica, Ltd. . . . . . . . . . . . . . . . . . . . . . . 17,947 13,491 Origin Energy, Ltd. . . . . . . . . . . . . . . . 45,630 7,294 Orora, Ltd. . . . . . . . . . . . . . . . . . . . . . 18,216 6,797 OZ Minerals, Ltd. . . . . . . . . . . . . . . . . 114,590 3,852 Pendal Group, Ltd.† . . . . . . . . . . . . . . 23,284 12,923 Perenti Global, Ltd.† . . . . . . . . . . . . . . 6,493 1,594 Perpetual, Ltd. . . . . . . . . . . . . . . . . . . . 47,877 43,898 Perseus Mining, Ltd.* . . . . . . . . . . . . . 48,065 3,992 Platinum Asset Management, Ltd. . . . 14,700 2,030 Premier Investments, Ltd. . . . . . . . . . . 43,464 1,044 Pro Medicus, Ltd.† . . . . . . . . . . . . . . . 45,975 4,109 Qantas Airways, Ltd.* . . . . . . . . . . . . 14,360 8,115 QBE Insurance Group, Ltd. . . . . . . . . 65,666 10,570 Qube Holdings, Ltd. . . . . . . . . . . . . . . 25,129 17,985 Ramelius Resources, Ltd. . . . . . . . . . . 22,862 1,186 Ramsay Health Care, Ltd. . . . . . . . . . . 55,990 355 REA Group, Ltd.† . . . . . . . . . . . . . . . 45,001 1,390 Reece, Ltd. . . . . . . . . . . . . . . . . . . . . . 24,612 10,111 Regis Resources, Ltd.† . . . . . . . . . . . . 17,895 6,796 Reliance Worldwide Corp., Ltd. . . . . . 26,808 26,531 Resolute Mining, Ltd.*,† . . . . . . . . . . 10,048 2,618 Rio Tinto, Ltd. . . . . . . . . . . . . . . . . . . . 248,641 4,596 Sandfire Resources, Ltd. . . . . . . . . . . 23,541 20,936 Santos, Ltd. . . . . . . . . . . . . . . . . . . . . . 111,320 2,007 SEEK, Ltd. . . . . . . . . . . . . . . . . . . . . . 49,881 3,220 Select Harvests, Ltd.† . . . . . . . . . . . . . 16,300
Australia (Continued) 5,998 Senex Energy, Ltd.† . . . . . . . . . . . . . . $ 15,429 1,184 Seven Group Holdings, Ltd.† . . . . . . . 18,070 62,916 Seven West Media, Ltd.* . . . . . . . . . . 21,941 4,361 Sims, Ltd.† . . . . . . . . . . . . . . . . . . . . . 54,291 4,234 Sonic Healthcare, Ltd. . . . . . . . . . . . . 121,931 21,815 South32, Ltd. . . . . . . . . . . . . . . . . . . . 47,935 3,457 Southern Cross Media Group, Ltd.* . . 5,419 13,215 Spark Infrastructure Group . . . . . . . . . 22,299 9,141 SpeedCast International, Ltd.*,†,§ . . . — 9,385 St. Barbara, Ltd. . . . . . . . . . . . . . . . . . 12,000 13,525 Star Entertainment Grp, Ltd. (The)* . . 37,428 4,593 Steadfast Group, Ltd. . . . . . . . . . . . . . 15,156 7,077 Suncorp Group, Ltd. . . . . . . . . . . . . . . 58,965 4,830 Super Retail Group, Ltd.† . . . . . . . . . . 46,763 9,346 Sydney Airport* . . . . . . . . . . . . . . . . . 40,582 14,863 Tabcorp Holdings, Ltd. . . . . . . . . . . . . 57,739 6,444 Tassal Group, Ltd.† . . . . . . . . . . . . . . . 17,301 4,562 Technology One, Ltd. . . . . . . . . . . . . . 31,852 48,961 Telstra Corp., Ltd. . . . . . . . . . . . . . . . . 138,061 2,964 TPG Telecom, Ltd.† . . . . . . . . . . . . . . 13,915 13,498 Transurban Group . . . . . . . . . . . . . . . . 144,048 6,808 Treasury Wine Estates, Ltd. . . . . . . . . 59,634 4,434 United Malt Grp, Ltd. . . . . . . . . . . . . . 14,897 3,525 Webjet, Ltd.*,† . . . . . . . . . . . . . . . . . . 12,980 6,301 Wesfarmers, Ltd. . . . . . . . . . . . . . . . . . 279,273 7,396 Western Areas, Ltd. . . . . . . . . . . . . . . . 13,256 22,518 Westpac Banking Corp. . . . . . . . . . . . 435,863 19,506 Whitehaven Coal, Ltd.* . . . . . . . . . . . 28,379 6,285 Woodside Petroleum, Ltd. . . . . . . . . . . 104,685 9,649 Woolworths Group, Ltd.† . . . . . . . . . . 275,919 4,639 Worley, Ltd. . . . . . . . . . . . . . . . . . . . . 41,609 647 Xero, Ltd.* . . . . . . . . . . . . . . . . . . . . . 66,523
10,297,553
Austria—0.3% 984 ANDRITZ AG† . . . . . . . . . . . . . . . . . 55,282 1,218 AT&S Austria Technologie &
Systemtechnik AG . . . . . . . . . . . . . . 52,715 133 DO & Co. AG†,* . . . . . . . . . . . . . . . . 12,001 1,848 Erste Group Bank AG . . . . . . . . . . . . . 67,798 614 EVN AG . . . . . . . . . . . . . . . . . . . . . . . 14,474 1,377 FACC AG*,† . . . . . . . . . . . . . . . . . . . . 15,332 1,233 IMMOFINANZ AG* . . . . . . . . . . . . . 27,705 332 Lenzing AG* . . . . . . . . . . . . . . . . . . . . 40,627
Value Shares (Note 1)
Value Shares (Note 1)

The accompanying notes are an integral part of these financial statements.
3
M International Equity FundSCHEDULE OF INVESTMENTS (Unaudited) (Continued)
June 30, 2021
Austria (Continued) 1,311 OMV AG . . . . . . . . . . . . . . . . . . . . . . . $ 74,570 3,082 Raiffeisen Bank International AG . . . . 69,801 1,417 S IMMO AG . . . . . . . . . . . . . . . . . . . . 33,940 127 Schoeller-Bleckmann Oilfield
Equipment AG* . . . . . . . . . . . . . . . . 5,338 1,874 Telekom Austria AG . . . . . . . . . . . . . . 15,999 4,149 UNIQA Insurance Group AG . . . . . . . 36,110 252 Verbund AG . . . . . . . . . . . . . . . . . . . . 23,202 884 Vienna Insurance Group AG Wiener
Versicherung Gruppe . . . . . . . . . . . . 24,266 1,881 voestalpine AG . . . . . . . . . . . . . . . . . . 76,592 368 Wienerberger AG . . . . . . . . . . . . . . . . 14,182
659,934
Belgium—0.7% 366 Ackermans & van Haaren NV . . . . . . 61,799 2,424 Ageas SA/NV . . . . . . . . . . . . . . . . . . . 134,515 5,568 AGFA-Gevaert NV* . . . . . . . . . . . . . . 25,848 5,947 Anheuser-Busch InBev SA/NV . . . . . 428,811 127 Argenx SE* . . . . . . . . . . . . . . . . . . . . . 38,416 851 Barco NV . . . . . . . . . . . . . . . . . . . . . . 23,289 1,086 Bekaert SA . . . . . . . . . . . . . . . . . . . . . 48,393 991 bpost SA* . . . . . . . . . . . . . . . . . . . . . . 11,857 105 Cie d’Entreprises CFE . . . . . . . . . . . . 10,956 333 D’ieteren Group . . . . . . . . . . . . . . . . . 40,275 196 Elia Group SA/NV . . . . . . . . . . . . . . . 20,684 609 Etablissements Franz Colruyt NV . . . 34,055 1,410 Euronav NV . . . . . . . . . . . . . . . . . . . . 13,108 2,756 Euronav SA*,† . . . . . . . . . . . . . . . . . . 25,686 548 EVS Broadcast Equipment SA . . . . . . 11,501 1,400 Fagron . . . . . . . . . . . . . . . . . . . . . . . . . 31,259 401 Gimv NV . . . . . . . . . . . . . . . . . . . . . . 25,676 1,602 KBC Group NV . . . . . . . . . . . . . . . . . 122,143 9 Lotus Bakeries NV . . . . . . . . . . . . . . . 50,904 216 Melexis NV . . . . . . . . . . . . . . . . . . . . . 22,424 2,034 Ontex Group NV*,† . . . . . . . . . . . . . . 25,324 1,080 Orange Belgium SA . . . . . . . . . . . . . . 24,229 1,637 Proximus SADP . . . . . . . . . . . . . . . . . 31,620 214 Sipef NV . . . . . . . . . . . . . . . . . . . . . . . 12,053 1,145 Solvay SA . . . . . . . . . . . . . . . . . . . . . . 145,544 449 Telenet Group Holding NV . . . . . . . . . 16,898 688 Tessenderlo Group SA* . . . . . . . . . . . 29,042 852 UCB SA . . . . . . . . . . . . . . . . . . . . . . . 89,065 1,277 Umicore SA . . . . . . . . . . . . . . . . . . . . 77,982
1,633,356
Canada—7.3% 1,800 Absolute Software Corp. . . . . . . . . . . $ 26,036 6,700 Advantage Energy, Ltd.*,† . . . . . . . . . 27,349 1,679 Aecon Group, Inc. . . . . . . . . . . . . . . . 24,380 607 Ag Growth International, Inc.† . . . . . . 18,862 1,650 Agnico-Eagle Mines, Ltd. . . . . . . . . . 99,749 5,042 Aimia, Inc.* . . . . . . . . . . . . . . . . . . . . 19,849 1,100 Air Canada*,† . . . . . . . . . . . . . . . . . . . 22,628 7,285 Alamos Gold, Inc., Class A . . . . . . . . . 55,654 889 Algonquin Power & Utilities
Corp.† . . . . . . . . . . . . . . . . . . . . . . . 13,246 5,308 Alimentation Couche-Tard, Inc.,
Class B . . . . . . . . . . . . . . . . . . . . . . . 195,046 1,600 AltaGas, Ltd.† . . . . . . . . . . . . . . . . . . . 33,585 1,185 Altus Group, Ltd.† . . . . . . . . . . . . . . . 54,920 18,656 ARC Resources, Ltd.† . . . . . . . . . . . . 158,778 989 Aritzia, Inc.* . . . . . . . . . . . . . . . . . . . . 29,584 700 Atco, Ltd., Class I . . . . . . . . . . . . . . . . 24,824 84 Aurora Cannabis, Inc.†,* . . . . . . . . . . 761 16,677 B2Gold Corp. . . . . . . . . . . . . . . . . . . . 69,958 850 Badger Infrastructure Solutions, Ltd. . . 25,796 5,455 Bank of Montreal . . . . . . . . . . . . . . . . 559,142 8,200 Bank of Nova Scotia (The)† . . . . . . . . 533,304 2,209 Barrick Gold Corp.† . . . . . . . . . . . . . . 45,691 7,164 Barrick Gold Corp. . . . . . . . . . . . . . . . 148,152 3,183 Bausch Health Cos., Inc.* . . . . . . . . . 93,415 1,208 BCE, Inc. . . . . . . . . . . . . . . . . . . . . . . 59,572 9,500 Birchcliff Energy, Ltd.† . . . . . . . . . . . 39,852 4,601 BlackBerry, Ltd.* . . . . . . . . . . . . . . . . 56,232 862 Boralex, Inc., Class A† . . . . . . . . . . . . 26,251 11 Brookfield Asset Management
Reinsurance Partners, Ltd. Class A* . . . . . . . . . . . . . . . . . . . . . . 581
9 Brookfield Asset Management Reinsurance Partners, Ltd. Class A*,† . . . . . . . . . . . . . . . . . . . . 479
1,680 Brookfield Asset Management, Inc., Class A† . . . . . . . . . . . . . . . . . . 153,817
785 BRP, Inc. . . . . . . . . . . . . . . . . . . . . . . . 61,427 4,802 Cameco Corp. . . . . . . . . . . . . . . . . . . . 92,042 1,985 Canaccord Genuity Group, Inc.† . . . . 21,746 400 Canada Goose Holdings, Inc.*,† . . . . 17,483 4,735 Canadian Imperial Bank of
Commerce . . . . . . . . . . . . . . . . . . . . 539,052 4,408 Canadian National Railway Co. . . . . . 465,087 14,634 Canadian Natural Resources, Ltd. . . . 531,244
Value Shares (Note 1)
Value Shares (Note 1)
The accompanying notes are an integral part of these financial statements.
4
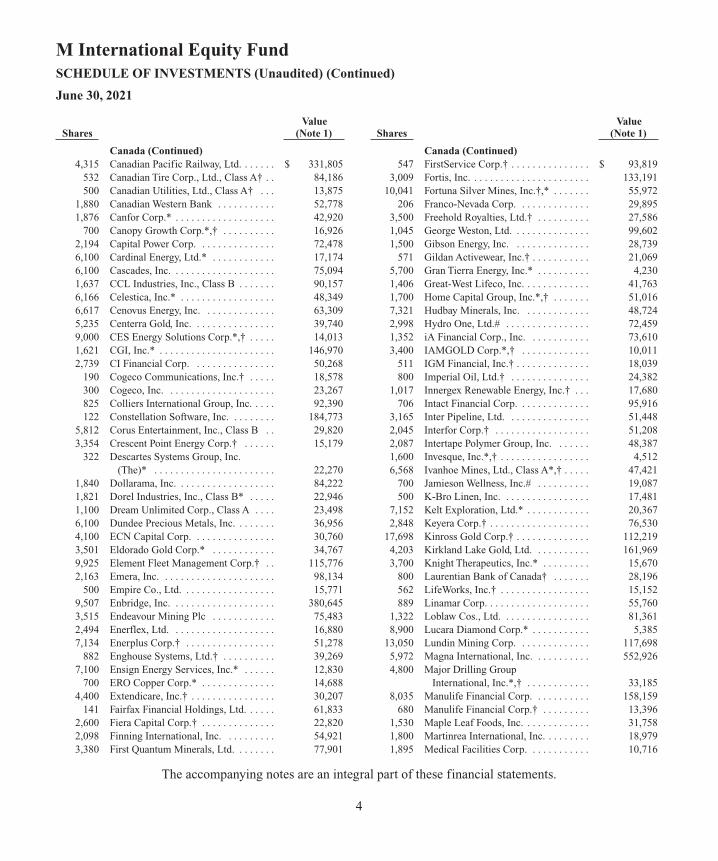
M International Equity FundSCHEDULE OF INVESTMENTS (Unaudited) (Continued)
June 30, 2021
Canada (Continued) 4,315 Canadian Pacific Railway, Ltd. . . . . . . $ 331,805 532 Canadian Tire Corp., Ltd., Class A† . . 84,186 500 Canadian Utilities, Ltd., Class A† . . . 13,875 1,880 Canadian Western Bank . . . . . . . . . . . 52,778 1,876 Canfor Corp.* . . . . . . . . . . . . . . . . . . . 42,920 700 Canopy Growth Corp.*,† . . . . . . . . . . 16,926 2,194 Capital Power Corp. . . . . . . . . . . . . . . 72,478 6,100 Cardinal Energy, Ltd.* . . . . . . . . . . . . 17,174 6,100 Cascades, Inc. . . . . . . . . . . . . . . . . . . . 75,094 1,637 CCL Industries, Inc., Class B . . . . . . . 90,157 6,166 Celestica, Inc.* . . . . . . . . . . . . . . . . . . 48,349 6,617 Cenovus Energy, Inc. . . . . . . . . . . . . . 63,309 5,235 Centerra Gold, Inc. . . . . . . . . . . . . . . . 39,740 9,000 CES Energy Solutions Corp.*,† . . . . . 14,013 1,621 CGI, Inc.* . . . . . . . . . . . . . . . . . . . . . . 146,970 2,739 CI Financial Corp. . . . . . . . . . . . . . . . 50,268 190 Cogeco Communications, Inc.† . . . . . 18,578 300 Cogeco, Inc. . . . . . . . . . . . . . . . . . . . . 23,267 825 Colliers International Group, Inc. . . . . 92,390 122 Constellation Software, Inc. . . . . . . . . 184,773 5,812 Corus Entertainment, Inc., Class B . . 29,820 3,354 Crescent Point Energy Corp.† . . . . . . 15,179 322 Descartes Systems Group, Inc.
(The)* . . . . . . . . . . . . . . . . . . . . . . . 22,270 1,840 Dollarama, Inc. . . . . . . . . . . . . . . . . . . 84,222 1,821 Dorel Industries, Inc., Class B* . . . . . 22,946 1,100 Dream Unlimited Corp., Class A . . . . 23,498 6,100 Dundee Precious Metals, Inc. . . . . . . . 36,956 4,100 ECN Capital Corp. . . . . . . . . . . . . . . . 30,760 3,501 Eldorado Gold Corp.* . . . . . . . . . . . . 34,767 9,925 Element Fleet Management Corp.† . . 115,776 2,163 Emera, Inc. . . . . . . . . . . . . . . . . . . . . . 98,134 500 Empire Co., Ltd. . . . . . . . . . . . . . . . . . 15,771 9,507 Enbridge, Inc. . . . . . . . . . . . . . . . . . . . 380,645 3,515 Endeavour Mining Plc . . . . . . . . . . . . 75,483 2,494 Enerflex, Ltd. . . . . . . . . . . . . . . . . . . . 16,880 7,134 Enerplus Corp.† . . . . . . . . . . . . . . . . . 51,278 882 Enghouse Systems, Ltd.† . . . . . . . . . . 39,269 7,100 Ensign Energy Services, Inc.* . . . . . . 12,830 700 ERO Copper Corp.* . . . . . . . . . . . . . . 14,688 4,400 Extendicare, Inc.† . . . . . . . . . . . . . . . . 30,207 141 Fairfax Financial Holdings, Ltd. . . . . . 61,833 2,600 Fiera Capital Corp.† . . . . . . . . . . . . . . 22,820 2,098 Finning International, Inc. . . . . . . . . . 54,921 3,380 First Quantum Minerals, Ltd. . . . . . . . 77,901
Canada (Continued) 547 FirstService Corp.† . . . . . . . . . . . . . . . $ 93,819 3,009 Fortis, Inc. . . . . . . . . . . . . . . . . . . . . . . 133,191 10,041 Fortuna Silver Mines, Inc.†,* . . . . . . . 55,972 206 Franco-Nevada Corp. . . . . . . . . . . . . . 29,895 3,500 Freehold Royalties, Ltd.† . . . . . . . . . . 27,586 1,045 George Weston, Ltd. . . . . . . . . . . . . . . 99,602 1,500 Gibson Energy, Inc. . . . . . . . . . . . . . . 28,739 571 Gildan Activewear, Inc.† . . . . . . . . . . . 21,069 5,700 Gran Tierra Energy, Inc.* . . . . . . . . . . 4,230 1,406 Great-West Lifeco, Inc. . . . . . . . . . . . . 41,763 1,700 Home Capital Group, Inc.*,† . . . . . . . 51,016 7,321 Hudbay Minerals, Inc. . . . . . . . . . . . . 48,724 2,998 Hydro One, Ltd.# . . . . . . . . . . . . . . . . 72,459 1,352 iA Financial Corp., Inc. . . . . . . . . . . . 73,610 3,400 IAMGOLD Corp.*,† . . . . . . . . . . . . . 10,011 511 IGM Financial, Inc.† . . . . . . . . . . . . . . 18,039 800 Imperial Oil, Ltd.† . . . . . . . . . . . . . . . 24,382 1,017 Innergex Renewable Energy, Inc.† . . . 17,680 706 Intact Financial Corp. . . . . . . . . . . . . . 95,916 3,165 Inter Pipeline, Ltd. . . . . . . . . . . . . . . . 51,448 2,045 Interfor Corp.† . . . . . . . . . . . . . . . . . . 51,208 2,087 Intertape Polymer Group, Inc. . . . . . . 48,387 1,600 Invesque, Inc.*,† . . . . . . . . . . . . . . . . . 4,512 6,568 Ivanhoe Mines, Ltd., Class A*,† . . . . . 47,421 700 Jamieson Wellness, Inc.# . . . . . . . . . . 19,087 500 K-Bro Linen, Inc. . . . . . . . . . . . . . . . . 17,481 7,152 Kelt Exploration, Ltd.* . . . . . . . . . . . . 20,367 2,848 Keyera Corp.† . . . . . . . . . . . . . . . . . . . 76,530 17,698 Kinross Gold Corp.† . . . . . . . . . . . . . . 112,219 4,203 Kirkland Lake Gold, Ltd. . . . . . . . . . . 161,969 3,700 Knight Therapeutics, Inc.* . . . . . . . . . 15,670 800 Laurentian Bank of Canada† . . . . . . . 28,196 562 LifeWorks, Inc.† . . . . . . . . . . . . . . . . . 15,152 889 Linamar Corp. . . . . . . . . . . . . . . . . . . . 55,760 1,322 Loblaw Cos., Ltd. . . . . . . . . . . . . . . . . 81,361 8,900 Lucara Diamond Corp.* . . . . . . . . . . . 5,385 13,050 Lundin Mining Corp. . . . . . . . . . . . . . 117,698 5,972 Magna International, Inc. . . . . . . . . . . 552,926 4,800 Major Drilling Group
International, Inc.*,† . . . . . . . . . . . . 33,185 8,035 Manulife Financial Corp. . . . . . . . . . . 158,159 680 Manulife Financial Corp.† . . . . . . . . . 13,396 1,530 Maple Leaf Foods, Inc. . . . . . . . . . . . . 31,758 1,800 Martinrea International, Inc. . . . . . . . . 18,979 1,895 Medical Facilities Corp. . . . . . . . . . . . 10,716
Value Shares (Note 1)
Value Shares (Note 1)
The accompanying notes are an integral part of these financial statements.
5
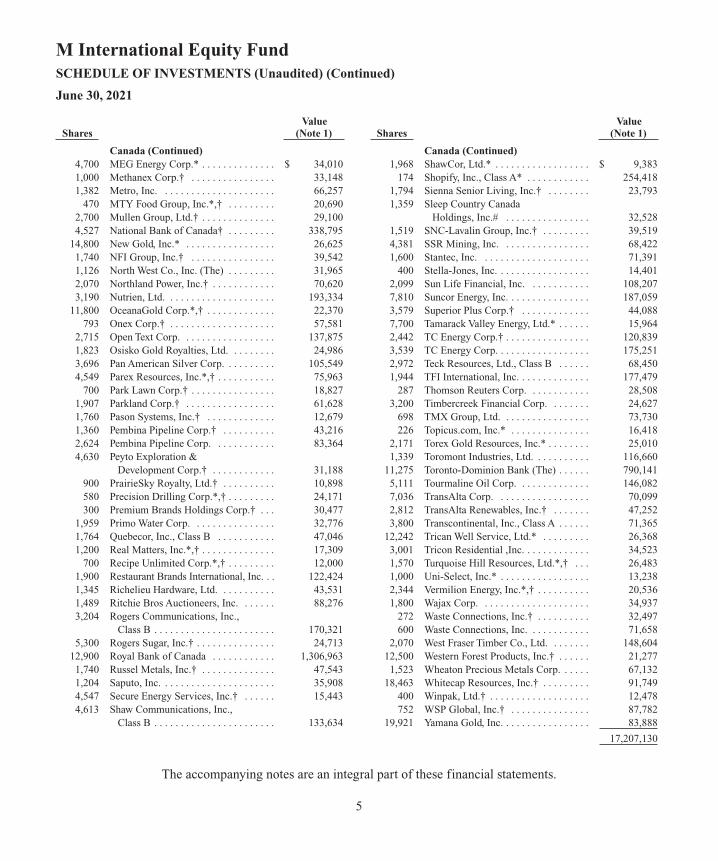
M International Equity FundSCHEDULE OF INVESTMENTS (Unaudited) (Continued)
June 30, 2021
Canada (Continued) 4,700 MEG Energy Corp.* . . . . . . . . . . . . . . $ 34,010 1,000 Methanex Corp.† . . . . . . . . . . . . . . . . 33,148 1,382 Metro, Inc. . . . . . . . . . . . . . . . . . . . . . 66,257 470 MTY Food Group, Inc.*,† . . . . . . . . . 20,690 2,700 Mullen Group, Ltd.† . . . . . . . . . . . . . . 29,100 4,527 National Bank of Canada† . . . . . . . . . 338,795 14,800 New Gold, Inc.* . . . . . . . . . . . . . . . . . 26,625 1,740 NFI Group, Inc.† . . . . . . . . . . . . . . . . 39,542 1,126 North West Co., Inc. (The) . . . . . . . . . 31,965 2,070 Northland Power, Inc.† . . . . . . . . . . . . 70,620 3,190 Nutrien, Ltd. . . . . . . . . . . . . . . . . . . . . 193,334 11,800 OceanaGold Corp.*,† . . . . . . . . . . . . . 22,370 793 Onex Corp.† . . . . . . . . . . . . . . . . . . . . 57,581 2,715 Open Text Corp. . . . . . . . . . . . . . . . . . 137,875 1,823 Osisko Gold Royalties, Ltd. . . . . . . . . 24,986 3,696 Pan American Silver Corp. . . . . . . . . . 105,549 4,549 Parex Resources, Inc.*,† . . . . . . . . . . . 75,963 700 Park Lawn Corp.† . . . . . . . . . . . . . . . . 18,827 1,907 Parkland Corp.† . . . . . . . . . . . . . . . . . 61,628 1,760 Pason Systems, Inc.† . . . . . . . . . . . . . 12,679 1,360 Pembina Pipeline Corp.† . . . . . . . . . . 43,216 2,624 Pembina Pipeline Corp. . . . . . . . . . . . 83,364 4,630 Peyto Exploration &
Development Corp.† . . . . . . . . . . . . 31,188 900 PrairieSky Royalty, Ltd.† . . . . . . . . . . 10,898 580 Precision Drilling Corp.*,† . . . . . . . . . 24,171 300 Premium Brands Holdings Corp.† . . . 30,477 1,959 Primo Water Corp. . . . . . . . . . . . . . . . 32,776 1,764 Quebecor, Inc., Class B . . . . . . . . . . . 47,046 1,200 Real Matters, Inc.*,† . . . . . . . . . . . . . . 17,309 700 Recipe Unlimited Corp.*,† . . . . . . . . . 12,000 1,900 Restaurant Brands International, Inc. . . 122,424 1,345 Richelieu Hardware, Ltd. . . . . . . . . . . 43,531 1,489 Ritchie Bros Auctioneers, Inc. . . . . . . 88,276 3,204 Rogers Communications, Inc.,
Class B . . . . . . . . . . . . . . . . . . . . . . . 170,321 5,300 Rogers Sugar, Inc.† . . . . . . . . . . . . . . . 24,713 12,900 Royal Bank of Canada . . . . . . . . . . . . 1,306,963 1,740 Russel Metals, Inc.† . . . . . . . . . . . . . . 47,543 1,204 Saputo, Inc. . . . . . . . . . . . . . . . . . . . . . 35,908 4,547 Secure Energy Services, Inc.† . . . . . . 15,443 4,613 Shaw Communications, Inc.,
Class B . . . . . . . . . . . . . . . . . . . . . . . 133,634
Canada (Continued) 1,968 ShawCor, Ltd.* . . . . . . . . . . . . . . . . . . $ 9,383 174 Shopify, Inc., Class A* . . . . . . . . . . . . 254,418 1,794 Sienna Senior Living, Inc.† . . . . . . . . 23,793 1,359 Sleep Country Canada
Holdings, Inc.# . . . . . . . . . . . . . . . . 32,528 1,519 SNC-Lavalin Group, Inc.† . . . . . . . . . 39,519 4,381 SSR Mining, Inc. . . . . . . . . . . . . . . . . 68,422 1,600 Stantec, Inc. . . . . . . . . . . . . . . . . . . . . 71,391 400 Stella-Jones, Inc. . . . . . . . . . . . . . . . . . 14,401 2,099 Sun Life Financial, Inc. . . . . . . . . . . . 108,207 7,810 Suncor Energy, Inc. . . . . . . . . . . . . . . . 187,059 3,579 Superior Plus Corp.† . . . . . . . . . . . . . 44,088 7,700 Tamarack Valley Energy, Ltd.* . . . . . . 15,964 2,442 TC Energy Corp.† . . . . . . . . . . . . . . . . 120,839 3,539 TC Energy Corp. . . . . . . . . . . . . . . . . . 175,251 2,972 Teck Resources, Ltd., Class B . . . . . . 68,450 1,944 TFI International, Inc. . . . . . . . . . . . . . 177,479 287 Thomson Reuters Corp. . . . . . . . . . . . 28,508 3,200 Timbercreek Financial Corp. . . . . . . . 24,627 698 TMX Group, Ltd. . . . . . . . . . . . . . . . . 73,730 226 Topicus.com, Inc.* . . . . . . . . . . . . . . . 16,418 2,171 Torex Gold Resources, Inc.* . . . . . . . . 25,010 1,339 Toromont Industries, Ltd. . . . . . . . . . . 116,660 11,275 Toronto-Dominion Bank (The) . . . . . . 790,141 5,111 Tourmaline Oil Corp. . . . . . . . . . . . . . 146,082 7,036 TransAlta Corp. . . . . . . . . . . . . . . . . . 70,099 2,812 TransAlta Renewables, Inc.† . . . . . . . 47,252 3,800 Transcontinental, Inc., Class A . . . . . . 71,365 12,242 Trican Well Service, Ltd.* . . . . . . . . . 26,368 3,001 Tricon Residential ,Inc. . . . . . . . . . . . . 34,523 1,570 Turquoise Hill Resources, Ltd.*,† . . . 26,483 1,000 Uni-Select, Inc.* . . . . . . . . . . . . . . . . . 13,238 2,344 Vermilion Energy, Inc.*,† . . . . . . . . . . 20,536 1,800 Wajax Corp. . . . . . . . . . . . . . . . . . . . . 34,937 272 Waste Connections, Inc.† . . . . . . . . . . 32,497 600 Waste Connections, Inc. . . . . . . . . . . . 71,658 2,070 West Fraser Timber Co., Ltd. . . . . . . . 148,604 12,500 Western Forest Products, Inc.† . . . . . . 21,277 1,523 Wheaton Precious Metals Corp. . . . . . 67,132 18,463 Whitecap Resources, Inc.† . . . . . . . . . 91,749 400 Winpak, Ltd.† . . . . . . . . . . . . . . . . . . . 12,478 752 WSP Global, Inc.† . . . . . . . . . . . . . . . 87,782 19,921 Yamana Gold, Inc. . . . . . . . . . . . . . . . . 83,888
17,207,130
Value Shares (Note 1)
Value Shares (Note 1)
The accompanying notes are an integral part of these financial statements.
6
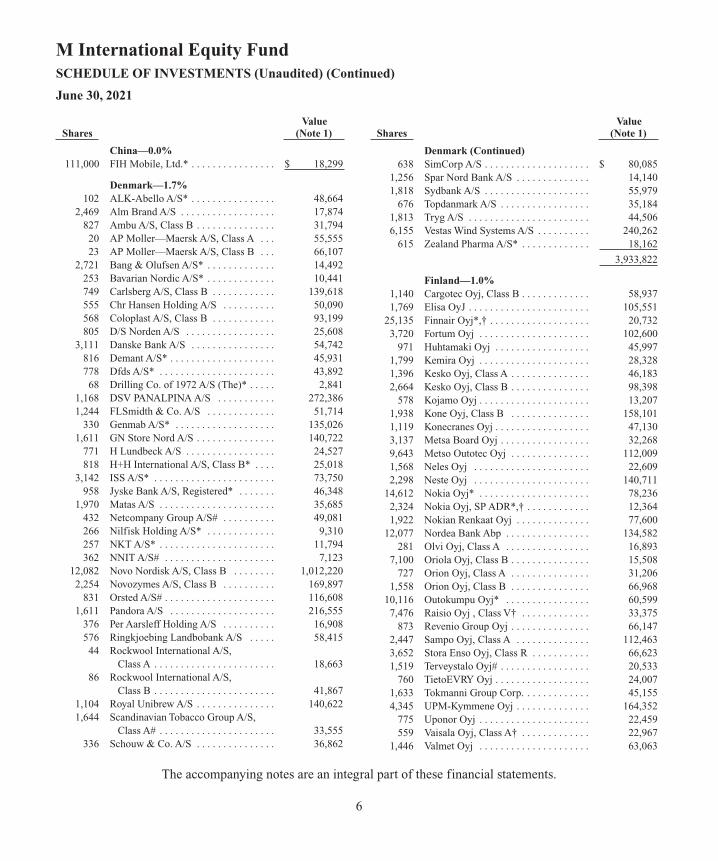
M International Equity FundSCHEDULE OF INVESTMENTS (Unaudited) (Continued)
June 30, 2021
China—0.0% 111,000 FIH Mobile, Ltd.* . . . . . . . . . . . . . . . . $ 18,299
Denmark—1.7% 102 ALK-Abello A/S* . . . . . . . . . . . . . . . . 48,664 2,469 Alm Brand A/S . . . . . . . . . . . . . . . . . . 17,874 827 Ambu A/S, Class B . . . . . . . . . . . . . . . 31,794 20 AP Moller—Maersk A/S, Class A . . . 55,555 23 AP Moller—Maersk A/S, Class B . . . 66,107 2,721 Bang & Olufsen A/S* . . . . . . . . . . . . . 14,492 253 Bavarian Nordic A/S* . . . . . . . . . . . . . 10,441 749 Carlsberg A/S, Class B . . . . . . . . . . . . 139,618 555 Chr Hansen Holding A/S . . . . . . . . . . 50,090 568 Coloplast A/S, Class B . . . . . . . . . . . . 93,199 805 D/S Norden A/S . . . . . . . . . . . . . . . . . 25,608 3,111 Danske Bank A/S . . . . . . . . . . . . . . . . 54,742 816 Demant A/S* . . . . . . . . . . . . . . . . . . . . 45,931 778 Dfds A/S* . . . . . . . . . . . . . . . . . . . . . . 43,892 68 Drilling Co. of 1972 A/S (The)* . . . . . 2,841 1,168 DSV PANALPINA A/S . . . . . . . . . . . 272,386 1,244 FLSmidth & Co. A/S . . . . . . . . . . . . . 51,714 330 Genmab A/S* . . . . . . . . . . . . . . . . . . . 135,026 1,611 GN Store Nord A/S . . . . . . . . . . . . . . . 140,722 771 H Lundbeck A/S . . . . . . . . . . . . . . . . . 24,527 818 H+H International A/S, Class B* . . . . 25,018 3,142 ISS A/S* . . . . . . . . . . . . . . . . . . . . . . . 73,750 958 Jyske Bank A/S, Registered* . . . . . . . 46,348 1,970 Matas A/S . . . . . . . . . . . . . . . . . . . . . . 35,685 432 Netcompany Group A/S# . . . . . . . . . . 49,081 266 Nilfisk Holding A/S* . . . . . . . . . . . . . 9,310 257 NKT A/S* . . . . . . . . . . . . . . . . . . . . . . 11,794 362 NNIT A/S# . . . . . . . . . . . . . . . . . . . . . 7,123 12,082 Novo Nordisk A/S, Class B . . . . . . . . 1,012,220 2,254 Novozymes A/S, Class B . . . . . . . . . . 169,897 831 Orsted A/S# . . . . . . . . . . . . . . . . . . . . . 116,608 1,611 Pandora A/S . . . . . . . . . . . . . . . . . . . . 216,555 376 Per Aarsleff Holding A/S . . . . . . . . . . 16,908 576 Ringkjoebing Landbobank A/S . . . . . 58,415 44 Rockwool International A/S,
Class A . . . . . . . . . . . . . . . . . . . . . . . 18,663 86 Rockwool International A/S,
Class B . . . . . . . . . . . . . . . . . . . . . . . 41,867 1,104 Royal Unibrew A/S . . . . . . . . . . . . . . . 140,622 1,644 Scandinavian Tobacco Group A/S,
Class A# . . . . . . . . . . . . . . . . . . . . . . 33,555 336 Schouw & Co. A/S . . . . . . . . . . . . . . . 36,862
Denmark (Continued) 638 SimCorp A/S . . . . . . . . . . . . . . . . . . . . $ 80,085 1,256 Spar Nord Bank A/S . . . . . . . . . . . . . . 14,140 1,818 Sydbank A/S . . . . . . . . . . . . . . . . . . . . 55,979 676 Topdanmark A/S . . . . . . . . . . . . . . . . . 35,184 1,813 Tryg A/S . . . . . . . . . . . . . . . . . . . . . . . 44,506 6,155 Vestas Wind Systems A/S . . . . . . . . . . 240,262 615 Zealand Pharma A/S* . . . . . . . . . . . . . 18,162
3,933,822
Finland—1.0% 1,140 Cargotec Oyj, Class B . . . . . . . . . . . . . 58,937 1,769 Elisa OyJ . . . . . . . . . . . . . . . . . . . . . . . 105,551 25,135 Finnair Oyj*,† . . . . . . . . . . . . . . . . . . . 20,732 3,720 Fortum Oyj . . . . . . . . . . . . . . . . . . . . . 102,600 971 Huhtamaki Oyj . . . . . . . . . . . . . . . . . . 45,997 1,799 Kemira Oyj . . . . . . . . . . . . . . . . . . . . . 28,328 1,396 Kesko Oyj, Class A . . . . . . . . . . . . . . . 46,183 2,664 Kesko Oyj, Class B . . . . . . . . . . . . . . . 98,398 578 Kojamo Oyj . . . . . . . . . . . . . . . . . . . . . 13,207 1,938 Kone Oyj, Class B . . . . . . . . . . . . . . . 158,101 1,119 Konecranes Oyj . . . . . . . . . . . . . . . . . . 47,130 3,137 Metsa Board Oyj . . . . . . . . . . . . . . . . . 32,268 9,643 Metso Outotec Oyj . . . . . . . . . . . . . . . 112,009 1,568 Neles Oyj . . . . . . . . . . . . . . . . . . . . . . 22,609 2,298 Neste Oyj . . . . . . . . . . . . . . . . . . . . . . 140,711 14,612 Nokia Oyj* . . . . . . . . . . . . . . . . . . . . . 78,236 2,324 Nokia Oyj, SP ADR*,† . . . . . . . . . . . . 12,364 1,922 Nokian Renkaat Oyj . . . . . . . . . . . . . . 77,600 12,077 Nordea Bank Abp . . . . . . . . . . . . . . . . 134,582 281 Olvi Oyj, Class A . . . . . . . . . . . . . . . . 16,893 7,100 Oriola Oyj, Class B . . . . . . . . . . . . . . . 15,508 727 Orion Oyj, Class A . . . . . . . . . . . . . . . 31,206 1,558 Orion Oyj, Class B . . . . . . . . . . . . . . . 66,968 10,116 Outokumpu Oyj* . . . . . . . . . . . . . . . . 60,599 7,476 Raisio Oyj , Class V† . . . . . . . . . . . . . 33,375 873 Revenio Group Oyj . . . . . . . . . . . . . . . 66,147 2,447 Sampo Oyj, Class A . . . . . . . . . . . . . . 112,463 3,652 Stora Enso Oyj, Class R . . . . . . . . . . . 66,623 1,519 Terveystalo Oyj# . . . . . . . . . . . . . . . . . 20,533 760 TietoEVRY Oyj . . . . . . . . . . . . . . . . . . 24,007 1,633 Tokmanni Group Corp. . . . . . . . . . . . . 45,155 4,345 UPM-Kymmene Oyj . . . . . . . . . . . . . . 164,352 775 Uponor Oyj . . . . . . . . . . . . . . . . . . . . . 22,459 559 Vaisala Oyj, Class A† . . . . . . . . . . . . . 22,967 1,446 Valmet Oyj . . . . . . . . . . . . . . . . . . . . . 63,063
Value Shares (Note 1)
Value Shares (Note 1)
The accompanying notes are an integral part of these financial statements.
7
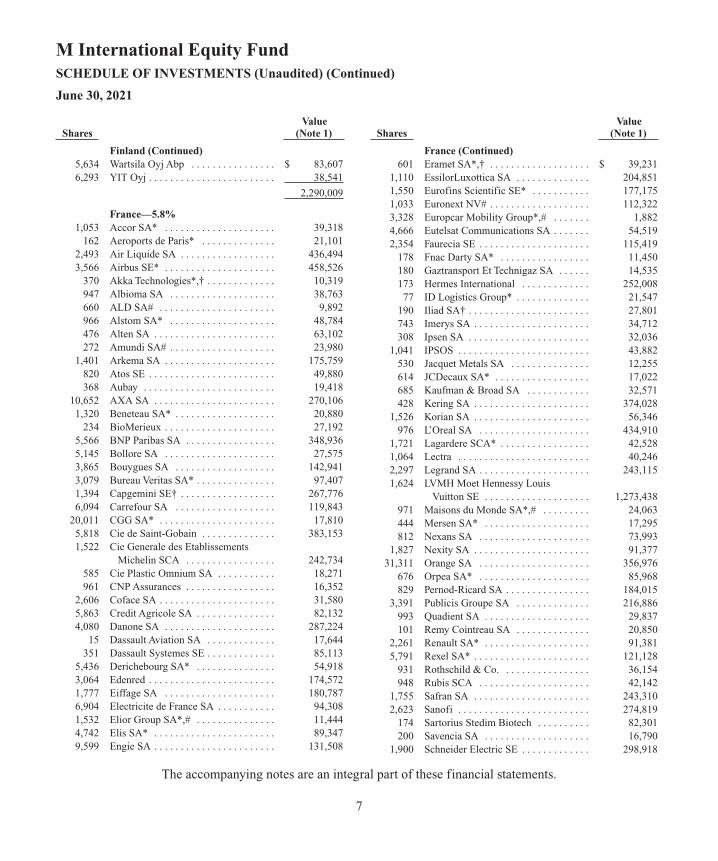
M International Equity FundSCHEDULE OF INVESTMENTS (Unaudited) (Continued)
June 30, 2021
Finland (Continued) 5,634 Wartsila Oyj Abp . . . . . . . . . . . . . . . . $ 83,607 6,293 YIT Oyj . . . . . . . . . . . . . . . . . . . . . . . . 38,541
2,290,009
France—5.8% 1,053 Accor SA* . . . . . . . . . . . . . . . . . . . . . 39,318 162 Aeroports de Paris* . . . . . . . . . . . . . . 21,101 2,493 Air Liquide SA . . . . . . . . . . . . . . . . . . 436,494 3,566 Airbus SE* . . . . . . . . . . . . . . . . . . . . . 458,526 370 Akka Technologies*,† . . . . . . . . . . . . . 10,319 947 Albioma SA . . . . . . . . . . . . . . . . . . . . 38,763 660 ALD SA# . . . . . . . . . . . . . . . . . . . . . . 9,892 966 Alstom SA* . . . . . . . . . . . . . . . . . . . . 48,784 476 Alten SA . . . . . . . . . . . . . . . . . . . . . . . 63,102 272 Amundi SA# . . . . . . . . . . . . . . . . . . . . 23,980 1,401 Arkema SA . . . . . . . . . . . . . . . . . . . . . 175,759 820 Atos SE . . . . . . . . . . . . . . . . . . . . . . . . 49,880 368 Aubay . . . . . . . . . . . . . . . . . . . . . . . . . 19,418 10,652 AXA SA . . . . . . . . . . . . . . . . . . . . . . . 270,106 1,320 Beneteau SA* . . . . . . . . . . . . . . . . . . . 20,880 234 BioMerieux . . . . . . . . . . . . . . . . . . . . . 27,192 5,566 BNP Paribas SA . . . . . . . . . . . . . . . . . 348,936 5,145 Bollore SA . . . . . . . . . . . . . . . . . . . . . 27,575 3,865 Bouygues SA . . . . . . . . . . . . . . . . . . . 142,941 3,079 Bureau Veritas SA* . . . . . . . . . . . . . . . 97,407 1,394 Capgemini SE† . . . . . . . . . . . . . . . . . . 267,776 6,094 Carrefour SA . . . . . . . . . . . . . . . . . . . 119,843 20,011 CGG SA* . . . . . . . . . . . . . . . . . . . . . . 17,810 5,818 Cie de Saint-Gobain . . . . . . . . . . . . . . 383,153 1,522 Cie Generale des Etablissements
Michelin SCA . . . . . . . . . . . . . . . . . 242,734 585 Cie Plastic Omnium SA . . . . . . . . . . . 18,271 961 CNP Assurances . . . . . . . . . . . . . . . . . 16,352 2,606 Coface SA . . . . . . . . . . . . . . . . . . . . . . 31,580 5,863 Credit Agricole SA . . . . . . . . . . . . . . . 82,132 4,080 Danone SA . . . . . . . . . . . . . . . . . . . . . 287,224 15 Dassault Aviation SA . . . . . . . . . . . . . 17,644 351 Dassault Systemes SE . . . . . . . . . . . . . 85,113 5,436 Derichebourg SA* . . . . . . . . . . . . . . . 54,918 3,064 Edenred . . . . . . . . . . . . . . . . . . . . . . . . 174,572 1,777 Eiffage SA . . . . . . . . . . . . . . . . . . . . . 180,787 6,904 Electricite de France SA . . . . . . . . . . . 94,308 1,532 Elior Group SA*,# . . . . . . . . . . . . . . . 11,444 4,742 Elis SA* . . . . . . . . . . . . . . . . . . . . . . . 89,347 9,599 Engie SA . . . . . . . . . . . . . . . . . . . . . . . 131,508
France (Continued) 601 Eramet SA*,† . . . . . . . . . . . . . . . . . . . $ 39,231 1,110 EssilorLuxottica SA . . . . . . . . . . . . . . 204,851 1,550 Eurofins Scientific SE* . . . . . . . . . . . 177,175 1,033 Euronext NV# . . . . . . . . . . . . . . . . . . . 112,322 3,328 Europcar Mobility Group*,# . . . . . . . 1,882 4,666 Eutelsat Communications SA . . . . . . . 54,519 2,354 Faurecia SE . . . . . . . . . . . . . . . . . . . . . 115,419 178 Fnac Darty SA* . . . . . . . . . . . . . . . . . 11,450 180 Gaztransport Et Technigaz SA . . . . . . 14,535 173 Hermes International . . . . . . . . . . . . . 252,008 77 ID Logistics Group* . . . . . . . . . . . . . . 21,547 190 Iliad SA† . . . . . . . . . . . . . . . . . . . . . . . 27,801 743 Imerys SA . . . . . . . . . . . . . . . . . . . . . . 34,712 308 Ipsen SA . . . . . . . . . . . . . . . . . . . . . . . 32,036 1,041 IPSOS . . . . . . . . . . . . . . . . . . . . . . . . . 43,882 530 Jacquet Metals SA . . . . . . . . . . . . . . . 12,255 614 JCDecaux SA* . . . . . . . . . . . . . . . . . . 17,022 685 Kaufman & Broad SA . . . . . . . . . . . . 32,571 428 Kering SA . . . . . . . . . . . . . . . . . . . . . . 374,028 1,526 Korian SA . . . . . . . . . . . . . . . . . . . . . . 56,346 976 L’Oreal SA . . . . . . . . . . . . . . . . . . . . . 434,910 1,721 Lagardere SCA* . . . . . . . . . . . . . . . . . 42,528 1,064 Lectra . . . . . . . . . . . . . . . . . . . . . . . . . 40,246 2,297 Legrand SA . . . . . . . . . . . . . . . . . . . . . 243,115 1,624 LVMH Moet Hennessy Louis
Vuitton SE . . . . . . . . . . . . . . . . . . . . 1,273,438 971 Maisons du Monde SA*,# . . . . . . . . . 24,063 444 Mersen SA* . . . . . . . . . . . . . . . . . . . . 17,295 812 Nexans SA . . . . . . . . . . . . . . . . . . . . . 73,993 1,827 Nexity SA . . . . . . . . . . . . . . . . . . . . . . 91,377 31,311 Orange SA . . . . . . . . . . . . . . . . . . . . . 356,976 676 Orpea SA* . . . . . . . . . . . . . . . . . . . . . 85,968 829 Pernod-Ricard SA . . . . . . . . . . . . . . . . 184,015 3,391 Publicis Groupe SA . . . . . . . . . . . . . . 216,886 993 Quadient SA . . . . . . . . . . . . . . . . . . . . 29,837 101 Remy Cointreau SA . . . . . . . . . . . . . . 20,850 2,261 Renault SA* . . . . . . . . . . . . . . . . . . . . 91,381 5,791 Rexel SA* . . . . . . . . . . . . . . . . . . . . . . 121,128 931 Rothschild & Co. . . . . . . . . . . . . . . . . 36,154 948 Rubis SCA . . . . . . . . . . . . . . . . . . . . . 42,142 1,755 Safran SA . . . . . . . . . . . . . . . . . . . . . . 243,310 2,623 Sanofi . . . . . . . . . . . . . . . . . . . . . . . . . 274,819 174 Sartorius Stedim Biotech . . . . . . . . . . 82,301 200 Savencia SA . . . . . . . . . . . . . . . . . . . . 16,790 1,900 Schneider Electric SE . . . . . . . . . . . . . 298,918
Value Shares (Note 1)
Value Shares (Note 1)
The accompanying notes are an integral part of these financial statements.
8
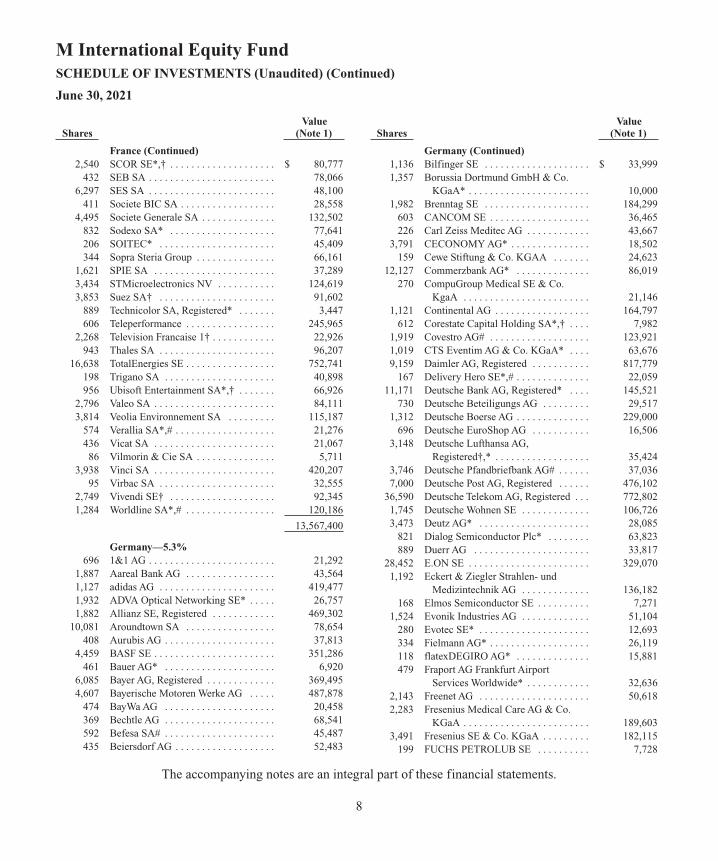
M International Equity FundSCHEDULE OF INVESTMENTS (Unaudited) (Continued)
June 30, 2021
France (Continued) 2,540 SCOR SE*,† . . . . . . . . . . . . . . . . . . . . $ 80,777 432 SEB SA . . . . . . . . . . . . . . . . . . . . . . . . 78,066 6,297 SES SA . . . . . . . . . . . . . . . . . . . . . . . . 48,100 411 Societe BIC SA . . . . . . . . . . . . . . . . . . 28,558 4,495 Societe Generale SA . . . . . . . . . . . . . . 132,502 832 Sodexo SA* . . . . . . . . . . . . . . . . . . . . 77,641 206 SOITEC* . . . . . . . . . . . . . . . . . . . . . . 45,409 344 Sopra Steria Group . . . . . . . . . . . . . . . 66,161 1,621 SPIE SA . . . . . . . . . . . . . . . . . . . . . . . 37,289 3,434 STMicroelectronics NV . . . . . . . . . . . 124,619 3,853 Suez SA† . . . . . . . . . . . . . . . . . . . . . . 91,602 889 Technicolor SA, Registered* . . . . . . . 3,447 606 Teleperformance . . . . . . . . . . . . . . . . . 245,965 2,268 Television Francaise 1† . . . . . . . . . . . . 22,926 943 Thales SA . . . . . . . . . . . . . . . . . . . . . . 96,207 16,638 TotalEnergies SE . . . . . . . . . . . . . . . . . 752,741 198 Trigano SA . . . . . . . . . . . . . . . . . . . . . 40,898 956 Ubisoft Entertainment SA*,† . . . . . . . 66,926 2,796 Valeo SA . . . . . . . . . . . . . . . . . . . . . . . 84,111 3,814 Veolia Environnement SA . . . . . . . . . 115,187 574 Verallia SA*,# . . . . . . . . . . . . . . . . . . . 21,276 436 Vicat SA . . . . . . . . . . . . . . . . . . . . . . . 21,067 86 Vilmorin & Cie SA . . . . . . . . . . . . . . . 5,711 3,938 Vinci SA . . . . . . . . . . . . . . . . . . . . . . . 420,207 95 Virbac SA . . . . . . . . . . . . . . . . . . . . . . 32,555 2,749 Vivendi SE† . . . . . . . . . . . . . . . . . . . . 92,345 1,284 Worldline SA*,# . . . . . . . . . . . . . . . . . 120,186
13,567,400
Germany—5.3% 696 1&1 AG . . . . . . . . . . . . . . . . . . . . . . . . 21,292 1,887 Aareal Bank AG . . . . . . . . . . . . . . . . . 43,564 1,127 adidas AG . . . . . . . . . . . . . . . . . . . . . . 419,477 1,932 ADVA Optical Networking SE* . . . . . 26,757 1,882 Allianz SE, Registered . . . . . . . . . . . . 469,302 10,081 Aroundtown SA . . . . . . . . . . . . . . . . . 78,654 408 Aurubis AG . . . . . . . . . . . . . . . . . . . . . 37,813 4,459 BASF SE . . . . . . . . . . . . . . . . . . . . . . . 351,286 461 Bauer AG* . . . . . . . . . . . . . . . . . . . . . 6,920 6,085 Bayer AG, Registered . . . . . . . . . . . . . 369,495 4,607 Bayerische Motoren Werke AG . . . . . 487,878 474 BayWa AG . . . . . . . . . . . . . . . . . . . . . 20,458 369 Bechtle AG . . . . . . . . . . . . . . . . . . . . . 68,541 592 Befesa SA# . . . . . . . . . . . . . . . . . . . . . 45,487 435 Beiersdorf AG . . . . . . . . . . . . . . . . . . . 52,483
Germany (Continued) 1,136 Bilfinger SE . . . . . . . . . . . . . . . . . . . . $ 33,999 1,357 Borussia Dortmund GmbH & Co.
KGaA* . . . . . . . . . . . . . . . . . . . . . . . 10,000 1,982 Brenntag SE . . . . . . . . . . . . . . . . . . . . 184,299 603 CANCOM SE . . . . . . . . . . . . . . . . . . . 36,465 226 Carl Zeiss Meditec AG . . . . . . . . . . . . 43,667 3,791 CECONOMY AG* . . . . . . . . . . . . . . . 18,502 159 Cewe Stiftung & Co. KGAA . . . . . . . 24,623 12,127 Commerzbank AG* . . . . . . . . . . . . . . 86,019 270 CompuGroup Medical SE & Co.
KgaA . . . . . . . . . . . . . . . . . . . . . . . . 21,146 1,121 Continental AG . . . . . . . . . . . . . . . . . . 164,797 612 Corestate Capital Holding SA*,† . . . . 7,982 1,919 Covestro AG# . . . . . . . . . . . . . . . . . . . 123,921 1,019 CTS Eventim AG & Co. KGaA* . . . . 63,676 9,159 Daimler AG, Registered . . . . . . . . . . . 817,779 167 Delivery Hero SE*,# . . . . . . . . . . . . . . 22,059 11,171 Deutsche Bank AG, Registered* . . . . 145,521 730 Deutsche Beteiligungs AG . . . . . . . . . 29,517 1,312 Deutsche Boerse AG . . . . . . . . . . . . . . 229,000 696 Deutsche EuroShop AG . . . . . . . . . . . 16,506 3,148 Deutsche Lufthansa AG,
Registered†,* . . . . . . . . . . . . . . . . . . 35,424 3,746 Deutsche Pfandbriefbank AG# . . . . . . 37,036 7,000 Deutsche Post AG, Registered . . . . . . 476,102 36,590 Deutsche Telekom AG, Registered . . . 772,802 1,745 Deutsche Wohnen SE . . . . . . . . . . . . . 106,726 3,473 Deutz AG* . . . . . . . . . . . . . . . . . . . . . 28,085 821 Dialog Semiconductor Plc* . . . . . . . . 63,823 889 Duerr AG . . . . . . . . . . . . . . . . . . . . . . 33,817 28,452 E.ON SE . . . . . . . . . . . . . . . . . . . . . . . 329,070 1,192 Eckert & Ziegler Strahlen- und
Medizintechnik AG . . . . . . . . . . . . . 136,182 168 Elmos Semiconductor SE . . . . . . . . . . 7,271 1,524 Evonik Industries AG . . . . . . . . . . . . . 51,104 280 Evotec SE* . . . . . . . . . . . . . . . . . . . . . 12,693 334 Fielmann AG* . . . . . . . . . . . . . . . . . . . 26,119 118 flatexDEGIRO AG* . . . . . . . . . . . . . . 15,881 479 Fraport AG Frankfurt Airport
Services Worldwide* . . . . . . . . . . . . 32,636 2,143 Freenet AG . . . . . . . . . . . . . . . . . . . . . 50,618 2,283 Fresenius Medical Care AG & Co.
KGaA . . . . . . . . . . . . . . . . . . . . . . . . 189,603 3,491 Fresenius SE & Co. KGaA . . . . . . . . . 182,115 199 FUCHS PETROLUB SE . . . . . . . . . . 7,728
Value Shares (Note 1)
Value Shares (Note 1)

The accompanying notes are an integral part of these financial statements.
9
M International Equity FundSCHEDULE OF INVESTMENTS (Unaudited) (Continued)
June 30, 2021
Germany (Continued) 2,497 GEA Group AG . . . . . . . . . . . . . . . . . $ 101,142 425 Gerresheimer AG . . . . . . . . . . . . . . . . 46,993 287 Gesco AG* . . . . . . . . . . . . . . . . . . . . . 6,976 1,489 Grand City Properties SA* . . . . . . . . . 40,220 336 Hannover Rueck SE . . . . . . . . . . . . . . 56,216 243 Hapag-Lloyd AG# . . . . . . . . . . . . . . . . 55,927 871 HeidelbergCement AG . . . . . . . . . . . . 74,712 6,593 Heidelberger Druckmaschinen AG* . . 15,674 524 Hella GmbH & Co. KGaA* . . . . . . . . 35,888 1,225 HelloFresh SE* . . . . . . . . . . . . . . . . . . 119,080 462 Henkel AG & Co. KGaA . . . . . . . . . . 42,538 160 HOCHTIEF AG . . . . . . . . . . . . . . . . . 12,286 461 Hornbach Holding AG & Co. KGaA . . 52,531 1,048 HUGO BOSS AG . . . . . . . . . . . . . . . . 57,014 38 Hypoport SE* . . . . . . . . . . . . . . . . . . . 19,646 721 Indus Holding AG . . . . . . . . . . . . . . . . 28,555 10,553 Infineon Technologies AG . . . . . . . . . 423,197 790 Instone Real Estate Group AG# . . . . . 23,793 788 Jenoptik AG . . . . . . . . . . . . . . . . . . . . 21,547 6,571 K+S AG, Registered* . . . . . . . . . . . . . 89,447 642 KION Group AG . . . . . . . . . . . . . . . . . 68,421 2,961 Kloeckner & Co. SE* . . . . . . . . . . . . . 40,517 165 Knorr-Bremse AG . . . . . . . . . . . . . . . . 18,978 434 Koenig & Bauer AG* . . . . . . . . . . . . . 14,486 326 Krones AG . . . . . . . . . . . . . . . . . . . . . 29,127 730 LANXESS AG . . . . . . . . . . . . . . . . . . 50,049 698 LEG Immobilien SE . . . . . . . . . . . . . . 100,519 685 Merck KGaA . . . . . . . . . . . . . . . . . . . 131,339 4,159 METRO AG . . . . . . . . . . . . . . . . . . . . 51,485 373 MTU Aero Engines AG . . . . . . . . . . . 92,393 675 Muenchener Rueckversicherungs-
Gesellschaft AG in Muenchen, Registered . . . . . . . . . . . . . . . . . . . . 184,848
772 Nemetschek SE . . . . . . . . . . . . . . . . . . 59,062 33 New Work SE . . . . . . . . . . . . . . . . . . . 10,369 188 Nexus AG . . . . . . . . . . . . . . . . . . . . . . 13,999 1,039 Norma Group SE . . . . . . . . . . . . . . . . 53,198 390 OHB SE . . . . . . . . . . . . . . . . . . . . . . . 17,087 471 PATRIZIA AG . . . . . . . . . . . . . . . . . . . 12,287 1,490 ProSiebenSat.1 Media SE . . . . . . . . . . 29,638 656 Puma SE . . . . . . . . . . . . . . . . . . . . . . . 78,213 1,192 QIAGEN NV* . . . . . . . . . . . . . . . . . . 57,611 51 Rational AG . . . . . . . . . . . . . . . . . . . . 46,202 824 Rheinmetall AG . . . . . . . . . . . . . . . . . 81,389 641 RTL Group SA* . . . . . . . . . . . . . . . . . 38,193
Germany (Continued) 3,858 RWE AG . . . . . . . . . . . . . . . . . . . . . . . $ 139,800 959 S&T AG . . . . . . . . . . . . . . . . . . . . . . . 21,947 1,686 SAF-Holland SE* . . . . . . . . . . . . . . . . 23,450 523 Salzgitter AG* . . . . . . . . . . . . . . . . . . . 15,541 4,060 SAP SE . . . . . . . . . . . . . . . . . . . . . . . . 572,113 826 Scout24 AG*,# . . . . . . . . . . . . . . . . . . 69,657 2,763 Siemens AG, Registered . . . . . . . . . . . 437,770 1,782 Siemens Energy AG* . . . . . . . . . . . . . 53,713 524 Siemens Healthineers AG# . . . . . . . . . 32,110 279 Siltronic AG . . . . . . . . . . . . . . . . . . . . 46,481 185 Sixt SE* . . . . . . . . . . . . . . . . . . . . . . . 24,920 435 Software AG . . . . . . . . . . . . . . . . . . . . 19,569 638 Stabilus SA . . . . . . . . . . . . . . . . . . . . . 51,859 286 STRATEC SE . . . . . . . . . . . . . . . . . . . 39,949 324 Stroeer SE & Co. KGaA . . . . . . . . . . . 25,952 1,626 Suedzucker AG . . . . . . . . . . . . . . . . . . 26,028 731 Symrise AG . . . . . . . . . . . . . . . . . . . . . 101,847 1,795 TAG Immobilien AG . . . . . . . . . . . . . 56,957 1,202 Takkt AG . . . . . . . . . . . . . . . . . . . . . . . 19,982 315 Talanx AG* . . . . . . . . . . . . . . . . . . . . . 12,879 685 TeamViewer AG*,# . . . . . . . . . . . . . . . 25,764 420 Technotrans SE . . . . . . . . . . . . . . . . . . 13,596 13,304 Telefonica Deutschland Holding AG . . 35,100 2,041 thyssenkrupp AG* . . . . . . . . . . . . . . . . 21,273 1,060 Uniper SE . . . . . . . . . . . . . . . . . . . . . . 39,039 2,405 United Internet AG, Registered . . . . . 98,328 542 Volkswagen AG . . . . . . . . . . . . . . . . . . 177,893 3,634 Vonovia SE . . . . . . . . . . . . . . . . . . . . . 234,928 257 Vossloh AG . . . . . . . . . . . . . . . . . . . . . 12,967 236 Wacker Chemie AG . . . . . . . . . . . . . . 36,393 904 Wacker Neuson SE . . . . . . . . . . . . . . . 25,983 209 Washtec AG . . . . . . . . . . . . . . . . . . . . 12,961 284 Zalando SE*,# . . . . . . . . . . . . . . . . . . 34,332 117 Zeal Network SE . . . . . . . . . . . . . . . . . 5,813 42 zooplus AG* . . . . . . . . . . . . . . . . . . . . 13,606
12,357,012
Hong Kong—2.0% 86,000 AIA Group, Ltd. . . . . . . . . . . . . . . . . . 1,068,866 2,500 ASM Pacific Technology, Ltd. . . . . . . 33,873 9,400 Bank of East Asia, Ltd. (The) . . . . . . . 17,458 2,700 BOC Aviation, Ltd.# . . . . . . . . . . . . . . 22,777 18,000 BOC Hong Kong Holdings, Ltd. . . . . 61,087 3,500 Budweiser Brewing Co. APAC, Ltd.# . . 11,044 10,000 Cafe de Coral Holdings, Ltd. . . . . . . . 20,556
Value Shares (Note 1)
Value Shares (Note 1)
The accompanying notes are an integral part of these financial statements.
10
M International Equity FundSCHEDULE OF INVESTMENTS (Unaudited) (Continued)
June 30, 2021
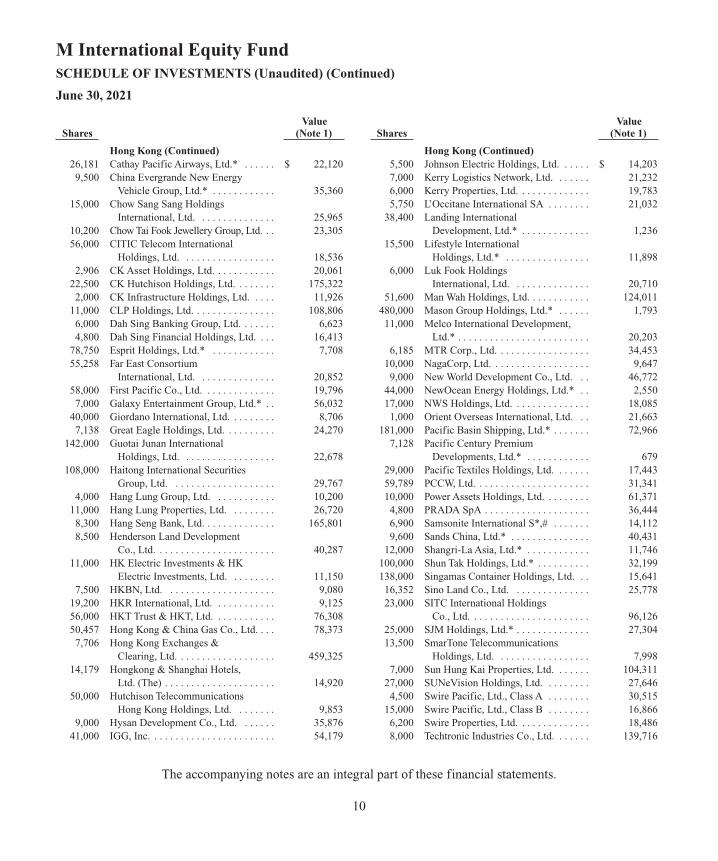
Hong Kong (Continued) 26,181 Cathay Pacific Airways, Ltd.* . . . . . . $ 22,120 9,500 China Evergrande New Energy
Vehicle Group, Ltd.* . . . . . . . . . . . . 35,360 15,000 Chow Sang Sang Holdings
International, Ltd. . . . . . . . . . . . . . . 25,965 10,200 Chow Tai Fook Jewellery Group, Ltd. . . 23,305 56,000 CITIC Telecom International
Holdings, Ltd. . . . . . . . . . . . . . . . . . 18,536 2,906 CK Asset Holdings, Ltd. . . . . . . . . . . . 20,061 22,500 CK Hutchison Holdings, Ltd. . . . . . . . 175,322 2,000 CK Infrastructure Holdings, Ltd. . . . . 11,926 11,000 CLP Holdings, Ltd. . . . . . . . . . . . . . . . 108,806 6,000 Dah Sing Banking Group, Ltd. . . . . . . 6,623 4,800 Dah Sing Financial Holdings, Ltd. . . . 16,413 78,750 Esprit Holdings, Ltd.* . . . . . . . . . . . . 7,708 55,258 Far East Consortium
International, Ltd. . . . . . . . . . . . . . . 20,852 58,000 First Pacific Co., Ltd. . . . . . . . . . . . . . 19,796 7,000 Galaxy Entertainment Group, Ltd.* . . 56,032 40,000 Giordano International, Ltd. . . . . . . . . 8,706 7,138 Great Eagle Holdings, Ltd. . . . . . . . . . 24,270 142,000 Guotai Junan International
Holdings, Ltd. . . . . . . . . . . . . . . . . . 22,678 108,000 Haitong International Securities
Group, Ltd. . . . . . . . . . . . . . . . . . . . 29,767 4,000 Hang Lung Group, Ltd. . . . . . . . . . . . 10,200 11,000 Hang Lung Properties, Ltd. . . . . . . . . 26,720 8,300 Hang Seng Bank, Ltd. . . . . . . . . . . . . . 165,801 8,500 Henderson Land Development
Co., Ltd. . . . . . . . . . . . . . . . . . . . . . . 40,287 11,000 HK Electric Investments & HK
Electric Investments, Ltd. . . . . . . . . 11,150 7,500 HKBN, Ltd. . . . . . . . . . . . . . . . . . . . . 9,080 19,200 HKR International, Ltd. . . . . . . . . . . . 9,125 56,000 HKT Trust & HKT, Ltd. . . . . . . . . . . . 76,308 50,457 Hong Kong & China Gas Co., Ltd. . . . 78,373 7,706 Hong Kong Exchanges &
Clearing, Ltd. . . . . . . . . . . . . . . . . . . 459,325 14,179 Hongkong & Shanghai Hotels,
Ltd. (The) . . . . . . . . . . . . . . . . . . . . . 14,920 50,000 Hutchison Telecommunications
Hong Kong Holdings, Ltd. . . . . . . . 9,853 9,000 Hysan Development Co., Ltd. . . . . . . 35,876 41,000 IGG, Inc. . . . . . . . . . . . . . . . . . . . . . . . 54,179
Hong Kong (Continued) 5,500 Johnson Electric Holdings, Ltd. . . . . . $ 14,203 7,000 Kerry Logistics Network, Ltd. . . . . . . 21,232 6,000 Kerry Properties, Ltd. . . . . . . . . . . . . . 19,783 5,750 L’Occitane International SA . . . . . . . . 21,032 38,400 Landing International
Development, Ltd.* . . . . . . . . . . . . . 1,236 15,500 Lifestyle International
Holdings, Ltd.* . . . . . . . . . . . . . . . . 11,898 6,000 Luk Fook Holdings
International, Ltd. . . . . . . . . . . . . . . 20,710 51,600 Man Wah Holdings, Ltd. . . . . . . . . . . . 124,011 480,000 Mason Group Holdings, Ltd.* . . . . . . 1,793 11,000 Melco International Development,
Ltd.* . . . . . . . . . . . . . . . . . . . . . . . . . 20,203 6,185 MTR Corp., Ltd. . . . . . . . . . . . . . . . . . 34,453 10,000 NagaCorp, Ltd. . . . . . . . . . . . . . . . . . . 9,647 9,000 New World Development Co., Ltd. . . 46,772 44,000 NewOcean Energy Holdings, Ltd.* . . 2,550 17,000 NWS Holdings, Ltd. . . . . . . . . . . . . . . 18,085 1,000 Orient Overseas International, Ltd. . . 21,663 181,000 Pacific Basin Shipping, Ltd.* . . . . . . . 72,966 7,128 Pacific Century Premium
Developments, Ltd.* . . . . . . . . . . . . 679 29,000 Pacific Textiles Holdings, Ltd. . . . . . . 17,443 59,789 PCCW, Ltd. . . . . . . . . . . . . . . . . . . . . . 31,341 10,000 Power Assets Holdings, Ltd. . . . . . . . . 61,371 4,800 PRADA SpA . . . . . . . . . . . . . . . . . . . . 36,444 6,900 Samsonite International S*,# . . . . . . . 14,112 9,600 Sands China, Ltd.* . . . . . . . . . . . . . . . 40,431 12,000 Shangri-La Asia, Ltd.* . . . . . . . . . . . . 11,746 100,000 Shun Tak Holdings, Ltd.* . . . . . . . . . . 32,199 138,000 Singamas Container Holdings, Ltd. . . 15,641 16,352 Sino Land Co., Ltd. . . . . . . . . . . . . . . 25,778 23,000 SITC International Holdings
Co., Ltd. . . . . . . . . . . . . . . . . . . . . . . 96,126 25,000 SJM Holdings, Ltd.* . . . . . . . . . . . . . . 27,304 13,500 SmarTone Telecommunications
Holdings, Ltd. . . . . . . . . . . . . . . . . . 7,998 7,000 Sun Hung Kai Properties, Ltd. . . . . . . 104,311 27,000 SUNeVision Holdings, Ltd. . . . . . . . . 27,646 4,500 Swire Pacific, Ltd., Class A . . . . . . . . 30,515 15,000 Swire Pacific, Ltd., Class B . . . . . . . . 16,866 6,200 Swire Properties, Ltd. . . . . . . . . . . . . . 18,486 8,000 Techtronic Industries Co., Ltd. . . . . . . 139,716
Value Shares (Note 1)
Value Shares (Note 1)
The accompanying notes are an integral part of these financial statements.
11
M International Equity FundSCHEDULE OF INVESTMENTS (Unaudited) (Continued)
June 30, 2021
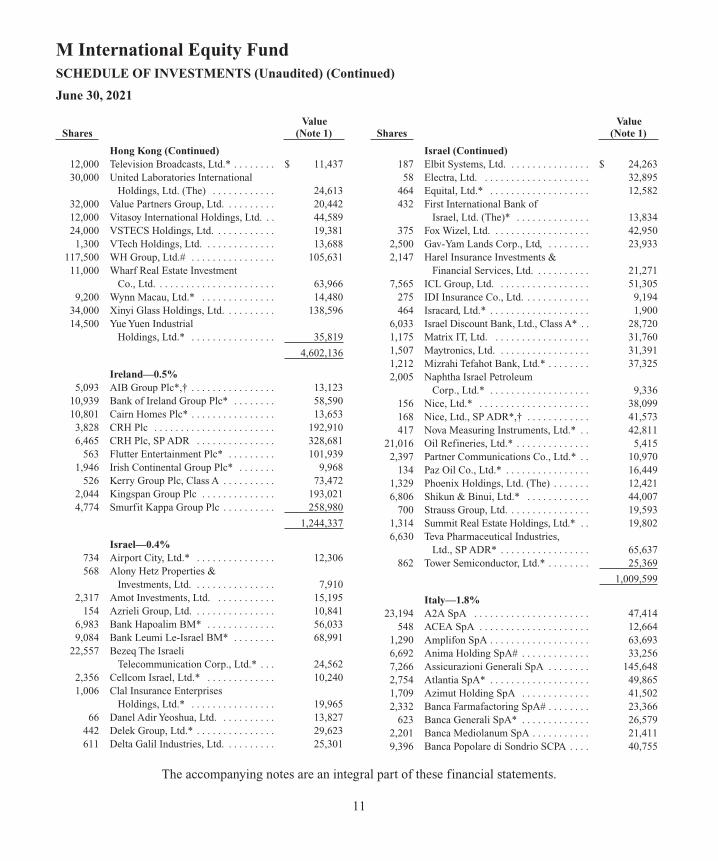
Hong Kong (Continued) 12,000 Television Broadcasts, Ltd.* . . . . . . . . $ 11,437 30,000 United Laboratories International
Holdings, Ltd. (The) . . . . . . . . . . . . 24,613 32,000 Value Partners Group, Ltd. . . . . . . . . . 20,442 12,000 Vitasoy International Holdings, Ltd. . . 44,589 24,000 VSTECS Holdings, Ltd. . . . . . . . . . . . 19,381 1,300 VTech Holdings, Ltd. . . . . . . . . . . . . . 13,688 117,500 WH Group, Ltd.# . . . . . . . . . . . . . . . . 105,631 11,000 Wharf Real Estate Investment
Co., Ltd. . . . . . . . . . . . . . . . . . . . . . . 63,966 9,200 Wynn Macau, Ltd.* . . . . . . . . . . . . . . 14,480 34,000 Xinyi Glass Holdings, Ltd. . . . . . . . . . 138,596 14,500 Yue Yuen Industrial
Holdings, Ltd.* . . . . . . . . . . . . . . . . 35,819
4,602,136
Ireland—0.5% 5,093 AIB Group Plc*,† . . . . . . . . . . . . . . . . 13,123 10,939 Bank of Ireland Group Plc* . . . . . . . . 58,590 10,801 Cairn Homes Plc* . . . . . . . . . . . . . . . . 13,653 3,828 CRH Plc . . . . . . . . . . . . . . . . . . . . . . . 192,910 6,465 CRH Plc, SP ADR . . . . . . . . . . . . . . . 328,681 563 Flutter Entertainment Plc* . . . . . . . . . 101,939 1,946 Irish Continental Group Plc* . . . . . . . 9,968 526 Kerry Group Plc, Class A . . . . . . . . . . 73,472 2,044 Kingspan Group Plc . . . . . . . . . . . . . . 193,021 4,774 Smurfit Kappa Group Plc . . . . . . . . . . 258,980
1,244,337
Israel—0.4% 734 Airport City, Ltd.* . . . . . . . . . . . . . . . 12,306 568 Alony Hetz Properties &
Investments, Ltd. . . . . . . . . . . . . . . . 7,910 2,317 Amot Investments, Ltd. . . . . . . . . . . . 15,195 154 Azrieli Group, Ltd. . . . . . . . . . . . . . . . 10,841 6,983 Bank Hapoalim BM* . . . . . . . . . . . . . 56,033 9,084 Bank Leumi Le-Israel BM* . . . . . . . . 68,991 22,557 Bezeq The Israeli
Telecommunication Corp., Ltd.* . . . 24,562 2,356 Cellcom Israel, Ltd.* . . . . . . . . . . . . . 10,240 1,006 Clal Insurance Enterprises
Holdings, Ltd.* . . . . . . . . . . . . . . . . 19,965 66 Danel Adir Yeoshua, Ltd. . . . . . . . . . . 13,827 442 Delek Group, Ltd.* . . . . . . . . . . . . . . . 29,623 611 Delta Galil Industries, Ltd. . . . . . . . . . 25,301
Israel (Continued) 187 Elbit Systems, Ltd. . . . . . . . . . . . . . . . $ 24,263 58 Electra, Ltd. . . . . . . . . . . . . . . . . . . . . 32,895 464 Equital, Ltd.* . . . . . . . . . . . . . . . . . . . 12,582 432 First International Bank of
Israel, Ltd. (The)* . . . . . . . . . . . . . . 13,834 375 Fox Wizel, Ltd. . . . . . . . . . . . . . . . . . . 42,950 2,500 Gav-Yam Lands Corp., Ltd, . . . . . . . . 23,933 2,147 Harel Insurance Investments &
Financial Services, Ltd. . . . . . . . . . . 21,271 7,565 ICL Group, Ltd. . . . . . . . . . . . . . . . . . 51,305 275 IDI Insurance Co., Ltd. . . . . . . . . . . . . 9,194 464 Isracard, Ltd.* . . . . . . . . . . . . . . . . . . . 1,900 6,033 Israel Discount Bank, Ltd., Class A* . . 28,720 1,175 Matrix IT, Ltd. . . . . . . . . . . . . . . . . . . 31,760 1,507 Maytronics, Ltd. . . . . . . . . . . . . . . . . . 31,391 1,212 Mizrahi Tefahot Bank, Ltd.* . . . . . . . . 37,325 2,005 Naphtha Israel Petroleum
Corp., Ltd.* . . . . . . . . . . . . . . . . . . . 9,336 156 Nice, Ltd.* . . . . . . . . . . . . . . . . . . . . . 38,099 168 Nice, Ltd., SP ADR*,† . . . . . . . . . . . . 41,573 417 Nova Measuring Instruments, Ltd.* . . 42,811 21,016 Oil Refineries, Ltd.* . . . . . . . . . . . . . . 5,415 2,397 Partner Communications Co., Ltd.* . . 10,970 134 Paz Oil Co., Ltd.* . . . . . . . . . . . . . . . . 16,449 1,329 Phoenix Holdings, Ltd. (The) . . . . . . . 12,421 6,806 Shikun & Binui, Ltd.* . . . . . . . . . . . . 44,007 700 Strauss Group, Ltd. . . . . . . . . . . . . . . . 19,593 1,314 Summit Real Estate Holdings, Ltd.* . . 19,802 6,630 Teva Pharmaceutical Industries,
Ltd., SP ADR* . . . . . . . . . . . . . . . . . 65,637 862 Tower Semiconductor, Ltd.* . . . . . . . . 25,369
1,009,599
Italy—1.8% 23,194 A2A SpA . . . . . . . . . . . . . . . . . . . . . . 47,414 548 ACEA SpA . . . . . . . . . . . . . . . . . . . . . 12,664 1,290 Amplifon SpA . . . . . . . . . . . . . . . . . . . 63,693 6,692 Anima Holding SpA# . . . . . . . . . . . . . 33,256 7,266 Assicurazioni Generali SpA . . . . . . . . 145,648 2,754 Atlantia SpA* . . . . . . . . . . . . . . . . . . . 49,865 1,709 Azimut Holding SpA . . . . . . . . . . . . . 41,502 2,332 Banca Farmafactoring SpA# . . . . . . . . 23,366 623 Banca Generali SpA* . . . . . . . . . . . . . 26,579 2,201 Banca Mediolanum SpA . . . . . . . . . . . 21,411 9,396 Banca Popolare di Sondrio SCPA . . . . 40,755
Value Shares (Note 1)
Value Shares (Note 1)

The accompanying notes are an integral part of these financial statements.
12
M International Equity FundSCHEDULE OF INVESTMENTS (Unaudited) (Continued)
June 30, 2021
Italy (Continued) 30,073 Banco BPM SpA . . . . . . . . . . . . . . . . $ 96,743 26,017 BPER Banca . . . . . . . . . . . . . . . . . . . . 56,625 732 Brunello Cucinelli SpA†,* . . . . . . . . . 42,808 1,230 Buzzi Unicem SpA . . . . . . . . . . . . . . . 32,626 3,016 Cairo Communication SpA† . . . . . . . 6,072 1,300 Carel Industries SpA# . . . . . . . . . . . . . 31,215 4,487 Cerved Group SpA* . . . . . . . . . . . . . . 52,140 27,159 CIR SpA-Compagnie Industriali* . . . 16,295 12,944 CNH Industrial NV . . . . . . . . . . . . . . . 213,726 3,914 Credito Emiliano SpA . . . . . . . . . . . . 23,437 253 DiaSorin SpA . . . . . . . . . . . . . . . . . . . 47,849 44,294 Enel SpA . . . . . . . . . . . . . . . . . . . . . . . 411,349 15,027 Eni SpA . . . . . . . . . . . . . . . . . . . . . . . . 182,994 806 ERG SpA . . . . . . . . . . . . . . . . . . . . . . 23,893 741 Ferrari NV . . . . . . . . . . . . . . . . . . . . . . 152,883 18,781 Fincantieri SpA* . . . . . . . . . . . . . . . . . 16,925 4,947 FinecoBank Banca Fineco SpA* . . . . 86,229 725 Gruppo MutuiOnline SpA . . . . . . . . . 34,559 12,089 Hera SpA . . . . . . . . . . . . . . . . . . . . . . 49,942 1,991 Infrastrutture Wireless Italiane SpA# . . 22,456 1,134 Interpump Group SpA . . . . . . . . . . . . 67,151 88,627 Intesa Sanpaolo SpA . . . . . . . . . . . . . . 244,806 9,018 Iren SpA . . . . . . . . . . . . . . . . . . . . . . . 25,728 7,345 Italgas SpA . . . . . . . . . . . . . . . . . . . . . 48,006 2,260 Leonardo SpA* . . . . . . . . . . . . . . . . . . 18,255 7,518 Mediobanca Banca di Credito
Finanziario SpA* . . . . . . . . . . . . . . . 87,807 1,242 Moncler SpA . . . . . . . . . . . . . . . . . . . . 84,032 7,618 OVS SpA*,#,† . . . . . . . . . . . . . . . . . . 14,417 1,752 Pirelli & C SpA# . . . . . . . . . . . . . . . . . 10,171 3,814 Poste Italiane SpA# . . . . . . . . . . . . . . . 50,425 1,079 Prysmian SpA . . . . . . . . . . . . . . . . . . . 38,677 442 Recordati Industria Chimica
e Farmaceutica SpA . . . . . . . . . . . . . 25,262 5,199 Saipem SpA*,† . . . . . . . . . . . . . . . . . . 12,582 10,551 Saras SpA*,† . . . . . . . . . . . . . . . . . . . 8,820 9,270 Snam SpA . . . . . . . . . . . . . . . . . . . . . . 53,586 5,594 Societa Cattolica di
Assicurazioni SC* . . . . . . . . . . . . . . 46,465 39,061 Stellantis NV . . . . . . . . . . . . . . . . . . . . 766,725 3,313 Tamburi Investment Partners SpA . . . 32,488 2,650 Technogym SpA# . . . . . . . . . . . . . . . . 33,810 151,273 Telecom Italia SpA . . . . . . . . . . . . . . . 75,139 29,205 Telecom Italia SpA . . . . . . . . . . . . . . . 15,473 1,807 Tenaris SA . . . . . . . . . . . . . . . . . . . . . . 19,695
Italy (Continued) 9,476 Terna SpA . . . . . . . . . . . . . . . . . . . . . . $ 70,608 7,682 UniCredit SpA . . . . . . . . . . . . . . . . . . 90,634 7,073 Unipol Gruppo SpA . . . . . . . . . . . . . . 38,512 9,399 UnipolSai Assicurazioni SpA . . . . . . . 27,283
4,113,476
Japan—14.6% 1,200 77 Bank, Ltd. (The) . . . . . . . . . . . . . . 13,156 4,900 Acom Co., Ltd. . . . . . . . . . . . . . . . . . . 21,347 1,200 Adastria Co., Ltd. . . . . . . . . . . . . . . . . 21,927 1,500 ADEKA Corp. . . . . . . . . . . . . . . . . . . 28,152 1,500 Advantest Corp. . . . . . . . . . . . . . . . . . 135,155 4,700 Aeon Co., Ltd. . . . . . . . . . . . . . . . . . . 126,284 1,400 AEON Financial Service Co., Ltd. . . . 16,496 2,100 Aeon Mall Co., Ltd. . . . . . . . . . . . . . . 32,343 2,100 AGC, Inc.† . . . . . . . . . . . . . . . . . . . . . 88,087 700 Aica Kogyo Co., Ltd. . . . . . . . . . . . . . 24,605 2,900 Aida Engineering, Ltd. . . . . . . . . . . . . 25,817 8,600 Aiful Corp. . . . . . . . . . . . . . . . . . . . . . 29,648 300 Ain Holdings, Inc. . . . . . . . . . . . . . . . 18,714 2,300 Air Water, Inc. . . . . . . . . . . . . . . . . . . . 35,361 1,600 Aisin Seiki Co., Ltd. . . . . . . . . . . . . . . 68,410 2,900 Ajinomoto Co., Inc. . . . . . . . . . . . . . . 75,283 1,200 Alconix Corp.† . . . . . . . . . . . . . . . . . . 15,824 1,400 Alfresa Holdings Corp. . . . . . . . . . . . . 20,906 2,600 Alps Alpine Co., Ltd. . . . . . . . . . . . . . 27,452 2,700 Amada Co., Ltd. . . . . . . . . . . . . . . . . . 27,293 1,000 Amano Corp. . . . . . . . . . . . . . . . . . . . 25,213 700 ANA Holdings, Inc.* . . . . . . . . . . . . . 16,458 1,500 Anritsu Corp.† . . . . . . . . . . . . . . . . . . 27,963 1,100 AOKI Holdings, Inc.† . . . . . . . . . . . . . 6,594 900 Aoyama Trading Co., Ltd.* . . . . . . . . 6,262 700 Aozora Bank, Ltd. . . . . . . . . . . . . . . . 15,658 500 Arata Corp. . . . . . . . . . . . . . . . . . . . . . 19,398 1,000 Arcs Co., Ltd. . . . . . . . . . . . . . . . . . . . 21,747 1,400 Arisawa Manufacturing Co., Ltd. . . . . 11,291 1,800 Asahi Diamond Industrial Co., Ltd. . . 8,344 3,400 Asahi Group Holdings, Ltd.† . . . . . . . 158,868 2,000 Asahi Holdings, Inc. . . . . . . . . . . . . . . 40,794 1,600 Asahi Intecc Co., Ltd. . . . . . . . . . . . . . 38,252 15,000 Asahi Kasei Corp. . . . . . . . . . . . . . . . . 164,791 1,400 ASKUL Corp. . . . . . . . . . . . . . . . . . . . 21,826 10,900 Astellas Pharma, Inc. . . . . . . . . . . . . . 189,802 1,600 Avex, Inc. . . . . . . . . . . . . . . . . . . . . . . 23,634 800 Awa Bank, Ltd. (The) . . . . . . . . . . . . . 14,474
Value Shares (Note 1)
Value Shares (Note 1)
The accompanying notes are an integral part of these financial statements.
13
M International Equity FundSCHEDULE OF INVESTMENTS (Unaudited) (Continued)
June 30, 2021
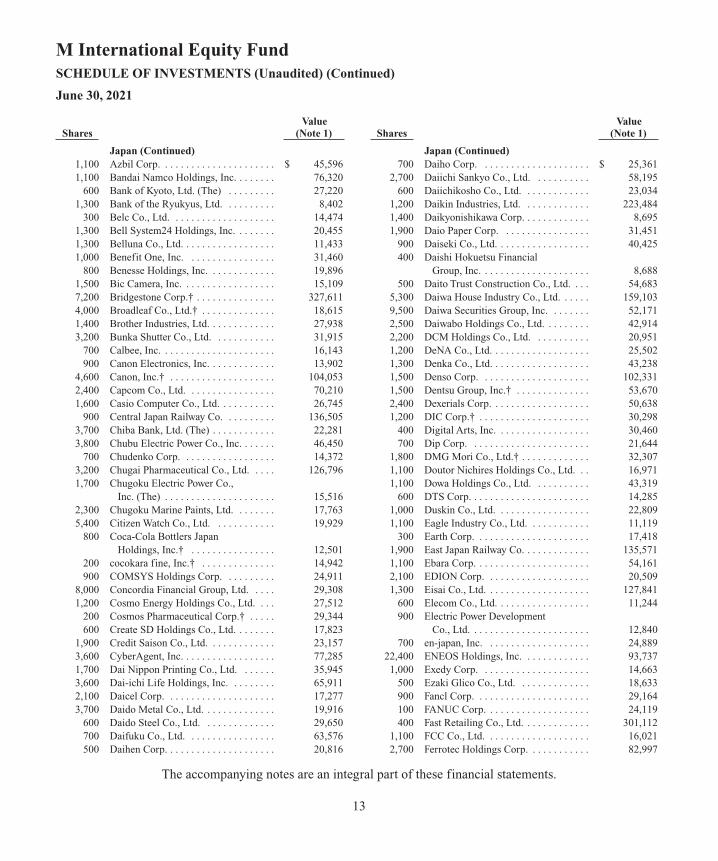
Japan (Continued) 1,100 Azbil Corp. . . . . . . . . . . . . . . . . . . . . . $ 45,596 1,100 Bandai Namco Holdings, Inc. . . . . . . . 76,320 600 Bank of Kyoto, Ltd. (The) . . . . . . . . . 27,220 1,300 Bank of the Ryukyus, Ltd. . . . . . . . . . 8,402 300 Belc Co., Ltd. . . . . . . . . . . . . . . . . . . . 14,474 1,300 Bell System24 Holdings, Inc. . . . . . . . 20,455 1,300 Belluna Co., Ltd. . . . . . . . . . . . . . . . . . 11,433 1,000 Benefit One, Inc. . . . . . . . . . . . . . . . . 31,460 800 Benesse Holdings, Inc. . . . . . . . . . . . . 19,896 1,500 Bic Camera, Inc. . . . . . . . . . . . . . . . . . 15,109 7,200 Bridgestone Corp.† . . . . . . . . . . . . . . . 327,611 4,000 Broadleaf Co., Ltd.† . . . . . . . . . . . . . . 18,615 1,400 Brother Industries, Ltd. . . . . . . . . . . . . 27,938 3,200 Bunka Shutter Co., Ltd. . . . . . . . . . . . 31,915 700 Calbee, Inc. . . . . . . . . . . . . . . . . . . . . . 16,143 900 Canon Electronics, Inc. . . . . . . . . . . . . 13,902 4,600 Canon, Inc.† . . . . . . . . . . . . . . . . . . . . 104,053 2,400 Capcom Co., Ltd. . . . . . . . . . . . . . . . . 70,210 1,600 Casio Computer Co., Ltd. . . . . . . . . . . 26,745 900 Central Japan Railway Co. . . . . . . . . . 136,505 3,700 Chiba Bank, Ltd. (The) . . . . . . . . . . . . 22,281 3,800 Chubu Electric Power Co., Inc. . . . . . . 46,450 700 Chudenko Corp. . . . . . . . . . . . . . . . . . 14,372 3,200 Chugai Pharmaceutical Co., Ltd. . . . . 126,796 1,700 Chugoku Electric Power Co.,
Inc. (The) . . . . . . . . . . . . . . . . . . . . . 15,516 2,300 Chugoku Marine Paints, Ltd. . . . . . . . 17,763 5,400 Citizen Watch Co., Ltd. . . . . . . . . . . . 19,929 800 Coca-Cola Bottlers Japan
Holdings, Inc.† . . . . . . . . . . . . . . . . 12,501 200 cocokara fine, Inc.† . . . . . . . . . . . . . . 14,942 900 COMSYS Holdings Corp. . . . . . . . . . 24,911 8,000 Concordia Financial Group, Ltd. . . . . 29,308 1,200 Cosmo Energy Holdings Co., Ltd. . . . 27,512 200 Cosmos Pharmaceutical Corp.† . . . . . 29,344 600 Create SD Holdings Co., Ltd. . . . . . . . 17,823 1,900 Credit Saison Co., Ltd. . . . . . . . . . . . . 23,157 3,600 CyberAgent, Inc. . . . . . . . . . . . . . . . . . 77,285 1,700 Dai Nippon Printing Co., Ltd. . . . . . . 35,945 3,600 Dai-ichi Life Holdings, Inc. . . . . . . . . 65,911 2,100 Daicel Corp. . . . . . . . . . . . . . . . . . . . . 17,277 3,700 Daido Metal Co., Ltd. . . . . . . . . . . . . . 19,916 600 Daido Steel Co., Ltd. . . . . . . . . . . . . . 29,650 700 Daifuku Co., Ltd. . . . . . . . . . . . . . . . . 63,576 500 Daihen Corp. . . . . . . . . . . . . . . . . . . . . 20,816
Japan (Continued) 700 Daiho Corp. . . . . . . . . . . . . . . . . . . . . $ 25,361 2,700 Daiichi Sankyo Co., Ltd. . . . . . . . . . . 58,195 600 Daiichikosho Co., Ltd. . . . . . . . . . . . . 23,034 1,200 Daikin Industries, Ltd. . . . . . . . . . . . . 223,484 1,400 Daikyonishikawa Corp. . . . . . . . . . . . . 8,695 1,900 Daio Paper Corp. . . . . . . . . . . . . . . . . 31,451 900 Daiseki Co., Ltd. . . . . . . . . . . . . . . . . . 40,425 400 Daishi Hokuetsu Financial
Group, Inc. . . . . . . . . . . . . . . . . . . . . 8,688 500 Daito Trust Construction Co., Ltd. . . . 54,683 5,300 Daiwa House Industry Co., Ltd. . . . . . 159,103 9,500 Daiwa Securities Group, Inc. . . . . . . . 52,171 2,500 Daiwabo Holdings Co., Ltd. . . . . . . . . 42,914 2,200 DCM Holdings Co., Ltd. . . . . . . . . . . 20,951 1,200 DeNA Co., Ltd. . . . . . . . . . . . . . . . . . . 25,502 1,300 Denka Co., Ltd. . . . . . . . . . . . . . . . . . . 43,238 1,500 Denso Corp. . . . . . . . . . . . . . . . . . . . . 102,331 1,500 Dentsu Group, Inc.† . . . . . . . . . . . . . . 53,670 2,400 Dexerials Corp. . . . . . . . . . . . . . . . . . . 50,638 1,200 DIC Corp.† . . . . . . . . . . . . . . . . . . . . . 30,298 400 Digital Arts, Inc. . . . . . . . . . . . . . . . . . 30,460 700 Dip Corp. . . . . . . . . . . . . . . . . . . . . . . 21,644 1,800 DMG Mori Co., Ltd.† . . . . . . . . . . . . . 32,307 1,100 Doutor Nichires Holdings Co., Ltd. . . 16,971 1,100 Dowa Holdings Co., Ltd. . . . . . . . . . . 43,319 600 DTS Corp. . . . . . . . . . . . . . . . . . . . . . . 14,285 1,000 Duskin Co., Ltd. . . . . . . . . . . . . . . . . . 22,809 1,100 Eagle Industry Co., Ltd. . . . . . . . . . . . 11,119 300 Earth Corp. . . . . . . . . . . . . . . . . . . . . . 17,418 1,900 East Japan Railway Co. . . . . . . . . . . . . 135,571 1,100 Ebara Corp. . . . . . . . . . . . . . . . . . . . . . 54,161 2,100 EDION Corp. . . . . . . . . . . . . . . . . . . . 20,509 1,300 Eisai Co., Ltd. . . . . . . . . . . . . . . . . . . . 127,841 600 Elecom Co., Ltd. . . . . . . . . . . . . . . . . . 11,244 900 Electric Power Development
Co., Ltd. . . . . . . . . . . . . . . . . . . . . . . 12,840 700 en-japan, Inc. . . . . . . . . . . . . . . . . . . . 24,889 22,400 ENEOS Holdings, Inc. . . . . . . . . . . . . 93,737 1,000 Exedy Corp. . . . . . . . . . . . . . . . . . . . . 14,663 500 Ezaki Glico Co., Ltd. . . . . . . . . . . . . . 18,633 900 Fancl Corp. . . . . . . . . . . . . . . . . . . . . . 29,164 100 FANUC Corp. . . . . . . . . . . . . . . . . . . . 24,119 400 Fast Retailing Co., Ltd. . . . . . . . . . . . . 301,112 1,100 FCC Co., Ltd. . . . . . . . . . . . . . . . . . . . 16,021 2,700 Ferrotec Holdings Corp. . . . . . . . . . . . 82,997
Value Shares (Note 1)
Value Shares (Note 1)

The accompanying notes are an integral part of these financial statements.
14
M International Equity FundSCHEDULE OF INVESTMENTS (Unaudited) (Continued)
June 30, 2021
Japan (Continued) 1,600 Food & Life Cos., Ltd. . . . . . . . . . . . . $ 69,058 900 Foster Electric Co., Ltd. . . . . . . . . . . . 7,907 800 FP Corp. . . . . . . . . . . . . . . . . . . . . . . . 29,704 1,100 Fudo Tetra Corp. . . . . . . . . . . . . . . . . . 17,496 1,600 Fuji Corp. . . . . . . . . . . . . . . . . . . . . . . 36,610 1,400 Fuji Electric Co., Ltd. . . . . . . . . . . . . . 65,403 700 Fuji Oil Holdings, Inc. . . . . . . . . . . . . 16,653 700 Fuji Seal International, Inc. . . . . . . . . 14,675 500 Fuji Soft, Inc. . . . . . . . . . . . . . . . . . . . 25,069 900 FUJIFILM Holdings Corp. . . . . . . . . . 66,746 7,900 Fujikura, Ltd.* . . . . . . . . . . . . . . . . . . 36,693 600 Fujitsu General, Ltd. . . . . . . . . . . . . . . 15,916 2,000 Fujitsu, Ltd. . . . . . . . . . . . . . . . . . . . . . 374,454 1,000 Fukuoka Financial Group, Inc. . . . . . . 17,454 600 Fukuyama Transporting Co., Ltd. . . . . 22,278 900 Furukawa Co., Ltd. . . . . . . . . . . . . . . . 10,126 1,200 Furukawa Electric Co., Ltd. . . . . . . . . 29,888 1,200 Furuno Electric Co., Ltd. . . . . . . . . . . 10,845 800 Futaba Corp. . . . . . . . . . . . . . . . . . . . . 5,595 500 Fuyo General Lease Co., Ltd. . . . . . . . 31,595 800 Geo Holdings Corp. . . . . . . . . . . . . . . 8,857 1,000 Glory, Ltd. . . . . . . . . . . . . . . . . . . . . . . 20,730 900 GMO internet, Inc. . . . . . . . . . . . . . . . 24,547 700 Goldcrest Co., Ltd. . . . . . . . . . . . . . . . 10,472 400 Goldwin, Inc. . . . . . . . . . . . . . . . . . . . 23,511 3,100 Gree, Inc. . . . . . . . . . . . . . . . . . . . . . . 16,408 1,000 GS Yuasa Corp. . . . . . . . . . . . . . . . . . . 25,519 1,100 GungHo Online Entertainment, Inc. . . 21,892 4,900 Gunma Bank, Ltd. (The) . . . . . . . . . . . 15,437 600 Gunze, Ltd. . . . . . . . . . . . . . . . . . . . . . 24,979 900 H.U. Group Holdings, Inc. . . . . . . . . . 23,202 1,700 H2O Retailing Corp. . . . . . . . . . . . . . . 13,787 5,000 Hachijuni Bank, Ltd. (The) . . . . . . . . . 16,112 2,400 Hakuhodo DY Holdings, Inc.† . . . . . . 37,244 500 Hamamatsu Photonics KK . . . . . . . . . 30,154 2,200 Hankyu Hanshin Holdings, Inc. . . . . . 67,825 800 Hanwa Co., Ltd. . . . . . . . . . . . . . . . . . 23,115 5,200 Haseko Corp. . . . . . . . . . . . . . . . . . . . 71,240 3,500 Hazama Ando Corp. . . . . . . . . . . . . . . 25,771 1,200 Heiwa Corp. . . . . . . . . . . . . . . . . . . . . 21,247 600 Heiwa Real Estate Co., Ltd. . . . . . . . . 22,629 900 Heiwado Co., Ltd.† . . . . . . . . . . . . . . . 17,968 200 Hikari Tsushin, Inc.† . . . . . . . . . . . . . 35,123 2,600 Hino Motors, Ltd. . . . . . . . . . . . . . . . . 22,865 3,100 Hirogin Holdings, Inc. . . . . . . . . . . . . 16,324
Japan (Continued) 400 Hisamitsu Pharmaceutical Co., Inc. . . $ 19,695 1,900 Hitachi Construction Machinery
Co., Ltd. . . . . . . . . . . . . . . . . . . . . . . 58,063 2,000 Hitachi Metals, Ltd. . . . . . . . . . . . . . . 38,238 600 Hitachi Transport System, Ltd. . . . . . . 24,871 6,400 Hitachi Zosen Corp. . . . . . . . . . . . . . . 41,305 9,500 Hitachi, Ltd. . . . . . . . . . . . . . . . . . . . . 543,944 400 Hogy Medical Co., Ltd. . . . . . . . . . . . 12,296 2,900 Hokkaido Electric Power Co., Inc.† . . 13,130 700 Hokkoku Bank, Ltd. (The) . . . . . . . . . 13,944 3,000 Hokuetsu Corp. . . . . . . . . . . . . . . . . . . 15,581 1,800 Hokuhoku Financial Group, Inc. . . . . 13,140 2,300 Hokuriku Electric Power Co. . . . . . . . 12,546 1,200 Hokuto Corp. . . . . . . . . . . . . . . . . . . . 20,728 7,300 Honda Motor Co., Ltd. . . . . . . . . . . . . 233,269 500 Horiba, Ltd.† . . . . . . . . . . . . . . . . . . . . 32,405 3,100 Hosiden Corp. . . . . . . . . . . . . . . . . . . . 27,765 600 House Foods Group, Inc. . . . . . . . . . . 18,336 2,400 Hoya Corp. . . . . . . . . . . . . . . . . . . . . . 318,214 2,300 Hulic Co., Ltd.† . . . . . . . . . . . . . . . . . 25,879 3,000 Hyakugo Bank, Ltd. (The) . . . . . . . . . 8,263 1,100 Ibiden Co., Ltd. . . . . . . . . . . . . . . . . . . 59,310 6,700 Ichigo, Inc. . . . . . . . . . . . . . . . . . . . . . 21,229 600 Idec Corp. . . . . . . . . . . . . . . . . . . . . . . 11,347 1,200 Idemitsu Kosan Co., Ltd. . . . . . . . . . . 28,981 3,000 IDOM, Inc. . . . . . . . . . . . . . . . . . . . . . 17,661 2,200 IHI Corp. . . . . . . . . . . . . . . . . . . . . . . . 52,200 1,100 Iida Group Holdings Co., Ltd. . . . . . . 28,318 900 Inabata & Co., Ltd. . . . . . . . . . . . . . . . 13,861 4,200 Infomart Corp.† . . . . . . . . . . . . . . . . . 34,441 10,600 Inpex Corp.† . . . . . . . . . . . . . . . . . . . . 79,098 300 Iriso Electronics Co., Ltd. . . . . . . . . . . 14,474 1,900 Isetan Mitsukoshi Holdings, Ltd. . . . . 13,237 1,600 Ishihara Sangyo Kaisha, Ltd. . . . . . . . 16,116 1,500 Isuzu Motors, Ltd. . . . . . . . . . . . . . . . 19,807 500 Ito En, Ltd. . . . . . . . . . . . . . . . . . . . . . 29,659 2,900 ITOCHU Corp. . . . . . . . . . . . . . . . . . . 83,532 700 Itochu Techno-Solutions Corp. . . . . . . 21,675 3,400 Itoham Yonekyu Holdings, Inc. . . . . . . 21,882 700 Iwatani Corp. . . . . . . . . . . . . . . . . . . . 41,964 4,100 Iyo Bank, Ltd. (The) . . . . . . . . . . . . . . 20,150 500 Izumi Co., Ltd. . . . . . . . . . . . . . . . . . . 18,813 2,300 J Trust Co., Ltd.† . . . . . . . . . . . . . . . . 7,660 1,600 J. Front Retailing Co., Ltd. . . . . . . . . . 14,186 1,300 Jaccs Co., Ltd. . . . . . . . . . . . . . . . . . . . 30,424
Value Shares (Note 1)
Value Shares (Note 1)
The accompanying notes are an integral part of these financial statements.
15
M International Equity FundSCHEDULE OF INVESTMENTS (Unaudited) (Continued)
June 30, 2021
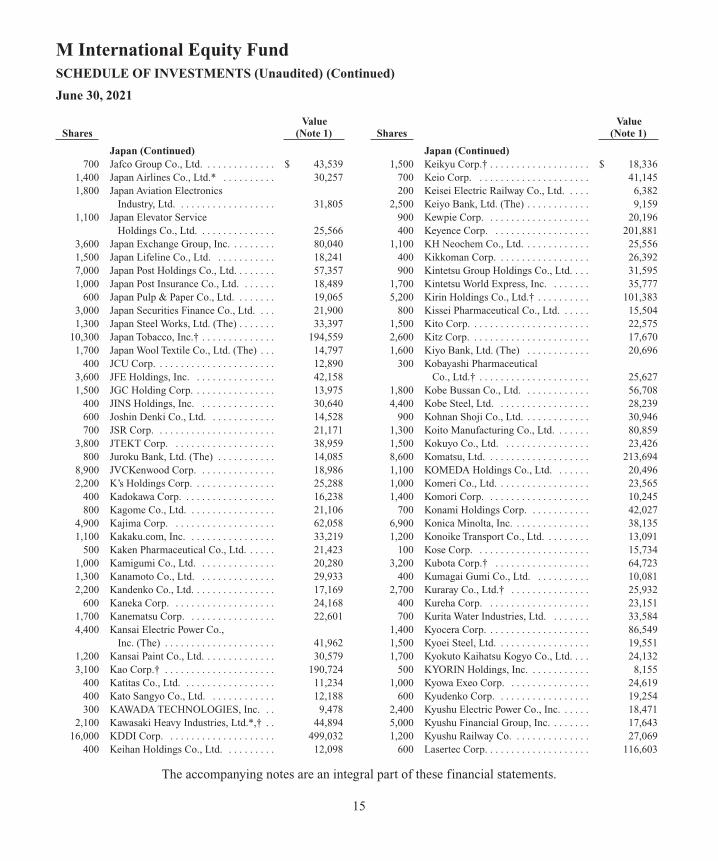
Japan (Continued) 700 Jafco Group Co., Ltd. . . . . . . . . . . . . . $ 43,539 1,400 Japan Airlines Co., Ltd.* . . . . . . . . . . 30,257 1,800 Japan Aviation Electronics
Industry, Ltd. . . . . . . . . . . . . . . . . . . 31,805 1,100 Japan Elevator Service
Holdings Co., Ltd. . . . . . . . . . . . . . . 25,566 3,600 Japan Exchange Group, Inc. . . . . . . . . 80,040 1,500 Japan Lifeline Co., Ltd. . . . . . . . . . . . 18,241 7,000 Japan Post Holdings Co., Ltd. . . . . . . . 57,357 1,000 Japan Post Insurance Co., Ltd. . . . . . . 18,489 600 Japan Pulp & Paper Co., Ltd. . . . . . . . 19,065 3,000 Japan Securities Finance Co., Ltd. . . . 21,900 1,300 Japan Steel Works, Ltd. (The) . . . . . . . 33,397 10,300 Japan Tobacco, Inc.† . . . . . . . . . . . . . . 194,559 1,700 Japan Wool Textile Co., Ltd. (The) . . . 14,797 400 JCU Corp. . . . . . . . . . . . . . . . . . . . . . . 12,890 3,600 JFE Holdings, Inc. . . . . . . . . . . . . . . . 42,158 1,500 JGC Holding Corp. . . . . . . . . . . . . . . . 13,975 400 JINS Holdings, Inc. . . . . . . . . . . . . . . 30,640 600 Joshin Denki Co., Ltd. . . . . . . . . . . . . 14,528 700 JSR Corp. . . . . . . . . . . . . . . . . . . . . . . 21,171 3,800 JTEKT Corp. . . . . . . . . . . . . . . . . . . . 38,959 800 Juroku Bank, Ltd. (The) . . . . . . . . . . . 14,085 8,900 JVCKenwood Corp. . . . . . . . . . . . . . . 18,986 2,200 K’s Holdings Corp. . . . . . . . . . . . . . . . 25,288 400 Kadokawa Corp. . . . . . . . . . . . . . . . . . 16,238 800 Kagome Co., Ltd. . . . . . . . . . . . . . . . . 21,106 4,900 Kajima Corp. . . . . . . . . . . . . . . . . . . . 62,058 1,100 Kakaku.com, Inc. . . . . . . . . . . . . . . . . 33,219 500 Kaken Pharmaceutical Co., Ltd. . . . . . 21,423 1,000 Kamigumi Co., Ltd. . . . . . . . . . . . . . . 20,280 1,300 Kanamoto Co., Ltd. . . . . . . . . . . . . . . 29,933 2,200 Kandenko Co., Ltd. . . . . . . . . . . . . . . . 17,169 600 Kaneka Corp. . . . . . . . . . . . . . . . . . . . 24,168 1,700 Kanematsu Corp. . . . . . . . . . . . . . . . . 22,601 4,400 Kansai Electric Power Co.,
Inc. (The) . . . . . . . . . . . . . . . . . . . . . 41,962 1,200 Kansai Paint Co., Ltd. . . . . . . . . . . . . . 30,579 3,100 Kao Corp.† . . . . . . . . . . . . . . . . . . . . . 190,724 400 Katitas Co., Ltd. . . . . . . . . . . . . . . . . . 11,234 400 Kato Sangyo Co., Ltd. . . . . . . . . . . . . 12,188 300 KAWADA TECHNOLOGIES, Inc. . . 9,478 2,100 Kawasaki Heavy Industries, Ltd.*,† . . 44,894 16,000 KDDI Corp. . . . . . . . . . . . . . . . . . . . . 499,032 400 Keihan Holdings Co., Ltd. . . . . . . . . . 12,098
Japan (Continued) 1,500 Keikyu Corp.† . . . . . . . . . . . . . . . . . . . $ 18,336 700 Keio Corp. . . . . . . . . . . . . . . . . . . . . . 41,145 200 Keisei Electric Railway Co., Ltd. . . . . 6,382 2,500 Keiyo Bank, Ltd. (The) . . . . . . . . . . . . 9,159 900 Kewpie Corp. . . . . . . . . . . . . . . . . . . . 20,196 400 Keyence Corp. . . . . . . . . . . . . . . . . . . 201,881 1,100 KH Neochem Co., Ltd. . . . . . . . . . . . . 25,556 400 Kikkoman Corp. . . . . . . . . . . . . . . . . . 26,392 900 Kintetsu Group Holdings Co., Ltd. . . . 31,595 1,700 Kintetsu World Express, Inc. . . . . . . . 35,777 5,200 Kirin Holdings Co., Ltd.† . . . . . . . . . . 101,383 800 Kissei Pharmaceutical Co., Ltd. . . . . . 15,504 1,500 Kito Corp. . . . . . . . . . . . . . . . . . . . . . . 22,575 2,600 Kitz Corp. . . . . . . . . . . . . . . . . . . . . . . 17,670 1,600 Kiyo Bank, Ltd. (The) . . . . . . . . . . . . 20,696 300 Kobayashi Pharmaceutical
Co., Ltd.† . . . . . . . . . . . . . . . . . . . . . 25,627 1,800 Kobe Bussan Co., Ltd. . . . . . . . . . . . . 56,708 4,400 Kobe Steel, Ltd. . . . . . . . . . . . . . . . . . 28,239 900 Kohnan Shoji Co., Ltd. . . . . . . . . . . . . 30,946 1,300 Koito Manufacturing Co., Ltd. . . . . . . 80,859 1,500 Kokuyo Co., Ltd. . . . . . . . . . . . . . . . . 23,426 8,600 Komatsu, Ltd. . . . . . . . . . . . . . . . . . . . 213,694 1,100 KOMEDA Holdings Co., Ltd. . . . . . . 20,496 1,000 Komeri Co., Ltd. . . . . . . . . . . . . . . . . . 23,565 1,400 Komori Corp. . . . . . . . . . . . . . . . . . . . 10,245 700 Konami Holdings Corp. . . . . . . . . . . . 42,027 6,900 Konica Minolta, Inc. . . . . . . . . . . . . . . 38,135 1,200 Konoike Transport Co., Ltd. . . . . . . . . 13,091 100 Kose Corp. . . . . . . . . . . . . . . . . . . . . . 15,734 3,200 Kubota Corp.† . . . . . . . . . . . . . . . . . . 64,723 400 Kumagai Gumi Co., Ltd. . . . . . . . . . . 10,081 2,700 Kuraray Co., Ltd.† . . . . . . . . . . . . . . . 25,932 400 Kureha Corp. . . . . . . . . . . . . . . . . . . . 23,151 700 Kurita Water Industries, Ltd. . . . . . . . 33,584 1,400 Kyocera Corp. . . . . . . . . . . . . . . . . . . . 86,549 1,500 Kyoei Steel, Ltd. . . . . . . . . . . . . . . . . . 19,551 1,700 Kyokuto Kaihatsu Kogyo Co., Ltd. . . . 24,132 500 KYORIN Holdings, Inc. . . . . . . . . . . . 8,155 1,000 Kyowa Exeo Corp. . . . . . . . . . . . . . . . 24,619 600 Kyudenko Corp. . . . . . . . . . . . . . . . . . 19,254 2,400 Kyushu Electric Power Co., Inc. . . . . . 18,471 5,000 Kyushu Financial Group, Inc. . . . . . . . 17,643 1,200 Kyushu Railway Co. . . . . . . . . . . . . . . 27,069 600 Lasertec Corp. . . . . . . . . . . . . . . . . . . . 116,603
Value Shares (Note 1)
Value Shares (Note 1)
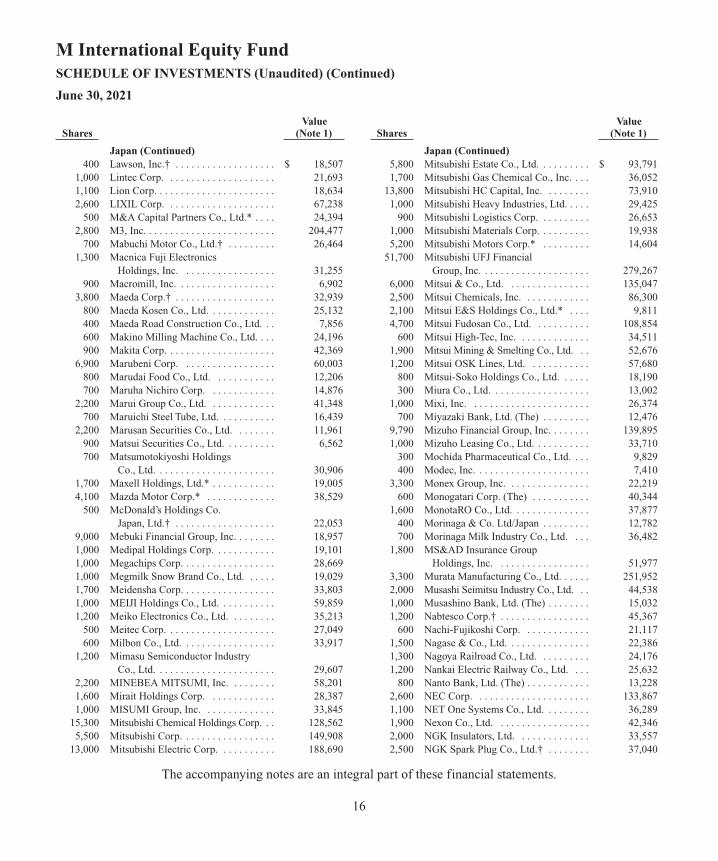
The accompanying notes are an integral part of these financial statements.
16
M International Equity FundSCHEDULE OF INVESTMENTS (Unaudited) (Continued)
June 30, 2021
Japan (Continued) 400 Lawson, Inc.† . . . . . . . . . . . . . . . . . . . $ 18,507 1,000 Lintec Corp. . . . . . . . . . . . . . . . . . . . . 21,693 1,100 Lion Corp. . . . . . . . . . . . . . . . . . . . . . . 18,634 2,600 LIXIL Corp. . . . . . . . . . . . . . . . . . . . . 67,238 500 M&A Capital Partners Co., Ltd.* . . . . 24,394 2,800 M3, Inc. . . . . . . . . . . . . . . . . . . . . . . . . 204,477 700 Mabuchi Motor Co., Ltd.† . . . . . . . . . 26,464 1,300 Macnica Fuji Electronics
Holdings, Inc. . . . . . . . . . . . . . . . . . 31,255 900 Macromill, Inc. . . . . . . . . . . . . . . . . . . 6,902 3,800 Maeda Corp.† . . . . . . . . . . . . . . . . . . . 32,939 800 Maeda Kosen Co., Ltd. . . . . . . . . . . . . 25,132 400 Maeda Road Construction Co., Ltd. . . 7,856 600 Makino Milling Machine Co., Ltd. . . . 24,196 900 Makita Corp. . . . . . . . . . . . . . . . . . . . . 42,369 6,900 Marubeni Corp. . . . . . . . . . . . . . . . . . 60,003 800 Marudai Food Co., Ltd. . . . . . . . . . . . 12,206 700 Maruha Nichiro Corp. . . . . . . . . . . . . 14,876 2,200 Marui Group Co., Ltd. . . . . . . . . . . . . 41,348 700 Maruichi Steel Tube, Ltd. . . . . . . . . . . 16,439 2,200 Marusan Securities Co., Ltd. . . . . . . . 11,961 900 Matsui Securities Co., Ltd. . . . . . . . . . 6,562 700 Matsumotokiyoshi Holdings
Co., Ltd. . . . . . . . . . . . . . . . . . . . . . . 30,906 1,700 Maxell Holdings, Ltd.* . . . . . . . . . . . . 19,005 4,100 Mazda Motor Corp.* . . . . . . . . . . . . . 38,529 500 McDonald’s Holdings Co.
Japan, Ltd.† . . . . . . . . . . . . . . . . . . . 22,053 9,000 Mebuki Financial Group, Inc. . . . . . . . 18,957 1,000 Medipal Holdings Corp. . . . . . . . . . . . 19,101 1,000 Megachips Corp. . . . . . . . . . . . . . . . . . 28,669 1,000 Megmilk Snow Brand Co., Ltd. . . . . . 19,029 1,700 Meidensha Corp. . . . . . . . . . . . . . . . . . 33,803 1,000 MEIJI Holdings Co., Ltd. . . . . . . . . . . 59,859 1,200 Meiko Electronics Co., Ltd. . . . . . . . . 35,213 500 Meitec Corp. . . . . . . . . . . . . . . . . . . . . 27,049 600 Milbon Co., Ltd. . . . . . . . . . . . . . . . . . 33,917 1,200 Mimasu Semiconductor Industry
Co., Ltd. . . . . . . . . . . . . . . . . . . . . . . 29,607 2,200 MINEBEA MITSUMI, Inc. . . . . . . . . 58,201 1,600 Mirait Holdings Corp. . . . . . . . . . . . . 28,387 1,000 MISUMI Group, Inc. . . . . . . . . . . . . . 33,845 15,300 Mitsubishi Chemical Holdings Corp. . . 128,562 5,500 Mitsubishi Corp. . . . . . . . . . . . . . . . . . 149,908 13,000 Mitsubishi Electric Corp. . . . . . . . . . . 188,690
Japan (Continued) 5,800 Mitsubishi Estate Co., Ltd. . . . . . . . . . $ 93,791 1,700 Mitsubishi Gas Chemical Co., Inc. . . . 36,052 13,800 Mitsubishi HC Capital, Inc. . . . . . . . . 73,910 1,000 Mitsubishi Heavy Industries, Ltd. . . . . 29,425 900 Mitsubishi Logistics Corp. . . . . . . . . . 26,653 1,000 Mitsubishi Materials Corp. . . . . . . . . . 19,938 5,200 Mitsubishi Motors Corp.* . . . . . . . . . 14,604 51,700 Mitsubishi UFJ Financial
Group, Inc. . . . . . . . . . . . . . . . . . . . . 279,267 6,000 Mitsui & Co., Ltd. . . . . . . . . . . . . . . . 135,047 2,500 Mitsui Chemicals, Inc. . . . . . . . . . . . . 86,300 2,100 Mitsui E&S Holdings Co., Ltd.* . . . . 9,811 4,700 Mitsui Fudosan Co., Ltd. . . . . . . . . . . 108,854 600 Mitsui High-Tec, Inc. . . . . . . . . . . . . . 34,511 1,900 Mitsui Mining & Smelting Co., Ltd. . . 52,676 1,200 Mitsui OSK Lines, Ltd. . . . . . . . . . . . 57,680 800 Mitsui-Soko Holdings Co., Ltd. . . . . . 18,190 300 Miura Co., Ltd. . . . . . . . . . . . . . . . . . . 13,002 1,000 Mixi, Inc. . . . . . . . . . . . . . . . . . . . . . . 26,374 700 Miyazaki Bank, Ltd. (The) . . . . . . . . . 12,476 9,790 Mizuho Financial Group, Inc. . . . . . . . 139,895 1,000 Mizuho Leasing Co., Ltd. . . . . . . . . . . 33,710 300 Mochida Pharmaceutical Co., Ltd. . . . 9,829 400 Modec, Inc. . . . . . . . . . . . . . . . . . . . . . 7,410 3,300 Monex Group, Inc. . . . . . . . . . . . . . . . 22,219 600 Monogatari Corp. (The) . . . . . . . . . . . 40,344 1,600 MonotaRO Co., Ltd. . . . . . . . . . . . . . . 37,877 400 Morinaga & Co. Ltd/Japan . . . . . . . . . 12,782 700 Morinaga Milk Industry Co., Ltd. . . . 36,482 1,800 MS&AD Insurance Group
Holdings, Inc. . . . . . . . . . . . . . . . . . 51,977 3,300 Murata Manufacturing Co., Ltd. . . . . . 251,952 2,000 Musashi Seimitsu Industry Co., Ltd. . . 44,538 1,000 Musashino Bank, Ltd. (The) . . . . . . . . 15,032 1,200 Nabtesco Corp.† . . . . . . . . . . . . . . . . . 45,367 600 Nachi-Fujikoshi Corp. . . . . . . . . . . . . 21,117 1,500 Nagase & Co., Ltd. . . . . . . . . . . . . . . . 22,386 1,300 Nagoya Railroad Co., Ltd. . . . . . . . . . 24,176 1,200 Nankai Electric Railway Co., Ltd. . . . 25,632 800 Nanto Bank, Ltd. (The) . . . . . . . . . . . . 13,228 2,600 NEC Corp. . . . . . . . . . . . . . . . . . . . . . 133,867 1,100 NET One Systems Co., Ltd. . . . . . . . . 36,289 1,900 Nexon Co., Ltd. . . . . . . . . . . . . . . . . . 42,346 2,000 NGK Insulators, Ltd. . . . . . . . . . . . . . 33,557 2,500 NGK Spark Plug Co., Ltd.† . . . . . . . . 37,040
Value Shares (Note 1)
Value Shares (Note 1)

The accompanying notes are an integral part of these financial statements.
17
M International Equity FundSCHEDULE OF INVESTMENTS (Unaudited) (Continued)
June 30, 2021
Japan (Continued) 1,000 NH Foods, Ltd. . . . . . . . . . . . . . . . . . . $ 38,886 2,400 NHK Spring Co., Ltd. . . . . . . . . . . . . . 19,702 1,300 Nichi-iko Pharmaceutical Co., Ltd. . . 10,415 1,200 Nichias Corp. . . . . . . . . . . . . . . . . . . . 30,190 700 Nichiha Corp. . . . . . . . . . . . . . . . . . . . 17,787 800 Nichirei Corp. . . . . . . . . . . . . . . . . . . . 21,020 900 Nidec Corp. . . . . . . . . . . . . . . . . . . . . . 104,303 1,600 Nifco, Inc. . . . . . . . . . . . . . . . . . . . . . . 60,417 700 Nihon Kohden Corp. . . . . . . . . . . . . . . 19,974 2,000 Nihon M&A Center, Inc. . . . . . . . . . . 51,866 1,800 Nihon Parkerizing Co., Ltd. . . . . . . . . 17,968 900 Nihon Unisys, Ltd. . . . . . . . . . . . . . . . 27,058 1,700 Nikkiso Co., Ltd.† . . . . . . . . . . . . . . . 17,093 1,300 Nikkon Holdings Co., Ltd. . . . . . . . . . 28,295 3,000 Nikon Corp. . . . . . . . . . . . . . . . . . . . . 32,000 500 Nintendo Co., Ltd. . . . . . . . . . . . . . . . 290,832 900 Nippn Corp. . . . . . . . . . . . . . . . . . . . . 12,711 1,200 Nippo Corp. . . . . . . . . . . . . . . . . . . . . 34,187 600 Nippon Carbon Co., Ltd. . . . . . . . . . . 22,629 700 Nippon Densetsu Kogyo Co., Ltd. . . . 11,373 900 Nippon Electric Glass Co., Ltd. . . . . . 21,144 1,200 Nippon Express Co., Ltd. . . . . . . . . . . 91,381 1,800 Nippon Gas Co., Ltd. . . . . . . . . . . . . . 30,590 1,520 Nippon Light Metal Holdings
Co., Ltd. . . . . . . . . . . . . . . . . . . . . . . 25,585 1,200 Nippon Paper Industries Co., Ltd. . . . 13,437 1,200 Nippon Sanso Holdings Corp. . . . . . . 24,595 1,200 Nippon Seiki Co., Ltd. . . . . . . . . . . . . 12,800 300 Nippon Shinyaku Co., Ltd. . . . . . . . . . 23,790 400 Nippon Shokubai Co., Ltd. . . . . . . . . . 19,227 2,600 Nippon Signal Co., Ltd. . . . . . . . . . . . 21,438 900 Nippon Soda Co., Ltd. . . . . . . . . . . . . 26,045 5,500 Nippon Steel Corp. . . . . . . . . . . . . . . . 92,752 500 Nippon Steel Trading Corp. . . . . . . . . 19,668 3,600 Nippon Suisan Kaisha, Ltd. . . . . . . . . 17,142 8,000 Nippon Telegraph & Telephone Corp. . . 208,434 530 Nippon Yakin Kogyo Co., Ltd. . . . . . . 10,829 1,800 Nippon Yusen KK . . . . . . . . . . . . . . . . 91,219 2,200 Nipro Corp. . . . . . . . . . . . . . . . . . . . . . 26,001 2,000 Nishi-Nippon Financial Holdings,
Inc. . . . . . . . . . . . . . . . . . . . . . . . . . . 11,378 900 Nishi-Nippon Railroad Co., Ltd. . . . . 21,808 1,000 Nishimatsu Construction Co., Ltd. . . . 31,145 1,600 Nishimatsuya Chain Co., Ltd. . . . . . . 21,704 700 Nishio Rent All Co., Ltd. . . . . . . . . . . 19,533
Japan (Continued) 800 Nissan Chemical Corp. . . . . . . . . . . . . $ 39,174 12,900 Nissan Motor Co., Ltd.* . . . . . . . . . . . 64,015 1,100 Nissha Co., Ltd.† . . . . . . . . . . . . . . . . 16,545 800 Nisshin Oillio Group, Ltd. (The) . . . . 22,107 1,400 Nisshin Seifun Group, Inc. . . . . . . . . . 20,478 5,700 Nisshinbo Holdings, Inc.† . . . . . . . . . 49,204 400 Nissin Foods Holdings Co., Ltd. . . . . . 28,804 500 Nitori Holdings Co., Ltd. . . . . . . . . . . 88,483 900 Nitto Denko Corp. . . . . . . . . . . . . . . . 67,159 700 Nitto Kogyo Corp. . . . . . . . . . . . . . . . 11,487 300 Noevir Holdings Co., Ltd. . . . . . . . . . 15,230 700 NOF Corp. . . . . . . . . . . . . . . . . . . . . . 36,482 1,100 Nojima Corp. . . . . . . . . . . . . . . . . . . . 27,189 1,500 NOK Corp. . . . . . . . . . . . . . . . . . . . . . 18,606 1,800 Nomura Co., Ltd. . . . . . . . . . . . . . . . . 15,473 14,300 Nomura Holdings, Inc. . . . . . . . . . . . . 73,086 1,500 Nomura Real Estate Holdings, Inc. . . 38,049 1,500 Nomura Research Institute, Ltd. . . . . . 49,620 300 Noritake Co., Ltd. . . . . . . . . . . . . . . . . 11,396 700 Noritsu Koki Co., Ltd.† . . . . . . . . . . . 14,971 7,800 North Pacific Bank, Ltd. . . . . . . . . . . . 16,570 800 NSD Co., Ltd. . . . . . . . . . . . . . . . . . . . 13,365 2,900 NSK, Ltd. . . . . . . . . . . . . . . . . . . . . . . 24,511 10,800 NTN Corp.* . . . . . . . . . . . . . . . . . . . . 28,192 4,900 NTT Data Corp. . . . . . . . . . . . . . . . . . 76,436 600 Obara Group, Inc.† . . . . . . . . . . . . . . . 20,577 6,000 Obayashi Corp. . . . . . . . . . . . . . . . . . . 47,689 200 Obic Co., Ltd. . . . . . . . . . . . . . . . . . . . 37,283 2,100 Odakyu Electric Railway Co., Ltd. . . . 53,041 1,100 Ogaki Kyoritsu Bank, Ltd. (The) . . . . 18,357 8,800 Oji Holdings Corp. . . . . . . . . . . . . . . . 50,537 1,000 Okamura Corp. . . . . . . . . . . . . . . . . . . 13,529 4,600 Okasan Securities Group, Inc. . . . . . . 17,225 1,800 Oki Electric Industry Co., Ltd. . . . . . . 16,494 500 Okinawa Cellular Telephone Co. . . . . 23,088 1,155 Okinawa Electric Power Co.,
Inc. (The) . . . . . . . . . . . . . . . . . . . . . 14,399 500 OKUMA Corp. . . . . . . . . . . . . . . . . . . 24,439 700 Okumura Corp. . . . . . . . . . . . . . . . . . . 18,405 8,100 Olympus Corp. . . . . . . . . . . . . . . . . . . 160,987 500 Omron Corp. . . . . . . . . . . . . . . . . . . . . 39,651 2,000 Ono Pharmaceutical Co., Ltd. . . . . . . 44,628 3,700 Onward Holdings Co., Ltd. . . . . . . . . . 11,190 1,200 Open House Co., Ltd. . . . . . . . . . . . . . 56,384 200 Oracle Corp. Japan . . . . . . . . . . . . . . . 15,302
Value Shares (Note 1)
Value Shares (Note 1)
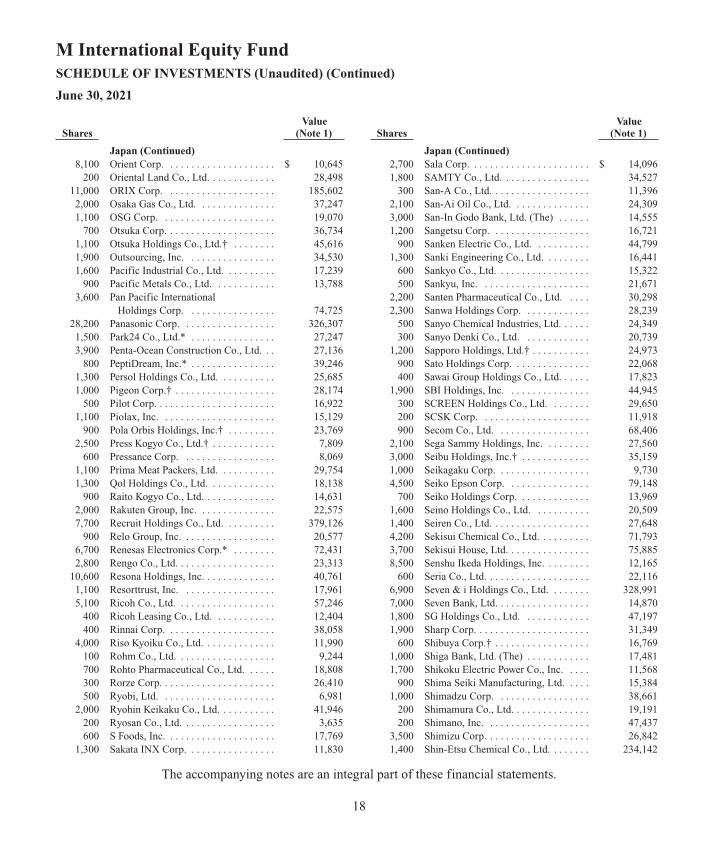
The accompanying notes are an integral part of these financial statements.
18
M International Equity FundSCHEDULE OF INVESTMENTS (Unaudited) (Continued)
June 30, 2021
Japan (Continued) 8,100 Orient Corp. . . . . . . . . . . . . . . . . . . . . $ 10,645 200 Oriental Land Co., Ltd. . . . . . . . . . . . . 28,498 11,000 ORIX Corp. . . . . . . . . . . . . . . . . . . . . 185,602 2,000 Osaka Gas Co., Ltd. . . . . . . . . . . . . . . 37,247 1,100 OSG Corp. . . . . . . . . . . . . . . . . . . . . . 19,070 700 Otsuka Corp. . . . . . . . . . . . . . . . . . . . . 36,734 1,100 Otsuka Holdings Co., Ltd.† . . . . . . . . 45,616 1,900 Outsourcing, Inc. . . . . . . . . . . . . . . . . 34,530 1,600 Pacific Industrial Co., Ltd. . . . . . . . . . 17,239 900 Pacific Metals Co., Ltd. . . . . . . . . . . . 13,788 3,600 Pan Pacific International
Holdings Corp. . . . . . . . . . . . . . . . . 74,725 28,200 Panasonic Corp. . . . . . . . . . . . . . . . . . 326,307 1,500 Park24 Co., Ltd.* . . . . . . . . . . . . . . . . 27,247 3,900 Penta-Ocean Construction Co., Ltd. . . 27,136 800 PeptiDream, Inc.* . . . . . . . . . . . . . . . . 39,246 1,300 Persol Holdings Co., Ltd. . . . . . . . . . . 25,685 1,000 Pigeon Corp.† . . . . . . . . . . . . . . . . . . . 28,174 500 Pilot Corp. . . . . . . . . . . . . . . . . . . . . . . 16,922 1,100 Piolax, Inc. . . . . . . . . . . . . . . . . . . . . . 15,129 900 Pola Orbis Holdings, Inc.† . . . . . . . . . 23,769 2,500 Press Kogyo Co., Ltd.† . . . . . . . . . . . . 7,809 600 Pressance Corp. . . . . . . . . . . . . . . . . . 8,069 1,100 Prima Meat Packers, Ltd. . . . . . . . . . . 29,754 1,300 Qol Holdings Co., Ltd. . . . . . . . . . . . . 18,138 900 Raito Kogyo Co., Ltd. . . . . . . . . . . . . . 14,631 2,000 Rakuten Group, Inc. . . . . . . . . . . . . . . 22,575 7,700 Recruit Holdings Co., Ltd. . . . . . . . . . 379,126 900 Relo Group, Inc. . . . . . . . . . . . . . . . . . 20,577 6,700 Renesas Electronics Corp.* . . . . . . . . 72,431 2,800 Rengo Co., Ltd. . . . . . . . . . . . . . . . . . . 23,313 10,600 Resona Holdings, Inc. . . . . . . . . . . . . . 40,761 1,100 Resorttrust, Inc. . . . . . . . . . . . . . . . . . 17,961 5,100 Ricoh Co., Ltd. . . . . . . . . . . . . . . . . . . 57,246 400 Ricoh Leasing Co., Ltd. . . . . . . . . . . . 12,404 400 Rinnai Corp. . . . . . . . . . . . . . . . . . . . . 38,058 4,000 Riso Kyoiku Co., Ltd. . . . . . . . . . . . . . 11,990 100 Rohm Co., Ltd. . . . . . . . . . . . . . . . . . . 9,244 700 Rohto Pharmaceutical Co., Ltd. . . . . . 18,808 300 Rorze Corp. . . . . . . . . . . . . . . . . . . . . . 26,410 500 Ryobi, Ltd. . . . . . . . . . . . . . . . . . . . . . 6,981 2,000 Ryohin Keikaku Co., Ltd. . . . . . . . . . . 41,946 200 Ryosan Co., Ltd. . . . . . . . . . . . . . . . . . 3,635 600 S Foods, Inc. . . . . . . . . . . . . . . . . . . . . 17,769 1,300 Sakata INX Corp. . . . . . . . . . . . . . . . . 11,830
Japan (Continued) 2,700 Sala Corp. . . . . . . . . . . . . . . . . . . . . . . $ 14,096 1,800 SAMTY Co., Ltd. . . . . . . . . . . . . . . . . 34,527 300 San-A Co., Ltd. . . . . . . . . . . . . . . . . . . 11,396 2,100 San-Ai Oil Co., Ltd. . . . . . . . . . . . . . . 24,309 3,000 San-In Godo Bank, Ltd. (The) . . . . . . 14,555 1,200 Sangetsu Corp. . . . . . . . . . . . . . . . . . . 16,721 900 Sanken Electric Co., Ltd. . . . . . . . . . . 44,799 1,300 Sanki Engineering Co., Ltd. . . . . . . . . 16,441 600 Sankyo Co., Ltd. . . . . . . . . . . . . . . . . . 15,322 500 Sankyu, Inc. . . . . . . . . . . . . . . . . . . . . 21,671 2,200 Santen Pharmaceutical Co., Ltd. . . . . 30,298 2,300 Sanwa Holdings Corp. . . . . . . . . . . . . 28,239 500 Sanyo Chemical Industries, Ltd. . . . . . 24,349 300 Sanyo Denki Co., Ltd. . . . . . . . . . . . . 20,739 1,200 Sapporo Holdings, Ltd.† . . . . . . . . . . . 24,973 900 Sato Holdings Corp. . . . . . . . . . . . . . . 22,068 400 Sawai Group Holdings Co., Ltd. . . . . . 17,823 1,900 SBI Holdings, Inc. . . . . . . . . . . . . . . . 44,945 300 SCREEN Holdings Co., Ltd. . . . . . . . 29,650 200 SCSK Corp. . . . . . . . . . . . . . . . . . . . . 11,918 900 Secom Co., Ltd. . . . . . . . . . . . . . . . . . 68,406 2,100 Sega Sammy Holdings, Inc. . . . . . . . . 27,560 3,000 Seibu Holdings, Inc.† . . . . . . . . . . . . . 35,159 1,000 Seikagaku Corp. . . . . . . . . . . . . . . . . . 9,730 4,500 Seiko Epson Corp. . . . . . . . . . . . . . . . 79,148 700 Seiko Holdings Corp. . . . . . . . . . . . . . 13,969 1,600 Seino Holdings Co., Ltd. . . . . . . . . . . 20,509 1,400 Seiren Co., Ltd. . . . . . . . . . . . . . . . . . . 27,648 4,200 Sekisui Chemical Co., Ltd. . . . . . . . . . 71,793 3,700 Sekisui House, Ltd. . . . . . . . . . . . . . . . 75,885 8,500 Senshu Ikeda Holdings, Inc. . . . . . . . . 12,165 600 Seria Co., Ltd. . . . . . . . . . . . . . . . . . . . 22,116 6,900 Seven & i Holdings Co., Ltd. . . . . . . . 328,991 7,000 Seven Bank, Ltd. . . . . . . . . . . . . . . . . . 14,870 1,800 SG Holdings Co., Ltd. . . . . . . . . . . . . 47,197 1,900 Sharp Corp. . . . . . . . . . . . . . . . . . . . . . 31,349 600 Shibuya Corp.† . . . . . . . . . . . . . . . . . . 16,769 1,000 Shiga Bank, Ltd. (The) . . . . . . . . . . . . 17,481 1,700 Shikoku Electric Power Co., Inc. . . . . 11,568 900 Shima Seiki Manufacturing, Ltd. . . . . 15,384 1,000 Shimadzu Corp. . . . . . . . . . . . . . . . . . 38,661 200 Shimamura Co., Ltd. . . . . . . . . . . . . . . 19,191 200 Shimano, Inc. . . . . . . . . . . . . . . . . . . . 47,437 3,500 Shimizu Corp. . . . . . . . . . . . . . . . . . . . 26,842 1,400 Shin-Etsu Chemical Co., Ltd. . . . . . . . 234,142
Value Shares (Note 1)
Value Shares (Note 1)

The accompanying notes are an integral part of these financial statements.
19
M International Equity FundSCHEDULE OF INVESTMENTS (Unaudited) (Continued)
June 30, 2021
Japan (Continued) 2,000 Shin-Etsu Polymer Co., Ltd. . . . . . . . . $ 18,471 1,100 Shinko Electric Industries Co., Ltd. . . 40,249 1,700 Shinmaywa Industries, Ltd. . . . . . . . . 14,675 1,800 Shinsei Bank, Ltd. . . . . . . . . . . . . . . . 23,607 1,000 Shionogi & Co., Ltd. . . . . . . . . . . . . . . 52,127 1,200 Ship Healthcare Holdings, Inc. . . . . . . 28,008 600 Shiseido Co., Ltd.† . . . . . . . . . . . . . . . 44,130 4,800 Shizuoka Bank, Ltd. (The)† . . . . . . . . 37,114 2,800 Shizuoka Gas Co., Ltd.† . . . . . . . . . . . 25,078 300 SHO-BOND Holdings Co., Ltd. . . . . . 12,489 300 Shoei Co., Ltd. . . . . . . . . . . . . . . . . . . 11,328 1,300 Showa Denko KK . . . . . . . . . . . . . . . . 38,616 1,000 Siix Corp.† . . . . . . . . . . . . . . . . . . . . . 12,791 1,100 Sinfonia Technology Co., Ltd. . . . . . . 12,367 3,900 SKY Perfect JSAT Holdings, Inc. . . . . 14,218 2,600 Skylark Holdings Co., Ltd.*,† . . . . . . 36,111 100 SMC Corp. . . . . . . . . . . . . . . . . . . . . . 59,094 1,300 SMS Co., Ltd. . . . . . . . . . . . . . . . . . . . 38,908 2,700 Sodick Co., Ltd.† . . . . . . . . . . . . . . . . 24,814 11,900 SoftBank Corp. . . . . . . . . . . . . . . . . . . 155,692 11,100 SoftBank Group Corp. . . . . . . . . . . . . 776,835 500 Sohgo Security Services Co., Ltd. . . . 22,773 7,800 Sojitz Corp. . . . . . . . . . . . . . . . . . . . . . 23,520 2,000 Sompo Holdings, Inc. . . . . . . . . . . . . . 73,919 8,500 Sony Group Corp. . . . . . . . . . . . . . . . . 827,467 800 Sotetsu Holdings, Inc. . . . . . . . . . . . . . 15,763 400 Square Enix Holdings Co., Ltd. . . . . . 19,839 400 Stanley Electric Co., Ltd. . . . . . . . . . . 11,576 1,600 Star Micronics Co., Ltd. . . . . . . . . . . . 24,354 800 Starts Corp., Inc. . . . . . . . . . . . . . . . . . 20,473 6,000 Subaru Corp. . . . . . . . . . . . . . . . . . . . . 118,358 200 Sugi Holdings Co., Ltd. . . . . . . . . . . . 14,582 3,600 SUMCO Corp.† . . . . . . . . . . . . . . . . . 88,303 13,500 Sumitomo Chemical Co., Ltd. . . . . . . 71,574 3,800 Sumitomo Corp. . . . . . . . . . . . . . . . . . 50,897 1,500 Sumitomo Dainippon Pharma
Co., Ltd. . . . . . . . . . . . . . . . . . . . . . . 31,433 5,300 Sumitomo Electric Industries, Ltd. . . . 78,192 1,600 Sumitomo Forestry Co., Ltd.† . . . . . . 29,308 1,700 Sumitomo Heavy Industries, Ltd. . . . . 46,825 1,100 Sumitomo Metal Mining Co., Ltd. . . . 42,824 3,600 Sumitomo Mitsui Construction
Co., Ltd. . . . . . . . . . . . . . . . . . . . . . . 15,295 5,600 Sumitomo Mitsui Financial
Group, Inc. . . . . . . . . . . . . . . . . . . . . 193,060
Japan (Continued) 1,900 Sumitomo Mitsui Trust
Holdings, Inc. . . . . . . . . . . . . . . . . . $ 60,338 900 Sumitomo Osaka Cement Co., Ltd. . . 24,466 1,700 Sumitomo Realty & Development
Co., Ltd. . . . . . . . . . . . . . . . . . . . . . . 60,750 3,700 Sumitomo Rubber Industries, Ltd.† . . 51,056 400 Sumitomo Seika Chemicals Co., Ltd. . . 12,962 900 Sumitomo Warehouse Co.,
Ltd. (The) . . . . . . . . . . . . . . . . . . . . . 12,938 2,600 Sun Frontier Fudousan Co., Ltd. . . . . 24,480 700 Sundrug Co., Ltd. . . . . . . . . . . . . . . . . 22,242 1,100 Suntory Beverage & Food, Ltd.† . . . . 41,388 400 Suzuken Co., Ltd. . . . . . . . . . . . . . . . . 11,720 2,700 Suzuki Motor Corp. . . . . . . . . . . . . . . 114,251 900 Sysmex Corp. . . . . . . . . . . . . . . . . . . . 106,935 1,700 Systena Corp. . . . . . . . . . . . . . . . . . . . 32,578 800 T Hasegawa Co., Ltd. . . . . . . . . . . . . . 17,715 2,400 T&D Holdings, Inc. . . . . . . . . . . . . . . 31,022 700 Tachi-S Co., Ltd. . . . . . . . . . . . . . . . . . 9,363 2,200 Tadano, Ltd. . . . . . . . . . . . . . . . . . . . . 22,971 1,800 Taiheiyo Cement Corp. . . . . . . . . . . . . 39,485 3,200 Taisei Corp. . . . . . . . . . . . . . . . . . . . . . 104,847 200 Taisho Pharmaceutical Holdings
Co., Ltd. . . . . . . . . . . . . . . . . . . . . . . 10,712 300 Taiyo Holdings Co., Ltd. . . . . . . . . . . 14,177 1,600 Taiyo Yuden Co., Ltd. . . . . . . . . . . . . . 79,067 500 Takara Holdings, Inc. . . . . . . . . . . . . . 6,233 1,600 Takashimaya Co., Ltd. . . . . . . . . . . . . 17,398 6,700 Takeda Pharmaceutical Co., Ltd. . . . . 224,288 1,200 Takeuchi Manufacturing Co., Ltd. . . . 29,888 2,100 Tamura Corp.† . . . . . . . . . . . . . . . . . . 15,746 1,200 TDK Corp. . . . . . . . . . . . . . . . . . . . . . 145,713 1,800 TechnoPro Holdings, Inc. . . . . . . . . . . 42,580 4,200 Teijin, Ltd. . . . . . . . . . . . . . . . . . . . . . . 64,005 400 Tekken Corp. . . . . . . . . . . . . . . . . . . . . 6,632 3,300 Terumo Corp. . . . . . . . . . . . . . . . . . . . 133,729 1,300 THK Co., Ltd.† . . . . . . . . . . . . . . . . . . 38,791 1,200 TIS, Inc. . . . . . . . . . . . . . . . . . . . . . . . 30,644 3,100 Toagosei Co., Ltd.† . . . . . . . . . . . . . . . 31,504 1,500 Tobu Railway Co., Ltd. . . . . . . . . . . . . 38,778 2,200 Tocalo Co., Ltd. . . . . . . . . . . . . . . . . . 27,783 3,500 Toda Corp. . . . . . . . . . . . . . . . . . . . . . 24,101 600 Toho Co., Ltd . . . . . . . . . . . . . . . . . . . 24,736 500 Toho Gas Co., Ltd. . . . . . . . . . . . . . . . 24,484 1,500 Toho Holdings Co., Ltd. . . . . . . . . . . . 24,128
Value Shares (Note 1)
Value Shares (Note 1)
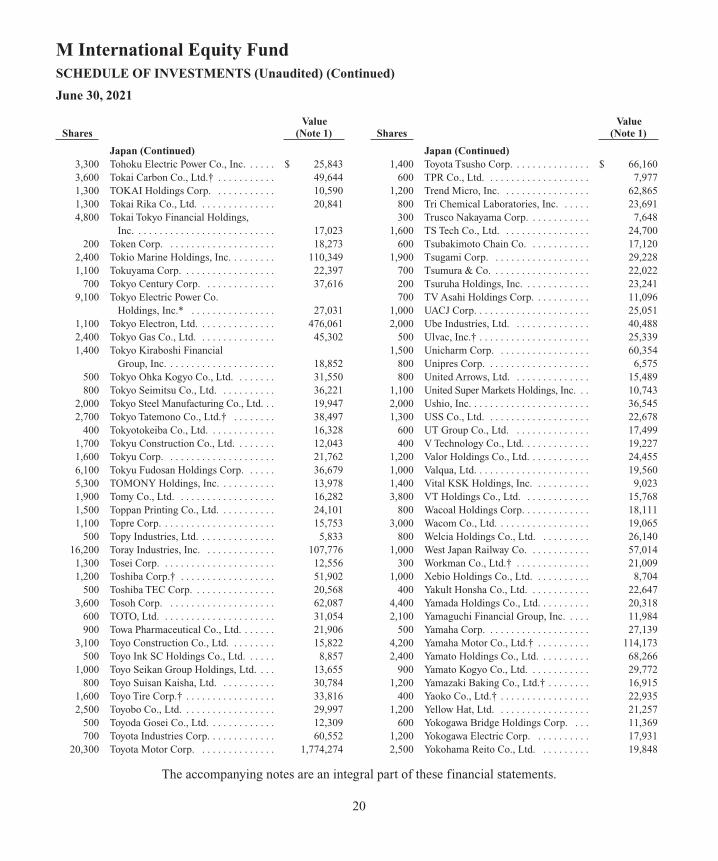
The accompanying notes are an integral part of these financial statements.
20
M International Equity FundSCHEDULE OF INVESTMENTS (Unaudited) (Continued)
June 30, 2021
Japan (Continued) 3,300 Tohoku Electric Power Co., Inc. . . . . . $ 25,843 3,600 Tokai Carbon Co., Ltd.† . . . . . . . . . . . 49,644 1,300 TOKAI Holdings Corp. . . . . . . . . . . . 10,590 1,300 Tokai Rika Co., Ltd. . . . . . . . . . . . . . . 20,841 4,800 Tokai Tokyo Financial Holdings,
Inc. . . . . . . . . . . . . . . . . . . . . . . . . . . 17,023 200 Token Corp. . . . . . . . . . . . . . . . . . . . . 18,273 2,400 Tokio Marine Holdings, Inc. . . . . . . . . 110,349 1,100 Tokuyama Corp. . . . . . . . . . . . . . . . . . 22,397 700 Tokyo Century Corp. . . . . . . . . . . . . . 37,616 9,100 Tokyo Electric Power Co.
Holdings, Inc.* . . . . . . . . . . . . . . . . 27,031 1,100 Tokyo Electron, Ltd. . . . . . . . . . . . . . . 476,061 2,400 Tokyo Gas Co., Ltd. . . . . . . . . . . . . . . 45,302 1,400 Tokyo Kiraboshi Financial
Group, Inc. . . . . . . . . . . . . . . . . . . . . 18,852 500 Tokyo Ohka Kogyo Co., Ltd. . . . . . . . 31,550 800 Tokyo Seimitsu Co., Ltd. . . . . . . . . . . 36,221 2,000 Tokyo Steel Manufacturing Co., Ltd. . . 19,947 2,700 Tokyo Tatemono Co., Ltd.† . . . . . . . . 38,497 400 Tokyotokeiba Co., Ltd. . . . . . . . . . . . . 16,328 1,700 Tokyu Construction Co., Ltd. . . . . . . . 12,043 1,600 Tokyu Corp. . . . . . . . . . . . . . . . . . . . . 21,762 6,100 Tokyu Fudosan Holdings Corp. . . . . . 36,679 5,300 TOMONY Holdings, Inc. . . . . . . . . . . 13,978 1,900 Tomy Co., Ltd. . . . . . . . . . . . . . . . . . . 16,282 1,500 Toppan Printing Co., Ltd. . . . . . . . . . . 24,101 1,100 Topre Corp. . . . . . . . . . . . . . . . . . . . . . 15,753 500 Topy Industries, Ltd. . . . . . . . . . . . . . . 5,833 16,200 Toray Industries, Inc. . . . . . . . . . . . . . 107,776 1,300 Tosei Corp. . . . . . . . . . . . . . . . . . . . . . 12,556 1,200 Toshiba Corp.† . . . . . . . . . . . . . . . . . . 51,902 500 Toshiba TEC Corp. . . . . . . . . . . . . . . . 20,568 3,600 Tosoh Corp. . . . . . . . . . . . . . . . . . . . . 62,087 600 TOTO, Ltd. . . . . . . . . . . . . . . . . . . . . . 31,054 900 Towa Pharmaceutical Co., Ltd. . . . . . . 21,906 3,100 Toyo Construction Co., Ltd. . . . . . . . . 15,822 500 Toyo Ink SC Holdings Co., Ltd. . . . . . 8,857 1,000 Toyo Seikan Group Holdings, Ltd. . . . 13,655 800 Toyo Suisan Kaisha, Ltd. . . . . . . . . . . 30,784 1,600 Toyo Tire Corp.† . . . . . . . . . . . . . . . . . 33,816 2,500 Toyobo Co., Ltd. . . . . . . . . . . . . . . . . . 29,997 500 Toyoda Gosei Co., Ltd. . . . . . . . . . . . . 12,309 700 Toyota Industries Corp. . . . . . . . . . . . . 60,552 20,300 Toyota Motor Corp. . . . . . . . . . . . . . . 1,774,274
Japan (Continued) 1,400 Toyota Tsusho Corp. . . . . . . . . . . . . . . $ 66,160 600 TPR Co., Ltd. . . . . . . . . . . . . . . . . . . . 7,977 1,200 Trend Micro, Inc. . . . . . . . . . . . . . . . . 62,865 800 Tri Chemical Laboratories, Inc. . . . . . 23,691 300 Trusco Nakayama Corp. . . . . . . . . . . . 7,648 1,600 TS Tech Co., Ltd. . . . . . . . . . . . . . . . . 24,700 600 Tsubakimoto Chain Co. . . . . . . . . . . . 17,120 1,900 Tsugami Corp. . . . . . . . . . . . . . . . . . . 29,228 700 Tsumura & Co. . . . . . . . . . . . . . . . . . . 22,022 200 Tsuruha Holdings, Inc. . . . . . . . . . . . . 23,241 700 TV Asahi Holdings Corp. . . . . . . . . . . 11,096 1,000 UACJ Corp. . . . . . . . . . . . . . . . . . . . . . 25,051 2,000 Ube Industries, Ltd. . . . . . . . . . . . . . . 40,488 500 Ulvac, Inc.† . . . . . . . . . . . . . . . . . . . . . 25,339 1,500 Unicharm Corp. . . . . . . . . . . . . . . . . . 60,354 800 Unipres Corp. . . . . . . . . . . . . . . . . . . . 6,575 800 United Arrows, Ltd. . . . . . . . . . . . . . . 15,489 1,100 United Super Markets Holdings, Inc. . . 10,743 2,000 Ushio, Inc. . . . . . . . . . . . . . . . . . . . . . . 36,545 1,300 USS Co., Ltd. . . . . . . . . . . . . . . . . . . . 22,678 600 UT Group Co., Ltd. . . . . . . . . . . . . . . 17,499 400 V Technology Co., Ltd. . . . . . . . . . . . . 19,227 1,200 Valor Holdings Co., Ltd. . . . . . . . . . . . 24,455 1,000 Valqua, Ltd. . . . . . . . . . . . . . . . . . . . . . 19,560 1,400 Vital KSK Holdings, Inc. . . . . . . . . . . 9,023 3,800 VT Holdings Co., Ltd. . . . . . . . . . . . . 15,768 800 Wacoal Holdings Corp. . . . . . . . . . . . . 18,111 3,000 Wacom Co., Ltd. . . . . . . . . . . . . . . . . . 19,065 800 Welcia Holdings Co., Ltd. . . . . . . . . . 26,140 1,000 West Japan Railway Co. . . . . . . . . . . . 57,014 300 Workman Co., Ltd.† . . . . . . . . . . . . . . 21,009 1,000 Xebio Holdings Co., Ltd. . . . . . . . . . . 8,704 400 Yakult Honsha Co., Ltd. . . . . . . . . . . . 22,647 4,400 Yamada Holdings Co., Ltd. . . . . . . . . . 20,318 2,100 Yamaguchi Financial Group, Inc. . . . . 11,984 500 Yamaha Corp. . . . . . . . . . . . . . . . . . . . 27,139 4,200 Yamaha Motor Co., Ltd.† . . . . . . . . . . 114,173 2,400 Yamato Holdings Co., Ltd. . . . . . . . . . 68,266 900 Yamato Kogyo Co., Ltd. . . . . . . . . . . . 29,772 1,200 Yamazaki Baking Co., Ltd.† . . . . . . . . 16,915 400 Yaoko Co., Ltd.† . . . . . . . . . . . . . . . . . 22,935 1,200 Yellow Hat, Ltd. . . . . . . . . . . . . . . . . . 21,257 600 Yokogawa Bridge Holdings Corp. . . . 11,369 1,200 Yokogawa Electric Corp. . . . . . . . . . . 17,931 2,500 Yokohama Reito Co., Ltd. . . . . . . . . . 19,848
Value Shares (Note 1)
Value Shares (Note 1)
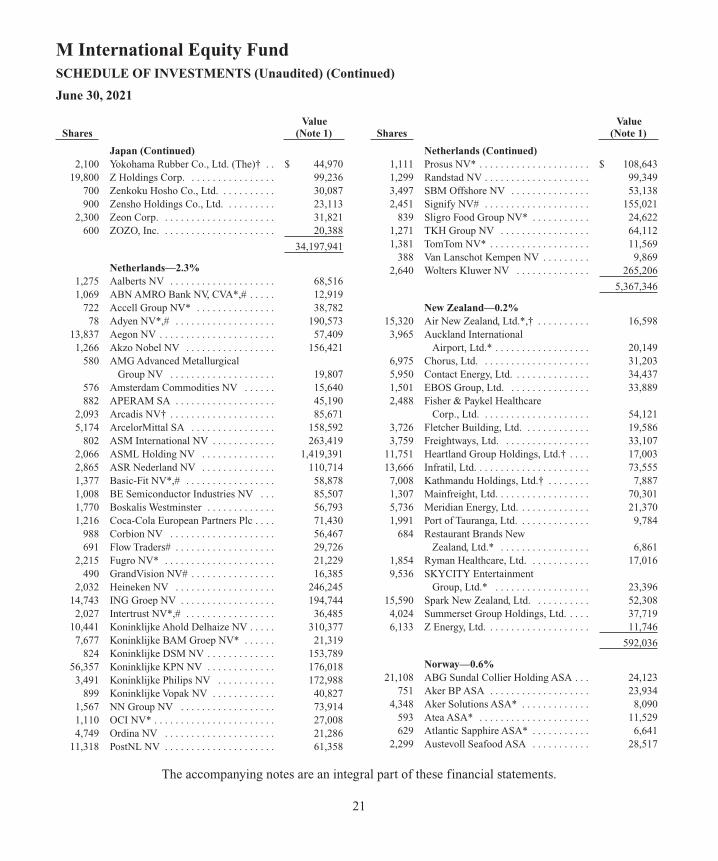
The accompanying notes are an integral part of these financial statements.
21
M International Equity FundSCHEDULE OF INVESTMENTS (Unaudited) (Continued)
June 30, 2021
Japan (Continued) 2,100 Yokohama Rubber Co., Ltd. (The)† . . $ 44,970 19,800 Z Holdings Corp. . . . . . . . . . . . . . . . . 99,236 700 Zenkoku Hosho Co., Ltd. . . . . . . . . . . 30,087 900 Zensho Holdings Co., Ltd. . . . . . . . . . 23,113 2,300 Zeon Corp. . . . . . . . . . . . . . . . . . . . . . 31,821 600 ZOZO, Inc. . . . . . . . . . . . . . . . . . . . . . 20,388
34,197,941
Netherlands—2.3% 1,275 Aalberts NV . . . . . . . . . . . . . . . . . . . . 68,516 1,069 ABN AMRO Bank NV, CVA*,# . . . . . 12,919 722 Accell Group NV* . . . . . . . . . . . . . . . 38,782 78 Adyen NV*,# . . . . . . . . . . . . . . . . . . . 190,573 13,837 Aegon NV . . . . . . . . . . . . . . . . . . . . . . 57,409 1,266 Akzo Nobel NV . . . . . . . . . . . . . . . . . 156,421 580 AMG Advanced Metallurgical
Group NV . . . . . . . . . . . . . . . . . . . . 19,807 576 Amsterdam Commodities NV . . . . . . 15,640 882 APERAM SA . . . . . . . . . . . . . . . . . . . 45,190 2,093 Arcadis NV† . . . . . . . . . . . . . . . . . . . . 85,671 5,174 ArcelorMittal SA . . . . . . . . . . . . . . . . 158,592 802 ASM International NV . . . . . . . . . . . . 263,419 2,066 ASML Holding NV . . . . . . . . . . . . . . 1,419,391 2,865 ASR Nederland NV . . . . . . . . . . . . . . 110,714 1,377 Basic-Fit NV*,# . . . . . . . . . . . . . . . . . 58,878 1,008 BE Semiconductor Industries NV . . . 85,507 1,770 Boskalis Westminster . . . . . . . . . . . . . 56,793 1,216 Coca-Cola European Partners Plc . . . . 71,430 988 Corbion NV . . . . . . . . . . . . . . . . . . . . 56,467 691 Flow Traders# . . . . . . . . . . . . . . . . . . . 29,726 2,215 Fugro NV* . . . . . . . . . . . . . . . . . . . . . 21,229 490 GrandVision NV# . . . . . . . . . . . . . . . . 16,385 2,032 Heineken NV . . . . . . . . . . . . . . . . . . . 246,245 14,743 ING Groep NV . . . . . . . . . . . . . . . . . . 194,744 2,027 Intertrust NV*,# . . . . . . . . . . . . . . . . . 36,485 10,441 Koninklijke Ahold Delhaize NV . . . . . 310,377 7,677 Koninklijke BAM Groep NV* . . . . . . 21,319 824 Koninklijke DSM NV . . . . . . . . . . . . . 153,789 56,357 Koninklijke KPN NV . . . . . . . . . . . . . 176,018 3,491 Koninklijke Philips NV . . . . . . . . . . . 172,988 899 Koninklijke Vopak NV . . . . . . . . . . . . 40,827 1,567 NN Group NV . . . . . . . . . . . . . . . . . . 73,914 1,110 OCI NV* . . . . . . . . . . . . . . . . . . . . . . . 27,008 4,749 Ordina NV . . . . . . . . . . . . . . . . . . . . . 21,286 11,318 PostNL NV . . . . . . . . . . . . . . . . . . . . . 61,358
Netherlands (Continued) 1,111 Prosus NV* . . . . . . . . . . . . . . . . . . . . . $ 108,643 1,299 Randstad NV . . . . . . . . . . . . . . . . . . . . 99,349 3,497 SBM Offshore NV . . . . . . . . . . . . . . . 53,138 2,451 Signify NV# . . . . . . . . . . . . . . . . . . . . 155,021 839 Sligro Food Group NV* . . . . . . . . . . . 24,622 1,271 TKH Group NV . . . . . . . . . . . . . . . . . 64,112 1,381 TomTom NV* . . . . . . . . . . . . . . . . . . . 11,569 388 Van Lanschot Kempen NV . . . . . . . . . 9,869 2,640 Wolters Kluwer NV . . . . . . . . . . . . . . 265,206
5,367,346
New Zealand—0.2% 15,320 Air New Zealand, Ltd.*,† . . . . . . . . . . 16,598 3,965 Auckland International
Airport, Ltd.* . . . . . . . . . . . . . . . . . . 20,149 6,975 Chorus, Ltd. . . . . . . . . . . . . . . . . . . . . 31,203 5,950 Contact Energy, Ltd. . . . . . . . . . . . . . . 34,437 1,501 EBOS Group, Ltd. . . . . . . . . . . . . . . . 33,889 2,488 Fisher & Paykel Healthcare
Corp., Ltd. . . . . . . . . . . . . . . . . . . . . 54,121 3,726 Fletcher Building, Ltd. . . . . . . . . . . . . 19,586 3,759 Freightways, Ltd. . . . . . . . . . . . . . . . . 33,107 11,751 Heartland Group Holdings, Ltd.† . . . . 17,003 13,666 Infratil, Ltd. . . . . . . . . . . . . . . . . . . . . . 73,555 7,008 Kathmandu Holdings, Ltd.† . . . . . . . . 7,887 1,307 Mainfreight, Ltd. . . . . . . . . . . . . . . . . . 70,301 5,736 Meridian Energy, Ltd. . . . . . . . . . . . . . 21,370 1,991 Port of Tauranga, Ltd. . . . . . . . . . . . . . 9,784 684 Restaurant Brands New
Zealand, Ltd.* . . . . . . . . . . . . . . . . . 6,861 1,854 Ryman Healthcare, Ltd. . . . . . . . . . . . 17,016 9,536 SKYCITY Entertainment
Group, Ltd.* . . . . . . . . . . . . . . . . . . 23,396 15,590 Spark New Zealand, Ltd. . . . . . . . . . . 52,308 4,024 Summerset Group Holdings, Ltd. . . . . 37,719 6,133 Z Energy, Ltd. . . . . . . . . . . . . . . . . . . . 11,746
592,036
Norway—0.6% 21,108 ABG Sundal Collier Holding ASA . . . 24,123 751 Aker BP ASA . . . . . . . . . . . . . . . . . . . 23,934 4,348 Aker Solutions ASA* . . . . . . . . . . . . . 8,090 593 Atea ASA* . . . . . . . . . . . . . . . . . . . . . 11,529 629 Atlantic Sapphire ASA* . . . . . . . . . . . 6,641 2,299 Austevoll Seafood ASA . . . . . . . . . . . 28,517
Value Shares (Note 1)
Value Shares (Note 1)
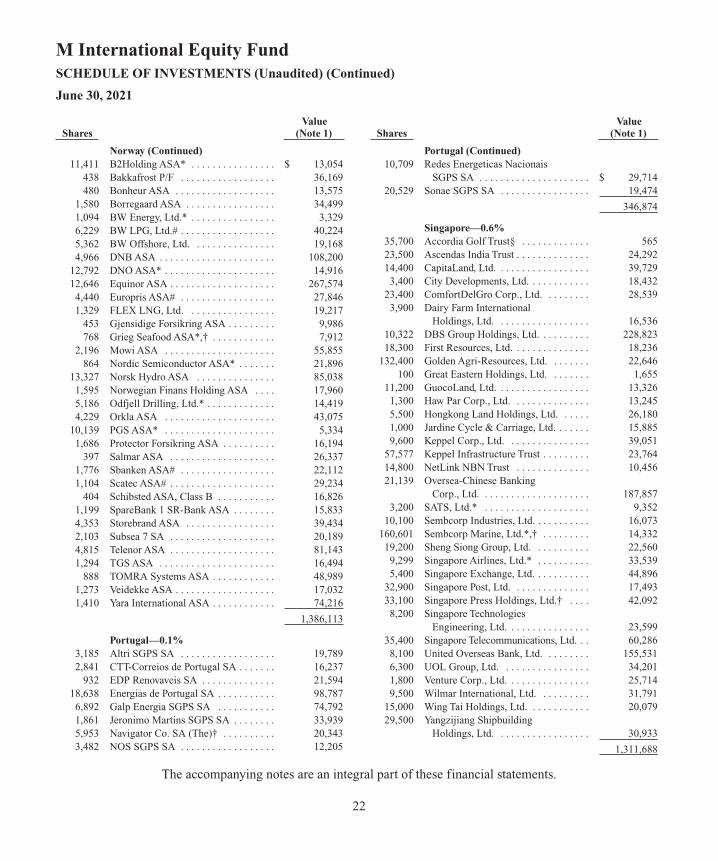
The accompanying notes are an integral part of these financial statements.
22
M International Equity FundSCHEDULE OF INVESTMENTS (Unaudited) (Continued)
June 30, 2021
Norway (Continued) 11,411 B2Holding ASA* . . . . . . . . . . . . . . . . $ 13,054 438 Bakkafrost P/F . . . . . . . . . . . . . . . . . . 36,169 480 Bonheur ASA . . . . . . . . . . . . . . . . . . . 13,575 1,580 Borregaard ASA . . . . . . . . . . . . . . . . . 34,499 1,094 BW Energy, Ltd.* . . . . . . . . . . . . . . . . 3,329 6,229 BW LPG, Ltd.# . . . . . . . . . . . . . . . . . . 40,224 5,362 BW Offshore, Ltd. . . . . . . . . . . . . . . . 19,168 4,966 DNB ASA . . . . . . . . . . . . . . . . . . . . . . 108,200 12,792 DNO ASA* . . . . . . . . . . . . . . . . . . . . . 14,916 12,646 Equinor ASA . . . . . . . . . . . . . . . . . . . . 267,574 4,440 Europris ASA# . . . . . . . . . . . . . . . . . . 27,846 1,329 FLEX LNG, Ltd. . . . . . . . . . . . . . . . . 19,217 453 Gjensidige Forsikring ASA . . . . . . . . . 9,986 768 Grieg Seafood ASA*,† . . . . . . . . . . . . 7,912 2,196 Mowi ASA . . . . . . . . . . . . . . . . . . . . . 55,855 864 Nordic Semiconductor ASA* . . . . . . . 21,896 13,327 Norsk Hydro ASA . . . . . . . . . . . . . . . 85,038 1,595 Norwegian Finans Holding ASA . . . . 17,960 5,186 Odfjell Drilling, Ltd.* . . . . . . . . . . . . . 14,419 4,229 Orkla ASA . . . . . . . . . . . . . . . . . . . . . 43,075 10,139 PGS ASA* . . . . . . . . . . . . . . . . . . . . . 5,334 1,686 Protector Forsikring ASA . . . . . . . . . . 16,194 397 Salmar ASA . . . . . . . . . . . . . . . . . . . . 26,337 1,776 Sbanken ASA# . . . . . . . . . . . . . . . . . . 22,112 1,104 Scatec ASA# . . . . . . . . . . . . . . . . . . . . 29,234 404 Schibsted ASA, Class B . . . . . . . . . . . 16,826 1,199 SpareBank 1 SR-Bank ASA . . . . . . . . 15,833 4,353 Storebrand ASA . . . . . . . . . . . . . . . . . 39,434 2,103 Subsea 7 SA . . . . . . . . . . . . . . . . . . . . 20,189 4,815 Telenor ASA . . . . . . . . . . . . . . . . . . . . 81,143 1,294 TGS ASA . . . . . . . . . . . . . . . . . . . . . . 16,494 888 TOMRA Systems ASA . . . . . . . . . . . . 48,989 1,273 Veidekke ASA . . . . . . . . . . . . . . . . . . . 17,032 1,410 Yara International ASA . . . . . . . . . . . . 74,216
1,386,113
Portugal—0.1% 3,185 Altri SGPS SA . . . . . . . . . . . . . . . . . . 19,789 2,841 CTT-Correios de Portugal SA . . . . . . . 16,237 932 EDP Renovaveis SA . . . . . . . . . . . . . . 21,594 18,638 Energias de Portugal SA . . . . . . . . . . . 98,787 6,892 Galp Energia SGPS SA . . . . . . . . . . . 74,792 1,861 Jeronimo Martins SGPS SA . . . . . . . . 33,939 5,953 Navigator Co. SA (The)† . . . . . . . . . . 20,343 3,482 NOS SGPS SA . . . . . . . . . . . . . . . . . . 12,205
Portugal (Continued) 10,709 Redes Energeticas Nacionais
SGPS SA . . . . . . . . . . . . . . . . . . . . . $ 29,714 20,529 Sonae SGPS SA . . . . . . . . . . . . . . . . . 19,474
346,874
Singapore—0.6% 35,700 Accordia Golf Trust§ . . . . . . . . . . . . . 565 23,500 Ascendas India Trust . . . . . . . . . . . . . . 24,292 14,400 CapitaLand, Ltd. . . . . . . . . . . . . . . . . . 39,729 3,400 City Developments, Ltd. . . . . . . . . . . . 18,432 23,400 ComfortDelGro Corp., Ltd. . . . . . . . . 28,539 3,900 Dairy Farm International
Holdings, Ltd. . . . . . . . . . . . . . . . . . 16,536 10,322 DBS Group Holdings, Ltd. . . . . . . . . . 228,823 18,300 First Resources, Ltd. . . . . . . . . . . . . . . 18,236 132,400 Golden Agri-Resources, Ltd. . . . . . . . 22,646 100 Great Eastern Holdings, Ltd. . . . . . . . 1,655 11,200 GuocoLand, Ltd. . . . . . . . . . . . . . . . . . 13,326 1,300 Haw Par Corp., Ltd. . . . . . . . . . . . . . . 13,245 5,500 Hongkong Land Holdings, Ltd. . . . . . 26,180 1,000 Jardine Cycle & Carriage, Ltd. . . . . . . 15,885 9,600 Keppel Corp., Ltd. . . . . . . . . . . . . . . . 39,051 57,577 Keppel Infrastructure Trust . . . . . . . . . 23,764 14,800 NetLink NBN Trust . . . . . . . . . . . . . . 10,456 21,139 Oversea-Chinese Banking
Corp., Ltd. . . . . . . . . . . . . . . . . . . . . 187,857 3,200 SATS, Ltd.* . . . . . . . . . . . . . . . . . . . . 9,352 10,100 Sembcorp Industries, Ltd. . . . . . . . . . . 16,073 160,601 Sembcorp Marine, Ltd.*,† . . . . . . . . . 14,332 19,200 Sheng Siong Group, Ltd. . . . . . . . . . . 22,560 9,299 Singapore Airlines, Ltd.* . . . . . . . . . . 33,539 5,400 Singapore Exchange, Ltd. . . . . . . . . . . 44,896 32,900 Singapore Post, Ltd. . . . . . . . . . . . . . . 17,493 33,100 Singapore Press Holdings, Ltd.† . . . . 42,092 8,200 Singapore Technologies
Engineering, Ltd. . . . . . . . . . . . . . . . 23,599 35,400 Singapore Telecommunications, Ltd. . . 60,286 8,100 United Overseas Bank, Ltd. . . . . . . . . 155,531 6,300 UOL Group, Ltd. . . . . . . . . . . . . . . . . 34,201 1,800 Venture Corp., Ltd. . . . . . . . . . . . . . . . 25,714 9,500 Wilmar International, Ltd. . . . . . . . . . 31,791 15,000 Wing Tai Holdings, Ltd. . . . . . . . . . . . 20,079 29,500 Yangzijiang Shipbuilding
Holdings, Ltd. . . . . . . . . . . . . . . . . . 30,933
1,311,688
Value Shares (Note 1)
Value Shares (Note 1)
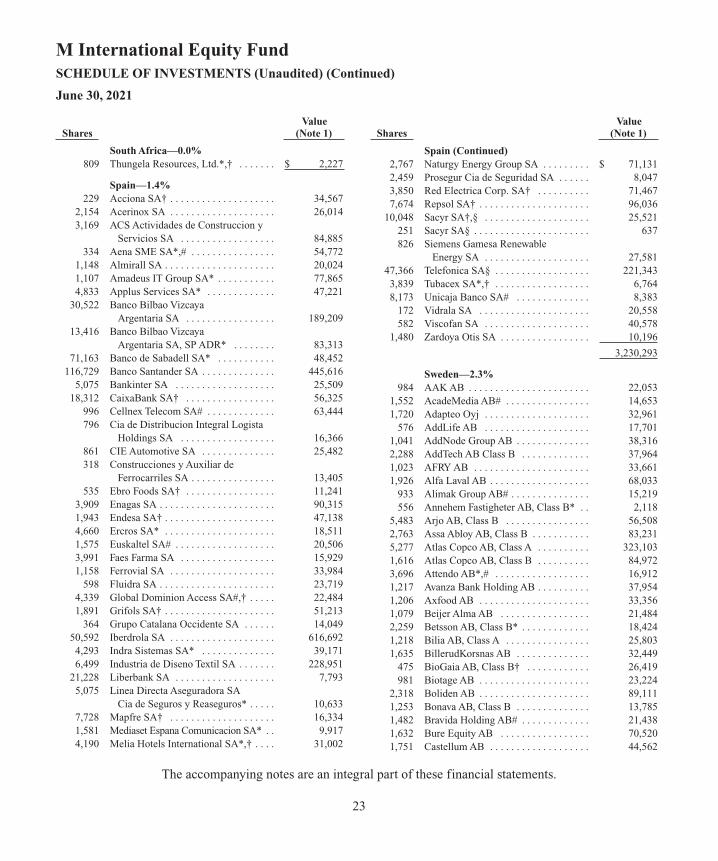
The accompanying notes are an integral part of these financial statements.
23
M International Equity FundSCHEDULE OF INVESTMENTS (Unaudited) (Continued)
June 30, 2021
South Africa—0.0% 809 Thungela Resources, Ltd.*,† . . . . . . . $ 2,227
Spain—1.4% 229 Acciona SA† . . . . . . . . . . . . . . . . . . . . 34,567 2,154 Acerinox SA . . . . . . . . . . . . . . . . . . . . 26,014 3,169 ACS Actividades de Construccion y
Servicios SA . . . . . . . . . . . . . . . . . . 84,885 334 Aena SME SA*,# . . . . . . . . . . . . . . . . 54,772 1,148 Almirall SA . . . . . . . . . . . . . . . . . . . . . 20,024 1,107 Amadeus IT Group SA* . . . . . . . . . . . 77,865 4,833 Applus Services SA* . . . . . . . . . . . . . 47,221 30,522 Banco Bilbao Vizcaya
Argentaria SA . . . . . . . . . . . . . . . . . 189,209 13,416 Banco Bilbao Vizcaya
Argentaria SA, SP ADR* . . . . . . . . 83,313 71,163 Banco de Sabadell SA* . . . . . . . . . . . 48,452 116,729 Banco Santander SA . . . . . . . . . . . . . . 445,616 5,075 Bankinter SA . . . . . . . . . . . . . . . . . . . 25,509 18,312 CaixaBank SA† . . . . . . . . . . . . . . . . . 56,325 996 Cellnex Telecom SA# . . . . . . . . . . . . . 63,444 796 Cia de Distribucion Integral Logista
Holdings SA . . . . . . . . . . . . . . . . . . 16,366 861 CIE Automotive SA . . . . . . . . . . . . . . 25,482 318 Construcciones y Auxiliar de
Ferrocarriles SA . . . . . . . . . . . . . . . . 13,405 535 Ebro Foods SA† . . . . . . . . . . . . . . . . . 11,241 3,909 Enagas SA . . . . . . . . . . . . . . . . . . . . . . 90,315 1,943 Endesa SA† . . . . . . . . . . . . . . . . . . . . . 47,138 4,660 Ercros SA* . . . . . . . . . . . . . . . . . . . . . 18,511 1,575 Euskaltel SA# . . . . . . . . . . . . . . . . . . . 20,506 3,991 Faes Farma SA . . . . . . . . . . . . . . . . . . 15,929 1,158 Ferrovial SA . . . . . . . . . . . . . . . . . . . . 33,984 598 Fluidra SA . . . . . . . . . . . . . . . . . . . . . . 23,719 4,339 Global Dominion Access SA#,† . . . . . 22,484 1,891 Grifols SA† . . . . . . . . . . . . . . . . . . . . . 51,213 364 Grupo Catalana Occidente SA . . . . . . 14,049 50,592 Iberdrola SA . . . . . . . . . . . . . . . . . . . . 616,692 4,293 Indra Sistemas SA* . . . . . . . . . . . . . . 39,171 6,499 Industria de Diseno Textil SA . . . . . . . 228,951 21,228 Liberbank SA . . . . . . . . . . . . . . . . . . . 7,793 5,075 Linea Directa Aseguradora SA
Cia de Seguros y Reaseguros* . . . . . 10,633 7,728 Mapfre SA† . . . . . . . . . . . . . . . . . . . . 16,334 1,581 Mediaset Espana Comunicacion SA* . . 9,917 4,190 Melia Hotels International SA*,† . . . . 31,002
Spain (Continued) 2,767 Naturgy Energy Group SA . . . . . . . . . $ 71,131 2,459 Prosegur Cia de Seguridad SA . . . . . . 8,047 3,850 Red Electrica Corp. SA† . . . . . . . . . . 71,467 7,674 Repsol SA† . . . . . . . . . . . . . . . . . . . . . 96,036 10,048 Sacyr SA†,§ . . . . . . . . . . . . . . . . . . . . 25,521 251 Sacyr SA§ . . . . . . . . . . . . . . . . . . . . . . 637 826 Siemens Gamesa Renewable
Energy SA . . . . . . . . . . . . . . . . . . . . 27,581 47,366 Telefonica SA§ . . . . . . . . . . . . . . . . . . 221,343 3,839 Tubacex SA*,† . . . . . . . . . . . . . . . . . . 6,764 8,173 Unicaja Banco SA# . . . . . . . . . . . . . . 8,383 172 Vidrala SA . . . . . . . . . . . . . . . . . . . . . 20,558 582 Viscofan SA . . . . . . . . . . . . . . . . . . . . 40,578 1,480 Zardoya Otis SA . . . . . . . . . . . . . . . . . 10,196
3,230,293
Sweden—2.3% 984 AAK AB . . . . . . . . . . . . . . . . . . . . . . . 22,053 1,552 AcadeMedia AB# . . . . . . . . . . . . . . . . 14,653 1,720 Adapteo Oyj . . . . . . . . . . . . . . . . . . . . 32,961 576 AddLife AB . . . . . . . . . . . . . . . . . . . . 17,701 1,041 AddNode Group AB . . . . . . . . . . . . . . 38,316 2,288 AddTech AB Class B . . . . . . . . . . . . . 37,964 1,023 AFRY AB . . . . . . . . . . . . . . . . . . . . . . 33,661 1,926 Alfa Laval AB . . . . . . . . . . . . . . . . . . . 68,033 933 Alimak Group AB# . . . . . . . . . . . . . . . 15,219 556 Annehem Fastigheter AB, Class B* . . 2,118 5,483 Arjo AB, Class B . . . . . . . . . . . . . . . . 56,508 2,763 Assa Abloy AB, Class B . . . . . . . . . . . 83,231 5,277 Atlas Copco AB, Class A . . . . . . . . . . 323,103 1,616 Atlas Copco AB, Class B . . . . . . . . . . 84,972 3,696 Attendo AB*,# . . . . . . . . . . . . . . . . . . 16,912 1,217 Avanza Bank Holding AB . . . . . . . . . . 37,954 1,206 Axfood AB . . . . . . . . . . . . . . . . . . . . . 33,356 1,079 Beijer Alma AB . . . . . . . . . . . . . . . . . 21,484 2,259 Betsson AB, Class B* . . . . . . . . . . . . . 18,424 1,218 Bilia AB, Class A . . . . . . . . . . . . . . . . 25,803 1,635 BillerudKorsnas AB . . . . . . . . . . . . . . 32,449 475 BioGaia AB, Class B† . . . . . . . . . . . . 26,419 981 Biotage AB . . . . . . . . . . . . . . . . . . . . . 23,224 2,318 Boliden AB . . . . . . . . . . . . . . . . . . . . . 89,111 1,253 Bonava AB, Class B . . . . . . . . . . . . . . 13,785 1,482 Bravida Holding AB# . . . . . . . . . . . . . 21,438 1,632 Bure Equity AB . . . . . . . . . . . . . . . . . 70,520 1,751 Castellum AB . . . . . . . . . . . . . . . . . . . 44,562
Value Shares (Note 1)
Value Shares (Note 1)
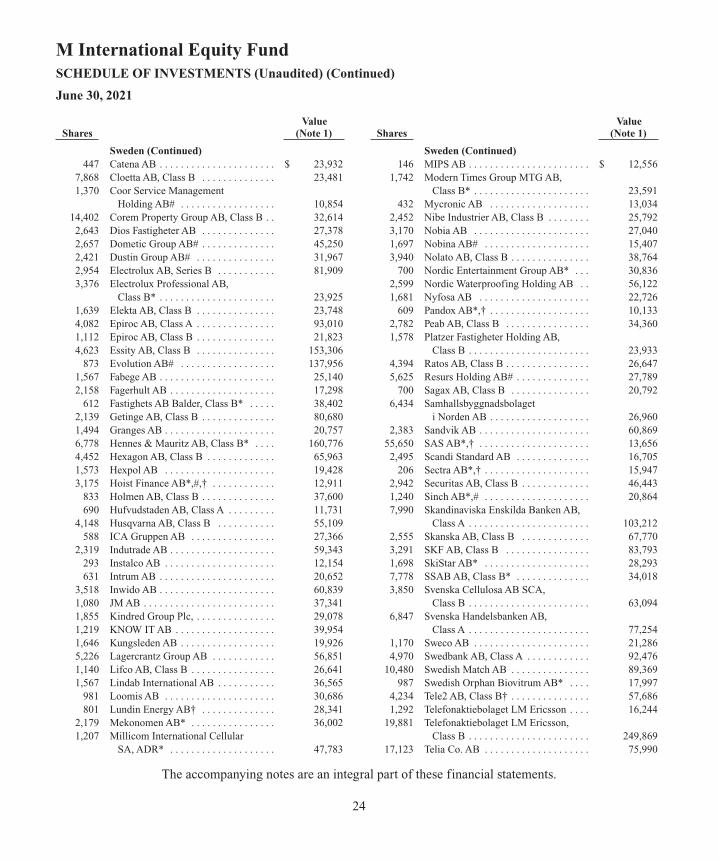
The accompanying notes are an integral part of these financial statements.
24
M International Equity FundSCHEDULE OF INVESTMENTS (Unaudited) (Continued)
June 30, 2021
Sweden (Continued) 447 Catena AB . . . . . . . . . . . . . . . . . . . . . . $ 23,932 7,868 Cloetta AB, Class B . . . . . . . . . . . . . . 23,481 1,370 Coor Service Management
Holding AB# . . . . . . . . . . . . . . . . . . 10,854 14,402 Corem Property Group AB, Class B . . 32,614 2,643 Dios Fastigheter AB . . . . . . . . . . . . . . 27,378 2,657 Dometic Group AB# . . . . . . . . . . . . . . 45,250 2,421 Dustin Group AB# . . . . . . . . . . . . . . . 31,967 2,954 Electrolux AB, Series B . . . . . . . . . . . 81,909 3,376 Electrolux Professional AB,
Class B* . . . . . . . . . . . . . . . . . . . . . . 23,925 1,639 Elekta AB, Class B . . . . . . . . . . . . . . . 23,748 4,082 Epiroc AB, Class A . . . . . . . . . . . . . . . 93,010 1,112 Epiroc AB, Class B . . . . . . . . . . . . . . . 21,823 4,623 Essity AB, Class B . . . . . . . . . . . . . . . 153,306 873 Evolution AB# . . . . . . . . . . . . . . . . . . 137,956 1,567 Fabege AB . . . . . . . . . . . . . . . . . . . . . . 25,140 2,158 Fagerhult AB . . . . . . . . . . . . . . . . . . . . 17,298 612 Fastighets AB Balder, Class B* . . . . . 38,402 2,139 Getinge AB, Class B . . . . . . . . . . . . . . 80,680 1,494 Granges AB . . . . . . . . . . . . . . . . . . . . . 20,757 6,778 Hennes & Mauritz AB, Class B* . . . . 160,776 4,452 Hexagon AB, Class B . . . . . . . . . . . . . 65,963 1,573 Hexpol AB . . . . . . . . . . . . . . . . . . . . . 19,428 3,175 Hoist Finance AB*,#,† . . . . . . . . . . . . 12,911 833 Holmen AB, Class B . . . . . . . . . . . . . . 37,600 690 Hufvudstaden AB, Class A . . . . . . . . . 11,731 4,148 Husqvarna AB, Class B . . . . . . . . . . . 55,109 588 ICA Gruppen AB . . . . . . . . . . . . . . . . 27,366 2,319 Indutrade AB . . . . . . . . . . . . . . . . . . . . 59,343 293 Instalco AB . . . . . . . . . . . . . . . . . . . . . 12,154 631 Intrum AB . . . . . . . . . . . . . . . . . . . . . . 20,652 3,518 Inwido AB . . . . . . . . . . . . . . . . . . . . . . 60,839 1,080 JM AB . . . . . . . . . . . . . . . . . . . . . . . . . 37,341 1,855 Kindred Group Plc, . . . . . . . . . . . . . . . 29,078 1,219 KNOW IT AB . . . . . . . . . . . . . . . . . . . 39,954 1,646 Kungsleden AB . . . . . . . . . . . . . . . . . . 19,926 5,226 Lagercrantz Group AB . . . . . . . . . . . . 56,851 1,140 Lifco AB, Class B . . . . . . . . . . . . . . . . 26,641 1,567 Lindab International AB . . . . . . . . . . . 36,565 981 Loomis AB . . . . . . . . . . . . . . . . . . . . . 30,686 801 Lundin Energy AB† . . . . . . . . . . . . . . 28,341 2,179 Mekonomen AB* . . . . . . . . . . . . . . . . 36,002 1,207 Millicom International Cellular
SA, ADR* . . . . . . . . . . . . . . . . . . . . 47,783
Sweden (Continued) 146 MIPS AB . . . . . . . . . . . . . . . . . . . . . . . $ 12,556 1,742 Modern Times Group MTG AB,
Class B* . . . . . . . . . . . . . . . . . . . . . . 23,591 432 Mycronic AB . . . . . . . . . . . . . . . . . . . 13,034 2,452 Nibe Industrier AB, Class B . . . . . . . . 25,792 3,170 Nobia AB . . . . . . . . . . . . . . . . . . . . . . 27,040 1,697 Nobina AB# . . . . . . . . . . . . . . . . . . . . 15,407 3,940 Nolato AB, Class B . . . . . . . . . . . . . . . 38,764 700 Nordic Entertainment Group AB* . . . 30,836 2,599 Nordic Waterproofing Holding AB . . 56,122 1,681 Nyfosa AB . . . . . . . . . . . . . . . . . . . . . 22,726 609 Pandox AB*,† . . . . . . . . . . . . . . . . . . . 10,133 2,782 Peab AB, Class B . . . . . . . . . . . . . . . . 34,360 1,578 Platzer Fastigheter Holding AB,
Class B . . . . . . . . . . . . . . . . . . . . . . . 23,933 4,394 Ratos AB, Class B . . . . . . . . . . . . . . . . 26,647 5,625 Resurs Holding AB# . . . . . . . . . . . . . . 27,789 700 Sagax AB, Class B . . . . . . . . . . . . . . . 20,792 6,434 Samhallsbyggnadsbolaget
i Norden AB . . . . . . . . . . . . . . . . . . . 26,960 2,383 Sandvik AB . . . . . . . . . . . . . . . . . . . . . 60,869 55,650 SAS AB*,† . . . . . . . . . . . . . . . . . . . . . 13,656 2,495 Scandi Standard AB . . . . . . . . . . . . . . 16,705 206 Sectra AB*,† . . . . . . . . . . . . . . . . . . . . 15,947 2,942 Securitas AB, Class B . . . . . . . . . . . . . 46,443 1,240 Sinch AB*,# . . . . . . . . . . . . . . . . . . . . 20,864 7,990 Skandinaviska Enskilda Banken AB,
Class A . . . . . . . . . . . . . . . . . . . . . . . 103,212 2,555 Skanska AB, Class B . . . . . . . . . . . . . 67,770 3,291 SKF AB, Class B . . . . . . . . . . . . . . . . 83,793 1,698 SkiStar AB* . . . . . . . . . . . . . . . . . . . . 28,293 7,778 SSAB AB, Class B* . . . . . . . . . . . . . . 34,018 3,850 Svenska Cellulosa AB SCA,
Class B . . . . . . . . . . . . . . . . . . . . . . . 63,094 6,847 Svenska Handelsbanken AB,
Class A . . . . . . . . . . . . . . . . . . . . . . . 77,254 1,170 Sweco AB . . . . . . . . . . . . . . . . . . . . . . 21,286 4,970 Swedbank AB, Class A . . . . . . . . . . . . 92,476 10,480 Swedish Match AB . . . . . . . . . . . . . . . 89,369 987 Swedish Orphan Biovitrum AB* . . . . 17,997 4,234 Tele2 AB, Class B† . . . . . . . . . . . . . . . 57,686 1,292 Telefonaktiebolaget LM Ericsson . . . . 16,244 19,881 Telefonaktiebolaget LM Ericsson,
Class B . . . . . . . . . . . . . . . . . . . . . . . 249,869 17,123 Telia Co. AB . . . . . . . . . . . . . . . . . . . . 75,990
Value Shares (Note 1)
Value Shares (Note 1)
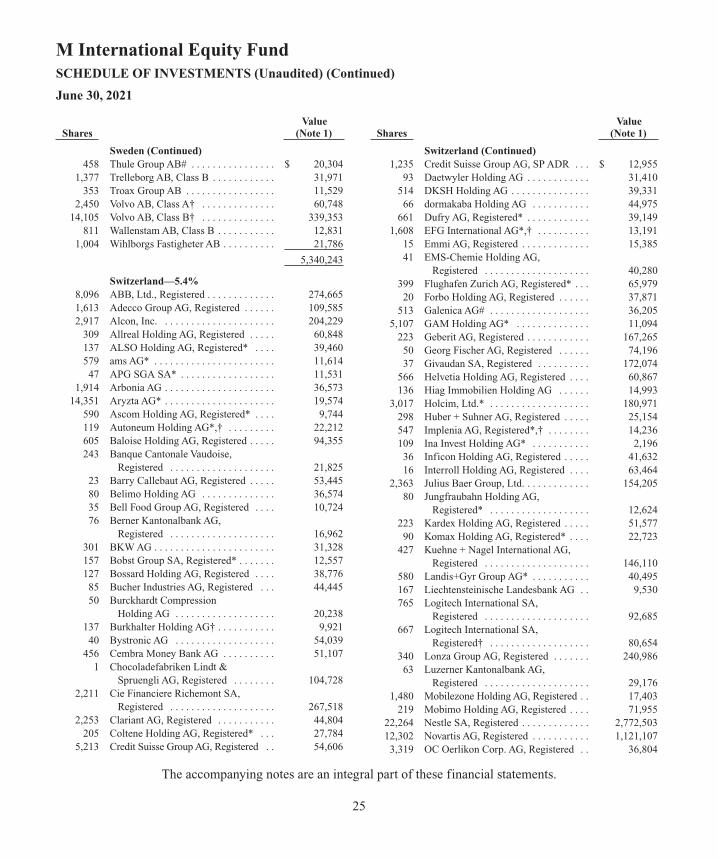
The accompanying notes are an integral part of these financial statements.
25
M International Equity FundSCHEDULE OF INVESTMENTS (Unaudited) (Continued)
June 30, 2021
Sweden (Continued) 458 Thule Group AB# . . . . . . . . . . . . . . . . $ 20,304 1,377 Trelleborg AB, Class B . . . . . . . . . . . . 31,971 353 Troax Group AB . . . . . . . . . . . . . . . . . 11,529 2,450 Volvo AB, Class A† . . . . . . . . . . . . . . 60,748 14,105 Volvo AB, Class B† . . . . . . . . . . . . . . 339,353 811 Wallenstam AB, Class B . . . . . . . . . . . 12,831 1,004 Wihlborgs Fastigheter AB . . . . . . . . . . 21,786
5,340,243
Switzerland—5.4% 8,096 ABB, Ltd., Registered . . . . . . . . . . . . . 274,665 1,613 Adecco Group AG, Registered . . . . . . 109,585 2,917 Alcon, Inc. . . . . . . . . . . . . . . . . . . . . . 204,229 309 Allreal Holding AG, Registered . . . . . 60,848 137 ALSO Holding AG, Registered* . . . . 39,460 579 ams AG* . . . . . . . . . . . . . . . . . . . . . . . 11,614 47 APG SGA SA* . . . . . . . . . . . . . . . . . . 11,531 1,914 Arbonia AG . . . . . . . . . . . . . . . . . . . . . 36,573 14,351 Aryzta AG* . . . . . . . . . . . . . . . . . . . . . 19,574 590 Ascom Holding AG, Registered* . . . . 9,744 119 Autoneum Holding AG*,† . . . . . . . . . 22,212 605 Baloise Holding AG, Registered . . . . . 94,355 243 Banque Cantonale Vaudoise,
Registered . . . . . . . . . . . . . . . . . . . . 21,825 23 Barry Callebaut AG, Registered . . . . . 53,445 80 Belimo Holding AG . . . . . . . . . . . . . . 36,574 35 Bell Food Group AG, Registered . . . . 10,724 76 Berner Kantonalbank AG,
Registered . . . . . . . . . . . . . . . . . . . . 16,962 301 BKW AG . . . . . . . . . . . . . . . . . . . . . . . 31,328 157 Bobst Group SA, Registered* . . . . . . . 12,557 127 Bossard Holding AG, Registered . . . . 38,776 85 Bucher Industries AG, Registered . . . 44,445 50 Burckhardt Compression
Holding AG . . . . . . . . . . . . . . . . . . . 20,238 137 Burkhalter Holding AG† . . . . . . . . . . . 9,921 40 Bystronic AG . . . . . . . . . . . . . . . . . . . 54,039 456 Cembra Money Bank AG . . . . . . . . . . 51,107 1 Chocoladefabriken Lindt &
Spruengli AG, Registered . . . . . . . . 104,728 2,211 Cie Financiere Richemont SA,
Registered . . . . . . . . . . . . . . . . . . . . 267,518 2,253 Clariant AG, Registered . . . . . . . . . . . 44,804 205 Coltene Holding AG, Registered* . . . 27,784 5,213 Credit Suisse Group AG, Registered . . 54,606
Switzerland (Continued) 1,235 Credit Suisse Group AG, SP ADR . . . $ 12,955 93 Daetwyler Holding AG . . . . . . . . . . . . 31,410 514 DKSH Holding AG . . . . . . . . . . . . . . . 39,331 66 dormakaba Holding AG . . . . . . . . . . . 44,975 661 Dufry AG, Registered* . . . . . . . . . . . . 39,149 1,608 EFG International AG*,† . . . . . . . . . . 13,191 15 Emmi AG, Registered . . . . . . . . . . . . . 15,385 41 EMS-Chemie Holding AG,
Registered . . . . . . . . . . . . . . . . . . . . 40,280 399 Flughafen Zurich AG, Registered* . . . 65,979 20 Forbo Holding AG, Registered . . . . . . 37,871 513 Galenica AG# . . . . . . . . . . . . . . . . . . . 36,205 5,107 GAM Holding AG* . . . . . . . . . . . . . . 11,094 223 Geberit AG, Registered . . . . . . . . . . . . 167,265 50 Georg Fischer AG, Registered . . . . . . 74,196 37 Givaudan SA, Registered . . . . . . . . . . 172,074 566 Helvetia Holding AG, Registered . . . . 60,867 136 Hiag Immobilien Holding AG . . . . . . 14,993 3,017 Holcim, Ltd.* . . . . . . . . . . . . . . . . . . . 180,971 298 Huber + Suhner AG, Registered . . . . . 25,154 547 Implenia AG, Registered*,† . . . . . . . . 14,236 109 Ina Invest Holding AG* . . . . . . . . . . . 2,196 36 Inficon Holding AG, Registered . . . . . 41,632 16 Interroll Holding AG, Registered . . . . 63,464 2,363 Julius Baer Group, Ltd. . . . . . . . . . . . . 154,205 80 Jungfraubahn Holding AG,
Registered* . . . . . . . . . . . . . . . . . . . 12,624 223 Kardex Holding AG, Registered . . . . . 51,577 90 Komax Holding AG, Registered* . . . . 22,723 427 Kuehne + Nagel International AG,
Registered . . . . . . . . . . . . . . . . . . . . 146,110 580 Landis+Gyr Group AG* . . . . . . . . . . . 40,495 167 Liechtensteinische Landesbank AG . . 9,530 765 Logitech International SA,
Registered . . . . . . . . . . . . . . . . . . . . 92,685 667 Logitech International SA,
Registered† . . . . . . . . . . . . . . . . . . . 80,654 340 Lonza Group AG, Registered . . . . . . . 240,986 63 Luzerner Kantonalbank AG,
Registered . . . . . . . . . . . . . . . . . . . . 29,176 1,480 Mobilezone Holding AG, Registered . . 17,403 219 Mobimo Holding AG, Registered . . . . 71,955 22,264 Nestle SA, Registered . . . . . . . . . . . . . 2,772,503 12,302 Novartis AG, Registered . . . . . . . . . . . 1,121,107 3,319 OC Oerlikon Corp. AG, Registered . . 36,804
Value Shares (Note 1)
Value Shares (Note 1)

The accompanying notes are an integral part of these financial statements.
26
M International Equity FundSCHEDULE OF INVESTMENTS (Unaudited) (Continued)
June 30, 2021
Switzerland (Continued) 136 Orior AG . . . . . . . . . . . . . . . . . . . . . . . $ 12,288 124 Partners Group Holding AG . . . . . . . . 187,826 699 PSP Swiss Property AG, Registered . . 88,768 78 Rieter Holding AG, Registered* . . . . . 15,242 5,133 Roche Holding AG . . . . . . . . . . . . . . . 1,939,567 140 Schindler Holding AG, Registered . . . 40,914 25 Schweiter Technologies AG . . . . . . . . 36,639 123 SFS Group AG . . . . . . . . . . . . . . . . . . 17,694 32 SGS SA, Registered . . . . . . . . . . . . . . 98,706 97 Siegfried Holding AG, Registered* . . 90,946 1,237 SIG Combibloc Group AG* . . . . . . . . 33,611 910 Sika AG, Registered . . . . . . . . . . . . . . 297,514 373 Softwareone Holding AG . . . . . . . . . . 8,808 326 Sonova Holding AG, Registered . . . . . 122,613 88 St. Galler Kantonalbank AG,
Registered . . . . . . . . . . . . . . . . . . . . 39,090 52 Straumann Holding AG, Registered . . 82,897 636 Sulzer AG, Registered . . . . . . . . . . . . . 87,847 225 Swatch Group AG (The) . . . . . . . . . . . 77,185 384 Swatch Group AG (The), Registered . . 25,337 253 Swiss Life Holding AG, Registered . . 122,938 1,182 Swiss Prime Site AG, Registered . . . . 117,274 1,421 Swiss Re AG . . . . . . . . . . . . . . . . . . . . 128,209 379 Swisscom AG, Registered . . . . . . . . . . 216,361 247 Swissquote Group Holding SA,
Registered . . . . . . . . . . . . . . . . . . . . 37,320 40 Tecan Group AG, Registered . . . . . . . 19,817 634 Temenos AG, Registered . . . . . . . . . . . 101,824 276 u-blox Holding AG† . . . . . . . . . . . . . . 20,284 11,952 UBS Group AG, Registered . . . . . . . . 182,913 94 Valora Holding AG, Registered* . . . . 19,770 228 VAT Group AG# . . . . . . . . . . . . . . . . . 75,799 400 Vetropack Holding AG, Registered . . 24,123 451 Vifor Pharma AG . . . . . . . . . . . . . . . . 58,370 706 Vontobel Holding AG, Registered . . . 55,015 77 VP Bank AG, Class A . . . . . . . . . . . . . 9,238 828 Zurich Insurance Group AG . . . . . . . . 332,184
12,726,112
United Kingdom—9.3% 4,994 3i Group Plc . . . . . . . . . . . . . . . . . . . . 81,033 217 4imprint Group Plc* . . . . . . . . . . . . . . 8,030 2,172 888 Holdings Plc . . . . . . . . . . . . . . . . 11,531 917 Admiral Group Plc . . . . . . . . . . . . . . . 39,881 7,159 Aggreko Plc . . . . . . . . . . . . . . . . . . . . 85,364
United Kingdom (Continued) 12,432 Alliance Pharma Plc . . . . . . . . . . . . . . $ 17,060 8,094 Anglo American Plc . . . . . . . . . . . . . . 321,617 5,917 Anglo Pacific Group Plc† . . . . . . . . . . 11,377 2,896 Antofagasta Plc . . . . . . . . . . . . . . . . . . 57,507 4,535 Ascential Plc* . . . . . . . . . . . . . . . . . . . 26,097 3,862 Ashtead Group Plc . . . . . . . . . . . . . . . 286,561 355 ASOS Plc* . . . . . . . . . . . . . . . . . . . . . 24,357 2,639 Associated British Foods Plc . . . . . . . 80,896 7,325 AstraZeneca Plc . . . . . . . . . . . . . . . . . 879,820 8,970 Auto Trader Group Plc*,# . . . . . . . . . . 78,594 3,592 Avast Plc# . . . . . . . . . . . . . . . . . . . . . . 24,337 26,339 Aviva Plc . . . . . . . . . . . . . . . . . . . . . . . 147,889 835 Avon Rubber Plc . . . . . . . . . . . . . . . . . 30,216 12,786 B&M European Value Retail SA† . . . 101,381 5,299 Babcock International Group Plc*,† . . 21,257 22,654 BAE Systems Plc . . . . . . . . . . . . . . . . 163,581 9,792 Balfour Beatty Plc . . . . . . . . . . . . . . . 41,530 617 Bank of Georgia Group Plc* . . . . . . . 11,471 81,962 Barclays Plc . . . . . . . . . . . . . . . . . . . . 194,012 5,771 Barratt Developments Plc . . . . . . . . . . 55,498 3,269 Beazley Plc* . . . . . . . . . . . . . . . . . . . . 15,031 1,766 Bellway Plc . . . . . . . . . . . . . . . . . . . . . 79,150 735 Berkeley Group Holdings Plc (The) . . 46,719 12,902 BHP Group Plc . . . . . . . . . . . . . . . . . . 380,148 4,891 Biffa Plc*,# . . . . . . . . . . . . . . . . . . . . . 21,989 1,176 Bodycote Plc . . . . . . . . . . . . . . . . . . . . 13,771 8,370 boohoo Group Plc* . . . . . . . . . . . . . . . 35,939 162,950 BP Plc . . . . . . . . . . . . . . . . . . . . . . . . . 710,037 8,187 Brewin Dolphin Holdings Plc . . . . . . . 39,355 9,634 British American Tobacco Plc . . . . . . 373,148 589 British American Tobacco Plc,
SP ADR . . . . . . . . . . . . . . . . . . . . . . 23,154 4,032 Britvic Plc . . . . . . . . . . . . . . . . . . . . . . 52,261 105,509 BT Group Plc* . . . . . . . . . . . . . . . . . . 283,144 3,731 Bunzl Plc . . . . . . . . . . . . . . . . . . . . . . . 123,298 2,743 Burberry Group Plc* . . . . . . . . . . . . . 78,392 4,834 Burford Capital, Ltd. . . . . . . . . . . . . . 49,750 4,589 C&C Group Plc* . . . . . . . . . . . . . . . . 15,426 11,065 Cairn Energy Plc . . . . . . . . . . . . . . . . . 22,301 40,000 Capita Plc* . . . . . . . . . . . . . . . . . . . . . 20,644 7,460 Card Factory Plc* . . . . . . . . . . . . . . . . 6,470 510 Carnival Plc* . . . . . . . . . . . . . . . . . . . 11,717 21,596 Centamin Plc . . . . . . . . . . . . . . . . . . . . 30,232 6,675 Central Asia Metals Plc . . . . . . . . . . . 21,976 77,567 Centrica Plc* . . . . . . . . . . . . . . . . . . . . 55,216
Value Shares (Note 1)
Value Shares (Note 1)
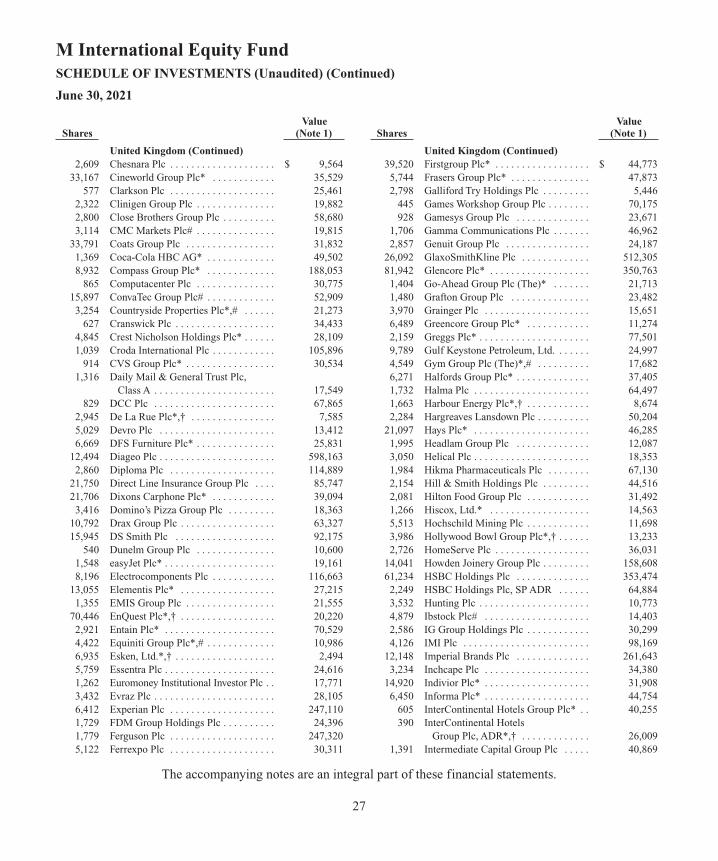
The accompanying notes are an integral part of these financial statements.
27
M International Equity FundSCHEDULE OF INVESTMENTS (Unaudited) (Continued)
June 30, 2021
United Kingdom (Continued) 2,609 Chesnara Plc . . . . . . . . . . . . . . . . . . . . $ 9,564 33,167 Cineworld Group Plc* . . . . . . . . . . . . 35,529 577 Clarkson Plc . . . . . . . . . . . . . . . . . . . . 25,461 2,322 Clinigen Group Plc . . . . . . . . . . . . . . . 19,882 2,800 Close Brothers Group Plc . . . . . . . . . . 58,680 3,114 CMC Markets Plc# . . . . . . . . . . . . . . . 19,815 33,791 Coats Group Plc . . . . . . . . . . . . . . . . . 31,832 1,369 Coca-Cola HBC AG* . . . . . . . . . . . . . 49,502 8,932 Compass Group Plc* . . . . . . . . . . . . . 188,053 865 Computacenter Plc . . . . . . . . . . . . . . . 30,775 15,897 ConvaTec Group Plc# . . . . . . . . . . . . . 52,909 3,254 Countryside Properties Plc*,# . . . . . . 21,273 627 Cranswick Plc . . . . . . . . . . . . . . . . . . . 34,433 4,845 Crest Nicholson Holdings Plc* . . . . . . 28,109 1,039 Croda International Plc . . . . . . . . . . . . 105,896 914 CVS Group Plc* . . . . . . . . . . . . . . . . . 30,534 1,316 Daily Mail & General Trust Plc,
Class A . . . . . . . . . . . . . . . . . . . . . . . 17,549 829 DCC Plc . . . . . . . . . . . . . . . . . . . . . . . 67,865 2,945 De La Rue Plc*,† . . . . . . . . . . . . . . . . 7,585 5,029 Devro Plc . . . . . . . . . . . . . . . . . . . . . . 13,412 6,669 DFS Furniture Plc* . . . . . . . . . . . . . . . 25,831 12,494 Diageo Plc . . . . . . . . . . . . . . . . . . . . . . 598,163 2,860 Diploma Plc . . . . . . . . . . . . . . . . . . . . 114,889 21,750 Direct Line Insurance Group Plc . . . . 85,747 21,706 Dixons Carphone Plc* . . . . . . . . . . . . 39,094 3,416 Domino’s Pizza Group Plc . . . . . . . . . 18,363 10,792 Drax Group Plc . . . . . . . . . . . . . . . . . . 63,327 15,945 DS Smith Plc . . . . . . . . . . . . . . . . . . . 92,175 540 Dunelm Group Plc . . . . . . . . . . . . . . . 10,600 1,548 easyJet Plc* . . . . . . . . . . . . . . . . . . . . . 19,161 8,196 Electrocomponents Plc . . . . . . . . . . . . 116,663 13,055 Elementis Plc* . . . . . . . . . . . . . . . . . . 27,215 1,355 EMIS Group Plc . . . . . . . . . . . . . . . . . 21,555 70,446 EnQuest Plc*,† . . . . . . . . . . . . . . . . . . 20,220 2,921 Entain Plc* . . . . . . . . . . . . . . . . . . . . . 70,529 4,422 Equiniti Group Plc*,# . . . . . . . . . . . . . 10,986 6,935 Esken, Ltd.*,† . . . . . . . . . . . . . . . . . . . 2,494 5,759 Essentra Plc . . . . . . . . . . . . . . . . . . . . . 24,616 1,262 Euromoney Institutional Investor Plc . . 17,771 3,432 Evraz Plc . . . . . . . . . . . . . . . . . . . . . . . 28,105 6,412 Experian Plc . . . . . . . . . . . . . . . . . . . . 247,110 1,729 FDM Group Holdings Plc . . . . . . . . . . 24,396 1,779 Ferguson Plc . . . . . . . . . . . . . . . . . . . . 247,320 5,122 Ferrexpo Plc . . . . . . . . . . . . . . . . . . . . 30,311
United Kingdom (Continued) 39,520 Firstgroup Plc* . . . . . . . . . . . . . . . . . . $ 44,773 5,744 Frasers Group Plc* . . . . . . . . . . . . . . . 47,873 2,798 Galliford Try Holdings Plc . . . . . . . . . 5,446 445 Games Workshop Group Plc . . . . . . . . 70,175 928 Gamesys Group Plc . . . . . . . . . . . . . . 23,671 1,706 Gamma Communications Plc . . . . . . . 46,962 2,857 Genuit Group Plc . . . . . . . . . . . . . . . . 24,187 26,092 GlaxoSmithKline Plc . . . . . . . . . . . . . 512,305 81,942 Glencore Plc* . . . . . . . . . . . . . . . . . . . 350,763 1,404 Go-Ahead Group Plc (The)* . . . . . . . 21,713 1,480 Grafton Group Plc . . . . . . . . . . . . . . . 23,482 3,970 Grainger Plc . . . . . . . . . . . . . . . . . . . . 15,651 6,489 Greencore Group Plc* . . . . . . . . . . . . 11,274 2,159 Greggs Plc* . . . . . . . . . . . . . . . . . . . . . 77,501 9,789 Gulf Keystone Petroleum, Ltd. . . . . . . 24,997 4,549 Gym Group Plc (The)*,# . . . . . . . . . . 17,682 6,271 Halfords Group Plc* . . . . . . . . . . . . . . 37,405 1,732 Halma Plc . . . . . . . . . . . . . . . . . . . . . . 64,497 1,663 Harbour Energy Plc*,† . . . . . . . . . . . . 8,674 2,284 Hargreaves Lansdown Plc . . . . . . . . . . 50,204 21,097 Hays Plc* . . . . . . . . . . . . . . . . . . . . . . 46,285 1,995 Headlam Group Plc . . . . . . . . . . . . . . 12,087 3,050 Helical Plc . . . . . . . . . . . . . . . . . . . . . . 18,353 1,984 Hikma Pharmaceuticals Plc . . . . . . . . 67,130 2,154 Hill & Smith Holdings Plc . . . . . . . . . 44,516 2,081 Hilton Food Group Plc . . . . . . . . . . . . 31,492 1,266 Hiscox, Ltd.* . . . . . . . . . . . . . . . . . . . 14,563 5,513 Hochschild Mining Plc . . . . . . . . . . . . 11,698 3,986 Hollywood Bowl Group Plc*,† . . . . . . 13,233 2,726 HomeServe Plc . . . . . . . . . . . . . . . . . . 36,031 14,041 Howden Joinery Group Plc . . . . . . . . . 158,608 61,234 HSBC Holdings Plc . . . . . . . . . . . . . . 353,474 2,249 HSBC Holdings Plc, SP ADR . . . . . . 64,884 3,532 Hunting Plc . . . . . . . . . . . . . . . . . . . . . 10,773 4,879 Ibstock Plc# . . . . . . . . . . . . . . . . . . . . 14,403 2,586 IG Group Holdings Plc . . . . . . . . . . . . 30,299 4,126 IMI Plc . . . . . . . . . . . . . . . . . . . . . . . . 98,169 12,148 Imperial Brands Plc . . . . . . . . . . . . . . 261,643 3,234 Inchcape Plc . . . . . . . . . . . . . . . . . . . . 34,380 14,920 Indivior Plc* . . . . . . . . . . . . . . . . . . . . 31,908 6,450 Informa Plc* . . . . . . . . . . . . . . . . . . . . 44,754 605 InterContinental Hotels Group Plc* . . 40,255 390 InterContinental Hotels
Group Plc, ADR*,† . . . . . . . . . . . . . 26,009 1,391 Intermediate Capital Group Plc . . . . . 40,869
Value Shares (Note 1)
Value Shares (Note 1)
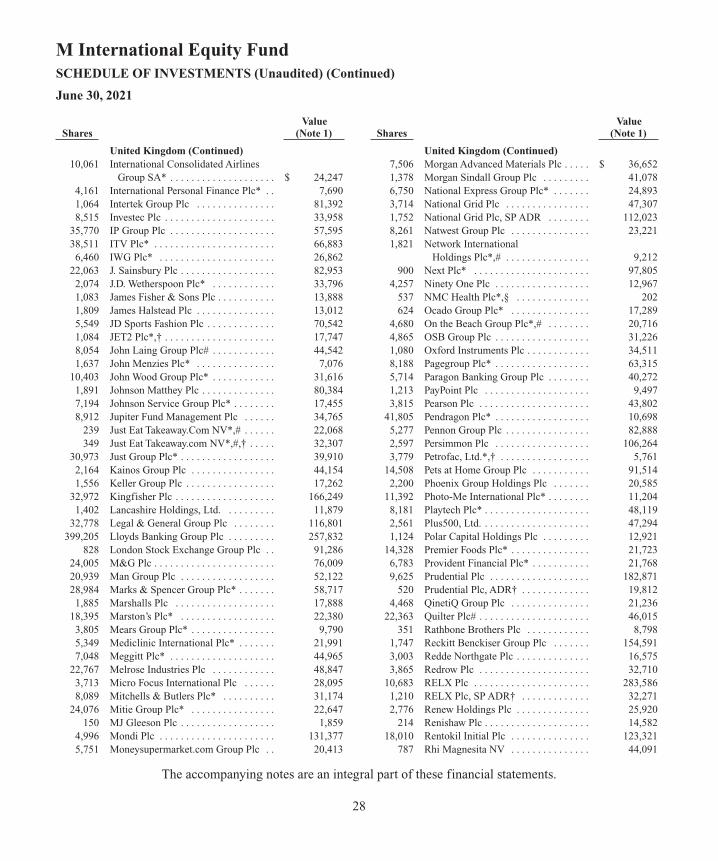
The accompanying notes are an integral part of these financial statements.
28
M International Equity FundSCHEDULE OF INVESTMENTS (Unaudited) (Continued)
June 30, 2021
United Kingdom (Continued) 10,061 International Consolidated Airlines
Group SA* . . . . . . . . . . . . . . . . . . . . $ 24,247 4,161 International Personal Finance Plc* . . 7,690 1,064 Intertek Group Plc . . . . . . . . . . . . . . . 81,392 8,515 Investec Plc . . . . . . . . . . . . . . . . . . . . . 33,958 35,770 IP Group Plc . . . . . . . . . . . . . . . . . . . . 57,595 38,511 ITV Plc* . . . . . . . . . . . . . . . . . . . . . . . 66,883 6,460 IWG Plc* . . . . . . . . . . . . . . . . . . . . . . 26,862 22,063 J. Sainsbury Plc . . . . . . . . . . . . . . . . . . 82,953 2,074 J.D. Wetherspoon Plc* . . . . . . . . . . . . 33,796 1,083 James Fisher & Sons Plc . . . . . . . . . . . 13,888 1,809 James Halstead Plc . . . . . . . . . . . . . . . 13,012 5,549 JD Sports Fashion Plc . . . . . . . . . . . . . 70,542 1,084 JET2 Plc*,† . . . . . . . . . . . . . . . . . . . . . 17,747 8,054 John Laing Group Plc# . . . . . . . . . . . . 44,542 1,637 John Menzies Plc* . . . . . . . . . . . . . . . 7,076 10,403 John Wood Group Plc* . . . . . . . . . . . . 31,616 1,891 Johnson Matthey Plc . . . . . . . . . . . . . . 80,384 7,194 Johnson Service Group Plc* . . . . . . . . 17,455 8,912 Jupiter Fund Management Plc . . . . . . 34,765 239 Just Eat Takeaway.Com NV*,# . . . . . . 22,068 349 Just Eat Takeaway.com NV*,#,† . . . . . 32,307 30,973 Just Group Plc* . . . . . . . . . . . . . . . . . . 39,910 2,164 Kainos Group Plc . . . . . . . . . . . . . . . . 44,154 1,556 Keller Group Plc . . . . . . . . . . . . . . . . . 17,262 32,972 Kingfisher Plc . . . . . . . . . . . . . . . . . . . 166,249 1,402 Lancashire Holdings, Ltd. . . . . . . . . . 11,879 32,778 Legal & General Group Plc . . . . . . . . 116,801 399,205 Lloyds Banking Group Plc . . . . . . . . . 257,832 828 London Stock Exchange Group Plc . . 91,286 24,005 M&G Plc . . . . . . . . . . . . . . . . . . . . . . . 76,009 20,939 Man Group Plc . . . . . . . . . . . . . . . . . . 52,122 28,984 Marks & Spencer Group Plc* . . . . . . . 58,717 1,885 Marshalls Plc . . . . . . . . . . . . . . . . . . . 17,888 18,395 Marston’s Plc* . . . . . . . . . . . . . . . . . . 22,380 3,805 Mears Group Plc* . . . . . . . . . . . . . . . . 9,790 5,349 Mediclinic International Plc* . . . . . . . 21,991 7,048 Meggitt Plc* . . . . . . . . . . . . . . . . . . . . 44,965 22,767 Melrose Industries Plc . . . . . . . . . . . . 48,847 3,713 Micro Focus International Plc . . . . . . 28,095 8,089 Mitchells & Butlers Plc* . . . . . . . . . . 31,174 24,076 Mitie Group Plc* . . . . . . . . . . . . . . . . 22,647 150 MJ Gleeson Plc . . . . . . . . . . . . . . . . . . 1,859 4,996 Mondi Plc . . . . . . . . . . . . . . . . . . . . . . 131,377 5,751 Moneysupermarket.com Group Plc . . 20,413
United Kingdom (Continued) 7,506 Morgan Advanced Materials Plc . . . . . $ 36,652 1,378 Morgan Sindall Group Plc . . . . . . . . . 41,078 6,750 National Express Group Plc* . . . . . . . 24,893 3,714 National Grid Plc . . . . . . . . . . . . . . . . 47,307 1,752 National Grid Plc, SP ADR . . . . . . . . 112,023 8,261 Natwest Group Plc . . . . . . . . . . . . . . . 23,221 1,821 Network International
Holdings Plc*,# . . . . . . . . . . . . . . . . 9,212 900 Next Plc* . . . . . . . . . . . . . . . . . . . . . . 97,805 4,257 Ninety One Plc . . . . . . . . . . . . . . . . . . 12,967 537 NMC Health Plc*,§ . . . . . . . . . . . . . . 202 624 Ocado Group Plc* . . . . . . . . . . . . . . . 17,289 4,680 On the Beach Group Plc*,# . . . . . . . . 20,716 4,865 OSB Group Plc . . . . . . . . . . . . . . . . . . 31,226 1,080 Oxford Instruments Plc . . . . . . . . . . . . 34,511 8,188 Pagegroup Plc* . . . . . . . . . . . . . . . . . . 63,315 5,714 Paragon Banking Group Plc . . . . . . . . 40,272 1,213 PayPoint Plc . . . . . . . . . . . . . . . . . . . . 9,497 3,815 Pearson Plc . . . . . . . . . . . . . . . . . . . . . 43,802 41,805 Pendragon Plc* . . . . . . . . . . . . . . . . . . 10,698 5,277 Pennon Group Plc . . . . . . . . . . . . . . . . 82,888 2,597 Persimmon Plc . . . . . . . . . . . . . . . . . . 106,264 3,779 Petrofac, Ltd.*,† . . . . . . . . . . . . . . . . . 5,761 14,508 Pets at Home Group Plc . . . . . . . . . . . 91,514 2,200 Phoenix Group Holdings Plc . . . . . . . 20,585 11,392 Photo-Me International Plc* . . . . . . . . 11,204 8,181 Playtech Plc* . . . . . . . . . . . . . . . . . . . . 48,119 2,561 Plus500, Ltd. . . . . . . . . . . . . . . . . . . . . 47,294 1,124 Polar Capital Holdings Plc . . . . . . . . . 12,921 14,328 Premier Foods Plc* . . . . . . . . . . . . . . . 21,723 6,783 Provident Financial Plc* . . . . . . . . . . . 21,768 9,625 Prudential Plc . . . . . . . . . . . . . . . . . . . 182,871 520 Prudential Plc, ADR† . . . . . . . . . . . . . 19,812 4,468 QinetiQ Group Plc . . . . . . . . . . . . . . . 21,236 22,363 Quilter Plc# . . . . . . . . . . . . . . . . . . . . . 46,015 351 Rathbone Brothers Plc . . . . . . . . . . . . 8,798 1,747 Reckitt Benckiser Group Plc . . . . . . . 154,591 3,003 Redde Northgate Plc . . . . . . . . . . . . . . 16,575 3,865 Redrow Plc . . . . . . . . . . . . . . . . . . . . . 32,710 10,683 RELX Plc . . . . . . . . . . . . . . . . . . . . . . 283,586 1,210 RELX Plc, SP ADR† . . . . . . . . . . . . . 32,271 2,776 Renew Holdings Plc . . . . . . . . . . . . . . 25,920 214 Renishaw Plc . . . . . . . . . . . . . . . . . . . . 14,582 18,010 Rentokil Initial Plc . . . . . . . . . . . . . . . 123,321 787 Rhi Magnesita NV . . . . . . . . . . . . . . . 44,091
Value Shares (Note 1)
Value Shares (Note 1)
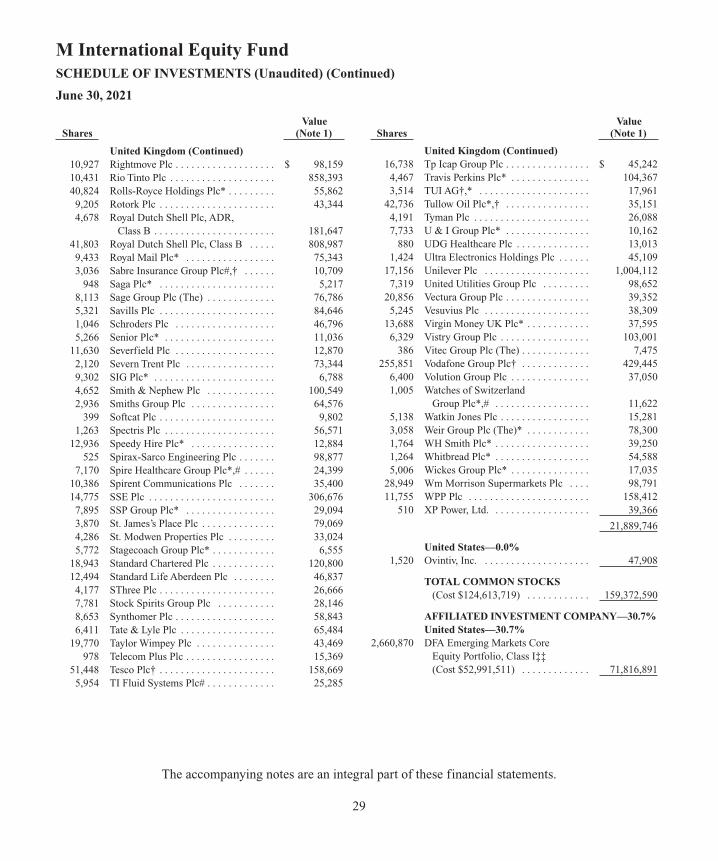
The accompanying notes are an integral part of these financial statements.
29
M International Equity FundSCHEDULE OF INVESTMENTS (Unaudited) (Continued)
June 30, 2021
United Kingdom (Continued) 10,927 Rightmove Plc . . . . . . . . . . . . . . . . . . . $ 98,159 10,431 Rio Tinto Plc . . . . . . . . . . . . . . . . . . . . 858,393 40,824 Rolls-Royce Holdings Plc* . . . . . . . . . 55,862 9,205 Rotork Plc . . . . . . . . . . . . . . . . . . . . . . 43,344 4,678 Royal Dutch Shell Plc, ADR,
Class B . . . . . . . . . . . . . . . . . . . . . . . 181,647 41,803 Royal Dutch Shell Plc, Class B . . . . . 808,987 9,433 Royal Mail Plc* . . . . . . . . . . . . . . . . . 75,343 3,036 Sabre Insurance Group Plc#,† . . . . . . 10,709 948 Saga Plc* . . . . . . . . . . . . . . . . . . . . . . 5,217 8,113 Sage Group Plc (The) . . . . . . . . . . . . . 76,786 5,321 Savills Plc . . . . . . . . . . . . . . . . . . . . . . 84,646 1,046 Schroders Plc . . . . . . . . . . . . . . . . . . . 46,796 5,266 Senior Plc* . . . . . . . . . . . . . . . . . . . . . 11,036 11,630 Severfield Plc . . . . . . . . . . . . . . . . . . . 12,870 2,120 Severn Trent Plc . . . . . . . . . . . . . . . . . 73,344 9,302 SIG Plc* . . . . . . . . . . . . . . . . . . . . . . . 6,788 4,652 Smith & Nephew Plc . . . . . . . . . . . . . 100,549 2,936 Smiths Group Plc . . . . . . . . . . . . . . . . 64,576 399 Softcat Plc . . . . . . . . . . . . . . . . . . . . . . 9,802 1,263 Spectris Plc . . . . . . . . . . . . . . . . . . . . . 56,571 12,936 Speedy Hire Plc* . . . . . . . . . . . . . . . . 12,884 525 Spirax-Sarco Engineering Plc . . . . . . . 98,877 7,170 Spire Healthcare Group Plc*,# . . . . . . 24,399 10,386 Spirent Communications Plc . . . . . . . 35,400 14,775 SSE Plc . . . . . . . . . . . . . . . . . . . . . . . . 306,676 7,895 SSP Group Plc* . . . . . . . . . . . . . . . . . 29,094 3,870 St. James’s Place Plc . . . . . . . . . . . . . . 79,069 4,286 St. Modwen Properties Plc . . . . . . . . . 33,024 5,772 Stagecoach Group Plc* . . . . . . . . . . . . 6,555 18,943 Standard Chartered Plc . . . . . . . . . . . . 120,800 12,494 Standard Life Aberdeen Plc . . . . . . . . 46,837 4,177 SThree Plc . . . . . . . . . . . . . . . . . . . . . . 26,666 7,781 Stock Spirits Group Plc . . . . . . . . . . . 28,146 8,653 Synthomer Plc . . . . . . . . . . . . . . . . . . . 58,843 6,411 Tate & Lyle Plc . . . . . . . . . . . . . . . . . . 65,484 19,770 Taylor Wimpey Plc . . . . . . . . . . . . . . . 43,469 978 Telecom Plus Plc . . . . . . . . . . . . . . . . . 15,369 51,448 Tesco Plc† . . . . . . . . . . . . . . . . . . . . . . 158,669 5,954 TI Fluid Systems Plc# . . . . . . . . . . . . . 25,285
United Kingdom (Continued) 16,738 Tp Icap Group Plc . . . . . . . . . . . . . . . . $ 45,242 4,467 Travis Perkins Plc* . . . . . . . . . . . . . . . 104,367 3,514 TUI AG†,* . . . . . . . . . . . . . . . . . . . . . 17,961 42,736 Tullow Oil Plc*,† . . . . . . . . . . . . . . . . 35,151 4,191 Tyman Plc . . . . . . . . . . . . . . . . . . . . . . 26,088 7,733 U & I Group Plc* . . . . . . . . . . . . . . . . 10,162 880 UDG Healthcare Plc . . . . . . . . . . . . . . 13,013 1,424 Ultra Electronics Holdings Plc . . . . . . 45,109 17,156 Unilever Plc . . . . . . . . . . . . . . . . . . . . 1,004,112 7,319 United Utilities Group Plc . . . . . . . . . 98,652 20,856 Vectura Group Plc . . . . . . . . . . . . . . . . 39,352 5,245 Vesuvius Plc . . . . . . . . . . . . . . . . . . . . 38,309 13,688 Virgin Money UK Plc* . . . . . . . . . . . . 37,595 6,329 Vistry Group Plc . . . . . . . . . . . . . . . . . 103,001 386 Vitec Group Plc (The) . . . . . . . . . . . . . 7,475 255,851 Vodafone Group Plc† . . . . . . . . . . . . . 429,445 6,400 Volution Group Plc . . . . . . . . . . . . . . . 37,050 1,005 Watches of Switzerland
Group Plc*,# . . . . . . . . . . . . . . . . . . 11,622 5,138 Watkin Jones Plc . . . . . . . . . . . . . . . . . 15,281 3,058 Weir Group Plc (The)* . . . . . . . . . . . . 78,300 1,764 WH Smith Plc* . . . . . . . . . . . . . . . . . . 39,250 1,264 Whitbread Plc* . . . . . . . . . . . . . . . . . . 54,588 5,006 Wickes Group Plc* . . . . . . . . . . . . . . . 17,035 28,949 Wm Morrison Supermarkets Plc . . . . 98,791 11,755 WPP Plc . . . . . . . . . . . . . . . . . . . . . . . 158,412 510 XP Power, Ltd. . . . . . . . . . . . . . . . . . . 39,366
21,889,746
United States—0.0% 1,520 Ovintiv, Inc. . . . . . . . . . . . . . . . . . . . . 47,908
TOTAL COMMON STOCKS(Cost $124,613,719) . . . . . . . . . . . . 159,372,590
AFFILIATED INVESTMENT COMPANY—30.7%United States—30.7%
2,660,870 DFA Emerging Markets Core Equity Portfolio, Class I‡‡ (Cost $52,991,511) . . . . . . . . . . . . . 71,816,891
Value Shares (Note 1)
Value Shares (Note 1)
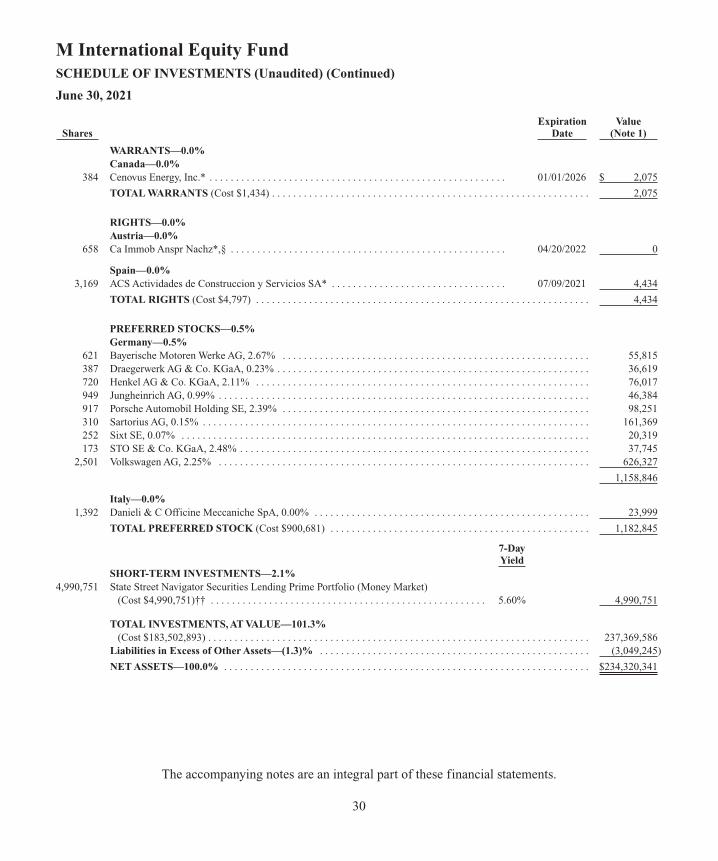
WARRANTS—0.0%Canada—0.0%
384 Cenovus Energy, Inc.* . . . . . . . . . . . . . . . . . . . . . . . . . . . . . . . . . . . . . . . . . . . . . . . . . . . . . . . . 01/01/2026 $ 2,075 TOTAL WARRANTS (Cost $1,434) . . . . . . . . . . . . . . . . . . . . . . . . . . . . . . . . . . . . . . . . . . . . . . . . . . . . . . . . . . . . 2,075
RIGHTS—0.0%Austria—0.0%
658 Ca Immob Anspr Nachz*,§ . . . . . . . . . . . . . . . . . . . . . . . . . . . . . . . . . . . . . . . . . . . . . . . . . . . . 04/20/2022 0
Spain—0.0% 3,169 ACS Actividades de Construccion y Servicios SA* . . . . . . . . . . . . . . . . . . . . . . . . . . . . . . . . . 07/09/2021 4,434 TOTAL RIGHTS (Cost $4,797) . . . . . . . . . . . . . . . . . . . . . . . . . . . . . . . . . . . . . . . . . . . . . . . . . . . . . . . . . . . . . . . 4,434
PREFERRED STOCKS—0.5%Germany—0.5%
621 Bayerische Motoren Werke AG, 2.67% . . . . . . . . . . . . . . . . . . . . . . . . . . . . . . . . . . . . . . . . . . . . . . . . . . . . . . . . . . 55,815 387 Draegerwerk AG & Co. KGaA, 0.23% . . . . . . . . . . . . . . . . . . . . . . . . . . . . . . . . . . . . . . . . . . . . . . . . . . . . . . . . . . . 36,619 720 Henkel AG & Co. KGaA, 2.11% . . . . . . . . . . . . . . . . . . . . . . . . . . . . . . . . . . . . . . . . . . . . . . . . . . . . . . . . . . . . . . . 76,017 949 Jungheinrich AG, 0.99% . . . . . . . . . . . . . . . . . . . . . . . . . . . . . . . . . . . . . . . . . . . . . . . . . . . . . . . . . . . . . . . . . . . . . . 46,384 917 Porsche Automobil Holding SE, 2.39% . . . . . . . . . . . . . . . . . . . . . . . . . . . . . . . . . . . . . . . . . . . . . . . . . . . . . . . . . . 98,251 310 Sartorius AG, 0.15% . . . . . . . . . . . . . . . . . . . . . . . . . . . . . . . . . . . . . . . . . . . . . . . . . . . . . . . . . . . . . . . . . . . . . . . . . 161,369 252 Sixt SE, 0.07% . . . . . . . . . . . . . . . . . . . . . . . . . . . . . . . . . . . . . . . . . . . . . . . . . . . . . . . . . . . . . . . . . . . . . . . . . . . . . 20,319 173 STO SE & Co. KGaA, 2.48% . . . . . . . . . . . . . . . . . . . . . . . . . . . . . . . . . . . . . . . . . . . . . . . . . . . . . . . . . . . . . . . . . . 37,745 2,501 Volkswagen AG, 2.25% . . . . . . . . . . . . . . . . . . . . . . . . . . . . . . . . . . . . . . . . . . . . . . . . . . . . . . . . . . . . . . . . . . . . . . 626,327
1,158,846
Italy—0.0% 1,392 Danieli & C Officine Meccaniche SpA, 0.00% . . . . . . . . . . . . . . . . . . . . . . . . . . . . . . . . . . . . . . . . . . . . . . . . . . . . 23,999 TOTAL PREFERRED STOCK (Cost $900,681) . . . . . . . . . . . . . . . . . . . . . . . . . . . . . . . . . . . . . . . . . . . . . . . . . 1,182,845
7-Day Yield
SHORT-TERM INVESTMENTS—2.1%4,990,751 State Street Navigator Securities Lending Prime Portfolio (Money Market)
(Cost $4,990,751)†† . . . . . . . . . . . . . . . . . . . . . . . . . . . . . . . . . . . . . . . . . . . . . . . . . . . . 5.60% 4,990,751
TOTAL INVESTMENTS, AT VALUE—101.3%(Cost $183,502,893) . . . . . . . . . . . . . . . . . . . . . . . . . . . . . . . . . . . . . . . . . . . . . . . . . . . . . . . . . . . . . . . . . . . . . . . . 237,369,586
Liabilities in Excess of Other Assets—(1.3)% . . . . . . . . . . . . . . . . . . . . . . . . . . . . . . . . . . . . . . . . . . . . . . . . . . . (3,049,245) NET ASSETS—100.0% . . . . . . . . . . . . . . . . . . . . . . . . . . . . . . . . . . . . . . . . . . . . . . . . . . . . . . . . . . . . . . . . . . . . . $234,320,341
The accompanying notes are an integral part of these financial statements.
30
Expiration Value Shares Date (Note 1)
M International Equity FundSCHEDULE OF INVESTMENTS (Unaudited) (Continued)
June 30, 2021

Notes to the Schedule of Investments:
ADR—American Depositary Receipt
SP ADR—Sponsored American Depositary Receipt
* Non-income producing security
# Security exempt from registration under Rule 144A of the Securities Act of 1933. These securities may be resold in transactions exemptfrom registration, normally to qualified institutional buyers. The aggregate value of securities exempt from registration under Rule 144Aof the Securities Act of 1933 at June 30, 2021, amounts to approximately $3,320,172, and represents 1.41% of net assets.
† Denotes all or a portion of security on loan. As of June 30, 2021, the market value of the securities on loan was $9,116,422 (Note 1).
‡‡ Affiliated issuer. Assets with a total aggregate market value of $71,816,891, or 30.7% of net assets, were affiliated with the Fund as ofJune 30, 2021 (Note 2).
†† Represents cash collateral received from securities lending transactions. Non-cash collateral amounted to $4,622,252.
§ Fair valued security—Represents fair value as measured based on the Portfolio Valuation policies specified in Note 1. Fair value is basedon a fair value factor being applied to quoted market prices for the foreign securities based on the pre-determined threshold. As ofJune 30, 2021, the total value of the fair valued securities was $248,269.
Percentages indicated are based on net assets.
The accompanying notes are an integral part of these financial statements.
31
M International Equity FundSCHEDULE OF INVESTMENTS (Unaudited) (Continued)
June 30, 2021
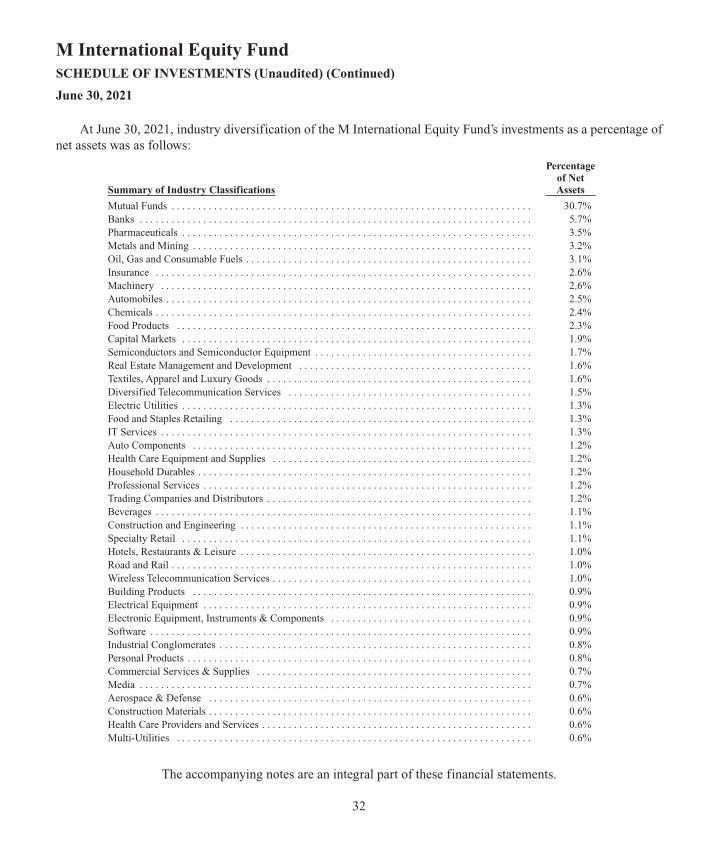
At June 30, 2021, industry diversification of the M International Equity Fund’s investments as a percentage ofnet assets was as follows:
Percentage of Net Summary of Industry Classifications Assets Mutual Funds . . . . . . . . . . . . . . . . . . . . . . . . . . . . . . . . . . . . . . . . . . . . . . . . . . . . . . . . . . . . . . . . . . . . 30.7%Banks . . . . . . . . . . . . . . . . . . . . . . . . . . . . . . . . . . . . . . . . . . . . . . . . . . . . . . . . . . . . . . . . . . . . . . . . . . 5.7%Pharmaceuticals . . . . . . . . . . . . . . . . . . . . . . . . . . . . . . . . . . . . . . . . . . . . . . . . . . . . . . . . . . . . . . . . . . 3.5%Metals and Mining . . . . . . . . . . . . . . . . . . . . . . . . . . . . . . . . . . . . . . . . . . . . . . . . . . . . . . . . . . . . . . . . 3.2%Oil, Gas and Consumable Fuels . . . . . . . . . . . . . . . . . . . . . . . . . . . . . . . . . . . . . . . . . . . . . . . . . . . . . . 3.1%Insurance . . . . . . . . . . . . . . . . . . . . . . . . . . . . . . . . . . . . . . . . . . . . . . . . . . . . . . . . . . . . . . . . . . . . . . . 2.6%Machinery . . . . . . . . . . . . . . . . . . . . . . . . . . . . . . . . . . . . . . . . . . . . . . . . . . . . . . . . . . . . . . . . . . . . . . 2.6%Automobiles . . . . . . . . . . . . . . . . . . . . . . . . . . . . . . . . . . . . . . . . . . . . . . . . . . . . . . . . . . . . . . . . . . . . . 2.5%Chemicals . . . . . . . . . . . . . . . . . . . . . . . . . . . . . . . . . . . . . . . . . . . . . . . . . . . . . . . . . . . . . . . . . . . . . . . 2.4%Food Products . . . . . . . . . . . . . . . . . . . . . . . . . . . . . . . . . . . . . . . . . . . . . . . . . . . . . . . . . . . . . . . . . . . 2.3%Capital Markets . . . . . . . . . . . . . . . . . . . . . . . . . . . . . . . . . . . . . . . . . . . . . . . . . . . . . . . . . . . . . . . . . . 1.9%Semiconductors and Semiconductor Equipment . . . . . . . . . . . . . . . . . . . . . . . . . . . . . . . . . . . . . . . . . 1.7%Real Estate Management and Development . . . . . . . . . . . . . . . . . . . . . . . . . . . . . . . . . . . . . . . . . . . . 1.6%Textiles, Apparel and Luxury Goods . . . . . . . . . . . . . . . . . . . . . . . . . . . . . . . . . . . . . . . . . . . . . . . . . . 1.6%Diversified Telecommunication Services . . . . . . . . . . . . . . . . . . . . . . . . . . . . . . . . . . . . . . . . . . . . . . 1.5%Electric Utilities . . . . . . . . . . . . . . . . . . . . . . . . . . . . . . . . . . . . . . . . . . . . . . . . . . . . . . . . . . . . . . . . . . 1.3%Food and Staples Retailing . . . . . . . . . . . . . . . . . . . . . . . . . . . . . . . . . . . . . . . . . . . . . . . . . . . . . . . . . 1.3%IT Services . . . . . . . . . . . . . . . . . . . . . . . . . . . . . . . . . . . . . . . . . . . . . . . . . . . . . . . . . . . . . . . . . . . . . . 1.3%Auto Components . . . . . . . . . . . . . . . . . . . . . . . . . . . . . . . . . . . . . . . . . . . . . . . . . . . . . . . . . . . . . . . . 1.2%Health Care Equipment and Supplies . . . . . . . . . . . . . . . . . . . . . . . . . . . . . . . . . . . . . . . . . . . . . . . . . 1.2%Household Durables . . . . . . . . . . . . . . . . . . . . . . . . . . . . . . . . . . . . . . . . . . . . . . . . . . . . . . . . . . . . . . . 1.2%Professional Services . . . . . . . . . . . . . . . . . . . . . . . . . . . . . . . . . . . . . . . . . . . . . . . . . . . . . . . . . . . . . . 1.2%Trading Companies and Distributors . . . . . . . . . . . . . . . . . . . . . . . . . . . . . . . . . . . . . . . . . . . . . . . . . . 1.2%Beverages . . . . . . . . . . . . . . . . . . . . . . . . . . . . . . . . . . . . . . . . . . . . . . . . . . . . . . . . . . . . . . . . . . . . . . . 1.1%Construction and Engineering . . . . . . . . . . . . . . . . . . . . . . . . . . . . . . . . . . . . . . . . . . . . . . . . . . . . . . . 1.1%Specialty Retail . . . . . . . . . . . . . . . . . . . . . . . . . . . . . . . . . . . . . . . . . . . . . . . . . . . . . . . . . . . . . . . . . . 1.1%Hotels, Restaurants & Leisure . . . . . . . . . . . . . . . . . . . . . . . . . . . . . . . . . . . . . . . . . . . . . . . . . . . . . . . 1.0%Road and Rail . . . . . . . . . . . . . . . . . . . . . . . . . . . . . . . . . . . . . . . . . . . . . . . . . . . . . . . . . . . . . . . . . . . . 1.0%Wireless Telecommunication Services . . . . . . . . . . . . . . . . . . . . . . . . . . . . . . . . . . . . . . . . . . . . . . . . . 1.0%Building Products . . . . . . . . . . . . . . . . . . . . . . . . . . . . . . . . . . . . . . . . . . . . . . . . . . . . . . . . . . . . . . . . 0.9%Electrical Equipment . . . . . . . . . . . . . . . . . . . . . . . . . . . . . . . . . . . . . . . . . . . . . . . . . . . . . . . . . . . . . . 0.9%Electronic Equipment, Instruments & Components . . . . . . . . . . . . . . . . . . . . . . . . . . . . . . . . . . . . . . 0.9%Software . . . . . . . . . . . . . . . . . . . . . . . . . . . . . . . . . . . . . . . . . . . . . . . . . . . . . . . . . . . . . . . . . . . . . . . . 0.9%Industrial Conglomerates . . . . . . . . . . . . . . . . . . . . . . . . . . . . . . . . . . . . . . . . . . . . . . . . . . . . . . . . . . . 0.8%Personal Products . . . . . . . . . . . . . . . . . . . . . . . . . . . . . . . . . . . . . . . . . . . . . . . . . . . . . . . . . . . . . . . . . 0.8%Commercial Services & Supplies . . . . . . . . . . . . . . . . . . . . . . . . . . . . . . . . . . . . . . . . . . . . . . . . . . . . 0.7%Media . . . . . . . . . . . . . . . . . . . . . . . . . . . . . . . . . . . . . . . . . . . . . . . . . . . . . . . . . . . . . . . . . . . . . . . . . . 0.7%Aerospace & Defense . . . . . . . . . . . . . . . . . . . . . . . . . . . . . . . . . . . . . . . . . . . . . . . . . . . . . . . . . . . . . 0.6%Construction Materials . . . . . . . . . . . . . . . . . . . . . . . . . . . . . . . . . . . . . . . . . . . . . . . . . . . . . . . . . . . . . 0.6%Health Care Providers and Services . . . . . . . . . . . . . . . . . . . . . . . . . . . . . . . . . . . . . . . . . . . . . . . . . . . 0.6%Multi-Utilities . . . . . . . . . . . . . . . . . . . . . . . . . . . . . . . . . . . . . . . . . . . . . . . . . . . . . . . . . . . . . . . . . . . 0.6%
The accompanying notes are an integral part of these financial statements.
32
M International Equity FundSCHEDULE OF INVESTMENTS (Unaudited) (Continued)
June 30, 2021
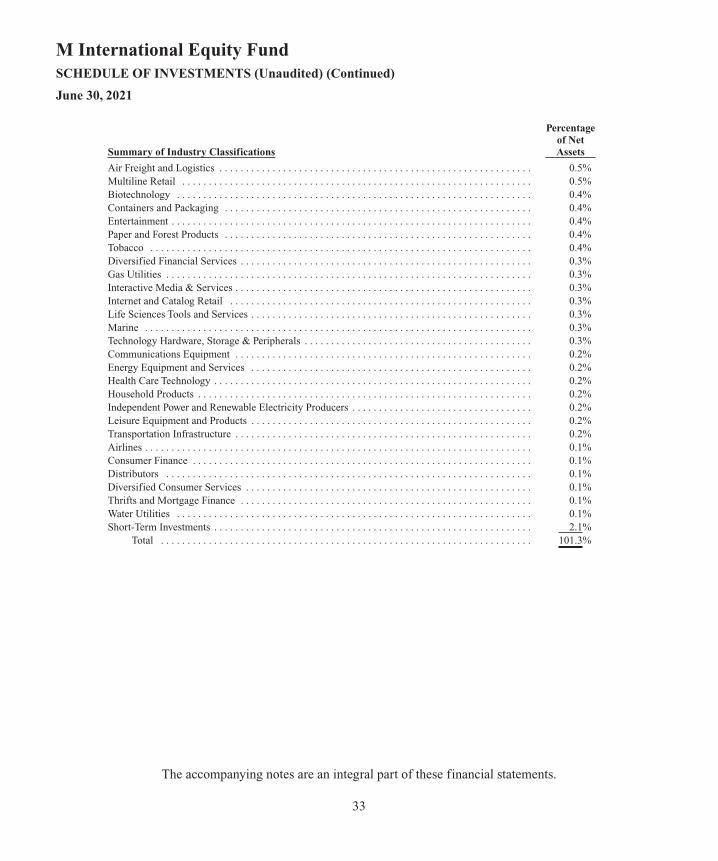
Percentage of Net Summary of Industry Classifications Assets Air Freight and Logistics . . . . . . . . . . . . . . . . . . . . . . . . . . . . . . . . . . . . . . . . . . . . . . . . . . . . . . . . . . . 0.5%Multiline Retail . . . . . . . . . . . . . . . . . . . . . . . . . . . . . . . . . . . . . . . . . . . . . . . . . . . . . . . . . . . . . . . . . . 0.5%Biotechnology . . . . . . . . . . . . . . . . . . . . . . . . . . . . . . . . . . . . . . . . . . . . . . . . . . . . . . . . . . . . . . . . . . . 0.4%Containers and Packaging . . . . . . . . . . . . . . . . . . . . . . . . . . . . . . . . . . . . . . . . . . . . . . . . . . . . . . . . . . 0.4%Entertainment . . . . . . . . . . . . . . . . . . . . . . . . . . . . . . . . . . . . . . . . . . . . . . . . . . . . . . . . . . . . . . . . . . . . 0.4%Paper and Forest Products . . . . . . . . . . . . . . . . . . . . . . . . . . . . . . . . . . . . . . . . . . . . . . . . . . . . . . . . . . 0.4%Tobacco . . . . . . . . . . . . . . . . . . . . . . . . . . . . . . . . . . . . . . . . . . . . . . . . . . . . . . . . . . . . . . . . . . . . . . . . 0.4%Diversified Financial Services . . . . . . . . . . . . . . . . . . . . . . . . . . . . . . . . . . . . . . . . . . . . . . . . . . . . . . . 0.3%Gas Utilities . . . . . . . . . . . . . . . . . . . . . . . . . . . . . . . . . . . . . . . . . . . . . . . . . . . . . . . . . . . . . . . . . . . . . 0.3%Interactive Media & Services . . . . . . . . . . . . . . . . . . . . . . . . . . . . . . . . . . . . . . . . . . . . . . . . . . . . . . . . 0.3%Internet and Catalog Retail . . . . . . . . . . . . . . . . . . . . . . . . . . . . . . . . . . . . . . . . . . . . . . . . . . . . . . . . . 0.3%Life Sciences Tools and Services . . . . . . . . . . . . . . . . . . . . . . . . . . . . . . . . . . . . . . . . . . . . . . . . . . . . . 0.3%Marine . . . . . . . . . . . . . . . . . . . . . . . . . . . . . . . . . . . . . . . . . . . . . . . . . . . . . . . . . . . . . . . . . . . . . . . . . 0.3%Technology Hardware, Storage & Peripherals . . . . . . . . . . . . . . . . . . . . . . . . . . . . . . . . . . . . . . . . . . . 0.3%Communications Equipment . . . . . . . . . . . . . . . . . . . . . . . . . . . . . . . . . . . . . . . . . . . . . . . . . . . . . . . . 0.2%Energy Equipment and Services . . . . . . . . . . . . . . . . . . . . . . . . . . . . . . . . . . . . . . . . . . . . . . . . . . . . . 0.2%Health Care Technology . . . . . . . . . . . . . . . . . . . . . . . . . . . . . . . . . . . . . . . . . . . . . . . . . . . . . . . . . . . . 0.2%Household Products . . . . . . . . . . . . . . . . . . . . . . . . . . . . . . . . . . . . . . . . . . . . . . . . . . . . . . . . . . . . . . . 0.2%Independent Power and Renewable Electricity Producers . . . . . . . . . . . . . . . . . . . . . . . . . . . . . . . . . . 0.2%Leisure Equipment and Products . . . . . . . . . . . . . . . . . . . . . . . . . . . . . . . . . . . . . . . . . . . . . . . . . . . . . 0.2%Transportation Infrastructure . . . . . . . . . . . . . . . . . . . . . . . . . . . . . . . . . . . . . . . . . . . . . . . . . . . . . . . . 0.2%Airlines . . . . . . . . . . . . . . . . . . . . . . . . . . . . . . . . . . . . . . . . . . . . . . . . . . . . . . . . . . . . . . . . . . . . . . . . . 0.1%Consumer Finance . . . . . . . . . . . . . . . . . . . . . . . . . . . . . . . . . . . . . . . . . . . . . . . . . . . . . . . . . . . . . . . . 0.1%Distributors . . . . . . . . . . . . . . . . . . . . . . . . . . . . . . . . . . . . . . . . . . . . . . . . . . . . . . . . . . . . . . . . . . . . . 0.1%Diversified Consumer Services . . . . . . . . . . . . . . . . . . . . . . . . . . . . . . . . . . . . . . . . . . . . . . . . . . . . . . 0.1%Thrifts and Mortgage Finance . . . . . . . . . . . . . . . . . . . . . . . . . . . . . . . . . . . . . . . . . . . . . . . . . . . . . . . 0.1%Water Utilities . . . . . . . . . . . . . . . . . . . . . . . . . . . . . . . . . . . . . . . . . . . . . . . . . . . . . . . . . . . . . . . . . . . 0.1%Short-Term Investments . . . . . . . . . . . . . . . . . . . . . . . . . . . . . . . . . . . . . . . . . . . . . . . . . . . . . . . . . . . . 2.1%
Total . . . . . . . . . . . . . . . . . . . . . . . . . . . . . . . . . . . . . . . . . . . . . . . . . . . . . . . . . . . . . . . . . . . . . . 101.3%
The accompanying notes are an integral part of these financial statements.
33
M International Equity FundSCHEDULE OF INVESTMENTS (Unaudited) (Continued)
June 30, 2021
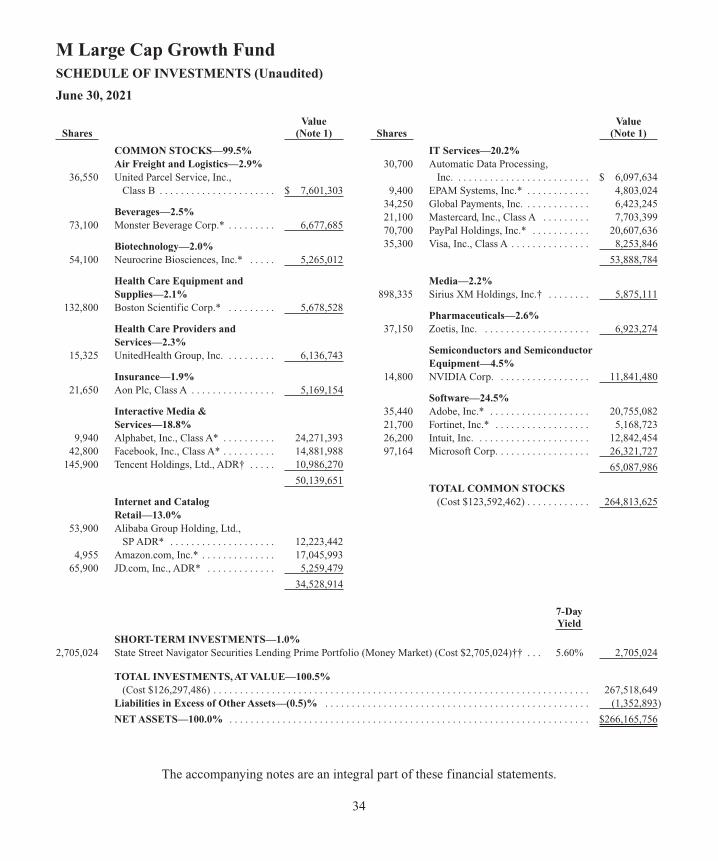
The accompanying notes are an integral part of these financial statements.
34
M Large Cap Growth FundSCHEDULE OF INVESTMENTS (Unaudited)
June 30, 2021
COMMON STOCKS—99.5%Air Freight and Logistics—2.9%
36,550 United Parcel Service, Inc., Class B . . . . . . . . . . . . . . . . . . . . . . $ 7,601,303
Beverages—2.5% 73,100 Monster Beverage Corp.* . . . . . . . . . 6,677,685
Biotechnology—2.0% 54,100 Neurocrine Biosciences, Inc.* . . . . . 5,265,012
Health Care Equipment and Supplies—2.1%
132,800 Boston Scientific Corp.* . . . . . . . . . 5,678,528
Health Care Providers and Services—2.3%
15,325 UnitedHealth Group, Inc. . . . . . . . . . 6,136,743
Insurance—1.9% 21,650 Aon Plc, Class A . . . . . . . . . . . . . . . . 5,169,154
Interactive Media & Services—18.8%
9,940 Alphabet, Inc., Class A* . . . . . . . . . . 24,271,393 42,800 Facebook, Inc., Class A* . . . . . . . . . . 14,881,988 145,900 Tencent Holdings, Ltd., ADR† . . . . . 10,986,270
50,139,651
Internet and Catalog Retail—13.0%
53,900 Alibaba Group Holding, Ltd., SP ADR* . . . . . . . . . . . . . . . . . . . . 12,223,442
4,955 Amazon.com, Inc.* . . . . . . . . . . . . . . 17,045,993 65,900 JD.com, Inc., ADR* . . . . . . . . . . . . . 5,259,479
34,528,914
IT Services—20.2% 30,700 Automatic Data Processing,
Inc. . . . . . . . . . . . . . . . . . . . . . . . . . $ 6,097,634 9,400 EPAM Systems, Inc.* . . . . . . . . . . . . 4,803,024 34,250 Global Payments, Inc. . . . . . . . . . . . . 6,423,245 21,100 Mastercard, Inc., Class A . . . . . . . . . 7,703,399 70,700 PayPal Holdings, Inc.* . . . . . . . . . . . 20,607,636 35,300 Visa, Inc., Class A . . . . . . . . . . . . . . . 8,253,846
53,888,784
Media—2.2% 898,335 Sirius XM Holdings, Inc.† . . . . . . . . 5,875,111
Pharmaceuticals—2.6% 37,150 Zoetis, Inc. . . . . . . . . . . . . . . . . . . . . 6,923,274
Semiconductors and SemiconductorEquipment—4.5%
14,800 NVIDIA Corp. . . . . . . . . . . . . . . . . . 11,841,480
Software—24.5% 35,440 Adobe, Inc.* . . . . . . . . . . . . . . . . . . . 20,755,082 21,700 Fortinet, Inc.* . . . . . . . . . . . . . . . . . . 5,168,723 26,200 Intuit, Inc. . . . . . . . . . . . . . . . . . . . . . 12,842,454 97,164 Microsoft Corp. . . . . . . . . . . . . . . . . . 26,321,727
65,087,986
TOTAL COMMON STOCKS (Cost $123,592,462) . . . . . . . . . . . . 264,813,625
Value Shares (Note 1)
Value Shares (Note 1)
SHORT-TERM INVESTMENTS—1.0%2,705,024 State Street Navigator Securities Lending Prime Portfolio (Money Market) (Cost $2,705,024)†† . . . 5.60% 2,705,024
TOTAL INVESTMENTS, AT VALUE—100.5%(Cost $126,297,486) . . . . . . . . . . . . . . . . . . . . . . . . . . . . . . . . . . . . . . . . . . . . . . . . . . . . . . . . . . . . . . . . . . . . . . . 267,518,649
Liabilities in Excess of Other Assets—(0.5)% . . . . . . . . . . . . . . . . . . . . . . . . . . . . . . . . . . . . . . . . . . . . . . . . . . (1,352,893) NET ASSETS—100.0% . . . . . . . . . . . . . . . . . . . . . . . . . . . . . . . . . . . . . . . . . . . . . . . . . . . . . . . . . . . . . . . . . . . . $266,165,756
7-Day Yield
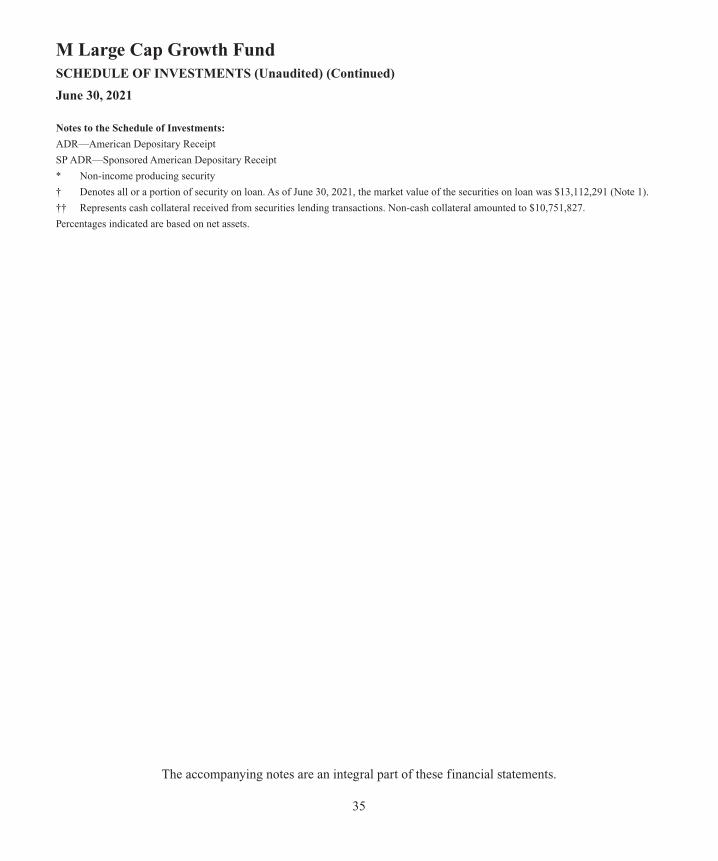
Notes to the Schedule of Investments:
ADR—American Depositary Receipt
SP ADR—Sponsored American Depositary Receipt
* Non-income producing security
† Denotes all or a portion of security on loan. As of June 30, 2021, the market value of the securities on loan was $13,112,291 (Note 1).
†† Represents cash collateral received from securities lending transactions. Non-cash collateral amounted to $10,751,827.
Percentages indicated are based on net assets.
The accompanying notes are an integral part of these financial statements.
35
M Large Cap Growth FundSCHEDULE OF INVESTMENTS (Unaudited) (Continued)
June 30, 2021

At June 30, 2021, industry sector diversification of the M Large Cap Growth Fund’s investments as a percentageof net assets was as follows:
Percentage of Net Summary of Sector Classifications Assets Information Technology . . . . . . . . . . . . . . . . . . . . . . . . . . . . . . . . . . . . . . . . . . . . . . . . . . . . . . . . . . . . 49.1%Communication Services . . . . . . . . . . . . . . . . . . . . . . . . . . . . . . . . . . . . . . . . . . . . . . . . . . . . . . . . . . . 21.1%Consumer Discretionary . . . . . . . . . . . . . . . . . . . . . . . . . . . . . . . . . . . . . . . . . . . . . . . . . . . . . . . . . . . 13.0%Health Care . . . . . . . . . . . . . . . . . . . . . . . . . . . . . . . . . . . . . . . . . . . . . . . . . . . . . . . . . . . . . . . . . . . . . 9.0%Industrials . . . . . . . . . . . . . . . . . . . . . . . . . . . . . . . . . . . . . . . . . . . . . . . . . . . . . . . . . . . . . . . . . . . . . . . 2.9%Consumer Staples . . . . . . . . . . . . . . . . . . . . . . . . . . . . . . . . . . . . . . . . . . . . . . . . . . . . . . . . . . . . . . . . . 2.5%Financials . . . . . . . . . . . . . . . . . . . . . . . . . . . . . . . . . . . . . . . . . . . . . . . . . . . . . . . . . . . . . . . . . . . . . . . 1.9%Short-Term Investments . . . . . . . . . . . . . . . . . . . . . . . . . . . . . . . . . . . . . . . . . . . . . . . . . . . . . . . . . . . . 1.0%
Total . . . . . . . . . . . . . . . . . . . . . . . . . . . . . . . . . . . . . . . . . . . . . . . . . . . . . . . . . . . . . . . . . . . . . . 100.5%
The accompanying notes are an integral part of these financial statements.
36
M Large Cap Growth FundSCHEDULE OF INVESTMENTS (Unaudited) (Continued)
June 30, 2021
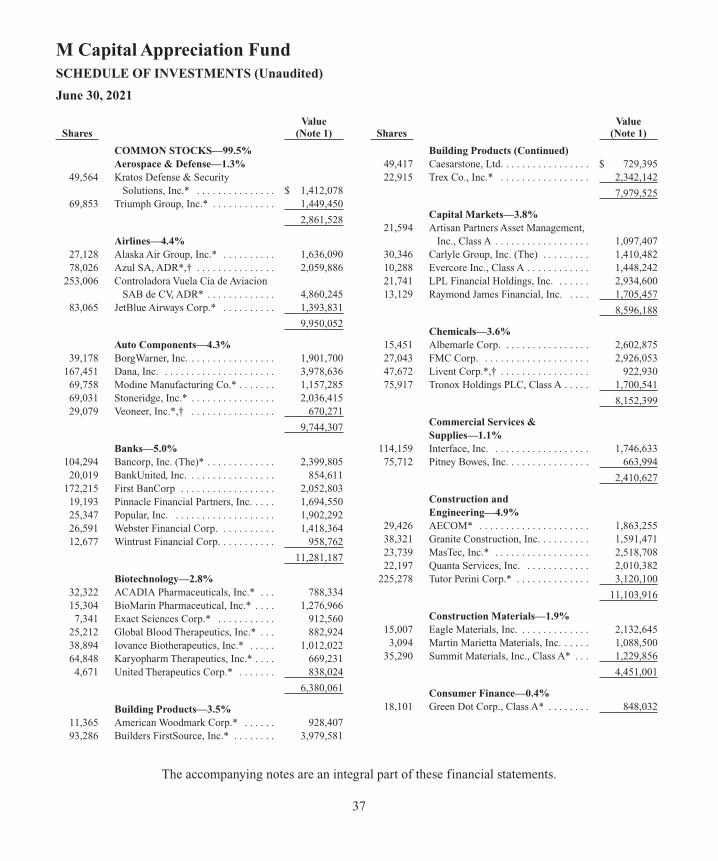
The accompanying notes are an integral part of these financial statements.
37
M Capital Appreciation FundSCHEDULE OF INVESTMENTS (Unaudited)
June 30, 2021
COMMON STOCKS—99.5%Aerospace & Defense—1.3%
49,564 Kratos Defense & Security Solutions, Inc.* . . . . . . . . . . . . . . . $ 1,412,078
69,853 Triumph Group, Inc.* . . . . . . . . . . . . 1,449,450
2,861,528
Airlines—4.4% 27,128 Alaska Air Group, Inc.* . . . . . . . . . . 1,636,090 78,026 Azul SA, ADR*,† . . . . . . . . . . . . . . . 2,059,886 253,006 Controladora Vuela Cia de Aviacion
SAB de CV, ADR* . . . . . . . . . . . . . 4,860,245 83,065 JetBlue Airways Corp.* . . . . . . . . . . 1,393,831
9,950,052
Auto Components—4.3% 39,178 BorgWarner, Inc. . . . . . . . . . . . . . . . . 1,901,700 167,451 Dana, Inc. . . . . . . . . . . . . . . . . . . . . . 3,978,636 69,758 Modine Manufacturing Co.* . . . . . . . 1,157,285 69,031 Stoneridge, Inc.* . . . . . . . . . . . . . . . . 2,036,415 29,079 Veoneer, Inc.*,† . . . . . . . . . . . . . . . . 670,271 9,744,307
Banks—5.0% 104,294 Bancorp, Inc. (The)* . . . . . . . . . . . . . 2,399,805 20,019 BankUnited, Inc. . . . . . . . . . . . . . . . . 854,611 172,215 First BanCorp . . . . . . . . . . . . . . . . . . 2,052,803 19,193 Pinnacle Financial Partners, Inc. . . . . 1,694,550 25,347 Popular, Inc. . . . . . . . . . . . . . . . . . . . 1,902,292 26,591 Webster Financial Corp. . . . . . . . . . . 1,418,364 12,677 Wintrust Financial Corp. . . . . . . . . . . 958,762 11,281,187
Biotechnology—2.8% 32,322 ACADIA Pharmaceuticals, Inc.* . . . 788,334 15,304 BioMarin Pharmaceutical, Inc.* . . . . 1,276,966 7,341 Exact Sciences Corp.* . . . . . . . . . . . 912,560 25,212 Global Blood Therapeutics, Inc.* . . . 882,924 38,894 Iovance Biotherapeutics, Inc.* . . . . . 1,012,022 64,848 Karyopharm Therapeutics, Inc.* . . . . 669,231 4,671 United Therapeutics Corp.* . . . . . . . 838,024 6,380,061
Building Products—3.5% 11,365 American Woodmark Corp.* . . . . . . 928,407 93,286 Builders FirstSource, Inc.* . . . . . . . . 3,979,581
Building Products (Continued) 49,417 Caesarstone, Ltd. . . . . . . . . . . . . . . . . $ 729,395 22,915 Trex Co., Inc.* . . . . . . . . . . . . . . . . . 2,342,142 7,979,525
Capital Markets—3.8% 21,594 Artisan Partners Asset Management,
Inc., Class A . . . . . . . . . . . . . . . . . . 1,097,407 30,346 Carlyle Group, Inc. (The) . . . . . . . . . 1,410,482 10,288 Evercore Inc., Class A . . . . . . . . . . . . 1,448,242 21,741 LPL Financial Holdings, Inc. . . . . . . 2,934,600 13,129 Raymond James Financial, Inc. . . . . 1,705,457 8,596,188
Chemicals—3.6% 15,451 Albemarle Corp. . . . . . . . . . . . . . . . . 2,602,875 27,043 FMC Corp. . . . . . . . . . . . . . . . . . . . . 2,926,053 47,672 Livent Corp.*,† . . . . . . . . . . . . . . . . . 922,930 75,917 Tronox Holdings PLC, Class A . . . . . 1,700,541 8,152,399
Commercial Services & Supplies—1.1%
114,159 Interface, Inc. . . . . . . . . . . . . . . . . . . 1,746,633 75,712 Pitney Bowes, Inc. . . . . . . . . . . . . . . . 663,994 2,410,627
Construction and Engineering—4.9%
29,426 AECOM* . . . . . . . . . . . . . . . . . . . . . 1,863,255 38,321 Granite Construction, Inc. . . . . . . . . . 1,591,471 23,739 MasTec, Inc.* . . . . . . . . . . . . . . . . . . 2,518,708 22,197 Quanta Services, Inc. . . . . . . . . . . . . 2,010,382 225,278 Tutor Perini Corp.* . . . . . . . . . . . . . . 3,120,100 11,103,916
Construction Materials—1.9% 15,007 Eagle Materials, Inc. . . . . . . . . . . . . . 2,132,645 3,094 Martin Marietta Materials, Inc. . . . . . 1,088,500 35,290 Summit Materials, Inc., Class A* . . . 1,229,856 4,451,001
Consumer Finance—0.4% 18,101 Green Dot Corp., Class A* . . . . . . . . 848,032
Value Shares (Note 1)
Value Shares (Note 1)
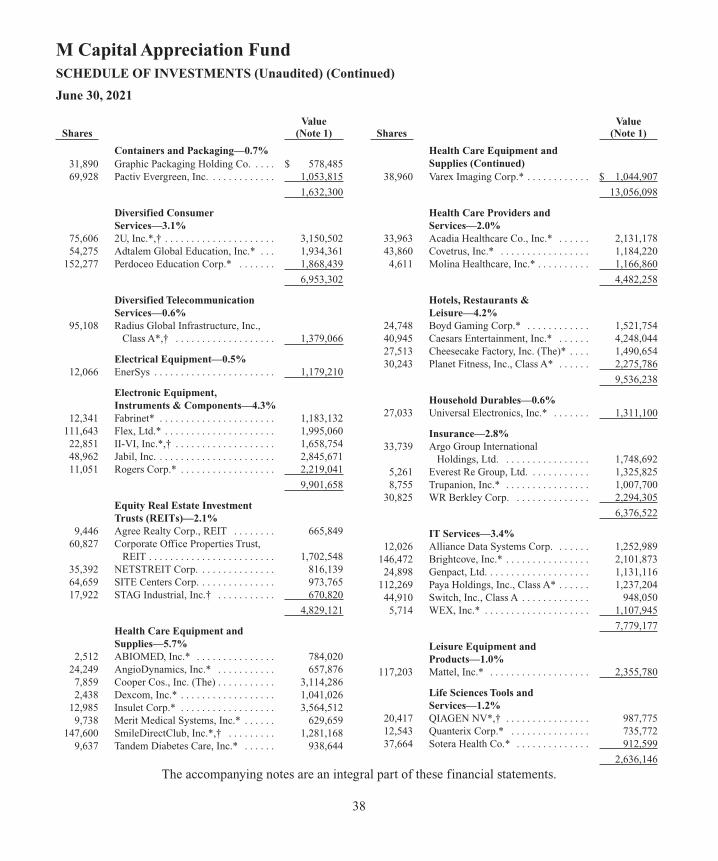
The accompanying notes are an integral part of these financial statements.
38
M Capital Appreciation FundSCHEDULE OF INVESTMENTS (Unaudited) (Continued)
June 30, 2021
Containers and Packaging—0.7% 31,890 Graphic Packaging Holding Co. . . . . $ 578,485 69,928 Pactiv Evergreen, Inc. . . . . . . . . . . . . 1,053,815 1,632,300
Diversified Consumer Services—3.1%
75,606 2U, Inc.*,† . . . . . . . . . . . . . . . . . . . . . 3,150,502 54,275 Adtalem Global Education, Inc.* . . . 1,934,361 152,277 Perdoceo Education Corp.* . . . . . . . 1,868,439 6,953,302
Diversified Telecommunication Services—0.6%
95,108 Radius Global Infrastructure, Inc., Class A*,† . . . . . . . . . . . . . . . . . . . 1,379,066
Electrical Equipment—0.5% 12,066 EnerSys . . . . . . . . . . . . . . . . . . . . . . . 1,179,210
Electronic Equipment, Instruments & Components—4.3%
12,341 Fabrinet* . . . . . . . . . . . . . . . . . . . . . . 1,183,132 111,643 Flex, Ltd.* . . . . . . . . . . . . . . . . . . . . . 1,995,060 22,851 II-VI, Inc.*,† . . . . . . . . . . . . . . . . . . . 1,658,754 48,962 Jabil, Inc. . . . . . . . . . . . . . . . . . . . . . . 2,845,671 11,051 Rogers Corp.* . . . . . . . . . . . . . . . . . . 2,219,041 9,901,658
Equity Real Estate Investment Trusts (REITs)—2.1%
9,446 Agree Realty Corp., REIT . . . . . . . . 665,849 60,827 Corporate Office Properties Trust,
REIT . . . . . . . . . . . . . . . . . . . . . . . . 1,702,548 35,392 NETSTREIT Corp. . . . . . . . . . . . . . . 816,139 64,659 SITE Centers Corp. . . . . . . . . . . . . . . 973,765 17,922 STAG Industrial, Inc.† . . . . . . . . . . . 670,820 4,829,121
Health Care Equipment and Supplies—5.7%
2,512 ABIOMED, Inc.* . . . . . . . . . . . . . . . 784,020 24,249 AngioDynamics, Inc.* . . . . . . . . . . . 657,876 7,859 Cooper Cos., Inc. (The) . . . . . . . . . . . 3,114,286 2,438 Dexcom, Inc.* . . . . . . . . . . . . . . . . . . 1,041,026 12,985 Insulet Corp.* . . . . . . . . . . . . . . . . . . 3,564,512 9,738 Merit Medical Systems, Inc.* . . . . . . 629,659 147,600 SmileDirectClub, Inc.*,† . . . . . . . . . 1,281,168 9,637 Tandem Diabetes Care, Inc.* . . . . . . 938,644
Health Care Equipment and Supplies (Continued)
38,960 Varex Imaging Corp.* . . . . . . . . . . . . $ 1,044,907 13,056,098
Health Care Providers and Services—2.0%
33,963 Acadia Healthcare Co., Inc.* . . . . . . 2,131,178 43,860 Covetrus, Inc.* . . . . . . . . . . . . . . . . . 1,184,220 4,611 Molina Healthcare, Inc.* . . . . . . . . . . 1,166,860 4,482,258
Hotels, Restaurants & Leisure—4.2%
24,748 Boyd Gaming Corp.* . . . . . . . . . . . . 1,521,754 40,945 Caesars Entertainment, Inc.* . . . . . . 4,248,044 27,513 Cheesecake Factory, Inc. (The)* . . . . 1,490,654 30,243 Planet Fitness, Inc., Class A* . . . . . . 2,275,786 9,536,238
Household Durables—0.6% 27,033 Universal Electronics, Inc.* . . . . . . . 1,311,100
Insurance—2.8% 33,739 Argo Group International
Holdings, Ltd. . . . . . . . . . . . . . . . . 1,748,692 5,261 Everest Re Group, Ltd. . . . . . . . . . . . 1,325,825 8,755 Trupanion, Inc.* . . . . . . . . . . . . . . . . 1,007,700 30,825 WR Berkley Corp. . . . . . . . . . . . . . . 2,294,305 6,376,522
IT Services—3.4% 12,026 Alliance Data Systems Corp. . . . . . . 1,252,989 146,472 Brightcove, Inc.* . . . . . . . . . . . . . . . . 2,101,873 24,898 Genpact, Ltd. . . . . . . . . . . . . . . . . . . . 1,131,116 112,269 Paya Holdings, Inc., Class A* . . . . . . 1,237,204 44,910 Switch, Inc., Class A . . . . . . . . . . . . . 948,050 5,714 WEX, Inc.* . . . . . . . . . . . . . . . . . . . . 1,107,945 7,779,177
Leisure Equipment and Products—1.0%
117,203 Mattel, Inc.* . . . . . . . . . . . . . . . . . . . 2,355,780
Life Sciences Tools and Services—1.2%
20,417 QIAGEN NV*,† . . . . . . . . . . . . . . . . 987,775 12,543 Quanterix Corp.* . . . . . . . . . . . . . . . 735,772 37,664 Sotera Health Co.* . . . . . . . . . . . . . . 912,599 2,636,146
Value Shares (Note 1)
Value Shares (Note 1)
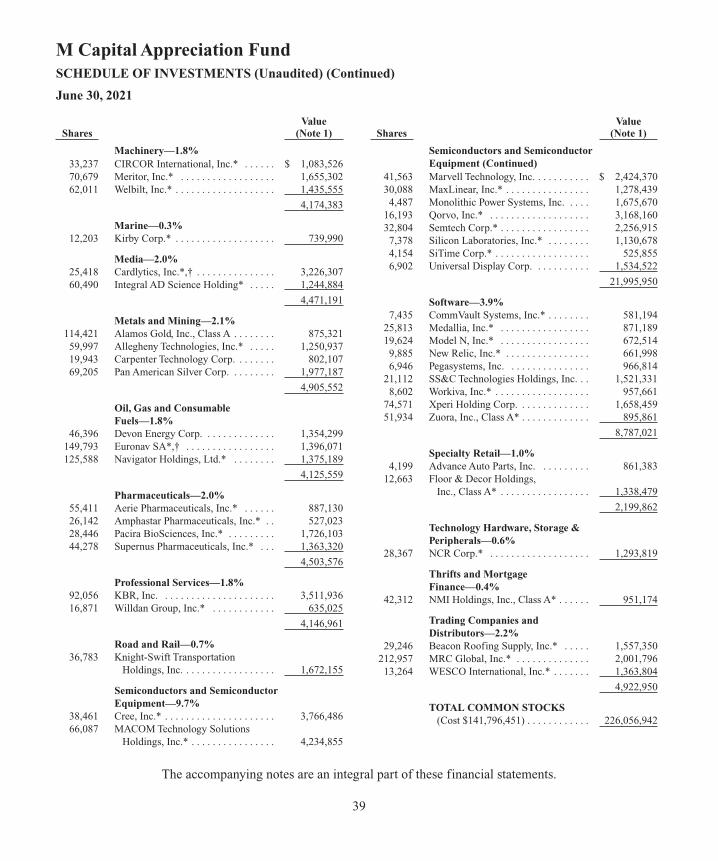
The accompanying notes are an integral part of these financial statements.
39
M Capital Appreciation FundSCHEDULE OF INVESTMENTS (Unaudited) (Continued)
June 30, 2021
Machinery—1.8% 33,237 CIRCOR International, Inc.* . . . . . . $ 1,083,526 70,679 Meritor, Inc.* . . . . . . . . . . . . . . . . . . 1,655,302 62,011 Welbilt, Inc.* . . . . . . . . . . . . . . . . . . . 1,435,555 4,174,383
Marine—0.3% 12,203 Kirby Corp.* . . . . . . . . . . . . . . . . . . . 739,990
Media—2.0% 25,418 Cardlytics, Inc.*,† . . . . . . . . . . . . . . . 3,226,307 60,490 Integral AD Science Holding* . . . . . 1,244,884 4,471,191
Metals and Mining—2.1% 114,421 Alamos Gold, Inc., Class A . . . . . . . . 875,321 59,997 Allegheny Technologies, Inc.* . . . . . 1,250,937 19,943 Carpenter Technology Corp. . . . . . . . 802,107 69,205 Pan American Silver Corp. . . . . . . . . 1,977,187 4,905,552
Oil, Gas and Consumable Fuels—1.8%
46,396 Devon Energy Corp. . . . . . . . . . . . . . 1,354,299 149,793 Euronav SA*,† . . . . . . . . . . . . . . . . . 1,396,071 125,588 Navigator Holdings, Ltd.* . . . . . . . . 1,375,189 4,125,559
Pharmaceuticals—2.0% 55,411 Aerie Pharmaceuticals, Inc.* . . . . . . 887,130 26,142 Amphastar Pharmaceuticals, Inc.* . . 527,023 28,446 Pacira BioSciences, Inc.* . . . . . . . . . 1,726,103 44,278 Supernus Pharmaceuticals, Inc.* . . . 1,363,320 4,503,576
Professional Services—1.8% 92,056 KBR, Inc. . . . . . . . . . . . . . . . . . . . . . 3,511,936 16,871 Willdan Group, Inc.* . . . . . . . . . . . . 635,025 4,146,961
Road and Rail—0.7% 36,783 Knight-Swift Transportation
Holdings, Inc. . . . . . . . . . . . . . . . . . 1,672,155
Semiconductors and SemiconductorEquipment—9.7%
38,461 Cree, Inc.* . . . . . . . . . . . . . . . . . . . . . 3,766,486 66,087 MACOM Technology Solutions
Holdings, Inc.* . . . . . . . . . . . . . . . . 4,234,855
Semiconductors and Semiconductor Equipment (Continued)
41,563 Marvell Technology, Inc. . . . . . . . . . . $ 2,424,370 30,088 MaxLinear, Inc.* . . . . . . . . . . . . . . . . 1,278,439 4,487 Monolithic Power Systems, Inc. . . . . 1,675,670 16,193 Qorvo, Inc.* . . . . . . . . . . . . . . . . . . . 3,168,160 32,804 Semtech Corp.* . . . . . . . . . . . . . . . . . 2,256,915 7,378 Silicon Laboratories, Inc.* . . . . . . . . 1,130,678 4,154 SiTime Corp.* . . . . . . . . . . . . . . . . . . 525,855 6,902 Universal Display Corp. . . . . . . . . . . 1,534,522 21,995,950
Software—3.9% 7,435 CommVault Systems, Inc.* . . . . . . . . 581,194 25,813 Medallia, Inc.* . . . . . . . . . . . . . . . . . 871,189 19,624 Model N, Inc.* . . . . . . . . . . . . . . . . . 672,514 9,885 New Relic, Inc.* . . . . . . . . . . . . . . . . 661,998 6,946 Pegasystems, Inc. . . . . . . . . . . . . . . . 966,814 21,112 SS&C Technologies Holdings, Inc. . . 1,521,331 8,602 Workiva, Inc.* . . . . . . . . . . . . . . . . . . 957,661 74,571 Xperi Holding Corp. . . . . . . . . . . . . . 1,658,459 51,934 Zuora, Inc., Class A* . . . . . . . . . . . . . 895,861 8,787,021
Specialty Retail—1.0% 4,199 Advance Auto Parts, Inc. . . . . . . . . . 861,383 12,663 Floor & Decor Holdings,
Inc., Class A* . . . . . . . . . . . . . . . . . 1,338,479 2,199,862
Technology Hardware, Storage &Peripherals—0.6%
28,367 NCR Corp.* . . . . . . . . . . . . . . . . . . . 1,293,819
Thrifts and Mortgage Finance—0.4%
42,312 NMI Holdings, Inc., Class A* . . . . . . 951,174
Trading Companies and Distributors—2.2%
29,246 Beacon Roofing Supply, Inc.* . . . . . 1,557,350 212,957 MRC Global, Inc.* . . . . . . . . . . . . . . 2,001,796 13,264 WESCO International, Inc.* . . . . . . . 1,363,804 4,922,950
TOTAL COMMON STOCKS(Cost $141,796,451) . . . . . . . . . . . . 226,056,942
Value Shares (Note 1)
Value Shares (Note 1)
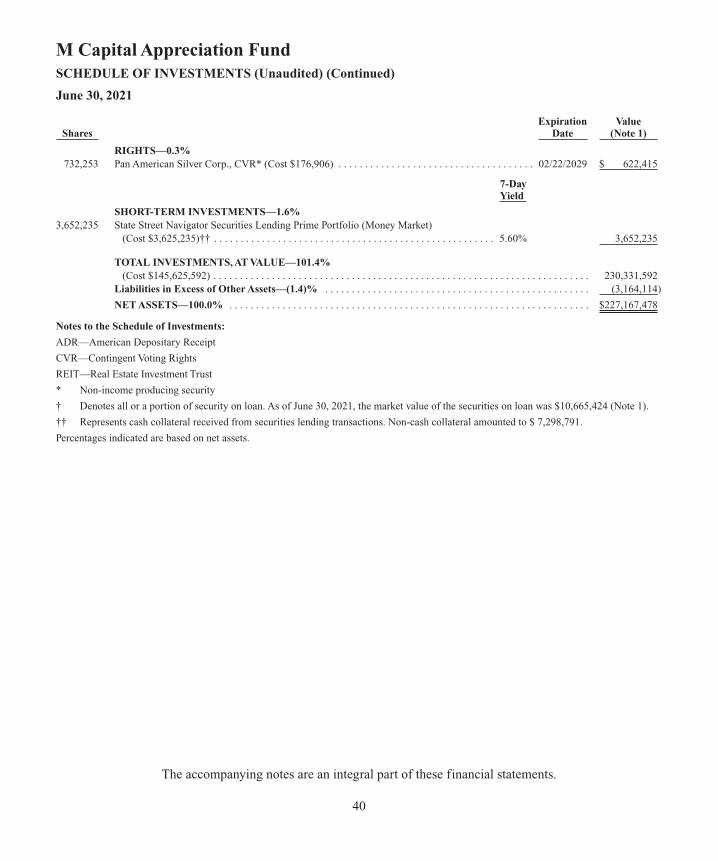
RIGHTS—0.3% 732,253 Pan American Silver Corp., CVR* (Cost $176,906) . . . . . . . . . . . . . . . . . . . . . . . . . . . . . . . . . . . . . 02/22/2029 $ 622,415
7-Day Yield
SHORT-TERM INVESTMENTS—1.6%3,652,235 State Street Navigator Securities Lending Prime Portfolio (Money Market)
(Cost $3,625,235)†† . . . . . . . . . . . . . . . . . . . . . . . . . . . . . . . . . . . . . . . . . . . . . . . . . . . . . 5.60% 3,652,235
TOTAL INVESTMENTS, AT VALUE—101.4%(Cost $145,625,592) . . . . . . . . . . . . . . . . . . . . . . . . . . . . . . . . . . . . . . . . . . . . . . . . . . . . . . . . . . . . . . . . . . . . . . . 230,331,592
Liabilities in Excess of Other Assets—(1.4)% . . . . . . . . . . . . . . . . . . . . . . . . . . . . . . . . . . . . . . . . . . . . . . . . . . (3,164,114) NET ASSETS—100.0% . . . . . . . . . . . . . . . . . . . . . . . . . . . . . . . . . . . . . . . . . . . . . . . . . . . . . . . . . . . . . . . . . . . . $227,167,478
Notes to the Schedule of Investments:
ADR—American Depositary Receipt
CVR—Contingent Voting Rights
REIT—Real Estate Investment Trust
* Non-income producing security
† Denotes all or a portion of security on loan. As of June 30, 2021, the market value of the securities on loan was $10,665,424 (Note 1).
†† Represents cash collateral received from securities lending transactions. Non-cash collateral amounted to $ 7,298,791.
Percentages indicated are based on net assets.
The accompanying notes are an integral part of these financial statements.
40
Expiration Value Shares Date (Note 1)
M Capital Appreciation FundSCHEDULE OF INVESTMENTS (Unaudited) (Continued)
June 30, 2021
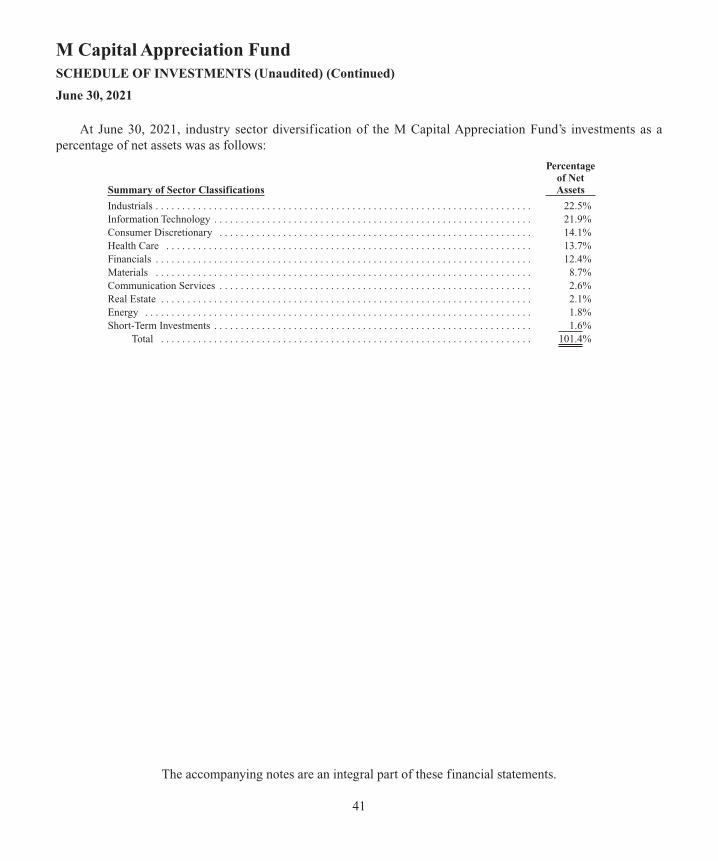
At June 30, 2021, industry sector diversification of the M Capital Appreciation Fund’s investments as apercentage of net assets was as follows:
Percentage of Net Summary of Sector Classifications Assets Industrials . . . . . . . . . . . . . . . . . . . . . . . . . . . . . . . . . . . . . . . . . . . . . . . . . . . . . . . . . . . . . . . . . . . . . . . 22.5%Information Technology . . . . . . . . . . . . . . . . . . . . . . . . . . . . . . . . . . . . . . . . . . . . . . . . . . . . . . . . . . . . 21.9%Consumer Discretionary . . . . . . . . . . . . . . . . . . . . . . . . . . . . . . . . . . . . . . . . . . . . . . . . . . . . . . . . . . . 14.1%Health Care . . . . . . . . . . . . . . . . . . . . . . . . . . . . . . . . . . . . . . . . . . . . . . . . . . . . . . . . . . . . . . . . . . . . . 13.7%Financials . . . . . . . . . . . . . . . . . . . . . . . . . . . . . . . . . . . . . . . . . . . . . . . . . . . . . . . . . . . . . . . . . . . . . . . 12.4%Materials . . . . . . . . . . . . . . . . . . . . . . . . . . . . . . . . . . . . . . . . . . . . . . . . . . . . . . . . . . . . . . . . . . . . . . . 8.7%Communication Services . . . . . . . . . . . . . . . . . . . . . . . . . . . . . . . . . . . . . . . . . . . . . . . . . . . . . . . . . . . 2.6%Real Estate . . . . . . . . . . . . . . . . . . . . . . . . . . . . . . . . . . . . . . . . . . . . . . . . . . . . . . . . . . . . . . . . . . . . . . 2.1%Energy . . . . . . . . . . . . . . . . . . . . . . . . . . . . . . . . . . . . . . . . . . . . . . . . . . . . . . . . . . . . . . . . . . . . . . . . . 1.8%Short-Term Investments . . . . . . . . . . . . . . . . . . . . . . . . . . . . . . . . . . . . . . . . . . . . . . . . . . . . . . . . . . . . 1.6%
Total . . . . . . . . . . . . . . . . . . . . . . . . . . . . . . . . . . . . . . . . . . . . . . . . . . . . . . . . . . . . . . . . . . . . . . 101.4%
The accompanying notes are an integral part of these financial statements.
41
M Capital Appreciation FundSCHEDULE OF INVESTMENTS (Unaudited) (Continued)
June 30, 2021

The accompanying notes are an integral part of these financial statements.
42
M Large Cap Value FundSCHEDULE OF INVESTMENTS (Unaudited)
June 30, 2021
COMMON STOCKS—98.2%Aerospace & Defense—1.5%
5,000 General Dynamics Corp. . . . . . . . . . . . $ 941,300 500 Huntington Ingalls Industries, Inc. . . . 105,375 2,500 L3Harris Technologies, Inc. . . . . . . . . 540,375 4,000 Textron, Inc. . . . . . . . . . . . . . . . . . . . . 275,080 1,862,130
Air Freight and Logistics—1.5% 800 Expeditors International of
Washington, Inc. . . . . . . . . . . . . . . . 101,280 8,400 United Parcel Service, Inc.,
Class B . . . . . . . . . . . . . . . . . . . . . . . 1,746,948 1,848,228
Auto Components—0.2% 3,300 Gentex Corp. . . . . . . . . . . . . . . . . . . . . 109,197 800 Lear Corp. . . . . . . . . . . . . . . . . . . . . . . 140,224 249,421
Automobiles—1.8% 69,200 Ford Motor Co.* . . . . . . . . . . . . . . . . . 1,028,312 19,700 General Motors Co.* . . . . . . . . . . . . . . 1,165,649 2,193,961
Banks—15.1%118,900 Bank of America Corp. . . . . . . . . . . . . 4,902,247 5,800 Citizens Financial Group, Inc. . . . . . . 266,046 1,900 Comerica, Inc. . . . . . . . . . . . . . . . . . . . 135,546 1,565 Commerce Bancshares, Inc. . . . . . . . . 116,687 700 Cullen/Frost Bankers, Inc. . . . . . . . . . 78,400 1,900 East West Bancorp, Inc. . . . . . . . . . . . 136,211 9,700 Fifth Third Bancorp . . . . . . . . . . . . . . 370,831 37,800 JPMorgan Chase & Co. . . . . . . . . . . . . 5,879,412 13,300 KeyCorp . . . . . . . . . . . . . . . . . . . . . . . 274,645 1,600 M&T Bank Corp. . . . . . . . . . . . . . . . . 232,496 5,800 PNC Financial Services Group,
Inc. (The) . . . . . . . . . . . . . . . . . . . . . 1,106,408 13,200 Regions Financial Corp. . . . . . . . . . . . 266,376 18,400 Truist Financial Corp. . . . . . . . . . . . . . 1,021,200 20,589 U.S. Bancorp . . . . . . . . . . . . . . . . . . . . 1,172,955 54,700 Wells Fargo & Co. . . . . . . . . . . . . . . . . 2,477,363 1,300 Western Alliance Bancorp . . . . . . . . . 120,705 2,200 Zions Bancorp NA . . . . . . . . . . . . . . . 116,292 18,673,820
Beverages—0.1% 2,700 Molson Coors Brewing Co.,
Class B* . . . . . . . . . . . . . . . . . . . . . . $ 144,963
Building Products—0.6% 2,400 Fortune Brands Home &
Security, Inc. . . . . . . . . . . . . . . . . . . 239,064 4,500 Masco Corp. . . . . . . . . . . . . . . . . . . . . 265,095 1,900 Owens Corning . . . . . . . . . . . . . . . . . . 186,010 690,169
Capital Markets—3.5% 12,000 Bank of New York Mellon
Corp. (The) . . . . . . . . . . . . . . . . . . . 614,760 4,700 Goldman Sachs Group, Inc. (The) . . . 1,783,791 3,600 Jefferies Financial Group, Inc. . . . . . . 123,120 1,100 LPL Financial Holdings, Inc. . . . . . . . 148,478 2,900 Northern Trust Corp. . . . . . . . . . . . . . . 335,298 1,800 Raymond James Financial, Inc. . . . . . . 233,820 1,900 SEI Investments Co. . . . . . . . . . . . . . . 117,743 4,800 State Street Corp. . . . . . . . . . . . . . . . . 394,944 3,100 T. Rowe Price Group, Inc. . . . . . . . . . . 613,707 4,365,661
Chemicals—2.0% 2,000 Celanese Corp. . . . . . . . . . . . . . . . . . . 303,200 6,600 DuPont de Nemours, Inc. . . . . . . . . . . 510,906 2,300 Eastman Chemical Co. . . . . . . . . . . . . 268,525 2,300 FMC Corp. . . . . . . . . . . . . . . . . . . . . . 248,860 5,800 LyondellBasell Industries NV,
Class A . . . . . . . . . . . . . . . . . . . . . . . 596,646 6,600 Mosaic Co. (The) . . . . . . . . . . . . . . . . 210,606 2,200 RPM International, Inc. . . . . . . . . . . . 195,096 800 Scotts Miracle-Gro Co. (The) . . . . . . . 153,536 2,487,375
Communications Equipment—2.3% 52,300 Cisco Systems, Inc. . . . . . . . . . . . . . . . 2,771,900 4,000 Juniper Networks, Inc. . . . . . . . . . . . . 109,400 2,881,300
Construction and Engineering—0.1% 1,800 Quanta Services, Inc. . . . . . . . . . . . . . 163,026
Consumer Finance—1.8% 5,100 Ally Financial, Inc. . . . . . . . . . . . . . . . 254,184 6,300 Capital One Financial Corp. . . . . . . . . 974,547
ValueShares (Note 1)
ValueShares (Note 1)
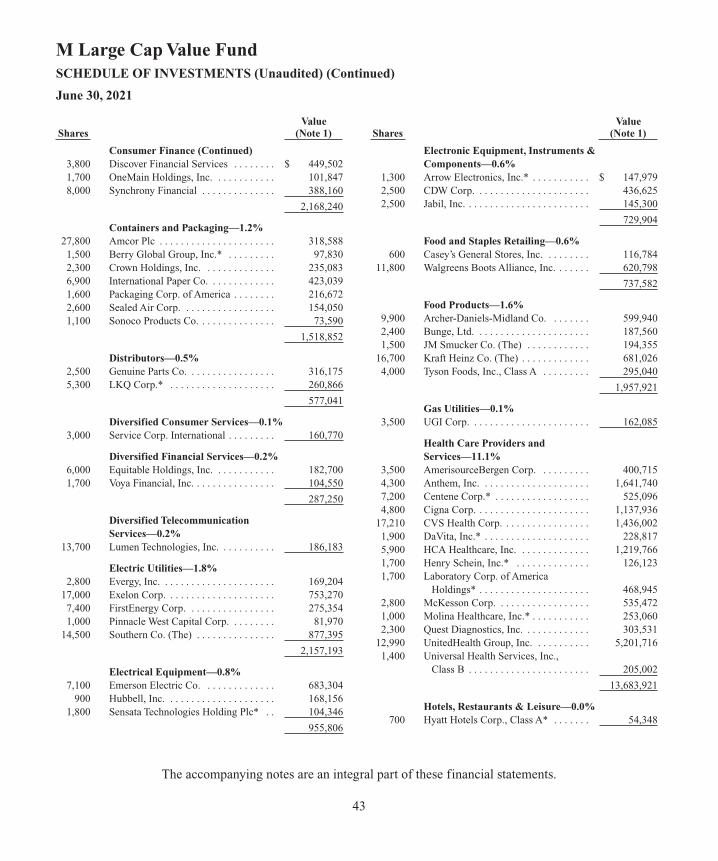
The accompanying notes are an integral part of these financial statements.
43
M Large Cap Value FundSCHEDULE OF INVESTMENTS (Unaudited) (Continued)
June 30, 2021
Consumer Finance (Continued) 3,800 Discover Financial Services . . . . . . . . $ 449,502 1,700 OneMain Holdings, Inc. . . . . . . . . . . . 101,847 8,000 Synchrony Financial . . . . . . . . . . . . . . 388,160 2,168,240
Containers and Packaging—1.2% 27,800 Amcor Plc . . . . . . . . . . . . . . . . . . . . . . 318,588 1,500 Berry Global Group, Inc.* . . . . . . . . . 97,830 2,300 Crown Holdings, Inc. . . . . . . . . . . . . . 235,083 6,900 International Paper Co. . . . . . . . . . . . . 423,039 1,600 Packaging Corp. of America . . . . . . . . 216,672 2,600 Sealed Air Corp. . . . . . . . . . . . . . . . . . 154,050 1,100 Sonoco Products Co. . . . . . . . . . . . . . . 73,590 1,518,852
Distributors—0.5% 2,500 Genuine Parts Co. . . . . . . . . . . . . . . . . 316,175 5,300 LKQ Corp.* . . . . . . . . . . . . . . . . . . . . 260,866 577,041
Diversified Consumer Services—0.1% 3,000 Service Corp. International . . . . . . . . . 160,770
Diversified Financial Services—0.2% 6,000 Equitable Holdings, Inc. . . . . . . . . . . . 182,700 1,700 Voya Financial, Inc. . . . . . . . . . . . . . . . 104,550 287,250
Diversified Telecommunication Services—0.2%
13,700 Lumen Technologies, Inc. . . . . . . . . . . 186,183
Electric Utilities—1.8% 2,800 Evergy, Inc. . . . . . . . . . . . . . . . . . . . . . 169,204 17,000 Exelon Corp. . . . . . . . . . . . . . . . . . . . . 753,270 7,400 FirstEnergy Corp. . . . . . . . . . . . . . . . . 275,354 1,000 Pinnacle West Capital Corp. . . . . . . . . 81,970 14,500 Southern Co. (The) . . . . . . . . . . . . . . . 877,395 2,157,193
Electrical Equipment—0.8% 7,100 Emerson Electric Co. . . . . . . . . . . . . . 683,304 900 Hubbell, Inc. . . . . . . . . . . . . . . . . . . . . 168,156 1,800 Sensata Technologies Holding Plc* . . 104,346 955,806
Electronic Equipment, Instruments &Components—0.6%
1,300 Arrow Electronics, Inc.* . . . . . . . . . . . $ 147,979 2,500 CDW Corp. . . . . . . . . . . . . . . . . . . . . . 436,625 2,500 Jabil, Inc. . . . . . . . . . . . . . . . . . . . . . . . 145,300 729,904
Food and Staples Retailing—0.6% 600 Casey’s General Stores, Inc. . . . . . . . . 116,784 11,800 Walgreens Boots Alliance, Inc. . . . . . . 620,798 737,582
Food Products—1.6% 9,900 Archer-Daniels-Midland Co. . . . . . . . 599,940 2,400 Bunge, Ltd. . . . . . . . . . . . . . . . . . . . . . 187,560 1,500 JM Smucker Co. (The) . . . . . . . . . . . . 194,355 16,700 Kraft Heinz Co. (The) . . . . . . . . . . . . . 681,026 4,000 Tyson Foods, Inc., Class A . . . . . . . . . 295,040 1,957,921
Gas Utilities—0.1% 3,500 UGI Corp. . . . . . . . . . . . . . . . . . . . . . . 162,085
Health Care Providers and Services—11.1%
3,500 AmerisourceBergen Corp. . . . . . . . . . 400,715 4,300 Anthem, Inc. . . . . . . . . . . . . . . . . . . . . 1,641,740 7,200 Centene Corp.* . . . . . . . . . . . . . . . . . . 525,096 4,800 Cigna Corp. . . . . . . . . . . . . . . . . . . . . . 1,137,936 17,210 CVS Health Corp. . . . . . . . . . . . . . . . . 1,436,002 1,900 DaVita, Inc.* . . . . . . . . . . . . . . . . . . . . 228,817 5,900 HCA Healthcare, Inc. . . . . . . . . . . . . . 1,219,766 1,700 Henry Schein, Inc.* . . . . . . . . . . . . . . 126,123 1,700 Laboratory Corp. of America
Holdings* . . . . . . . . . . . . . . . . . . . . . 468,945 2,800 McKesson Corp. . . . . . . . . . . . . . . . . . 535,472 1,000 Molina Healthcare, Inc.* . . . . . . . . . . . 253,060 2,300 Quest Diagnostics, Inc. . . . . . . . . . . . . 303,531 12,990 UnitedHealth Group, Inc. . . . . . . . . . . 5,201,716 1,400 Universal Health Services, Inc.,
Class B . . . . . . . . . . . . . . . . . . . . . . . 205,002 13,683,921
Hotels, Restaurants & Leisure—0.0% 700 Hyatt Hotels Corp., Class A* . . . . . . . 54,348
ValueShares (Note 1)
ValueShares (Note 1)
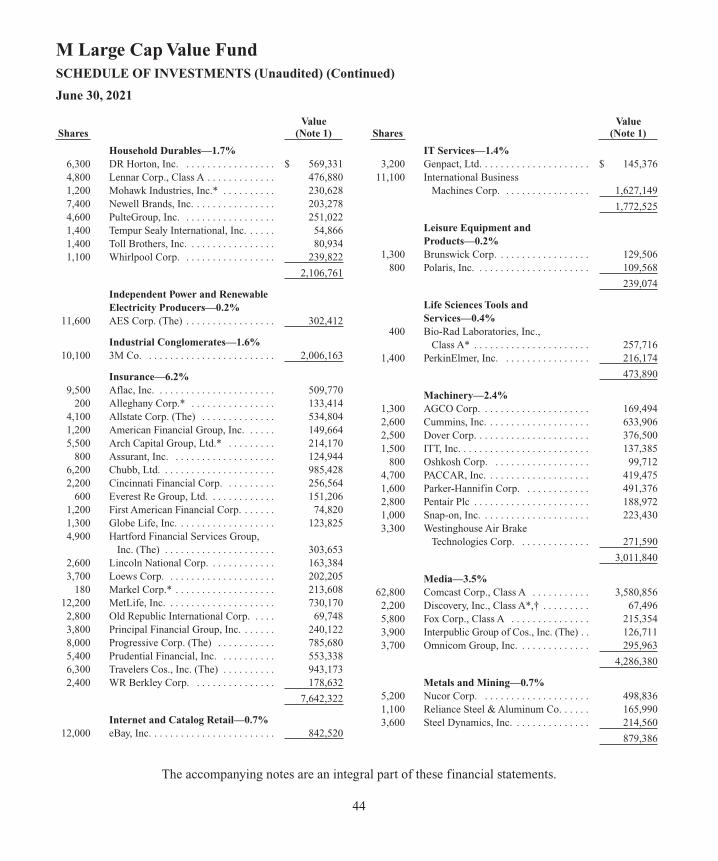
The accompanying notes are an integral part of these financial statements.
44
M Large Cap Value FundSCHEDULE OF INVESTMENTS (Unaudited) (Continued)
June 30, 2021
Household Durables—1.7% 6,300 DR Horton, Inc. . . . . . . . . . . . . . . . . . $ 569,331 4,800 Lennar Corp., Class A . . . . . . . . . . . . . 476,880 1,200 Mohawk Industries, Inc.* . . . . . . . . . . 230,628 7,400 Newell Brands, Inc. . . . . . . . . . . . . . . . 203,278 4,600 PulteGroup, Inc. . . . . . . . . . . . . . . . . . 251,022 1,400 Tempur Sealy International, Inc. . . . . . 54,866 1,400 Toll Brothers, Inc. . . . . . . . . . . . . . . . . 80,934 1,100 Whirlpool Corp. . . . . . . . . . . . . . . . . . 239,822 2,106,761
Independent Power and Renewable Electricity Producers—0.2%
11,600 AES Corp. (The) . . . . . . . . . . . . . . . . . 302,412
Industrial Conglomerates—1.6% 10,100 3M Co. . . . . . . . . . . . . . . . . . . . . . . . . 2,006,163
Insurance—6.2% 9,500 Aflac, Inc. . . . . . . . . . . . . . . . . . . . . . . 509,770 200 Alleghany Corp.* . . . . . . . . . . . . . . . . 133,414 4,100 Allstate Corp. (The) . . . . . . . . . . . . . . 534,804 1,200 American Financial Group, Inc. . . . . . 149,664 5,500 Arch Capital Group, Ltd.* . . . . . . . . . 214,170 800 Assurant, Inc. . . . . . . . . . . . . . . . . . . . 124,944 6,200 Chubb, Ltd. . . . . . . . . . . . . . . . . . . . . . 985,428 2,200 Cincinnati Financial Corp. . . . . . . . . . 256,564 600 Everest Re Group, Ltd. . . . . . . . . . . . . 151,206 1,200 First American Financial Corp. . . . . . . 74,820 1,300 Globe Life, Inc. . . . . . . . . . . . . . . . . . . 123,825 4,900 Hartford Financial Services Group,
Inc. (The) . . . . . . . . . . . . . . . . . . . . . 303,653 2,600 Lincoln National Corp. . . . . . . . . . . . . 163,384 3,700 Loews Corp. . . . . . . . . . . . . . . . . . . . . 202,205 180 Markel Corp.* . . . . . . . . . . . . . . . . . . . 213,608 12,200 MetLife, Inc. . . . . . . . . . . . . . . . . . . . . 730,170 2,800 Old Republic International Corp. . . . . 69,748 3,800 Principal Financial Group, Inc. . . . . . . 240,122 8,000 Progressive Corp. (The) . . . . . . . . . . . 785,680 5,400 Prudential Financial, Inc. . . . . . . . . . . 553,338 6,300 Travelers Cos., Inc. (The) . . . . . . . . . . 943,173 2,400 WR Berkley Corp. . . . . . . . . . . . . . . . 178,632 7,642,322
Internet and Catalog Retail—0.7% 12,000 eBay, Inc. . . . . . . . . . . . . . . . . . . . . . . . 842,520
IT Services—1.4% 3,200 Genpact, Ltd. . . . . . . . . . . . . . . . . . . . . $ 145,376 11,100 International Business
Machines Corp. . . . . . . . . . . . . . . . . 1,627,149 1,772,525
Leisure Equipment and Products—0.2%
1,300 Brunswick Corp. . . . . . . . . . . . . . . . . . 129,506 800 Polaris, Inc. . . . . . . . . . . . . . . . . . . . . . 109,568 239,074
Life Sciences Tools and Services—0.4%
400 Bio-Rad Laboratories, Inc., Class A* . . . . . . . . . . . . . . . . . . . . . . 257,716
1,400 PerkinElmer, Inc. . . . . . . . . . . . . . . . . 216,174 473,890
Machinery—2.4% 1,300 AGCO Corp. . . . . . . . . . . . . . . . . . . . . 169,494 2,600 Cummins, Inc. . . . . . . . . . . . . . . . . . . . 633,906 2,500 Dover Corp. . . . . . . . . . . . . . . . . . . . . . 376,500 1,500 ITT, Inc. . . . . . . . . . . . . . . . . . . . . . . . . 137,385 800 Oshkosh Corp. . . . . . . . . . . . . . . . . . . 99,712 4,700 PACCAR, Inc. . . . . . . . . . . . . . . . . . . . 419,475 1,600 Parker-Hannifin Corp. . . . . . . . . . . . . 491,376 2,800 Pentair Plc . . . . . . . . . . . . . . . . . . . . . . 188,972 1,000 Snap-on, Inc. . . . . . . . . . . . . . . . . . . . . 223,430 3,300 Westinghouse Air Brake
Technologies Corp. . . . . . . . . . . . . . 271,590 3,011,840
Media—3.5% 62,800 Comcast Corp., Class A . . . . . . . . . . . 3,580,856 2,200 Discovery, Inc., Class A*,† . . . . . . . . . 67,496 5,800 Fox Corp., Class A . . . . . . . . . . . . . . . 215,354 3,900 Interpublic Group of Cos., Inc. (The) . . 126,711 3,700 Omnicom Group, Inc. . . . . . . . . . . . . . 295,963 4,286,380
Metals and Mining—0.7% 5,200 Nucor Corp. . . . . . . . . . . . . . . . . . . . . 498,836 1,100 Reliance Steel & Aluminum Co. . . . . . 165,990 3,600 Steel Dynamics, Inc. . . . . . . . . . . . . . . 214,560 879,386
ValueShares (Note 1)
ValueShares (Note 1)

The accompanying notes are an integral part of these financial statements.
45
M Large Cap Value FundSCHEDULE OF INVESTMENTS (Unaudited) (Continued)
June 30, 2021
Multi-Utilities—0.5% 9,300 Public Service Enterprise
Group, Inc. . . . . . . . . . . . . . . . . . . . . $ 555,582
Multiline Retail—2.1% 4,100 Dollar Tree, Inc.* . . . . . . . . . . . . . . . . 407,950 8,800 Target Corp. . . . . . . . . . . . . . . . . . . . . 2,127,312 2,535,262
Oil, Gas and Consumable Fuels—6.0%
4,400 Cheniere Energy, Inc.* . . . . . . . . . . . . 381,656 6,300 Continental Resources, Inc. . . . . . . . . 239,589 10,300 EOG Resources, Inc. . . . . . . . . . . . . . . 859,432 58,000 Exxon Mobil Corp. . . . . . . . . . . . . . . . 3,658,640 31,000 Kinder Morgan, Inc. . . . . . . . . . . . . . . 565,130 9,935 Marathon Oil Corp. . . . . . . . . . . . . . . . 135,314 5,900 Phillips 66 . . . . . . . . . . . . . . . . . . . . . . 506,338 5,600 Valero Energy Corp. . . . . . . . . . . . . . . 437,248 21,500 Williams Cos., Inc. (The) . . . . . . . . . . 570,825 7,354,172
Pharmaceuticals—3.3% 24,800 Johnson & Johnson . . . . . . . . . . . . . . . 4,085,552
Real Estate Management and Development—0.6%
5,800 CBRE Group, Inc., Class A* . . . . . . . 497,234 900 Jones Lang LaSalle, Inc.* . . . . . . . . . . 175,914 673,148
Road and Rail—0.2% 400 AMERCO . . . . . . . . . . . . . . . . . . . . . . 235,760
Semiconductors and SemiconductorEquipment—5.0%
4,800 Broadcom, Inc. . . . . . . . . . . . . . . . . . . 2,288,832 37,600 Intel Corp. . . . . . . . . . . . . . . . . . . . . . . 2,110,864 13,200 Micron Technology, Inc.* . . . . . . . . . . 1,121,736 700 MKS Instruments, Inc. . . . . . . . . . . . . 124,565 1,400 Qorvo, Inc.* . . . . . . . . . . . . . . . . . . . . 273,910 1,500 Skyworks Solutions, Inc. . . . . . . . . . . 287,625 6,207,532
Software—3.4% 7,200 NortonLifeLock, Inc. . . . . . . . . . . . . . 195,984 51,800 Oracle Corp. . . . . . . . . . . . . . . . . . . . . 4,032,112 4,228,096
Specialty Retail—5.1% 1,200 Advance Auto Parts, Inc. . . . . . . . . . . $ 246,168 1,500 AutoNation, Inc.* . . . . . . . . . . . . . . . . 142,215 310 AutoZone, Inc.* . . . . . . . . . . . . . . . . . 462,588 1,300 CarMax, Inc.* . . . . . . . . . . . . . . . . . . . 167,895 800 Dick’s Sporting Goods, Inc. . . . . . . . . 80,152 5,000 Home Depot, Inc. (The) . . . . . . . . . . . 1,594,450 12,800 Lowe’s Cos., Inc. . . . . . . . . . . . . . . . . . 2,482,816 1,300 O’Reilly Automotive, Inc.* . . . . . . . . . 736,073 1,400 Tractor Supply Co. . . . . . . . . . . . . . . . 260,484 1,000 Williams-Sonoma, Inc. . . . . . . . . . . . . 159,650 6,332,491
Technology Hardware, Storage &Peripherals—1.1%
22,900 Hewlett Packard Enterprise Co. . . . . . 333,882 22,900 HP, Inc. . . . . . . . . . . . . . . . . . . . . . . . . 691,351 3,900 NetApp, Inc. . . . . . . . . . . . . . . . . . . . . 319,098 1,344,331
Textiles, Apparel and Luxury Goods—0.1%
2,700 Hanesbrands, Inc. . . . . . . . . . . . . . . . . 50,409 1,600 Skechers U.S.A., Inc., Class A* . . . . . 79,728 130,137
Tobacco—2.2% 13,500 Altria Group, Inc. . . . . . . . . . . . . . . . . 643,680 21,300 Philip Morris International, Inc. . . . . . 2,111,043 2,754,723
Trading Companies and Distributors—0.3%
1,000 United Rentals, Inc.* . . . . . . . . . . . . . . 319,010
TOTAL COMMON STOCKS (Cost $89,876,729) . . . . . . . . . . . . . . 121,216,219
EXCHANGE-TRADED FUND—1.3% 9,800 iShares Russell 1000 Value ETF
(Cost $1,566,155)† . . . . . . . . . . . . . . 1,554,476
ValueShares (Note 1)
ValueShares (Note 1)
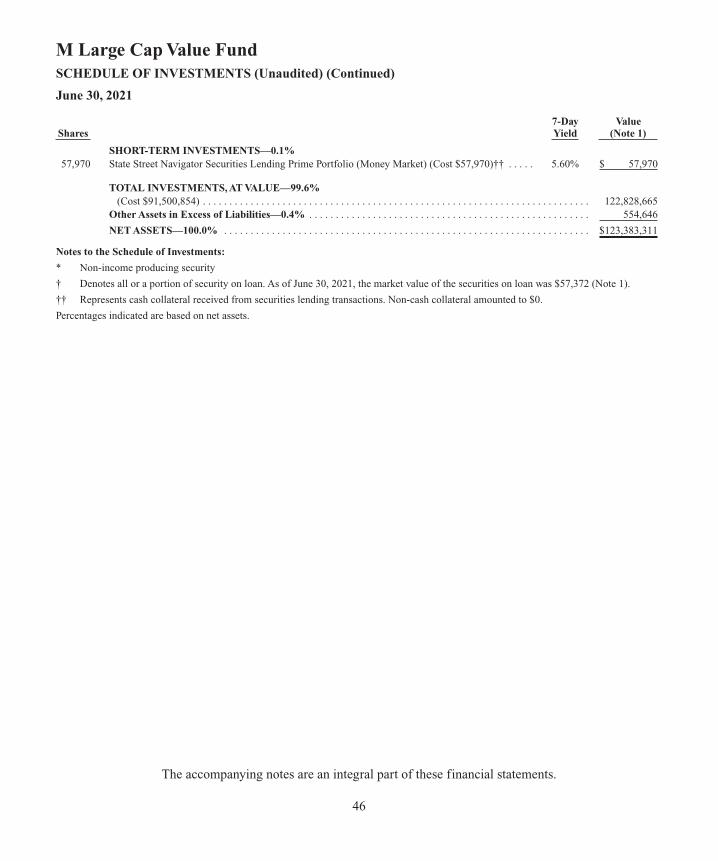
SHORT-TERM INVESTMENTS—0.1% 57,970 State Street Navigator Securities Lending Prime Portfolio (Money Market) (Cost $57,970)†† . . . . . 5.60% $ 57,970
TOTAL INVESTMENTS, AT VALUE—99.6%(Cost $91,500,854) . . . . . . . . . . . . . . . . . . . . . . . . . . . . . . . . . . . . . . . . . . . . . . . . . . . . . . . . . . . . . . . . . . . . . . . . . 122,828,665
Other Assets in Excess of Liabilities—0.4% . . . . . . . . . . . . . . . . . . . . . . . . . . . . . . . . . . . . . . . . . . . . . . . . . . . . . 554,646 NET ASSETS—100.0% . . . . . . . . . . . . . . . . . . . . . . . . . . . . . . . . . . . . . . . . . . . . . . . . . . . . . . . . . . . . . . . . . . . . . $123,383,311
Notes to the Schedule of Investments:
* Non-income producing security
† Denotes all or a portion of security on loan. As of June 30, 2021, the market value of the securities on loan was $57,372 (Note 1).
†† Represents cash collateral received from securities lending transactions. Non-cash collateral amounted to $0.
Percentages indicated are based on net assets.
The accompanying notes are an integral part of these financial statements.
46
7-Day ValueShares Yield (Note 1)
M Large Cap Value FundSCHEDULE OF INVESTMENTS (Unaudited) (Continued)
June 30, 2021
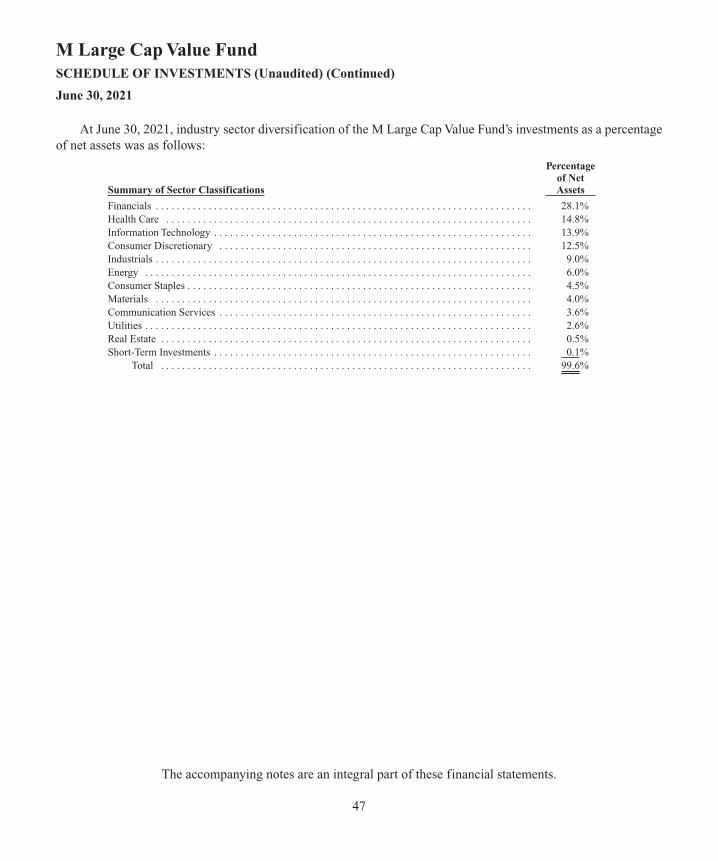
At June 30, 2021, industry sector diversification of the M Large Cap Value Fund’s investments as a percentageof net assets was as follows:
Percentage of Net Summary of Sector Classifications Assets Financials . . . . . . . . . . . . . . . . . . . . . . . . . . . . . . . . . . . . . . . . . . . . . . . . . . . . . . . . . . . . . . . . . . . . . . . 28.1%Health Care . . . . . . . . . . . . . . . . . . . . . . . . . . . . . . . . . . . . . . . . . . . . . . . . . . . . . . . . . . . . . . . . . . . . . 14.8%Information Technology . . . . . . . . . . . . . . . . . . . . . . . . . . . . . . . . . . . . . . . . . . . . . . . . . . . . . . . . . . . . 13.9%Consumer Discretionary . . . . . . . . . . . . . . . . . . . . . . . . . . . . . . . . . . . . . . . . . . . . . . . . . . . . . . . . . . . 12.5%Industrials . . . . . . . . . . . . . . . . . . . . . . . . . . . . . . . . . . . . . . . . . . . . . . . . . . . . . . . . . . . . . . . . . . . . . . . 9.0%Energy . . . . . . . . . . . . . . . . . . . . . . . . . . . . . . . . . . . . . . . . . . . . . . . . . . . . . . . . . . . . . . . . . . . . . . . . . 6.0%Consumer Staples . . . . . . . . . . . . . . . . . . . . . . . . . . . . . . . . . . . . . . . . . . . . . . . . . . . . . . . . . . . . . . . . . 4.5%Materials . . . . . . . . . . . . . . . . . . . . . . . . . . . . . . . . . . . . . . . . . . . . . . . . . . . . . . . . . . . . . . . . . . . . . . . 4.0%Communication Services . . . . . . . . . . . . . . . . . . . . . . . . . . . . . . . . . . . . . . . . . . . . . . . . . . . . . . . . . . . 3.6%Utilities . . . . . . . . . . . . . . . . . . . . . . . . . . . . . . . . . . . . . . . . . . . . . . . . . . . . . . . . . . . . . . . . . . . . . . . . . 2.6%Real Estate . . . . . . . . . . . . . . . . . . . . . . . . . . . . . . . . . . . . . . . . . . . . . . . . . . . . . . . . . . . . . . . . . . . . . . 0.5%Short-Term Investments . . . . . . . . . . . . . . . . . . . . . . . . . . . . . . . . . . . . . . . . . . . . . . . . . . . . . . . . . . . . 0.1%
Total . . . . . . . . . . . . . . . . . . . . . . . . . . . . . . . . . . . . . . . . . . . . . . . . . . . . . . . . . . . . . . . . . . . . . . 99.6%
The accompanying notes are an integral part of these financial statements.
47
M Large Cap Value FundSCHEDULE OF INVESTMENTS (Unaudited) (Continued)
June 30, 2021
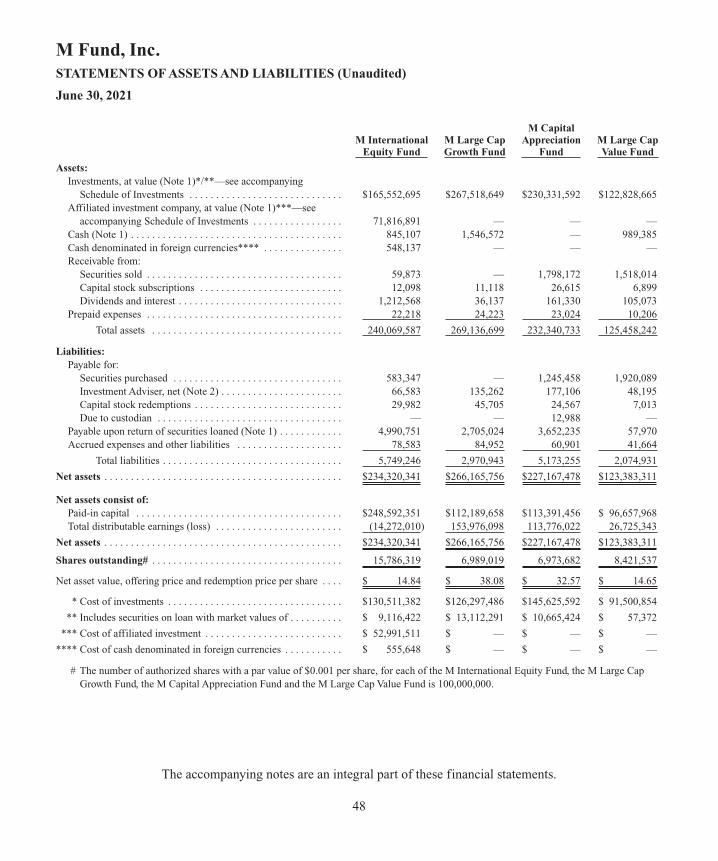
M Capital M International M Large Cap Appreciation M Large Cap Equity Fund Growth Fund Fund Value Fund Assets:
Investments, at value (Note 1)*/**—see accompanying Schedule of Investments . . . . . . . . . . . . . . . . . . . . . . . . . . . . . $165,552,695 $267,518,649 $230,331,592 $122,828,665
Affiliated investment company, at value (Note 1)***—see accompanying Schedule of Investments . . . . . . . . . . . . . . . . . 71,816,891 — — —
Cash (Note 1) . . . . . . . . . . . . . . . . . . . . . . . . . . . . . . . . . . . . . . . . 845,107 1,546,572 — 989,385Cash denominated in foreign currencies**** . . . . . . . . . . . . . . . 548,137 — — —Receivable from:
Securities sold . . . . . . . . . . . . . . . . . . . . . . . . . . . . . . . . . . . . . 59,873 — 1,798,172 1,518,014Capital stock subscriptions . . . . . . . . . . . . . . . . . . . . . . . . . . . 12,098 11,118 26,615 6,899Dividends and interest . . . . . . . . . . . . . . . . . . . . . . . . . . . . . . . 1,212,568 36,137 161,330 105,073
Prepaid expenses . . . . . . . . . . . . . . . . . . . . . . . . . . . . . . . . . . . . . 22,218 24,223 23,024 10,206 Total assets . . . . . . . . . . . . . . . . . . . . . . . . . . . . . . . . . . . . 240,069,587 269,136,699 232,340,733 125,458,242
Liabilities:Payable for:
Securities purchased . . . . . . . . . . . . . . . . . . . . . . . . . . . . . . . . 583,347 — 1,245,458 1,920,089Investment Adviser, net (Note 2) . . . . . . . . . . . . . . . . . . . . . . . 66,583 135,262 177,106 48,195Capital stock redemptions . . . . . . . . . . . . . . . . . . . . . . . . . . . . 29,982 45,705 24,567 7,013Due to custodian . . . . . . . . . . . . . . . . . . . . . . . . . . . . . . . . . . . — — 12,988 —
Payable upon return of securities loaned (Note 1) . . . . . . . . . . . . 4,990,751 2,705,024 3,652,235 57,970Accrued expenses and other liabilities . . . . . . . . . . . . . . . . . . . . 78,583 84,952 60,901 41,664
Total liabilities . . . . . . . . . . . . . . . . . . . . . . . . . . . . . . . . . . 5,749,246 2,970,943 5,173,255 2,074,931 Net assets . . . . . . . . . . . . . . . . . . . . . . . . . . . . . . . . . . . . . . . . . . . . . $234,320,341 $266,165,756 $227,167,478 $123,383,311
Net assets consist of:Paid-in capital . . . . . . . . . . . . . . . . . . . . . . . . . . . . . . . . . . . . . . . $248,592,351 $112,189,658 $113,391,456 $ 96,657,968Total distributable earnings (loss) . . . . . . . . . . . . . . . . . . . . . . . . (14,272,010) 153,976,098 113,776,022 26,725,343
Net assets . . . . . . . . . . . . . . . . . . . . . . . . . . . . . . . . . . . . . . . . . . . . . $234,320,341 $266,165,756 $227,167,478 $123,383,311 Shares outstanding# . . . . . . . . . . . . . . . . . . . . . . . . . . . . . . . . . . . . 15,786,319 6,989,019 6,973,682 8,421,537
Net asset value, offering price and redemption price per share . . . . $ 14.84 $ 38.08 $ 32.57 $ 14.65
* Cost of investments . . . . . . . . . . . . . . . . . . . . . . . . . . . . . . . . . $130,511,382 $126,297,486 $145,625,592 $ 91,500,854
** Includes securities on loan with market values of . . . . . . . . . . $ 9,116,422 $ 13,112,291 $ 10,665,424 $ 57,372
*** Cost of affiliated investment . . . . . . . . . . . . . . . . . . . . . . . . . . $ 52,991,511 $ — $ — $ —
**** Cost of cash denominated in foreign currencies . . . . . . . . . . . $ 555,648 $ — $ — $ —
# The number of authorized shares with a par value of $0.001 per share, for each of the M International Equity Fund, the M Large CapGrowth Fund, the M Capital Appreciation Fund and the M Large Cap Value Fund is 100,000,000.
The accompanying notes are an integral part of these financial statements.
48
M Fund, Inc.STATEMENTS OF ASSETS AND LIABILITIES (Unaudited)
June 30, 2021
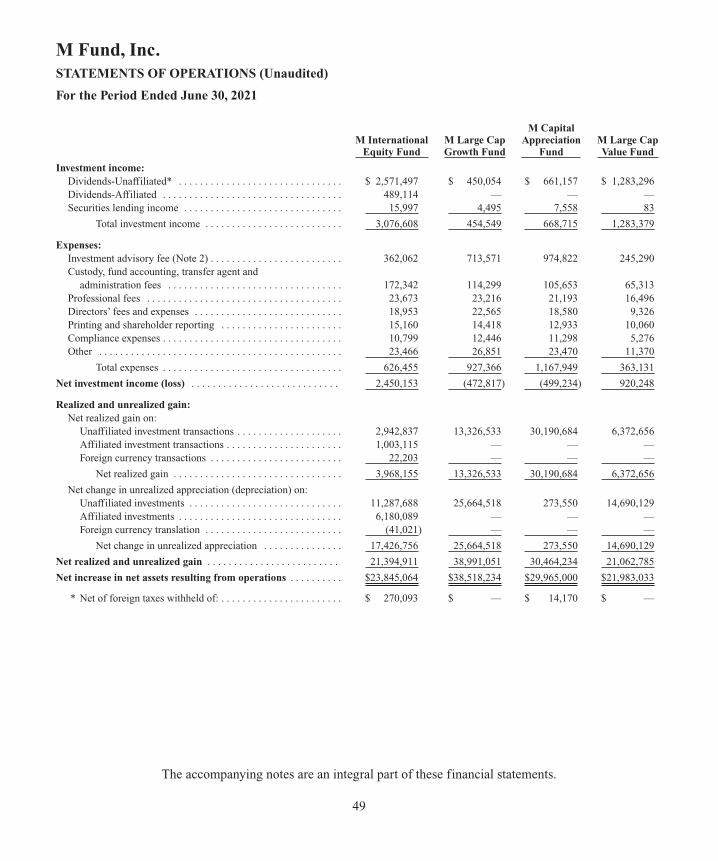
M Capital M International M Large Cap Appreciation M Large Cap Equity Fund Growth Fund Fund Value Fund Investment income:
Dividends-Unaffiliated* . . . . . . . . . . . . . . . . . . . . . . . . . . . . . . . $ 2,571,497 $ 450,054 $ 661,157 $ 1,283,296Dividends-Affiliated . . . . . . . . . . . . . . . . . . . . . . . . . . . . . . . . . . 489,114 — — —Securities lending income . . . . . . . . . . . . . . . . . . . . . . . . . . . . . . 15,997 4,495 7,558 83
Total investment income . . . . . . . . . . . . . . . . . . . . . . . . . . 3,076,608 454,549 668,715 1,283,379
Expenses:Investment advisory fee (Note 2) . . . . . . . . . . . . . . . . . . . . . . . . . 362,062 713,571 974,822 245,290Custody, fund accounting, transfer agent and
administration fees . . . . . . . . . . . . . . . . . . . . . . . . . . . . . . . . . 172,342 114,299 105,653 65,313Professional fees . . . . . . . . . . . . . . . . . . . . . . . . . . . . . . . . . . . . . 23,673 23,216 21,193 16,496Directors’ fees and expenses . . . . . . . . . . . . . . . . . . . . . . . . . . . . 18,953 22,565 18,580 9,326Printing and shareholder reporting . . . . . . . . . . . . . . . . . . . . . . . 15,160 14,418 12,933 10,060Compliance expenses . . . . . . . . . . . . . . . . . . . . . . . . . . . . . . . . . . 10,799 12,446 11,298 5,276Other . . . . . . . . . . . . . . . . . . . . . . . . . . . . . . . . . . . . . . . . . . . . . . 23,466 26,851 23,470 11,370
Total expenses . . . . . . . . . . . . . . . . . . . . . . . . . . . . . . . . . . 626,455 927,366 1,167,949 363,131 Net investment income (loss) . . . . . . . . . . . . . . . . . . . . . . . . . . . . 2,450,153 (472,817) (499,234) 920,248
Realized and unrealized gain:Net realized gain on:
Unaffiliated investment transactions . . . . . . . . . . . . . . . . . . . . 2,942,837 13,326,533 30,190,684 6,372,656Affiliated investment transactions . . . . . . . . . . . . . . . . . . . . . . 1,003,115 — — —Foreign currency transactions . . . . . . . . . . . . . . . . . . . . . . . . . 22,203 — — —
Net realized gain . . . . . . . . . . . . . . . . . . . . . . . . . . . . . . . . 3,968,155 13,326,533 30,190,684 6,372,656 Net change in unrealized appreciation (depreciation) on:
Unaffiliated investments . . . . . . . . . . . . . . . . . . . . . . . . . . . . . 11,287,688 25,664,518 273,550 14,690,129Affiliated investments . . . . . . . . . . . . . . . . . . . . . . . . . . . . . . . 6,180,089 — — —Foreign currency translation . . . . . . . . . . . . . . . . . . . . . . . . . . (41,021) — — —
Net change in unrealized appreciation . . . . . . . . . . . . . . . 17,426,756 25,664,518 273,550 14,690,129 Net realized and unrealized gain . . . . . . . . . . . . . . . . . . . . . . . . . 21,394,911 38,991,051 30,464,234 21,062,785 Net increase in net assets resulting from operations . . . . . . . . . . $23,845,064 $38,518,234 $29,965,000 $21,983,033
* Net of foreign taxes withheld of: . . . . . . . . . . . . . . . . . . . . . . . $ 270,093 $ — $ 14,170 $ —
The accompanying notes are an integral part of these financial statements.
49
M Fund, Inc.STATEMENTS OF OPERATIONS (Unaudited)
For the Period Ended June 30, 2021
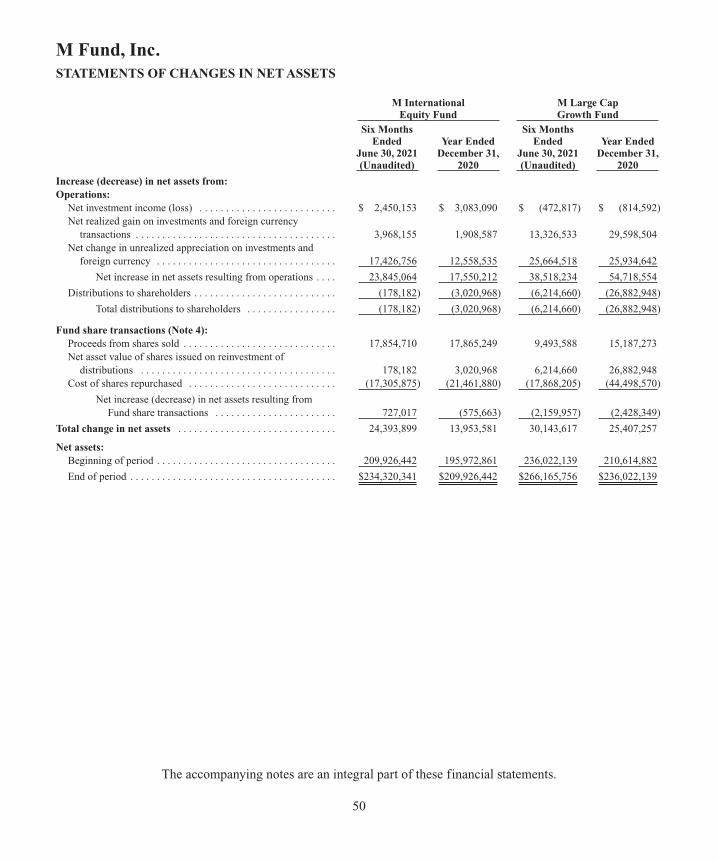
M International M Large Cap Equity Fund Growth Fund Six Months Six Months Ended Year Ended Ended Year Ended June 30, 2021 December 31, June 30, 2021 December 31, (Unaudited) 2020 (Unaudited) 2020 Increase (decrease) in net assets from:Operations:
Net investment income (loss) . . . . . . . . . . . . . . . . . . . . . . . . . . $ 2,450,153 $ 3,083,090 $ (472,817) $ (814,592)Net realized gain on investments and foreign currency
transactions . . . . . . . . . . . . . . . . . . . . . . . . . . . . . . . . . . . . . . 3,968,155 1,908,587 13,326,533 29,598,504Net change in unrealized appreciation on investments and
foreign currency . . . . . . . . . . . . . . . . . . . . . . . . . . . . . . . . . . 17,426,756 12,558,535 25,664,518 25,934,642 Net increase in net assets resulting from operations . . . . 23,845,064 17,550,212 38,518,234 54,718,554
Distributions to shareholders . . . . . . . . . . . . . . . . . . . . . . . . . . . (178,182) (3,020,968) (6,214,660) (26,882,948) Total distributions to shareholders . . . . . . . . . . . . . . . . . (178,182) (3,020,968) (6,214,660) (26,882,948)
Fund share transactions (Note 4):Proceeds from shares sold . . . . . . . . . . . . . . . . . . . . . . . . . . . . . 17,854,710 17,865,249 9,493,588 15,187,273Net asset value of shares issued on reinvestment of
distributions . . . . . . . . . . . . . . . . . . . . . . . . . . . . . . . . . . . . . 178,182 3,020,968 6,214,660 26,882,948Cost of shares repurchased . . . . . . . . . . . . . . . . . . . . . . . . . . . . (17,305,875) (21,461,880) (17,868,205) (44,498,570)
Net increase (decrease) in net assets resulting from Fund share transactions . . . . . . . . . . . . . . . . . . . . . . . 727,017 (575,663) (2,159,957) (2,428,349)
Total change in net assets . . . . . . . . . . . . . . . . . . . . . . . . . . . . . . 24,393,899 13,953,581 30,143,617 25,407,257
Net assets:Beginning of period . . . . . . . . . . . . . . . . . . . . . . . . . . . . . . . . . . 209,926,442 195,972,861 236,022,139 210,614,882 End of period . . . . . . . . . . . . . . . . . . . . . . . . . . . . . . . . . . . . . . . $234,320,341 $209,926,442 $266,165,756 $236,022,139
The accompanying notes are an integral part of these financial statements.
50
M Fund, Inc.STATEMENTS OF CHANGES IN NET ASSETS
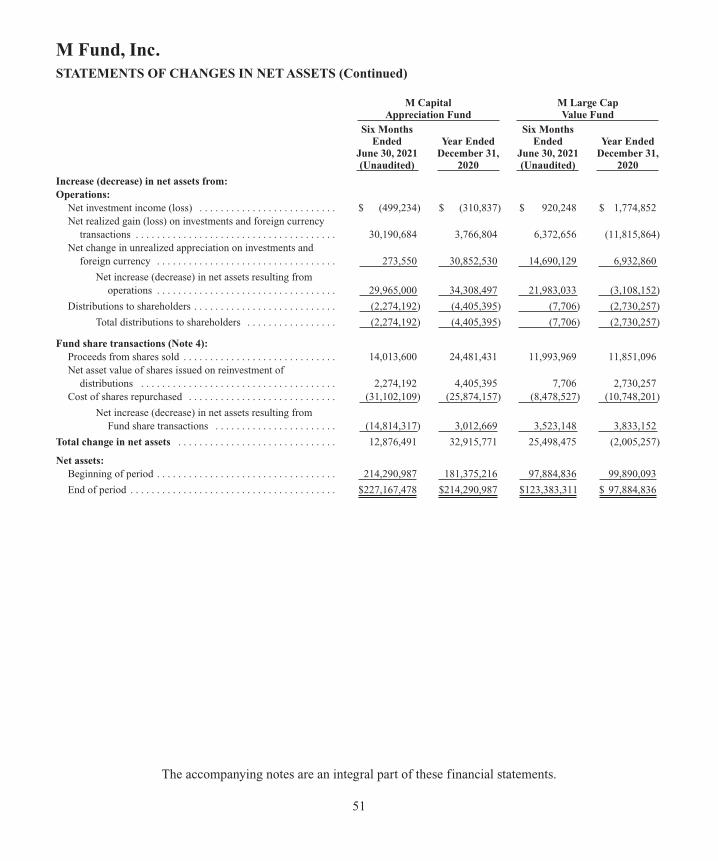
M Capital M Large Cap Appreciation Fund Value Fund Six Months Six Months Ended Year Ended Ended Year Ended June 30, 2021 December 31, June 30, 2021 December 31, (Unaudited) 2020 (Unaudited) 2020 Increase (decrease) in net assets from:Operations:
Net investment income (loss) . . . . . . . . . . . . . . . . . . . . . . . . . . $ (499,234) $ (310,837) $ 920,248 $ 1,774,852Net realized gain (loss) on investments and foreign currency
transactions . . . . . . . . . . . . . . . . . . . . . . . . . . . . . . . . . . . . . . 30,190,684 3,766,804 6,372,656 (11,815,864)Net change in unrealized appreciation on investments and
foreign currency . . . . . . . . . . . . . . . . . . . . . . . . . . . . . . . . . . 273,550 30,852,530 14,690,129 6,932,860 Net increase (decrease) in net assets resulting from
operations . . . . . . . . . . . . . . . . . . . . . . . . . . . . . . . . . . 29,965,000 34,308,497 21,983,033 (3,108,152) Distributions to shareholders . . . . . . . . . . . . . . . . . . . . . . . . . . . (2,274,192) (4,405,395) (7,706) (2,730,257)
Total distributions to shareholders . . . . . . . . . . . . . . . . . (2,274,192) (4,405,395) (7,706) (2,730,257)
Fund share transactions (Note 4):Proceeds from shares sold . . . . . . . . . . . . . . . . . . . . . . . . . . . . . 14,013,600 24,481,431 11,993,969 11,851,096Net asset value of shares issued on reinvestment of
distributions . . . . . . . . . . . . . . . . . . . . . . . . . . . . . . . . . . . . . 2,274,192 4,405,395 7,706 2,730,257Cost of shares repurchased . . . . . . . . . . . . . . . . . . . . . . . . . . . . (31,102,109) (25,874,157) (8,478,527) (10,748,201)
Net increase (decrease) in net assets resulting from Fund share transactions . . . . . . . . . . . . . . . . . . . . . . . (14,814,317) 3,012,669 3,523,148 3,833,152
Total change in net assets . . . . . . . . . . . . . . . . . . . . . . . . . . . . . . 12,876,491 32,915,771 25,498,475 (2,005,257)
Net assets:Beginning of period . . . . . . . . . . . . . . . . . . . . . . . . . . . . . . . . . . 214,290,987 181,375,216 97,884,836 99,890,093 End of period . . . . . . . . . . . . . . . . . . . . . . . . . . . . . . . . . . . . . . . $227,167,478 $214,290,987 $123,383,311 $ 97,884,836
The accompanying notes are an integral part of these financial statements.
51
M Fund, Inc.STATEMENTS OF CHANGES IN NET ASSETS (Continued)
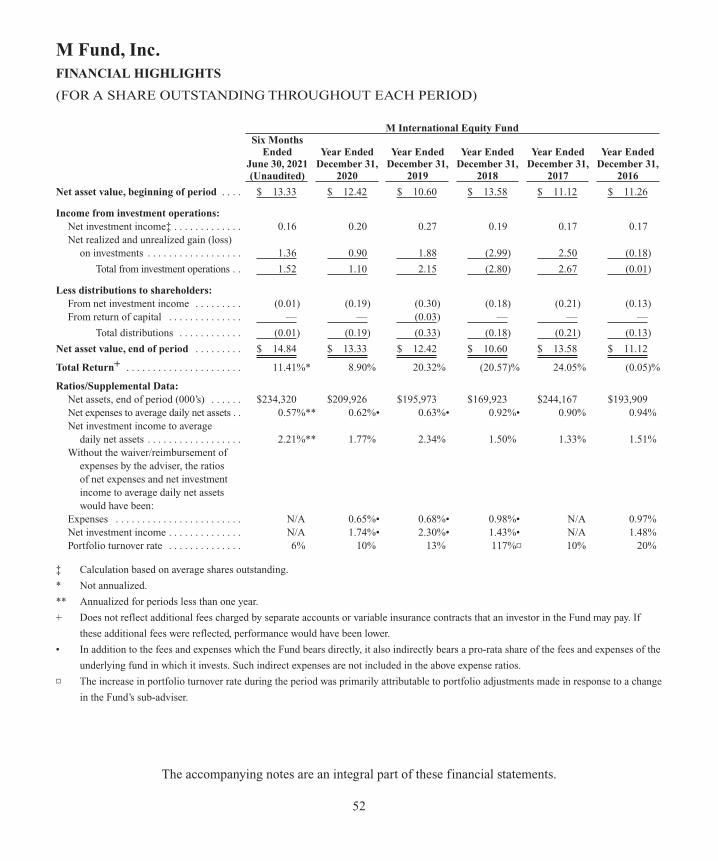
M International Equity Fund Six Months Ended Year Ended Year Ended Year Ended Year Ended Year Ended June 30, 2021 December 31, December 31, December 31, December 31, December 31, (Unaudited) 2020 2019 2018 2017 2016 Net asset value, beginning of period . . . . $ 13.33 $ 12.42 $ 10.60 $ 13.58 $ 11.12 $ 11.26
Income from investment operations:Net investment income‡ . . . . . . . . . . . . . 0.16 0.20 0.27 0.19 0.17 0.17Net realized and unrealized gain (loss)
on investments . . . . . . . . . . . . . . . . . . 1.36 0.90 1.88 (2.99) 2.50 (0.18) Total from investment operations . . 1.52 1.10 2.15 (2.80) 2.67 (0.01)
Less distributions to shareholders:From net investment income . . . . . . . . . (0.01) (0.19) (0.30) (0.18) (0.21) (0.13)From return of capital . . . . . . . . . . . . . . — — (0.03) — — —
Total distributions . . . . . . . . . . . . (0.01) (0.19) (0.33) (0.18) (0.21) (0.13) Net asset value, end of period . . . . . . . . . $ 14.84 $ 13.33 $ 12.42 $ 10.60 $ 13.58 $ 11.12 Total Return+ . . . . . . . . . . . . . . . . . . . . . . 11.41%* 8.90% 20.32% (20.57)% 24.05% (0.05)%
Ratios/Supplemental Data:Net assets, end of period (000’s) . . . . . . $234,320 $209,926 $195,973 $169,923 $244,167 $193,909Net expenses to average daily net assets . . 0.57%** 0.62%• 0.63%• 0.92%• 0.90% 0.94%Net investment income to average
daily net assets . . . . . . . . . . . . . . . . . . 2.21%** 1.77% 2.34% 1.50% 1.33% 1.51%Without the waiver/reimbursement of
expenses by the adviser, the ratios of net expenses and net investment income to average daily net assets would have been:
Expenses . . . . . . . . . . . . . . . . . . . . . . . . N/A 0.65%• 0.68%• 0.98%• N/A 0.97%Net investment income . . . . . . . . . . . . . . N/A 1.74%• 2.30%• 1.43%• N/A 1.48%Portfolio turnover rate . . . . . . . . . . . . . . 6% 10% 13% 117%¤ 10% 20%
‡ Calculation based on average shares outstanding.
* Not annualized.
** Annualized for periods less than one year.
+ Does not reflect additional fees charged by separate accounts or variable insurance contracts that an investor in the Fund may pay. If
these additional fees were reflected, performance would have been lower.
• In addition to the fees and expenses which the Fund bears directly, it also indirectly bears a pro-rata share of the fees and expenses of the
underlying fund in which it invests. Such indirect expenses are not included in the above expense ratios.
¤ The increase in portfolio turnover rate during the period was primarily attributable to portfolio adjustments made in response to a change
in the Fund’s sub-adviser.
The accompanying notes are an integral part of these financial statements.
52
M Fund, Inc.FINANCIAL HIGHLIGHTS
(FOR A SHARE OUTSTANDING THROUGHOUT EACH PERIOD)

M Large Cap Growth Fund Six Months Ended Year Ended Year Ended Year Ended Year Ended Year Ended June 30, 2021 December 31, December 31, December 31, December 31, December 31, (Unaudited) 2020 2019 2018 2017 2016 Net asset value, beginning of period . . . . $ 33.48 $ 29.33 $ 22.85 $ 27.01 $ 19.97 $ 21.66
Income from investment operations:Net investment loss‡ . . . . . . . . . . . . . . . (0.07) (0.12) (0.07) (0.03) (0.05) (0.05)Net realized and unrealized gain (loss)
on investments . . . . . . . . . . . . . . . . . . 5.58 8.46 8.31 (1.12) 7.83 (0.45) Total from investment operations . . 5.51 8.34 8.24 (1.15) 7.78 (0.50)
Less distributions to shareholders:From net realized capital gains . . . . . . . . (0.91) (4.19) (1.76) (3.01) (0.74) (1.19)
Net asset value, end of period . . . . . . . . . $ 38.08 $ 33.48 $ 29.33 $ 22.85 $ 27.01 $ 19.97 Total Return+ . . . . . . . . . . . . . . . . . . . . . . 16.55%* 28.89% 36.09% (4.95)% 38.97% (2.32)%
Ratios/Supplemental Data:Net assets, end of period (000’s) . . . . . . $266,166 $236,022 $210,615 $168,222 $193,379 $157,766Net expenses to average daily net assets . . 0.75%** 0.78% 0.77% 0.75% 0.73% 0.78%Net investment loss to average
daily net assets . . . . . . . . . . . . . . . . . . (0.38)%** (0.38)% (0.25)% (0.11)% (0.20)% (0.26)%Portfolio turnover rate . . . . . . . . . . . . . . 10% 31% 22% 34% 49% 36%
‡ Calculation based on average shares outstanding.
* Not annualized.
** Annualized for periods less than one year.
+ Does not reflect additional fees charged by separate accounts or variable insurance contracts that an investor in the Fund may pay. If
these additional fees were reflected, performance would have been lower.
The accompanying notes are an integral part of these financial statements.
53
M Fund, Inc.FINANCIAL HIGHLIGHTS
(FOR A SHARE OUTSTANDING THROUGHOUT EACH PERIOD)
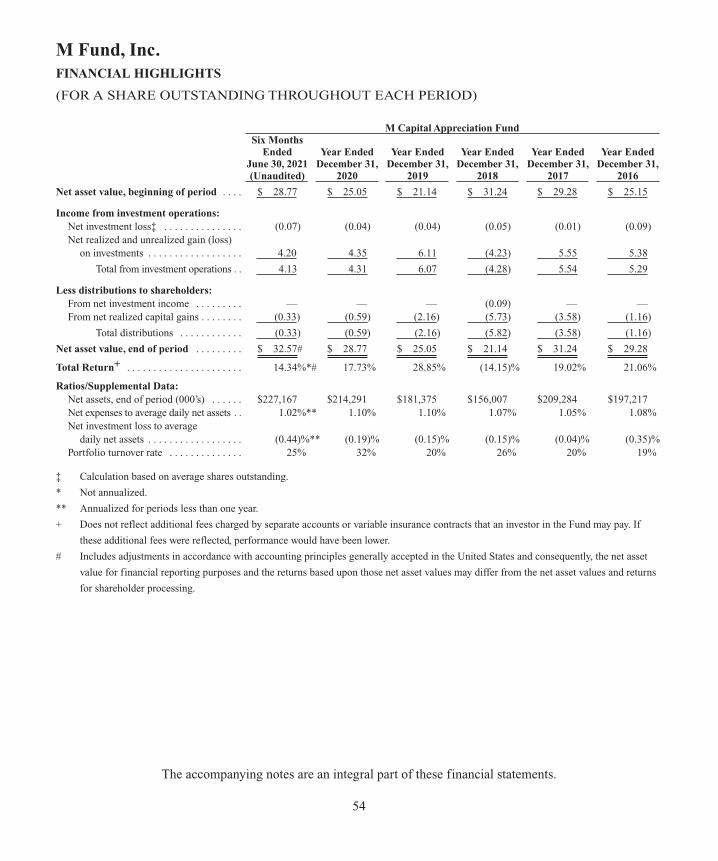
M Capital Appreciation Fund Six Months Ended Year Ended Year Ended Year Ended Year Ended Year Ended June 30, 2021 December 31, December 31, December 31, December 31, December 31, (Unaudited) 2020 2019 2018 2017 2016 Net asset value, beginning of period . . . . $ 28.77 $ 25.05 $ 21.14 $ 31.24 $ 29.28 $ 25.15
Income from investment operations:Net investment loss‡ . . . . . . . . . . . . . . . (0.07) (0.04) (0.04) (0.05) (0.01) (0.09)Net realized and unrealized gain (loss)
on investments . . . . . . . . . . . . . . . . . . 4.20 4.35 6.11 (4.23) 5.55 5.38 Total from investment operations . . 4.13 4.31 6.07 (4.28) 5.54 5.29
Less distributions to shareholders:From net investment income . . . . . . . . . — — — (0.09) — —From net realized capital gains . . . . . . . . (0.33) (0.59) (2.16) (5.73) (3.58) (1.16)
Total distributions . . . . . . . . . . . . (0.33) (0.59) (2.16) (5.82) (3.58) (1.16) Net asset value, end of period . . . . . . . . . $ 32.57# $ 28.77 $ 25.05 $ 21.14 $ 31.24 $ 29.28 Total Return+ . . . . . . . . . . . . . . . . . . . . . . 14.34%*# 17.73% 28.85% (14.15)% 19.02% 21.06%
Ratios/Supplemental Data:Net assets, end of period (000’s) . . . . . . $227,167 $214,291 $181,375 $156,007 $209,284 $197,217Net expenses to average daily net assets . . 1.02%** 1.10% 1.10% 1.07% 1.05% 1.08%Net investment loss to average
daily net assets . . . . . . . . . . . . . . . . . . (0.44)%** (0.19)% (0.15)% (0.15)% (0.04)% (0.35)%Portfolio turnover rate . . . . . . . . . . . . . . 25% 32% 20% 26% 20% 19%
‡ Calculation based on average shares outstanding.
* Not annualized.
** Annualized for periods less than one year.
+ Does not reflect additional fees charged by separate accounts or variable insurance contracts that an investor in the Fund may pay. If
these additional fees were reflected, performance would have been lower.
# Includes adjustments in accordance with accounting principles generally accepted in the United States and consequently, the net asset
value for financial reporting purposes and the returns based upon those net asset values may differ from the net asset values and returns
for shareholder processing.
The accompanying notes are an integral part of these financial statements.
54
M Fund, Inc.FINANCIAL HIGHLIGHTS
(FOR A SHARE OUTSTANDING THROUGHOUT EACH PERIOD)

M Large Cap Value Fund Six Months Ended Year Ended Year Ended Year Ended Year Ended Year Ended June 30, 2021 December 31, December 31, December 31, December 31, December 31, (Unaudited) 2020 2019 2018 2017 2016 Net asset value, beginning of period . . . . $ 12.02 $ 12.80 $ 11.06 $ 13.93 $ 12.89 $ 11.96
Income from investment operations:Net investment income‡ . . . . . . . . . . . . . 0.11 0.23 0.22 0.20 0.21 0.22Net realized and unrealized gain (loss)
on investments . . . . . . . . . . . . . . . . . . 2.52 (0.66) 2.16 (1.88) 1.73 0.94 Total from investment operations . . 2.63 (0.43) 2.38 (1.68) 1.94 1.16
Less distributions to shareholders:From net investment income . . . . . . . . . (0.00)† (0.22) (0.22) (0.20) (0.21) (0.23)From net realized capital gains . . . . . . . . — (0.13) (0.42) (0.99) (0.69) —
Total distributions . . . . . . . . . . . . (0.00)† (0.35) (0.64) (1.19) (0.90) (0.23) Net asset value, end of period . . . . . . . . . . $ 14.65 $ 12.02 $ 12.80 $ 11.06 $ 13.93 $ 12.89 Total Return+ . . . . . . . . . . . . . . . . . . . . . . 21.89%* (3.16)% 21.52% (12.07)% 14.99% 9.73%#
Ratios/Supplemental Data:Net assets, end of period (000’s) . . . . . . . $123,383 $97,885 $99,890 $85,437 $99,501 $91,189Net expenses to average daily net assets . . 0.64%** 0.68% 0.68% 0.64% 0.64% 0.68%Net investment income to average
daily net assets . . . . . . . . . . . . . . . . . . 1.61%** 2.09% 1.73% 1.47% 1.57% 1.85%Without the waiver/reimbursement of
expenses by the adviser, the ratios of net expenses and net investment income to average daily net assets would have been:
Expenses . . . . . . . . . . . . . . . . . . . . . . . . . N/A 0.72% 0.69% 0.66% 0.64% 0.68%Net investment income . . . . . . . . . . . . . . N/A 2.06% 1.72% 1.45% 1.56% 1.85%Portfolio turnover rate . . . . . . . . . . . . . . 35% 157%¤ 107% 82% 75% 54%
‡ Calculation based on average shares outstanding.
† Amount rounds to less than $0.005.
* Not annualized.
** Annualized for periods less than one year.
+ Does not reflect additional fees charged by separate accounts or variable insurance contracts that an investor in the Fund may pay. If
these additional fees were reflected, performance would have been lower.
# Includes adjustments in accordance with accounting principles generally accepted in the United States and consequently, the net asset
value for financial reporting purposes and the returns based upon those net asset values may differ from the net asset values and returns
for shareholder processing.
¤ The increase in portfolio turnover rate during the period was primarily attributable to portfolio adjustments made in response to a change
in the Fund’s sub-adviser.
The accompanying notes are an integral part of these financial statements.
55
M Fund, Inc.FINANCIAL HIGHLIGHTS
(FOR A SHARE OUTSTANDING THROUGHOUT EACH PERIOD)
M Fund, Inc. (the “Corporation”) was incorporated in Maryland on August 11, 1995 and is registered under theInvestment Company Act of 1940, as amended (the “1940 Act”), as an open-end management investment company.As of June 30, 2021, the Corporation consisted of four separate diversified investment portfolios: M InternationalEquity Fund, M Large Cap Growth Fund, M Capital Appreciation Fund and M Large Cap Value Fund (each singularlya “Fund” or collectively the “Funds”), each of which is a separate mutual fund.
The Corporation offers shares of the Funds to certain insurance company separate accounts, which serve as theunderlying funding vehicles for certain variable annuity and variable life insurance policies. These annuities andinsurance policies are offered primarily by members of M Financial Holdings Incorporated (“M Financial Group”)and are issued by certain life insurance companies.
M International Equity Fund
M International Equity Fund seeks to achieve its investment objective through exposure to a broad and diversegroup of securities of non-U.S. companies in countries with developed and emerging markets with a greater emphasison small capitalization, value and/or high profitability companies as compared to their representation in the Non-U.S. Universe. For purposes of the Fund, Dimensional Fund Advisors LP (“DFA”), the Fund’s sub-adviser, definesthe Non-U.S. Universe as a market capitalization weighted portfolio of non-U.S. companies in developed andemerging markets that have been authorized for investment as approved markets by the DFA’s Investment Committee.The Fund may pursue its investment objective by investing its assets directly and/or indirectly by investing its assetsin the DFA Emerging Markets Core Equity Portfolio of DFA Investment Dimensions Group Inc. (the “UnderlyingFund”). The Underlying Fund purchases a broad and diverse group of securities associated with emerging markets,which may include frontier markets (emerging market countries in an earlier stage of development), with a greateremphasis on small capitalization, value, and/or high profitability companies. As of the date of this report, it isanticipated that a significant portion of the Fund’s assets will be invested indirectly through the Underlying Fund.
The Fund’s increased exposure to small capitalization, value, and/or high profitability companies may be achievedby decreasing the allocation of the Fund’s assets to the largest growth and/or low profitability companies relative totheir weight in the Non-U.S. Universe, which would result in a greater weight allocation to small capitalization,value, and/or high profitability companies. DFA considers an equity issuer to be a growth company primarilybecause it has a high price in relation to its book value. Securities are considered value stocks primarily because acompany’s shares have a low price in relation to their book value. In assessing growth and value, DFA may consideradditional factors such as price to cash flow or price to earnings ratios. In assessing profitability, DFA may considerdifferent ratios, such as that of earnings or profits from operations relative to book value or assets. The criteria DFAuses for assessing growth, value, or profitability are subject to change from time to time. DFA determines companysize on a country or region-specific basis and based primarily on market capitalization. DFA may adjust therepresentation in the Fund of an eligible company, or exclude a company, after considering such factors as freefloat, momentum, trading strategies, liquidity, size, value, profitability, investment characteristics, and other factorsthat DFA determines to be appropriate. In assessing a company’s investment characteristics, DFA may considerratios such as recent changes in assets or book value scaled by assets or book value. The criteria DFA uses forassessing a company’s investment characteristics are subject to change from time to time.
The Fund will normally invest at least 80% of its total assets in equity securities of issuers located in at least threecountries other than the United States. These countries may include, but are not limited to, the nations of Western
56
M Fund, Inc.NOTES TO FINANCIAL STATEMENTS (Unaudited)
Europe, North and South America, Australia, Africa and Asia. This strategy is not fundamental (it may be changedwithout shareholder approval), but should the Fund decide to change this strategy, it will provide shareholders withat least 60 days’ notice. The Fund may invest up to 40% of its total assets in emerging markets.
The Fund may gain exposure to companies associated with approved markets by purchasing equity securities in theform of depositary receipts, which may be listed or traded outside the issuer’s domicile country. The Fund maypurchase or sell futures contracts and options on futures contracts for foreign or U.S. equity securities and indices,to adjust market exposure based on actual or expected cash inflows to or outflows from the Fund. The Fund doesnot intend to sell futures contracts to establish short positions in individual securities or to use derivatives forpurposes of speculation or leveraging investment returns.
M Large Cap Growth Fund
M Large Cap Growth Fund will normally invest at least 80% of its total assets in domestic equity securities of U.S.large capitalization securities. Domestic equity securities, as determined by DSM Capital Partners LLC (“DSM”),the Fund’s sub-adviser, in its discretion, include, but are not limited to common stocks, preferred stocks, securitiesconvertible into common stocks, rights and warrants. Shares of foreign domiciled issuers that primarily trade on aU.S. exchange are generally considered by DSM to be domestic equity securities. Also, as determined by DSM,issuers that issue domestic equity securities may be domiciled and/or headquartered anywhere in the world. TheFund may generally invest up to 20% of its assets in equity securities of foreign issuers, including AmericanDepositary Receipts and similar securities. DSM defines “large cap” as capitalizations of $10 billion or more. TheFund will generally contain 25 to 35 equity securities.
This strategy to invest at least 80% of its total assets in domestic equity securities of U.S. large capitalizationsecurities is not fundamental (it may be changed without shareholder approval), but should the Fund decide tochange this strategy, it will provide shareholders with at least 60 days’ notice.
DSM uses a “bottom-up,” idea-driven approach and focuses on a long-term (e.g., three-year minimum) investmenthorizon.
DSM seeks to invest in growing businesses with solid fundamentals, attractive profitability and successfulmanagement. Candidate companies will typically have projected revenue and earnings growth in excess of 10%and will often have higher returns on equity and assets than average S&P 500 companies. Generally, these businesseswill be generating free cash flow and will have financial returns that are stable or rising, driven by improvingbusiness fundamentals, all as determined by DSM.
In its stock valuation work, DSM focuses primarily on P/E ratios. P/E is the ratio of a company’s share price to itsper-share earnings. DSM will generally only buy a stock that it believes has a forward four-quarter P/E ratio thatwill rise over the next three years. To accomplish this, a target P/E ratio that DSM believes is reasonable and rationaland is reflective of a fair valued stock three years from now is selected. DSM will typically buy when the company’sstock clears two hurdles: 1. it must have attractive fundamental business characteristics that translate into a reasonablypredictable and growing stream of earnings and 2. it must have a P/E on forward four quarters earnings that isnormally 8% to 10% below the target P/E three years from the calculation point. In order to determine a target P/E,DSM takes into consideration a number of qualitative and quantitative factors. Among the qualitative factors arebarriers to entry, number of competitors, economic cyclicality, customer loyalty, price competition, global reach,
57
M Fund, Inc.NOTES TO FINANCIAL STATEMENTS (Unaudited) (Continued)
government involvement and management quality. Among the quantitative factors are historic revenue and EPSgrowth, projected revenue and EPS growth, margins, return on assets, return on equity, capital expenditures relativeto net income and the historic range of P/E over the last five years. Once a target P/E has been agreed upon, it mayoccasionally be adjusted.
M Capital Appreciation Fund
M Capital Appreciation Fund principally invests in common stock of U.S. companies of all sizes, with emphasis onstocks of companies with capitalizations that are consistent with the capitalizations of those companies found inthe Russell 2500® Index. As of June 30, 2021, the market capitalization range of companies in the Russell 2500®
Index was between approximately $0.03 billion and $25.52 billion. The Fund may invest up to 15% of the value ofits total assets in equity securities of foreign issuers.
The Fund’s sub-adviser, Frontier Capital Management Company, LLC (“Frontier”) seeks long-term capitalappreciation by employing a Growth-At-A-Reasonable-Price approach to identify, in its view, the best risk/rewardinvestment ideas in the U.S. small- and mid-capitalization equity universe. Frontier purchases companies that, in itsview, have above-average earnings growth potential and are available at reasonable valuations. Frontier’s philosophycombines rigorous bottom-up fundamental analysis with a proven investment process.
Frontier may sell stocks for a number of reasons, including when price objectives are reached, fundamental conditionshave changed so that future earnings progress is likely to be adversely affected, or a stock is fully invested and anattractive, new opportunity causes the sale of a current holding with less appreciation potential. Frontier does notsell stocks solely on changes to a company’s market capitalization.
M Large Cap Value Fund
M Large Cap Value Fund invests at least 80% of its net assets, plus the amount of borrowings for investmentpurposes, if any, in issuers domiciled, or having their principal activities, in the United States, at the time ofinvestment or other instruments with similar economic characteristics. In addition, the Fund normally invests atleast 80% of its net assets in equity securities of large capitalization companies. Brandywine Global InvestmentManagement, LLC (“Brandywine”), the Fund’s sub-adviser, defines “large capitalization” companies as thosecompanies with market capitalizations similar to companies in the Russell 1000® Index (the “Index”). As of June 30,2021, the market capitalization range of companies in the Index was between approximately $730.3 million to$2.3 trillion. This strategy is not fundamental (it may be changed without shareholder approval), but should theFund decide to change this strategy, it will provide shareholders with at least 60 days’ notice.
The Fund invests primarily in equity securities that, in Brandywine’s opinion, are undervalued or out of favor.Brandywine invests in securities that meet its value criteria, primarily price-to-earnings, price-to-book, pricemomentum and share change and quality, based on both quantitative and fundamental analysis. The Fund expectsto hold approximately 175-250 stocks under normal market conditions.
Brandywine bases portfolio price targets on quantitative criteria determined in its sell process. Brandywine’s systemsupdate these quantitatively determined buy and sell limits on a daily basis. Buy candidates must have a price thatqualifies the stock as a value such that the price-to-earnings ratio is in the lower 40% of its universe or the price-to-book is in the lower 25% of its universe at time of purchase. Additionally, the current price compared to the price
58
M Fund, Inc.NOTES TO FINANCIAL STATEMENTS (Unaudited) (Continued)
nine months ago must place it above the lower quartile of other universe stocks when ranked by nine month pricemomentum and the change in shares outstanding over the past year must place it below the upper quartile.
Sell candidates will have a price that when compared to earnings and book place the stock above the median on aprice-to-earnings basis and above the 40th percentile on a price-to-book basis. If a stock’s price declines relative tothe universe such that it falls to the lower 10% of stocks as ranked on nine month price momentum or the companyissues sufficient shares to rank among the top 10% largest issuers (as a percentage of shares outstanding) in theyear, the holding will be a sell candidate. Additionally, a stock will be sold if the capitalization falls 20% below theminimum purchase capitalization criteria.
Brandywine may modify buy and sell trigger points and decisions only due to tracking error considerations, tradingopportunities or limitations such as position, industry or sector size. Brandywine does not violate its buy and sellrules based on analyst affinity for the stock. Its investment process requires disciplined buy and sell decisions ruleswith carefully outlined exceptions.
If a security experiences a severe fundamental deterioration event that is not captured in the price change, sharechange or valuation rules, Brandywine will initiate a sell. The rank order of the most common occurrences areprice momentum, valuation expansion into the sell range, share issuance or fundamental deterioration.
1. Significant Accounting Policies
The following is a summary of significant accounting policies for the Funds. Such policies are in conformity withaccounting principles generally accepted in the United States of America (“GAAP”) for investment companies andare consistently followed by the Funds in the preparation of the financial statements.
Use of Estimates
Each Fund is an investment company and accordingly follows the investment company accounting and reportingguidance of the Financial Accounting Standards Board (“FASB”) Accounting Standard Codification Topic 946Financial Services—Investment Companies. The preparation of financial statements in accordance with GAAPrequires management to make estimates and assumptions that affect the reported amounts of assets and liabilitiesand disclosure of contingent assets and liabilities at the date of the financial statements and the reported amountsof increases and decreases in net assets from operations during the reporting period. Actual results could differfrom those estimates.
Portfolio Valuation
Equity securities and other similar investments traded on a recognized U.S. securities exchange (other than theNational Association of Securities Dealers Automated Quotation System “NASDAQ”) are valued at the last saleprice on the exchange on which the securities are traded. If no sale occurs, equity securities and other similarinvestments traded on a U.S. exchange (other than NASDAQ) are valued at the most recent bid price. Equitysecurities and other similar investments traded on NASDAQ are valued at the NASDAQ Official Closing Price. Ifno sale occurs, equity securities and other similar investments traded on NASDAQ are valued at the most recent bidprice. Equity securities and other similar investments traded on a non-U.S. exchange are generally valued according
59
M Fund, Inc.NOTES TO FINANCIAL STATEMENTS (Unaudited) (Continued)
to the latest closing values on that exchange prior to the close of the New York Stock Exchange. However, if anevent which may change the value of a security occurs after the time that the closing value on the non-U.S. exchangewas determined, the Board of Directors may decide to value the security based on fair value. The Board of Directorshas approved the use of an independent fair value service for foreign securities, which may provide a fair valueprice on trading days when the S&P 500 Index moves more than 0.5%. The use of a fair value price may cause thevalue of the security on the books of the Fund to be significantly different from the closing value on the non-U.S.exchange and may affect the calculation of the Fund’s NAV. Over-the-counter securities are valued at the last saleprice on the valuation date or, if no sale occurs, at the most recent bid price. Short-term obligations maturing insixty days or less are valued at amortized cost, which approximates market value.
Amortized cost valuation involves initially valuing a security at its cost, and thereafter, assuming a constant accretionor amortization to maturity of any discount or premium, regardless of the impact of fluctuating interest rates on themarket value of the security. Securities for which a pricing service supplies no quotations or quotations are notdeemed to be representative of market value or for which there are no readily available market quotations are valuedat fair value as determined in good faith by the Pricing Committee appointed by the Board of Directors (excludingdebt securities with a remaining maturity of sixty days or less). Investments in mutual funds, including moneymarket funds, are valued at their respective NAVs as of the close of the Exchange on the valuation date. Thesesecurities are generally categorized as Level 1 in the fair value hierarchy.
Fair value is defined as the price that the Funds would receive upon selling an investment in a timely transaction toan independent buyer in the principal or most advantageous market for the investment. A three-tier hierarchy isutilized to maximize the use of observable data inputs and minimize the use of unobservable data inputs and toestablish classification of fair value measurements for disclosure purposes. Inputs refer broadly to the assumptionsthat market participants would use to price the asset or liability, including assumptions about risk. Observable inputsare inputs that reflect the assumptions market participants would use to price the asset or liability based on marketdata obtained from sources independent of the reporting entity. Unobservable inputs are inputs that reflect thereporting entity’s own assumptions about the assumptions market participants would use to price the asset or liabilitybased on the best information available in the circumstances. The three-tier hierarchy of inputs is summarized inthe three broad Levels listed below.
• Level 1—quoted prices in active markets for identical investments;
• Level 2—quoted prices in markets that are not active or other significant observable inputs (includingquoted prices for similar investments, interest rates, prepayment speeds, credit risk, etc.); and
• Level 3—significant unobservable inputs (including the Fund’s own assumptions used to determine thefair value of investments).
The valuation techniques used by the Funds to measure fair value during the period ended June 30, 2021 maximizedthe use of observable inputs and minimized the use of unobservable inputs.
The availability of observable inputs can vary from security to security and is affected by a wide variety of factors,including, for example, the type of security, whether the security is new and not yet established in the marketplace,
60
M Fund, Inc.NOTES TO FINANCIAL STATEMENTS (Unaudited) (Continued)
1. Significant Accounting Policies (Continued)
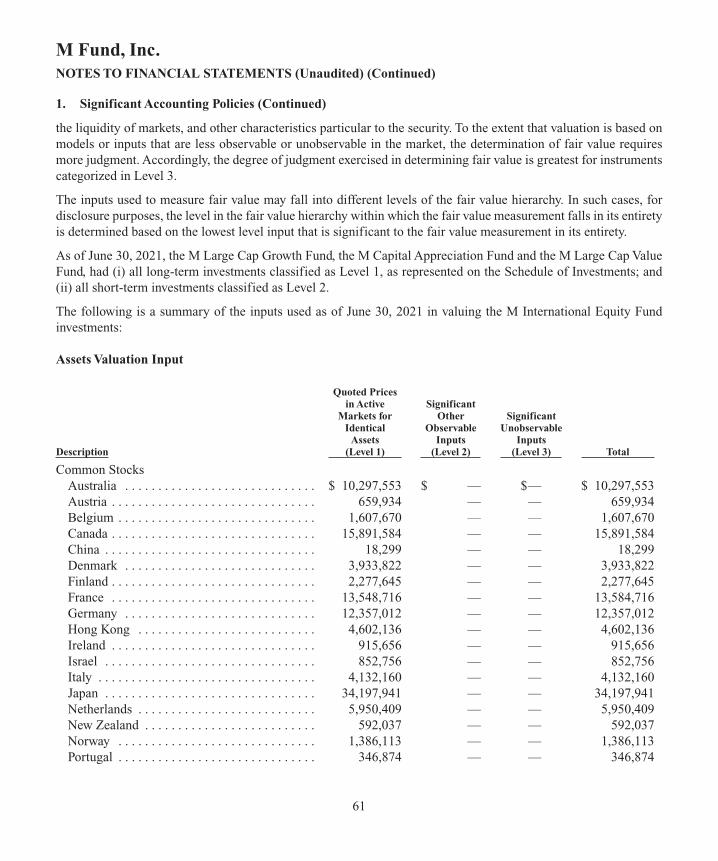
the liquidity of markets, and other characteristics particular to the security. To the extent that valuation is based onmodels or inputs that are less observable or unobservable in the market, the determination of fair value requiresmore judgment. Accordingly, the degree of judgment exercised in determining fair value is greatest for instrumentscategorized in Level 3.
The inputs used to measure fair value may fall into different levels of the fair value hierarchy. In such cases, fordisclosure purposes, the level in the fair value hierarchy within which the fair value measurement falls in its entiretyis determined based on the lowest level input that is significant to the fair value measurement in its entirety.
As of June 30, 2021, the M Large Cap Growth Fund, the M Capital Appreciation Fund and the M Large Cap ValueFund, had (i) all long-term investments classified as Level 1, as represented on the Schedule of Investments; and(ii) all short-term investments classified as Level 2.
The following is a summary of the inputs used as of June 30, 2021 in valuing the M International Equity Fundinvestments:
Assets Valuation Input
Quoted Prices in Active Significant Markets for Other Significant Identical Observable Unobservable Assets Inputs Inputs Description (Level 1) (Level 2) (Level 3) Total
Common StocksAustralia . . . . . . . . . . . . . . . . . . . . . . . . . . . . . $ 10,297,553 $ — $— $ 10,297,553Austria . . . . . . . . . . . . . . . . . . . . . . . . . . . . . . . 659,934 — — 659,934Belgium . . . . . . . . . . . . . . . . . . . . . . . . . . . . . . 1,607,670 — — 1,607,670Canada . . . . . . . . . . . . . . . . . . . . . . . . . . . . . . . 15,891,584 — — 15,891,584China . . . . . . . . . . . . . . . . . . . . . . . . . . . . . . . . 18,299 — — 18,299Denmark . . . . . . . . . . . . . . . . . . . . . . . . . . . . . 3,933,822 — — 3,933,822Finland . . . . . . . . . . . . . . . . . . . . . . . . . . . . . . . 2,277,645 — — 2,277,645France . . . . . . . . . . . . . . . . . . . . . . . . . . . . . . . 13,548,716 — — 13,584,716Germany . . . . . . . . . . . . . . . . . . . . . . . . . . . . . 12,357,012 — — 12,357,012Hong Kong . . . . . . . . . . . . . . . . . . . . . . . . . . . 4,602,136 — — 4,602,136Ireland . . . . . . . . . . . . . . . . . . . . . . . . . . . . . . . 915,656 — — 915,656Israel . . . . . . . . . . . . . . . . . . . . . . . . . . . . . . . . 852,756 — — 852,756Italy . . . . . . . . . . . . . . . . . . . . . . . . . . . . . . . . . 4,132,160 — — 4,132,160Japan . . . . . . . . . . . . . . . . . . . . . . . . . . . . . . . . 34,197,941 — — 34,197,941Netherlands . . . . . . . . . . . . . . . . . . . . . . . . . . . 5,950,409 — — 5,950,409New Zealand . . . . . . . . . . . . . . . . . . . . . . . . . . 592,037 — — 592,037Norway . . . . . . . . . . . . . . . . . . . . . . . . . . . . . . 1,386,113 — — 1,386,113Portugal . . . . . . . . . . . . . . . . . . . . . . . . . . . . . . 346,874 — — 346,874
61
M Fund, Inc.NOTES TO FINANCIAL STATEMENTS (Unaudited) (Continued)
1. Significant Accounting Policies (Continued)

Quoted Prices in Active Significant Markets for Other Significant Identical Observable Unobservable Assets Inputs Inputs Description (Level 1) (Level 2) (Level 3) Total
Singapore . . . . . . . . . . . . . . . . . . . . . . . . . . . . $ 1,311,124 $ 565 $— $ 1,311,689Spain . . . . . . . . . . . . . . . . . . . . . . . . . . . . . . . . 2,899,478 247,502 — 3,146,980Sweden . . . . . . . . . . . . . . . . . . . . . . . . . . . . . . 5,340,243 — — 5,340,243Switzerland . . . . . . . . . . . . . . . . . . . . . . . . . . . 12,632,503 — — 12,632,503United Kingdom . . . . . . . . . . . . . . . . . . . . . . . 20,848,909 202 — 20,849,111United States . . . . . . . . . . . . . . . . . . . . . . . . . . 2,523,747 — — 2,523,747
Total Common Stocks . . . . . . . . . . . . . . . . . . . . . 159,124,321 248,269 — 159,372,590
Affiliated Investment CompanyUnited States . . . . . . . . . . . . . . . . . . . . . . . . . . 71,816,891 — — 71,816,891
WarrantsCanada . . . . . . . . . . . . . . . . . . . . . . . . . . . . . . . 2,075 — — 2,075
RightAustria . . . . . . . . . . . . . . . . . . . . . . . . . . . . . . . — — — —Spain . . . . . . . . . . . . . . . . . . . . . . . . . . . . . . . . 4,434 — — 4,434
Total Rights . . . . . . . . . . . . . . . . . . . . . . . . . . . . . 4,434 — — 4,434
Preferred StocksGermany . . . . . . . . . . . . . . . . . . . . . . . . . . . . . 1,158,846 — — 1,158,846Italy . . . . . . . . . . . . . . . . . . . . . . . . . . . . . . . . . 23,999 — — 23,999
Total Preferred Stocks . . . . . . . . . . . . . . . . . . . . . 1,182,845 — — 1,182,845
Short-Term InvestmentsInvestments in Security Lending Collateral . . — 4,990,751 — 4,990,751
Total . . . . . . . . . . . . . . . . . . . . . . . . . . . . . . . . . . $232,130,566 $5,239,020 $— $237,369,586
Securities Transactions, Investment Income and Expenses
Securities transactions are recorded as of the trade date. Realized gains or losses from securities sold are recordedon the identified cost basis. Interest income is recorded on the accrual basis and consists of interest accrued and, ifapplicable, discount earned less premiums amortized. Dividend income is recorded on the ex-dividend date, exceptthat certain dividends from foreign securities are recorded as soon as the Fund is informed of the ex-dividend date.Investment income is recorded net of foreign taxes withheld where the recovery of such taxes is uncertain. Non-cashdividends included in dividend income, if any, are recorded at the fair market value of the securities received.Expenses of the Corporation that can be directly attributed to a particular fund are charged to that Fund. Expensesthat cannot be directly attributed are apportioned among Funds by the Corporation based on average net assets ofeach Fund.
62
M Fund, Inc.NOTES TO FINANCIAL STATEMENTS (Unaudited) (Continued)
1. Significant Accounting Policies (Continued)

Additionally, the Funds may invest in mutual funds, which are subject to management fees and other fees that mayincrease the costs of investing in mutual funds versus the costs of owning the underlying securities directly. Theseindirect expenses of mutual funds are not included in the amounts shown as expenses in the Funds’ Statements ofOperations or in the expense ratios included in the financial highlights.
Dividends and Distributions to Shareholders
Each Fund declares and pays dividends from net investment income, if any, and distributes net short-term capitalgains, if any, on an annual basis. Each Fund also distributes, at least annually, substantially all of the long-termcapital gains in excess of available capital losses, if any, which it realizes for each taxable year. Distributions arerecorded on the ex-dividend date. Income distributions and capital gain distributions are determined in accordancewith income tax regulations, which may differ from GAAP.
Securities Lending
The Funds participate in a securities lending program under the terms of a Securities Lending Agency Agreementwith State Street Bank and Trust Company, which serves as the Funds’ securities lending agent. Each Fund mayloan its portfolio securities in an amount up to 33 1/3 of its total assets. The Funds receive cash (U.S. currency) andnon-cash (U.S. Treasuries and Agencies) as collateral against the loaned securities. Cash collateral is invested bythe securities lending agent in a money market mutual fund that meets the quality and diversification requirementsin accordance with Rule 2a-7 under the 1940 Act. All collateral received will be in an amount at least equal to102% (for loans of U.S. securities) or 105% (for loans of non-U.S. securities) of the market value of the loanedsecurities at the inception of each loan. The market value of the loaned securities is determined each day at the closeof business of the Funds and any change in the amount of collateral is delivered to or paid by the Fund the next day.The collateral value does not include the calculated mark, which is the amount charged/returned to the borrowerdaily to maintain 102%/105% of market value. There is a day lag in receiving the mark, which may at times resultin a collateral percentage above or below 102%/105%.
The collateral received is recorded on a lending Fund’s statement of assets and liabilities, along with the relatedobligation to return the collateral. A Fund may also record realized gain or loss on securities deemed sold due to aborrower’s inability to return securities on loan. Upon an event of default under the Securities Agency LendingAgreement, there is a risk of delay in the recovery of the securities or loss of rights in the collateral. If the borrowerfails to return loaned securities and collateral is insufficient to cover the value of loaned securities (provided thatthe insufficiency is not due to investment losses), the securities lending agent has agreed, at its option, to pay theamount of any shortfall in collateral to the Funds; or to replace the securities. Any dividends or interest payable bythe issuers of the loaned portfolio securities, during the time that the securities are on loan, are paid to the borrowersof those securities. Dividend or interest payments that are made to borrowers of the loaned securities are reimbursedby the borrowers to the Funds. Such reimbursement amounts do not comprise qualified dividend income under theInternal Revenue Code of 1986, as amended.
Income generated from the investment of collateral, less negotiated rebate fees paid to the borrower through thesecurities lending agent, is the source of the Fund’s securities lending income, 70% of which is paid to the Fund,30% of which is paid to the custodian as securities lending agent.
63
M Fund, Inc.NOTES TO FINANCIAL STATEMENTS (Unaudited) (Continued)
1. Significant Accounting Policies (Continued)
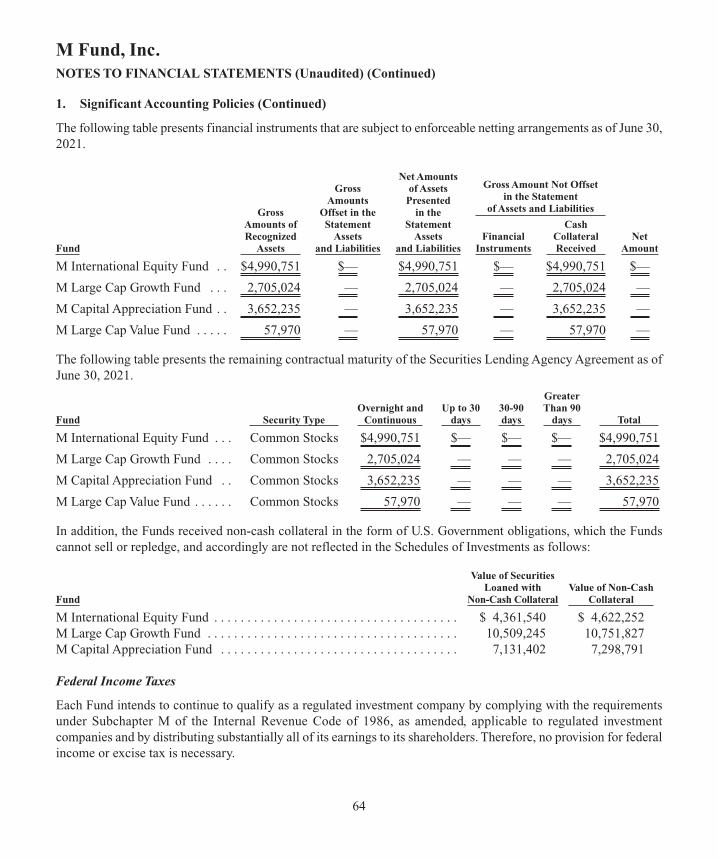
The following table presents financial instruments that are subject to enforceable netting arrangements as of June 30,2021.
Net Amounts Gross Amount Not Offset
Gross of Assets
in the Statement
Amounts Presented of Assets and Liabilities
Gross Offset in the in the
Amounts of Statement Statement Cash Recognized Assets Assets Financial Collateral Net
Fund Assets and Liabilities and Liabilities Instruments Received Amount
M International Equity Fund . . $4,990,751 $— $4,990,751 $— $4,990,751 $—
M Large Cap Growth Fund . . . 2,705,024 — 2,705,024 — 2,705,024 —
M Capital Appreciation Fund . . 3,652,235 — 3,652,235 — 3,652,235 —
M Large Cap Value Fund . . . . . 57,970 — 57,970 — 57,970 —
The following table presents the remaining contractual maturity of the Securities Lending Agency Agreement as ofJune 30, 2021.
Greater Overnight and Up to 30 30-90 Than 90
Fund Security Type Continuous days days days Total
M International Equity Fund . . . Common Stocks $4,990,751 $— $— $— $4,990,751
M Large Cap Growth Fund . . . . Common Stocks 2,705,024 — — — 2,705,024
M Capital Appreciation Fund . . Common Stocks 3,652,235 — — — 3,652,235
M Large Cap Value Fund . . . . . . Common Stocks 57,970 — — — 57,970
In addition, the Funds received non-cash collateral in the form of U.S. Government obligations, which the Fundscannot sell or repledge, and accordingly are not reflected in the Schedules of Investments as follows:
Value of Securities Loaned with Value of Non-CashFund Non-Cash Collateral Collateral
M International Equity Fund . . . . . . . . . . . . . . . . . . . . . . . . . . . . . . . . . . . . . $ 4,361,540 $ 4,622,252M Large Cap Growth Fund . . . . . . . . . . . . . . . . . . . . . . . . . . . . . . . . . . . . . . 10,509,245 10,751,827M Capital Appreciation Fund . . . . . . . . . . . . . . . . . . . . . . . . . . . . . . . . . . . . 7,131,402 7,298,791
Federal Income Taxes
Each Fund intends to continue to qualify as a regulated investment company by complying with the requirementsunder Subchapter M of the Internal Revenue Code of 1986, as amended, applicable to regulated investmentcompanies and by distributing substantially all of its earnings to its shareholders. Therefore, no provision for federalincome or excise tax is necessary.
64
M Fund, Inc.NOTES TO FINANCIAL STATEMENTS (Unaudited) (Continued)
1. Significant Accounting Policies (Continued)
The Funds evaluate the Funds’ tax positions to determine if the tax positions taken meet the minimum recognitionthreshold in connection with accounting for uncertainties in income tax positions taken or expected to be taken forthe purposes of measuring and recognizing tax liabilities in the financial statements. Recognition of tax benefits ofan uncertain tax position is permitted only to the extent the position is “more likely than not” to be sustainedassuming examination by taxing authorities. The Funds did not have any unrecognized tax benefits as of June 30,2021, nor were there any increases or decreases in unrecognized tax benefits for the period then ended. The Fundsrecognize interest and penalties, if any, related to unrecognized tax benefits as an income tax expense in theStatements of Operations. During the six-month period ended June 30, 2021, the Funds did not incur any suchinterest or penalties. The Funds’ tax returns are subject to examination by U.S. federal and state tax authorities forreturns filed for the prior three fiscal years, December 2018 through December 2020. No examination of any of theFunds’ tax filings is currently in progress.
Significant Concentrations
The Funds maintain a demand deposit in excess of Federal Deposit Insurance Company (“FDIC”) Insurance limits.As a result, the Fund is exposed to credit risk in the event of insolvency or other failure of the institution to meet itsobligations. The Funds manage this risk by dealing with a major financial institution and monitoring its creditworthiness.
2. Advisory Fee and Other Transactions with Affiliates
The Corporation has entered into an investment advisory agreement (the “Advisory Agreement”) with M FinancialInvestment Advisers, Inc. (the “Adviser”), a wholly-owned subsidiary of M Financial Group. The AdvisoryAgreement provides that the Funds will pay the Adviser a fee at an annual rate of the value of each Fund’s averagedaily net assets as follows:
Fund Total Advisory Fees
M International Equity Fund . . . . . . . . . . . . . For the period January 1, 2021 through February 28, 2021: 0.15% on all assets plus (and only with respect to Fund assets which are not invested in a mutual fund that is advised by the Fund’s sub-adviser): 0.32% on the first $100 million 0.27% on the amounts thereafter For the period March 1, 2021 through June 30, 2021: 0.15% on all assets plus (and only with respect to Fund assets which are not invested in a mutual fund that is advised by the Fund’s sub-adviser): 0.25% on the first $100 million 0.20% on the amounts thereafter
65
M Fund, Inc.NOTES TO FINANCIAL STATEMENTS (Unaudited) (Continued)
1. Significant Accounting Policies (Continued)

Fund Total Advisory Fees
M Large Cap Growth Fund . . . . . . . . . . . . . . 0.65% of the first $50 million 0.60% of the next $50 million 0.55% on the amounts above $100 millionM Capital Appreciation Fund . . . . . . . . . . . . 0.90% on the first $125 million 0.80% on the amounts thereafterM Large Cap Value Fund . . . . . . . . . . . . . . . 0.43%
Prior to May 1, 2021 and for the period May 1, 2021 to April 30, 2022, the Adviser has contractually agreed toreimburse each Fund for any expenses (other than advisory fees, brokerage or other portfolio transaction expensesor expenses for litigation, indemnification, taxes or other extraordinary expenses) to the extent that such expensesexceed 0.25% of a Fund’s annualized average daily net assets.
The Adviser has engaged Dimensional Fund Advisors LP, DSM Capital Partners LLC, Frontier Capital ManagementCompany, LLC and Brandywine Global Investment Management, LLC to act as sub-advisers to provide day-to-dayportfolio management for the M International Equity Fund, the M Large Cap Growth Fund, the M CapitalAppreciation Fund and the M Large Cap Value Fund, respectively.
As compensation for their services, each sub-adviser receives a fee based on the average daily net assets of theapplicable Fund at the following annual rates:
Fund Total Sub-Advisory Fees
M International Equity Fund . . . . . . . . . . . . . For the period January 1, 2021 through February 28, 2021: 0.32% on the first $100 million 0.27% on the amounts thereafter For the period March 1, 2021 through June 30, 2021: 0.25% on the first $100 million 0.20% on the amounts thereafter
Sub-adviser shall not receive any sub-advisory fee for its sub-advisory services to the M International Equity Fund with respect to assets of the M International Equity Fund invested in any other mutual fund advised by the Sub-Adviser.
M Large Cap Growth Fund . . . . . . . . . . . . . . 0.50% on the first $50 million 0.45% on the next $50 million 0.40% on the amounts above $100 millionM Capital Appreciation Fund . . . . . . . . . . . . 0.75% on the first $125 million 0.65% on the amounts thereafterM Large Cap Value Fund . . . . . . . . . . . . . . . 0.28%
66
M Fund, Inc.NOTES TO FINANCIAL STATEMENTS (Unaudited) (Continued)
2. Advisory Fee and Other Transactions with Affiliates (Continued)
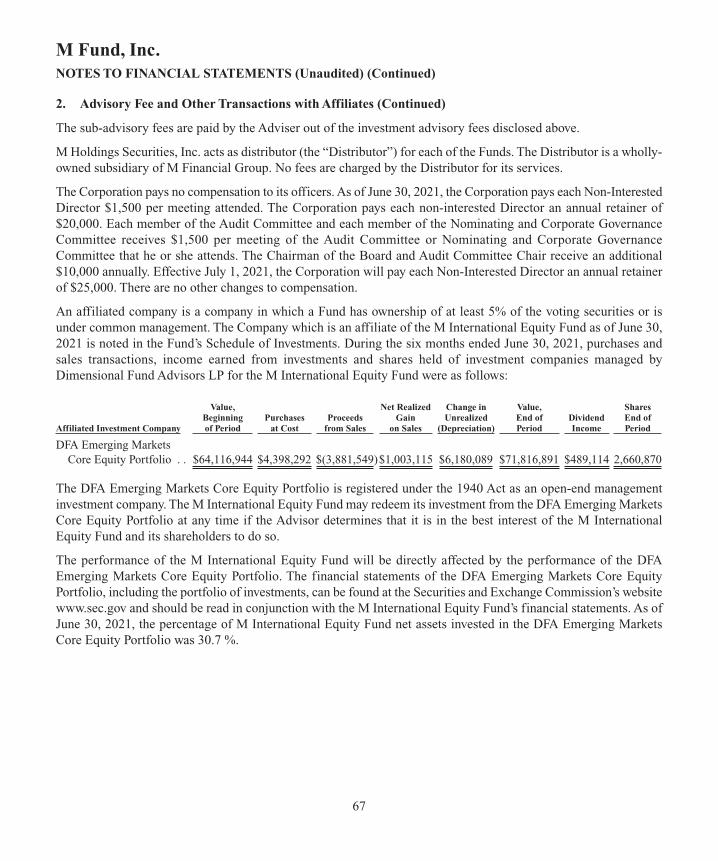
The sub-advisory fees are paid by the Adviser out of the investment advisory fees disclosed above.
M Holdings Securities, Inc. acts as distributor (the “Distributor”) for each of the Funds. The Distributor is a wholly-owned subsidiary of M Financial Group. No fees are charged by the Distributor for its services.
The Corporation pays no compensation to its officers. As of June 30, 2021, the Corporation pays each Non-InterestedDirector $1,500 per meeting attended. The Corporation pays each non-interested Director an annual retainer of$20,000. Each member of the Audit Committee and each member of the Nominating and Corporate GovernanceCommittee receives $1,500 per meeting of the Audit Committee or Nominating and Corporate GovernanceCommittee that he or she attends. The Chairman of the Board and Audit Committee Chair receive an additional$10,000 annually. Effective July 1, 2021, the Corporation will pay each Non-Interested Director an annual retainerof $25,000. There are no other changes to compensation.
An affiliated company is a company in which a Fund has ownership of at least 5% of the voting securities or isunder common management. The Company which is an affiliate of the M International Equity Fund as of June 30,2021 is noted in the Fund’s Schedule of Investments. During the six months ended June 30, 2021, purchases andsales transactions, income earned from investments and shares held of investment companies managed byDimensional Fund Advisors LP for the M International Equity Fund were as follows:
Value, Net Realized Change in Value, SharesBeginning Purchases Proceeds Gain Unrealized End of Dividend End of
Affiliated Investment Company of Period at Cost from Sales on Sales (Depreciation) Period Income Period DFA Emerging Markets
Core Equity Portfolio . . $64,116,944 $4,398,292 $(3,881,549)$1,003,115 $6,180,089 $71,816,891 $489,114 2,660,870
The DFA Emerging Markets Core Equity Portfolio is registered under the 1940 Act as an open-end managementinvestment company. The M International Equity Fund may redeem its investment from the DFA Emerging MarketsCore Equity Portfolio at any time if the Advisor determines that it is in the best interest of the M InternationalEquity Fund and its shareholders to do so.
The performance of the M International Equity Fund will be directly affected by the performance of the DFAEmerging Markets Core Equity Portfolio. The financial statements of the DFA Emerging Markets Core EquityPortfolio, including the portfolio of investments, can be found at the Securities and Exchange Commission’s websitewww.sec.gov and should be read in conjunction with the M International Equity Fund’s financial statements. As ofJune 30, 2021, the percentage of M International Equity Fund net assets invested in the DFA Emerging MarketsCore Equity Portfolio was 30.7 %.
67
M Fund, Inc.NOTES TO FINANCIAL STATEMENTS (Unaudited) (Continued)
2. Advisory Fee and Other Transactions with Affiliates (Continued)
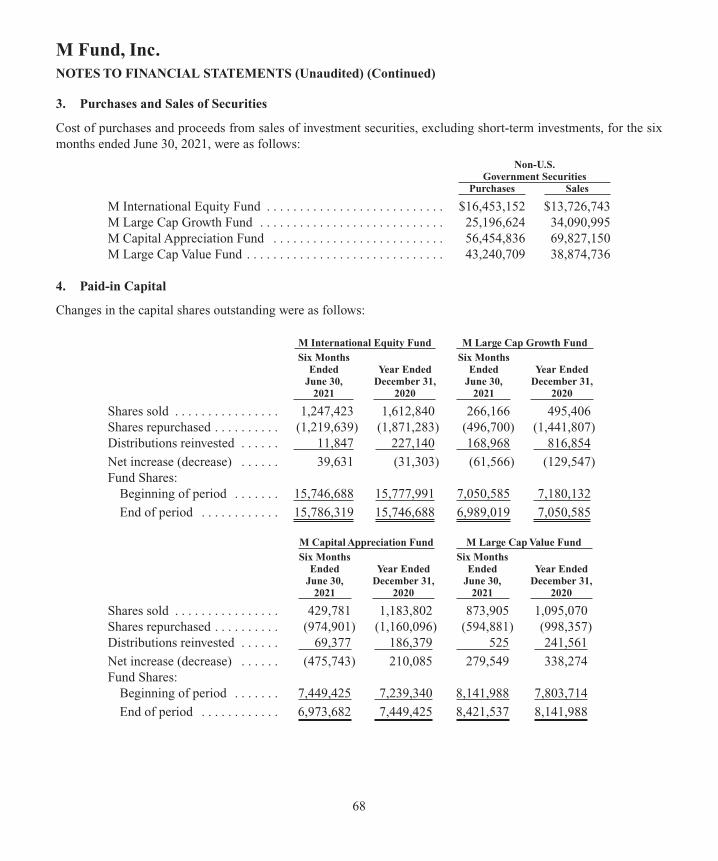
Cost of purchases and proceeds from sales of investment securities, excluding short-term investments, for the sixmonths ended June 30, 2021, were as follows:
Non-U.S. Government Securities Purchases Sales
M International Equity Fund . . . . . . . . . . . . . . . . . . . . . . . . . . . $16,453,152 $13,726,743M Large Cap Growth Fund . . . . . . . . . . . . . . . . . . . . . . . . . . . . 25,196,624 34,090,995M Capital Appreciation Fund . . . . . . . . . . . . . . . . . . . . . . . . . . 56,454,836 69,827,150M Large Cap Value Fund . . . . . . . . . . . . . . . . . . . . . . . . . . . . . . 43,240,709 38,874,736
4. Paid-in Capital
Changes in the capital shares outstanding were as follows:
M International Equity Fund M Large Cap Growth Fund Six Months Six Months Ended Year Ended Ended Year Ended June 30, December 31, June 30, December 31, 2021 2020 2021 2020
Shares sold . . . . . . . . . . . . . . . . 1,247,423 1,612,840 266,166 495,406Shares repurchased . . . . . . . . . . (1,219,639) (1,871,283) (496,700) (1,441,807)Distributions reinvested . . . . . . 11,847 227,140 168,968 816,854 Net increase (decrease) . . . . . . 39,631 (31,303) (61,566) (129,547)Fund Shares:
Beginning of period . . . . . . . 15,746,688 15,777,991 7,050,585 7,180,132 End of period . . . . . . . . . . . . 15,786,319 15,746,688 6,989,019 7,050,585
M Capital Appreciation Fund M Large Cap Value Fund Six Months Six Months Ended Year Ended Ended Year Ended June 30, December 31, June 30, December 31, 2021 2020 2021 2020
Shares sold . . . . . . . . . . . . . . . . 429,781 1,183,802 873,905 1,095,070Shares repurchased . . . . . . . . . . (974,901) (1,160,096) (594,881) (998,357)Distributions reinvested . . . . . . 69,377 186,379 525 241,561 Net increase (decrease) . . . . . . (475,743) 210,085 279,549 338,274Fund Shares:
Beginning of period . . . . . . . 7,449,425 7,239,340 8,141,988 7,803,714 End of period . . . . . . . . . . . . 6,973,682 7,449,425 8,421,537 8,141,988
68
M Fund, Inc.NOTES TO FINANCIAL STATEMENTS (Unaudited) (Continued)
3. Purchases and Sales of Securities
Foreign Investments and Foreign Currency
Each of the Funds may invest in securities of companies that are organized under the laws of a foreign country and(i) are unlisted or listed primarily on a non-U.S. exchange; or (ii) are listed on a U.S. exchange or over-the-counteras a sponsored or unsponsored American Depositary Receipt (“foreign issuers”). M International Equity Fund mayalso invest in non-U.S. dollar denominated securities and securities of foreign issuers represented by EuropeanDepositary Receipts (“EDRs”), International Depositary Receipts (“IDRs”) and Global Depositary Receipts(“GDRs”). The value of all assets and liabilities expressed in foreign currencies are translated into U.S. dollars atthe exchange rates captured as of twelve noon Eastern Time each business day other than market holidays or earlyclosures. Purchases and sales of investment securities, income receipts and expense payments are translated intoU.S. dollars at the prevailing exchange rate on the respective dates of such transactions. Net realized foreign currencygains and losses result from changes in exchange rates, including foreign currency gains and losses between tradedate and settlement date on investment securities transactions, foreign currency transactions and the differencebetween the amounts of interest and dividends recorded on the books of the Funds and the amount actually received.The portion of foreign currency gains and losses related to fluctuation in exchange rates between the initial tradedate and subsequent sale trade date is included in realized gains and losses on investment transactions.M International Equity Fund does not isolate that portion of the results for changes in foreign currency exchangerates from the fluctuations arising from changes in market prices of securities held at year end.
Investments in non-U.S. dollar denominated securities or in the securities of foreign issuers may be affected bychanges in currency rates, changes in foreign or U.S. laws or restrictions applicable to such investments and inexchange control regulations (e.g., currency blockage). Some foreign stock markets may have substantially lessvolume than, for example, the New York Stock Exchange, and securities of some foreign issuers may be less liquidthan securities of comparable domestic issuers. Commissions and dealer mark-ups on transactions in foreigninvestments may be higher than for similar transactions in the United States. In addition, clearance and settlementprocedures for such securities may be different in foreign countries and, in certain markets, on certain occasionssuch procedures have been unable to keep pace with the volume of securities transactions.
Foreign issuers are not generally subject to uniform accounting, auditing and financial reporting standardscomparable to those applicable to domestic companies. There may be less publicly available information about aforeign issuer than about a domestic one. In addition, there is generally less government regulation of stockexchanges, brokers, and listed and unlisted issuers in foreign countries than in the United States. Furthermore, withrespect to certain foreign countries, there is a possibility of expropriation or confiscatory taxation, imposition ofwithholding taxes on dividend or interest payments, limitations on the removal of funds or other assets of the Funds,or political or social instability or diplomatic developments which could affect investments in those countries.Individual foreign economies also may differ favorably or unfavorably from the United States economy in suchrespects as growth of gross national product, rate of inflation, capital reinvestment and resource self-sufficiency.
Because investment in foreign issuers will usually involve currencies of foreign countries, and because the Fundsmay be exposed to currency exposure independent of their securities positions, the value of the assets of the Fundsinvested in foreign issuers as measured in U.S. dollars will be affected by changes in foreign currency exchangerates. To the extent that a Fund’s assets consist of investments denominated in a particular currency, the Fund is atrisk of adverse developments affecting the value of such currency.
69
M Fund, Inc.NOTES TO FINANCIAL STATEMENTS (Unaudited) (Continued)
5. Financial Instruments

Currency exchange rates may fluctuate significantly over short periods of time causing, along with other factors, aFund’s net asset value to fluctuate as well. Currency exchange rates generally are determined by the forces of supplyand demand in the foreign exchange markets and the relative merits of investments in different countries, actual oranticipated changes in interest rates and other complex factors, as seen from an international perspective. Currencyexchange rates also can be affected unpredictably by intervention by U.S. or foreign governments or central banks,or the failure to intervene, or by currency controls or political developments in the U.S. or abroad. To the extent thata substantial portion of a Fund’s total assets, adjusted to reflect the Fund’s net position after giving effect to currencytransactions, is denominated in the currencies of foreign countries, the Fund will be more susceptible to the risk ofadverse economic and political developments within those countries.
Risks Related to COVID-19 Pandemic
Beginning in January 2020, global financial markets experienced, and may continue to experience, significantvolatility resulting from the spread of a virus known as COVID-19. The extent of the impact from the COVID-19outbreak on the financial performance of the Funds continues to depend on developments, including duration andspread of the outbreak, related advisories and restrictions, and the impact of COVID-19 on the financial marketsand the overall economy, all of which are highly uncertain and cannot be predicted. Adverse market conditions maybe prolonged and may not have the same impact on all types of securities. These disruptions could prevent a Fundfrom executing advantageous investment decisions in a timely manner and could negatively impact the Fund’sability to achieve its investment objective. If the financial markets and/or the overall economy continue to beimpacted for an extended period of time, the Funds’ results of operations may be materially adversely affected.
6. Beneficial Interest
Shares of the Funds are owned by insurance companies through their separate accounts that are used primarily tofund variable annuity contracts and variable life insurance contracts. As of June 30, 2021, John Hancock VariableLife Insurance Co., Pacific Life Insurance Co., Pruco Life Insurance Co. of Arizona and Security Life of Denver(an indirect, wholly owned subsidiary of Voya Financial, Inc.) each owned 5% or more of the Funds’ shares. JohnHancock Variable Life Insurance Co. and Pacific Life Insurance Co. may each be deemed a control person of eachFund because their separate accounts hold more than 25% of the shares of each Fund.
As of June 30, 2021, the ownership of each Fund was as follows:
Percentage of Ownership(1) John Hancock Pruco Life Voya-Security Variable Life Pacific Life Insurance Co. Life of Insurance Co. Insurance Co. Of Arizona Denver
M International Equity Fund . . . . . . . . . . . . . . 39.7% 40.2% 6.4% 5.6%M Large Cap Growth Fund . . . . . . . . . . . . . . . 53.0% 30.9% 6.5% 1.5%M Capital Appreciation Fund . . . . . . . . . . . . . . 49.5% 35.4% 1.7% 6.6%M Large Cap Value Fund . . . . . . . . . . . . . . . . . 52.6% 31.7% 4.7% 1.4%
(1) The balance of the Funds’ shares are owned by shareholders with less than 5% beneficial interest.
70
M Fund, Inc.NOTES TO FINANCIAL STATEMENTS (Unaudited) (Continued)
5. Financial Instruments (Continued)
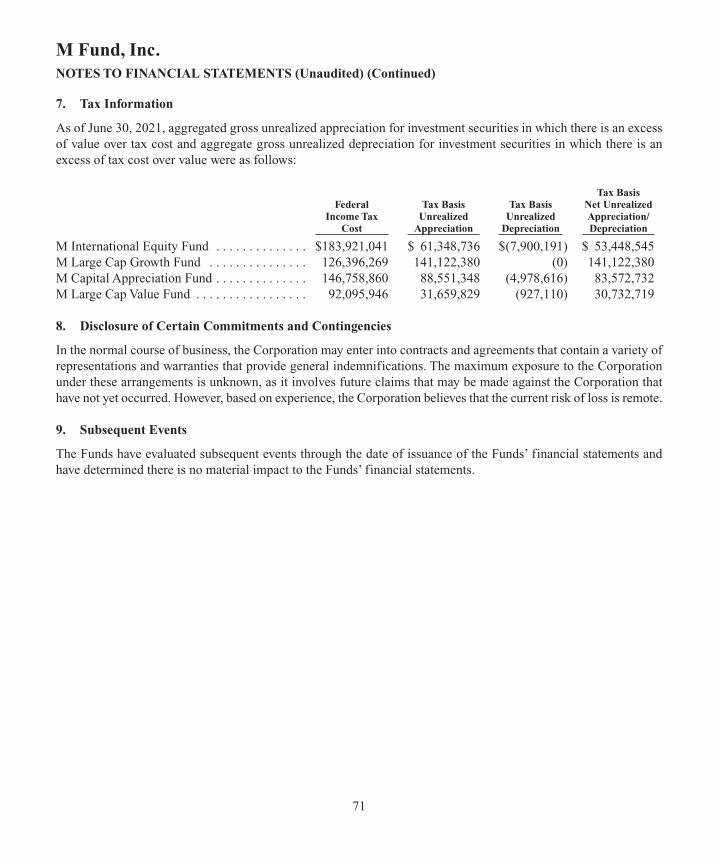
As of June 30, 2021, aggregated gross unrealized appreciation for investment securities in which there is an excessof value over tax cost and aggregate gross unrealized depreciation for investment securities in which there is anexcess of tax cost over value were as follows:
Tax Basis Federal Tax Basis Tax Basis Net Unrealized Income Tax Unrealized Unrealized Appreciation/ Cost Appreciation Depreciation Depreciation
M International Equity Fund . . . . . . . . . . . . . . $183,921,041 $ 61,348,736 $(7,900,191) $ 53,448,545M Large Cap Growth Fund . . . . . . . . . . . . . . . 126,396,269 141,122,380 (0) 141,122,380M Capital Appreciation Fund . . . . . . . . . . . . . . 146,758,860 88,551,348 (4,978,616) 83,572,732M Large Cap Value Fund . . . . . . . . . . . . . . . . . 92,095,946 31,659,829 (927,110) 30,732,719
8. Disclosure of Certain Commitments and Contingencies
In the normal course of business, the Corporation may enter into contracts and agreements that contain a variety ofrepresentations and warranties that provide general indemnifications. The maximum exposure to the Corporationunder these arrangements is unknown, as it involves future claims that may be made against the Corporation thathave not yet occurred. However, based on experience, the Corporation believes that the current risk of loss is remote.
9. Subsequent Events
The Funds have evaluated subsequent events through the date of issuance of the Funds’ financial statements andhave determined there is no material impact to the Funds’ financial statements.
71
M Fund, Inc.NOTES TO FINANCIAL STATEMENTS (Unaudited) (Continued)
7. Tax Information

72
The Board meets on a quarterly basis to review the ongoing operations of the Corporation and the Funds (as definedbelow), and at each meeting, considers matters bearing on (1) the Investment Advisory Agreement (the “AdvisoryAgreement”) between the Corporation and the Adviser, and (2) the Investment Sub-Advisory Agreements (each, a“Sub-Advisory Agreement” and collectively, the “Sub-Advisory Agreements”) between the Adviser, on behalf ofthe M International Equity Fund, M Capital Appreciation Fund, M Large Cap Growth Fund and M Large Cap ValueFund (each, a “Fund” and collectively, the “Funds”), and Dimensional Fund Advisors (“DFA”), Frontier CapitalManagement Company, LLC (“Frontier”), DSM Capital LLC (“DSM”) and Brandywine Global InvestmentManagement (“Brandywine”), respectively (each, a “Sub-Adviser” and collectively, the “Sub-Advisers”). Theindependent directors meet with the entire Board and hold separate executive sessions to the extent that theindependent directors believe that such sessions are necessary.
At each quarterly meeting, the Board specifically reviews the investment performance of each Fund (reflecting theadvisory services provided by the applicable Sub-Adviser), in both absolute terms and relative to each Fund’srelevant benchmark index. The Board considers this performance in light of general economic conditions. Finally,the Board receives quarterly performance reports and Sub-Adviser evaluations from Strategic Capital InvestmentAdvisors, Inc. (“Strategic Capital”), as summarized below.
In addition to investment performance, the quarterly reviews specifically address and consider other matters thatbear upon and are part of the annual evaluation and approval, such as compliance (including code of ethics violations)matters.
These quarterly on-going reviews and monitoring form an important basis for the annual review and approvaldiscussed below.
The Board utilizes the services of Strategic Capital to help choose and evaluate each of the Corporation’s Sub-Advisers. Strategic Capital is an independent, third-party vendor that provides consulting services to institutionalinvestors. The Adviser engages Strategic Capital primarily to evaluate existing Sub-Adviser performance and assistin searches for new sub-advisers, when necessary.
Strategic Capital provides the Board with Fund performance information quarterly. Strategic Capital also providesthe Board with Sub-Adviser evaluations based upon on-going qualitative assessments and quantitative analysis.This evaluation provides the Board with an in-depth understanding of each Sub-Adviser’s investment philosophy,process, capabilities and resources.
ANNUAL REVIEW AND APPROVAL OF THE INVESTMENT ADVISORY AND SUB-ADVISORYAGREEMENTS
At a meeting held on March 12, 2021, the Board, including the Independent Directors, unanimously approved thecontinuance of the Advisory Agreement and the Sub-Advisory Agreements with DFA, DSM and Frontier. At thismeeting, the Board evaluated, among other things, written information provided by the Adviser and each Sub-Adviser, as well as answers to questions posed by the Board to representatives of the Adviser (including answersprovided at other Board meetings). The Board was not asked to reapprove the sub-advisory agreement betweenMFIA and Brandywine with respect to the Large Cap Value Fund because that agreement is still within its initialtwo-year term.
BOARD OF DIRECTORS REPORT
CONSIDERATIONS IN APPROVING INVESTMENT ADVISORY
AND SUB-ADVISORY AGREEMENTS
73
The Adviser and Sub-Advisers furnished information concerning a variety of aspects of the operation of the Fundsincluding, (1) the capability of the Adviser and each Sub-Adviser to provide advisory services (including numberand experience of personnel, administrative systems, and financial strength); (2) the nature, extent, and quality ofservices to be provided by the Adviser and each Sub-Adviser; (3) the Adviser’s and each Sub-Adviser’s regulatorycompliance history; (4) the investment performance of each Fund; (5) advisory fees, considering the servicesprovided; the costs and expenses of the Adviser or each Sub-Adviser; fees throughout the industry; the level ofprofit realized by the Adviser or each Sub-Adviser under the Advisory Agreements; and any collateral or “fall-out”benefits to the Adviser, each Sub-Adviser, or a Fund; (6) the extent to which economies of scale would be realizedas the Corporation and the Funds grow and whether shareholders benefit from these economies of scale; and(7) each Sub-Adviser’s choice of brokers and dealers for portfolio transactions and the cost for such transactions.
Below is a discussion of the information considered by the Board, as well as the Board’s conclusions with respectto the Advisory Agreement and Sub-Advisory Agreements presented to the Board for its approval at its March 12,2021 Board meeting.
Applicable rules of the U.S. Securities and Exchange Commission (“SEC”) and relevant case law instruct mutualfund directors to consider a number of specific factors in approving and re-approving Advisory and Sub-AdvisoryAgreements. Those rules are designed for the typical situation where the adviser or sub-adviser is the sponsor (oran affiliate of the sponsor) of the fund and therefore the relationship is not an “arms-length” one (that is, since theadvisor may have a strong or undue influence over the fund, the two parties are not in equal bargaining positions).Here, however, the Corporation and the Sub-Advisers are independent of each other, and there is no other materialbusiness arrangement between them, so that there is truly an “arms-length” bargaining position. In thesecircumstances, the SEC permits a fund’s board to view certain otherwise applicable factors as not relevant or lessmaterial with respect to such “non-sponsor advisers” (see SEC Release No. 33-8433, June 23, 2004). Here, inaccordance with such SEC guidance, factors that may be irrelevant (or less material than others) include the Sub-Advisers’ costs and profits. In addition, there may be few, or fewer and less significant, collateral or “fall-out”benefits for the Sub-Advisers.
The following discussion is not intended to be all-inclusive. The Board was presented with and considered asignificant amount of information and a variety of factors in connection with its review of the Advisory Agreementand the Sub-Advisory Agreements. The Board did not find it practicable to, and did not, quantify or otherwiseassign relative weights to the specific factors considered in reaching their conclusions and determinations to approvethe continuance of the Advisory Agreement and the Sub-Advisory Agreements. Nor did the Board identify anyparticular item of information or factor that was controlling. The approval determinations were made on the basisof each director’s business judgment after consideration of all of the factors taken as a whole, although individualdirectors may have given different weights to certain factors and assigned various degrees of materiality toconclusions made.
1. THE CAPABILITY OF THE ADVISER AND EACH SUB-ADVISER TO PROVIDE ADVISORYSERVICES AND THE NATURE, EXTENT AND QUALITY OF SERVICES PROVIDED
The Board reviewed in detail the capability of the Adviser and each Sub-Adviser to provide advisory services to theFunds under the terms of the Advisory Agreement and Sub-Advisory Agreements. The Board reviewed the personnelat the Adviser and each Sub-Adviser responsible for providing advisory and sub-advisory services to the Funds.
BOARD OF DIRECTORS REPORT
CONSIDERATIONS IN APPROVING INVESTMENT ADVISORY
AND SUB-ADVISORY AGREEMENTS (Continued)
74
The Board reviewed in detail the nature and extent of the services provided by the Adviser and Sub-Advisers underthe terms of the Advisory Agreement and Sub-Advisory Agreements, and the quality of those services over the pastyear (and longer). The Board considered the experience of the Adviser and each Sub-Adviser as an investmentmanager. Regarding the Adviser, the Board noted that the Adviser has been registered as an investment adviserunder the Investment Advisers Act of 1940, as amended (the “Advisers Act”) since 1995. As of December 31, 2020,the Adviser had approximately $758 million in assets under management, all of which were assets of the Corporation.The Adviser delegates the day-to-day investment of the Funds to the Sub-Advisers. The Adviser monitors the generalbusiness activity of the Sub-Advisers through a variety of quarterly and annual questionnaires and on-site compliancemeetings and reports significant changes and developments to the Board at least quarterly. The Board noted that acomplete description of the services provided by the Adviser and the experience of its officers was contained in itsForm ADV, which was included in the Board Materials. It was noted that the Adviser’s organizational chart is alsoincluded in the Board Materials. The Board concluded that the Adviser has the operational experience, capability,resources and personnel necessary to continue to manage the Funds.
M International Equity Fund
The Board noted that DFA was founded in 1981 and has managed the M International Equity Fund sinceDecember 12, 2018. As of December 31, 2020, DFA had approximately $600 billion of assets under management.The Board noted that DFA uses a team approach in all business aspects. In accordance with the team approach,DFA investment professionals make investment decisions based on guidelines, policies and procedures establishedby its investment committee. The Board concluded that DFA has significant operational experience and the capability,resources and personnel necessary to continue to manage the Fund.
M Large Cap Growth Fund
The Board noted that DSM was founded in 2001 and has managed the M Large Cap Growth Fund sinceOctober 2009. As of December 31, 2020, DSM had approximately $9.7 billion of assets under management. TheFund is managed by one of DSM’s founders and principals, Daniel Strickberger, with the support of a team ofresearch analysts/portfolio managers. A complete description of the services provided by DSM and the experienceof its professionals is contained in the firm’s Form ADV, which was included in the Board Materials. The Boardconcluded that DSM has significant operational experience and the capability, resources and personnel necessaryto continue to manage the Fund.
M Capital Appreciation Fund
The Board noted that Frontier has been registered as an investment adviser under the Advisers Act since 1981 andhas managed the M Capital Appreciation Fund since its inception in January 1996. Frontier had $13.7 billion inassets under management as of December 31, 2020. The Board noted that Frontier has significant investmentoperations and support staff, which include a dedicated back office, compliance and marketing professionals,analysts and portfolio managers, and continues to provide high quality responsive service to MFIA’s requests. Acomplete description of the services provided by Frontier and the experience of its professionals was contained inthe firm’s Form ADV, which was included in the Board Materials. The Board concluded that Frontier has significantoperational experience and the capability, resources and personnel necessary to continue to manage the Fund.
BOARD OF DIRECTORS REPORT
CONSIDERATIONS IN APPROVING INVESTMENT ADVISORY
AND SUB-ADVISORY AGREEMENTS (Continued)

75
2. REGULATORY COMPLIANCE HISTORY OF ADVISER AND SUB-ADVISERS
The Board considered the regulatory compliance history of the Adviser and each Sub-Adviser, which is reviewedquarterly by the Adviser and any material violations are brought to the attention of the Corporation’s ChiefCompliance Officer (“CCO”) and the Board. Neither the Adviser, nor any of the Sub-Advisers had any materialviolations of any of their respective policies and procedures or their Codes of Ethics during the year endedDecember 31, 2020. Based upon information provided to it, the Board concluded that it was satisfied with theadequacy of the Adviser’s and Sub-Advisers’ compliance programs.
3. THE INVESTMENT PERFORMANCE OF EACH FUND, THE ADVISER AND EACHSUB-ADVISER
The Board noted that investment performance for each Fund is primarily determined by the investment decisions ofeach Sub-Adviser. The Board also noted that the Adviser has the responsibility to manage each Sub-Advisoryrelationship and make decisions about when to recommend a change in Sub-Adviser. The Board noted by examplethat Brandywine replaced AJO as a Sub-Adviser to the Large Cap Value Fund on May 1, 2020. The Board furthernoted MFIA’s active approach to evaluating each sub-advisory relationship including meeting annually with eachSub-Adviser. The Board concluded that MFIA was appropriately managing each sub-advisory relationship.
The Board reviewed the investment performance of each Fund for the one-, three-, five- and 10-year periods endedDecember 31, 2020 and for the period from the inception of each Fund through December 31, 2020.
M International Equity Fund
The Board considered the investment performance of M International Equity Fund while it has been managedby DFA. At December 31, 2020, the Fund lagged its benchmark, the MSCI AC World ex US Index, for the one-,three-, five-, and 10-year periods, but exceeded the benchmark for the “since inception” time period. For thethree-, five-, and ten-year and “since inception” periods, the Fund was managed by other sub-advisers. The Boarddiscussed the reasons for the underperformance of the Fund and concluded that it was satisfied with DFA’sinvestment performance.
M Large Cap Growth Fund
The Board considered the investment performance of M Large Cap Growth Fund while it has been managed byDSM. The Fund lagged its benchmark, the Russell 1000 Growth Index, for the one-, three-, five-, and 10-yearperiods, but exceeded the benchmark from inception to December 31, 2020. The “since inception” investmentperformance provided included management by the Fund’s previous sub-adviser, which was replaced largely due topoor investment performance. The Board noted that it believed DSM’s investment performance was adequate.
M Capital Appreciation Fund
The Board considered the investment performance of M Capital Appreciation Fund. The Fund lagged its benchmark,the Russell 2500 Index, for the one-, three-, five-, and ten-year periods ended December 31, 2020. The Fundexceeded its benchmark for the period beginning with the Fund’s inception in 1996. The Board noted that Frontier’sinvestment performance was satisfactory.
BOARD OF DIRECTORS REPORT
CONSIDERATIONS IN APPROVING INVESTMENT ADVISORY
AND SUB-ADVISORY AGREEMENTS (Continued)
76
4. ADVISORY FEES PAYABLE TO THE ADVISER AND SUB-ADVISERS
The Board considered the advisory fees payable to the Adviser and Sub-Advisers. The Board noted that each Fundpays a management fee to the Adviser and the Adviser retains 0.15% of the management fee and pays the balanceof the management fee to the applicable Sub-Adviser. The Board reviewed information comparing the advisory feeof each Fund to the advisory fee charged to similar funds. The Board considered the profitability of the Adviser andnoted that no “fall-out” or collateral benefits were reported except the differentiation in the marketplace allowed bythe relationship because M Member Firms were able to offer the Funds to their clients while the majority of theircompetitors were not. The Board concluded that the management fees and the portion of the management feesretained by the Adviser were fair and reasonable.
The Board reviewed a comparison of each Fund’s advisory fees to those of other funds with similar strategies.
M International Equity Fund
The Board reviewed a comparison of the Fund’s advisory fees and expenses to those of other funds with similarstrategies. It was noted that the Fund’s total advisory fee is less than 56 and the same as four of the other69 managers in the peer group. DFA proposed a new fee schedule pursuant to which it would receive 0.25% on thefirst $100 million of assets under management and 0.20% on amounts over $100 million, excluding assets investedin other DFA managed mutual funds. It was noted that DFA had also provided a fee waiver for the period March 1,2021 through March 11, 2021 so that, in effect, the impact of the fee reduction was realized by the Fund as ofMarch 1, 2021. The Board noted that no “fall-out” or collateral benefits to DFA, MFIA or the Corporation resultingfrom the sub-advisory relationship were reported. It was further noted that DFA does not engage in soft dollartransactions on behalf of the Fund. The Board concluded that DFA’s fees were fair and reasonable.
M Large Cap Growth Fund
The Board considered the advisory fees payable to DSM. The Board reviewed a comparison of the Fund’s advisoryfees and expenses to those of other funds with similar strategies. The Board noted that based upon the Fund’s assets,the management fee was 0.59%, which includes 0.15% payable to MFIA as an advisory fee and 0.44% payable toDSM as the Sub-Adviser. It was noted that the Fund’s total advisory fee is less than 105 of the 172 other managersin the peer group and further noted that the sub-advisory fee DSM charges to the Fund is lower than its standard feestructure for separately-managed accounts in its large cap growth strategy. The Board reviewed DSM’s financialstatements. The Board noted that no “fall-out” benefits to DSM, MFIA or the Corporation resulting from the sub-advisory relationship were reported; however, DSM does engage in soft-dollar transactions on behalf of the Fundand other accounts. The Board concluded that DSM’s fees were fair and reasonable.
M Capital Appreciation Fund
The Board considered the advisory fees payable to Frontier as well as the profitability to Frontier in managing theFund. The Board reviewed a comparison of the Fund’s advisory fees and expenses to those of other funds withsimilar strategies. It was noted that Frontier’s sub-advisory fee is 0.73% of average daily net assets. It was furthernoted that the Fund’s total advisory fee is higher than 44 of the other 52 funds in its peer group, but still falls withina reasonable range of its peers. Frontier manages approximately 17 separate accounts in the capital appreciation
BOARD OF DIRECTORS REPORT
CONSIDERATIONS IN APPROVING INVESTMENT ADVISORY
AND SUB-ADVISORY AGREEMENTS (Continued)
77
strategy, and all but five pay the same fee that the Fund pays. The Board noted that no “fall-out” benefits to Frontier,MFIA or the Corporation resulting from the sub-advisory relationship were reported, however, Frontier does engagein soft dollar transactions on behalf of the Fund and its other accounts. The Board concluded that Frontier’s feeswere fair and reasonable.
5. THE EXTENT TO WHICH ECONOMIES OF SCALE WOULD BE REALIZED AS EACH FUNDGROWS AND WHETHER SHAREHOLDERS BENEFIT FROM THESE ECONOMIES OF SCALE
The Board considered the benefit to investors of economies of scale. The Board noted that the portion of themanagement fee retained by the Adviser does not decrease at breakpoints, but instead remains fixed at 0.15% ofthe average daily net assets of each Fund. The Board noted that the sub-advisory fees payable for the M InternationalEquity Fund, M Large Cap Growth Fund and M Capital Appreciation Fund to DFA, DSM and Frontier, respectively,decrease at breakpoints. The Board noted that as assets in each of the Funds increase, fixed operating costs arespread over a larger asset base resulting in a lower per share allocation of such costs. The Board concluded thatthese economies of scale benefit shareholders.
6. THE OPERATING EXPENSES OF THE FUNDS
The Board considered the operating expenses of each Fund. The Board noted that in addition to the advisory fee,each Fund is also responsible for payment of a portion of the Corporation’s operating expenses. The Board reviewedinformation comparing the total annual operating expenses of each Fund to the total annual operating expenses ofsimilar funds.
The Board noted that the Adviser has contractually agreed to reimburse each Fund for any expenses (other thanadvisory fees and extraordinary expenses) incurred by the Fund to the extent that such expenses exceed 0.25% ofthe Fund’s average daily net assets. The Board noted that the Adviser reimbursed $75,506 in 2020, $51,182 relatedto the M International Equity Fund and $24,324 related to the Large Cap Value Fund. The Board concluded that theCorporation’s operating expenses were fair and reasonable.
7. THE SUB-ADVISERS’ PROCESS FOR SELECTION OF BROKERS AND DEALERS FORPORTFOLIO TRANSACTIONS AND THE COST FOR SUCH TRANSACTIONS.
The Board considered the brokerage transactions on behalf of the Funds. The Board noted that the trading andexecution for the Funds is handled at the Sub-Adviser level. The Board noted that the Corporation’s CCO reviewseach Sub-Adviser’s written policies and procedures for fair-trading and best execution at least annually. The Boardalso noted that it is presented with quarterly reports of each Sub-Adviser’s soft-dollar commission information. TheBoard concluded that it was satisfied with the Sub-Advisers’ policies and procedures for broker selection and bestexecution.
The Board considered each Sub-Adviser’s process for choosing brokers for each Fund.
BOARD OF DIRECTORS REPORT
CONSIDERATIONS IN APPROVING INVESTMENT ADVISORY
AND SUB-ADVISORY AGREEMENTS (Continued)
78
M International Equity Fund
The Board noted that DFA selects brokers based on a number of stated criteria and that all brokers used by DFAmust be approved in accordance with DFA’s policies and procedures. Brokers are reviewed and approved by DFA atleast annually by its investment committee. The Board noted that DFA does not engage in soft dollar transactionson behalf of the Fund. The Board concluded that it was satisfied with DFA’s policies and procedures for brokerselection and execution.
M Large Cap Growth Fund
The Board considered brokerage arrangements by DSM on behalf of the Fund. It was noted that additionalinformation regarding DSM’s broker selection practices was set forth in Part 2A of the firm’s Form ADV, whichwas included in the Board Materials. It was further noted that more information regarding DSM’s 2020 soft dollarcommissions was also included in the Board Materials. The Board concluded that it was satisfied with DSM’spolicies and procedures for broker selection and best execution.
M Capital Appreciation Fund
The Board considered brokerage arrangements by Frontier on behalf of the Fund. It was noted that additionaldetailed information regarding Frontier’s broker selection practices was set forth in Part 2A of the firm’s Form ADV,which was included in the Board Materials. It was further noted that more information regarding Frontier’s 2020soft dollar commissions was also included in the Board Materials. The Board concluded that it was satisfied withFrontier’s policies and procedures for broker selection and best execution.
CONCLUSIONS
The Board noted that no single factor was cited as determinative to the decision of the Board. Rather, after weighingall of the considerations and conclusions discussed above, and based upon such information as it considerednecessary to the exercise of its reasonable business judgment, the Board concluded that it was fair and reasonableand in the best interests of the Funds to continue the investment advisory agreement with MFIA and the sub-advisory agreements with DFA, DSM and Frontier.
BOARD OF DIRECTORS REPORT
CONSIDERATIONS IN APPROVING INVESTMENT ADVISORY
AND SUB-ADVISORY AGREEMENTS (Continued)
Portfolio Holdings Disclosure
Disclosure of the complete holdings of each Fund is required to be made quarterly within 60 days of the end of theFund’s fiscal quarter in the Annual Report and Semi-Annual Report to Fund shareholders on Form N-CSR and inForm N-PORT, with every third month made available to the public by the SEC 60 days after the end of the Funds’fiscal quarter. You can find SEC filings on the SEC’s website, www.sec.gov. Each Fund will also make the quarterlyholdings reports available on the Corporation’s website at www.mfin.com. Once you reach the website, click on theM Funds link at the bottom of the web page. Then, click on the “Quarterly Holding Report” link.
Proxy Voting Policies and Procedures and Proxy Voting Record
A description of the Corporation’s proxy voting policies and procedures and the Corporation’s proxy voting recordfor the most recent twelve-month period ending June 30 are available (1) without charge, upon request, by callingthe Corporation toll-free at 1-888-736-2878; and (2) on Form N-PX on the SEC’s website at www.sec.gov.
79
M Fund, Inc.SUPPLEMENTAL INFORMATION (Unaudited)

As an indirect shareholder of a Fund, you incur ongoing costs, including management fees and other Fund expenses.The following example is intended to help you understand your ongoing costs (in dollars and cents) of investing ina Fund and to compare these costs with the ongoing costs of investing in other mutual funds.
The example is based on an investment of $1,000 invested at the beginning of the period and held for the entireperiod from January 1, 2021 to June 30, 2021.
Actual Expenses
The first line under each Fund in the table below provides information about actual account values and actualexpenses. You may use the information in this line, together with the amount you invested, to estimate the expensesthat you paid over the period. Simply divide your account value by $1,000 (for example, an $8,600 account valuedivided by $1,000 = 8.6), then multiply the result by the number in the first line for your Fund under the headingentitled “Expenses Paid During Period” to estimate the expenses you paid on your account during this period.
Hypothetical Example for Comparison Purposes
The second line under each Fund in the table below provides information about hypothetical account values andhypothetical expenses based on the Fund’s actual expense ratio and an assumed rate of return of 5% per year beforeexpenses, which is not the Fund’s actual return. The hypothetical account values and expenses may not be used toestimate the actual ending account balance or expenses you paid for the period. You may use this information tocompare the ongoing costs of investing in your Fund and other funds. To do so, compare this 5% hypotheticalexample with the 5% hypothetical examples that appear in the shareholder reports of the other funds.
Please note that the expenses shown in the table are meant to highlight your ongoing Fund costs only. As an indirectshareholder of a Fund, you do not incur any transactional costs, such as sales charges (loads), redemption fees orexchange fees. However, you do incur such transactional costs, as well as other fees and charges as an owner of avariable annuity contract or variable life insurance policy. If these transactional and other insurance company feesand charges were included, your costs would have been higher. Therefore, the second line under each Fund in thetable is useful in comparing ongoing Fund costs only, and will not help you determine the relative total costs ofowning different variable annuities or variable life insurance policies.
80
M Fund, Inc.HYPOTHETICAL EXPENSE EXAMPLE (Unaudited)
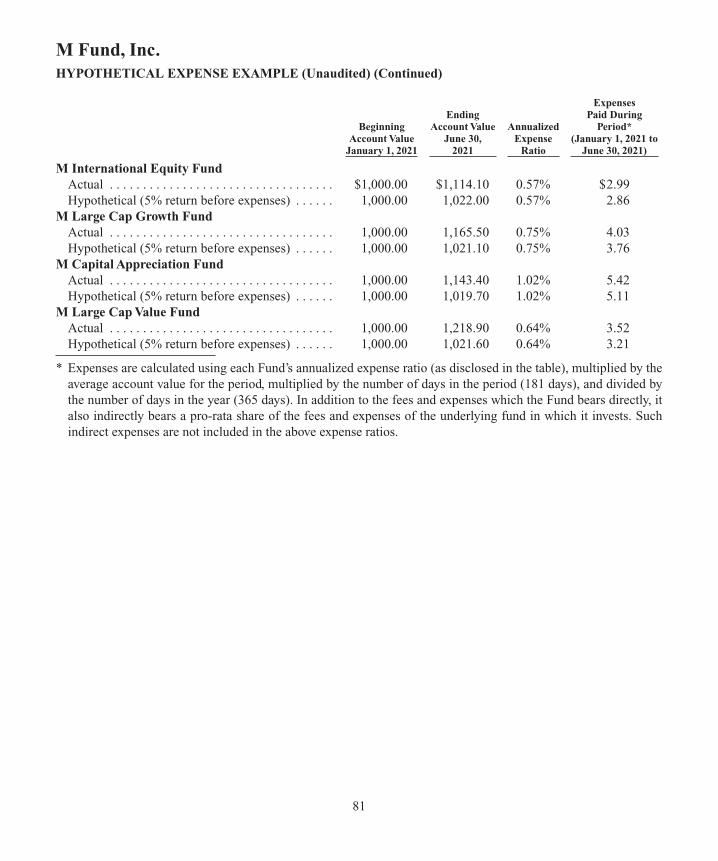
Expenses Ending Paid During Beginning Account Value Annualized Period* Account Value June 30, Expense (January 1, 2021 to January 1, 2021 2021 Ratio June 30, 2021)
M International Equity FundActual . . . . . . . . . . . . . . . . . . . . . . . . . . . . . . . . . . $1,000.00 $1,114.10 0.57% $2.99Hypothetical (5% return before expenses) . . . . . . 1,000.00 1,022.00 0.57% 2.86
M Large Cap Growth FundActual . . . . . . . . . . . . . . . . . . . . . . . . . . . . . . . . . . 1,000.00 1,165.50 0.75% 4.03Hypothetical (5% return before expenses) . . . . . . 1,000.00 1,021.10 0.75% 3.76
M Capital Appreciation FundActual . . . . . . . . . . . . . . . . . . . . . . . . . . . . . . . . . . 1,000.00 1,143.40 1.02% 5.42Hypothetical (5% return before expenses) . . . . . . 1,000.00 1,019.70 1.02% 5.11
M Large Cap Value FundActual . . . . . . . . . . . . . . . . . . . . . . . . . . . . . . . . . . 1,000.00 1,218.90 0.64% 3.52Hypothetical (5% return before expenses) . . . . . . 1,000.00 1,021.60 0.64% 3.21
* Expenses are calculated using each Fund’s annualized expense ratio (as disclosed in the table), multiplied by theaverage account value for the period, multiplied by the number of days in the period (181 days), and divided bythe number of days in the year (365 days). In addition to the fees and expenses which the Fund bears directly, italso indirectly bears a pro-rata share of the fees and expenses of the underlying fund in which it invests. Suchindirect expenses are not included in the above expense ratios.
81
M Fund, Inc.HYPOTHETICAL EXPENSE EXAMPLE (Unaudited) (Continued)