lyman-alpha imaging of starburst galaxies in the local ...197485/fulltext01.pdf · lyman-alpha...
TRANSCRIPT
Lyman-alpha imaging of starburstgalaxies in the local universe and
beyond
Matthew Hayes
Department of AstronomyStockholm University
Cover image:False colour composite image of nearby star forming galaxy ESO 338-IG04obtained with the Hubble Space Telescope. Hydrogen Lyman-alpha emissionis shown in blue, far ultraviolet continuum at ∼ 1500Å in green, and Hydro-gen Balmer-alpha in red. Despite being produced in the same photoionisednebulae, the emission of Lyman-alpha and H-alpha are clearly not spatiallycorrelated.Credit: G. Östlin.
c©Matthew Hayes, Stockholm 2007ISBN 978-91-7155-462-8Universitetsservice, US-AB, Stockholm 2007Department of Astronomy, Stockholm University

Doctoral Dissertation 2007Stockholm ObservatoryDepartment of AstronomySE-106 91 Stockholm
AbstractThe last decade has seen incredible advances in studies of astrophysical cos-mology, primarily as a result of developments in telescopic facilities, both onthe ground and in space. Recent results suggest that individual galaxies mayhave been found at redshifts (z) as high as 10. One of the primary observa-tional signatures of actively star forming galaxies in the distant universe is theLyman-alpha emission line (Lyα). The line is used either to search for ob-jects or as a spectral feature for definite redshift confirmation. In recent years,high-z Lyα surveys have been used to constrain cosmic star formation his-tory, search for signatures of large scale structure, and investigate the neutralhydrogen fraction of the intergalactic medium. This doctoral thesis is directlyconcerned with studies of the Lyα emission from star-forming galaxies andthe validity of Lyα as a cosmological tool.
The approach is to study a sample of local actively star forming galaxiesusing data obtained with the Hubble Space Telescope (HST). Imaging obser-vations have been performed in the Lyα line, Hα , and various continuumbandpasses in the ultraviolet and optical wavelength domains. Sophisticatedtools have been developed for the analysis of the images, resulting also in theo-retical exploration of Lyα-related observables from galaxies at high-z. Modelsimulations are presented, along with a methodology by which to interprethigh-z survey data. HST imaging results call into question the interpretationsof many high-z Lyα surveys. More specifically, the first direct observationalevidence is presented for the emission of Lyα photons after resonant scatter-ing in neutral hydrogen and low surface-brightness Lyα halos are found asa result. Imaging reveals Lyα morphologies that systematically differ frommorphologies probed by stellar light or non-resonant tracers of the nebulargas. Based upon Hα observations and recombination theory, the fraction ofLyα photons that escape is found never to exceed 20% in any of the observedtargets, despite the violent star-formation known to be taking place. Even af-ter internal dust corrections, a deficit from the predicted Lyα/Hα line ratio isalways found. The interpretation is that scattering events systematically en-hance the probability of absorption of Lyα by dust grains. If these galaxiesare representative of those that fall into the data-sets of high-z Lyα surveys,some cosmological estimates may be in error by an order of magnitude.


For Charlotta


Contents
1 Introduction 11.1 Surveying the universe . . . . . . . . . . . . . . . . . . . . . . . . . . . . . . 21.2 Star formation rates . . . . . . . . . . . . . . . . . . . . . . . . . . . . . . . . 3
2 Predicted Lyman-alpha observables 52.1 Early predictions for primeval galaxies . . . . . . . . . . . . . . . . . . 52.2 Truly primeval systems: toward population III . . . . . . . . . . . . 72.3 Effects of the intergalactic medium . . . . . . . . . . . . . . . . . . . . . 72.4 Number counts and luminosity functions . . . . . . . . . . . . . . . . 10
3 High-redshift Lyman-alpha Surveys 133.1 Finding the high-redshift populations . . . . . . . . . . . . . . . . . . . 133.2 First attempts at high-z detections . . . . . . . . . . . . . . . . . . . . . . 153.3 Recent results from high-z Lyα . . . . . . . . . . . . . . . . . . . . . . . 16
3.3.1 Properties of the highest-redshift galaxies . . . . . . . . . 163.3.2 Primeval stars and population III? . . . . . . . . . . . . . . . 183.3.3 Tests for reionisation . . . . . . . . . . . . . . . . . . . . . . . . . 193.3.4 Structure and clustering . . . . . . . . . . . . . . . . . . . . . . . 203.3.5 Star formation rates . . . . . . . . . . . . . . . . . . . . . . . . . . 22
4 Lyman-alpha observations in the nearby universe 254.1 Early studies with the IUE . . . . . . . . . . . . . . . . . . . . . . . . . . . 254.2 Spectroscopic studies with HST . . . . . . . . . . . . . . . . . . . . . . . 264.3 Imaging studies with HST . . . . . . . . . . . . . . . . . . . . . . . . . . . 30
5 Lyman-alpha radiative transport 315.1 Early analytical studies . . . . . . . . . . . . . . . . . . . . . . . . . . . . . . 325.2 The modern computational approach . . . . . . . . . . . . . . . . . . . 33
6 This thesis: data and methods 376.1 The imaging study and target selection . . . . . . . . . . . . . . . . . . 376.2 Observations with the Hubble Space Telescope . . . . . . . . . . . 386.3 Data processing methods . . . . . . . . . . . . . . . . . . . . . . . . . . . . 39
7 Summary of the Papers 437.1 Paper I . . . . . . . . . . . . . . . . . . . . . . . . . . . . . . . . . . . . . . . . . . 43

8 CONTENTS
7.1.1 Paper I – Erratum . . . . . . . . . . . . . . . . . . . . . . . . . . . . 447.2 Paper II . . . . . . . . . . . . . . . . . . . . . . . . . . . . . . . . . . . . . . . . . 447.3 Paper III . . . . . . . . . . . . . . . . . . . . . . . . . . . . . . . . . . . . . . . . . 457.4 Paper IV . . . . . . . . . . . . . . . . . . . . . . . . . . . . . . . . . . . . . . . . 467.5 Paper V . . . . . . . . . . . . . . . . . . . . . . . . . . . . . . . . . . . . . . . . . 47
8 Ongoing projects and future prospects 498.1 Narrow-band imaging in H-alpha and H-beta . . . . . . . . . . . . . 498.2 Infra-red emission line imaging . . . . . . . . . . . . . . . . . . . . . . . 498.3 Future Lyman-alpha studies with HST . . . . . . . . . . . . . . . . . . 508.4 Future Lyman-alpha studies with HST . . . . . . . . . . . . . . . . . . 518.5 Other applications of the spectral fitting codes . . . . . . . . . . . . 51
9 Acknowledgements 53
10 Publications not included in this thesis 55
11 Bibliography 57

List of Figures
2.1 Predicted Lyα observables . . . . . . . . . . . . . . . . . . . . . . . . . . . 62.2 Observables of population III objects . . . . . . . . . . . . . . . . . . . 8
3.1 Search methods for high-z Lyα emitters . . . . . . . . . . . . . . . . . 143.2 Atmospheric OH air-glow emission windows . . . . . . . . . . . . . 153.3 Lyα luminosity functions . . . . . . . . . . . . . . . . . . . . . . . . . . . . 203.4 Large scale structure of Lyα emitters . . . . . . . . . . . . . . . . . . . 22
4.1 Lyα observables vs. metallicity . . . . . . . . . . . . . . . . . . . . . . . 264.2 Lyα absorption profiles at low-z . . . . . . . . . . . . . . . . . . . . . . . 274.3 Lyα emission profiles at low-z . . . . . . . . . . . . . . . . . . . . . . . . 284.4 Predicted Lyα profiles with superbubble evolution . . . . . . . . . 29
5.1 Lyα transfer in a multiphase ISM . . . . . . . . . . . . . . . . . . . . . . 345.2 Predicted Lyα line profiles . . . . . . . . . . . . . . . . . . . . . . . . . . . 35
6.1 Far ultraviolet bandpasses . . . . . . . . . . . . . . . . . . . . . . . . . . . 386.2 UV and optical bandpasses . . . . . . . . . . . . . . . . . . . . . . . . . . . 39
8.1 ESO 338-IG04 as seen by HST and VLT/NACO . . . . . . . . . . . 50

List of Papers
This thesis is based on the following papers, which are referred to in the textby their Roman numerals.
I Hayes, M., Östlin, G., Mas-Hesse, J. M., Kunth, D., Leitherer,C., & Petrosian, A. (2005), HST/ACS Lymanα imaging of thenearby starburst ESO 338-IG04, A&A, 438, 71
II Hayes, M. & Östlin, G. (2006), On the narrowband detectionproperties of high-redshift Lyman-alpha emitters, A&A, 460, 681
III Hayes, M., Östlin, G., Mas-Hesse, J. M., (2007), Contin-uum subtracting Lyman-alpha images: Low redshift studiesusing the Solar Blind Channel of HST/ACS, in preparation for AJ
IV Hayes, M., Östlin, G., Atek, H., Kunth, D., Mas-Hesse, J. M.,Leitherer, C., Jiménez-Bailón, E., & Adamo, A. (2007) Theescape of Lyman photons from a young starburst: the case ofHaro 11, submitted to MNRAS
V Östlin, G., Hayes, M., Kunth, D., Mas-Hesse, J. M., Leitherer,C., Petrosian, A. & Atek, H. (2007), The Lyman alphamorphology of local starburst galaxies: release of calibratedimages, in preparation for ApJ
Reprints were made with permission from the publishers.


1
1 Introduction
This thesis is devoted entirely to studies of the Lyman-alpha emission line(Lyα), formed by the electronic de-excitation between the 22P and 12S or-bitals of neutral hydrogen (HI). This transition results in the emission of asingle photon with energy 10.2 eV and wavelength (λ ) 1216 Å. When short-lived massive stars are in existence, their hot atmospheres produce an intenseradiation field with a significant number of photons with energy greater than13.6 eV (λ < 912 Å) which ionised the surrounding neutral medium. Aftersome time, the individual electrons and protons recombine with continuousemission resulting from recombinations into the higher excited states of thehydrogen atom. A sequence of electronic cascades follows resulting in a se-ries of discrete emission lines, the final stage of which produces photons in theLyman series. Thus, the hydrogen emission line spectrum is frequently seensuperimposed on spectra of young stellar populations and is used as a diag-nostic of star formation. Around 1/3 of the ionising energy is reprocessed inthe Lyα emission line alone.
Star formation in galaxies typically occurs either quiescently at low, sus-tainable rates or in rapid, unsustainable, and therefore short-lived bursts (‘star-bursts’). In the second mode, Lyα may be expected to be so bright that it couldbe observable from the farthest reaches of the observable universe. Indeed thisdoes seem to be the case although, considering the distances involved, evenLyα may appear very faint. Stellar continua are fainter still, often undetected,and Lyα may be the only radiation seen from some galaxies at the highest red-shifts, at least with current technology. While theories may be able to predictLyα observables, how much information can really be inferred from a singleemission line? The situation is so complex that detailed observational tests arerequired.
The work contained here is broken down as follows. The remainder of thisChapter provides a broad overview of galaxy surveys and observational di-agnostics of star formation. Chapters 2 and 3 outline the general significanceand cosmological importance of Lyα studies. Chapters 4 and 5 explain whythe physical understanding of Lyα emission is far from complete and thatmuch further work is required. Chapter 6 describes the observations and someof the methods employed in the presented articles. Chapter 7 includes a de-scription of the individual articles produced for the thesis. Chapter 8 outlinessome ongoing work and future prospects. Finally the articles themselves areincluded.

2 Introduction
1.1 Surveying the universeThe universe is a large and poorly understood entity. A great deal of whatwe do understand comes from observations of the stars; by observing the ra-diation they produce directly, by observing reprocessed stellar energy, or byobserving the violent phenomena in the final stages of stellar evolution. Allbut a very small fraction of stars in the universe reside in the confines of grav-itationally bound galaxies. As we look to greater distances stars become toofaint and angular separations too small for stars to be observed individuallyand observers must instead rely upon the integrated stellar light from galax-ies. Fortunately galaxies, at least the bright ones, can be observed out to thevery large distances and the current record-holding galaxy candidate lies at aredshift (z) of about 10, when the universe was just a few percent of its currentage. The galaxy population is far from homogeneous, with objects spanningmany orders of magnitude in mass and luminosity, exhibiting a wide array ofcolours and morphological types. Furthermore, galaxies are not evenly dis-tributed in space, but follow a complex distribution in groups, clusters, andsuper-clusters. On very large scales clusters are linked by filamentary struc-tures, with huge voids between in which very few objects are found. Funda-mental issues that need to be addressed are how the rate of star formation hasproceeded as a function of cosmic time (i.e. at the rate gas has been convertedinto stars), what physical processes are dominant in regulating and driving starformation, and how this varies as a function of environment. Furthermore thestate (composition, density, ionisation, etc.) of the space in between galaxies(the intergalactic medium; IGM) plays a fundamental role in our understand-ing of the universe and its evolution.
Many many efforts have been undertaken, are underway, and are in devel-opment to address just these questions, the most common approach being tosurvey the visible galaxy population. Optimisation of telescope time dependsupon the scientific goal; ideally one wants as many galaxy candidates as pos-sible. Arguably the largest scale survey to date is the Sloan Digital Sky Survey(SDSS). Using a dedicated 2.5m telescope and five optical bandpasses SDSShas already detected over 200 million celestial bodies and measured spectrafor more than 750 000 extra-galactic objects. Covering one quarter of the sky,SDSS will construct a three-dimensional map of the galaxy population. Cov-ering a much smaller portion of the sky, the Canada-France-Hawaii TelescopeLegacy Survey Deep (CFHT-LS) and Subaru Deep Field (SDF) surveys haveobtained a similar type of data-set to SDSS but reaching fainter depths, aimingdirectly at studying the evolution of clustering and stellar populations withcosmic distance, and uncovering some of the most distant galaxies. Space-based surveys, e.g. the Hubble Deep Field (HDF) and Great ObservatoriesOrigins Deep Survey (GOODS) again have similar objectives but utilise theenhanced resolving power of the Hubble Space Telescope. These examplesselect just a few of the many galaxy surveys using optical wavelengths; cov-

1.2 Star formation rates 3
erage of all of them would require a volume of its own. Combined data fromall of these surveys have produced, and will continue to provide insights intothe processes of galaxy evolution, clustering, and cosmic star formation.
1.2 Star formation ratesThe star formation rate (SFR) is defined as the rate at which gas is convertedinto stars and, integrated over a single object, is typically measured in solar-masses per year (M� yr−1). From the perspective of astrophysical cosmol-ogy, the key star formation related quantity to pin down is the rate of cosmicstar-formation per unit volume, or star formation rate density (ρSFR, units ofM� yr−1 Mpc−3). This quantity, measured at various epochs in the history ofthe universe, gives us the cosmic star formation history; a quantity fundamen-tally linked to the drivers of the star formation process and galaxy evolution.Typically ρSFR is measured by summing the SFR of all the galaxies found ina given volume of space.
Star formation rates can be measured in a number of ways and an excellentreview can be found in Kennicutt (1998a). For standard initial mass function(IMF; the mass distribution of stars at zero age)1, the relative abundance ofmassive stars is small. Since these stars have very short lifetimes (less thanthe proto-stellar collapse timescale) ongoing star formation is required to ob-serve them and their number becomes a direct tracer of the SFR. Since theyburn very hot (T & 30000 K), they may dominate the far ultraviolet (FUV)luminosity of the host and the FUV luminosity is often used as an SFR esti-mator, a common calibration being that of Madau et al. (1998). This is par-ticularly useful for high-z galaxy surveys when the restframe FUV gets red-shifted to optical wavelengths, and is observable from the ground. Drawbacksof SFR(FUV) include extinction by dust which can be severe in the FUV, andthat post-starburst A-star dominated systems remain bright in the FUV several100 Myr after active star formation has ceased.
Since the ionising output from massive stars is reprocessed in the hydro-gen recombination spectrum, recombination lines offer an alternative mea-sure since they trace the ionising luminosity directly. Essentially any line canbe used, most commonly Hα since it is the strongest line in the optical do-main and lies in the R-band where dust reddening is small. Many SFR(Hα)calibrations have been published, a very frequently adopted relation being thatKennicutt (1983). Hα is a very common star formation probe at low-z, but isnot suited to high-z since it is redshifted out of the optical domain at z ∼ 0.4.Blueward of Hα , Hβ would be a possibility but is less well suited to SFRdeterminations being a weaker line and more susceptible to both stellar Hβ
absorption and dust reddening. [OII]λ3727Å has been calibrated as a SFR
1dN/dM ∝ M−2.35, for the Salpeter (1955) initial mass function. Mass range frequently as-sumed to be between 0.1M� and 100M�. Numerous alternative and more complex IMFs exist.

4 Introduction
diagnostic (e.g. Gallagher et al. 1989) and may be better suited to high-z, re-maining in the optical until z ∼ 1.4. Neither is it subject to stellar absorptionbut has only been empirically calibrated against Hα and spread is significant.The only strong recombination line bluewards of [OII] is Lyα at 1216Å. Sinceit is not redshifted out of the the optical domain until z ∼ 6.5, in principlemakes it an ideal tracer of star formation at very high-z. However, Lyα is ex-tremely sensitive to dust and, due further complexities relating to its resonantnature, it may make an extremely biased indicator. Indeed the complexity ofLyα emission from galaxies is the main topic addressed in this thesis.
Many other wavelength domains may be used to estimate SFRs in galaxies.Most notably, the far infra-red thermal continuum from UV-heated dust grains(Kennicutt 1998b), the X-ray luminosity (Ranalli et al. 2003), and radio con-tinuum, (Condon 1992). All SFR estimators are subject to model uncertainties,particularly regarding the IMF and assumed star-formation timescales.

5
2 Predicted Lyman-alphaobservables
2.1 Early predictions for primeval galaxiesThe star formation process very quickly leads to the production of dust. Dustin turn leads to the attenuation of both starlight and emission from nebular gas,with extinction curves showing successively more attenuation at shorter wave-lengths (although some discrete features may be present). All extinction lawspeak at FUV wavelengths, indicating strong biases may be introduced intoquantities derived from FUV continuum or Lyα . However, the very first starsto turn on in the universe must have done so in a dust-free environment. Sincethe first stars must also form at high redshifts, from where the FUV will beredshifted to wavelengths observable from the ground, both FUV continuumand Lyα have long been considered effective tracers of high-z star formationand ‘primeval galaxies’.
Indeed, it was just these considerations that lead Partridge & Peebles (1967)to propose the use of both the Lyman continuum break and Lyα emission lineas observational signatures of primeval galaxies and to make observationalpredictions. These predictions were based upon the most basic stellar popula-tion model: that the spectrum of the primeval starburst could be approximatedby that of a single blackbody with effective temperature midway between thatof an average O and B star (Teff = 30000 K). Computing the fraction of ion-ising photons (hν > 13.6 eV; λ < 912Å), and assuming that they were all ab-sorbed by neutral hydrogen, Partridge & Peebles (1967) were able to estimatethe strength of the nebular hydrogen spectrum from recombination theory.They found that in this idealised case, equivalent widths1 of around 70Å couldbe expected for Lyα . For the estimated galaxy masses, this corresponded toLyα fluxes so great that objects could potentially be observed at cosmologi-cal distances, and represented the birth of cosmological Lyα studies, at leastconceptually.
A more advanced approach was adopted by Meier (1976) who modified thesingle blackbody spectrum of Partridge & Peebles (1967) using more devel-oped population synthesis models (Tinsley 1972). Since the massive hot starsdominate both the UV continuum near Lyα and the ionising photon budget,
1Equivalent width (W ) measures the strength of a spectral line relative to the continuum. W =F/ fλ . F is flux integrated over line flux, fλ is continuum flux density. Unit is that of wavelength,usually Å.

6 Predicted Lyman-alpha observables
Figure 2.1: Predicted observables from Charlot & Fall (1993). Left: The evolutionof the UV and optical composite stellar continuum with time. A decrease in ionisingflux of over three orders of magnitude is visible between 10 and 100 Myr. Right: Theevolution of Lyα flux and equivalent width over the same time-scales. An extremelysharp break is seen in the flux around 40 Myr resulting directly from the drop inionising continuum. Various upper mass limits (in M�) on the IMF are labeled.
Meier’s result was in close agreement with Partridge & Peebles (1967) at theearliest times: WLyα∼ 70Å. The main limitation of both of these attempts wasthe treatment of the ionising photons, given that no individual stars had everbeen observed at these wavelengths.
Sophisticated population synthesis modeling (e.g. Bruzual & Charlot 1993),aided by libraries of observed stellar spectra, improved the estimates of Lyα
observables in the early 1990s. Due to the advent of space-based FUV obser-vatories and stellar atmosphere radiative transport models, population synthe-sis models became much better equipped to estimate the ionisation budget.The models allow galaxy spectra to be predicted for a variety of IMFs andstar formation histories. Figure 2.1 shows predictions from Charlot & Fall(1993) for the stellar continuum spectra (left) and for the resulting Lyα fluxand equivalent width (right). The stellar continuum flux can be seen to declinewith age at all wavelengths but the ionising flux predictions are significant:between 10 and 100 Myr, the ionising flux density can be seen to drop by overthree orders of magnitude, while the continuum flux at Lyα evolves muchmore slowly. Due to the fall-off in the ionising power, the Lyα flux can beseen to decrease very rapidly at around 40 Myr, after which the Lyα emissionfeature cannot be expected. The models predict WLyα of up to 240Å (for aninstantaneous starburst with Salpeter IMF) at early times during the starburstphase.
The Charlot & Fall (1993) predictions remain oft-cited by Lyα observersand the ranges of equivalent widths observed spectroscopically infrequently

2.2 Truly primeval systems: toward population III 7
exceed the limits set by these models. They were, however, based upon li-braries of normal stars, observed in the Galaxy and Magellanic clouds, andare unlikely to be representative of the first stars to form in the universe.
2.2 Truly primeval systems: toward population IIIThe IMF is thought to be determined by gaseous collapse, fragmentation, spin,cooling, and turbulence in the protostellar clouds, resulting in Jeans masses of. 100M� for normal metallicities (Z). Simulations suggest that metal-freesystems are able to avoid fragmentation at masses between 100 and 1000M�,resulting in the formation of very massive stars (Abel et al. 2000; Brommet al. 2002). This represents a significant departure from ‘normal’ stellar massdistributions of zero age populations. Also, as a result of zero metal opac-ity and higher central temperatures and pressures, the properties of individualpopulation III stars are thought to differ greatly from their higher metallic-ity counterparts, with effective temperatures significantly higher: & 105K at100M� (Tumlinson & Shull 2000; Schaerer 2002). With substantially raisedeffective temperatures at given mass, and relative overproduction of massivestars, the far and extreme UV spectrum of a primeval star forming galaxy isexpected to be significantly enhanced compared to normal starbursts.
Figure 2.2 shows some predictions for the zero age spectrum of a popu-lation III galaxy and the evolution of WLyα with time. Due to the higher ef-fective temperature of the stars, the spectrum hardens and the ionising powerincreases, dramatically raising the contribution of the nebular continuum com-ponent compared to normal starbursts. In the example shown here, the totalspectrum is dominated by nebular gas at all wavelengths redward of the Ly-man break. While the most massive (> 100M�) are still in existence, WLyα
reaches above 1000Å and the hardening of the spectrum results in a substan-tial number of photons with energy sufficient to ionise He+ (24.6 eV) and aHeII λ1640Å line is also superimposed on the spectrum. This line is generallyaccepted as the canonical signature of population III stars although to date ithas never been observed in high-z starburst systems.
2.3 Effects of the intergalactic mediumWhile significant work has gone into predicting the restframe observables ofstar forming objects, the actual observables, particularly regarding Lyα , maydiffer significantly. The spectrum may be modified by radiative transfer effectsinternal to the galaxy (in the interstellar medium; Chapter 5) or between thetarget and the Milky Way (in the intergalactic medium; IGM).
Just like in the ISM, the IGM makes its presence felt as a result of two ma-jor constituents: dust and HI. Typically in the ISM, dust or HI are thought of

8 Predicted Lyman-alpha observables
Figure 2.2: Predicted observables from Schaerer (2002, 2003). Left: Synthetic spec-trum of a zero-age main sequence population at Z = 10−7Z�. Dotted black spectrum:pure stellar continuum; grey spectrum: nebular gas continuum; solid black: total stel-lar+nebular spectrum. Vertical dotted lines show the ionisation energies of HeII, HeI,and HI. Strong nebular recombination lines are superimposed on the spectrum, in-cluding the canonical Pop III signature: the HeIIλ1640Å line. Note also the opticalcontinuum is dominated by the nebular continuum which is much redder than thatof the stars. Right: predicted evolution of the HI Lyα equivalent width for variousburst models at Z = 10−7Z�. Zero-age WLyα is significantly higher than that shown inFigure 2.1.
as screens covering the central regions, negligible in depth compared to cos-mic distance scales. In the IGM the ‘screen’, while of extremely low densitycompared to the ISM, may have a depth comparable to the distance to thetarget, implying that any wavelength-specific processes manifest themselvesover a wide range of spectral bands. Moreover, the density and compositionof the IGM constituents vary with z, as a result of the Hubble expansion andgalaxy evolution and feedback processes. Thus redshift and line–of–sight tothe source have a profound impact upon the observed spectrum.
Firstly, it has long been known from high-z quasar spectroscopy that dis-crete Lyα absorption features are seen on the blue side of redshifted Lyα , thatresult from individual HI clouds in the IGM (i.e. The Lyα forest; LAF). Nu-merous LAF review articles have been published (eg. Rauch 1998; Fan et al.2006) and won’t be discussed at length here. Each individual cloud leaves itsimprint in the spectrum, depending on redshift and the neutral hydrogen col-umn density (nHI). Both the space density (Péroux et al. 2003) and columndensity (Rao et al. 2006) depend strongly upon redshift. This means that con-version between observed and restframe optical colours is more involved thanthe standard cosmological K−correction. Madau (1995) has shown that lineblanketing by Lyman series absorption features in IGM clouds would causez∼ 3 galaxies to completely drop out of U−band observations, even neglect-

2.3 Effects of the intergalactic medium 9
ing the intrinsic Lyman break feature. By z∼ 4, more that two magnitudes arelost at B. Between redshifts of 4 and 5, Madau (1995) also suggested that IGMabsorption features could completely remove flux bluewards of Lyα , resultingin a ‘Lyman-alpha break’, similar to the classic Lyman break but situated atrestframe 1216Å, which should instead be used as a tool to identify high-zgalaxies.
Complete absorption (Gunn-Peterson) troughs have been observed inquasar spectra at zGP = z ∼ 6 − 6.5. This either represents the gradualthickening of the LAF (Songaila & Cowie 2002; Songaila 2004) or asignificant change in the fraction ionisation fraction (xHI) of the IGM (Beckeret al. 2001; Djorgovski et al. 2001; Fan et al. 2002). Whatever the directcause of the Gunn Peterson trough, the high HI column density near thesource implies the red damping wing of the absorption profile at Lyα mayalso affect the emitted Lyα line itself (e.g. Miralda-Escude 1998). Simpleconsiderations would then demonstrate that at redshifts around zGP the Lyα
line could be severely attenuated by the local IGM and at slightly greater zLyα-emitters (LAE) would cease to be observable.
However, hope exists for the observation of Lyα beyond the epoch of reion-isation. Loeb & Rybicki (1999) have investigated the effects of resonant Lyα
scattering in the pristine neutral IGM. In their models, photons scatter anddiffuse until they redshift out of resonance owing to the Hubble expansion,from which point they free stream through the neutral IGM. This would resultin Lyα halos significantly larger than the HII region where the Lyα formed,and a decrease in surface brightness as the intensity is distributed over a largerangular size.
The size of a photoionised region (Strömgren sphere in the idealised, spher-ically symmetric case) can be computed from very simple ionisation balanceconsiderations. Cen & Haiman (2000) and Madau & Rees (2000) have pre-sented models of the Lyα line transmission from a source embedded in aneutral IGM. Objects with sufficient ionising power are found to create HII
regions so large that the travel time between Lyα photons being produced andreaching the ionisation boundary is enough for photons to be redshifted outof the restframe scattering resonance and avoid scattering in the IGM. Thismodel was developed by Haiman (2002) producing a simple model for Lyα
transmission prior to reionisation where the transmitted fraction of Lyα is de-pendent simply upon star-formation rate (i.e. the number of ionising photons),nHI, and the intrinsic thermal width of Lyα . Subsequent Lyα predictions ofasymmetric line profiles from epochs prior to reionisation have been made bySantos (2004) where dynamic effects in the IGM (HI infall) and host (feed-back and outflows) were considered.
Lyα emission beyond reionisation is aided by the fact that the galaxy distri-bution in the universe is far from homogeneous with significant overdensitiesin place by z∼ zGP. If the reionisation process began at z∼ 14 as suggested byW-MAP (Spergel et al. 2007), the early and mid stages of reionisation are ex-

10 Predicted Lyman-alpha observables
pected to be quite inhomogeneous. The clustering of the first star-forming ob-jects results in the individual Strömgren spheres overlapping, producing cos-mological HII regions. This implies Lyα would be expected from some sitessignificantly prior to zGP. Typically, it would be redshifted out of the wave-length domain covered by most current surveys. While detections of LAEsprior to re-ionisation seems possible, detections are more likely to trace proto-clusters than individual galaxies.
2.4 Number counts and luminosity functionsPrevious discussion in this Chapter has focussed on the observables from in-dividual objects but has not addressed the actual number of such objects thatcould be expected from a given observation. The luminosity function (LF)describes the space density of galaxies at a given luminosity, usually approxi-mated by the Schechter function2.
Quite recently, an analytical approach to the problem was taken by Haiman& Spaans (1999) who employed Press & Schechter (1974) formalism to esti-mate the cosmological mass distribution of dark matter halos. They assumedthat each halo goes through a Lyα emitting phase during which a certainfraction of baryonic mass is converted into stars over a constant timescale.This allowed them to compute the surface density of Lyα emitters on the skyabove a given observational threshold flux. While not publishing the predictedLF(Lyα) per se, they did comment on how the observed space density dependsvery strongly upon detection threshold, noticing how a loss in sensitivity ofa factor of 10 resulted in a decrease in observed space density by a 2–3 or-ders of magnitude between redshifts 2 and 5. One of the main points of thisarticle was the suggestion that if the intrinsic LF(Lyα) was known at a givenredshift, deviations from this could be used to constrain xHI (see Section 2.3).Employing the Lyα attenuation model of Cen & Haiman (2000) these modelswere converted to luminosity functions by Haiman & Cen (2005) for a varietyof values of xHI.
Le Delliou et al. (2005, 2006) have performed similar experiments basedupon semi-analytical galaxy formation models that include the star-formationepisodes for each condensation. SFH for each model galaxy is then easilyconverted into Lyα luminosity by assuming an IMF to compute the ionisationbudget, recombination theory to compute the Lyα production, and a Lyα es-cape fraction to obtain the emitted flux. They found Lyα LFs to well matchobservations at redshifts between 2 and 5 and were also able to predict a va-riety of properties and observables of Lyα selected systems, including halomasses, clustering biases, stellar masses, and the Lyα equivalent width distri-
2Schechter function: Φ(L)dL = φ?( L
L?
)α exp(− L
L?
) dLL? describes the number of galaxies per
Mpc3 as a function of luminosity. The function takes the form of a power law with index α atL < L? and a negative exponential at L > L?.
2.4 Number counts and luminosity functions 11
bution. All of these can be compared against observables or observationally-inferred properties. More recently an analytical approach has been adopted byDijkstra et al. (2007) who again uses a Press-Schechter formalism but mod-ified to comoving coordinates (Sheth et al. 2001). Their conversion betweenmass and Lyα luminosity functions is performed by assuming a star-formationduty cycle, efficiency, escape fraction and IGM transmission.
The intrinsic Lyα luminosity function is one of the most valuable quantitiesto pin down, since comparison of the observed LF with redshift may provideinsights into the ionisation state of the IGM. Unfortunately so many variablesgo into the estimate, and Lyα is by nature a very sensitive line (Chapters 4and 5), that robust estimates are extremely difficult to make. More discussionof LF(Lyα), relating to real observations, can be found in Section 3.3.3.


13
3 High-redshift Lyman-alphaSurveys
After having discussed what theoreticians expect, I now discuss the reply ofthe observers. Firstly by discussing the survey methodologies, then discussingthe first generations of surveys, followed by a summary of the current state–of–the–art.
3.1 Finding the high-redshift populationsSeveral observational techniques are commonly employed to hunt down thehigh-z galaxy populations, and often it is prudent to use more than one, ei-ther concurrently or consecutively, to obtain robust results. Selection of high-z galaxy candidates has been successfully performed using the Lyman-breakselection criterion by numerous groups, most notably at redshifts around 3 us-ing various ground-based telescopes (Steidel et al. 1999), and all the way toz∼ 6 using the HST (GOODS and HUDF) and SUBARU telescopes (Stanwayet al. 2003, 2004; Bunker et al. 2004; Yan et al. 2006), and between 7 and 8(Bouwens et al. 2004). In principle, pure broad-band photometry enables pho-tometric redshifts (photo-z) to be derived for large catalogues simultaneously.Photo-z techniques are commonplace and statistically accurate when testedagainst large spectroscopic samples, particularly at low- and intermediate-z.However at the highest redshifts, where dropout candidates are detected injust one or two bandpasses, photo-zs cannot be considered robust for indi-vidual targets and spectroscopic follow-ups are essential to obtain redshiftconfirmation.
Searches for emission line objects don’t suffer directly from such erroneousredshift determinations; if an emission line can be found and identified, thenits wavelength gives the redshift of the object directly. Emission line searchescan be performed in essentially three ways: slitless spectroscopy (objectiveprism), long-slit spectroscopy, and narrow-band imaging.
The objective prism method simply requires a dispersion element in the col-limated beam of the telescope, thereby dispersing the light received from eachobject across the detector. Thus both spatial and spectral information are pro-vided simultaneously. However, with no filter to remove the sky background,the background is dispersed over all wavelengths of the detector, resulting ingeneral, in high background noise and poor sensitivity. Moreover, without a

14 High-redshift Lyman-alpha Surveys
slit in front of the disperser, all light from the targets is smeared together overthe dispersion axis, making the method more suitable for identifying unre-solved objects like stars or high-z quasars, than spatially resolved galaxies.The method was frequently employed to search for low-z HII galaxies (e.g.Moss et al. 1988) although has fallen out of favour in recent years. It is cur-rently enjoying something of a comeback due to the Grism ACS Program forExtragalactic Science (GRAPES) survey using HST/ACS (Rhoads et al. 2005).
Long-slit spectroscopic search methods offer a different approach and im-proved sensitivity, since only sky background in the slit itself is transmitted.Moreover, depending on the dispersion, large redshift ranges may be sampledin a single observation. However, if survey volume is the goal, then slit spec-troscopy suffers in the face of its small field–of–view as the slit reduces thearea covered on a given pointing. Strategic improvements can be made by tar-geting critical lines following the caustics of lensing clusters (see Figure 3.1), in order to use the natural telescopic effect of the cluster to observe fainterbackground sources (e.g. Stark et al. 2007).
Figure 3.1: Left: Example of blind longslit survey approach where slits are placedalong gravitational lens caustics from Stark et al. (2007). Right: Narrow-band surveyfilter setup targeting Lyα at z∼ 6.5 from the SUBARU group.
Easily the most common method of searching for high-z Lyα emitters is thenarrow-band (NB) imaging approach in which single narrow-band observa-tion is used to target the line. At least one wavelength-coincident broad-band(BB) imaging observation is required. Thus if an line emitting object at theright redshift falls within the field–of–view (FoV), then it will exhibit a blue(negative) NB−BB colour (‘narrow-band excess’). Narrow-band imaging hasthe advantage of being able to cover large FoV; as large as the good regionof the detector, and the narrow filter itself limits the sky-noise. Redshift spaceis however restricted due to the narrow bandpass. Target redshifts are furtherrestricted by atmospheric OH air-glow emission lines which dominate the skybackground in the R-band and become stronger with increasing wavelength.Hence narrow-band filters must be selected so as to avoid residual contami-
3.2 First attempts at high-z detections 15
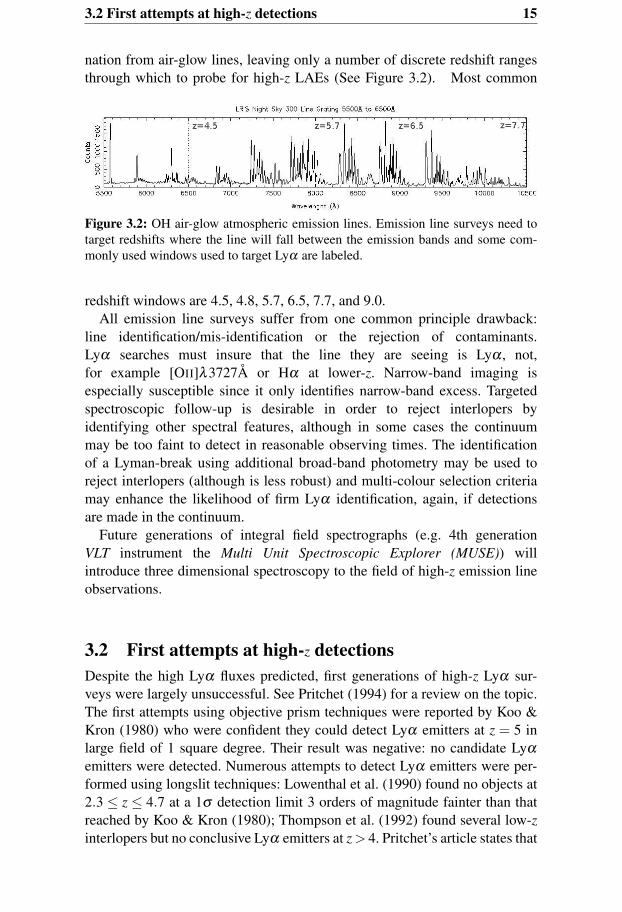
nation from air-glow lines, leaving only a number of discrete redshift rangesthrough which to probe for high-z LAEs (See Figure 3.2). Most common
Figure 3.2: OH air-glow atmospheric emission lines. Emission line surveys need totarget redshifts where the line will fall between the emission bands and some com-monly used windows used to target Lyα are labeled.
redshift windows are 4.5, 4.8, 5.7, 6.5, 7.7, and 9.0.All emission line surveys suffer from one common principle drawback:
line identification/mis-identification or the rejection of contaminants.Lyα searches must insure that the line they are seeing is Lyα , not,for example [OII]λ3727Å or Hα at lower-z. Narrow-band imaging isespecially susceptible since it only identifies narrow-band excess. Targetedspectroscopic follow-up is desirable in order to reject interlopers byidentifying other spectral features, although in some cases the continuummay be too faint to detect in reasonable observing times. The identificationof a Lyman-break using additional broad-band photometry may be used toreject interlopers (although is less robust) and multi-colour selection criteriamay enhance the likelihood of firm Lyα identification, again, if detectionsare made in the continuum.
Future generations of integral field spectrographs (e.g. 4th generationVLT instrument the Multi Unit Spectroscopic Explorer (MUSE)) willintroduce three dimensional spectroscopy to the field of high-z emission lineobservations.
3.2 First attempts at high-z detectionsDespite the high Lyα fluxes predicted, first generations of high-z Lyα sur-veys were largely unsuccessful. See Pritchet (1994) for a review on the topic.The first attempts using objective prism techniques were reported by Koo &Kron (1980) who were confident they could detect Lyα emitters at z = 5 inlarge field of 1 square degree. Their result was negative: no candidate Lyα
emitters were detected. Numerous attempts to detect Lyα emitters were per-formed using longslit techniques: Lowenthal et al. (1990) found no objects at2.3 ≤ z ≤ 4.7 at a 1σ detection limit 3 orders of magnitude fainter than thatreached by Koo & Kron (1980); Thompson et al. (1992) found several low-zinterlopers but no conclusive Lyα emitters at z > 4. Pritchet’s article states that

16 High-redshift Lyman-alpha Surveys
other groups have attempted to look for serendipitous high-z Lyα detectionsin off-target regions of pre-existing long-slit data, but no detections worthy ofpublication have materialised. Between the mid 1980’s and early 1990’s, nu-merous narrow-band imaging surveys were undertaken: Pritchet & Hartwick(1987) reported zero objects in the range 4 < z < 6; Pritchet & Hartwick(1990) reported zero objects at z = 2; Studies by Rhee et al. (1989) foundzero objects; Wolfe et al. (1992) found a single object in a field surroundinga bright QSO at z = 2.2; Djorgovski et al. (1992) found several candidatesat z = 4 but could spectroscopically confirm none of them; de Propris et al.(1993) found zero objects at z = 2.3; Møller & Warren (1993) found a singleconfirmed emitter at z = 2.8; Macchetto et al. (1993) found a single object atz = 3.4; Parkes et al. (1994) found no Lyα emitters at z = 7. In all, tens ofsurveys and hundreds of hours of telescope time found three high-z LAEs inabout a decade.
Limits on the number density of LAEs from the observations describedabove could then be compared these predicted LFs from (Pritchet & Hartwick1990, see Section 2.4), and showed clear discrepancies. Before 1994 therewas no evidence for the observed number of Lyα emitters coming close to thepredicted values; in most case being under-abundant by around two orders ofmagnitude.
3.3 Recent results from high-z Lyα
As is frequently the case, the break-through had to wait for technology, whichcame in the form of large-diameter reflectors, high-throughput optics, and sen-sitive linear detectors. The last decade has seen Lyα surveys triumph on anumber of fronts, with large-scale imaging surveys such as surveys of Hu et al.(1998), the Large Area Lyman-Alpha (LALA) survey (Rhoads et al. 2000), andthe Lyα front of the SUBARU Deep Survey (Ajiki et al. 2003). To date, severalhundred objects have been found, or have had redshifts confirmed thanks totheir Lyα emission. Cosmic distances are pushing z = 10. In this Section, Idescribe some of the attempts to infer the properties of these high-z Lyα se-lected galaxies and summarise some of the attempts to derive cosmologicalquantities from the samples.
3.3.1 Properties of the highest-redshift galaxiesDetermining the properties of galaxies in the very distant universe is extremelychallenging from an observational perspective. Frequently, objects are eithertoo faint for spectroscopic evaluation of the stellar continuum or go com-pletely un-detected in continuum bandpasses. Properties that one would liketo learn about these galaxies include the age and mass of their stellar popu-lations, dust content, metallicity, and IMF. In cases where objects are bright

3.3 Recent results from high-z Lyα 17
enough or observations deep enough to measure several points on the SED,some of these parameters may be recoverable by fitting of spectral models tothe data. Several attempts to recover properties high-z LAEs have been pre-sented either by examining sources individually or stacking datapoints.
Populations of Lyα-selected galaxies at z ∼ 3.1 have been studied by bothGawiser et al. (2006) and Nilsson et al. (2007) by stacking optical and NIRdata-points for 40 objects, and optical, NIR and Spitzer data-points for 23 ob-jects, respectively. Results of these two studies are largely in agreement, withbest fit ages of ∼ 500 Myr, and masses of ∼ 5× 10⁸M�. Finkelstein et al.(2007) have applied SED fitting methods to objects found in the z∼ 4.5 LALAfield, stacking 21 objects for which continuum detections were made in sub-groups based upon WLyα . They found that both age and mass increased withdecreasing WLyα , with ages ranging between 4 and 200 Myr and masses be-tween 2× 10⁷ and 2× 10⁹M�. This result is entirely consistent with currentunderstanding since WLyα a rapidly decreasing function of stellar age, andolder stars reduce WLyα while increasing the mass. Pirzkal et al. (2006) com-bine Spitzer mid-IR data-points with HUDF data from a sample of nine LAEsbetween z = 4 and 5.5, fitting models to individual sources. The addition ofrestframe ∼ R-band data-points proves crucial in the mass estimates, whichthey conclude to be lower than previous studies at 106 to 108M�. All ageswere determined to be less than 20 Myr at best fit. Similarly, Lai et al. (2007)have presented SED-fitting studies of three LAEs at z ∼ 5.7, also combin-ing HST/ACS with Spitzer datapoints. These authors find significantly highermasses (109− 1010M�) and ages in the range from 5 to 100 Myr for instan-taneous burst models, with ages pushed as high as 700 Myr when continuousstar formation is allowed. It should be noted that some of these ages are sig-nificantly greater than the limits at which an emission line spectrum could beexpected (see Sections 2.1 and 2.2). Clearly very young stellar populationsmust be present in these objects. Details of the star formation history are veryhard to constrain and what is really being determined is a luminosity-weightedaverage age.
The effect of dust at high-z has also been examined by some of these authorswith signs of modest extinction being the norm, rather than the exception,despite the dust sensitivity of Lyα . Typical V -band extinction (AV ) has beenfound to be 0.1 (Gawiser et al. 2006), 0.26 (Nilsson et al. 2007). Curiously,the highest-redshift object studied in this manner is a z ∼ 6.96 lensed objectof Hu et al. (2002), which shows AV higher than those quoted above, with avalue of between 0.5 and 1.8 at the 1σ level (Schaerer & Pelló 2005; Charyet al. 2005).
The examples outlined above give the best insights available into the prop-erties of the LAEs, but are difficult to understand in a coherent manner. Differ-ing redshifts have been targeted and differences in halo-mass and other evolu-tionary effects may well enter. The relative selection functions, depths of theobservations, and stacking may introduce further biases. Equally detrimental

18 High-redshift Lyman-alpha Surveys
is the approach to SED fitting with many parameters, often with degenerateeffects, being fit to few data-points that may be contaminated with previousgenerations of stars and strong emission lines. If population III objects wereto enter the samples, then a revision of the methodology would be required:models would be largely inequipped, with stellar libraries not suited to thevery massive stars, nebular gas continuum may be greatly enhanced, emissionlines may dominate certain bandpasses, and the IMF is so uncertain it wouldmost likely need to be a free parameter.
3.3.2 Primeval stars and population III?As discussed in Section 2.2, the observables of population III objects havebeen predicted, as primeval conditions manifest themselves in the formationof very hot stars and a modification of the IMF. Primary signatures includea high Lyα equivalent width, and the presence of the HeIIλ1640Å emissionline. Naturally, if such objects are to be found at all, it will most likely be atthe highest redshifts. Interestingly, several of the high-z teams have reportedevidence of high restframe WLyα . Shimasaku et al. (2006) found a medianWLyα of 233Å for 28 narrow-band selected and spectroscopically confirmedLAEs at z ∼ 5.7, tantalisingly close the theoretical maximum of 240Å esti-mated by Charlot & Fall (1993) or at normal metallicity by Schaerer (2003).From estimates of absorption by the IGM (Section 2.3), they estimate thatsome 30–40% of their targets could contain a population III contribution, al-though within their detection limit, no sign of the HeII line was found. Similarhigh-WLyα results have been found between z = 6 and 6.5, again with the non-detection of HeII (Nagao et al. 2005, 2007).
The LALA group have published a sample of 150 LAEs at z ∼ 4.5 withstartlingly high photometric equivalent widths: 60% of their narrow-bandcatalogue exhibited restframe WLyα in excess of 240Å (Malhotra & Rhoads2002). Modelling of this population lead them to conclude that either a veryflat IMF (α = −0.5 instead of −2.35), zero metallicity stars, or narrowline AGN must be responsible. The AGN possibility was quickly ruled outby X-ray non-detections of all of the candidates with the Chandra satellite(Wang et al. 2004) and Jimenez & Haiman (2006) also postulate a populationIII like environment to explain this (and other) result(s). The star formingnature of the objects was further backed up by spectroscopic studies (Dawsonet al. 2004) who found narrow natural line widths < 500km s−1 and notrace of high ionisation state emission lines associated with AGN. 70% ofthe photometric catalogue were confirmed as LAEs but only 3 to 5 of the17 spectroscopically targeted objects showed signs of WLyα greater thanthe theoretical maximum. It is possible that the equivalent widths basedupon image photometry alone are questionable, given that they are sensitiveto the shape of the continuum across the broad-band filter and errors onthe continuum photometry. About half the sample was undetected in the
3.3 Recent results from high-z Lyα 19
broad-band R filter at 2-σ and the equivalent width distribution is likelyto be skewed towards high values, from which the selection function maypreferentially select the more promising (high-WLyα ) targets.
3.3.3 Tests for reionisationAs described in Section 2.4, a number of attempts have been made to estimatethe intrinsic Lyα luminosity function at given redshift. Naturally, the observedluminosity functions can be expected to vary significantly because of transferthrough the IGM (Section 2.3) or internal transport effects (see Chapter 5).The high-z Lyα luminosity function itself is also an extremely demandingquantity to measure, given the distances involved, transport effects, and thefact that the bulk of the galaxy population will be concentrated at the faintend. Nevertheless, the rewards of measuring the Lyα luminosity function arerich given that, evolution in the LF will either reflect evolution in the galaxypopulation or the ionisation fraction of the IGM, depending upon which isbetter constrained. The approach is either to compare observed LFs directlywith theoretical ones, with one another at different z.
For example, Ouchi et al. (2003) compared luminosity functions of Lyα-selected galaxies and found little evolution between z = 3 and z = 4.8 in eitherLyα itself or continuum. While galaxy evolution can clearly enter, if the LFwere a function of the ionisation fraction only, this would be expected sincethere is little evidence of a neutral IGM at these redshifts. Similar results (i.e.little evolution in the LF of LAEs) have been published by van Breukelenet al. (2005) between z = 2.3 and 4.6 based on Integral Field Spectroscopy,although their sample is small. Shimasaku et al. (2006) compare their ownderived LF at z = 5.7 with that of Dawson (2005) at z = 4.5 finding that whiletheir LF is higher, the two are consistent within the 1σ error-bars, and rule outdrastic evolution.
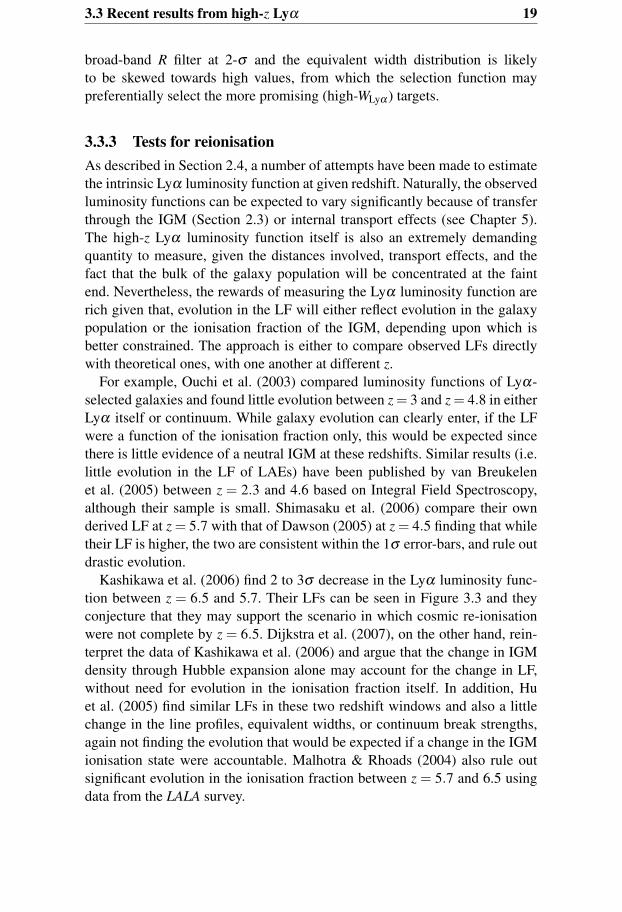
Kashikawa et al. (2006) find 2 to 3σ decrease in the Lyα luminosity func-tion between z = 6.5 and 5.7. Their LFs can be seen in Figure 3.3 and theyconjecture that they may support the scenario in which cosmic re-ionisationwere not complete by z = 6.5. Dijkstra et al. (2007), on the other hand, rein-terpret the data of Kashikawa et al. (2006) and argue that the change in IGMdensity through Hubble expansion alone may account for the change in LF,without need for evolution in the ionisation fraction itself. In addition, Huet al. (2005) find similar LFs in these two redshift windows and also a littlechange in the line profiles, equivalent widths, or continuum break strengths,again not finding the evolution that would be expected if a change in the IGMionisation state were accountable. Malhotra & Rhoads (2004) also rule outsignificant evolution in the ionisation fraction between z = 5.7 and 6.5 usingdata from the LALA survey.
20 High-redshift Lyman-alpha Surveys
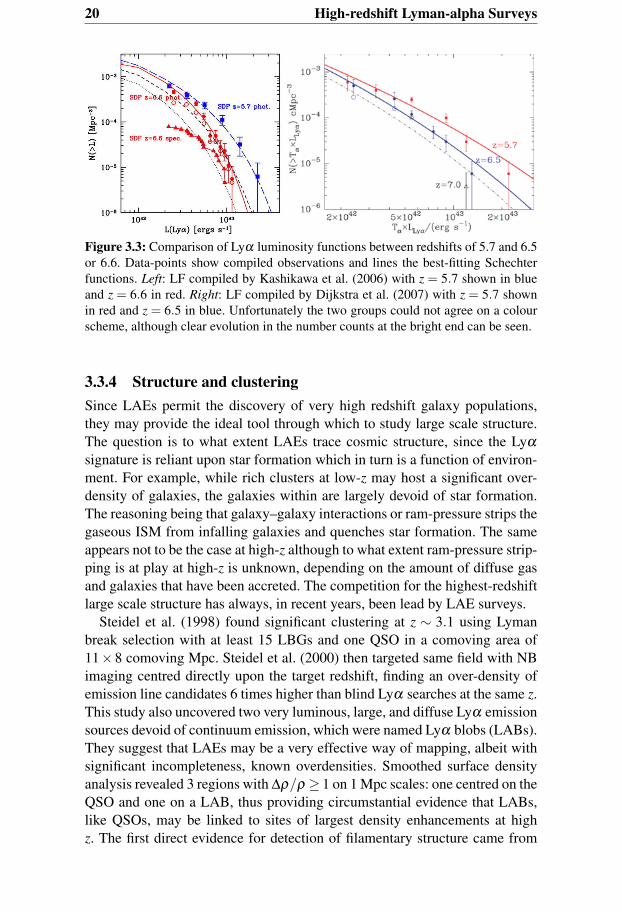
Figure 3.3: Comparison of Lyα luminosity functions between redshifts of 5.7 and 6.5or 6.6. Data-points show compiled observations and lines the best-fitting Schechterfunctions. Left: LF compiled by Kashikawa et al. (2006) with z = 5.7 shown in blueand z = 6.6 in red. Right: LF compiled by Dijkstra et al. (2007) with z = 5.7 shownin red and z = 6.5 in blue. Unfortunately the two groups could not agree on a colourscheme, although clear evolution in the number counts at the bright end can be seen.
3.3.4 Structure and clusteringSince LAEs permit the discovery of very high redshift galaxy populations,they may provide the ideal tool through which to study large scale structure.The question is to what extent LAEs trace cosmic structure, since the Lyα
signature is reliant upon star formation which in turn is a function of environ-ment. For example, while rich clusters at low-z may host a significant over-density of galaxies, the galaxies within are largely devoid of star formation.The reasoning being that galaxy–galaxy interactions or ram-pressure strips thegaseous ISM from infalling galaxies and quenches star formation. The sameappears not to be the case at high-z although to what extent ram-pressure strip-ping is at play at high-z is unknown, depending on the amount of diffuse gasand galaxies that have been accreted. The competition for the highest-redshiftlarge scale structure has always, in recent years, been lead by LAE surveys.
Steidel et al. (1998) found significant clustering at z ∼ 3.1 using Lymanbreak selection with at least 15 LBGs and one QSO in a comoving area of11×8 comoving Mpc. Steidel et al. (2000) then targeted same field with NBimaging centred directly upon the target redshift, finding an over-density ofemission line candidates 6 times higher than blind Lyα searches at the same z.This study also uncovered two very luminous, large, and diffuse Lyα emissionsources devoid of continuum emission, which were named Lyα blobs (LABs).They suggest that LAEs may be a very effective way of mapping, albeit withsignificant incompleteness, known overdensities. Smoothed surface densityanalysis revealed 3 regions with ∆ρ/ρ ≥ 1 on 1 Mpc scales: one centred on theQSO and one on a LAB, thus providing circumstantial evidence that LABs,like QSOs, may be linked to sites of largest density enhancements at highz. The first direct evidence for detection of filamentary structure came from

3.3 Recent results from high-z Lyα 21
Møller & Fynbo (2001), spectroscopically targeting 7 narrow-band detectedLAEs and one Lyα absorber found in a QSO field at z = 3.1 (Fynbo et al.2000).
Hayashino et al. (2004) performed narrow-band imaging centred on samefield as Steidel et al. (2000) but with a much larger FoV. 283 LAEs wereuncovered tracing a strongly non-uniform ‘belt-like’ structure of over 60 co-moving Mpc. 49 strong Lyα absorbing systems were also found in the study,tracing a very similar distribution on the sky. The same region was targetedfor spectroscopy by Matsuda et al. (2005) to map the 3-D structure of of thebelt-like feature. At least three physical filaments were found to be connected,with the two LABs found to be located near the intersection of these filaments.Again, implying massive galaxy formation occurs preferentially in regions ofsignificant overdensity.
Further studies have been made of fields surrounding luminous radio galax-ies by Venemans et al. (2002): narrow-band imaging and spectroscopy of az = 4.1 field found 20 LAEs within 1.3 Mpc of the radio source, implyingoverdensity by factor of 15 compared with z ∼ 4.1 field sources. The radiogalaxy itself was also found to exhibit a large symmetric Lyα halo. Their ini-tial conclusions included the statement of intent: radio galaxies should provideexcellent tracers of galaxy overdensity that could be further mapped by Lyα .The study was extended in just that way with similar results at z = 5.2 (Vene-mans et al. 2004). A systematic survey of 8 bright radio sources between z = 2and 5.2 revealed LAE overdensities of factors between 3 and 5 compared withthe field in at least 6 of the 8 cases (Venemans et al. 2007).
Ouchi et al. (2003), working on a sample of 87 LAEs in the SUBARU deepfield at z ≈ 4.86 found clear signatures of clustering on large (∼ 20 Mpc)scales, and indications that LAEs are typically more strongly clustered thanLBGs at similar z. After dividing the sample into two groups based on Lyα
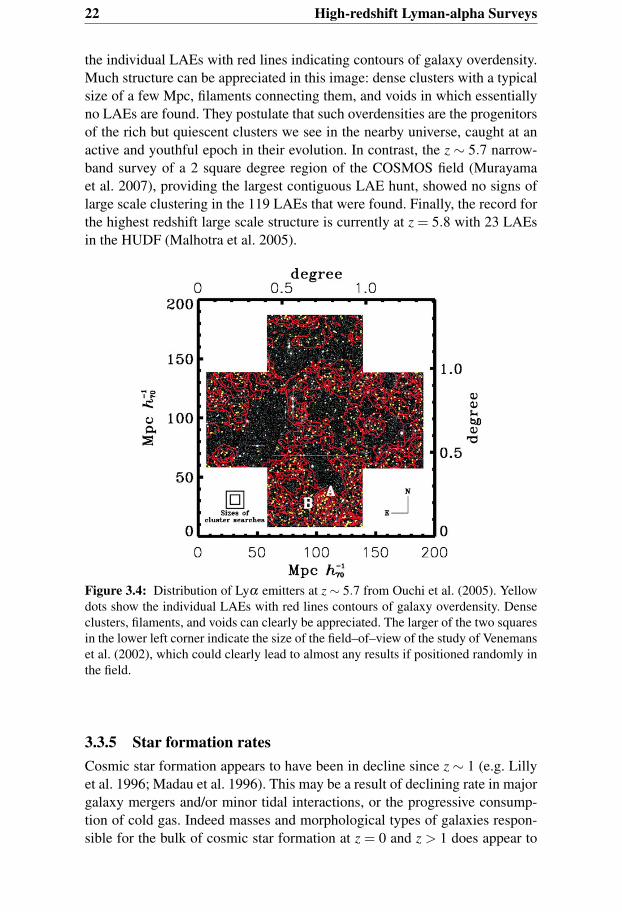
flux, equivalent width, and UV luminosity, they found that the brighter groupin Lyα flux to be more clustered than the faint, although no such dependencewas seen in WLyα or continuum. This was used to motivate the claim that thebrighter LAEs were more biased against the underlying dark matter halo dis-tribution than the bright continuum sources. Shimasaku et al. (2003), usingthe newly commissioned Suprime-Cam mounted on the SUBARU telescopesurveyed the same field at z = 4.86 finding 43 LAE candidates clustered in anelongated region of 50×20 Mpc, with higher surface overdensity by factor of2, which may be the progenitor of a cluster. Further studies of the same field,this time at z = 4.79 (Shimasaku et al. 2004), revealed a quite different dis-tribution with clustering weak on all scales and no large-scale high-contraststructure. Ouchi et al. (2005) also found strong evidence for clustering andfilamentary structure at z = 5.7 as shown in Figure 3.4. This image shows thehuge 1 square degree field–of–view of Suprime-Cam and also that of the cam-eras used by Venemans et al. (2002), clearly demonstrating the need to sam-ple large patches of sky in order to avoid cosmic variance. Yellow dots show
22 High-redshift Lyman-alpha Surveys
the individual LAEs with red lines indicating contours of galaxy overdensity.Much structure can be appreciated in this image: dense clusters with a typicalsize of a few Mpc, filaments connecting them, and voids in which essentiallyno LAEs are found. They postulate that such overdensities are the progenitorsof the rich but quiescent clusters we see in the nearby universe, caught at anactive and youthful epoch in their evolution. In contrast, the z ∼ 5.7 narrow-band survey of a 2 square degree region of the COSMOS field (Murayamaet al. 2007), providing the largest contiguous LAE hunt, showed no signs oflarge scale clustering in the 119 LAEs that were found. Finally, the record forthe highest redshift large scale structure is currently at z = 5.8 with 23 LAEsin the HUDF (Malhotra et al. 2005).
Figure 3.4: Distribution of Lyα emitters at z∼ 5.7 from Ouchi et al. (2005). Yellowdots show the individual LAEs with red lines contours of galaxy overdensity. Denseclusters, filaments, and voids can clearly be appreciated. The larger of the two squaresin the lower left corner indicate the size of the field–of–view of the study of Venemanset al. (2002), which could clearly lead to almost any results if positioned randomly inthe field.
3.3.5 Star formation ratesCosmic star formation appears to have been in decline since z ∼ 1 (e.g. Lillyet al. 1996; Madau et al. 1996). This may be a result of declining rate in majorgalaxy mergers and/or minor tidal interactions, or the progressive consump-tion of cold gas. Indeed masses and morphological types of galaxies respon-sible for the bulk of cosmic star formation at z = 0 and z > 1 does appear to

3.3 Recent results from high-z Lyα 23
be in evolution. Beyond z = 1− 2 the star formation rate density appears toflatten or turn over, although the absolute values of the curve at high-z is noto-riously difficult to measure: surveys become incomplete, morphological typesmore difficult to measure and merger signatures more difficult to detect, andperhaps most importantly dust extinction correction becomes more difficult.
Since Lyα surveys directly trace the star forming galaxy population, Lyα-derived star formation rates, Lyα may prove a useful tool through which toconstrain high-z star formation. Indeed most survey groups have measuredSFR(Lyα) within their samples although again, results are mixed and differ-ential comparison difficult to make. Between z = 3.1 and 3.5, Cowie & Hu(1998), Kudritzki et al. (2000), van Breukelen et al. (2005), and Nilsson et al.(2007) all find SFRD(Lyα) to be consistent with continuum-based estimatesat the same redshift. On the other hand, some surveys demonstrate systematicunderestimates of SFR(Lyα) in individual galaxies, often of around a fac-tor of three compared to estimates from FUV continuum (Ajiki et al. 2003;Taniguchi et al. 2005; Gronwall et al. 2007). Dust is often called upon to ex-plain the offset although FUV estimates are equally likely to be affected bydust. Differential extinction (i.e. stronger attenuation on nebular emission thanon stellar continuum Calzetti et al. 2000) may be further invoked although stillfails to reconcile the numbers in most of the above cases. Furthermore, Fujitaet al. (2003), Ajiki et al. (2003), Rhoads et al. (2003), and Kodaira et al. (2003)all find estimates of the star-formation rate density offset by an order of mag-nitude compared continuum-based estimates between z = 3 and 6.5. If thesesamples are comparable those outlined above where Lyα typically underesti-mates individual SFRs by a factor of 3, this would indicate that only around1 in 3 star forming galaxies shows Lyα in emission at all. Indeed, this is seenfor continuum selected galaxies at z ∼ 3, where for a spectroscopic sampleof around 800 Lyman break galaxies, Shapley et al. (2003) found a medianWLyα of ∼ 0Å and predicted that only 1/4 of the sample would be selected bynarrow-band Lyα surveys. How this fraction varies towards fainter continuumlevels, and for Lyα-selected samples is unknown.

25
4 Lyman-alpha observations in thenearby universe
Nearby systems are impossible to observe at the wavelength of Lyα fromthe ground. Even from space, objects must still lie at sufficient redshift (al-though far from cosmological) to prevent the line from being absorbed bythe HI in the Milky Way, and to prevent contamination by Lyα emissionfrom the Earth’s geocorona. The first instrument capable of observations inthe far ultraviolet was an aperture spectrograph, the International UltravioletExplorer (IUE) which proved invaluable for studies of both starburst galax-ies and massive stars. Later, several FUV-capable instruments onboard HSTbecame available: the aperture spectrograph Goddard High Resolution Spec-trograph (GHRS), the slit spectrograph and imager Space Telescope ImagingSpectrograph (STIS), and the Advanced Camera for Surveys, capable of bothimaging and slitless spectroscopy.
4.1 Early studies with the IUETargeting known star-forming galaxies, early results from the IUE seemedto parallel the first results of the high-z teams (Section 3.2): Lyα was infre-quently observed in emission from local young starbursts, even from manyknown dust- and metal-poor objects. Meier & Terlevich (1981) observed threeUV-bright, blue compact star forming galaxies, detecting Lyα at > 1σ inemission from only one, the lowest metallicity object. Hartmann et al. (1984)conducted a very similar study of 3 HII galaxies detecting weak Lyα emis-sion from two. One of the main conclusions of this article was that Lyα couldnot be used as a tracer of primeval galaxies at high-z. Hartmann et al. (1988)observed 5 more UV-bright galaxies finding Lyα absorption in 2 and Lyα inemission, but far below the recombination value, in the remainder. Compilingresults from previous IUE studies, they found evidence for the relationship be-tween Lyα and metallicity that would be expected if dust and metallicity weredirectly correlated, and re-stated their scepticism about the power of Lyα athigh-z. Similar results were reported by Terlevich et al. (1993) and Charlot& Fall (1993), who presented the Lyα vs. metallicity relationship shown inFigure 4.1. Clearly from this Figure, an anti-correlation is present betweenWLyα and metallicity, and Charlot & Fall (1993) suggested that in cases whereLyα was weak or absent, the inferred dust abundances would be sufficient to

26 Lyman-alpha observations in the nearby universe
remove the line. The equivalent width, however, is independent of reddeningand for this to be the case Lyα photons must be selectively attenuated withrespect to the continuum.
Figure 4.1: Left: Lyα equivalent width from IUE catalogues vs. metallicity [O/H]from Charlot & Fall (1993). A clear anticorrelation is visible between the two ob-served quantities, with stronger Lyα emitters found to have lower metallicity. Right:Plot from Giavalisco et al. (1996) showing the reddening corrected Lyα/Hβ ratio vs.metallicity. The dashed line shows the line ratio predicted from case B recombination.While three galaxies fall close to the recombination value, the bulk of the selectedobjects fall significantly below, indicating that pure attenuation by dust is not the mainculprit behind the low Lyα fluxes observed from known starbursts.
Numerous archival IUE observations of low-Z starbursts were compiled fora more statistically significant analysis by Giavalisco et al. (1996) comparingLyα flux and equivalent widths to various properties of the hosts. Using bothBalmer decrement and UV continuum slope methods, Lyα emission fluxeswere corrected for absorption by dust. Figure 4.1 also shows the extinctioncorrected Lyα/Hβ ratio, and in all galaxies, Lyα/Hβ was found to be lowerthan its recombination value (horizontal line). These results suggest that thevisibility of the Lyα line is not primarily regulated by dust, and Giavaliscoet al. (1996) suggested that ISM geometry may be the main driver.
4.2 Spectroscopic studies with HSTCameras mounted on HST offered significant improvements over IUE interms of both spatial and spectral resolution. The WLyα vs. metallicityanti-correlation of Charlot & Fall (1993) suggested that the ideal objectsfrom which to observe Lyα emission would be the most metal- and dust-poorgalaxies known: the now famous IZw 18 (Z = Z�/50), and SBS 0335-052(Z = Z�/42). Lying below the lower limit of the abscissa in left panel of

4.2 Spectroscopic studies with HST 27
Figure 4.1, the greatly sub-solar metallicities of these objects would suggestthat large emission Lyα equivalent widths would be expected.
Perhaps the most startling result from this new generation of high-resolutionspectroscopic observations is that both of these objects were found to be Lyα
absorbers (Kunth et al. 1994; Thuan & Izotov 1997, Figure 4.2). The ab-
Figure 4.2: Damped Lyα absorbers from HST/GHRS and STIS Left: IZw 18 (Kunthet al. 1994), Right: SBS 0335-052 (Thuan & Izotov 1997). Damped Lyα absorptionprofiles are visible in both cases despite the fact that they are the most metal-poorgalaxies known to date.
sorption in both these cases is clearly damped with equivalent widths around-50Å, significantly at odds with the predictions of Charlot & Fall (1993). Incontrast, Lequeux et al. (1995) found bright Lyα emission from Haro 2, agalaxy an order of magnitude more dust- and metal-rich.
Further observations with the GHRS expanded upon these case studies.Kunth et al. (1998) observed a further seven local star forming galaxies inthe FUV, selecting a range of targets including known Lyα absorbers andemitters. Of the eight active starbursts included, four showed Lyα features inemission while the remaining four exhibited a damped absorption profile. Thespectra were of sufficient resolution and S/N to clearly resolve the low ionisa-tion state (LIS) metal absorption features of [OI]λ1302Å and [SiII]λ1304Å inthe neutral ISM for all objects. Observed spectra of the Lyα emitting galaxiesare shown in Figure 4.3. For the absorbers, the LIS features fell at almost pre-cisely the wavelength that would be expected from the systemic redshift of thetargets, implying that the neutral ISM is static with respect to the stars. TheLyα absorption feature too was largely symmetric around restframe 1216Å.For the Lyα emitting objects the situation was found to be very different withLIS absorption features clearly blueshifted with respect the systemic velocity.This implies outflows in the neutral ISM with velocities of between 200 and300 km s−1. Lyα emission features were found to be clearly redshifted withrespect to the systemic velocity, and showed Lyα blue-side absorption fea-tures, similar to classic P-Cygni profiles. In fact, estimates of the HI columndensity derived from Voigt profile fitting to the absorption profile suggestedin all cases that a static neutral medium would not have permitted the transfer

28 Lyman-alpha observations in the nearby universe
Figure 4.3: HST/GHRS spectra of the Lyα emitting starbursts from the Kunth et al.(1998) sample. Left: UV spectra of around the LIS interstellar absorption features.Vertical lines show the zero-velocity wavelengths of the features as predicted from thesystemic redshift. Absorption lines are clearly blueshifted indicating an outflow in theneutral ISM. Right: Spectra of the same targets around Lyα . Asymmetric and P-Cygnilike profiles are clearly visible as a result of the outflow. Voigt profiles are fitted to thewings of the absorption profiles.
of Lyα . This has quite profound implications for Lyα escape physics, sug-gesting that an outflowing medium may be a requirement. The outflows in theneutral medium allow the Lyα photons in the red wing of the line to avoid res-onant trapping, since the neutral medium only sees photons in the blue side ofthe emission profile at restframe 1216Å. This phenomenon, with very similarrelative velocities between the Lyα peak, and stellar and interstellar absorp-tion features has also been observed in Lyman Break Galaxies (Shapley et al.2003). To date, only one local Lyα emitting starburst observed with sufficientspectral resolution does not show a P Cygni profile: Tol 1214-277 (Z∼ Z�/23,Thuan & Izotov 1997), which shows a symmetric emission profile with nosign of blueshifted absorption.
The effect of mechanical feedback on the Lyα line profile has been mod-eled by Tenorio-Tagle et al. (1999) using hydrodynamic simulations, whichallowed Mas-Hesse et al. (2003) to interpret the variety of Lyα profiles seen inthe GHRS and STIS samples as part of an evolutionary sequence (Figure 4.4).Schematically the model begins with a central dense, static star forming re-gion embedded in a low density HI halo. At the ignition of the starburst theLyα profile will be one of pure absorption, as the surrounding HI mediumis static. This is likely to be the explanation behind the damped profiles seen

4.2 Spectroscopic studies with HST 29
Figure 4.4: Hydrodynamicevolutionary models ofTenorio-Tagle et al. (1999)showing the predicted Lyα
line profile as a functionof evolutionary state of thestarburst. Times are (a):≤ 1.5 Myr, (b): ∼ 2.5 Myr,(c): ∼ 4 Myr, (d): ∼ 5 Myr,(e): ∼ 6 Myr (f): > 8 Myr.Insets show a schematic ofthe Lyα line profile evolvingfrom damped absorption,through a symmetric emis-sion phase, the developmentof a secondary blueshiftedcomponent, through a P-Cygni phase, and back toabsorption.
in IZw 18 and SBS 0335-052. Shortly afterwards, the combined mechanicalfeedback from massive young stars and core-collapse SNe blow the remain-der of the high-density medium into the halo in the form of a rapidly outflow-ing shell. At times around 2 Myr this shell become Rayleigh-Taylor unstableand breaks up, allowing ionising photons to stream into the halo resulting ina conical ionised structure. This allows Lyα photons to leave the galaxy un-hindered through the ionised cone, resulting in a symmetric emission profilefor observers looking into the cone (Tol 1214-277). After blowout the ionisedlow density medium is swept up by the original adiabatic shock, the shockitself becomes radiative as the ionised material recombines, resulting in anadditional Lyα emission component blueshifted by the expansion velocity attimes around 3 Myr (IRAS 08339+65; Figure 4.3). Recombination in the shellprevents further ionising continuum leaking into the halo as (i) more materialis swept up, (ii) growth of the shell results in fewer photons arriving per unitarea, and (iii) the number of ionising photons produced by the starburst de-cays rapidly after∼ 3.5 Myr. The newly formed neutral layer becomes able totrap Lyα photons in the blue wing of the emission profile, and the emergentLyα profile becomes P-Cygni (Haro 2; Figure 4.3). With further evolution, theshell completely recombines and slows with the blue-side absorption profilebecoming increasingly significant, eventually leading to a static absorptionprofile at times greater than around 8 Myr. The exact timescales involved aredependent upon the central density and star formation rate, and halo density.

30 Lyman-alpha observations in the nearby universe
4.3 Imaging studies with HSTSpectroscopic studies of the line profile provide much-needed informationabout the kinematics of the neutral medium. However, targeted UV spec-troscopy does not permit the estimation of global quantities which would beneeded in order to interpret the high-z survey data. In addition, Lyα reso-nantly scatters and some, perhaps the majority, of the Lyα photons may dif-fuse through the galaxy and escape from regions far from their productionsites. Spectroscopic observations usually target the brightest points in the con-tinuum and a large fraction of the global flux may be lost outside the apertureor slit. Thus imaging becomes an invaluable complement to spectroscopy be-cause the whole of the galaxy can be observed in a single observation, albeitwith no kinematic information. While technically possible with the Wide Fieldand Planetary Camera 2 (WFPC2) on HST, poor system efficiency essentiallyprecluded such imaging studies.
Using the Solar Blind Channel (SBC) of the Advanced Camera for Surveys(ACS) Kunth et al. (2003) imaged six local star-forming galaxies in Lyα andFUV continuum, selecting known Lyα emitters and absorbers, and a range ofmetallicities, dust contents and luminosities. Results for two targets, one emit-ter and one absorber, were initially published although technical difficultiesrelating to the continuum subtraction prevented a detailed photometric anal-ysis. However, no matter what methods they used to subtract the continuum,certain features still remained. Lyα morphologies were found to be complex,and largely unrelated to the morphology seen in the FUV continuum or Hα .Little or no sign of Lyα emission was seen in the more metal-deficient target(SBS 0335-052), in agreement with the spectroscopic observations of Thuan& Izotov (1997). The other target (ESO 350-IG38) showed signs of both emis-sion and absorption from young star forming knots, with the brightest emis-sion coming from a knot significantly duster than other regions showing onlyLyα absorption. The data were again suggestive that Lyα is predominantlyregulated by ISM kinematics rather than simply the dust content.
While not an HST observation, Cannon et al. (2004) observed two differentLyα emitting targets in the Kunth et al. (2003) sample with the Very LargeArray (VLA) with the intent to probe neutral hydrogen directly. Both targetswere Lyα emitters but the HI covering would have suggested otherwise: theneutral column density in front of both targets showed only small velocitygradients and was found to be too high to permit the escape of Lyα photons.However, the spatial resolution of those observations was not comparable tothat of HST and could not reject the hypothesis that ionised holes exist in theHI medium through which Lyα could escape.

31
5 Lyman-alpha radiative transport
Numerous studies, both analytical and numerical have addressed the problemof radiation transport of resonant lines, explicitly considering Lyα . The sci-ence driver behind such studies is, naturally, the cosmological importance ofLyα emitters. Lyα-based estimates of individual star-formation rates are typ-ically lower than those based on UV continuum (Section 3.3.5) implying thatnot all the photons being produced escape; and cosmic star formation rate den-sities are often lower by larger factors when probed by Lyα , indicating thatnot all star-forming galaxies show Lyα in emission. This in turn affects thederived Lyα luminosity functions and re-ionisation estimates (Section 3.3.3)and biases estimates of clustering properties still further (Section 3.3.4). Whencoupled with results from the low-z observational studies (Chapter 4), it is ob-vious that a better understanding of the processes that regulate Lyα emissionis required in order to interpret the high-z claims.
Again as previously discussed, Lyα is particularly sensitive to attenuationby dust. The situation becomes vastly more complex with the considerationof resonance scattering when Lyα photons do not travel along straight pathsthrough the ISM. Adopting the standard mathematical formulation with thephoton frequency x presented as the deviation from line centre in units of theDoppler width ( ν−ν0
∆νD), the optical depth of a photon with frequency x travelling
a distance s is given by Equation 5.1, taken from Verhamme et al. (2006).
τx(s) = 1.041×10⁻¹³T−1/24 nH
H(x,a)√π
(5.1)
where T4 is the temperature in units of 104K, and H(a,x) is the Hjerting func-tion that describes the Voigt profile (i.e. both a Doppler core and Lorentziandamping wings). From simple considerations it can be seen that at line centre,Lyα becomes optically thick at column densities around 1013 cm−2, aroundsix orders of magnitude below the typical column densities of the Milky WayHI halo, even at high or low Galactic latitude. Unless the path between thephoton production sites and the IGM were completely ionised, there wouldbe no chance of Lyα photons escaping with line-centre frequencies. Superfi-cially, two mechanisms exist through which Lyα photons could escape from astatic medium. Firstly, they could repeatedly scatter in the line core and diffuseuntil they reach the edge of the HI medium, from where a symmetric emissionprofile would be observed, centred on restframe 1216Å. Alternatively, theycould scatter into wings of the line profile where the optical depth is much

32 Lyman-alpha radiative transport
lower and escape more or less directly. Since in this case there would be es-sentially no transport at line centre, double peaked profiles would be observedwhere only photons that have scattered into the line wings could escape.
Since scattering clearly dominates the transfer, the kinematic structure ofthe neutral medium becomes a vital parameter in the escape physics (as dis-cussed from an observational perspective by Kunth et al. 1998), along with thegeometry and ionisation structure of the ISM. If Lyα photons are scatteringand thereby travelling significantly extended path lengths, the probability ofdust absorption is hugely increased. Thus not only does the dust abundance en-ter the problem, but also its distribution with respect to the scattering medium.None of these parameters are necessarily independent and are coupled withthe star formation process itself. In addition to scattering and dust, Lyα mayin theory pump coincident Lyman bands lines in H2 leading to losses throughultraviolet fluorescence (Shull 1978; Black & van Dishoeck 1987), or be col-lisionally drained by electron scatterings leading to decay via the two-photonchannel (Osterbrock 1962).
5.1 Early analytical studiesBy way of a summary of the earliest work, Osterbrock (1962) assumed coher-ent Lyα scattering in HI and applied an analytic diffusive approximation tosolve the transport equation. Considering complete redistribution within theDoppler core, in which the mean number of scatterings required for escape< N > grows ∝ τ2
0 , he computed that on average, a given Lyα photon wouldundergo 1010− 1012 core scatterings before escape from the densest astro-physical media. Adams (1972), modifying a classical numerical method ofsolving the transfer equation (Feautrier 1964), saw that the overall line trans-fer is dominated not by scatterings in the Doppler core but by relatively fewerexcursions into the wings of the redistribution function at high nHI. In thisregime the mean number of scatterings becomes ∝ τ0 and Adams introducedthe concept of the resonance lines escaping the medium in the ‘single longestexcursion’ in frequency space away from line centre. The actual excursion infrequency required for significant transport depends on the optical depth ofthe medium, and defines the separation of the double peaks in the emergentprofile. The technique was later extended by Hummer & Kunasz (1980) whoincluded the effects of some absorbing material, e.g. dust.
Neufeld & McKee (1988) have also showed that just like charged particles,Lyα photons could repeatedly scatter across shock fronts, in a manner anal-ogous to the first order Fermi acceleration believed to be responsible for theacceleration of lower energy cosmic rays. This would result in a systematicblueshift of the photons, and these authors first attributed the apparent blue-asymmetric line profiles observed in the handful of high-z detections to thisprocess.

5.2 The modern computational approach 33
The analytical, diffusive approach was developed by Neufeld (1990) whoapplied the results of his study directly to astrophysical H Lyα and He+ Lyα .Neufeld derived expressions for the line intensity within static, opaque, non-absorbing, plane-parallel slab, generalising the expressions to include the ef-fects of absorption by nearby line modes or a source of continuum opacity. Asa function of optical depth within the slab, the evolution of the line profile, themean number of scatterings to escape, and the mean path length before ab-sorption or escape were all examined, showing excellent agreement with theresults of Hummer & Kunasz (1980).
Neufeld (1991) considered the separation of the neutral and ionised ISMcomponents. For this study, the ISM configuration was assumed to take theform of a hot, low-density inter-cloud medium (ICM), in which clouds ofneutral material were embedded. Such an ICM has been observed in the MilkyWay as the ‘hot ionised medium’ (Cox & Smith 1974) and has been proposedas a component of the ISM in high-z galaxies by Rees (1989) and within col-lapsing protogalaxies Fall & Rees (1985). Assuming the ‘percolated’ ISMmodel in which every part of the hot ionised medium is in contact, and thatLyα photons are produced in HII regions in the ICM, it was shown that scat-tering at cloud surfaces could prevent Lyα photons from penetrating far intothe dense HI clouds. An illustration from Neufeld (1991) can be seen in Fig-ure 5.1. Independent of cloud size or optical depth, the medium could be ef-fectively thin to Lyα photons and, even though the total HI covering factormay greater than 1, the effective optical depth could be less than the totalline-of-sight optical depth. This leads to the possibility that the Lyα escapefraction could be significantly greater than that of nearby continuum photonsof energies where the scattering coefficient is small. In contrast to the homo-geneous medium (in which HI and dust conspire to preferentially remove Lyα
relative to continuum), in the multiphase medium dust and resonant scatteringmay actually enhance the emergent equivalent width.
5.2 The modern computational approachAnalytical studies have proved informative in the analysis of Lyα transport butso many parameters enter the problem (most notably geometry and ionisationstructure) that it is very difficult to apply them to real systems. In this sense,a numerical examination of the problem becomes a requirement, since morecomplex systems can be explored case by case, albeit with a lack of generality.
Monte-Carlo radiative transfer codes have been developed by a numberof groups enabling detailed modeling of emergent line profiles (Ahn et al.2001; Dijkstra et al. 2006a,b; Verhamme et al. 2006), and in some cases im-age morphologies (Laursen & Sommer-Larsen 2007). Figure 5.2 from Ver-hamme et al. (2006) shows emergent line profiles in the simple case of amonochromatic Lyα sources embedded in a static HI medium. Successive

34 Lyman-alpha radiative transport
Figure 5.1: Lyα scattering in a percolated medium from Neufeld (1991). HI cloudscontaining dust are embedded in an ionised medium. Resonant Lyα scattering causesphotons to be reflected from cloud surfaces and remain in the ionised medium, avoid-ing resonant trapping and attenuation by dust. Continuum photons, on the other hand,must penetrate the dense clouds where they undergo attenuation.
increases in the optical depth move the line profiles further apart as line trans-fer requires longer excursions into the wings. Recent high-resolution spectraobtained from high-z objects have reached sufficient depths to observe thedouble peaked profile (e.g. Venemans et al. 2005; Shapley et al. 2006) andspectra have been modeled (Tapken et al. 2007). However, observationallysuch profiles are in the minority, with the bulk of observed spectra showingeither single asymmetric or P Cygni morphologies.
In order to model real life situations, it is necessary to include at least thekinematic structure of the medium and dust. In the simplest cases, the twoparameters have competing effects: adding more dust to the neutral mediumsuppresses the double peaked line profile, resulting in pure or partial absorp-tion when continuum photons are included; while large-scale kinematic struc-ture (outflows or inflows) allows photons to avoid resonant trapping and aidstheir escape. In the case of outflows, this results in a shift in the centre of theabsorption profile towards higher frequency (shorter λ ). In a series of articles,Sang-Hyeon Ahn and collaborators have examined Lyα line formation forvarious starburst configurations using a plane-parallel transfer code. Adoptingthe various starburst evolutionary stages of (Tenorio-Tagle et al. 1999, Sec-tion 4.2), Ahn et al. (2001) examine the line profile in each stage. P Cygniprofiles were found at some stages, but the pure absorption features found byTenorio-Tagle et al. (1999) did not appear due to the absence of dust in theAhn et al. (2001) models.
Outflows lead to reddened peaks in the Lyα profile, shifting the absorptioncentre towards higher frequency. With an ionised bubble surrounded by anexpanding symmetric neutral shell, the situation becomes more complex asbackscatterings from the shell become important. A P Cygni-like profile stillresults but is complemented with additional redshifted peaks that result from
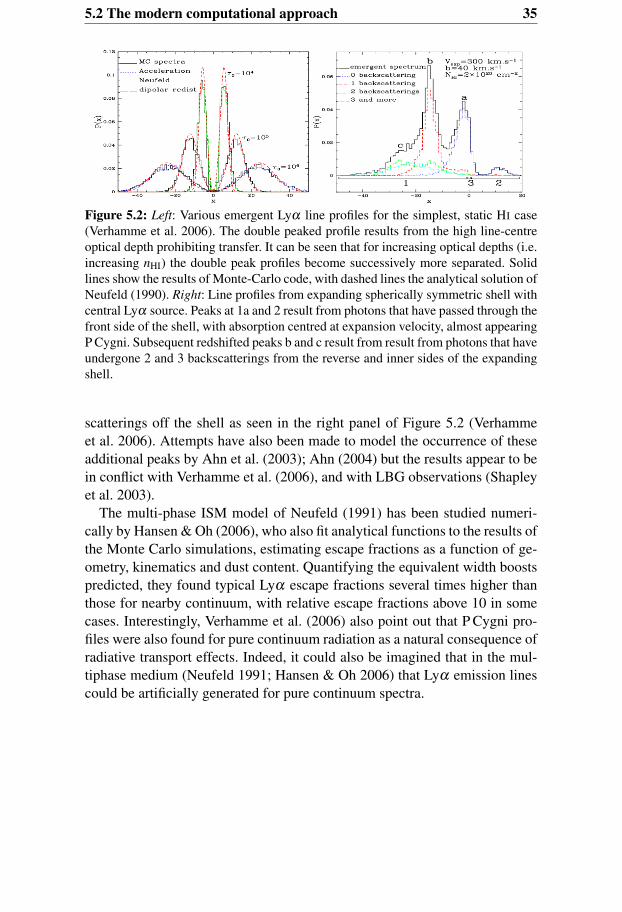
5.2 The modern computational approach 35
Figure 5.2: Left: Various emergent Lyα line profiles for the simplest, static HI case(Verhamme et al. 2006). The double peaked profile results from the high line-centreoptical depth prohibiting transfer. It can be seen that for increasing optical depths (i.e.increasing nHI) the double peak profiles become successively more separated. Solidlines show the results of Monte-Carlo code, with dashed lines the analytical solution ofNeufeld (1990). Right: Line profiles from expanding spherically symmetric shell withcentral Lyα source. Peaks at 1a and 2 result from photons that have passed through thefront side of the shell, with absorption centred at expansion velocity, almost appearingP Cygni. Subsequent redshifted peaks b and c result from result from photons that haveundergone 2 and 3 backscatterings from the reverse and inner sides of the expandingshell.
scatterings off the shell as seen in the right panel of Figure 5.2 (Verhammeet al. 2006). Attempts have also been made to model the occurrence of theseadditional peaks by Ahn et al. (2003); Ahn (2004) but the results appear to bein conflict with Verhamme et al. (2006), and with LBG observations (Shapleyet al. 2003).
The multi-phase ISM model of Neufeld (1991) has been studied numeri-cally by Hansen & Oh (2006), who also fit analytical functions to the results ofthe Monte Carlo simulations, estimating escape fractions as a function of ge-ometry, kinematics and dust content. Quantifying the equivalent width boostspredicted, they found typical Lyα escape fractions several times higher thanthose for nearby continuum, with relative escape fractions above 10 in somecases. Interestingly, Verhamme et al. (2006) also point out that P Cygni pro-files were also found for pure continuum radiation as a natural consequence ofradiative transport effects. Indeed, it could also be imagined that in the mul-tiphase medium (Neufeld 1991; Hansen & Oh 2006) that Lyα emission linescould be artificially generated for pure continuum spectra.


37
6 This thesis: data and methods
The bulk of the research presented here is a continuation of the low-z observa-tional studies, and is mostly concerned with imaging of known star-forminggalaxies in Lyα . Only with high-resolution Lyα observations and support-ing data at other wavelengths can we attain the understanding necessary tointerpret the high-z survey data. It represents an extension of the largely unex-ploited HST imaging study of Kunth et al. (2003). In this Chapter I outline thebasics of the observations that have been obtained and some of the methodsused in the data analysis.
6.1 The imaging study and target selectionSix targets were selected for this study by Daniel Kunth and collaboratorsfor HST General Observer observations during Cycle 11. The aim was notto provide any statistical answers about the processes that regulate the emis-sion of Lyα but to perform a pilot study which could, depending upon re-sults, make the case for a larger future programme. Several key parameterswere identified as regulatory in the visibility of Lyα: dust, HI, morphology,luminosity, and ISM outflows. The observational evidence for dust being themain parameter in the destruction of Lyα is ambiguous. It is possible thatmore luminous galaxies, that tend to be more metal- (and therefore dust-) rich,host more vigorous starbursts. Through a perturbed and unrelaxed ISM, thiscould aid the escape of Lyα photons, thereby (partially, at least), removingthe dust dependence. To address this problem, one very luminous object wasselected: NGC 6090, for which NIR observations with NICMOS already ex-isted in the archive. Evidence exists for the a scaling relation between the Lyα
and the star formation rate: the more luminous the galaxy, the more turbulentthe ISM (Heckman et al. 1998). Thus two bright Lyα emitters were selected:NGC 6090, and Haro 11. The effect of kinematics was addressed by select-ing two galaxies, both Lyα-bright, with very different kinematic informationimprinted on the Lyα profile: Tol 1214-277 showing a clean, symmetric Lyα
line (Thuan & Izotov 1997) and IRAS 08339+65 showing multiple velocitycomponents (Kunth et al. 1998). To address the significance of galaxies withno Lyα detection, two damped Lyα absorbers were selected: the very metal-poor SBS 0335-052 and Tol 65, both from the study of Thuan & Izotov (1997).After acceptance of the proposal, but before observation, Tol 1214-277, wasexchanged for ESO 338-IG04, similar in some respects but with much HST

38 This thesis: data and methods
data already in existence. A summary of the properties of the selected targetscan be seen in Table 1 of Paper V.
6.2 Observations with the Hubble Space TelescopeHigh-resolution (∼ 0.05′′) imaging observations have been obtained at wave-lengths between∼ 1200 and∼ 9000Å. The isolation of the Lyα emission lineis the primary requirement, necessitating observations in a narrow (preferablyas narrow as possible) bandpass centred on, or near to, Lyα . Instruments ca-pable of this include the WFPC2, STIS, and the Solar Blind Channel (SBC)of the ACS. While possible with the WFPC2 the poor sensitivity of the de-tector in the FUV more or less preclude such observations. From ACS/SBCand STIS, the better defined bandpass of the SBC/F122M medium band fil-ter makes it the optimal choice through which to observe Lyα . As well astransmitting the emission line, this filter (and any on-line filter) also transmitsthe underlying continuum, which it is essential to subtract before any kind ofanalysis can be performed. In order to get an estimate of the continuum flux,we use the nearest filter in wavelength that does not transmit Lyα: F140LP,also in ACS/SBC. The Lyα on-line and continuum filter profiles, together witha synthetic galaxy spectrum, can be seen in Figure 6.1.
Figure 6.1: The filter profiles used for the FUV leg of the imaging campaign. The redline shows a synthetic continuum spectrum of a starburst galaxy at z = 0.01 with an ar-tificially applied Lyα emission line. The vertical dot-dashed line shows the rest-framewavelength of Lyα and thereby the wavelength of Lyα produced in the Earth’s geo-corona. Solid black line shows the on-line bandpass for sampling Lyα– note that bothLyα from the target galaxy and geocorona are transmitted by this filter. The dashedblack line shows the filter used to sample the stellar continuum. Note the overall sys-tem throughput is low, just a few % for F122M.
30 HST orbits were awarded during Cycle 11 to obtain images of the sixgalaxies in F122M and F140LP. The goal of these studies was to compare Lyα
maps with various other observables. Naturally this requires more observation.Of particular importance is to be able to map the ionised nebulae in which Lyα
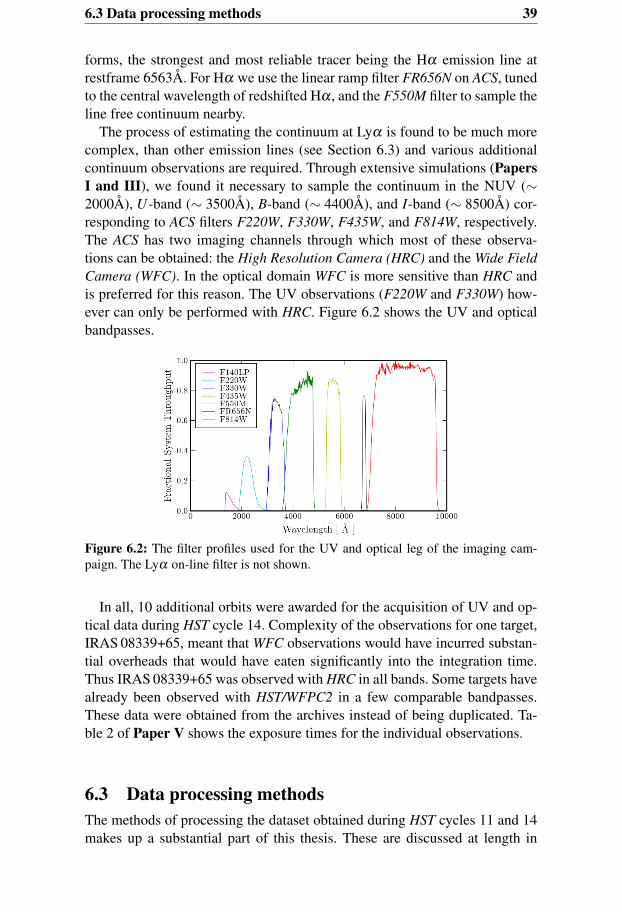
6.3 Data processing methods 39
forms, the strongest and most reliable tracer being the Hα emission line atrestframe 6563Å. For Hα we use the linear ramp filter FR656N on ACS, tunedto the central wavelength of redshifted Hα , and the F550M filter to sample theline free continuum nearby.
The process of estimating the continuum at Lyα is found to be much morecomplex, than other emission lines (see Section 6.3) and various additionalcontinuum observations are required. Through extensive simulations (PapersI and III), we found it necessary to sample the continuum in the NUV (∼2000Å), U-band (∼ 3500Å), B-band (∼ 4400Å), and I-band (∼ 8500Å) cor-responding to ACS filters F220W, F330W, F435W, and F814W, respectively.The ACS has two imaging channels through which most of these observa-tions can be obtained: the High Resolution Camera (HRC) and the Wide FieldCamera (WFC). In the optical domain WFC is more sensitive than HRC andis preferred for this reason. The UV observations (F220W and F330W) how-ever can only be performed with HRC. Figure 6.2 shows the UV and opticalbandpasses.
Figure 6.2: The filter profiles used for the UV and optical leg of the imaging cam-paign. The Lyα on-line filter is not shown.
In all, 10 additional orbits were awarded for the acquisition of UV and op-tical data during HST cycle 14. Complexity of the observations for one target,IRAS 08339+65, meant that WFC observations would have incurred substan-tial overheads that would have eaten significantly into the integration time.Thus IRAS 08339+65 was observed with HRC in all bands. Some targets havealready been observed with HST/WFPC2 in a few comparable bandpasses.These data were obtained from the archives instead of being duplicated. Ta-ble 2 of Paper V shows the exposure times for the individual observations.
6.3 Data processing methodsThe methods of processing the dataset obtained during HST cycles 11 and 14makes up a substantial part of this thesis. These are discussed at length in

40 This thesis: data and methods
Papers I and III. Estimation of the flux due to continuum processes in theon-line filter is far from trivial in this case. Ultimately, the ACS filter-set wasnot designed for these applications.
In the ideal world, observers would like to have a spectrum of the target atevery position, that way much information can be extracted (e.g. in the case ofgalaxies, age, EB−V , metallicity, etc.). Indeed, this would be especially valu-able for Lyα studies since so much kinematic information about the ISM isimprinted on the line profile. This is possible at the moment in the optical andNIR with ground-based Fabry-Perot spectrographs and Integral Field Unitsthat allow three dimensional spectra to be obtained. Unfortunately there is nosuch device mounted on HST or any space-based observatory. Using the STISit would, in theory, have been possible to map the targets by taking a series oflong-slit spectra, moving the slit systematically across the face of the targets.This would be prohibitively costly.
However, model spectra of galaxies, based upon the synthesis of many wellunderstood stellar spectra allow model galaxy spectra to be constructed as afunction of various parameters. Most importantly, with the correct treatmentfor stellar evolution, galaxy spectra can be modeled as a function of age. Simi-larly, the effects of dust (i.e. reddening) are reasonably well understood. Thus,if enough photometric data-points are available (i.e. images in enough filters),and the observations of sufficient depth (i.e. photometric errors are small),model spectra can be fit to the data-points. Thus the parameters of the modelspectra that best-fit the data-points are the most likely ones to reflect the con-ditions in the galaxy at that point. Indeed, spectral fitting is an extremely com-mon concept in observational astronomy and is applied to every energy in theelectromagnetic spectrum. With relation to galaxies, it is the method throughwhich properties of high-z galaxies are determined (see Section 3.3.1) and,by introducing redshift as a free parameter, the basis of photometric-redshiftcodes.
Most frequently SED fitting is applied to aperture-extracted galaxy fluxes,in order to obtain integrated properties. Sometimes the method is used to es-timate continuum levels at certain wavelengths in order to isolate the contri-bution from the starburst. It is difficult to find an example of SED modelingbeing used to calibrate fluxes in a given bandpass in order to isolate an emis-sion line, which is exactly what is performed here. In our HST imaging samplewe have images in eight bandpasses and spatially resolved spectral fitting ispivotal in the data analysis for two reasons: firstly, our FUV imaging filtersdo not permit a reliable estimate of the continuum flux at Lyα; and secondlybecause many properties of the host galaxies are returned from the fitting.The method is more involved than most other fitting methodologies in thepublished literature and is optimised to return unique information about thetargets. For example, by treating nebular gas and multiple stellar componentsindependently, we are able to analyse the properties of the starburst, any un-derlying stellar component, and nebular gas independently, and including the

6.3 Data processing methods 41
effects of dust. This is performed on the HST images pixel–by–pixel, return-ing resolved maps of many parameters. Properties returned directly are thestellar ages, photometric masses, and EB−V in each pixel. With a map of thebest-fitting spectral parameters, we are essentially able to read off fluxes ata wavelength or predict the flux in a certain filter. This forms the basis forthe continuum subtraction of Lyα , and estimates of the ionising continuumoutput. Furthermore we are able to estimate the strength of stellar absorptionfeatures, which is used in the analysis of the ground-based imaging data. Adetailed description of the methodology, together with test of its reliability arepresented in Paper III. Many future applications can be envisaged.


43
7 Summary of the Papers
7.1 Paper IThis work built upon the HST/ACS imaging study of Kunth et al. (2003) inwhich two targets were examined. While presenting the first ever low-redshiftLyα images, uncertainties about how to subtract the strong FUV continuumprevented a detailed photometric analysis. Here we turn our attention to athird target in the sample: the UV-bright, low metallicity, and Lyα emittingESO 338-IG04. This target had also been imaged with HST in a number ofbroad-band continuum filters by Östlin et al. (2003). Using the Starburst99(Leitherer et al. 1999; Vázquez & Leitherer 2005) and those of Delgado et al.(2005). A detailed study of the UV and optical colours was undertaken atvarious ages and internal reddenings (EB−V ). While in some colours age andEB−V have degenerate effects, we found that enough information was presentin the observations of ESO 338-IG04 to lift this degeneracy and allow us to fitunique model solutions to the data. We defined a parameter called the Contin-uum Throughput Normalisation factor (CTN) as the scaling factor that wouldconvert the flux measured in the off-line continuum filter to the flux expecteddue to continuum processes alone in the on-line filter. Thus, using the multi-ple continuum observations and colour databases, we were able to map CTNpixel-by-pixel, across the galaxy and reliably subtract the continuum. Thisyielded the first calibrated high-resolution (∼ 5pc) Lyα line-only images, andenabled a real photometric analysis to be performed.
Flux measurements based on IUE observations were confirmed in the ACSimages, as well as emission and absorption features in a spectrum taken withSTIS. The Lyα morphology was found to be complex and strongly decoupledfrom that seen at other wavelengths. Emission was found from a few centralstar-forming knots but in general, Lyα was seen in absorption in front of thestarburst region. In the central regions the net Lyα flux was found to be nega-tive. Globally, ESO 338-IG04 is a Lyα emitter, and the emission was found tobe dominated by a large diffuse halo, resulting from resonant scattering in theneutral medium. This provided the first direct observational evidence for theescape of Lyα photons after resonance scattering. We found tentative evidencefor the Lyα emission morphology following the kinematics of the ionised gasas traced by the Hα velocity field. Comparing the Lyα flux with that predictedfrom Hα and assuming case B recombination, we found that the fraction ofescaping Lyα photons fell significantly below 1 at just 5%, despite the verylow dust content. Such conclusions mirror those drawn from previous studies

44 Summary of the Papers
with the IUE and HST spectrographs: if such processes are at play in high-zgalaxy populations, severe biases may be lurking in the derived quantities.
7.1.1 Paper I – ErratumIn Section 6.4, entitled ‘The diffuse emission’, a calculation is performed toestimate the number of resonant scatterings experienced by a Lyα photon es-caping in the diffuse scattering halo. While the calculation itself isn’t at fault,it’s based upon an erroneous assumption about the probability of scatteringvs. two-photon emission. The 12S to 22P Lyα absorption can ultimately resultin the emission of two photons, but the 22P → 22S transition must first oc-cur. This requires electron scattering and is thus only possible in the ionisedmedium, not the HI halo. This transition probability was shown by Osterbrock(1962) to be many orders of magnitude lower that the 1/3 presented in PaperI. None of the other results or interpretations are affected.
7.2 Paper IIAs described in Section 3.3 populations of high-z Lyα emitters have beenfound with very high equivalent widths; higher than those predicted by pop-ulation synthesis models with standard IMFs and solar-like metallicities. Mo-tivated by our success with spectral fitting approaches to Lyα analysis andcode developed for Paper I, we tested various observational strategies forhigh-z surveys. Again using the Starburst99 population synthesis models, wegenerated populations of galaxies at various redshifts, modifying the spectrawith synthetic Lyα lines, internal dust reddening, and underlying stellar com-ponents. We adopted observational constraints on the number density and col-umn density distribution of IGM absorption systems as a function of redshiftto generate a Monte Carlo code for the modification of the spectra of high-zgalaxies by discrete absorbers. By simulating fluxes expected in various wave-bands, we were then able to test how reliably various survey methodologiesrecovered the input Lyα fluxes and equivalent widths.
In a similar conclusion to that of Paper I we determined that estimates ofthe continuum at Lyα based upon single off-line observations to be severelyflawed for all realistic input spectra. Methods utilising two off-line filters tomeasure and extrapolate the FUV continuum slope produced accurate resultsin dust-free cases but again, severe discrepancies were found between the ob-served and input fluxes when relatively modest internal reddening was ap-plied. Wavelength-coincident narrow- and broad-band filters, the most com-mon selection criterion for high-z Lyα emitters, was found to perform well atintermediate-z where IGM absorption is minimal. However, this method in-volves around half of the broad-band filter sampling rest-frame wavelengthsbluewards of Lyα , where IGM absorption effects are present. Discrete absorp-

7.3 Paper III 45
tion features caused by Lyα-forest clouds remove an increasing fraction offlux from the broad-band filter as observations target higher redshifts, whichleads to underestimates of the continuum flux at Lyα and therefore a system-atic overestimate of equivalent width. This method was found to overestimateWLyα by ∼ 25% at z = 6 on average, and by factors of several in some in-dividual cases. Due to observational noise in the continuum band, we noticea positive skewness in the WLyα distribution, and that selection functions areliable to preferentially select objects at the high WLyα end of this tail, furtherbiasing the sample. We suggested the implementation of a Monte-Carlo ap-proach similar to ours by high-z survey teams for their own filter sets. Wefind that the only reliable method of estimating the continuum flux at Lyα isa spectral fitting method similar to the one implemented in our HST sample.While this may be very observationally expensive using current telescopic fa-cilities, it will be entirely possible with future ground based extremely large(30m-class) telescopes or the James Webb Space Telescope, when extremelydeep multiband datasets will become available.
7.3 Paper IIIAfter the publication of Paper I more HST time was applied for to observe theremaining galaxies in the sample in five additional continuum bands and Hα .Ten orbits were awarded and data obtained, processed, and calibrated. This ar-ticle presents a detailed study of the reliability of the Lyα observables obtain-able for our HST/ACS imaging study, and outlines the continuum subtractionmethodology in detail. The codes used for Papers I and II were completelyre-designed and a sophisticated spectral reconstruction method implemented.With the additional bandpasses, we are able to constrain not only the age of thestarburst and EB−V , but also the contribution from nebular gas and any stellarpopulation underlying the current starburst. For each pixel in the aligned HSTimages, our code outputs CTN and continuum subtracted Lyα maps, contin-uum subtracted Hα maps, maps of age and photometric mass in the variousstellar components, and EB−V . Based upon stellar age and normalisation, weare also able to estimate the flux density at any given wavelength, allowing usto also map the ionising photon production. From EB−V maps we are able tocorrect fluxes in individual bands for internal dust absorption.
We produce an array synthetic galaxy SEDs that we predict are likely tocover the starburst parameter space in our target objects. Age, EB−V , metallic-ity, IMF, contribution from old star and ionised gas, stellar atmosphere modelare all varied, and we apply Lyα lines of varying strengths. Adding numericalnoise and again applying Monte-Carlo methods, we test the reliability of ourrecovery of Lyα observables as a function of signal–to–noise. We identify theneed to obtain S/N in the range 5 to 10 in all bandpasses to obtain acceptablespectral fits using the multi-component fitting method outlined above. Drop-

46 Summary of the Papers
ping observations in a single continuum bandpass is acceptable, given that thenumber of datapoints still exceeds the number of parameters we are trying tofit, although dropping observations in two or more bandpasses simultaneouslyleads to grossly unreliable fits. We identify the need for an independent deter-mination of metallicity, which fortunately is well known in all of our targets,although details of the IMF are relatively unimportant for our primary method.The results are used as a basis for the methodology in Papers IV and V.
Simulations for a potential HST imaging survey at slightly higher redshiftare shown. With the presented filter configuration, we are able to obtain re-sults of similar reliability to our current study but at decreased observationalexpense, allowing a statistically significant sample of starbursts to be imagedin future HST cycles.
7.4 Paper IVWith new UV and optical data obtained of our HST/ACS Lyα sample, weapply the new SED-fitting methods (Paper III) to a single target: Haro 11.Haro 11 is also a known Lyα emitter and also the only known emitter of ion-ising radiation at low-z (Bergvall et al. 2006).
As in Paper I, the Lyα morphology was found to be strongly decoupledfrom that of the stellar continuum and also from the ionised medium as probedby the HST Hα images. While exhibiting a very complex morphology in FUVand Hα , the Lyα images showed a central region of bright emission coin-cident with a single major star forming condensation, while other condensa-tions brighter in Hα showed only Lyα absorption. The central emission wassurrounded by a large (∼ 8 kpc) diffuse Lyα scattering halo, with the overallLyα morphology being ocularly similar to a bulge+disc system. ComparingLyα surface brightness to that of Hα showed that in the very central regionan upper limit appeared to be set to the Lyα/Hα line ratio by the case B re-combination value. However, in the scattering halo, the line ratio consistentlyexceeded that of case B, indicating that the Lyα we observe from these re-gions can not have been produced locally. Based on the Hα luminosity, wecompute a global Lyα escape fraction of less than 3%. Comparing Lyα sur-face brightness to EB−V and stellar age indicated that Lyα was frequentlyseen superimposed on regions too old to produce ionisation, or too dusty toallow the transmission of Lyα , both providing further evidence in supportof the resonance scattering escape mechanism. Deep ground-based narrow-band imaging using ESO’s New Technology Telescope in Hα and Hβ allowus to map the nebular gas extinction, revealing that the central emission re-gion was significantly dustier than the other star forming knots. Fitting Sérsicsurface brightness profiles to the central and diffuse Lyα components reveledthat over 90% of the Lyα luminosity was emitted in the diffuse component.We performed aperture photometry on the numerous star clusters in the im-

7.5 Paper V 47
age and derived their ages and reddenings using the same SED fitting codedescribed. Tentative evidence was found for the Lyα equivalent width in theimmediate vicinity of individual clusters being a function of age, qualitativelyconsistent with the hydrodynamic predictions of Tenorio-Tagle et al. (1999).Using the spectral fitting code, we are also able to predict the number of ion-ising photons produced by the young starburst, and place constraints of ∼ 9%on the escape of ionising radiation.
7.5 Paper VPaper V builds further upon Papers I, III, and IV, and presents processedLyα and Hα images for the complete sample of galaxies in the ACS sam-ple. It will be accompanied by a release of the continuum-subtracted Lyα
images in the Centre de Données astronomiques de Strasbourg (CDS). As inPapers I and IV, Lyα emission is found to be strongly decoupled from non-resonant morphological tracers. In most cases, the bulk of the Hα output isfound from regions of moderate UV surface brightness, which is to be ex-pected since many HII nebulae can be resolved. The same effect is seen forLyα but is much stronger since the photons are further decoupled by resonantscattering. While the most metal- and dust-free galaxy in the sample showsnet Lyα absorption, small regions of Lyα leakage are seen surrounding theUV-bright central regions. For objects showing net Lyα emission, luminosi-ties are found to be dominated by the diffuse emission mechanism althoughequivalent widths are moderate. Lyα escape fractions are shown to never ex-ceed 18%. Corrections for internal dust extinction in the Lyα maps revealshigher escape fractions but still falling short of 1, significantly so in 4 of the6 cases, and resonant trapping is found to be very influential in the visibilityof Lyα . Globally, a positive correlation between WLyα and WHα would be ex-pected, however in this sample an anti-correlation is seen. This is thought toresult from evolutionary effects and is qualitatively consistent with evolution-ary hydrodynamic models. While both Lyα and Hα are intrinsically at theirstrongest at the earliest times, the neutral ISM is static and does not permit thetransfer of Lyα .


49
8 Ongoing projects and futureprospects
8.1 Narrow-band imaging in H-alpha and H-betaFor a robust astrophysical comparison between Lyα morphology and dust, anindependent measure of the interstellar extinction is preferable to the extinc-tion on the stellar continuum found by SED fitting presented in Papers IVand V. This is typically measured using emission line ratios (e.g. Hα/Hβ ),although Hβ was not included in the HST observations presented in this se-ries of articles. As part of the work involved in this thesis, images of all sixtargets have been obtained using the Nordic Optical Telescope on La Palmafor northern targets, and New Technology Telescope, at ESO La Silla, Chile,for those in the southern hemisphere. Images have been obtained in the Hα ,Hβ , and [OIII]λ5007Å emission lines, plus nearby continuum for each line.The motivation is to study directly the correlation between Lyα emission andinterstellar extinction as probed by the Balmer decrement (Hα/Hβ ) and thehardness of the ionising flux ([OIII]/ Hβ ). Naturally typical ground-based res-olutions (∼ 1′′) are not comparable with that of the ACS and the high level ofspatial detail in the Lyα maps is lost in the smoothing.
Unfortunately there was not enough time to reduce and process all of theseimages during the course of this thesis, although the Hα and Hβ data for onetarget, Haro 11 are included in Paper IV. Hα and Hβ data have now all beenreduced for all the targets, early results look promising, and a full analysisis pending. A dedicated article addressing the relationship between Lyα andinterstellar extinction is in preparation (Atek et al. 2007 in prep).
8.2 Infra-red emission line imagingIn a similar approach to that outlined above, a project is ongoing to measurethe interstellar extinction using the Hα/Brγ emission line decrement. For thisstudy we use the NAOS-CONICA instrument mounted on the Very Large Tele-scope (VLT) at ESO Paranal. This instrument uses an adaptive optics system tocorrect for effects of atmospheric turbulence in real-time, essentially reducingatmospheric seeing below the diffraction limit of the telescope for a fraction ofthe flux. For VLT in the K−band, the diffraction limit is 0.05′′, similar to thatof HST/ACS in the V−band and better than that obtainable with HST/NICMOSat K. VLT is actually a much better instrument for such observations than HST.

50 Ongoing projects and future prospects
Observations have been obtained for a single target, ESO 338-IG04, and arescheduled for a second, Haro 11. A preliminary reduction of a single hour’sworth of the NACO data has been performed but results are very promisingindeed. Figure 8.1 shows ESO 338-IG04 as seen by HST in the V -band andVLT/NACO in an intermediate band continuum filter near K. Many luminousstar clusters are visible. The NACO image is clearly of comparable resolutionand much of the same structure is visible. Moreover, only one quarter of sci-ence frames are used and the reduction of the NACO image was rapid; onlyaimed at testing the quality of the data. Signal–to–noise will increase by morethan a factor of 2 when the full data-set is carefully reduced.
Figure 8.1: Nearby luminous blue compact galaxy ESO 338-IG04. North is up andEast to the left. Image scale is 17×17′′. Left: HST/ACS image in the continuum nearthe V−band. Right: VLT/NACO intermediate band continuum image near K.
8.3 Future Lyman-alpha studies with HSTThe HST/ACS Lyα imaging campaign has done a lot in explaining the Lyα
emission mechanisms in starburst galaxies. However, the six galaxies in thesample were hand-picked, selecting a variety of optical morphologies, lumi-nosities, metallicities and dust contents. Target selection was also based uponprevious knowledge of the Lyα emission and absorption. Thus, this samplecannot be considered representative of the starburst galaxy population as awhole and with such a small sample, is far from statistically significant.
We plan, in future HST cycles, to propose a Lyα imaging survey of a statis-tically meaningful, unbiased selection of UV selected star-forming galaxies.The observational methodology is that outlined as a future Lyα imaging studyin Paper III. Selection is based upon the Galaxy Evolution Explorer (GALEX)FUV catalogues, cross correlated with Sloan Digital Sky Survey (SDSS). Fromthe matched catalogues, we are able to select a range of FUV luminosities

8.4 Future Lyman-alpha studies with HST 51
from the GALEX fluxes using the redshifts from SDSS to select the appropri-ate redshift for our survey design. Since high FUV luminosity is not neces-sarily in indication of an active starburst, cuts in Hα equivalent widths can bemade to select only galaxies with active star formation. No other criteria (e.g.metallicity, morphology) will be allowed to bias the selection function.
8.4 Future Lyman-alpha studies with HSTPaper IV includes a study of the young star cluster (known as super-star clus-ters; SSC) population in luminous blue compact galaxy Haro 11. Cluster lu-minosities were extracted by aperture photometry and the SED fitting codedescribed in Paper III was used to estimate the age, mass, and EB−V in the in-dividual clusters. Further HST/NICMOS data have been obtained of Haro 11,VLT/NACO data is pending, and NICMOS, WFPC2, and ACS/SBC data havebeen obtained or are scheduled to observe two more SSC-rich nearby star-bursts. We have already begun a detailed spectral analysis of the clusters us-ing spectral fitting. SSCs will be used to probe the star-formation histories inthese galaxies, in a similar manner to that demonstrated in Östlin et al. (2003)but with a significantly enhanced data-set. More specifically, deep IR data willallow us to probe beneath the dust screen and find embedded clusters in thedusty ISM, while the FUV data will permit the recovery of a more securemeasure of EB−V .
Important issues to address include: how the age distribution of clusters andhow it relates to age of the diffuse stellar population; what fraction of star-formation occurs in clusters compared with the diffuse medium, and whetherthe young clusters are able to survive processes in the violent ISM and sur-vive to adulthood, evolving into globular cluster populations we see in relaxedelliptical galaxies.
8.5 Other applications of the spectral fitting codesFinally, there are a number of further applications of the stellar modelingcodes developed in this thesis. Concerning starburst galaxies in the nearbyuniverse, masses of data are in existence. Of particular interest currently iswhether galaxies can ever be proven truly young. With spectral fitting soft-ware that independently treats multiple stellar components, it may be possible,with further testing, to examine the aged stellar populations in such galaxies.
When objects hosting population III stars are found, standard SED model-ing will not be applicable, not only due to the hotter stellar atmospheres, butalso due to the enhance contribution from nebular gas. A method of SED fit-ting will be required that takes into account multiple populations, in this caseone stellar and one independent nebular component. What the actual approach

52 Ongoing projects and future prospects
will be depends upon what telescopes are available. If James Webb Space Tele-scope is operational, and depending upon redshift, it may be possible to obtaina direct measurement of Hα . Lyα may or may not be an appropriate measureof nebular continuum due to attenuation in the IGM, again depending uponredshift and how much is known about IGM ionisation fraction at that red-shift. Failing that, a multi-component fitting method will likely be required.

53
9 Acknowledgements
Firstly, I need to express my extreme gratitude to my thesis advisor: GöranÖstlin. His guidance and enthusiasm have been inspirational. Thanks also formaking this fun, and for providing ideas at a rate where only a small fractionof them stuck – hopefully they were the right ones. From my extended super-visory support group I also thank Claes Fransson and Philippe Thébault foruseful comments and feedback on my research and progress.
I need to thank the Swedish National Space Board (SNSB; Rymdstyrelsen)for footing the bill for my employment, and the L. Namowitzky and L. &E. Kinanders foundations for financial donations. I thank the support staffat the Space Telescope Science Institute, European Southern Observatory, andNordic Optical Telescope. Also, the organisers of the Alpbach Summer Schooland IAC Winter School. Furthermore, I would like to thank the un-namedpeople behind the software that I’ve used extensively in these projects, manyof whom do it on their own time.
From Stockholm Observatory, I would like to thank explicitly Claes-IngvarBjörnsson and Hans Olofsson for giving up years of research time in orderto run the institute and manage graduate programme, respectively. All thesupport and administrative staff: Ulla Engberg, Sergio Gelato, Bengt Lars-son, Lena Olofsson, and Sandra Åberg deserve thanks for insuring that var-ious aspects of our institute function as they should. From SO, I thank ex-plicitly Robert Cumming, Gösta Gahm, Stefan Larsson, René Liseau, GarreltMellema, Edvard Mörtsell, Aage Sandqvist, and Jesper Sollerman. I have ap-preciated coffee machine banter with Magnus Näslund although I have heardthat that much caffeine isn’t good for a person.
From a scientific perspective I am extremely grateful to Daniel Kunth formaking the SBC dataset available, and hosting me in Paris on several occa-sions. Also to J. Miguel Mas-Hesse for hosting and supervising me in Madrid.Direct collaborators to whom I would like to express gratitude include AngelaAdamo, Hakim Atek, Elena Jiménez-Bailón, Claus Leitherer, Seppo Mattila,Kim Nilsson, Artashes Petrosian, Daniel Schaerer and Anne Verhamme. I amvery grateful to the members of the Uppsala Galaxy Group, Nils Bergvall,Elisabet Leitet and Thomas Marquart for numerous valuable discussions (butmostly for good times in Prague).
I thank all the SO graduate students, past and present. Particularly, AndreasAndersson Lundgren (and family) for sorting me out in Santiago, and BorisGudiksen for making me feel welcome when I started. I’d rather not single

54 Acknowledgements
people out, but the friendship of Jens Melinder, Jacob Trier Frederiksen, andAnestis Tziamtzis has been invaluable. Among my fondest memories fromStockholm will be hanging out with the grad students: conversations, rangingfrom hard-core science to the truly nonsensical and absurd, often with theblurring of standard social lubricants, will not be forgotten soon.
Outside of the astronomical world I need to thank, first and foremost,my wife Charlotta Hayes for her endless love, support, encouragement,and patience. In the last few years, I thank you for tolerating thefollowing: all the time when I wasn’t around; all the time I was aroundbut was completely disconnected; the phrase “sorry, what were yousaying?"; the phrase “why did nobody tell me that?"; the bleating aboutastronomy/proposals/papers/deadlines/computers; and all the frustration youhad to bear the brunt of. It all must have been quite draining, but all that’sgonna change... I need to thank my parents Michael and Patricia Hayes,also for their endless support over the last years (and all years), and myin-laws Lars-Åke and Birgitta Öhman for everything they’ve done for usbetween ∼ 2000 and now. All my friends deserve a mention but they are notall going to get one. In the UK I’d like to thank Pete Black, Mike Foxall,Adam Heath, Leo James, Mark Lamont, Tina Lee, Matthew Redgrave, andJames and Sharon Snowden. In Sweden: David Adlercreutz, Johan Almén,Jonas Forselius, Tuva Johansson, Carolina Jonsson, Lisa Him-Jensen, LindaNilsson, Anne Sellbrink, Mats Wällstedt, and Per-Johan Wik. Elsewhere:cheers Richard Tiernan! Finally, a more anonymous note of thanks goes tothose that were around when I began this but didn’t make it to the end.
Obviously these acknowledgements are non-exhaustive. Apologies for that.
Stockholm, July 2007

55
10 Publications not included in thisthesis
VI Fassbender, R., Stegmaier, J., Weijmans, A.-M., Köstner, S.,Kruselburger, A., Diethart, C., Fertl, P., Valiante, E., Hayes,M., Schuecker, P., & Hasinger, G. (2006) VADER: a satellitemission concept for high precision dark energy studies,Proc. SPIE, 6266, 90
VII Kunth, D., Hayes, M. Östlin, G., Mas-Hesse, J.-M., Leitherer, C.& Petrosian, A. (2004), Invited Talk: “Young Local Universe”,Proceedings of XXXIXth Rencontres de Moriond, La Thuile,Aosta Valley, Italie, March 21-28, 2004, Eds: A. Chalabaev,T. Fukui, T. Montmerle, and J. Tran-Thanh-Van, EditionsFrontieres, Paris
VIII Östlin, G., Hayes, M., Mas-Hesse, J.-M., Kunth, D., Leitherer,C., & Petrosian, A. (2005), Invited talk: “When UV meets IR:a History of Star Formation”, Proceedings of Rencontres deMoriond XXVth Moriond Astrophysics Meeting


57
11 Bibliography
Abel, T., Bryan, G. L., & Norman, M. L. 2000, ApJ, 540, 39
Adams, T. F. 1972, ApJ, 174, 439
Ahn, S.-H. 2004, ApJ, 601, L25
Ahn, S.-H., Lee, H.-W., & Lee, H. M. 2001, ApJ, 554, 604
—. 2003, MNRAS, 340, 863
Ajiki, M., Taniguchi, Y., Fujita, S. S., et al. 2003, AJ, 126, 2091
Atek, H., Kunth, D., Hayes, M., Östlin, G.,, & Mas-Hesse, J. M. 2007, A&A
Becker, R. H., Fan, X., White, R. L., et al. 2001, AJ, 122, 2850
Bergvall, N., Zackrisson, E., Andersson, B., et al. 2006, ArXiv Astrophysicse-prints
Black, J. H. & van Dishoeck, E. F. 1987, ApJ, 322, 412
Bouwens, R. J., Thompson, R. I., Illingworth, G. D., et al. 2004, ApJ, 616,L79
Bromm, V., Coppi, P. S., & Larson, R. B. 2002, ApJ, 564, 23
Bruzual, A. G. & Charlot, S. 1993, ApJ, 405, 538
Bunker, A. J., Stanway, E. R., Ellis, R. S., & McMahon, R. G. 2004, MN-RAS, 355, 374
Calzetti, D., Armus, L., Bohlin, R. C., et al. 2000, ApJ, 533, 682
Cannon, J. M., Skillman, E. D., Kunth, D., et al. 2004, ApJ, 608, 768
Cen, R. & Haiman, Z. 2000, ApJ, 542, L75
Charlot, S. & Fall, S. M. 1993, ApJ, 415, 580
Chary, R.-R., Stern, D., & Eisenhardt, P. 2005, ApJ, 635, L5
Condon, J. J. 1992, ARA&A, 30, 575
Cowie, L. L. & Hu, E. M. 1998, AJ, 115, 1319

58 BIBLIOGRAPHY
Cox, D. P. & Smith, B. W. 1974, ApJ, 189, L105+
Dawson, S., Rhoads, J. E., Malhotra, S., et al. 2004, ApJ, 617, 707
Dawson, S. A. 2005, PhD thesis, University of California, Berkeley, UnitedStates – California
de Propris, R., Pritchet, C. J., Hartwick, F. D. A., & Hickson, P. 1993, AJ,105, 1243
Delgado, R. M. G., Cerviño, M., Martins, L. P., Leitherer, C., & Hauschildt,P. H. 2005, MNRAS, 357, 945
Dijkstra, M., Haiman, Z., & Spaans, M. 2006a, ApJ, 649, 14
—. 2006b, ApJ, 649, 37
Dijkstra, M., Wyithe, J. S. B., & Haiman, Z. 2007, MNRAS, 379, 253
Djorgovski, S., Thompson, D. J., Smith, J. D., & Trauger, J. 1992, in Bulletinof the American Astronomical Society, 1248–+
Djorgovski, S. G., Castro, S., Stern, D., & Mahabal, A. A. 2001, ApJ, 560,L5
Fall, S. M. & Rees, M. J. 1985, ApJ, 298, 18
Fan, X., Carilli, C. L., & Keating, B. 2006, ARA&A, 44, 415
Fan, X., Narayanan, V. K., Strauss, M. A., et al. 2002, AJ, 123, 1247
Feautrier, P. 1964, Comptes Rendus Acad. Sci. Paris, 258, 3189
Finkelstein, S. L., Rhoads, J. E., Malhotra, S., Pirzkal, N., & Wang, J. 2007,ApJ, 660, 1023
Fujita, S. S., Ajiki, M., Shioya, Y., et al. 2003, AJ, 125, 13
Fynbo, J. U., Thomsen, B., & Möller, P. 2000, A&A, 353, 457
Gallagher, J. S., Hunter, D. A., & Bushouse, H. 1989, AJ, 97, 700
Gawiser, E., van Dokkum, P. G., Gronwall, C., et al. 2006, ApJ, 642, L13
Giavalisco, M., Koratkar, A., & Calzetti, D. 1996, ApJ, 466, 831
Gronwall, C., Ciardullo, R., Hickey, T., et al. 2007, ArXiv e-prints, 705
Haiman, Z. 2002, ApJ, 576, L1
Haiman, Z. & Cen, R. 2005, ApJ, 623, 627

BIBLIOGRAPHY 59
Haiman, Z. & Spaans, M. 1999, ApJ, 518, 138
Hansen, M. & Oh, S. P. 2006, MNRAS, 367, 979
Hartmann, L. W., Huchra, J. P., & Geller, M. J. 1984, ApJ, 287, 487
Hartmann, L. W., Huchra, J. P., Geller, M. J., O’Brien, P., & Wilson, R. 1988,ApJ, 326, 101
Hayashino, T., Matsuda, Y., Tamura, H., et al. 2004, AJ, 128, 2073
Heckman, T. M., Robert, C., Leitherer, C., Garnett, D. R., & van der Rydt,F. 1998, ApJ, 503, 646
Hu, E. M., Cowie, L. L., Capak, P., & Kakazu, Y. 2005, in IAU Colloq. 199:Probing Galaxies through Quasar Absorption Lines, ed. P. Williams, C.-G.Shu, & B. Menard, 363–368
Hu, E. M., Cowie, L. L., & McMahon, R. G. 1998, ApJ, 502, L99+
Hu, E. M., Cowie, L. L., McMahon, R. G., et al. 2002, ApJ, 568, L75
Hummer, D. G. & Kunasz, P. B. 1980, ApJ, 236, 609
Jimenez, R. & Haiman, Z. 2006, Nature, 440, 501
Kashikawa, N., Shimasaku, K., Malkan, M. A., et al. 2006, ApJ, 648, 7
Kennicutt, Jr., R. C. 1983, ApJ, 272, 54
—. 1998a, ARA&A, 36, 189
—. 1998b, ApJ, 498, 541
Kodaira, K., Taniguchi, Y., Kashikawa, N., et al. 2003, PASJ, 55, L17
Koo, D. C. & Kron, R. T. 1980, PASP, 92, 537
Kudritzki, R.-P., Méndez, R. H., Feldmeier, J. J., et al. 2000, ApJ, 536, 19
Kunth, D., Leitherer, C., Mas-Hesse, J. M., Östlin, G., & Petrosian, A. 2003,ApJ, 597, 263
Kunth, D., Lequeux, J., Sargent, W. L. W., & Viallefond, F. 1994, A&A, 282,709
Kunth, D., Mas-Hesse, J. M., Terlevich, E., et al. 1998, A&A, 334, 11
Lai, K., Huang, J.-S., Fazio, G., et al. 2007, ApJ, 655, 704
Laursen, P. & Sommer-Larsen, J. 2007, ApJ, 657, L69

60 BIBLIOGRAPHY
Le Delliou, M., Lacey, C., Baugh, C. M., et al. 2005, MNRAS, 357, L11
Le Delliou, M., Lacey, C. G., Baugh, C. M., & Morris, S. L. 2006, MNRAS,365, 712
Leitherer, C., Schaerer, D., Goldader, J. D., et al. 1999, ApJS, 123, 3
Lequeux, J., Kunth, D., Mas-Hesse, J. M., & Sargent, W. L. W. 1995, A&A,301, 18
Lilly, S. J., Le Fevre, O., Hammer, F., & Crampton, D. 1996, ApJ, 460, L1+
Loeb, A. & Rybicki, G. B. 1999, ApJ, 524, 527
Lowenthal, J. D., Hogan, C. J., Leach, R. W., Schmidt, G. D., & Foltz, C. B.1990, ApJ, 357, 3
Macchetto, F., Lipari, S., Giavalisco, M., Turnshek, D. A., & Sparks, W. B.1993, ApJ, 404, 511
Madau, P. 1995, ApJ, 441, 18
Madau, P., Ferguson, H. C., Dickinson, M. E., et al. 1996, MNRAS, 283,1388
Madau, P., Pozzetti, L., & Dickinson, M. 1998, ApJ, 498, 106
Madau, P. & Rees, M. J. 2000, ApJ, 542, L69
Malhotra, S. & Rhoads, J. E. 2002, ApJ, 565, L71
—. 2004, ApJ, 617, L5
Malhotra, S., Rhoads, J. E., Pirzkal, N., et al. 2005, ApJ, 626, 666
Mas-Hesse, J. M., Kunth, D., Tenorio-Tagle, G., et al. 2003, ApJ, 598, 858
Matsuda, Y., Yamada, T., Hayashino, T., et al. 2005, ApJ, 634, L125
Meier, D. L. 1976, ApJ, 207, 343
Meier, D. L. & Terlevich, R. 1981, ApJ, 246, L109
Miralda-Escude, J. 1998, ApJ, 501, 15
Møller, P. & Fynbo, J. U. 2001, A&A, 372, L57
Møller, P. & Warren, S. J. 1993, A&A, 270, 43
Moss, C., Irwin, M. J., & Whittle, M. 1988, MNRAS, 232, 381

BIBLIOGRAPHY 61
Murayama, T., Taniguchi, Y., Scoville, N. Z., et al. 2007, ArXiv Astrophysicse-prints
Nagao, T., Motohara, K., Maiolino, R., et al. 2005, ApJ, 631, L5
Nagao, T., Murayama, T., Maiolino, R., et al. 2007, A&A, 468, 877
Neufeld, D. A. 1990, ApJ, 350, 216
—. 1991, ApJ, 370, L85
Neufeld, D. A. & McKee, C. F. 1988, ApJ, 331, L87
Nilsson, K. K., Moeller, P., Moeller, O., et al. 2007, ArXiv e-prints, 706
Osterbrock, D. E. 1962, ApJ, 135, 195
Östlin, G., Zackrisson, E., Bergvall, N., & Rönnback, J. 2003, A&A, 408,887
Ouchi, M., Shimasaku, K., Akiyama, M., et al. 2005, ApJ, 620, L1
Ouchi, M., Shimasaku, K., Furusawa, H., et al. 2003, ApJ, 582, 60
Parkes, I. M., Collins, C. A., & Joseph, R. D. 1994, MNRAS, 266, 983
Partridge, R. B. & Peebles, P. J. E. 1967, ApJ, 147, 868
Péroux, C., McMahon, R. G., Storrie-Lombardi, L. J., & Irwin, M. J. 2003,MNRAS, 346, 1103
Pirzkal, N., Malhotra, S., Rhoads, J. E., & Xu, C. 2006, ArXiv Astrophysicse-prints
Press, W. H. & Schechter, P. 1974, ApJ, 187, 425
Pritchet, C. J. 1994, PASP, 106, 1052
Pritchet, C. J. & Hartwick, F. D. A. 1987, ApJ, 320, 464
—. 1990, ApJ, 355, L11
Ranalli, P., Comastri, A., & Setti, G. 2003, A&A, 399, 39
Rao, S. M., Turnshek, D. A., & Nestor, D. B. 2006, ApJ, 636, 610
Rauch, M. 1998, ARA&A, 36, 267
Rees, M. J. 1989, MNRAS, 239, 1P
Rhee, G. F. R. N., Webb, J. K., & Katgert, P. 1989, A&A, 217, 1

62 BIBLIOGRAPHY
Rhoads, J. E., Dey, A., Malhotra, S., et al. 2003, AJ, 125, 1006
Rhoads, J. E., Malhotra, S., Dey, A., et al. 2000, ApJ, 545, L85
Rhoads, J. E., Panagia, N., Windhorst, R. A., et al. 2005, ApJ, 621, 582
Salpeter, E. E. 1955, ApJ, 121, 161
Santos, M. R. 2004, MNRAS, 349, 1137
Schaerer, D. 2002, A&A, 382, 28
—. 2003, A&A, 397, 527
Schaerer, D. & Pelló, R. 2005, MNRAS, 362, 1054
Shapley, A. E., Steidel, C. C., Pettini, M., & Adelberger, K. L. 2003, ApJ,588, 65
Shapley, A. E., Steidel, C. C., Pettini, M., Adelberger, K. L., & Erb, D. K.2006, ArXiv Astrophysics e-prints
Sheth, R. K., Mo, H. J., & Tormen, G. 2001, MNRAS, 323, 1
Shimasaku, K., Hayashino, T., Matsuda, Y., et al. 2004, ApJ, 605, L93
Shimasaku, K., Kashikawa, N., Doi, M., et al. 2006, PASJ, 58, 313
Shimasaku, K., Ouchi, M., Okamura, S., et al. 2003, ApJ, 586, L111
Shull, J. M. 1978, ApJ, 224, 841
Songaila, A. 2004, AJ, 127, 2598
Songaila, A. & Cowie, L. L. 2002, AJ, 123, 2183
Spergel, D. N., Bean, R., Doré, O., et al. 2007, ApJS, 170, 377
Stanway, E. R., Bunker, A. J., & McMahon, R. G. 2003, MNRAS, 342, 439
Stanway, E. R., Bunker, A. J., McMahon, R. G., et al. 2004, ApJ, 607, 704
Stark, D. P., Ellis, R. S., Richard, J., et al. 2007, ApJ, 663, 10
Steidel, C. C., Adelberger, K. L., Dickinson, M., et al. 1998, ApJ, 492, 428
Steidel, C. C., Adelberger, K. L., Giavalisco, M., Dickinson, M., & Pettini,M. 1999, ApJ, 519, 1
Steidel, C. C., Adelberger, K. L., Shapley, A. E., et al. 2000, ApJ, 532, 170
Taniguchi, Y., Ajiki, M., Nagao, T., et al. 2005, PASJ, 57, 165

BIBLIOGRAPHY 63
Tapken, C., Appenzeller, I., Noll, S., et al. 2007, A&A, 467, 63
Tenorio-Tagle, G., Silich, S. A., Kunth, D., Terlevich, E., & Terlevich, R.1999, MNRAS, 309, 332
Terlevich, E., Diaz, A. I., Terlevich, R., & Vargas, M. L. G. 1993, MNRAS,260, 3
Thompson, D. J., Smith, J. D., Djorgovski, S., & Trauger, J. 1992, in Bulletinof the American Astronomical Society, 806–+
Thuan, T. X. & Izotov, Y. I. 1997, ApJ, 489, 623
Tinsley, B. M. 1972, A&A, 20, 383
Tumlinson, J. & Shull, J. M. 2000, ApJ, 528, L65
van Breukelen, C., Jarvis, M. J., & Venemans, B. P. 2005, MNRAS, 359, 895
Vázquez, G. A. & Leitherer, C. 2005, ApJ, 621, 695
Venemans, B. P., Kurk, J. D., Miley, G. K., et al. 2002, ApJ, 569, L11
Venemans, B. P., Röttgering, H. J. A., Miley, G. K., et al. 2005, A&A, 431,793
—. 2007, A&A, 461, 823
Venemans, B. P., Röttgering, H. J. A., Overzier, R. A., et al. 2004, A&A,424, L17
Verhamme, A., Schaerer, D., & Maselli, A. 2006, A&A, 460, 397
Wang, J. X., Rhoads, J. E., Malhotra, S., et al. 2004, ApJ, 608, L21
Wolfe, A. M., Lanzetta, K. M., Turnshek, D. A., & Oke, J. B. 1992, ApJ,385, 151
Yan, H., Dickinson, M., Giavalisco, M., et al. 2006, ApJ, 651, 24