luxembourg real estate investment funds 2015 - … · luxembourg has published the 2015 real estate...
TRANSCRIPT

alfi survey
Luxembourg Real Estate Investment Funds 2015

Executive summary 1
Introduction 31) CSSF data on Real Estate Investment Funds in Luxembourg 32) Survey Coverage 43) Luxembourg Real Estate Funds – The framework 4
3.1) Direct REIFs vs. Funds of REIFs 43.2) Regulatory Framework: Regulated vs. Unregulated structures 43.3) Legal structures 5
4) Scope and Methodology 64.1) Scope 64.2) Methodology 6
Part I - Direct real estate funds & real estate SICARs 7 1) Introduction 72) Initiator origins 83) Legal structure and regime 84) Fund structure 105) Investment style 116) Liquidity 127) Term 138) Geographical focus of fund investments 149) Target sectors 1510) Net Asset Value (NAV) distribution 1611) Gross Asset Value (GAV) distribution 1712) Target Gearing of Funds 1813) Fees 1814) Number of investors 1915) Type of investors 2016) Investor origins 2117) Accounting standards 2118) Frequency of NAV calculation 2319) Valuation standards 2420) Stock Exchange listing 2421) Currency 24
Part II - Funds of Real Estate Investment Funds 251) Introduction 252) Initiator origins 253) Legal structure and regime 264) Investment style 275) Liquidity 276) Term 297) Geographical focus of fund investment 298) Target sectors 309) Net Asset Value (NAV) 3110) 2016 target NAV distribution 31 11) Fees 3112) Type of investors 3313) Accounting standards 3414) Currency 3415) Frequency of NAV calculation 3516) Stock Exchange listing 35
Appendix 36Service providers 36Glossary 39Acknowledgements 41

1
The Association of the Luxembourg Fund Industry (ALFI) in partnership with EY Luxembourg has published the 2015 Real Estate Investment Funds (REIF) survey, its ninth edition. This year the survey not only illustrates the evolution of the REIF market for direct real estate funds (Direct Funds), Real Estate SICARs and Funds of REIFs at the end of June 2015, but a new category of investment vehicle – the “Manager-Regulated AIF”1 has been included for the first time.
2014 was another good year for Luxembourg domiciled REIFs as the population continued to expand by 27 Direct Funds of which 3 were Manager-Regulated AIFs, compared to 18 Direct Funds, including 2 Manager-Regulated AIFs, launched in 2013. In 2015, during Q1 and Q2, launches included 8 new SIFs, 3 Manager-Regulated AIFs and a single Part II (2010 Law) Fund. No SICAR
Direct Funds have been launched in 2014 and 2015. This brought the total number of REIFs surveyed to 260 vehicles, including 19 SICARs and 12 Manager-Regulated AIFs, an increase of 10% in total survey coverage compared to the last ALFI REIF survey. This is an increase of 294% of direct REIFs (excluding Manager-Regulated AIFs) surveyed since 2006 and amount to a compound annual growth rate (CAGR) of 16.45%.
Funds of REIFs present a less vigorous growth even though the growth in the new Fund of REIF launches seen during the years preceding 2011 seems to be re-emerging with 5 launches in 2014 compared to only 2 during 2013 and 1 in 2012. This brings the total number of funds analysed in this survey to 44, an increase of 10% compared to the sample size of last year’s survey.
Executive summary
Highlights Trends in direct REIFs
Approximately 43% of the surveyed funds have been set up as a “Fonds Commun de Placement” (FCP) and this usually in combination with the SIF regime. The trend toward the FCP form has continued to reverse in line with the 2014 ALFI survey compared to findings from earlier surveys, since SICAVs now account for almost the same proportion (40%), and all new launches of Direct Funds (excluding Manager-Regulated AIFs) continue to be Specialised Investment Funds. All in all, 79% of the total Direct Funds fall within the SIF regime.
In 2015 new Direct Fund launches were triggered overwhelmingly by initiators in Europe, with Benelux, French and German initiators being the most active.
Investment strategies
The most common target sector remains ‘multi-sector’ with 61% (compared to 57% in the 2014 survey). Among the sectors themselves, the category of “retail” reached the strongest preference this year with 45% of respondents indicating this as their sector of choice, compared to only 27% last year.
Geographical investment strategies focus on a single country in 40% of the funds (stable from 2014 but up from 35% and 27% in the preceding two years), which supports the trend toward simplification but also underlines the suitability of Luxembourg
investment vehicles for multi-national investments. 70% of the surveyed Direct Funds invest only in Europe, whereas 8% of funds invest only in the Asia Pacific region and 3% invest only in the Americas.
Fund structures
Though umbrella funds remain popular due to various practical and cost considerations, the trend over the last few years has been towards simplification of structures and strategies, a trend which was again in evidence in the 2015 survey.
68% of the Direct Funds have a single compartment structure, compared to 66% in the previous year. “Opportunity” (78%), “Value-Added” (69%) and “Core” funds (66%) are all mostly closed-ended, with approximately a third of “Core” and “Value-Added” funds offering some form of liquidity to investors. This reflects the inherent illiquidity of real estate as an asset class and the difficulties of achieving investor liquidity on demand.
SIFs account for all of the REIFs launched in the last 30 months (excluding Manager-Regulated AIFs) and the SIF regime is now firmly established as the favored regime for regulated REIFs and Fund of REIFs in Luxembourg. SCS/SCSp partnership legal forms are an increasing trend since the updating of the Luxembourg Partnership laws in 2013.
1 A “Manager-Regulated AIF” refers to an investment fund which is not established under a regulated fund regime in Luxembourg (e.g. SIF/SICAR), but instead is formed solely under corporate or partnership law. The manager of such a vehicle is typically themselves regulated or registered directly under the AIFMD.

2
Fund sizes and gearing
Similar to findings in previous surveys, smaller funds continue to make up the majority of direct REIFs, with 61% falling in the category of below €100 million NAV.
Overall, funds remain smaller when compared over a future horizon of several years, which aligns with the more cautious capital raising forecasts of 2015 and preceding years. The number of funds with significant gearing has increased, with a greater proportion reporting a target gearing in the 50%-60% range and the over 70% range. This could indicate optimism in relation to the ability to borrow.
Fees
In a departure to the results from recent surveys, the most commonly used basis for management fee calculations in 2015 has been the NAV, with a share of 29%, compared to GAV which stood at 28%. Half of direct REIFs charge a management fee between 0.51%-1.5%.
Investors
Investors mainly come from Europe, however a significant portion comes from the Americas, Asia and the Middle East, which confirms the global appeal of the Luxembourg fund regimes.
Luxembourg domiciled Direct Funds and Funds of REIFs are mainly used for small groups of institutional investors, with 87% having less than 25 investors – an increase of 3% compared to the last ALFI REIF survey.
Only 2% of the surveyed REIFs reported having more than 100 investors. The Direct Funds are widely distributed (but with focus on specific geographical areas), with only 26% limited to a single country, and 20% being sold in more than six countries. The largest proportion can be observed in the
category of 2-5 countries, into which 54% of funds fall. These figures confirm the attractiveness of Luxembourg REIFs to a global investor base.
Fund reporting
The proportion of funds reporting under IFRS has decreased slightly from the previous year to 40% in 2015 compared to 42% in 2014. Funds launched in the first half of 2015 mostly report under IFRS (75%), whereas funds launched in 2014 were mostly reporting under Lux GAAP (68%).
The reporting framework selected differs depending on the strategy of the fund, with 62.5% of “Core” and 71% of “Opportunity” funds opting for Lux GAAP whereas “Value-Added” funds are equally represented between IFRS and Lux GAAP.
56% of the funds reporting under IFRS make adjustments, whereas only 35% do so under Lux-GAAP. Funds of REIFs generally (83%) report under Lux-GAAP, a trend that has gained significant momentum over the past five years.
53% of the Direct Funds report a quarterly NAV, similar across all funds regardless of investment focus. Since 73% of Direct Funds are closed-ended, the reporting of a monthly NAV (12%) is mainly due to investors’ demand for performance measurement rather than unit redemption.
51% of the Direct Funds have an annual valuation with 8% requiring monthly valuations, a similar finding to the results of the previous year. Almost all of the funds use an independent appraiser, with RICS (66%) being the preferred standard.
This latest edition of the ALFI REIF survey confirms that Luxembourg remains the favored location to establish and maintain multi-national and multi-sectoral regulated REIFs, which continue to appeal to institutional investors and fund managers from around the world.
3
Introduction This year ALFI and its REIF subcommittee has entered into collaboration with EY Luxembourg in order to produce its ninth edition annual REIFs survey. The ALFI survey was conducted during the third quarters of 2015 and reflects the market composition as at the end of June 2015.
The main objective of producing this survey is to gain an understanding of market trends rather than claiming to provide complete and comprehensive data, though a significant proportion of the Luxembourg REIF market has been captured. The data sources are the depositaries that support the Direct Funds and Funds of REIFs in Luxembourg, a population that has changed and grown consistently year to year.
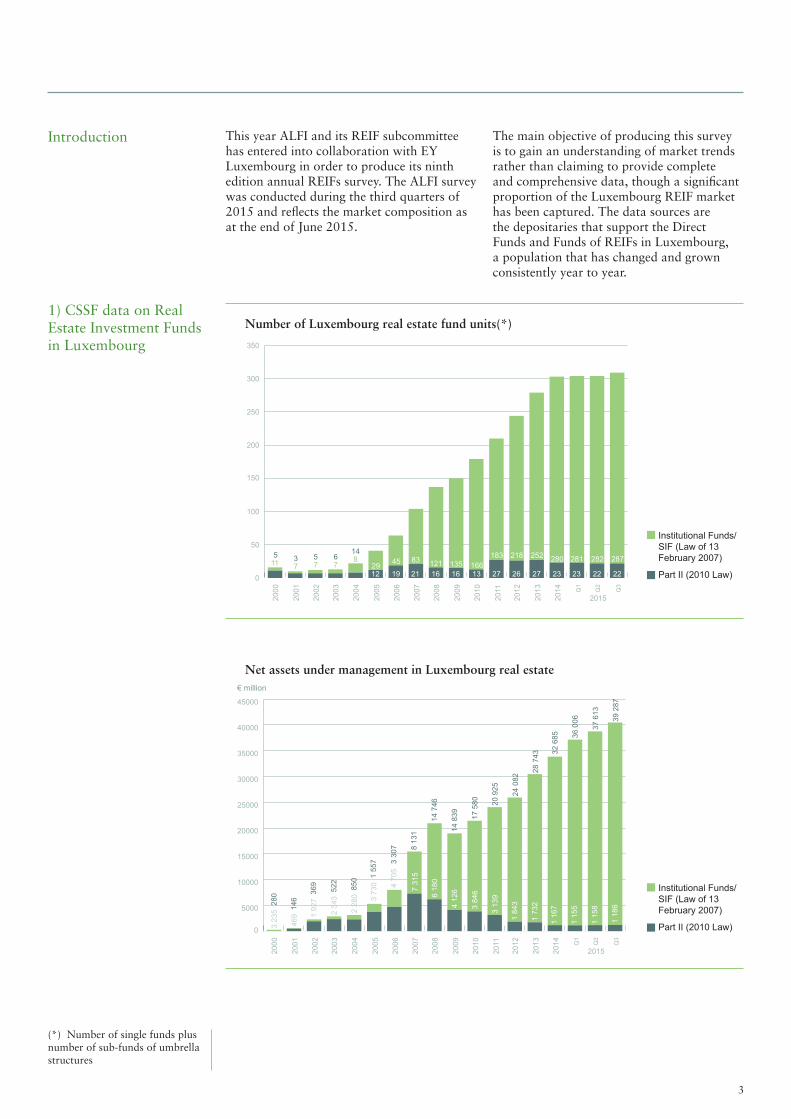
1) CSSF data on Real Estate Investment Funds in Luxembourg
0
50
100
150
200
250
300
350
287282281280252218183166135121834529
22222323272627131616211912
67
57
37
511
148
2000
2001
2002
2003
2004
2005
2006
2007
2008
2009
2010
2011
2012
2013
2014 Q
1
Q2
Q3
2015
Number of Luxembourg real estate fund units(*)
Institutional Funds/SIF (Law of 13 February 2007)
Part II (2010 Law)
0
5000
10000
15000
20000
25000
30000
35000
40000
45000
39 2
87
2000
2001
2002
2003
2004
2005
2006
2007
2008
2009
2010
2011
2012
2013
2014 Q
1
Q2
Q3
2015
37 6
13
36 0
06
32 6
85
28 7
43
24 0
82
20 9
25
17 5
80
14 8
3914 7
46
8 13
1
3 30
7
850
522
369
14628
0
1 55
7
1 18
6
1 15
8
1 15
5
1 16
7
1 73
2
1 84
3
3 13
9
3 84
6
4 12
66 18
0
7 31
5
4 70
5
2 28
0
2 34
3
1 92
7
469
3 23
5
3 73
0
Net assets under management in Luxembourg real estate
Institutional Funds/SIF (Law of 13 February 2007)
Part II (2010 Law)
(*) Number of single funds plus number of sub-funds of umbrella structures
€ million

4
2) Survey Coverage
3) Luxembourg Real Estate Funds – The framework
0
50
100
150
200
250
300
350
2005 2006 2007 2008 2009 2010 2011 2012/June 2013
2013/June 2014
2014/June 2015
Funds units
Number of fund units surveyed compared with total units as per CSSF
CSSF REIFs & Fund of REIFs (excluding SICARs)Direct REIFs (excluding SICARs)Fund of REIFs (excluding SICARs)SICARs (Direct)
As shown below, the ALFI REIF survey provides good coverage of the market compared to the CSSF data. CSSF data shows that 304 Direct REIFs and Fund of REIFs were in existence as at June 2015 while this survey collects data on 229 Direct REIFs
(excluding Manager-Regulated AIFs2) and 44 Fund of REIFs, for a total of 273 funds (90% coverage). In addition, data related to 19 SICARs and 12 Manager-Regulated AIFs are included in this survey.
3.1) Direct REIFs vs. Funds of REIFs For purposes of this survey, Real Estate Funds are characterised as either “Direct Funds” or “Funds of REIFs”:• Direct Funds include regulated fund
vehicles, Manager-Regulated AIFs and SICARs which invest in real estate assets either directly or via intermediary entities (special purpose vehicles, or SPVs).
• Funds of REIFs typically invest in other Real Estate Funds or SICARs, although other assets may also be held.
• Indirect Real Estate Funds invest in listed real estate related securities as portfolio investments; such funds are outside the scope of this survey.
3.2) Regulatory Framework: Regulated vs. Unregulated structures
Regulated structures, for the purposes of this survey, are those fund vehicles that are authorised and supervised by the Commission de Surveillance du Secteur Financier (the CSSF). The laws and regulations applicable to Luxembourg regulated funds are comprised of laws, circulars issued by the CSSF, and also certain Grand-Ducal regulations. The primary law applicable to regulated funds is the law of 17 December 2010 relating to undertakings for collective investment (UCIs), as amended (the 2010 law). Of special relevance to Real Estate Funds, the 2010 law is complemented by the law of 13 February 2007 on Specialised Investment Funds, as amended (the SIF law).
2 A “Manager-Regulated AIF” refers to an investment fund which is not established under a regulated fund regime in Luxembourg (e.g. SIF/SICAR), but instead is formed solely under corporate or partnership law. The manager of such a vehicle is typically themselves regulated or registered directly under the AIFMD.

5
Interests in funds which are subject to the 2010 law can in principle be sold to any type of investor, i.e. institutional, high net worth and retail investors. 2010 law “Part I” funds (UCITS) may take advantage of the European passport, which means that they can be sold to any type of investor in any EU Member State after complying with certain formalities. They are, however, required to comply with detailed investment restrictions. 2010 law “Part II” funds must comply with each relevant member state’s local distribution rules, and are required to comply with certain investment restrictions (much less stringent than for “Part I” funds).
Interests in funds which are subject to the SIF law may only be sold to “well-informed investors”. In addition to the usual market of institutional and professional investors, this opens SIFs to high net worth individuals who meet the requirements of the SIF law. SIFs are not subject to general investment restrictions but must ensure adequate risk diversification and disclosure; exceptions are subject to review by the CSSF on a case-by-case basis. Another useful Luxembourg vehicle is the SICAR, which is not classified as a fund. The “Société d’Investissement en Capital à Risque” is governed by the law of 15 June 2004, as amended. It is an investment vehicle tailored to qualified investors investing in venture capital and private equity. The SICAR can take various legal forms (such as the S.C.S., S.A., S.à r.l., S.C.A. or other legal structures) and, while regulated, is not subject to diversification requirements. Unregulated vehicles are typically set up as companies or partnerships under the law of 10 August 1915 on commercial companies, as amended. They often take the form of private limited companies (S.à r.l.), partnerships limited by shares (S.C.A.) or limited partnerships with/without legal personality (SCS / SCSp). When companies have as their main purpose the holding and financing of participations in other companies (which in their turn may own real estate) such companies are often referred to as “SOPARFI’s”.
SOPARFIs and limited partnerships do not enjoy a special legal or tax regime, but like any other fully taxable Luxembourg companies, SOPARFIs benefit from the participation exemption regime on qualifying participations. While unregulated vehicles operate in a manner similar to regulated
funds, unregulated vehicles offer greater flexibility, for example in terms of choice of service providers, and lower set-up and operating costs (as opposed to investment vehicles subject to regulatory oversight and restrictions). Regulated vehicles benefit, among others, from favorable tax status and a high level of investor protection. Unregulated vehicles tend to have a small group of investors and a simple capital structure. Notwithstanding the foregoing, unregulated vehicles may have a higher total size than regulated funds with more investors.
This survey takes into account Direct Funds and Funds of REIFs which are regulated by the “product” laws in Luxembourg (i.e. 2010/SIF/SICAR). Additionally, for the first time, this survey includes real estate investment structures reported by participating depositaries which are not regulated by the “product” laws but which may, nevertheless, be “Alternative Investment Funds” as defined by the Directive 2011/61/EU on alternative investment fund managers (AIFMD) and the law of 12 July 2013 on alternative investment fund managers, and which are referred to herein as “Manager-Regulated AIFs”.
3.3) Legal structures
Real Estate Funds governed by the 2010 law or the SIF law may be set up either in corporate form (e.g. “SICAV-SCA” or “SICAF-SA”), in contractual form (“FCP”) or as limited partnerships (“SCS” or “SCSp”). A key determining factor in the selection of one of these structures is the tax regime applicable to investors; FCPs and limited partnerships are tax transparent whereas SOPARFIs, SICAVs and SICAFs are opaque for tax purposes.
Regulated funds governed by the 2010 law or the SIF law as well as the SICAR law may adopt an umbrella structure with multiple sub-funds where, for instance, sub-funds have a different investment policy or are restricted to certain types of investors. The umbrella fund is legally treated as a single entity; however, in principle, each sub-fund is responsible for its own assets and liabilities.
For the purpose of this survey, reference to the number of fund “units” means the number of single funds plus the number of active sub-funds in umbrella structures.

6
4.1) Scope
The ALFI survey covers Direct REIFs, Real Estate SICARs and Funds of REIFs to which ALFI members provide depositary services. It does not cover the intermediary financing vehicles set up for the acquisition of property or similar collective investment vehicles.
4.2) Methodology
The ALFI survey is based on a comprehensive questionnaire which was sent to all ALFI members. The depositaries and administrators responding are those which service the vast majority of Direct Funds and Funds of REIFs in Luxembourg.
The questionnaire, which focused on the status as at June 2015, included questions relating to each fund’s: • Geographical investment region • Target segment of investment • Net Asset Value (NAV), Gross Asset • Value (GAV) and target gearing • Investment style • Legal regime and structure • Investor types and origin • Accounting standard (GAAP) • Fees • Distribution method • Valuation methodology • Initiator origin • Service providers including depositary,
central administration, audit, legal and tax
Where possible, survey results are at times compared with those published in Luxembourg Real Estate Funds: the ALFI REIF surveys 2007 to 2014.
4) Scope and Methodology

7
Part I - Direct real estate funds & real estate SICARs
1) Introduction The Direct Funds population surveyed continued to expand with 27 new Direct Funds launched in 2014 and a further 12 by the end of June 2015, bringing the total surveyed population to 260 Direct Funds as at 30 June 2015.
No SICAR launches were reported in 2014 nor during the first half of 2015, however 6 Manager-Regulated AIFs were launched in this period.
(*) This graph shows the launch year of fund units that are included in the REIF survey 2015. It is not a cumulative sequence.
0
5
10
15
20
25
30
35
40
<2000 2003 2004 2005 2006 2007 2008
3
1
8
24
3
2
14
2
4
128
17
22
1
15
322
6
13
20
2
1
3
2
3
2
2224
6
3 10
2009 2010 2011 2012 2013 2014 2015
Number of fund units by launch year (*)
Institutional Funds/SIF (Law of 13 February 2007) Part II (2010 Law)Manager-Regulated AIFSICAR
Institutional / SIF Funds constitute the majority of Real Estate Funds and since 2006 have accounted for almost all new fund launches. This was reinforced over the last 30 months, with almost all the new launches of
Direct Funds during this period being SIFs, with the balance largely made up of Manager-Regulated AIFs, bringing the total of SIFs to 79% of the Direct Fund population covered in this survey.
Source: ALFI survey 2015
0%
10%
20%
30%
40%
50%
60%
70%
80%
90%
100%
<2000 2003 2004 2005 2006 2007 2008
25%
11%7%
18%
100%
27%
21%
2009 2010 2011 2012 2013 2014 2015
100% 100% 55% 86% 81% 88% 71% 94% 54% 85% 78% 89% 67%
7%8%
12%8% 6%
41%
5%
12%3%
11%
11%
11%
8%
Proportion of fund types by launch year (*)
SIFSICARPart II (2010 Law)Manager-Regulated AIF
Source: ALFI survey 2015

8
Over the years, initiators from Europe were responsible for the majority of the new REIF
launches, most notably the Benelux countries, followed by Germany, the UK and France.
2) Initiator origins
3) Legal structure and regime
The majority of Real Estate Funds fall under the SIF law (79%) and most of the new Real Estate Funds launched over the last 30 months have adopted the SIF regime. This reflects the continued popularity of the SIF
regime for Real Estate Fund initiators seeking an onshore regulated investment fund vehicle for all types of alternative investment fund products (including Direct Funds and Funds of REIFs).
0%
10%
20%
30%
40%
50%
60%
70%
80%
90%
100%
<2000 2003 2004 2005 2006 2007 2008
33%
2009 2010 2011 2012 2013 2014 2015
33%
34%
100% 50%
50%
18%
9%
9%
9%
9%
18%
28%
4%21%
32%
4%10%
4%14%
4%7%
15%
25%
4%
7%
15%
11%
4%
4%15%
9%
13%
13%
4%13%
9%
4%31%
4%
7%
14%
14%
44%
21%
22%
6%
12%
5%
22%
22%
5%
6%
3%14%
8%
19%
3%
8%
40%
5%
3%3%7%
3%
7%
13%
10%
38%
16%
11%
6%
11%
11%
11%
11%
39%
11%
7%
4%7%
4%4%
22%
11%
30%
9%
55%
9%
27%
Proportion of REIFs launched by initiator origins (*)
Legal regime and vehicle type combined by launch year (*)
Australia/NZBeneluxCanadaFranceGermanyItalyMiddle EastNordic/BalticSpainSwitzerlandRussiaUKUSOther AmericasOther AsiaOther Europe
Source: ALFI survey 2015
0%
10%
20%
30%
40%
50%
60%
70%
80%
90%
100%
<2000 2003 2004 2005 2006 2007 2008
33%
2009 2010 2011 2012 2013 2014 2015
67%
100% 50%
50%
18%
18%
9%
46%
9%
3%4%4%4%
43%
3%3%
36%
11%
4%4%
7%
22%
52%
4%8%
44%
12%
32%
7%
21%
21%
30%
21%
6%
61%
22%
11%
41%
5%13%
11%
16%
11%
3%
6%
6%3%
33%
6%
31%
15%
11%
11%
28%
11%
39%
7%
4%33%
37%
4%4%7%
4%
8%
8%
17%
17%
17%
8%
25%
SIF (FCP)SIF (SICAF)SIF (SICAV - SCA)SIF (SICAV - SA)SIF (SICAV SCSp)SIF (SICAV SCS)SIF (SICAV - Sàrl)SASCASCSpSCSSICAR (SA)SICAR (Sàrl)SICAR (SCA)Part II (2010 Law) (FCP)Part II (2010 Law) (SICAV SCS)Part II (2010 Law) (SICAF)
Source: ALFI survey 2015
(*) This graph shows the launch year of fund units that are included in the REIF survey 2015. It is not a cumulative sequence.

9
111 of the 229 Direct Funds (excluding SICARs and Manager-Regulated AIFs) use the FCP as the vehicle type, usually in combination with the SIF regime. The FCP-SIF and SICAV-SIF are by far the most popular combinations of regulatory regime and fund vehicle and are roughly equally represented in the surveyed population.
The increased popularity of the SICAV-SCA and the SICAV-SA combinations over the past few years reflects the versatility of the Luxembourg environment in offering both transparent and opaque vehicles, and in supporting regulatory regimes suitable to initiators’ and investors’ requirements and may also be indicative of increased use of
Manager-Regulated AIFs, specifically in limited partnership form (at the expense of the FCP).
The most recent development in legal structuring has been the updating of the limited partnership laws in Luxembourg in 2013 (the SCS and SCSp). While these forms currently only represent 4.6% of the total population, it is expected that this proportion will grow strongly in future years. In fact, 21.05% of funds launched during the last 30 months took on an SCS/SCSp form reflecting an increase of this limited partnership form among launched funds (11% in 2013, 15% in 2014 and 50% in Q1 and Q2 2015).
SIF (2007 law) FCP 36,54%SIF (2007 law) SICAF 3,46%SIF (2007 law) SICAV - SCA 16,54%SIF (2007 law) SICAV - SA 18,46%SIF (2007 law) SICAV - SCSp 0,38%SIF (2007 law) SICAV - SCS 1,92%SIF (2007 law) SICAV - Sàrl 1,54%SICAR - SA 0,77%SICAR - Sàrl 1,15%
Source: ALFI survey 2015
Cumulative data of all surveyed funds
SICAR - SCA 5,38%SA 0,80%SCA 1,92%SCSp 0,77%SCS 1,15%Part II (2010 law) FCP 6,15%Part II (2010 law) SICAV - SCS 0,38%Part II (2010 law) SICAF 2,69%
Basic structureLegal regime
SIF (2007 law) 79%Part II (2010 law) 9%SICAR 7%Manager Regulated AIF 5%
FCP 42,7%SCA 23,8%SA 20%SICAF 6,2%SCS/SCSp 4,6%Sàrl 2,7%
Source: ALFI survey 2015 Source: ALFI survey 2015
(*) This graph shows the launch year of fund units that are included in the REIF survey 2015. It is not a cumulative sequence.

10
Source: ALFI/CSSF
CSSF Data as at30 September 2015excludes SICARs
Basic structure
Legal regime and basic structure combined
Legal regime
SIF (2007 law) / SICAV 56%SIF (2007 law) / FCP 32%Part II (2010 law) / FCP 6%SIF (2007 law) / SICAF 5%Part II (2010 law) / SICAF 1%
SIF (2007 law) 93%Part II (2010 law) 7%
SICAV 56% FCP 38%SICAF 6%
4) Fund structure 68% of the surveyed Direct Funds are single compartment vehicles. The remaining funds have a multi-compartment umbrella structure (i.e. sub-funds) which confirms the continued use of umbrella structures, despite the recent increase in single funds. 26% use the umbrella structure solely for separate investment strategies, 8% use an umbrella solely for co-investment and 8% combine both types of usage. 4% of the funds use feeder vehicles and 13% have complex
share classes so that, for example, different management and performance fee structures can be managed for different investors. Only 2% of surveyed funds use a pooling structure, possibly because in practice this is difficult to implement for Direct Funds investing in real estate assets (as opposed, for example, to equity funds). The overall trend over the last several years has been towards simplification of structures and strategies.
0%
10%
20%
30%
40%
50%
60%
70%
80%
90%
100%
Pooling FeederVehicles
Complex share classes
Single compartment
funds
Sub funds used for co-investment
& separate investment strategies
Sub funds used for separate investment
strategies only
Sub funds used for co-investment
only
2% 4% 13% 68% 8% 26% 9%98% 96%
87%
32%
92%
74%
91%
NoYes
Source: ALFI survey 2015
Source: ALFI/CSSF
Source: ALFI/CSSF
11
Core 51% Value-Added 29%Opportunity 20%
Graph includes SICARs
Source: ALFI survey 2015
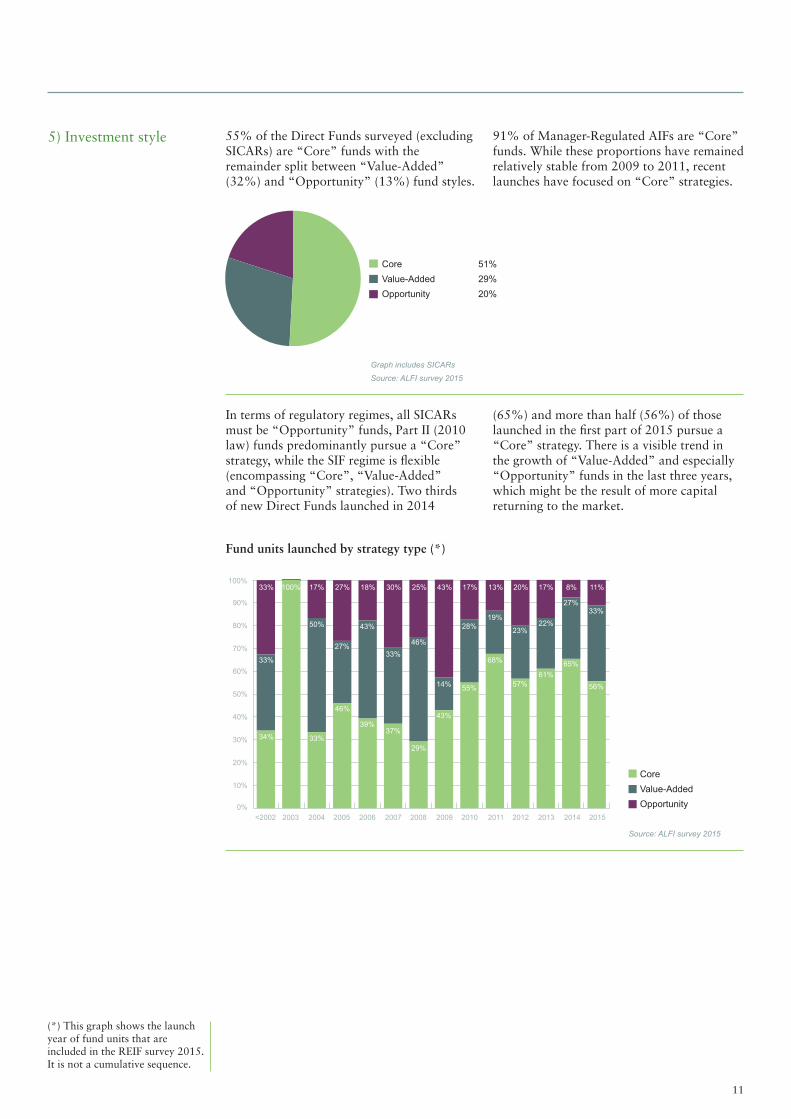
5) Investment style 55% of the Direct Funds surveyed (excluding SICARs) are “Core” funds with the remainder split between “Value-Added” (32%) and “Opportunity” (13%) fund styles.
91% of Manager-Regulated AIFs are “Core” funds. While these proportions have remained relatively stable from 2009 to 2011, recent launches have focused on “Core” strategies.
In terms of regulatory regimes, all SICARs must be “Opportunity” funds, Part II (2010 law) funds predominantly pursue a “Core” strategy, while the SIF regime is flexible (encompassing “Core”, “Value-Added” and “Opportunity” strategies). Two thirds of new Direct Funds launched in 2014
(65%) and more than half (56%) of those launched in the first part of 2015 pursue a “Core” strategy. There is a visible trend in the growth of “Value-Added” and especially “Opportunity” funds in the last three years, which might be the result of more capital returning to the market.
(*) This graph shows the launch year of fund units that are included in the REIF survey 2015. It is not a cumulative sequence.
0%
10%
20%
30%
40%
50%
60%
70%
80%
90%
<2002 2003 2004 2005 2006 2007 2008
37%
33%
33%
34%
2009 2010 2011 2012 2013 2014 2015
100% 17%
50%
33%
27%
27%
46%
18%
43%
39%
30% 25%
46%
43%
14%
17% 13% 20% 17% 8% 11%
33%
29%
43%
55%
28%
100%
68%
19%
57%
23%
61%
22%
65%
27%
56%
33%
Fund units launched by strategy type (*)
Core Value-AddedOpportunity
Source: ALFI survey 2015
12
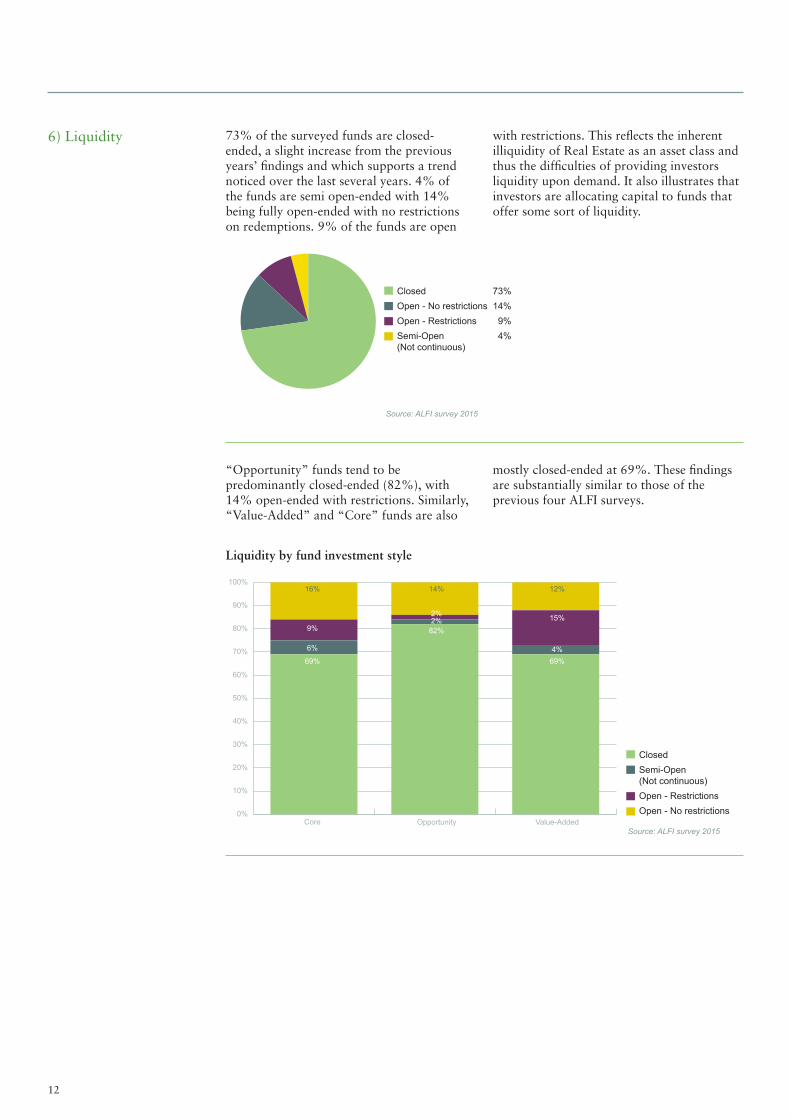
6) Liquidity 73% of the surveyed funds are closed-ended, a slight increase from the previous years’ findings and which supports a trend noticed over the last several years. 4% of the funds are semi open-ended with 14% being fully open-ended with no restrictions on redemptions. 9% of the funds are open
with restrictions. This reflects the inherent illiquidity of Real Estate as an asset class and thus the difficulties of providing investors liquidity upon demand. It also illustrates that investors are allocating capital to funds that offer some sort of liquidity.
Closed 73%Open - No restrictions 14%Open - Restrictions 9%Semi-Open 4% (Not continuous)
Source: ALFI survey 2015
“Opportunity” funds tend to be predominantly closed-ended (82%), with 14% open-ended with restrictions. Similarly, “Value-Added” and “Core” funds are also
mostly closed-ended at 69%. These findings are substantially similar to those of the previous four ALFI surveys.
0%
10%
20%
30%
40%
50%
60%
70%
80%
90%
100%
Core Opportunity Value-Added
16% 12%
15%
4%69%
14%
9% 82%2%
6%
69%
2%
Liquidity by fund investment style
ClosedSemi-Open (Not continuous) Open - RestrictionsOpen - No restrictions Source: ALFI survey 2015

13
7) Term
Nearly half of all Direct Funds have a term of 8-10 years or 11-15 years, while a further 42% have an infinite life. Only 11% have a duration of up to 7 years, which reflects the longer timeframe usually required for Real Estate Funds to fully implement their strategies. 21% of “Opportunity” funds
have a life of 8-10 years, down from 33% and 26% respectively in the 2013 and 2014 ALFI surveys. This shows a trend towards longer terms across all strategies, with 35% of “Opportunity” funds, 33% of ”Value-Added” funds and 49% of “Core” funds now having an infinite term.
Infinite 42%11-15 years 24%8-10 years 23%Up to 7 years 11%
Source: ALFI survey 2015
Term of direct real estate funds
0%
10%
20%
30%
40%
50%
60%
70%
80%
90%
100%
Core Opportunity Value-Added
49% 33%
16%
29%
22%
35%
25%
19%
21%
20%
6%
25%
Fund duration by investment style
Up to 7 years8 - 10 years11 - 15 yearsInfinite
Source: ALFI survey 2015

14
8) Geographical focus of fund investments
In the 2015 ALFI survey, 40% of Direct Funds have a single-country investment focus which points to a stabilizing trend following consistent increases identified in the 2011 to 2014 ALFI surveys (25%, 27%, 35% and 41% respectively). 57% of the funds invest only in the EU-28. 9 funds invest only in the
Americas and 20 funds in the Asia / Pacific region. Finally, 51 funds invest in 2 or more world regions, reflecting the suitability of Luxembourg REIFs for investment strategies focusing on a range of different countries. Luxembourg REIFs are used for investment in all major regions of the world.
(*) This chart is not cumulative, but shows the total number of funds by the year of launch.
Exclusive data: Each fund falls into one category. Percentages based on the responses received
Non-exclusive data, i.e. funds can cover one or several regions shown. The purpose of the graph is to highlight changes in strategy over time.
EU-28 Only 57%Multiple regions 19%Asia/Pacificonly 8%EU-28 + EFTA Only 8%EU-28 + other EuropeOnly 5%Americas only 3%
Source: ALFI survey 2015
REIFs investment regions
0%
10%
20%
30%
40%
50%
60%
70%
80%
90%
<2000 2003 2004 2005 2006 2007 2008
63%
25%
75%
2009 2010 2011 2012 2013 2014 2015
100% 13%
13%
13%
61%
8%
92%
5%5%
5%
19%
66%
8%3%
5%2%
15%
10%
10%
12%
9%
4%4%
17%
9%
6%2%4% 12%
3% 6% 7% 20%
5%
16%5%
46%
57%
42%
14%
9%
9%
14%
6%
100%
72%
12%
4%4%
60%
20%
5% 16%
6%
44%50%
16%6%
6%
11%
3%
7%
11%
11%
20%
40%
20%
2%
EU - 28Other EuropeEFTA (non EU)Asia/PacificAmerica - NorthAmerica - Central/South & OtherMiddle East, North Africa & other Africa
Source: ALFI survey 2015
Geographical focus of funds investments by fund unit launch year (*)

15
9) Target sectors The 2015 survey revealed a slight increase in the proportion of funds investing in multiple sectors, which came to 61%.This indicated
that a larger proportion of the surveyed funds have a diversified investment strategy in terms of property types.
The preferred target sectors in 2014 fund launches were office (27%), retail (27%) and residential (25%). The first half of 2015
indicates an increase of retail fund launches to 45%.
Exclusive data: Each fund falls into one category. Percentages based on the responses received.
Multi sector 61%Retail only 14%Other Single Specialist 6%Residential only 5%Industrial only 5%Officeonly 4%All sector 3%Hospitality only 2%
Source: ALFI survey 2015
Non-exclusive data, i.e. funds can cover one or several regions shown. The purpose of the graph is to highlight changes in strategy over time.
0%
10%
20%
30%
40%
50%
60%
70%
80%
90%
<2000 2003 2004 2005 2006 2007 2008
30%
32%
27%
14%
43%
14%
29%
2009 2010 2011 2012 2013 2014 2015
7%
7%
27%
6%
18%
12%
23%
41%
5%3%
32%
32%
16%
12%
4%8%
16%
19%
31%
22%
13%30%3%
15%
3%
25%5%
20%
2%
6%
15%
5%
14% 7% 25%
37%
20%
30%
22% 22%
25%
21%
13%
29%
33%2%
100%
21%
26%
23%
9%27%
24%
22%
8%9%
27%
27%
25%5%
10%
45%
20%
OfficeRetailIndustrialResidentialInfrastructureHospitality
Source: ALFI survey 2015
Target sector by fund unit launch year

16
10) Net Asset Value (NAV) distribution
These charts show a comparison of average NAVs reported in the 10 years of the ALFI REIF survey to date. The forecasted Target NAV averages of the survey populations illustrate the continued decrease in the average fund size, with the median moving from the 200-400 million euros band in 2009
target NAV results to the 100-200 million euros band in the following surveys, reflecting a continued trend toward the creation of many smaller funds and further impacted by the fact that many larger funds have come to the end of their terms.
0%
10%
20%
30%
40%
50%
60%
70%
80%
90%
2006 2007 2008 2009 2010
52%
13%
15%
26%
44%
2011 20132012 2014 June 2015
4%1%2%
8%
18%
48%
1%1% 1%
1%1%
8%
49%
20%
21%
6%
27%
16%
50%
3%5% 5%
15%
2%
20%
1%
13%
0,5%2%
7%3%
22%
18%
57% 56%
18%
16%
8% 8%100%
17%
60%
18%
61%
11%
7%
18%
10%
61%
21%
1%0,5%0,5% 0,5%
0,5%0,5%
<100100-200200-400400-800800-12001200-1800over 1800
Source: ALFI survey 2015
NAV distribution
Non-exclusive data, i.e. funds can cover one or several regions shown. The purpose of the graph is to highlight changes in strategy over time.
1%
0%
10%
20%
30%
40%
50%
60%
70%
80%
90%
2%2%
28%2%2%
4%4%
1%1%
15%
3%1%
12%3%1%
10%
19%
2%2%
7%
18%
23%
47%
22%
45%
4%2%
14%2%4%
9%
1%3%
9%
21%
18%
48%
22%
24%
39%
21%
23%
36%
27%
25%
32%
19%
30%
30%
16%
25%
21%
30%
39%
18%
11%
100%
2009 2010 2011 2012 2013 2014 20162015 2017
Target NAV
Source: ALFI survey 2015
€ million
€ million
<100100-200200-400400-800800-12001200-1800over 1800

17
The results show a decrease in the under 100 million GAV distribution band in 2014
with 42% of the funds (versus 46% in 2013) falling in this category.
11) Gross Asset Value (GAV) distribution
There has been, however, a rise for the GAV in the 800-1200 and 1200-1800 million categories from 3% to 5% and 1% to 2% respectively (from 2013 to 2014), showing optimism in relation to the availability of financing.
The largest drop in the Target GAV can be seen in the 400-800 million euros band to lower amounts, confirming recent trends towards smaller funds.
1%
0%
10%
20%
30%
40%
50%
60%
70%
80%
90%
2%2%
6%2%2%
2%2%
11% 8%3%
2%1%
15%
2%
5%15%
17%
18%
42%
16%
46%
17%
2%
3%
5% 4%3%
1%1%
16%4%
23%
15%
40%
15%
21%
42%
13%
19%
21%
37%
13%17%
21%
35%
18%
2%2%
6%
17%
21%
35%
14%
18%
15%
36%
16%
13%
27%
23%
27%
100%
2006 2007 2008 2009 2010 2011 20132012 2014
2%
0%
10%
20%
30%
40%
50%
60%
70%
80%
90%
7%
16%
7%
10% 6%
7%13%
11%
2%4%
5%3%3%
6%15%
17%
35%
21%
22%
32%
20%
15%
4%5% 5%
4%
4%
7%2%
24%
17%
28%
18%
5%
23%
17%
27%
19%
6%
24%
20%
21%
20%
23%
26%
18%
13%
26%
4%7%
9%
21%
15%
14%
9%
12%
10%
13%
33%33%
21%
9%
7%
100%
2009 2010 2011 2012 2013 2014 20162015 2017
Source: ALFI survey 2015
Source: ALFI survey 2015
GAV distribution
Target GAV
In this section, graphs exclude the funds that did not provide NAV/GAV figures.
€ million
€ million
<100100-200200-400400-800800-12001200-1800over 1800
<100100-200200-400400-800800-12001200-1800over 1800

18
12) Target Gearing of Funds
The most notable rises in target gearing were in the categories of 50%-60% and over 70%, where a rise from 18% to 23% and 17% to
21% can be observed. 20% of funds report target gearing of less than 20%.
13) Fees
28% of the surveyed Direct Funds use GAV as the basis for their management fee calculation, almost the same as the findings in the 2014 ALFI survey and slightly lower than the corresponding results of the 2010
to 2013 ALFI surveys. The majority of the funds which charge fees based on GAV charge in the 0.51%-1% range (33%), followed by 0%-0.51% (26%).
0%
10%
20%
30%
40%
50%
60%
70%
80%
90%
8%
28%
12% 9%
29%27%
17% 21%
7%
23%
3%10%
20%
16%
18%
7%
12%
11%
18%
17%
15% 20% 15%
13%
28%
8%
20%
3%
13%
31%
13%
7%2%6%
21%20%
4%2%9%
19%
31%26%
21%
31%
2%
10%
28%
10%
3%
33%
3%
26%
1%
29%15%
41%
5%3%
100%
2009 2010 2011 2012 2013 2014 20162015 2017
Less than 20%20%-30%30%-40%40%-50%50%-60%60%-70%over 70%
Source: ALFI survey 2015
Target gearing of funds
NAV 29%GAV 28%Other 25%Commitments 11%No data available 6%None 1%
Management fee calculation basis for direct real estate funds
0.51% - 1% 33%0% - 0.5% 26%1.01% - 1.5% 17%>1.5% 17%No data available 6%None 1%
Management fee range for Direct REIFs
Source: ALFI survey 2015 Source: ALFI survey 2015

19
Almost half of the surveyed Direct Funds do not levy a performance fee. For the funds charging performance fees, approximately 50% charge a fee of 20%. Out of these funds, 45% of “Core” funds and 32% of
“Opportunity” funds charge 20% while 76% of the “Value-Added” funds (up from 59% last year) reported a payout rate of 20%, indicating that this remains the market standard.
0%
10%
20%
30%
40%
50%
60%
70%
80%
90%
100%
Core Opportunity Value-Added
60% 48%
40%
9%3%
27%
8%
23%
27%
14%
18%
23%
20%<20%>20%None
Source: ALFI survey 2015
Performance fee charged
14) Number of investors
The ALFI survey results show that Direct Funds typically do not have a large number of investors. Approximately 87% of the Direct Funds have fewer than 25 investors and 37% have 5 investors or less, while only 2% have more than 100 investors. This reflects the fact that the majority of investors in such funds are institutional and thus, inherently, there tends to be a smaller number of investors per fund. Only 13% of funds (down from 14% in 2014 and 17% in 2013 surveys) have more than 25 investors. This continues the trend toward a larger number of smaller funds, with a smaller number of investors per fund.
6 - 25 investors 50%1 - 5 investors 37%26 - 100 investors 11%101 + investors 2%
Source: ALFI survey 2015

20
15) Type of investors Virtually all of the funds surveyed have institutional investors (90%), with “high net worth individuals” (HNWI) investing in 31% of the funds (up from 30% in 2014 and 26% in 2013). Retail investors have invested in 7% of the funds (down from 9% in 2014 and 11% in 2013). Institutional and HNW
individuals continue to represent the majority of investors in REIFs of all sizes, while the gradual decrease in the proportion of retail investors continues to be observed, this has been compensated by a similar increase of HNWI investors.
Non-exclusive data: Investor groups may be identified by fund. Percentages based on the received responses.
0%
10%
20%
30%
40%
50%
60%
70%
80%
90%
100%
Institutional HNW Individuals Private Bank Family Office Retail
7%
90%
20% 18%
31%
Source: ALFI survey 2015
% of fund units allowing specific investor groups
0%
10%
20%
30%
40%
50%
60%
70%
80%
90%
100%
1 - 5 6 - 25 25 - 100 101 +
14%14%
23%82%2%
21%
14%
28%
2%
2%
10%
12%
56%
20%5%
12%
16%
48%
19%
3%
5%4%
72%
16%
Institutional Private BankFamilyOfficeHNW IndividualsRetail
Source: ALFI survey 2015
Number of investors by type of investor

21
16) Investor origins The majority of investors continue to be from Europe. However, there are also significant numbers from the Americas (60 funds), the Asia/Pacific region (27 funds) and the Middle East (24 funds). 54% (compared to 49% last year) of the surveyed funds have investors from two to
five countries and 17% have investors from 6 to 10 countries, which again highlights the success of the SIF regime as a global investment offering. The expectation is that cross-border marketing under the AIFMD will further expand the reach of Luxembourg Real Estate Funds and it will be interesting to note these results over the coming years.
The 2015 ALFI survey again confirms the notable increase (identified in the 2012, 2013 and 2014 ALFI surveys) of funds targeted for
distribution in 2-5 countries, compared to the results from 2009-2011.
2 - 5 countries 54% 1 country 26%6 - 10 countries 17%11 + countries 3%
0%
10%
20%
30%
40%
50%
60%
70%
80%
90%
<2000 2003 2004 2005 2006 2007 2008
4%7%
36%
9%
33%
33%
34%
64%
14%
2009 2010 2011 2012 2013 2014 2015
100% 50%
17%
17%
16%
27% 39% 11% 12% 57% 19% 9% 13% 14% 23% 100%
7%
78%
36%
52%
29%
19%
62%
48%
43%
30%
57%
14%
72%
32%
45%
100%
18%6 - 10 countries2 - 5 11 +1
Source: ALFI survey 2015
Number of investor countries by launch year (*)
17) Accounting standards In confirmation of the results of the 2014 Alfi survey, 60% of all of the surveyed funds apply standard Luxembourg GAAP (Lux GAAP) as accounting standard, with the remainder applying IFRS. The reporting framework selected does differ depending on the strategy of the fund, with 62% of Core and 71% of Opportunity funds opt for Lux GAAP whereas Value-Added funds are equally represented between IFRS & Lux GAAP.
Lux GAAP 60%IFRS 40%
Number of investor countries
Source: ALFI survey 2015
(*) This graph shows the launch year of fund units that are included in the REIF survey 2015. It is not a cumulative sequence.
Source: ALFI survey 2015

22
56% of the funds reporting under IFRS make adjustments, whereas only 35% do so under Lux-GAAP. 49% of the funds preparing their financial statements under IFRS make adjustments with regard to deferred taxation,
compared with only 14% under Lux GAAP. Additionally, 40% of funds reporting under IFRS make adjustments for transaction costs compared to 27% under Lux GAAP (25% in the 2013 and 39% in the 2014 ALFI survey).
From 2006 to 2008, IFRS was the preferred standard. However, from 2009 until 2014
Lux GAAP became the dominant accounting standard.
0%
10%
20%
30%
40%
50%
60%
70%
80%
90%
<2000 2003 2004 2005 2006 2007 2008
52%
67%
33%
2009 2010 2011 2012 2013 2014 2015
100% 33%
67%
82%
18%
46%
54%
48% 48% 71% 56% 71% 76% 62% 68% 25%
52%
29%
44%
100%
29%24%
38%
32%
75%
IFRSLux GAAP
Source: ALFI survey 2015
GAAP adopted by new fund unit launches
0%
10%
20%
30%
40%
50%
Formationexpenses
Transactions costs
Deferred taxation
Fair value of financial
instruments
Other adjustments
19%
39%
14%
49%
27%
33%
40%
22%
3% 3%IFRS Lux GAAP
Source: ALFI survey 2015
IFRS fund units and LUX GAAP fund units adjusting for various items

23
18) Frequency of NAV calculation
The majority of Direct Funds report a quarterly NAV Calculation NAV (53%), similar across all fund types (i.e. “Core”, “Value-Added” and “Opportunity”), while 12% produce a monthly NAV. Among all the funds surveyed, only 3 funds have a daily NAV.
Since 73% of funds are closed-ended, the reporting of quarterly NAV is more likely due to investor demand for performance measurement rather than for the purposes
of pricing the issue and redemption of units. Almost all of the surveyed funds use an independent appraiser in respect of their valuations.
Quarterly 53%Annual 25%Monthly 12%Semi-Annual 9%Daily 1%
0%
10%
20%
30%
40%
50%
60%
70%
80%
90%
100%
Core Opportunity Value-Added
13% 7%
70%
8%
15%
6%
48%
17%
17%
43%
6%
33%
17%
AnnualSemi-AnnualQuarterlyMonthlyDaily
Source: ALFI survey 2015
Frequency of reporting by investment strategy
Similarly to the findings of the last several surveys, the frequency of property valuations correlates with the frequency of reporting of NAVs. It is more balanced for quarterly and monthly NAVs.
Annual 51%Quarterly 25%Semi-Annual 14%Monthly 8%Other 1%None 1%
Direct real estate funds valuations
Source: ALFI survey 2015
Source: ALFI survey 2015

24
Two-thirds of the Direct Funds’ valuations are carried out under RICS Valuation and Appraisal Standards. This is by far the leading standard for property valuations used, though the proportion has continued to shrink over recent years (68% in the 2014 survey and 73% in the 2013 survey).
19) Valuation standards
20) Stock Exchange listing
Out of the 260 Direct Funds covered in this survey, only 21 (8%) are listed, mainly on the
London Stock Exchange or the Luxembourg Stock Exchange (Lux MTF).
21) Currency The great majority of funds report in EUR (84%), while 8% report in USD and 4% in GBP, both slightly up from recent results.
0%
10%
20%
30%
40%
50%
60%
70%
80%
90%
100%
Annual Semi-Annual Quaterly Monthly Other
100%
12%
39%
48%
1%
7%
39%
54%81%
19%
100%
AnnualSemi-AnnualMonthly Quarterly
Source: ALFI survey 2015
Source: ALFI survey 2015
Frequency of property valuation by frequency of NAV calculation
RICS 66%Other 27%None 4%TEGOVA 2%ISVC 1%
Valuation standards adopted
EUR 84%USD 8%GBP 4%Other 4%
Source: ALFI survey 2015

25
Benelux 20%Germany 15%Other Europe 14%UK 13%USA 10%France 8%
Switzerland 7%Other Americas 6%Nordic/Baltic 5%Asia, Australia&NZ 2%
UK 32%Germany 30%Benelux 16%France 9%
Switzerland 5%Nordic/Baltic 4%Other Europe 4%
Part II - Funds of Real Estate Investment Funds
1) Introduction The first Fund of REIFs was launched in Luxembourg in 2005, more than five years after the launch of the first Direct REIF.
Given the small number of Funds of REIFs operational in Luxembourg at the end of 2006, these funds were not covered prior to the 2008 ALFI survey, but have been covered
each year since. 57% of Funds of REIFs were launched before 2010. Since then, 19 funds have been launched, mainly in 2010, 2011 and 2014 (6, 5 and 5 respectively). This brings the total number of Funds of REIFs covered by this survey to 44, out of which 42 were launched as SIFs.
2) Initiator origins
(*) The chart shows the details for Funds of REIFs only. This chart is not cumulative, but shows the total number of funds per year of launch.
Out of a broad range of initiators across Europe, UK and German initiators have been the most prolific since 2006, accounting for 62% of the new REIF FoFs launches over the period 2005-2014.
Germany and the UK hold more important stakes as origins of initiators for Funds of REIFs than for direct REIFs whereas the opposite is the case for Benelux.
Valuation standards adopted
0%
10%
20%
30%
40%
50%
60%
70%
80%
90%
100%
2005 2006 2007 2008 2009 2010 2011 2012 2013 2014
20%100% 11%
80%
89%
100% 100% 100% 100% 100% 100%100%
SIFsPart II (2010 Law)
Source: ALFI survey 2015
FoREIF units by launch year (*)
Origins of initiators of direct real estate funds
Origins of initiators of funds of real estate funds
Source: ALFI survey 2015
Source: ALFI survey 2015

26
3) Legal structure and regime
As reflected in last year’s survey, only 2 out of 44 Funds of REIFs are Part II (2010 law) funds. As already mentioned before, all of the funds launched from 2009 to 2014 have been SIFs.
With regard to the legal structure of the funds over the years, the FCP structure remains the preferred option over the SICAV structure (25 vs. 19). The FCP structure was chosen for 57% of the funds surveyed. While FCPs still constitute a small majority in overall REIF FoFs, SICAVs are equally represented since 2007 and the 5 new funds launched in 2014 were SICAVs.
0%
10%
20%
30%
40%
50%
60%
70%
80%
90%
100%
2005 2006 2007 2008 2009 2010 2011 2012 2013 2014
20%100% 89%
20%
60%
11%
38%
12%
50%
50%
50%
33%
17%
33%
17%
40%
40%
20%
100% 20%
20%
20%
40%
50%
50%
GermanyNordic/BalticUKBeneluxSwitzerlandOther EuropeFrance
Source: ALFI survey 2015
Origin of initiators by fund unit launch year (*)
SIF (FCP) 52%SIF (SICAV - SA) 30%SIF (SICAV - SCA) 11%Part II (2010 Law) (FCP) 5%SIF (SICAV - SCS) 2%
Legal structure and regime combined
(*) The chart shows the details for Funds of REIFs only. This chart is not cumulative, but shows the total number of funds per year of launch.
Source: ALFI survey 2015

27
4) Investment style 86% of Funds of REIFs covered by this survey are classified as either “Core” funds (23) or Value-Added” funds (14). There are 6
“Opportunity” Funds of REIFs. Since 2010, “Core” funds are the predominant investment style of the launched funds.
5) Liquidity Overall, the majority of Funds of REIFs (71%) are closed-ended. “Open-ended Funds of REIFs with restrictions” and “Open- ended Funds of REIFs with no restrictions” hold a smaller stake with 11% and 18% respectively. “Open-ended with no restrictions” funds are mainly chosen
by “Core” funds, whereas the two other categories show a more balanced figure. Out of “Core” funds, 65% are closed-ended while for “Value-Added” funds, 83% are closed-ended. These findings are in line with previous years surveys.
Legal structure and regime combined
0%
10%
20%
30%
40%
50%
60%
70%
80%
90%
100%
2005 2006 2007 2008 2009 2010 2011 2012 2013 2014
60%100% 78%
40%
22%
50%
50%
50%
50%
33%
17%
50%
20%
80%
100% 100%50%
50%
CoreValue-AddedOpportunity
Source: ALFI survey 2015
Investment style by launch year
0%
10%
20%
30%
40%
50%
60%
70%
80%
90%
100%
2005 2006 2007 2008 2009 2010 2011 2012 2013 2014
40%
20%
100% 11%
11%
40%
78%
100% 100% 25%
75%
20%
80%
100% 100%50%
50%
Open vs. Closed-ended funds by launch year (*)
(*) The chart shows the details for Funds of REIFs only. This chart is not cumulative, but shows the total number of funds per year of launch.
ClosedOpen - No RestrictionsOpen - Restrictions
Source: ALFI survey 2015

28
0%
10%
20%
30%
40%
50%
60%
70%
80%
90%
100%
Closed Open - No Restrictions Open - Restrictions
37%
15%
25%
50%
25%
14%
48%
86%
CoreOpportunityValue-Added
Source: ALFI survey 2015
Fund investment style by liquidity
0%
10%
20%
30%
40%
50%
60%
70%
80%
90%
100%
Core Opportunity Value-Added
5%30%
8%
8%
84%
33%
65% 67%
ClosedOpen - No RestrictionsOpen - Restrictions
Source: ALFI survey 2015
Liquidity by fund investment style
Closed 71%Open - No Restrictions 18%Open - Restrictions 11%
Source: ALFI survey 2015

29
6) Term A similar portion of Funds of REIFs are represented in the 11-15 year term and the infinite life categories. “Opportunity” and “Value-Added” funds make up a major part of 8-10 years and infinite term categories. 70% of the “Core” funds have an 11-15 year term whereas 93% of “Value-Added” funds have an infinite term. Only 4 funds are represented in the 8-10 year category.
7) Geographical focus of fund investment
Among the surveyed funds of REIFs, 72% invest in one region only. While for many years, the regional focus of investments often varied from one fund to another, recent launches focused mainly on the 28 EU member states (39%). No fund invested in all the regions proposed by the survey.
(*) “Multiple regions” represents fund units investing in more than one region.
Infinite 47%11-15 years 40%8 - 10 years 10%Up to 7 years 3%
Fund duration
0%
10%
20%
30%
40%
50%
60%
70%
80%
90%
100%
11 -15 years 8 - 10 years Infinite Up to 7 years
13%
87%
25%
50%
25%
68%
11%
21%
100%
Fund unit duration by investment style (*)
EU 28 Only 39%Multiple regions 28%Asia/Pacificonly16%All Europe only 14%Americas only 3%
Geographical focus of investments (*)
Source: ALFI survey 2015
CoreOpportunityValue-Added
Source: ALFI survey 2015
Source: ALFI survey 2015
(*) The chart shows the details for Funds of REIFs only. This chart is not cumulative, but shows the total number of funds per year of launch.

30
(*) The chart shows the details for Funds of REIFs only. This chart is not cumulative, but shows the total number of funds by the year of launch.
As was the case with the 2014 ALFI survey, almost all of the Funds of REIFs follow a multi-sector investment strategy. The office, retail, residential and industrial sectors
remain the most popular ones. Only 2 funds invested in one sector only, namely in the retail sector.
Exclusive data: Each fund falls into only one category
8) Target sectors
0%
10%
20%
30%
40%
50%
60%
70%
80%
90%
100%
2005 2006 2007 2008 2009 2010 2011 2012 2013 2014
13%
13%
21%
13%
100% 7%
21%
13%
27%
7%
21%
44%
10%
20%
20%
20%
30%
33%
33%
34%
67%
33%
13%
13%
13%
13%
48%
100% 100%100%
EU 28EFTA (non EU) Other EuropeAsia/PacificAmerica - NorthAmerica - Central/South
Source: ALFI survey 2015
Geographical investment region by fund unit by launch year (*)
Multi sector 95%Retail only 5%
Office/retail/residential/industrial 37%Other 25%Officeretail 10%All sectors 8%Office/retail/residential/industrial 7%Office/retail/residential 5%Office/retail/industrial/infrastructure 5%Office/retail/industrial 3%
0%
10%
20%
30%
40%
50%
60%
70%
80%
90%
100%
2005 2006 2007 2008 2009 2010 2011 2012 2013 2014
13%
13%
7%
13%
27%
100% 21%
5%
27%
3%5%23%
23%
20%
18%
24%
6%3%3%
24%
22%
20%
20%
20%
40%
24%
18%
29%
29%
22%
9%
5%5%
15%
22%
22%
50%
50%
25%
25%
33%
17%
22%
11%
11%
12%
22%
22%
OfficeRetailIndustrialInfrastructureHospitalityOtherResidential
Source: ALFI survey 2015
Target sector by fund unit launch year (*)
(*) The chart shows the details for Funds of REIFs only. This chart is not cumulative, but shows the total number of funds by the year of launch.
Non-exclusive data, i.e. funds can cover one or several regions shown. The purpose of the graph is to highlight changes in strategy over time.
Non-exclusive data, i.e. funds can cover one or several regions shown. The purpose of the graph is to highlight changes in strategy over time.
Source: ALFI survey 2015

31
9) Net Asset Value (NAV) The 44 Luxembourg domiciled Funds of REIFs represented a total NAV of 4.8 billion euros at the end of June 2015, compared to 4.4 billion euros end of 2013. The average NAV at June 2015 was 113 million
euros, ranging from 0.85 million euros to 525 million euros. 28 out of the 44 funds surveyed have a NAV below 100 million euros, in line with findings of 2014.
(*) If the information on the NAV was not available for end of June 2015, the data of the 31/12/2014 has been used.
10) 2016 target NAV distribution
The received information regarding the target NAV is, unfortunately, not reliable.
11) Fees
51% of the Funds of REIFs covered in this survey base their management fee on the NAV, similar to the findings of the preceding surveys. In 2015, commitments were only used in 11% of cases to compute management fees whereas in 2014, the approach based on commitments accounted for 24%. GAV is the basis for management fees for 22% of the funds, while a further
16% use “other” criteria. 14% of the Funds of REIFs surveyed charge a management fee in the mid-range of 0.51%-1%. For 56% of the Funds of REIFs the management fee is charged up to 0.5%. Compared to last year’s survey, the share of the 0.51%-1.0% range decreased from 29% to 14%, while the range of 0-0.5% increased from 45% to 56%.
0
5
10
15
20
25
30
<100 millions 100-200 millions 200-400 millions 400-800 millions
End of June 2015 NAV distribution (*)
NAV 51%GAV 22%Other 16%Commitments 11%
FoREIF Management fee basis
0%-0.5% 56%>1.5% 19%0.51%-1.0% 14%1.01%-1.5% 8%up to 1.5% 3%
FoREIF Management fee range
Source: ALFI survey 2015 Source: ALFI survey 2015
Source: ALFI survey 2015

32
35% of funds charge performance fees. 14% of the Funds of REIFs employ a hurdle rate.
0%
10%
20%
30%
40%
50%
60%
70%
80%
90%
100%
Core Opportunity Value-Added
85% 25%
20%
80%
5%5%5%
75%
20%<20%>20%None
Source: ALFI survey 2015
Performance fee charged
0%
10%
20%
30%
40%
50%
60%
70%
80%
90%
100%
Core Opportunity Value-Added
90% 82%
20%
80%
5%5%
9%
9%
5%-8%9%-12%None
Source: ALFI survey 2015
Performance fee hurdle rate

33
12) Type of investors A major part of Funds of REIFs covered in this survey is limited to institutional investors (26). 1 fund is open to family offices only, as was the case for last year’s survey. All other funds are open to institutional investors as well as other types of investors.
45% of the funds surveyed have between 6 and 25 investors, while 40% have 1 to 5 investors per fund. With regard to the number
of investors for the different investment styles, the majority of “Value-Added” funds is represented in the “6 to 25 investors” category, whereas the “Core” funds have nearly all their funds split between the “1 to 5” and the “6 to 25” investors categories. The “Opportunity” funds fall mainly into the “25 to 100 investors” category. Overall, 86% of the Funds of REIFs have between 1 and 25 investors.
Source: ALFI survey 2015
Institutional Only 60%Institutional&PrivateBank&FamilyOffice 19%Institutional&PrivateBank&HNWI&FamilyOffice 5%Institutional & Retail 5%Institutional & Private Bank 5%Institutional & Private Bank & HNWI & Retail 2%Institutional&PrivateBank&HNWI&FamilyOffice&Retail 2%FamilyOfficeonly 2%
Types of Fund of REIFs investors
0%
10%
20%
30%
40%
50%
60%
70%
80%
90%
100%
2005 2006 2007 2008 2009 2010 2011 2012 2013 2014
20%
20%
20%
100% 22%
40%
78%
50%
50%
50%
50%
17%
33%
50%
40%
60%
100% 67%
33%
100%
1 - 56 - 2526 - 100101+
Source: ALFI survey 2015
Number of investors by fund launch year

34
13) Accounting standards
83% of the Funds of REIFs surveyed report under Luxembourg-GAAP, whereas for Direct REIFs, this split is more evenly balanced.
14) Currency As is the case for Direct REIFs, the euro is the most common currency (37 funds).
Lux GAAP 83%IFRS 17%
0%
10%
20%
30%
40%
50%
60%
70%
80%
90%
100%
2005 2006 2007 2008 2009 2010 2011 2012 2013 2014
100%100% 100% 63%
37%
100% 100% 40%
60%
100% 100%100%
Lux GAAPIFRS
Source: ALFI survey 2015
Accounting standard by launch year
EUR 86%USD 7%Other 7%
Source: ALFI survey 2015
Source: ALFI survey 2015
35
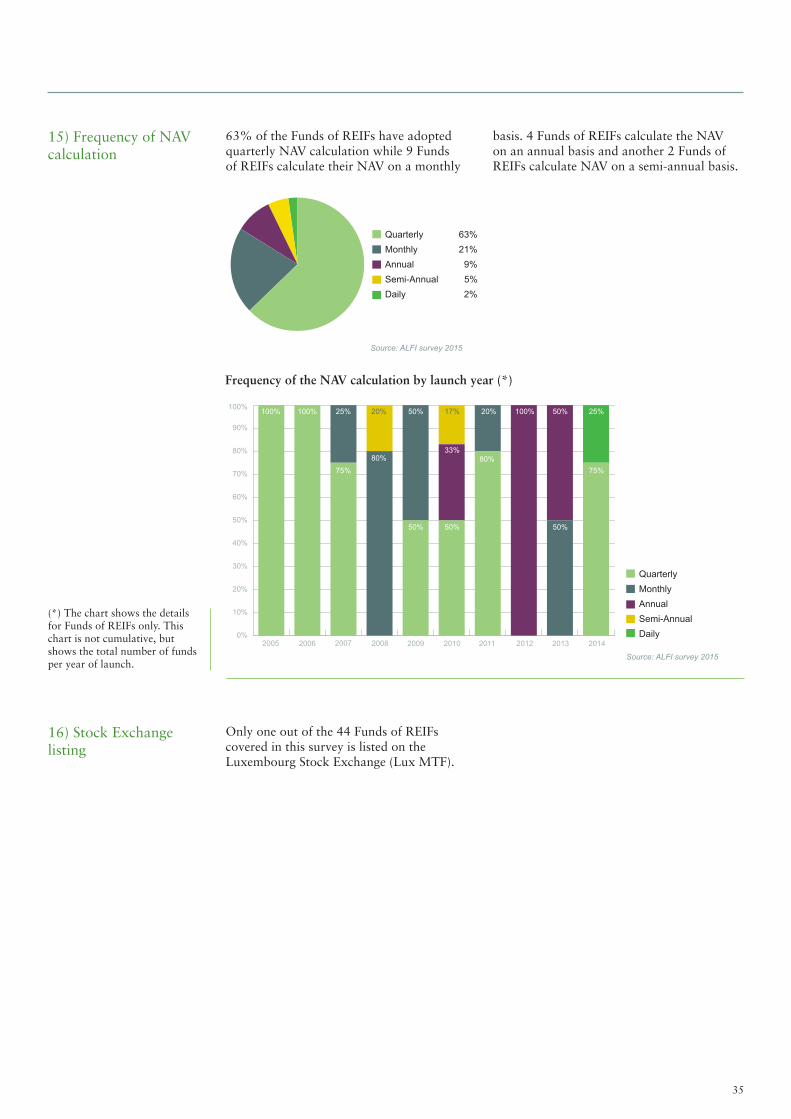
15) Frequency of NAV calculation
63% of the Funds of REIFs have adopted quarterly NAV calculation while 9 Funds of REIFs calculate their NAV on a monthly
basis. 4 Funds of REIFs calculate the NAV on an annual basis and another 2 Funds of REIFs calculate NAV on a semi-annual basis.
16) Stock Exchange listing
Only one out of the 44 Funds of REIFs covered in this survey is listed on the Luxembourg Stock Exchange (Lux MTF).
Quarterly 63%Monthly 21%Annual 9%Semi-Annual 5%Daily 2%
0%
10%
20%
30%
40%
50%
60%
70%
80%
90%
100%
2005 2006 2007 2008 2009 2010 2011 2012 2013 2014
20%
80%
100% 100% 25%
75%
50%
50%
17%
33%
50%
20%
80%
100% 25%
75%
50%
50%
Quarterly MonthlyAnnualSemi-AnnualDaily
Frequency of the NAV calculation by launch year (*)
Source: ALFI survey 2015
(*) The chart shows the details for Funds of REIFs only. This chart is not cumulative, but shows the total number of funds per year of launch.
Source: ALFI survey 2015

36
Appendix
Service providers The following service providers (listed in alphabetical order) were identified in the responses to the survey:
Accounting – Lux Holdco’s• A3T SA• Alter Domus Alternative Asset Fund
Administration S.à r.l.• Banque de Patrimoines Privés• Banque et Caisse d’Epargne de l’Etat,
Luxembourg• BlackRock• Brown Brothers Harriman (Luxembourg)
S.C.A.• CACEIS Bank Luxembourg• Caceis Investor Services• CITCO• Citibank International Plc (Luxembourg
Branch)• Colony• Credit Suisse Fund Services• ECE Real Estate Partners S. à r. l.• Edmond de Rothschild Asset Management• European Fund Administration S.A. • FaCTS• FUND SOLUTIONS SCA• Grant Thornton Abax Investment Services
S.A.• Hines Luxembourg S. à r. l.• Internos• Intertrust Luxembourg S. à r. l.• KPMG• Main Source SA• PANDOMUS• RBC Investor Services Bank S.A.• RBC Wealth Management• SGG S.A. • TMF• Trident Trust Company (LUXEMBOURG)
S.A.
Auditors • BDO• Deloitte• EY• Grant Thornton• HRT Révision• KPMG• Mazars• PWC
Depositaries • ABN Amro Bank (Luxembourg) S.A. • Alter Domus Depositary Services S.à r.l.• Banque de Luxembourg S.A.• Banque de Patrimoines Privés• Banque et Caisse d’Epargne de l’Etat,
Luxembourg• Banque International Luxembourg S.A.• BNP Paribas Securities Services• BNY Mellon • Brown Brothers Harriman (Luxembourg)
S.C.A.• CACEIS Bank Luxembourg• Citco Bank Nederland N.V., Luxembourg
Branch• Citibank International Plc (Luxembourg
Branch)• Crédit Suisse (Luxembourg) S.A.• DEKA INTERNATIONAL S.A.• DZ PRIVATBANK S.A.• Edmond de Rothschild (Europe)• EFG Bank (Luxembourg) S.A.• Grant Thorton • Hines Luxembourg S.à r.l.• Intertrust Luxembourg S.à r.l.• KBL European Private Bankers S.A.• LRI Depositary S.A.• M.M. Warburg & CO Luxembourg S.A.• Natixis Bank Luxembourg• Partners Group Luxembourg S.A.• Pictet & Cie (Europe) S.A.• RBC Investor Services Bank S.A.• RBS Global Banking (Luxembourg) S.A.• SGG S.A.• Skandinaviska Enskilda Banken S.A.• Societe Generale Bank and Trust• Union Investment Financial Services S.A.• VP Bank (Luxembourg) S.A.
Accounting - Non Lux SPVs • Alter Domus Alternative Asset Fund
Administration S.à.r.l.• Brown Brothers Harriman (Luxembourg)
S.C.A.• Citadel Capital• CITCO• Colony• EY• Forest Info OÜ• GFB RIO ASSESSORIA CONTABIL
LTDA• Grant Thornton • Internos• Knox House Trust• KPMG• Partners Group• Secured capital / Corwe Horvath• Tashir group• TMF Luxembourg S.A.• Trident Trust Company (LUXEMBOURG)
S.A.

37
Central administrations (including Transfer Agents) • Abax Investment Services S.A.• Adepa Asset Management• AEW Europe S.à r.l.• Alcyon SA• Allegro S.à r.l.• Alter Domus Alternative Asset Fund
Administration S.à r.l.• Apex Fund Services, Luxembourg Branch• Bank of New York Mellon (Luxembourg)
S.A.• Banque de Patrimoines Privés• Banque et Caisse d’Epargne de l’Etat,
Luxembourg• BNP Paribas Securities Services,
Luxembourg Branch• Brown Brothers Harriman (Luxembourg)
S.C.A.• CACEIS Investor Services• Citco Fund Services (Luxembourg) S.A.• Citibank International Plc (Luxembourg
Branch)• Colony• Credit Suisse Fund Services S.A.• Deka International S.A. • DekaBank Deutsche Girozentrale
Luxembourg S.A. • ECE Real Estate Partners S.à r.l.• Edmond de Rothschild Asset Management
(Luxembourg)• EFG Bank (Luxembourg) S.A.• European Fund Administration S.A.• Experta Corporate and Trust Services S.A.• Fil Investment Management (Luxembourg)
S.A.• Fund Solutions S.C.A.• Garbe Logistic Management Company S.à
r.l.• Grant Thornton • Hauck & Aufhäuser Alternative
Investment Services S.A.• Hines Luxembourg S.à r.l.• Intertrust (Luxembourg) S.à r.l.• Invesco Real Estate Management S.à r.l.• Kredietrust S.A. Luxembourg• LRI Invest S.A.• Luxglobal Trust Services S.A.• PANDOMUS• Partners Group Luxembourg S.A.• ProLogis Management Services S.à r.l.• Quilvest Luxembourg Services S.A.• RBC Investor Services Bank S.A.• Sanne Group (Luxembourg) S.A.• Schroder Investment Management
(Luxembourg) S.A.• SEB Asset Management S.A.• SEB Fund Services S.A.• SGG S.A.
• Société Générale Bank & Trust S.A.• Trident Trust Company (Luxembourg)
S.A.• Union Investment Luxembourg S.A.• United International Management S.A.• Universal-Investment-Luxemburg S.A.• VPB Fund Solutions S.A.
Domiciliation and Corporate • Adepa Asset Management S.A.• Alcyon S.A.• Allegro S.à r.l.• Alter Domus Alternative Asset Fund
Administration S.à.r.l.• Apex Fund Services Limited, Luxembourg
branch• Banque de Luxembourg S.A.• Banque de Patrimoines Privés• Banque et Caisse d’Epargne de l’Etat,
Luxembourg• Brown Brothers Harriman (Luxembourg)
S.C.A.• CACEIS Bank Luxembourg• Citco Fund Services (Luxembourg) S.A.• Citibank International Plc (Luxembourg
Branch)• Colony• Credit Suisse Fund Services S.A.• ECE Real Estate Partners S.à r.l.• Edmond de Rothschild Asset Management• European Fund Administration S.A.• FUND SOLUTIONS S.C.A.• Grant Thornton • Hauck & Aufhäuser Alternative
Investment Services S.A.• Henderson Fund Management
(Luxembourg) S.A.• Hines Luxembourg S.à r.l.• Invesco Real Estate Management S.à r.l.• Kredietrust S.A. Luxembourg• LRI Invest S.A.• Partners Group (Lux) S.A.• RBC Investor Services Bank S.A.• SGG S.A.• Societe Generale Bank & Trust • Structured Invest S.A.• TIAA Henderson• TRIDENT TRUST COMPANY
(LUXEMBOURG) S.A.• Union Investment Luxembourg S.A.• United International Management S.A.

38
Legal Advisors • Allen & Overy • AMMC Law• Anold & Porter (UK) LLP• Arendt & Medernach• Ashurst LLP• Bonn & Schmitt Avocats• Bonn Steichen & Partners• Clifford Chance• Dechert Luxembourg• DELAGARDELLE Law Firm• Duvieusart Ebel, avocats associés• Elvinger, Hoss & Prussen• Etude Dandois & Meynial• Kremer Associés • Linklaters LLP• Loyens & Loeff• MNKS S.A.• OGIER (Luxembourg)• Oostvogel Pfister Feyten• OPF Partners Luxembourg• Peuvrel & Cayphas• SCRM Avocats• Speechly Bircham Luxembourg• Wildgen, Partners in law
Tax advisors• Allen & Overy• Arendt & Medernach• Ashurst• ATOZ• Bonn & Schmitt Avocats• Capita Fiduciary• Clifford Chance• Deloitte• D.M.S. Services• Elvinger Hoss & Prussen• EY• FaCTS• Grant Thornton • KPMG• Kremer Associés • Linklaters LLP• Loyens & Loeff• OPF Partners• PWC• RSM• Van Horst Gruppe GmbH

39
Glossary 2010 Law The law of December 17, 2010 on Undertakings for Collective Invest-ment as may be amended from time to time (“UCIs”)
2007 Law The law of February 13, 2007 on Specialized Investment Funds as amended (“SIFs”)
AIFMD Alternative Investment Fund Managers Directive, Directive 2011/61/EU of the EP and of the Council of 8 June 2011
CSSF Commission de Surveillance du Secteur Financier (Luxembourg super-visory authority for the financial sector)
Direct Fund Fund investing in property assets or structures holding property Assets
EFTA European Free Trade Association (Iceland, Lichtenstein, Norway, Swit-zerland)
EU 28 Austria, Belgium, Bulgaria, Croatia, Cyprus, Czech Republic, Den-mark, Estonia, Finland, France, Germany, Greece, Hungary, Ireland, Italy, Latvia, Lithuania, Luxembourg, Malta,Netherlands, Poland, Portugal, Romania, Slovakia, Slovenia, Spain, Sweden, United Kingdom
EU Candidates Albania, Macedonia, Montenegro, Serbia, Turkey
FCP Fonds Commun de Placement: Common fund, entity without legal personality based on contractual agreement
FoREIF Fund of Real Estate Investment Fund
GAAP Generally Accepted Accounting Principles
HNW Gross Asset Value
HNWI High Net Worth
Indirect Fund High Net Worth Individual
IFRS Fund investing in real estate securities or other Real Estate Funds
Initiator International Financial Reporting StandardsInitiator origin region: Europe, Asia/Pacific/ME, Americas parent should be used
INREV European Association for Investors in Non-listed Real Estate Vehicles
Investment Style Core: Stable income returns, stabilised properties located in strong and low risk markets; geared at less than 50%Value Added: combination of Income and capital return; stabilised properties located in low to medium risk markets, as well as an element in development or opportunistic invest¬ments; geared from 40% to 70%Opportunistic: primarily through capital return; higher risk properties (e.g development projects, property repositioning, assets in higher risk countries or distressed assets); geared is in excess of 60%
ISVC International Standards Valuation Committee

40
Liquidity Closed-ended: Fund may not, at the request of investors, repurchase directly or indirectly their units or shares
Open-ended: Fund may, at the request of investors, repurchase directly or indirectly their units or shares
Open-ended with restriction: in addition subject to further conditions such as maximum number of units to be redeemed in a period; extended notice period; early redemption penalties etc.
Semi-open ended: series of distinct equity offerings after the initial launch, but not on a continuous basis; ability of investors to redeem capital at certain times during the fund life; infinite life.
LuxMTF Luxembourg Stock Exchange
NAV Net Asset Value
REIF Real Estate Investment Fund
RICS The Royal Institution of Chartered surveyors
SA Sociéte anonyme (public limited company)
SCA Société en commandite par actions (partnership limited by shares)
SCS Société en commandite simple (limited partnership)
SICAF Société d’investissement à capital fixe (investment company with fixed capital)
SICAR Société d’Investissement en Capital à Risque (investment company in risk capital)
SICAV Société d’investissement à capital variable (investment com pany with variable capital)
SIF Fonds d’investissement spécialisé (specialized investment fund)
SOPARFI Société de participations financières (financial holding company)
SPV Special Purpose Vehicle
TEGOVA The European Group of Valuers’ Associations
UCI Undertaking for Collective Investment

The ALFI Real Estate Funds Sub-Committee would like to thank the following people for their efforts in compiling the data and commentary for the ALFI REIF survey 2015:
EY project team:
Kai Braun – EYMartin Krist – EYAnne-Sophie Steichen - EY
Members of the REIF Publications Working Group:
Catherine Gauthier Brown Brothers Harriman (Luxembourg) S.C.A. – Working Group Co-ChairJohan Terblanche Dechert (Luxembourg) LLP – Working Group Co-ChairKeith Burman ManagementPlus - Sub-Committee Co-ChairMichael Hornsby EY - Sub-Committee Co-ChairPaul van den Abdeele Clifford ChanceValerie Tollet DeloitteandDavid Zackenfels Association of the Luxembourg Fund Industry - ALFIRégine Rugani Association of the Luxembourg Fund Industry – ALFI
The ALFI Real Estate Funds Sub-Committee repeats this Survey on an annual basis in the most comprehensive form possible. ALFI encourages any relevant fund initiators or depositaries that were not included in the 2015 ALFI survey to contact ALFI before May 2016 to ensure inclusion.
Acknowledgements
Editor: EY Luxembourg
Photo credits: © ALFI

alfi - association of the luxemborg fund industry
B.P. 206 L-2012 Luxembourg
Tel: +352 22 3026-1 Fax: +352 22 30 93
January 2016
EY B.P. 780 L-2017 Luxembourg
Tel: +352 42 124-1 www.ey.com/lu