luquillo experimental forest: research history and opportunities · 2013-03-28 · 4 luquillo...
TRANSCRIPT

Luquillo Experimental Forest: Research History and Opportunities
U.S. Department of Agriculture
Forest Service
EFR-1
May 2012

The U.S. Department of Agriculture (USDA) prohibits discrimination in all its programs and activities on the basis of race, color, national origin, age, disability, and where applicable, sex, marital status, familial status, parental status, religion, sexual orientation, genetic information, political beliefs, reprisal, or because all or part of an individual’s income is derived from any public assistance program. (Not all prohibited bases apply to all programs.) Persons with disabilities who require alternative means for communication of program information (Braille, large print, audiotape, etc.) should contact USDA’s TARGET Center at (202) 720-2600 (voice and TDD). To file a complaint of discrimination, write USDA, Director, Office of Civil Rights, 1400 Independence Avenue, S.W., Washington, D.C. 20250-9410, or call (800) 795-3272 (voice) or (202) 720-6382 (TDD). USDA is an equal opportunity provider and employer.

1 Winrock International, Ecosystem Services, 2121 Crystal Drive, Suite 500, Arlington, VA 22202
2 U.S. Department of Agriculture, Forest Service, International Institute of Tropical Forestry, 1201 Calle Ceiba, Jardín Botánico Sur, Río Piedras, PR 00926–1115
EditorsNancy L. Harris1, Ariel E. Lugo2, Sandra Brown,1 and Tamara Heartsill Scalley.2
U.S. Department of Agriculture
Forest Service
EFR-1
May 2012
Luquillo Experimental Forest: Research History and Opportunities


Luquillo Experimental Forest: Research History and Opportunities i
Acknowledgments ii
1. Introduction (N.L. Harris) 1
2. General Description of the Research Area (N.L. Harris) 3
3. Historical Perspective (N.L. Harris) 7
4. Land Use and Land Cover (N.L. Harris) 9
5. Climate (N.L. Harris, T. Heartsill Scalley, and F.N. Scatena) 12
6. Disturbances (N.L. Harris and A.E. Lugo) 21
7. Hydrology (N.L. Harris and W. Wu) 50
8. Water Quality of Rivers (N.L.Harris) 56
9. Geology (N.L. Harris) 60
10. Soils (N.L. Harris) 62
11. Vegetation (T. Heartsill Scalley) 64
12. Fungi (S.A. Cantrell and D.J. Lodge) 73
13. Fauna (N.L. Harris) 77
14. Ecosystem Processes (A.E. Lugo and N.L. Harris) 98
15. Nutrient Cycling in the Luquillo Experimental Forest (A.E. Lugo, N.L. Harris, and W.L. Silver) 107
16. Socioeconomic Indicators (N.L. Harris) 119
17. History and Focus of Research (N.L. Harris and T. Heartsill Scalley) 122
18. Research Opportunities (A.E. Lugo) 124
19. Education and Outreach (E. Meléndez Ackerman) 125
20. Facilities (E. Meléndez Ackerman) 127
Resources 129
Literature Cited 130
Contents

Luquillo Experimental Forest: Research History and Opportunitiesii
Acknowledgments
This work was done in cooperation with the University of Puerto Rico
as part of the Forest Service, U.S. Department of Agriculture (USDA),
contribution to the National Science Foundation Long-Term Ecological
Research Program at the Luquillo Experimental Forest. Work was conducted
under grants BIR-8811902, DEB-9411973, DEB-9705814, DEB-0080538,
and DEB-0218039 to the Institute for Tropical Ecosystem Studies of the
University of Puerto Rico and the International Institute of Tropical Forestry
(IITF), Forest Service. Special thanks to all contributing authors; special
thanks to F.N. Scatena, David Murphy, Eda Meléndez Colom, Chelse M.
Prather, and Hongqing Wang for their collaboration with our data requests;
Gisel Reyes, Jorge Morales, and other IITF library staff for their assistance in
literature compilation; Olga Ramos and staff of the Geographic Information
System Remote Sensing Laboratory of the IITF for their assistance with map
production; and Mildred Alayón for her assistance in the production process.
Cite this document as: Harris, N.L.; Lugo, A.E.; Brown, S.; and Heartsill Scalley, T. (Eds.). Luquillo Experimental Forest: Research history and opportunities. EFR-1. Washington, DC: U.S. Department of Agriculture. 152 p.

Luquillo Experimental Forest: Research History and Opportunities 1
Tropical forests cover an area of approximately 1.8 billion hectares (ha), or nearly 50 percent of the world’s total
forest area (Food and Agriculture Organization 2003). Tropical forest ecosystems are often introduced to students of ecology by dividing them into two types, based solely on rainfall patterns—rain forests and dry or seasonal forests. Although this representation may provide a simple, approachable view, it fails to illustrate the true diversity of all tropical forest types and promotes the extrapolation of limited data sets over large and heterogeneous regions to produce broad, sweeping generalizations about all tropical forests worldwide.
The Holdridge Life Zone System (Holdridge 1967), which is based on empirical data and ecophysiological principles, provides a more comprehensive picture of tropical forest types: of the world’s 112 life zones, more than one-half (66) are tropical and 33 include forests (out of 52 forested life zones in the world; Lugo and Brown 1991) (fig. 1). Thus, from a climatic perspective, tropical forests are more diverse than all other forest types combined. Understanding this diversity has posed a challenge even to seasoned ecologists, because describing the diversity of forest types becomes even more complicated when considering local factors, such as geologic formation, soils, topography, and aspect, as well as forest function and responses to natural and anthropogenic disturbances.
1. IntroductionN.L. Harris
When using the life zone approach, the guiding principle that underlies the diversity of tropical forests is that multiple environmental conditions—not just precipitation regime—dictate the organization, composition, and functioning of ecosystems from local to global scales. Therefore, ecological comparisons among ecosystems require a clear understanding of factors relevant at the various spatial, temporal, and biological scales.
The Luquillo Mountains in Puerto Rico provide an excellent natural research laboratory in which to study the diversity of tropical forest types, because five subtropical life zones are represented within an area of just over 11,000 ha: wet forest, rain forest, lower montane wet forest, lower montane rain forest, and a small tract of land in the southwest portion that falls within the moist forest life zone. Puerto Rico falls within the subtropical belt of the Holdridge Life Zone System because of the temperature regime; frost is absent from all tropical and subtropical life zones. The region is also steeped in a rich tradition of forestry research that is unique among tropical forests; scientists have been active there since the end of the 19th century.
In 1983, Brown et al. summarized major findings of past research that once had been scattered among obscure papers and
Figure 1.—Holdridge Life Zone System. From http://en.wikipedia.org/wiki/Holdridge_life_zones.

2 Luquillo Experimental Forest: Research History and Opportunities
large and inaccessible volumes to produce a succinct yet data-rich summary that is still widely cited more than 25 years later. Since the publication of Brown et al. (1983), significant new research has led to new hypotheses and new conclusions about how tropical forests function. Improvements in technology and data storage over the past 25 years have resulted in vast new data sets, syntheses, and models for the Luquillo Experimental Forest (LEF) that were once unimaginable due to data storage and processing limitations (e.g., Harris et al. 2008; Harris et al. in press; Heartsill Scalley et al. 2007; Wang et al. 2002; Wu et al. 2006a, 2006b).
The goals of this Luquillo Experimental Forest: Research History and Opportunities are to synthesize the new research that has
emerged from the LEF since the publication of Brown et al. (1983) into a concise summary of key research findings and to highlight opportunities for future research that will contribute to a greater understanding of the structure and function of tropical forested ecosystems in a changing world. The basic structure of this publication remains similar to the Brown et al. version, but the data presented in each chapter reflect new knowledge and new ideas that have arisen through the extensive work of modern-day researchers. Although some basic information from the Brown et al. (1983) version remains included in this version, it is assumed that the interested reader will consult the original version for detailed information on data published before 1983.

Luquillo Experimental Forest: Research History and Opportunities 3
Located at 18º N latitude and 66º W longitude in the northeastern Caribbean Sea, Puerto Rico is an archipelago,
encompassing Vieques, Culebra, Mona, Desecheo, Caja de Muertos, and numerous cays. The main island is the smallest (8,895 square kilometers (km2)) in the Greater Antilles island chain. The island boasts a population of nearly 4 million people, however, making Puerto Rico one of the most densely populated places on Earth (429 inhabitants km-2; U.S. Census Bureau 2000). The Luquillo Experimental Forest (LEF) is located in the Luquillo Mountains in the northeast corner of the island, approximately 30 miles (48.3 km) east of the capital of San Juan and southwest of the municipality of Luquillo (fig. 2). Ocean and trade winds moderate the island’s climate. Another large
2. General Description of the Research AreaN.L. Harris
mountain chain in the middle of the island (the Cordillera Central, or Central Mountain Range) creates a rain shadow, such that annual precipitation across the island spans a gradient of almost 5,000 millimeters (mm) from the Luquillo Mountains on the windward northeast coast to the Guánica dry forest (800 mm of annual rainfall) on the leeward southwest coast. One of the deepest points of the Atlantic Ocean lies several kilometers northwest of the Luquillo Mountains, a factor that, coupled with the long wind fetch of the Atlantic, contributes to high-energy conditions and thus frequent hurricanes on the north coast of the island (Lugo 2008). Of the land surface of Puerto Rico, 85 percent falls within the subtropical moist and subtropical wet life zones (Thomlinson et al. 1996).
Figure 2.—The Luquillo Experimental Forest in Puerto Rico. From Lugo and Heartsill Scalley (in press).

4 Luquillo Experimental Forest: Research History and Opportunities
The Luquillo Mountains rise from the coast to over 1,000 meters (m) above sea level, with El Yunque Peak (1,065 m in elevation) located 8 km (straight line distance) from the nearest beach (fig. 3). Other mountain peaks include El Toro (1,075 m), Pico del Este (1,050 m), Pico del Oeste (1,020 m), El Cacique (1,020 m), Los Picachos (968 m), Mount Britton (937 m), and La Mina (925 m). Moist air from the trade winds coming off the Atlantic Ocean cools and condenses as it rises up the steep, dissected mountain slopes, resulting in mountain peaks shrouded in cloud cover most of the time. Heavy rainfall at the peaks serves as the headwaters for six major rivers: Río Espíritu Santo, Río Grande de Loíza, Río Blanco, Río Mameyes, Río Fajardo, and Río Sabana (fig. 3). These rivers provide the main water supply to approximately 20 percent of the island’s population. Air temperature decreases up the mountain, with average monthly temperature ranging between 23.5 and 27 ºC (74 to 81 ºF) at the base of the mountain to between 17 and 20 ºC (63 to 68 ºF) on the mountain peaks (García Martinó et al. 1996).
Variation in climatic conditions in the Luquillo Mountains results in a shift in vegetation and community structure over a relatively small area. Tabonuco trees (Dacryodes excelsa) dominate forests at low elevations in the LEF (fig. 4a), while palo colorado (Cyrilla racemiflora) with reddish leaves and bark dominates at mid-elevations (fig. 4b). Palm forests, dominated by the sierra palm (Prestoea montana), occur at all elevations wherever very steep slopes and saturated soils prevail (fig. 4c). Forests at the mountain peaks are known as elfin forests (fig. 4d) because trees are short in stature in response to chronically saturated soils that limit transpiration rates and low solar radiation that limits photosynthesis (Wang et al. 2003; Harris 2006; Wu et al. 2006b; Harris et al. in press). Although these broad forest types characterize the vegetation of the LEF, clear boundaries between where one forest type stops and another starts are nonexistent. Rather, the distribution of vegetation corresponds to multiple environmental gradients such as solar radiation, temperature, rainfall, soil type, and topographic position that
Figure 3.—Elevation and rivers of the Luquillo Experimental Forest.

Luquillo Experimental Forest: Research History and Opportunities 5
Figure 4.—Representative forest types within the Luquillo Experimental Forest. (a) Tabonuco forest in the lowlands, dominated by Dacryodes excelsa; (b) palo colorado forest at mid-elevations, dominated by Cyrilla racemiflora; (c) palm brake forest in areas with steep slopes and saturated soils, dominated by the sierra palm (Prestoea montana); and (d) elfin forest at mountain peaks, with Micropholis garciniifolia as a representative tree species. Photos by G. Bauer.
4a. 4b.
4d.4c.
vary continuously over the landscape rather than as discrete categories. Also, many specialized communities occur across the landscape, such as floodplain forests, riparian vegetation, herbaceous bogs, plantations, and roadside vegetation.
Hurricanes and severe tropical storms are common in the LEF and occur mainly during the late summer months. More than
70 severe storms have occurred in Puerto Rico since the early 1700s, and the most recent storms to pass over Puerto Rico (since 1989) are shown in figure 5. The last two hurricanes to hit the LEF were Hurricane Georges in 1998 and Hurricane Hugo 9 years earlier in 1989. Hurricanes can be expected to pass directly over the forest once every 62 years and pass within 60 km once every 22 years (Scatena 1989).

6 Luquillo Experimental Forest: Research History and Opportunities
Figure 5.—Weekly rainfall and throughfall at the Bisley Watersheds in the Luquillo Experimental Forest and the names of storms and hurricanes passing over Puerto Rico from 1988 to 2003. Weekly means are expressed in mm day-1. The black color line is a running average. Bar colors represent January in gray, February in yellow, March in dark yellow, April in orange, May in red, June in dark gray, July in light green, August in dark green, September in light blue, October in dark blue, November in cyan, and December in olive. From Heartsill Scalley et al. (2007).
In comparison with tropical forests in the Atlantic lowlands of Costa Rica and the lowlands of central Panama—other well-known sites of long-term research activity (Gentry 1990)—the Luquillo Mountains are cooler, wetter, and less seasonal (Scatena 1998a). Unlike areas with monsoonal tropical climates that receive most of their annual rainfall during a well-defined rainy season, rainfall in the Luquillo Mountains is relatively
evenly distributed throughout the year. Dry periods in these mountains last days and weeks rather than months and are only moderately seasonal in occurrence. Rainfall in the Luquillo Mountains has a nutrient-rich oceanic chemical signature, and the precipitation regime is a high frequency of low-intensity showers punctuated by periodic high-intensity storms (Heartsill Scalley et al. 2007).

Luquillo Experimental Forest: Research History and Opportunities 7
The Origins of Forestry in the Luquillo Experimental Forest: 1903 to 1956When Puerto Rico became part of the United States territory in 1898, 5,018 hectares (ha) of forest land in the Luquillo Mountains were under the protection of the Spanish Crown. The Luquillo Forest Reserve was established by the United States in 1903 and renamed the Luquillo National Forest in 1907. The Division of Forestry managed the area between 1898 and 1905. The Forest Service has managed the area continuously since 1905, and the first supervisor of the national forest was appointed in 1917. The forest was renamed the Caribbean National Forest in 1935. In 2007, the name was changed again to the El Yunque National Forest to better reflect the cultural and historical attitudes of the Puerto Rican people. During the past century, the size of the forest under Forest Service ownership increased from the original 5,018 ha to 11,300 ha. In 1956, this forest area–with the same boundaries as today’s El Yunque National Forest–was also designated as the Luquillo Experimental Forest (LEF).
Initial Forest Service programs began about 1920 and included large-scale trial plantings with both introduced and native tree species. With the onset of the Great Depression in the early 1930s, the Civilian Conservation Corps program did extensive work in reforestation, forest road construction, and recreational and administrative improvements to the forest. The Forest Service started the first timber management plan for the Luquillo Mountains in 1934 (Muñoz 1965). Before this plan, management of public lands was minimal, and most privately owned areas were either cleared for agriculture or selectively cut for desirable species. Sugarcane production was at its peak in the Luquillo municipality in the late 1940s (Thomlinson et al. 1996). The 1956 forest management plan suggested that about 6,700 ha of the Caribbean National Forest, now El Yunque National Forest, could support timber production and were thus designated as commercial lands. Close to one-half of these lands came under active management, including both the management of natural stands and the development of plantations.
The Odum Years: 1963 to 1968In the 1960s, the Atomic Energy Commission (now the U.S. Department of Energy) and the University of Puerto Rico provided funding for Howard T. Odum and dozens of other scientists and technicians to conduct the first large-scale ecosystem study on the effects of disturbance caused
by radiation in the tabonuco forest. Odum’s experiments established the foundation for long-term ecological research in Puerto Rico and the tropics in general (Odum and Pigeon 1970). Through his radiation experiment, Odum found that the structure and function of the tabonuco forest ecosystem were highly resistant to the effects of radiation (Odum 1970a). Odum’s research legacy in the Luquillo Mountains transcends the radiation experiment, however. Odum also described in detail the climate of the Luquillo Mountains (Odum et al. 1970) and demonstrated how to measure forest metabolism on a large scale by isolating a section of forest within a giant plastic cylinder (Odum and Jordan 1970). Scientists involved in the Rain Forest Project also made comparisons with other tropical forests, both insular and continental (Odum 1970a, 1970b), and raised countless questions for future studies. Many of Odum’s questions concerned key methodological and monitoring approaches of the time, while others emphasized fundamental issues for research in tropical forests (see Lugo 2004a).
For Howard Odum, the Luquillo Mountains functioned as an integrated ecosystem connected to the rest of the globe by regional flows of energy and cycling of materials. He recognized the connection between the tabonuco forest and latitudinal wind patterns through inputs of water and nutrients. Odum also recognized the role of wind and hurricanes in shaping the canopy of the forest (Odum 1970b), demonstrated the hierarchical nature of forest function, and integrated the functions of organisms from microbes to humans (Odum 1970c). Through research on fundamental ecosystem structure and function, Odum developed models of sustainable land use for the tropics, including the design of ecosystems for human uses, such as waste recycling and wood production (Odum 1995).
The LTER Network: 1988 to TodayMost research conducted in the Luquillo Mountains until 1988 was of relatively short duration, from less than a year to a decade. Even H.T. Odum’s Rain Forest Project, which in its time was the most comprehensive study of a tropical forest ever conducted, lasted only 5 years (1963 to 1968). Notable longer term studies include (from 1942) monitoring of tree growth and survival under natural and managed conditions (Drew et al. 2009; Brown et al. 1983), the recovery of vegetation after ionizing radiation (Taylor et al. 1995), and the recovery project for the endangered Puerto Rican Parrot (Snyder et al. 1987).
3. Historical Perspective N.L. Harris
8 Luquillo Experimental Forest: Research History and Opportunities
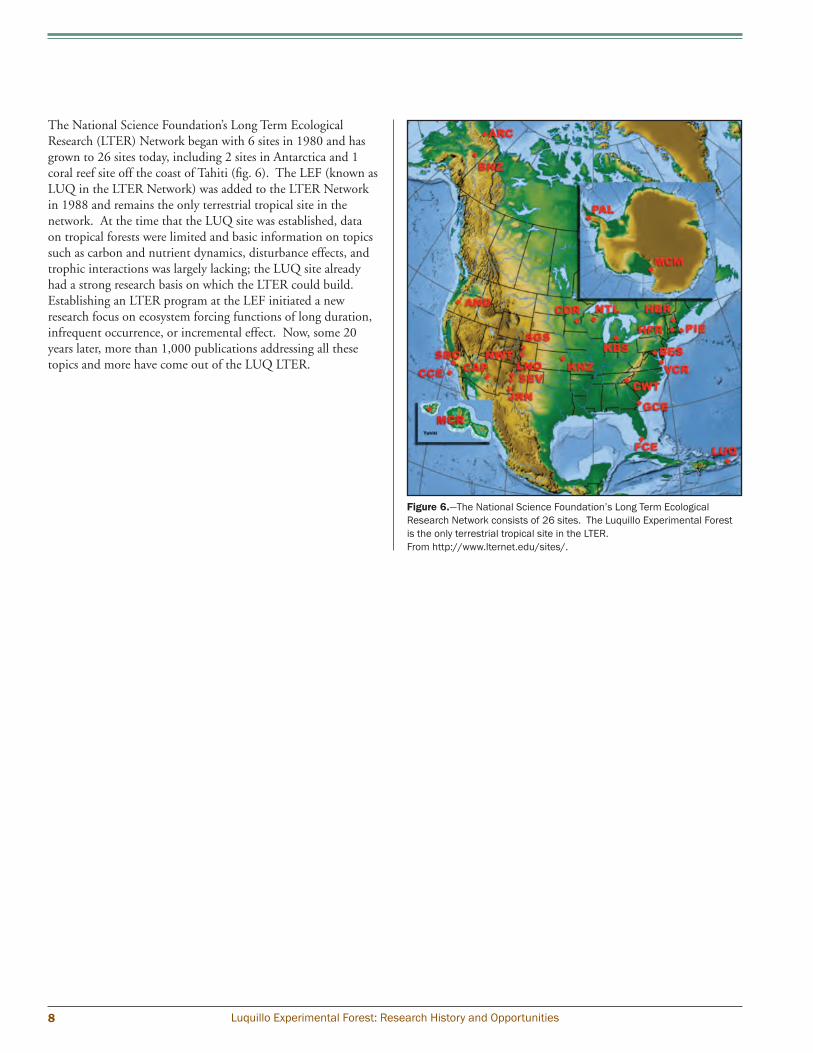
The National Science Foundation’s Long Term Ecological Research (LTER) Network began with 6 sites in 1980 and has grown to 26 sites today, including 2 sites in Antarctica and 1 coral reef site off the coast of Tahiti (fig. 6). The LEF (known as LUQ in the LTER Network) was added to the LTER Network in 1988 and remains the only terrestrial tropical site in the network. At the time that the LUQ site was established, data on tropical forests were limited and basic information on topics such as carbon and nutrient dynamics, disturbance effects, and trophic interactions was largely lacking; the LUQ site already had a strong research basis on which the LTER could build. Establishing an LTER program at the LEF initiated a new research focus on ecosystem forcing functions of long duration, infrequent occurrence, or incremental effect. Now, some 20 years later, more than 1,000 publications addressing all these topics and more have come out of the LUQ LTER.
Figure 6.—The National Science Foundation’s Long Term Ecological Research Network consists of 26 sites. The Luquillo Experimental Forest is the only terrestrial tropical site in the LTER. From http://www.lternet.edu/sites/.

Luquillo Experimental Forest: Research History and Opportunities 9
Most of Puerto Rico was forested at the time of European arrival. Although pre-Columbian Arawak and Taíno
agriculturalists cleared small tracts of land in the mid-elevation forests of Puerto Rico, their activities probably had little effect on the vegetation of the Luquillo Experimental Forest (LEF) because the coastal plains and the drier intermountain valleys were better suited to their needs than the Luquillo range (Wadsworth 1949; Walker in press).
Land-clearing activities and the extent of human-induced disturbances increased rapidly at the onset of European colonization, but then slowed with the development of the continental New World. The first two major settlements of
4. Land Use and Land CoverN.L. Harris
Puerto Rico, Caparra and San Germán, were established by 1510, but a third town was not established for another 136 years (Scatena 1989). During the first three centuries of colonization, the relatively inaccessible nature of the Luquillo Mountains limited their use.
Extensive agricultural activity did not begin in the LEF until the onset of government land distribution programs in the early 1800s. By 1831, coffee was grown in the region, but most of Fajardo and Luquillo were forested and sparsely populated (Wadsworth 1949). Between 1830 and 1890, as a result of the government land distribution programs, the flanks of the mountain became cultivated with coffee, bananas,
Figure 7.—Land use classes in the municipality of Luquillo, Puerto Rico in (a) 1936, showing the dominance of sugar cane and pasture; (b) 1964, showing the increasing area of pasture, largely due to abandonment of sugar cane crops; and (c) 1988, showing the dominance of dense forest. Values in parentheses in the legend show the percent canopy closure for each of the three forest classes. From Thomlinson et al. (1996).
7a.
7c.
7b.

10 Luquillo Experimental Forest: Research History and Opportunities
and subsistence crops including upland rice. The forest also supplied wood products and water resources to the surrounding communities, and local residents made charcoal for personal use. The extent of cultivated land in the Luquillo Mountains increased steadily from 1800 until a hurricane passed in 1899 (Wadsworth 1949). After the hurricane hit, many affected farms and coffee plantations were abandoned and allowed to reforest naturally. By 1934, all original coffee plantations had been destroyed, but many original shade trees (Inga fagifolia and Inga vera) remained. This decline in agricultural activity and the subsequent reforestation predates the general trend of natural reforestation in Puerto Rico that began about 1950 (Birdsey and Weaver 1982).
Helmer (2004)—who summarized islandwide land cover change over the time period between 1977 to 1978 and 1991 to 1992—found that the largest land cover change on the island was a 64-percent (~119,000 ha) decrease in agricultural
lands, with about one-third of this decrease corresponding to an increase in coffee cultivation and secondary forest. In an earlier study, Thomlinson et al. (1996) analyzed aerial photographs of the municipality of Luquillo, within which part of the LEF is located, and found that the pattern of land use between 1936 and 1988 followed the islandwide trend of a transition from high-intensity agriculture to dense forest (fig. 7). Sugar cane cropland and pasture were the dominant land uses in Luquillo in 1936, occupying about one-third of the study area each, while dense forest was rare. By 1988, pasture still occupied about one-fourth of the area, mainly because most of the area under sugar cane production was transformed to pasture after abandonment. Urban areas also increased by more than 2,000 percent between 1936 and 1988 and continue to encroach on forested areas today. Between 1988 and 1993, urbanization around the LEF in the municipality of Luquillo increased by 31 percent and represented a 5-percent loss in vegetative cover, more than 80 percent of which was dense forest (Thomlinson and Rivera 2000).
Figure 8.—Land cover map of Puerto Rico in 1991-1992. The Luquillo Experimental Forest is located in the northeastern corner. From Helmer et al. (2002).

Luquillo Experimental Forest: Research History and Opportunities 11
Suburbanization, or the transition of other land cover types to low-density urban areas, continues to encroach on the lowlands of the Luquillo Mountains. Thus, the LEF can be viewed as an “island within an island” because the forest is embedded within a broader mosaic of forested and nonforested land (fig. 8). What
Figure 9.—Average daily visits to Yokahu Tower, a major visitor center in El Yunque National Forest. Letters represent the day of the week, with Sunday being the most popular day. From Scatena (2001).
was once actively managed for timber production, charcoal, coffee, and sugar cane is now managed primarily for research and recreation. Hundreds of visitors from Puerto Rico and mainland United States visit the El Yunque National Forest each day, with July and August as peak months for tourism (fig. 9).

12 Luquillo Experimental Forest: Research History and Opportunities
The Luquillo Experimental Forest (LEF) is one of the wettest regions of Puerto Rico. As moisture-laden air masses move
inland from the Atlantic Ocean and rise more than 1,000 meters (m) over a horizontal distance of just 10 to 20 kilometers (km), the air cools and condenses, resulting in a wet environment with abundant water resources. Hurricanes are a regular part of the climate, as are tropical storms and depressions, convective storms, northeasterly trade winds, Saharan dust, and winter cold fronts (Odum and Pigeon 1970, Prospero and Nees 1986, Scatena 1989, McDowell et al. 1990, Larsen 2000). Above the lifting condensation level at about 600 m elevation, cloud cover reduces solar radiation to about 63 percent of nearby coastal areas (Briscoe 1966). Across the forest as a whole, mean annual precipitation averages approximately 3,879 mm yr-1 (millimeters per year) (García Martinó et al. 1996).
Meteorological DataPrecipitationOver the past 80 years, more than 18 rain gauges have been installed within or adjacent to the LEF. Many stations are part of the National Oceanic and Atmospheric Administration (NOAA) network. The Forest Service, University of Puerto Rico, U.S. Geological Survey (USGS), and U.S. Fish and Wildlife Service (USFWS) maintain other stations. Climate data for the five NOAA stations can be downloaded from the National Climatic Data Center Web site 1. The USGS also maintains several weather stations as well as rainfall and streamflow stations within the LEF. The earliest rainfall data were recorded for stations at 152 m and 366 m above sea level at Hacienda Perla (Brown et al. 1983). Canóvanas, a coastal station northwest of the Luquillo Mountains, has one of the longest continuous data sets for the Luquillo region with a record of more than 100 years. Three other long-term stations within the LEF are Bisley located at 361 m, El Verde at 400 m, and Pico del Este (East Peak) at 1,041 m. These stations contain 15 to 30 years of nearly continuous climate records. Data from each station are summarized briefly below, followed by a section that summarizes elevational trends.
Canóvanas (Coastal)The Canóvanas station is located just northwest of the LEF in the subtropical moist forest life zone. Long-term records depict wide oscillations between high and low rainfall years, with annual totals ranging from slightly more than 1,300 mm yr-1 in the driest years to nearly 3,000 mm yr-1 in the wettest years (fig. 10a). Although the running average reveals periods of decreasing rainfall (from about 1910 to the 1960s) followed by periods of increasing rainfall (1960s to 1990), peaks and valleys in the running average interrupt these trends. Furthermore, van der Molen (2002) showed that six out of the eight stations with the longest periods of record on the island had precipitation totals that decreased significantly during the past century (fig. 10b).
5. ClimateN.L. Harris, T. Heartsill Scalley, and F.N. Scatena
1 http://www.ncdc.noaa.gov.
Figure 10.—(a) Running averages for annual rainfall in Canóvanas, a coastal station in the subtropical moist forest life zone just northwest of the Luquillo Experimental Forest, and two other stations in Puerto Rico. Arecibo 3 is west of Canóvanas on the north coast and Aguirre is on the south coast. Compiled by Matthew C. Larsen, U.S. Geological Survey. (b) Trends in annual precipitation in the 20th century for eight National Climatic Data Center stations throughout Puerto Rico. The α represents the confidence level. From van der Molen (2002).
10a.
10b.

Luquillo Experimental Forest: Research History and Opportunities 13
El Verde and Bisley (300 to 400 m) Heartsill Scalley et al. (2007) reported annual and weekly rainfall and throughfall trends for a 15-year period (1988 to 2002) for the Bisley Experimental Watersheds, which range in elevation between 265 and 456 m above sea level and fall within the subtropical wet-forest life zone. They also report rainfall data for the same period at El Verde. Over the 15-year period analyzed, mean annual rainfall and throughfall rates were 3,482 and 2,131 mm yr-1, respectively, indicating that close to 40 percent of incoming rainfall is intercepted by the forest vegetation and then evaporates. The other 60 percent reaches the forest floor, enriched with nutrients leached as it passes over vegetation surfaces. Only 1 week in the 15-year analysis period had no measurable rainfall (May 23, 1989). Comparison across years indicates that the lowest average daily throughfall values occurred in 2000 and 2002 (4.34 and 3.84 mm day-1 (millimeters per day), respectively), while the highest values occurred in 1988 and 1990 (8.79 and 8.50 mm day-1, respectively). Comparison across monthly data, at both Bisley and El Verde, reveals seasonal trends as well; March had the lowest average monthly rainfall and throughfall, and January through April typically had lower rainfall than the rest of the year. Comparison of Bisley data with El Verde data indicates that rainfall patterns across the two sites follow similar monthly trends and have statistically similar average annual values, but rainfall in the months of May, June, and October are significantly lower at El Verde than at Bisley (fig. 11). These differences are apparently related to the greater exposure the Bisley site has to the northeast trade winds and the more pronounced presence of the afternoon adiabatic winds at the El Verde site (Heartsill Scalley et al. 2007).
Rainfall declined significantly over the 15-year period analyzed by Heartsill Scalley et al. (2007) (fig. 12a), but after Heartsill Scalley et al. (2009a) added the most recent 5 years of data to the 15-year time series to produce a 20-year time series (1988 to 2008), annual mean weekly rainfall appears to increase and decrease on approximately 5- to 7-year cycles (fig. 12b). If the period of analysis had covered only 1988 to 1994 or 2003 to 2008, it would have appeared that rainfall in the
Figure 11.—Per month mean weekly rainfall in mm day-1 for Bisley (gray circles), for El Verde (squares) and mean weekly throughfall in mm day-1 for Bisley (gray inverted triangles). Error bars represent one standard error of the mean. From Heartsill Scalley et al. (2007).
Figure 12.—(a) Per year weekly rainfall in mm day-1 for Bisley (gray circles) and for El Verde (green squares) with regression line for Bisley data. Shows 15 years of data; and error bars represent one standard error of the mean. From Heartsill Scalley et al. (2007). (b) Same as (a) showing Bisley data, but 20 years of data are shown and regression lines are split by trend tendency. Error bars represent one standard error of the mean. From Heartsill Scalley et al. (2009a).
12a.
12b.

14 Luquillo Experimental Forest: Research History and Opportunities
LEF had decreased significantly. If the period of analysis had covered 1995 to 1999, the reverse trend would have emerged. Therefore, figure 12 shows the importance of studying long-term trends in key data sets to avoid the misinterpretation of short-term data.
Pico del Este (1,051 m)In addition to receiving rain, mountain peaks of the LEF experience an additional component to precipitation: cloud water. Not all rain is vertical; much of the rain at Pico del Este is wind driven and comes in at an angle. The often stunted, epiphyte-laden trees in the elfin forest at the mountain peaks receive a considerable amount of their water supply through the process of cloud-stripping, or horizontal precipitation, whereby water in wind-driven mist and low clouds is intercepted by the vegetation (van der Molen 2002). Data collected between 2002 and 2007 indicate that 15 percent of the 5,168 mm yr-1 of precipitation at Pico del Este is attributable to cloud inputs and horizontal rain (fig. 13), which are highest during nighttime hours and decrease during the day as clouds burn off (fig. 14).
Elevational Trends in RainfallGarcía Martinó et al. (1996) explored correlations between rainfall and elevation in the LEF and found that a second order polynomial regression model best fit the data available from 18 rain gauges. Starting at the coast, rainfall rapidly increases with elevation for the first 300 m and then increases in a linear fashion to the upper summits. In contrast, air temperature decreases in a linear fashion from the coast to the uppermost elevations. Extensive new data collected at Pico del Este after the publication of García Martinó et al. (1996), however, suggest
that rainfall was underestimated when using rain gauges alone (Holwerda et al. 2006); after horizontal cloud inputs and wind losses are taken into account, mean annual precipitation at Pico del Este is closer to 5,168 mm yr-1. The updated data from Pico del Este were incorporated into the rainfall-elevation relationship shown in figure 15.
Air TemperatureLong-term temperature data for locations in and adjacent to the Luquillo Mountains are more limited than precipitation data. The earliest temperature data, like precipitation, were measured at Hacienda Perla, where the mean annual temperature was approximately 25 ºC (Brown et al. 1983). Across the LEF, from low- to high-elevation stations, mean annual temperature decreases, and the annual variation in temperature is small at any point on the landscape. Frost has never been recorded at the LEF.
Sabana, Bisley, and Pico del Este Average hourly air temperature is lowest during the months of February and March and is highest during July and August (fig. 16).
Average hourly air temperature for Pico del Este (East Peak) for the recent 7-year period of 2002 to 2008 is shown in figure 17. Variation in both daily and annual temperature is apparent, with cooler temperatures occurring from January to March and warmer temperatures from July to September (fig. 16). Average air temperatures at canopy height typically range from about 18 to 23 ºC over the course of a day.
Figure 13.—Total annual precipitation (top figure), horizontal cloud inputs (middle figure), and air temperature (bottom figure) at Pico del Este between 2002 and 2008. From Scatena (unpublished data are available from Luquillo LTER and Critical Zone Observatory).

Luquillo Experimental Forest: Research History and Opportunities 15
Figure 14.—Hourly variation in climate at Pico del Este. Values represent hourly averages of data collected between 2002 and 2008. Photosynthetic Photon Density Flux is PPDF. From Scatena (unpublished data are available from Luquillo LTER and Critical Zone Observatory).
2D Graph 2
mm
/hr
0.04
0.06
0.08
0.10
0.12
0.14
0 100 200 300 400 500 600 700 800 900 1000 1100 1200
mm
/hr
0.45
0.50
0.55
0.60
0.65
0.70
0.75
Air
Te
mp
., a
vg
ho
url
y,
C
18.0
18.4
18.8
19.2
19.6
20.0
0 200 400 600 800 1000 1200 1400 1600 1800 2000 2200 2400
mo
les/m
2/h
r
0
500
1000
1500
2000
2500
3000
m/s
5.2
5.4
5.6
5.8
6.0
6.2
6.4
6.6
6.8
7.0
Total Precipitation = Vertical Precipitation + Cloud Inputs
Total = 5145 mm/ yr = 4374 Rain + 770 Cloud interception
Cloud Interception, mm/yr
Mean = 6.19 m/sMedian = 6.47 m/s
Total PPDF
Mean = 846 moles/m2/hrMedian = 80 moles/m2/hr
Air Temperature, Canopy height
Mean = 18.75Median = 18.5
Mean = 0.59 mm/hr
Median = 0.59 mm,/hr
Mean = 0.09 mm/hrMedian = 0.11 mm/hr
Wind Speed, m/s
Mean = 846 moles/m2/hrMedian = 80 moles/m2/hr
mol
es/m
2 /hr

16 Luquillo Experimental Forest: Research History and Opportunities
Elevational Trends in Air TemperatureThe relationship between mean air temperature and elevation is a required parameter for some environmental models and is termed the adiabatic lapse rate, or the rate at which temperature declines with height as a parcel of dry air is lifted upward through the atmosphere with no addition or deletion of heat. Air and soil temperature were measured at 10 sites located along a windward elevation gradient from 153 to 1,011 m, and data were used to develop relationships between mean air and soil temperature and elevation. The regression analyses performed showed linear relationships between both air and soil mean temperature and elevation (fig. 15). The lapse rates calculated from these data were 5.58 for air temperature and 5.43 for soil temperature (i.e., for each kilometer increase in elevation, air and soil temperatures decrease by 5.58 and 5.43 °C, respectively) (Meléndez Colom 1999).
Solar RadiationSolar radiation data currently available from the Sabana Field Station (153 m), Bisley Experimental Watersheds (265 to 456 m), and Pico del Este (1,056 m) indicate that solar radiation
Figure 15.—Mean annual rainfall (mm yr-1) and air temperature versus elevation, masl (meters above sea level). Updated from García Martinó et al. (1996) using data available from Luquillo LTER and Critical Zone Observatory. Values corresponding to the location of the El Verde Field Station, El Yunque, Luquillo Mountains, Bisley Lower Tower, Canóvanas, Fajardo, Roosevelt Roads, and East Peak are EV, EY, LM, BLT, CAN, Faj, RR, and EP, respectively.
Figure 16.—Average hourly air temperature by month between 2000 and 2002 at Sabana, Bisley, and East Peak (unpublished data are available from Luquillo LTER and Critical Zone Observatory).

Luquillo Experimental Forest: Research History and Opportunities 17
decreases with elevation (fig. 18). It is evident from these data, however, that total incoming solar radiation declines with elevation as cloud cover increases.
Wind SpeedAverage daily wind speeds at El Verde and Bisley are between 1 and 2 m s-1 (meters per second) (fig. 19), with fairly common events at Bisley of 3 to 4 m s-1 and occasional peaks of 6 to 9 m s-1. Wind speeds at the windward Bisley Experimental Watersheds are higher than those at the leeward El Verde Field Station. During the passage of Hurricane Hugo, maximum sustained wind speed southeast of the Luquillo Mountains was estimated at 46 m s-1 (Scatena and Larsen 1991).
Climate ModelsData from individual climate stations are useful because they have high temporal resolution (e.g., hourly to weekly), but installing meteorological stations at every point on the landscape is impractical. Process-based ecosystem modeling that couples Geographic Information Systems (GIS) with remote sensing, Global Positioning Systems, and climate station data is an effective approach for examining spatial and temporal variations in ecosystem processes and the climatic factors that influence them. Such studies could not be done using conventional field experiments and investigations alone. Therefore, spatial modeling of climate using empirical data from measurement stations is a useful way to scale measurements over the landscape. Remote sensing can also be a useful tool for climate modeling, because the imagery covers large areas and can provide estimates at high spatial resolution, although each image is still a snapshot of reality and the temporal resolution of different satellites varies. Progress in both remote sensing and GIS-based modeling
Figure 17.— A 7-year pattern (2002 to 2008) of the average hourly temperature at Pico del Este, incorporating 55,026 records. From Scatena (unpublished data are available from Luquillo LTER and Critical Zone Observatory).
Figure 18.—Mean hourly radiation by month at three elevations in the Luquillo Experimental Forest over the course of a day. Bisley is B, S is Sabana, and E is East Peak. Hourly data between 2,000 and 2002 are averaged. From Scatena (unpublished data are from Luquillo LTER and Critical Zone Observatory).
Figure 19.—Daily maximum (open circles) and mean (closed circles) wind speeds at the Bisley Experimental Watersheds (from Heartsill Scalley, unpublished data).

18 Luquillo Experimental Forest: Research History and Opportunities
techniques makes it easier to derive the parameters needed to run ecological models. This section summarizes different spatial models of climate that have facilitated the analysis of climate-forcing functions in the LEF.
Air Temperature, Solar Insolation, and RainfallThe importance of rainfall to the LEF ecosystem is widely recognized. Early studies reviewed some of the available data
Figure 20.—Simulated air temperature, solar insolation, rainfall, and transpiration in dry and rainy months in the Luquillo Experimental Forest, Puerto Rico. From Wang et al. (2003).
(Briscoe 1966, Holben et al. 1979, Brown et al. 1983, Lugo 1986, McDowell and Estrada Pinto 1988), but a forestwide, spatially averaged synthesis of all the long-term rainfall and runoff data was not available until García Martinó et al. (1996) analyzed long-term rainfall and stream discharge data to develop statistically sound relationships among rainfall, stream runoff, and elevation. These relationships were then used within a GIS to estimate spatially averaged annual water budgets for watersheds within the Luquillo Mountains.
Luquillo Experimental Forest: Research History and Opportunities 19
More recently, Wang et al. (2003) used the TOPOCLIM model (TOPOgraphically driven CLIMate model) to simulate climatic variables for the LEF using both empirical and mechanistic approaches. The model produces estimates of air temperature, solar insolation, and rainfall for the Luquillo Mountains (Wooster 1989, Everham 1996, Marley 1998, Wang et al. 2003). Slope, aspect, and elevation values derived from a 30-m resolution digital elevation model were used as input data for the model and historical climate data compiled by Briscoe (1966), Odum et al. (1970), and García Martinó et al. (1996) were used for parameterization. Model output generates hourly estimates of solar insolation and temperature, as well as daily and monthly totals and averages. Rainfall is estimated monthly. For details about the equations and algorithms for TOPOCLIM, refer to Wang et al. (2003).
In the LEF, simulated monthly temperature and daily solar insolation under current climatic conditions decrease as elevation increases, with minor topographic variation (fig. 20). For example, in a rainy month (e.g., October), air temperature decreases from 26 ºC at low elevations to 20 ºC at mountain peaks (fig. 20). Solar insolation also decreases from approximately 20 MJ m-2 day-1 (megajoule per square meter per day) to approximately 8 MJ m-2 day-1 along the same gradient (fig. 20). Rainfall, however, increases as elevation increases. Rainfall in October increases from 200 mm mo-1 (millimeters per month) in the lowlands to 370 mm mo-1 at the peaks.
Climatic variables also vary with season. During the dry season (e.g., March), monthly rainfall in the LEF is between 125 and 250 mm, while in the rainy season (e.g., October) the range of rainfall for the entire LEF is between 200 and 370 mm (fig. 20).
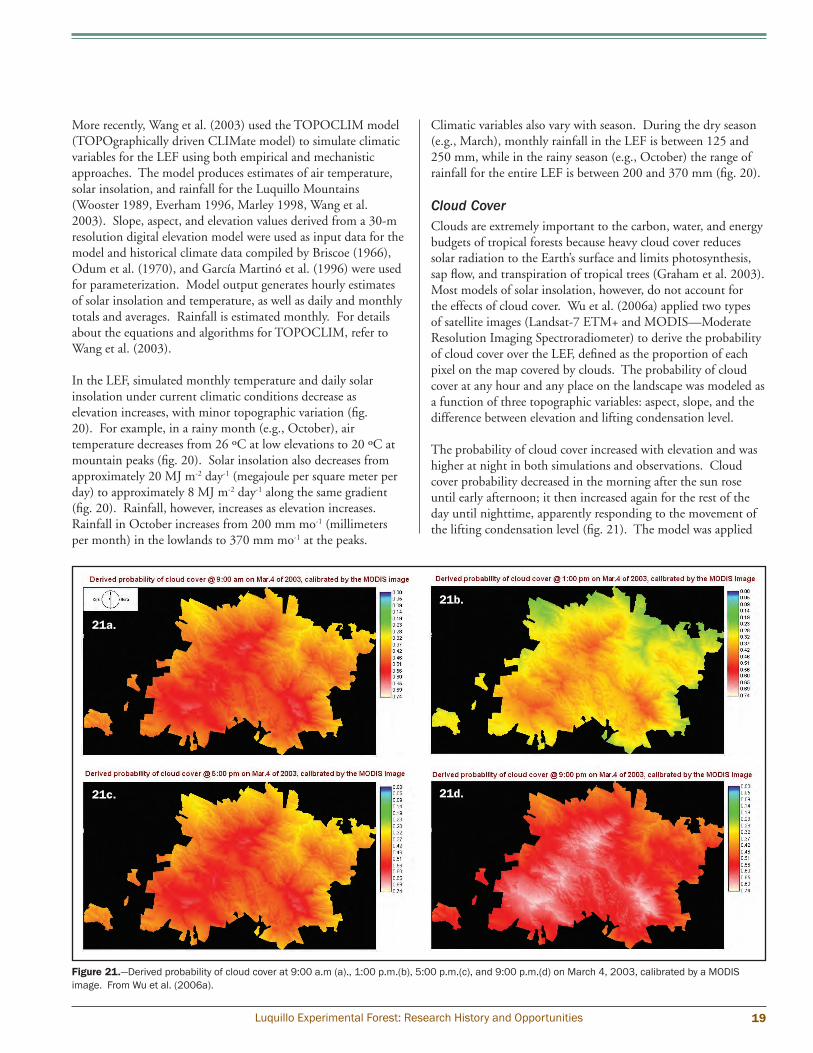
Cloud CoverClouds are extremely important to the carbon, water, and energy budgets of tropical forests because heavy cloud cover reduces solar radiation to the Earth’s surface and limits photosynthesis, sap flow, and transpiration of tropical trees (Graham et al. 2003). Most models of solar insolation, however, do not account for the effects of cloud cover. Wu et al. (2006a) applied two types of satellite images (Landsat-7 ETM+ and MODIS—Moderate Resolution Imaging Spectroradiometer) to derive the probability of cloud cover over the LEF, defined as the proportion of each pixel on the map covered by clouds. The probability of cloud cover at any hour and any place on the landscape was modeled as a function of three topographic variables: aspect, slope, and the difference between elevation and lifting condensation level.
The probability of cloud cover increased with elevation and was higher at night in both simulations and observations. Cloud cover probability decreased in the morning after the sun rose until early afternoon; it then increased again for the rest of the day until nighttime, apparently responding to the movement of the lifting condensation level (fig. 21). The model was applied
Figure 21.—Derived probability of cloud cover at 9:00 a.m (a)., 1:00 p.m.(b), 5:00 p.m.(c), and 9:00 p.m.(d) on March 4, 2003, calibrated by a MODIS image. From Wu et al. (2006a).
21a.
21b.
21c. 21d.

20 Luquillo Experimental Forest: Research History and Opportunities
Figure 23.—Predicted wind over a 180 x 180 km grid on September 18, 1989, during the passage of Hurricane Hugo. Cell size = 1 x 1 km. (a) Predicted sustained wind velocity and (b) predicted sustained wind direction at 1,200 GMT; (c) predicted maximum wind gust velocity and (d) predicted total energy of sustained winds of gale strength (17 m s-1) or greater over a 24-h period (time step = 2 min). From Boose et al. (1994).
to all months, and the simulations agreed with observed data that the probability of cloud cover is lower during the dry season, higher during the wet season, and moderate for the rest of the year. The cloud cover model used could usually predict the probability of cloud cover for each 100-m elevation band at a certain time of day with an index of agreement (IoA) of 0.560 to 0.919 and at a certain location over a day with an IoA of 0.940 to 0.994, indicating a medium-to-good model simulation at any particular time or location (fig. 22).
WindWind, especially hurricane-force wind, serves as an important source of landscape-level patterning in forests and is a major factor that influences vegetation dynamics (Boose et al. 1994). At the ecosystem level, extensive blowdown may factor into the regulation of hydrological, energy, and nutrient regimes (Lugo and Scatena 1995). Despite an awareness of the importance of hurricanes, ecologists have only a rudimentary understanding of how a hurricane’s energy is distributed.
Figure 22.—Comparison between an original Landsat image (combinations of band 4, 3, and 2 displayed as blue, green, and red, respectively) and the simulated probability of cloud cover calibrated by a MODIS image at the time when the Landsat image was obtained (cloudy areas had a higher probability of cloud cover; white lines on the Landsat images are the boundaries of the Luquillo Experimental Forest). (a) 20 March 20, 2000; (b) 9 January 9, 2001; (c) 20 July 20, 2001; (d) 4 March 4, 2003. From Wu et al. (2006a).
Boose et al. (1994) developed a simple model (HURRECON) of hurricane surface wind fields that was based on meteorological studies and calibrated with meteorological data for Puerto Rico. Another simple topographic exposure model (EXPOS) used wind direction predicted by HURRECON and a digital elevation model to predict site exposure to the strongest winds on a landscape scale. Simulated regional estimates of wind conditions in eastern Puerto Rico during the passage of Hurricane Hugo are shown in figure 23. Output from the topographic exposure model agreed with actual treefall data; most disturbance effects across the LEF were concentrated on north-facing slopes, while south-facing slopes that were exposed to the southwest or south-southwest winds of the trailing eyewall were not severely affected (Scatena and Larsen 1991). The actual east-to-west effects gradient across the northern LEF study area was even stronger than the model predictions suggested (e.g., although disturbance at El Verde was scattered and largely confined to defoliation and branch break, much of the Bisley Experimental Watershed area sustained much more severe effects, including massive uprooting and breakage of most stems).

Luquillo Experimental Forest: Research History and Opportunities 21
Disturbance has been a central focus of ecological research since its inception (Cowles 1899, Cooper 1926, Clements
1936), but most empirical research has focused on frequent, small-scale disturbances because they are easy to study. Before the creation of the National Science Foundation’s Long Term Ecological Research (LTER) Network, most long-term studies relied on retrospective analyses (e.g., Foster 1992, Horn and Sanford 1992) or on space-for-time substitution (Pickett 1989, Fastie 1995).
Since 1988, the Luquillo (LUQ) LTER has focused on the response of forest structure and dynamics to disturbance regimes ranging in size and effect (Guariguata 1990, Lugo and Scatena 1995, Walker at al. 1996a). Studies of disturbance in the Luquillo Experimental Forest (LEF) challenge the view that ecological systems are in a steady state regarding counteracting processes such as competitive hierarchies (Connell 1978), species immigration and extinction (Whittaker 1996), C (carbon) cycling (Lugo 1992a), and nutrient retention and loss (Lodge et al. 1994).
Common disturbances that influence ecosystem structure and function in the LEF include treefalls, landslides, hurricanes, and anthropogenic disturbance (Scatena and Larsen 1991, Scatena and Lugo 1995, Zimmerman et al. 1995, Reagan and Waide 1996, Lugo 2008). Treefalls create small gaps in the forest canopy, and landslides can create relatively larger gaps that also have exposed mineral soil. Hurricanes and anthropogenic disturbances produce larger scale effects that have long-term signatures on the structure of the forest landscape (Lugo 2008).
TreefallsTreefalls are a routine occurrence in mature forests but are also a major consequence of windstorms and hurricanes (Brokaw 1985, Foster 1988). Treefalls create gaps in the forest canopy that are critical to the regeneration of forest species. Despite the relatively small area of ground surface that is affected, treefalls alter the physical environment in ways that affect nutrient availability, light, litterfall, and forest regeneration (Richards
6. DisturbancesN.L. Harris and A.E. Lugo
Landscapeposition
Rate of formation(gaps ha-1 yr-1) Affected trees per gap
Canopy openingper gap (m2)
Aboveground biomass per gap
(Mg gap-1)
Ridges 0.9 1.8 (0.85, 7) 55 (45, 4) 1.37 (0.10, 4)
Slopes and upland valleys 0.5 2.0 (0.48, 12) 57 (21,6) 1.99 (1.11, 6)
Riparian valleys 1.7 1.4 (0.61, 13) 104 (65, 9) 1.81 (0.45, 9)
Total area 0.8 1.8 (0.40, 32) 76 (22, 19) 1.78 (0.38, 19)
Table 1.Standard error and sample size are in parentheses. Data for trees with DBH (diameter at breast height) ≥ 10 cm. From Scatena and Lugo (1995).
and Williamson 1975, Denslow 1987, Uhl et al. 1988). In boreal or temperate forests, slow decomposition of forest litter and cold, wet soils may limit regeneration; thus, exposure of mineral soil by an uprooted tree is essential in providing the increased nutrients, increased soil temperatures, and decreased soil moisture needed for establishing many plant species (Murray and Van Veldhuizen 1980, Thompson 1980, Beatty and Stone 1986). In tropical forests, light is often considered the resource that most limits the establishment and growth of plants in the understory (Denslow et al. 1990), although Walker et al. (1996b) noted dramatic species responses to artificial nutrient additions in hurricane-created gaps in the LEF, and Zimmerman et al. (1995) demonstrated by adding large amounts of woody debris that nutrients can be immobilized in tropical forest gaps.
Background estimates of the percentage of ground surface exposed by uprooting are generally low in the tropics (0.09 percent; Putz 1983) compared with the temperate zone (6 to 45 percent; Beatty and Stone 1986, Webb 1988). On average, the treefall-gap turnover rate is 100 percent per 135 years in the LEF (Lugo and Scatena 1995, Scatena and Lugo 1995), and the frequency of treefall gaps varies systematically with geomorphic setting and increases toward lower landscape positions (table 1). During the 2 years before Hurricane Hugo hit the LEF, the average canopy opening of 21 treefall gaps within a 13 hectares study area was 76 m2 (square meters) which is comparable to the 60 to 100 m2 openings expected from canopy trees of this size that have crown diameters ranging from 8.8 to 11.3 m (Scatena and Lugo 1995). When Hurricane Hugo passed directly over the LEF on September 18, 1989, 9 to 39 percent of the trees were uprooted, depending on distance to the center of the hurricane, and 56 percent of the trees in the LEF were severely defoliated (Brokaw and Walker 1991, Walker 1991). Subsequent uprooting of hurricane-affected trees continued for more than 3 years (Walker 1995). These continuing effects presented a unique experimental situation in which the defoliation of the canopy during the passage of Hurricane Hugo caused a temporary reduction in shade to both treefall soil pits and the undisturbed forest floor, but these two microsites had distinct soil conditions. Researchers used the opportunity to tease apart

22 Luquillo Experimental Forest: Research History and Opportunities
the effects of light and soil nutrient availability on recovery after treefall. Walker (2000) compared soil nutrient dynamics in soil pits of treefalls and the undisturbed forest floor after Hurricane Hugo occurred and found that soil in the pits under uprooted trees had lower N (nitrogen), lower phosphorus, and lower organic matter; was drier; had higher bulk densities; and was more acidic than soils from adjacent forest plots (table 2).
Soil concentrations of Al (aluminum) and Fe (iron) were higher and Ca (calcium) was lower in pit soils than forest soils, Mg (magnesium) tended to be higher in forest soils than pit soils, and K (potassium) and Mn (manganese) did not differ between pit and forest soils (table 3). These soil conditions, generally unfavorable to plant growth, resulted from the upheaval and removal of surface organic matter and exposure of subsurface mineral soils (Beatty and Stone 1986, Vitousek and Denslow 1986).
Canopy gaps resulting from treefall also influence light availability and subsequent plant responses (Chazdon and Fetcher 1984, Denslow 1987). Brokaw (1987) observed that background (nonhurricane) treefall gaps of at least 150 to 250 m2 are best for the establishment and growth of pioneers such as Cecropia schreberiana in the LEF. These species often have viable seeds in the soil that germinate in response to an increase in red: farred ratios or soil temperature and grow rapidly in high light environments (Silander 1979, Vázquez Yanes and Smith 1982, Denslow 1987). Upon canopy opening, Cecropia schreberiana has been observed to grow 2 to more than 4 m in height per year in the LEF (Silander 1979, Odum 1970a). Fernández and Fetcher (1991) evaluated light levels in a 32-m transect within the LEF after Hurricane Hugo occurred. They showed that 60 centimeters (cm) above the forest floor, median values of total daily photosynthetic photon flux density (PPFD) were
Tree species Plot typeOrganic
matter (%) Moisture (%) Bulk density (g m-2) pH
Ormosia krugii Pit 17.14 ± 0.82 27.91 ± 2.13 0.82 ± 0.02 3.40 ± 0.04
Forest 28.83 ± 1.61 40.22 ± 3.00 0.59 ± 0.06 3.53 ± 0.06
Casearia arborea Pit 20.22 ± 0.83 30.64 ± 2.71 0.83 ± 0.02 3.40 ± 0.05
Forest 25.94 ± 0.75 41.95 ± 2.51 0.65 ± 0.04 3.69 ± 0.08
Inga laurina Pit 19.22 ± 1.65 25.11 ± 1.91 0.83 ± 0.06 3.20 ± 0.04
Forest 26.53 ± 1.81 40.82 ± 2.44 0.63 ± 0.07 3.57 ± 0.13
Two-way ANOVA results:
Species effect 0.785 NS 0.436 NS 0.955 NS 0.399 NS
Plot type effect <0.001*** <0.001*** <0.001*** <0.002***
Species × plot interaction 0.614 NS O.864 NS 0.896 NS 0.575 NS
Table 2. Soil parameters from treefall pit and intact forest plots. Significant Analysis of Variance results are indicated by *** (P < 0.001). NS = not significant (P > 0.05). From Walker (2000).
Table 3. Elemental analyses of soils from the pit and forest plots (mg g-1). Significant Analysis of Variance results are indicated by * (Probability < 0.05), ** (P < 0.01), *** (P <0.001). NS = not significant (P > 0.05). From Walker (2000).
Tree species Plot type Nitrogen Phosphorus Aluminum Calcium Iron Magnesium Manganese Potassium
Ormosia krugii Pit 1.74 ± 0.10 0.22 ± 0.01 83.44 ± 4.03 0.17 ± .10 78.55 ± 3.76 0.99 ± 0.13 0.38 ± 0.14 0.51 ± 0.04
Forest 6.36 ± 0.53 0.30 ± 0.01 70.11 ± 4.03 0.86 ± 0.10 62.55 ± 3.76 1.30 ± 0.13 0.68 ± 0.14 0.61 ± 0.04
Casearia arborea Pit 3.06 ± 0.32 0.21 ± 0.01 68.07 ± 3.23 0.36 ± 0.08 62.28 ± 3.01 1.66 ± 0.11 0.35 ± 0.11 0.48 ± 0.03
Forest 5.41 ± 0.37 0.29 ± 0.01 59.92 ± 3.23 0.79 ± 0.08 54.35 ± 3.01 1.34 ± 0.11 0.52 ± 0.11 0.46 ± 0.03
Inga laurina Pit 2.71 ± 0.84 0.21 ± 0.02 66.25 ± 6.05 0.24 ± 0.15 64.25 ± 5.64 0.96 ± 0.20 0.25 ± 0.21 0.68 ± 0.07
Forest 6.03 ± 0.15 0.30 ± 0.02 57.00 ± 6.05 0.60 ± 0.15 50.50 ± 5.64 1.17 ± 0.20 0.35 ± 0.21 0.55 ± 0.07
Two-way ANOVA results:
Species effect 0.598 NS 0.765 NS 0.002** 0.439 NS 0.002** 0.696 NS 0.416 NS 0.027*
Plot type effect <0.001*** <0.001*** 0.009** <0.001*** <0.001*** 0.042* 0.157 NS 0.674 NS
Species × Plot interaction 0.032* 0.986 NS 0.774 NS 0.283 NS 0.479 NS 0.954 NS 0.809 NS 0.134 NS

Luquillo Experimental Forest: Research History and Opportunities 23
similar to values in large treefall gaps (>400 m2) for 10 months after the hurricane passed over the forest. By 14 months after the hurricane’s passage, regrowth of the forest understory and canopy had reestablished a shaded forest environment. Because large gap sizes (>150 m2) are not common in the LEF, except after hurricanes, widespread disturbance by hurricanes may be necessary to explain the current densities of C. schreberiana in the LEF (Brokaw 1998, fig. 24).
After Hurricane Hugo hit the LEF, Walker (2000) compared seedling and sapling dynamics of treefall pits and found that, although seedling densities did not differ between undisturbed soil and treefall pits, the number of species present (saplings and seedlings combined) was significantly lower in the soil pits under each species of uprooted tree than in the undisturbed soil
(fig. 25). Cecropia schreberiana seedlings grew into canopy trees only in the treefall pits, presumably as a consequence of both the temporary (ca. 1 yr) increase in light from defoliation of the surrounding canopy and the longer (ca. 2 to 4 yr) increase in light from the uprooting of the tree. This extended gap duration provided by the uprooting of trees and subsequent delay in canopy closure was critical for establishing C. schreberiana trees.
With the additional light following the defoliation of the LEF by Hurricane Hugo, treefall pits provided an opportunity for C. schreberiana saplings to reach the canopy, many of which survived to reproduce and reestablish the seed bank (Brokaw 1998). The net effect of the hurricane and treefall combination resembled multiple or large treefall gaps. In contrast, the temporarily higher light conditions in the forest plots due to
Figure 24.—Cecropia schreberiana sapling that was established due to high light levels from treefall in the Luquillo Experimental Forest. Photo by N. Harris.
Figure 25.—(a) Species and (b) seedling densities in treefall pits (open circles) and forest (closed circles) plots under a total of three uprooted tree species for seven sampling dates following Hurricane Hugo (September 1989; number m-2; ±SE; N=27). From Walker (2000).

24 Luquillo Experimental Forest: Research History and Opportunities
leaf loss during the passage of the hurricane were not sufficient to allow for the establishment of C. schreberiana trees or the growth of understory seedlings of other species into the canopy. Instead, existing canopy trees closed the gaps with lateral growth. Therefore, the net effect of treefall gaps on the species composition of the LEF was the increased number of C. schreberiana trees present during the 45 months after Hurricane Hugo came ashore (Walker 2000).
LandslidesA landslide is a common, natural mass-wasting phenomenon that occurs in mountainous areas throughout the world, including in the LEF, and represents a net downslope movement of material. Depending on the soil type, 6 to 24 percent of soil C stocks is exported downslope despite deposition from surrounding forest soils, litter from the surrounding landscape, and in situ successional regrowth (fig. 26). The term “landslide” means the downward and outward movement of hillslope-forming materials—natural rock, soils, artificial fills, or combinations of these materials (Schuster 1978). Landslides can include falls, topples, slides, spreads, and flows (Varnes 1978). Vegetation on recent landslides is very sparse, consisting mainly of mosses and isolated seedlings. Within 25 years, these landslides become covered with ferns and eventually with the seedlings and saplings that represent the mature forest. Cecropia schreberiana is the most abundant woody species growing on LEF landslide sites (Myster and Walker 1997) and the tree fern Cyathea arborea is also very common (Guariguata 1990, Walker et al. 1996a).
Landslides are part of the process of hillslope erosion and contribute to the introduction of sediment into streams, rivers, lakes, reservoirs, and finally the ocean. Landsliding triggered by earthquakes may be the most significant type of landslide in Puerto Rico over the long term (Keefer 1984), but hillslope modification for the construction of highways and other structures also frequently results in landsliding (Dames and Moore 1980, Molinelli 1984). For example, Larsen and Parks (1997) determined that within 85 m on either side of roads in the Luquillo Mountains, the rate of mass wasting was five to eight times higher than in forested areas; however, rainfall-triggered landslides are the most common type of landslide in the LEF. In 1989, Hurricane Hugo triggered more than 400 landslides in northeastern Puerto Rico (Scatena and Larsen 1991, Larsen and Torres Sánchez 1992). Guariguata and Larsen (1990) prepared a preliminary map of landslide locations in the LEF but more recently, Larsen and Torres Sánchez (1998) developed a map of 1,859 landslides that occurred in the LEF region between 1951 and 1990 (fig. 27) by compiling and analyzing approximately 300 sets of stereo aerial photographs (1:20,000 scale) in combination with a computerized Geographic Information Systems. The map was used to determine where landslides were common and to devise a method to assess the frequency of landslides over the landscape. Landslides were relatively evenly distributed among shallow soil slips, debris flows and slumps, with only a few debris avalanches. The estimated average frequency of landslides increased markedly as landscape disturbance increased from forests to agriculture areas to roads and structures (table 4). New landslides in the LEF affect 1 to 3 percent of the forest surface every 100 years (Walker et al. 1996a).
Slopewash refers to downslope soil sediment loss after a landslide. Larsen et al. (1999) measured a 4-year time series of slopewash and rainfall at two intact forest sites and two landslide scars in the LEF and showed a marked decrease in slopewash over time as landslide scars aged (fig. 28). The slopewash rate of a fresh landslide scar was equivalent to 2 to 40 times the mean annual slopewash rate for undisturbed forest, attesting to the importance of landslide scars as localized sediment sources. By the end of the study, slopewash rates on both landslide scars were lower than rates under the forest canopy, suggesting that the hydrologic and biologic characteristics of the soil surface on the landslide scar had been substantially altered. The possibility of the decrease in slopewash over time on landslide scars as attributable to the decline in rainfall during the study period was evaluated by calculating slopewash concentration, expressed as slopewash divided by surface runoff. Slopewash concentration measured on the landslide scars decreased by a factor of 35 to 70, while slopewash concentration decreased by no more than a factor of 4 on the forested hillslopes.
Figure 26.—Distribution of carbon within each soil type (volcaniclastic, dioritic, 0 to 10 cm depth) from three measured carbon pools: outputs of soil and litter (-) and inputs of litter (+). Proportions of total C within each soil type are based on means (g C m-2) of biweekly measurements (December 2003 to May 2004) from 1-m2 plots on 8 to 13 month old landslides in Puerto Rico. From Walker and Shiels (2008).

Luquillo Experimental Forest: Research History and Opportunities 25
Figure 27.—Shaded relief map of the Blanco study area in Puerto Rico, showing locations of landslides and rivers. From Larsen and Torres Sánchez (1998).

26 Luquillo Experimental Forest: Research History and Opportunities
Slopewash rates on landslide scars seem to be controlled strongly by the state of vegetative and soil recovery. In the study by Larsen et al. (1999), the saprolite (i.e., deposits of clay and disintegrated rock found in situ) exposed on the surfaces of the landslide scars was denser and less porous compared with that of the soils beneath the forest canopy. In addition, a pervasive black epiphyll crust composed of mosses and blue-green algae (Nostoc, Scytonema, Anabaena and Caolthrix) developed on the landslide
scar surfaces. Both factors effectively sealed the soil surface and reduced the tendency for rainsplash to detach soil particles. As the landslide scar surface is revegetated by seedling recruitment and encroachment along the perimeter, penetration by roots and soil mesofauna gradually returns the soil surface (slopewash rates, soil organic material) to the conditions observed under the forest canopy (Zarin and Johnson 1995, Larsen et al. 1999). Just as soil conditions have returned to predisturbance status, however, the local-scale landslide disturbance cycle may be reset by hurricanes, which have directly crossed the LEF about once every 60 years during the past several hundred years (Scatena and Larsen 1991, Scatena 1995). About 60 years is required for forest regeneration after landslide disturbance in the uplands of the LEF (Guariguata 1990), but regeneration may be faster if bird perches are present on the landslide to facilitate forest seed inputs through bird dispersal (Shiels and Walker 2003).
Regeneration of forests on landslide scars affords an opportunity to explore how forest vegetation and its associated microbes accumulate and manage reservoirs of nutrient capital (Frizano et al. 2002). Although oligotrophic soils, with a high dependence on biological recycling of mineral nutrients, have been associated with tropical forest ecosystems considered to be extremely sensitive to disturbance (Uhl et al. 1982), landslide scars in the LEF regain predisturbance levels of major nutrients rapidly (Zarin 1993). Zarin and Johnson (1995) documented the rates at which aboveground and belowground pools of several nutrients recovered during afforestation of landslide scars in the palo colorado (Cyrilla) forest type by evaluating data from
Elevation Slope orientation Slope angle Landslides per km2 per decade
Forest land use Agricultural land use Roads and structures
> 400 m Lee of prevailing wind > 12° 0.5 1.0 5.4
≤ 12° 0.9 1.6 3.0
Normal to prevailing wind > 12° 0.7 2.3 6.3
≤ 12° 0.7 1.4 5.5
Facing prevailing wind > 12° 1.2 8.8 15.4
≤ 12° 1.1 2.5 9.0
≤ 400 m Lee of prevailing wind > 12° 0.8 3.3 6.0
≤ 12° 0.3 1.0 0.6
Normal to prevailing wind > 12° 1.0 4.5 4.4
≤ 12° 0.4 1.3 0.4
Facing prevailing wind > 12° 1.7 8.4 8.9
≤ 12° 0.5 2.6 1.1
Averages 0.8 2.5 3.2
Table 4. Matrix showing the estimated frequency of landslides (number of landslides per km2 per decade) in 36 geographic categories in the Río Blanco study area. From Larsen and Torres Sánchez (1998).
Values calculated by first dividing the number of landslides per category by area in km2 and then dividing by 5 to account for the five decade span of data.
Figure 28.— Mean monthly slopewash and rainfall on forested hillslopes and on landslide scars. Note the logarithmic scale. (a) Site F1 is a Dacryodes-dominated forest, and Site LS1 is on a 1991 landslide scar with active vegetation regrowth. (b) Site F2 is a Cyrilla-dominated forest, Site F3 is elfin forest, and Site LS2 is a 1989 landslide scar. From Larsen et al. (1999).

Luquillo Experimental Forest: Research History and Opportunities 27
a chronosequence of landslide scars in the LEF. Landslide scars ranged in age from 1 year to more than 55 years. They found that major nutrient cation concentrations (neutral-salt-extractable Ca2+, Mg2+, K+, and total soil N pools) recovered to prelandslide levels in less than a century (fig. 29), but extractable inorganic P (phosphorous) present in the soil of recent landslide scars was undetectable. Table 5 summarizes regression equations that estimate rates of change during the course of the more-than-55-year landslide scar sequence for each variable measured.
Frizano et al. (2002) determined the rate at which labile P capital recovers during primary succession on landslides and concluded that a net increase in labile P is supplied from at least two sources: atmospheric deposition and allochthonous litter input—and probably from a third source, the pool of inorganic occluded P. In the top 10 cm of soil, organic matter, labile and total organic P increased with landslide age and labile soil P increased to approximately two-thirds of the predisturbance levels in the oldest landslide scar (>55 yr) (table 6). Thus, plants, their associated microflora and microfauna, and P inputs from offsite sources, substantially altered the distribution of soil P fractions during forest recovery. Figure 30 illustrates the correlations between percent C and resin-Pi (inorganic phosphorus released to anion exchange resin) and between percent C and the labile P pool. These results correlate with the findings of others
who have studied acidic, highly weathered soils (Tiessen et al. 1994). They are also consistent with the idea that turnover of easily mineralized organic P through microbial mediation is an important controller of plant-available inorganic P in LEF forests more than 55 years old (Frizano et al. 2002). The added P is captured by forest biota and returned to the soil in organic combinations. In the longer term (decades), it appears that the most important source of plant-available P shifts to the labile P pool whereby vegetation relies on the processing and cycling of readily mineralizable organic P.
Concurrent with the increase in exchangeable nutrient cation values is a rapid (i.e., within 60 years, Guariguata 1990) reestablishment of plant biomass both aboveground and belowground (Zarin 1993). Mortality and decomposition of biomass provides the developing soil with organic matter, which may be of central importance in the provision of exchange sites and/or major nutrients (fig. 30). For observed increases in soil organic matter (SOM) and nutrient content to occur along with the rapid forest regrowth, nutrient sources outside the initial exchange pool present in the soils of the new landslide scars must be available. In the LEF, after about 30 years after landslide disturbance, the supply of labile P in the soil far exceeds the annual demand for P (Frizano et al. 2002).
Variable Regression equation R P
Clay 12.7 + 5.03 [log(years)] 0.61 0.036
SOM 0.90 + 1.53 [log(years)] 0.74 0.006
Ca2+ 0.90 + 0.0 (years) 0.92 <0.001
Mg2+ 0.12 + 0.25 [log(years)] 0.76 0.004
K+ 0.08 + 0.05 [log(years)] 0.57 0.051
Al– 2.17 – 0.37 [log(years)] 0.52 0.082
Ca + Mg + K 0.23 + 0.56 [log(years)] 0.83 0.001
Ca = Mg + K + Al 2.45 + 0.01 (years) 0.28 0.410
BSI 0.13 + 0.20 [log(years)] 0.85 <0.001
Table 5. Regression equations calculated based on minimum age estimates for the 1 to 55+ year landslide chronosequence in the Luquillo Experimental Forest (Zarin and Johnson 1995).
Units are percent for Clay and Soil Organic Matter (SOM), and cmol+ kg-1 for the exchangeable cations.BSI = [Ca + Mg + K]/[Ca + Mg + K = Al]. R = a correlation coefficientP = the probability
Figure 29.—Base saturation index values calculated from surface mineral soil characteristics for a chronosequence of landslide scars and two late-succession vegetation associations (tabonuco and palo colorado). Data and regression calculations for the landslide chronosequence are plotted according to minimum plot age estimates of 1, 12, 27, and 55 years (based on aerial photographs). Estimated ages for palm brake and palo colorado forest are more than 100 years and more than 300 years, respectively. From Zarin and Johnson (1995).

28 Luquillo Experimental Forest: Research History and Opportunities
Vegetation characteristics on recent (13-month-old) landslides appear to vary with soil type (Shiels et al. 2008). Vines, trees, shrubs, and ferns with a high proportion of biomass aboveground tend to dominate volcaniclastic landslides (high soil clay, N, water-holding capacity, and low elevation), while herbs and mosses (bryophytes) with a higher proportion of
belowground biomass dominate the diorite substrate (table 7). Fern thickets on low-nutrient landslide soils appear to facilitate germination but inhibit growth of tree seedlings, possibly delaying forest development on landslides. Walker (1994) investigated the effects of fern thickets on landslide succession in the LEF and found that soil moisture and total soil N were
Plot ageDepth (cm) N (%) C (%) Resin-Pi Pi Po Pi Po
Dil. HCl-Pi Pi Po
Residue P Total P
1986-1991 0-10 0.034 0.28 1.11 <0.04 0.22 11.20 4.39 2.60 124 2.97 18.2 162
(0.062) (0.96) (<0.04) (0.53) (2.75) (0.62) (18.9) (2.03) (2.15) (23.1)
10-35 0.026 0.13 0.99 <0.04 <0.04 8.62 6.26 1.71 139 0.240 23.6 165
(0.001) (0.014) (0.48) (<0.04) (<0.04) (0.20) (1.26) (0.86) (23.6) (0.14) (3.20) (15.6)
35-60 0.017 0.07 1.05 <0.04 <0.04 9.90 6.55 2.08 151 8.10 17.0 181
(0.009) (0.015) (0.20) (<0.04) (<0.04) (0.33) (0.99) (0.94) (27.9) (1.44) (1.40) (40.6)
1972-1979 0-10 0.05 0.72 1.45 0.33 1.43 5.83 16.0 4.64 94.6 2.90 20.3 146
(0.006) (0.08) (0.82) (0.33) (1.15) (3.00) (6.90) (1.70) (4.40) (1.10) (0.20) (5.20)
10-35 0.03 0.19 0.86 <0.04 <0.04 13.6 8.62 3.33 82.5 2.10 21.1 119
(0.001) (0.05) (0.86) (<0.04) (<0.04) (1.90) (4.20) (0.20) (11.70) (0.30) (0.90) (11.6)
35-60 0.008 0.07 1.31. <0.04 <0.04 8.72 3.75 4.05 75.6 2.80 17.8 111
(0.008) (0.02) (0.71) (<0.04) (<0.04) (0.24) (1.40) (0.60) (5.00) (0.90) (2.10) (4.10)
1951 0-10 0.13 2.32 9.50 1.40 3.30 17.2 49.0 9.60 147 17.8 42.42 292
(0.01) (0.24) (2.80) (0.69) (1.40) (11.9) (15.5) (3.90) (43.0) (13.60) (6.00) (25.1)
10-35 0.08 1.00 3.10 0.70 0.09 16.9 30.1 4.40 104 20.7 35.5 208
(0.02) (0.25) (0.80) (0.40) (0.06) (7.90) (18.1) (2.00) (26.6) (11.6) (3.00) (21.5)
35-60 0.05 (0.48) 1.54 0.20 0.88 28.3 7.35 4.70 131 16.8 35.1 212
(0.01) (0.16) (0.69) (0.05) (0.50) (6.60) (2.30) (0.80) (34.0) (14.2) (4.60) (22.0)
Pre-1936 0-10 0.16 1.80 2.12 1.12 2.40 16.8 22.8 0.64 26.8 7.85 20.0 100
(0.02) (0.40) (0.30) (0.40) (1.70) (0.40) (3.60) (0.20) (1.50) (2.30) (1.50) (1.70)
10-35 0.12 1.33 2.22 0.52 1.19 28.5 23.2 3.24 33.7 4.76 26.0 123
(0.02) (0.30) (1.20) (0.52) (0.50) (13.8) (6.90) (0.50) (8.50) (0.50) (6.50) (36.0)
35-60 0.05 0.42 0.56 <0.04 1.14 9.70 4.92 3.07 33.9 35.3 18.07 105
(0.02) (0.20) (0.40) (<0.04) (1.14) (0.70) (2.50) (1.10) (11.0) (33.0) (1.80) (22.0)
CDF 0-10 0.27 4.22 15.4 0.91 5.16 4.15 59.8 0.50 26.6 10.9 25.3 149
(0.01) (0.14) (2.40) (0.91) (1.40) (4.15) (3.90) (0.37) (3.30) (1.90) (2.40) (14.3)
10-35 0.12 1.27 3.09 0.14 0.52 18.1 11.9 0.31 22.9 3.09 25.0 83.1
(0.001) (0.03) (0.73) (0.14) (0.52) (2.10) (0.68) (0.27) (1.20) (0.90) (1.20) (4.70)
35-60 0.08 0.82 1.85 0.76 0.57 14.5 4.80 1.22 27.0 2.92 21.0 72.9
(0.006) (0.08) (0.94) (0.76) (0.57) (4.60) (1.30) (0.19) (4.40) (0.50) (0.60) (2.80)
Table 6. Soil nutrient concentrations from a chronosequence of landslide scars (<5 to >55 yr in age) and a mature forest (CDF*; ca 300 years old) in the Luquillo Experimental Forest. Values presented are means with standard errors in parentheses. For C, N, and the P fractions, N=3 samples per depth for all sites, except at the 1986 to 1991 site, N=2 in the 0 to 10 cm depth interval; at the 1951 to 1964 sites, N=4 in the 0 to 10 and 35 to 60 cm depth intervals and N=5 in the 10 to 35 cm depth interval. P concentration units are in μg g-1 (Frizano et al. 2002).
*Cyrilla-dominated forest.
NaHCO3- Concentration HCl-NaOH-

Luquillo Experimental Forest: Research History and Opportunities 29
higher under fern thickets than in adjacent open areas and soil bulk density and soil surface temperatures were lower. Seeds of Cecropia schreberiana sown under fern thickets germinated more than those sown into adjacent open areas, but tree seedlings of Tabebuia heterophylla exhibited a threefold lower photosynthetic
rate under ferns, probably resulting from a 12-fold reduction of PPFD. Although the growth of Tabebuia seedlings was reduced under ferns, the distribution of seedlings of naturally occurring woody plants was not strongly correlated with the presence of fern thickets.
Figure 30.—Relationship between landslide percent soil carbon and (a) the extractable phosphorus pool and (b) the labile phosphorus pool in the Luquillo Experimental Forest. From Frizano et al. (2002).
30a. 30b.
Vegetation measurement
Soil type Significancea
Volcaniclastic Diorite P b
Biomass (g m-2)
Trees and shrubs 18.07 ± 9.65 1.40 ± 0.99 <0.001
Herbs 2.37 ± 1.88 7.72 ± 4.03 0.698
Vines 22.66 ± 10.19 1.57 ± 0.78 0.002
Graminoids 10.94 ± 5.53 2.94 ± 1.61 0.036
Fernsc 4.55 ± 1.79 0.92 ± 0.38 0.002
Bryophytes 0.12 ± 0.12 0.65 ± 0.43 0.436
Total aboveground 58.71 ± 23.57 15.28 ± 6.13 0.007
Total belowground 17.70 ± 6.48 41.75 ± 22.77 0.997
Total 76.41 ± 28.70 57.03 ± 23.93 0.227
Cover (%)
Trees and shrubs 19.57 ± 6.24 2.20 ± 1.22 <0.001
Herbs 3.50 ± 1.80 13.29 ± 4.70 0.617
Vines 10.75 ± 4.12 1.50 ± 0.93 0.002
Graminoids 8.13 ± 3.31 3.65 ± 0.95 0.082
Ferns 9.71 ± 2.83 3.81 ± 2.07 0.011
Bryophytes 8.86 ± 3.69 9.25 ± 2.62 0.992
Total 40.88 ± 7.26 23.64 ± 5.71 0.031
Table 7. Vegetation characteristics (mean ± SE) on 13-month-old landslides with two different soil types (volcaniclastic, n=8; diorite, n=22) in the Luquillo Experimental Forest. From Shiels et al. (2008).
a Results of the Multivariate Analysis of Variance for all variables listed in the biomass category (Wilks’ Lambda = 0.463, P = 0.038, F9.20 = 2.573), and the cover category (Wilks’ Lambda = 0.433, P = 0.005, F7.22 = 4.113).
b P = Probabilityc The fern category includes fern allies.

30 Luquillo Experimental Forest: Research History and Opportunities
On landslides in the LEF, leaf litter of the Cyathea tree fern decomposes significantly faster than Cecropia schreberiana leaf litter (Shiels 2006), most likely due to differences in leaf litter chemistry between the two species. Decomposition rates on landslides are low compared with rates reported in past studies in intact forest in the LEF (Zou et al. 1995, González and Seastedt 2001, Myster and Schaefer 2003), most likely due to fewer decomposer organisms and to severe environmental conditions on landslides (Calderón González 1993, Walker et al. 1996a). Decomposition rates on landslides are also consistent across widely ranging landslide conditions, which suggests that the species of leaf litter has a greater effect on decomposition rates than the location and environmental conditions on a particular landslide (Shiels 2006).
HurricanesIn recent decades, between 8 and 11 hurricanes have occurred in the Atlantic Ocean each year on average (Riehl 1979, Gray 1990), and an average of 1 to 2 hurricanes per year occur throughout the Caribbean. The island of Puerto Rico has experienced more than 70 hurricanes since 1700 (Salivia 1950, Millas 1968, Neumann et al. 1987, Heartsill Scalley et al. 2007)—approximately 1 every 21 years—including severe storms in 1899, 1928, 1932, 1989, and 1998 (Gifford 1905, Bates 1930, Weaver 1987, Scatena and Larsen 1991). Hurricanes generally approach the island of Puerto Rico from an easterly direction (fig. 31).
Hurricanes are classified by their intensity into five wind-speed categories according to the Saffir/Sampson Hurricane Scale (table
Figure 31.—Paths of hurricanes that have crossed Puerto Rico since 1700. Adapted from Salivia (1972), Weaver (1986b), and NWS (1990)¸ in Scatena and Larsen (1991). Note that Hurricane Georges (1998) is missing from the figure.
8, Neumann et al. 1978, Gray et al. 1997). Hurricane Hugo, a category 3 hurricane, passed over the extreme eastern tip of Puerto Rico on September 18, 1989, with maximum sustained winds in a northwesterly direction of 57 m s-1 (meters per second). Effects in the LEF were severe, particularly at the Bisley study site in the northeastern portion of the LEF, where extensive areas of forest were blown down. Nine years later on September 21, 1988, Hurricane Georges, also a category 3 hurricane, passed over the island.
The occurrence of hurricanes in the LEF has a marked influence on the structure and dynamics of plants and animals in the LEF. Much has been learned about these effects since the Brown et al. (1983) report, due to the extensive research conducted in the forest after Hurricanes Hugo and Georges occurred. In the 20 years since the passage of Hurricane Hugo, the effects of hurricane disturbances on ecosystem processes have been an important focus of research for the LUQ LTER Program (Waide and Lugo 1992, Lugo and Waide 1993). Lugo (2008) reviewed the visible and invisible effects of hurricanes on forest ecosystems; much of the information presented in the following section is paraphrased from this extensive review.
From an energy perspective, hurricanes have a global role in the heat balance of the Earth by transporting excess tropical heat to higher latitudes, dissipating approximately 36 x 1010 kWh (kilowatt hour) of energy per day, or at a daily dissipation rate equivalent to about 10 percent of the annual electrical output of the United States in 1999 (DOE 2000). The passage of hurricanes is controlled by sea surface temperature, atmospheric pressure, and high-altitude wind conditions (Emanuel 1987,

Luquillo Experimental Forest: Research History and Opportunities 31
2005; Gray et al. 1997). The location of landmasses and local topography play a role in determining the direction and speed of the hurricane’s passage as well as the effects it has on vegetation (Boose et al. 1994, Foster and Boose 1995, Turton 2008, Turton and Stork 2008). Hurricanes require warm water to maintain strength, which is why the storm strength diminishes when landfall is achieved. The rate of forward movement is faster for hurricanes at higher latitudes than for hurricanes at lower latitudes, which means that hurricanes at lower latitudes have longer periods of interaction with tropical forests than they do with temperate forests (Foster and Boose 1995).
Changes in Environmental ConditionsTwo environmental factors of hurricanes—rain and wind—have strong and independent interactions with forests. Wind causes biomass and nutrient transfer to the forest floor as a result of treefalls and treesnaps (Frangi and Lugo 1991, Lodge et al. 1991) as well as indirect mortality effects (Lugo and Scatena 1996). For example, defoliation during the passage of Hurricane Hugo deposited a thick layer of litter to the forest floor in the LEF equivalent to more than 1 year of normal litterfall (Lodge et al. 1991). The second environmental factor—rain—can result in landslides, which transport materials away from the stand (Larsen and Torres Sánchez 1992, Larsen and Simon 1993). These two effects have different consequences. Mass transfer in situ (from the canopy to the forest floor) maintains forest stand conditions, which can quickly restore a closed canopy forest through succession. More importantly, tree uprooting affects soil morphology, surface characteristics, nutrient availability, regeneration trends, and forest age structure (Schaetzl et al. 1989). In effect, hurricanes basically shift the ecological space available to organisms (sensu Hall et al. 1992) and set in motion several biotic responses that range temporally from seconds to centuries, eventually culminating in mature stands that can be either similar to or different from the prehurricane stand.
As a result of the wind effects on trees and the removal of the canopy, light levels at the forest floor increase dramatically after a hurricane has passed (Walker et al. 1992). Median PPFD at midday in the LEF rose from 23 µmol m-2 s-1 (micromole per
Figure 32.—Frequency distribution of photosynthetic photon flux densities (PPFD) (1100 to 1300 local time) at the forest floor in the Luquillo Experimental Forest before (N=21,660 records) and after (N=34,548 records) Hurricane Hugo passed over the forest. From Walker et al. (1992).
SS scaleCentral pressure
(mbar)Maximum sustainedwind speed (m s-1) Storm surge (m)
Relative potential destruction
1 980 33 – 42 1.0 – 1.7 1
2 965 – 979 43 – 49 1.8 – 2.6 10
3 945 – 964 50 – 58 2.7 – 3.8 50
4 920 – 944 59 – 69 3.9 – 5.6 100
5 <920 >69 ≥5.6 250
Table 8. Criteria by which hurricane intensity is defined according to the Saffir/Simpson (SS) scale (Gray et al. 1997, cited in Lugo 2000).
square meter per second) before Hurricane Hugo hit to 404 µmol m-2 s-1 afterward, and the distribution of PPFD after the hurricane occurred showed a high proportion of observations more than 1,000 µmol m-2 s-1 (fig. 32), indicating that much of the forest was exposed to direct beam solar radiation.
The passage of Hurricane Hugo over the Bisley Experimental Watersheds at the LEF affected the hydrologic cycle by decreasing evapotranspiration and increasing throughfall as a result of diminished leaf area (Scatena and Larsen 1991, Scatena et al. 1996, Heartsill Scalley et al. 2007). During the 2-week period before Hurricane Hugo hit the island, rainfall in eastern Puerto Rico was 80 to 85 percent below normal (NWS 1990). During the storm, however, rainfall totals ranged from 100 to 339 mm and precipitation intensities ranged from 34 to 39 mm hr-1 (millimeters per hour) (U.S. Department of Commerce 1990). During the weeks after the hurricane came ashore, large

32 Luquillo Experimental Forest: Research History and Opportunities
Figure 34.—Damage index in relation to various forest or individual tree characteristics. The damage index was calculated as the percent of trees that uprooted, snapped, or had less than 50 percent canopy branch loss (i.e., heavy effect) of all the trees in that class. Damage index in relation to (a) tree size; (b) crown class; (c) topography, as determined for each tree during a 1992 survey; (d) from Hurricane Georges (1989) in relation to tree effects from Hurricane Hugo (1989). Trees were classified into effect categories in 1992, and the previous effect is related to the amount of effect in 1998 during the second storm. From Ostertag et al. (2005).
Figure 33.—Departure from mean monthly rainfall for long-term rainfall stations at Fajardo, eastern Puerto Rico, and the northern slopes of Puerto Rico. From NWS (1990), in Scatena and Larsen (1991).
areas of Puerto Rico experienced below average rainfall (fig. 33). Monthly rainfall totals were below long-term averages at Fajardo (NWS 1990) and within the LEF at El Verde until the end of the calendar year. Within 12 to 24 hours after storm rainfall ended, all the streams returned to prestorm discharge rates. Hurricanes lower the sediment load of rivers by dislodging and displacing vegetation, debris accumulated on hillslopes and small channels, blocking bridges, and forming debris dams as shown in Lake Loíza, Puerto Rico by Gellis (1993). These debris dams cause backwater effects that reduce stream velocities and decrease suspended-sediment loads.
Changes in Forest StructureThe most common effect of hurricanes on forest structure is defoliation (Bates 1930, Wadsworth and Englerth 1959), which is the direct result of wind energy dissipation onto the canopy interface. Other effects on forest structure include stem breakage (from small limbs to stem boles, which can snap at the base or at any height) and uprooting, which can range from various levels of leaning to complete blowdown of the tree, thereby exposing the complete root system to the atmosphere (Putz et al. 1983).
The ability to resist hurricane effects is a property of both individuals and communities and can have strong effects on the structure and function of tropical forests. The fraction of trees affected by wind is explained by differences in canopy size and architecture. In general, trees with larger canopies, with higher growth rates, and/or that are present on ridges and valleys experience more wind effects than trees with smaller canopies in the forest understory, with slower growth rates, and that are present on slopes (fig. 34). Trees on ridges, however, exhibited less wind effects than trees on slopes in the Bisley Experimental Watersheds during the passage of Hurricane Hugo (Scatena and Lugo 1995). The inconsistency at Bisley is explained by exposure relative to the storm path (windward versus leeward), strength of winds, soil types, and vegetation structure. At El Verde, which is on the leeward side of the mountain, only about 25 percent of all trees had some visible wind effects after Hurricane Hugo hit (Zimmerman et al. 1994), while 60 percent of the trees were visibly affected in the windward sector of Bisley (Basnet et al. 1992).
Pioneer species, with their low wood density and low shade tolerance, experienced larger wind effects after the passage of Hurricane Hugo in terms of stem breakage and mortality than nonpioneers (Zimmerman et al. 1994, Everham 1996). Also, the growth of pioneer species in lower elevation forests and graminoid species in elfin woodlands was stimulated more by experimental nutrient additions than in mature forest species (Walker et al. 1996b). The lower wind effects and lower response to fertilization experienced by slow growing trees suggest that they can slowly but steadily reclaim and retain dominance in a frequent disturbance regime. After Hurricane Hugo hit, nonnative herbaceous plants and trees germinated
in places with an open canopy and lasted 10 to 15 years before returning to prehurricane low densities (Chinea 1999, Thompson et al. 2007), but the nonnative species ultimately failed to survive once the canopy closed and native species regained their dominance. Thus, a slow growth rate might represent a hurricane response syndrome among tree populations that includes architecture, elastic modulus, successional status,

Luquillo Experimental Forest: Research History and Opportunities 33
and wood density. Larger, more mature trees tend to develop on forest areas that escape large hurricanes due to either lower exposure or resistance to wind from the presence of tree unions through root grafting, which steadies trees during a windstorm (Basnet et al. 1992). These refugia are paradoxical in the sense that old trees are supported under a disturbance regime that generally tends to select for young rather than old trees.
After a hurricane makes landfall, there is also massive seed germination and subsequent growth of vines, tree seedlings, and herbaceous plants (Lugo and Zimmerman 2002), releafing of defoliated plants, abundant sprouting of new branches and stems, and epicormic tree growth (Zimmerman et al. 1994). In response to high light levels, new leaves produced after the passage of the hurricane likely have very high photosynthetic rates (Harris 2006, Harris et al. in press) that facilitate initial rapid recovery of forest structure. Typically, after a hurricane
passes, tree density and aboveground biomass decrease (Scatena et al. 1996, Frangi and Lugo 1998) but basal area may or may not decrease; it all depends on the strength of the hurricane and the level of tree mortality. For example, after Hurricane Hugo occurred, Fu et al. (1996) reported reductions in basal area and tree density in a mahogany plantation and paired secondary tabonuco forest at El Verde. After Hurricane Hugo occurred in 1989 and Hurricane Georges passed over the island in 1998, however, a mature tabonuco forest near the site studied by Fu et al. (1996) did not experience basal area reduction (fig. 35b).
In the years following the passage of strong hurricanes, structural parameters (tree density, biomass, and basal area) increased rapidly in all forest types in the LEF (fig. 35a-c, Fu et al. 1996, Scatena et al. 1996, Frangi and Lugo 1998). About 15 years after the hurricane passed, tree density reached a peak and both basal area and aboveground biomass stabilized (fig. 35b, c). After
Figure 35.—Long-term trajectories of change (1943 to 2005) in tree structure of a tabonuco (Dacryodes excelsa) forest plot at El Verde: (a) tree density; (b) basal area; (c) aboveground tree biomass; (d) The Shannon-Weiner species diversity index (dots) and Pielou’s J evenness index (squares). These data were collected by a variety of people, including F.H. Wadsworth and T. Crow and synthesized by Drew et al. (2009). A major hurricane (San Cipriano) passed over the site in 1932. Hurricanes Betsy (1956), Hugo (1989), and Georges (1998) also influenced stand dynamics. From Lugo (2008).
35a.
35c.
35b.
35d.

34 Luquillo Experimental Forest: Research History and Opportunities
15 years, stands entered a thinning phase that increased tree mortality and reduced tree density. The reduction in tree density made more room for surviving trees and resulted in a spurt in basal area and an increase in biomass.
Rapid changes in tree density, basal area, and aboveground biomass are accompanied by an equally dramatic change in stand composition and species diversity (fig. 35d). The hurricane’s disturbance increases the species diversity of stands because pioneer and nonpioneer species grow together and compete for light and space in the developing forest. More than a decade after the last hurricane passed over the LEF (Hurricane Georges in 1998), the competition for canopy space is still intense; the competitors include surviving upper canopy elements, sprouting trees and branches, seed-regenerated trees, and preexisting seedlings and saplings that sprint skyward stimulated by the high light conditions. Nearly 20 years after Hurricane Hugo occurred, canopy morphology has not returned to prehurricane conditions, but leaf area index (LAI), litterfall, and hydrologic fluxes (interception and throughfall) have (Scatena, unpublished data; Heartsill Scalley et al. 2007).
Like animal dispersal in response to habitat changes, plants also appear to scatter in ecological space after the passage of hurricanes and then reaggregate as prehurricane stand conditions return. Heartsill Scalley et al. (2010) showed this with species ordinations at the watershed scale (fig. 36). Before the hurricane occurred, species were grouped into four distinct species clusters with particular structural features. After the hurricane passed, new species combinations developed and the location of plots expanded into a multidimensional space such that species groupings were not detected in ordinations. After 15 years of succession, the original species clustering was not reestablished as species continued to migrate in multidimensional space.
Animal ResponsesConditions for animals change dramatically with the opening of the forest canopy and the transfer of large amounts of biomass to the forest floor after a hurricane occurs. Hurricanes not only rearrange the structure of the vegetation, they also affect many basic processes that influence animal population size and composition. Alteration of the canopy structure by hurricanes basically compresses the forage space available to organisms into fewer vertical (understory and canopy) and horizontal (gap and no gap) strata (Wunderle 1995). For example, canopy birds are forced to feed on the forest floor or understory, which increases the number of interactions among species that normally do not interact, owing to their vertical segregation (Wunderle et al. 1992). Over longer periods of evolutionary time, the frequent occurrence of hurricanes might explain the tendency for Caribbean forest-dwelling bird species to segregate into just two vertical layers, compared with those in Panama, which recognize four layers (Wunderle et al. 1992). Wunderle (1995) showed that a lag exists between reestablishing feeding guilds
and developing the vegetation structure that normally supports those guilds. Bird assemblages did not develop immediately after vegetation profiles began to define gap areas from no-gap areas because fruit production peaked in some locations and not in others. Avian populations returned to prehurricane levels within 6 to10 months, suggesting that the reduction of bird populations was mostly due to bird movements in search of food (Waide 1991), rather than mortality. Examination of avian stomach contents showed changes in diets (insectivorous birds feeding on different kinds of arthropods) and reductions in consumption, suggesting that hurricane disturbances induce feeding plasticity in Caribbean birds (Waide 1991).
In several studies, the capture of birds with mist nets located at ground level increased after a hurricane occurred. For example, after Hurricane Georges passed over the Maricao State Forest in Puerto Rico, counts increased from 26.8 to 57.9 individuals per net hour (Tossas 2006). Like plant responses, bird responses to hurricanes are species and/or guild specific, with some species or guilds showing no net effects, others disappearing from plots despite their dominance before the hurricane passed, and still others showing various patterns of decline (table 9).
Montane forests lagged behind lowland forests in the recovery of canopy conditions, which in turn had a greater effect on bird populations than the actual passage of the hurricane (Tossas 2006). The effects of a slow canopy recovery rate on avifauna include altering foraging patterns and increasing chances of species extinction for species restricted to montane forests (particularly nectarivores and fruit and seed eaters). In short, hurricanes favor the survival of species capable of using a broad range of habitats and limit the number of bird species in montane habitats through increased endemism and extinction rates of these species.
Strong fliers, such as the Jamaican Fruit Bat (Artibeus jamaicensis), left the LEF after Hurricane Hugo hit and did not return until 2 years after fruit production had resumed in the forest (Gannon et al. 2005). The population of the endemic Red Fig Eating Bat (Stenoderma rufum) experienced large reductions after Hurricane Hugo disturbed the LEF (captures decreased by 80 percent), and the population took 5 years to reach prehurricane levels. Hurricane Georges passed 9 years after Hurricane Hugo, decreasing the number of bats in this population again; however, no subsequent sign of recovery was evident 4 years later. The hurricane also affected the reproduction of the species; the representation of young bats decreased from 30 to 40 percent of the population before Hurricane Hugo occurred to just 10 to 20 percent after the hurricane hit. Unlike other frugivorous bats and birds, S. rufrum remained in the LEF and survived by expanding its home range within the forest; it appears these bats might be important in the dispersal of seeds of successional plant species. In contrast to the above two species (A. jamaicensis and S. rubrum) and Erophylla

Luquillo Experimental Forest: Research History and Opportunities 35
Figure 36.—Non-metric multidimensional scaling (NMS) of abundance-based species composition. The panels present the output of one NMS ordination, using data from the five censuses, as shown in panel (a). Panels (b-g) present the same ordination, on the same axes, but show labels of only two censuses at a time for clarity. Panels illustrate the following censuses: (b) 1989 pre-Hugo (labeled 88, color green) and 1989 post-Hugo (89 dark yellow), (c) 1989 post-Hugo (89 dark yellow) and 1994 (94 gray), (d) 1994 (94 gray) and 1999 (99 light green), (e) 1999 (99 light green) and 2004 (04 blue), (f) 1989 pre-Hugo (88 green) and 2004 (04 blue), and panel (g) 1989 post-Hugo (89, dark yellow) and 2004 (04, blue). Each panel has its respective analysis of similarities (ANOSIM) R statistic value presented with the associated significance value. From Heartsill Scalley et al. 2010.

36 Luquillo Experimental Forest: Research History and Opportunities
sezekorni (the Brown Flower Bat), which also experienced declines in populations after hurricanes, the population of Monophyllus redmani (the Greater Antillean Long-tongued Bat) increased dramatically after Hurricane Hugo passed over the forest, after taking advantage of the rapid flowering by plants in the open forest understory.
The loss of canopy cover after a hurricane also creates cover problems for predators such as the Puerto Rican Boa, Epicrates inornatus, which became more visible to observers in the LEF after Hurricane Georges came ashore (Wunderle et al. 2004). Before the hurricane hit, observers could see 15.5 percent of radio-tagged boas whose fix was known, while the visibility of these boas rose to 19.6 percent after the passage of the hurricane as the boas moved more frequently and over larger distances to look for suitable habitat.
Although anole abundance was greatest in the forest canopy before Hurricane Hugo made landfall, no anoles were observed more than 3 m above ground level 1 month after Hugo hit (Reagan 1991). Anolis stratulus, the least abundant anole near ground level before the passage of Hurricane Hugo, became the most abundant species near ground level 1 month after
the hurricane passed (table 10). The relative abundance of A. evermanni, normally present from ground level to canopy, also increased at ground level following Hurricane Hugo’s disturbance. Anolis gundlachi, a forest interior species, responded to the changes in the microenvironment (light and humidity) by moving to different heights in search of available suitable habitats (table 10).
Arboreal spiders also adjusted to the effects of the hurricane by establishing their webs closer to the ground; those that did, increased in numbers, while others that could not attach their webs to the resulting forest structure decreased in numbers (Pfeiffer 1996). As happened with birds, the effect of the hurricane on boas, lizards, and spiders was through its effect on habitat location rather than by direct mortality.
Similar to other animal groups in the LEF, frogs survived hurricane winds, but, in contrast to lizards, young frogs of the genus Eleutherodactylus were affected by the reduction in relative humidity from the drought that followed Hurricane Hugo’s disturbance (fig. 37). After the developing canopy restored the relative humidity, however, frog populations (adults and juveniles) increased rapidly, exceeding prehurricane counts.
Capture rate
Species Diet and foraging location1
Before(% of sample)
After(% of sample)
Ruddy Quail-Dove F, U 2.5 (9.4) 0.8 (1.4)
Puerto Rican Lizard-Cuckoo I, C 0 0.8 (1.4)
Green Mango N, C 0 2.4 (4.1)
Puerto Rican Emerald N, U 1.0 (3.8) 0.8 (1.4)
Puerto Rican Tody I, C 1.0 (3.8) 3.2 (5.5)
Puerto Rican Woodpecker O, C 0 0.8 (1.4)
Puerto Rican Peewee I, U 0.5 (1.9) 0
Gray Kingbird I, C 0 0.8 (1.4)
Puerto Rican Vireo I, C 3.5 (13.2) 4.0 (6.8)
Red-legged Thrush O, C 4.0 (15.1) 1.6 (2.7)
Elfin Woods Warbler I, C 0.5 (1.9) 0
Bananaquit N, C 4.0 (15.1) 18.3 (31.5)
Puerto Rican Tanager O, C 2.0 (7.5) 7.1 (12.3)
Puerto Rican Spindalis F, C 2.0 (7.5) 9.5 (16.4)
Black-faced Grassquit F, U 0.5 (1.9) 0
Puerto Rican Bullfinch F, C 5.1 (18.9) 6.3 (11.0)
Greater Antillean Oriole I, C 0 1.6 (2.7)
Total capture rate 26.8 57.9
Total birds captured 53 73
Table 9. Capture rates (number of individuals captured/100 net hours) and proportion of sample of bird species in Maricao State Forest before (July 1998) and after (October 1998) Hurricane Georges with data on diet and foraging location. From Tossas (2006).
1 I = insectivore, O = omnivore, N = nectarivore, F = frugivore, U = understory, C = canopy.

Luquillo Experimental Forest: Research History and Opportunities 37
These increases were attributed to the abundance of retreat sites and the reduction in invertebrate predators.
Prehurricane and posthurricane surveys of six invertebrate species in the LEF revealed dramatic population decreases in all species. In fact, populations of Nenia tridens and Gaeotis nigrolineata (snails) and Agamemnon iphimedeia (walking stick) were reduced to the point that no specimens were detected in posthurricane surveys (Willig and Camilo 1991). It is believed that these species could not react to, or overcome, the large-scale changes in microenvironment induced by the hurricane. Subsequent studies in these populations uncovered complex interactions among shifts in ecological space, land use legacies, and cross-scale responses of biodiversity (Willig et al. 2007).
Hurricanes have significant effects on insects as well (Torres 1988, 1992). First, hurricanes transport and disperse insect species to great distances and account for numerous
introductions into the Caribbean (Torres 1988). Second, hurricanes affect insect population numbers through effects on food sources and/or predators, and they cause local extinctions or dramatic outbreaks of populations (Torres 1992). After Hurricane Hugo passed over the LEF, Torres observed population outbreaks of 15 species of Lepidoptera, including larvae of Spodoptera eridania (Noctuidae), which were observed feeding on 56 plant species belonging to 31 different families. All plants were early successional, and many were new host plants for the Lepidoptera. The outbreak of these insects ended with the decline of the host plants and had measurable influence on insect-insect interactions, such as predation and parasitism
El Verde Bisley
SpeciesMinimumdensity
Relativeabundance
Minimumdensity
Relativeabundance
A. gundlachi 560 86% 739 94%
A. evermanni 78 12% 29 4%
A. stratulus 11 2% 17 2%
649 785
Posthurricane
October 1989
A. gundlachi 99 13% 110 17%
A. evermanni 273 35% 247 38%
A. stratulus 389 51% 288 45%
A. krugi 8 1% —
769 645
March 1990
A. gundlachi 188 36% 120 23%
A. evermanni 95 18% 90 17%
A. stratulus 241 46% 319 60%
524 529
October 1990
A. gundlachi 195 38% 212 37%
A. evermanni 133 26% 172 30%
A. stratulus 168 33% 191 33%
A. krugi 17 3% —
513 575
Table 10. Pre- and post-Hugo minimum population densities and relative abundances of Anolis lizards at ground level for the El Verde and Bisley study sites. Prehurricane estimates are from September 1981 (El Verde) and February 1989 (Bisley). From Reagan (1991).
Figure 37.—(a) Size distribution of juvenile Eleutherodactylus coqui before and after Hurricane Hugo. (b) Maximum number of juvenile E. coqui counted during each study period between 1987 and 1990 in each of two study plots. From Woolbright (1991).
37a.
37b.

38 Luquillo Experimental Forest: Research History and Opportunities
involving other insect groups. Schowalter and Ganio (1999) also showed that disturbance from Hurricane Hugo affected invertebrate abundances significantly, with sapsuckers and mollusks becoming more abundant, and defoliators, detritivores, and emergent aquatic insects becoming less abundant in recovering treefall gaps than in intact forest.
Changes in Ecosystem ProcessesHurricane-induced mortality applies not just to tree biomass aboveground (Lugo and Scatena 1996) but also to roots and animals. Tree mortality can result from almost any hurricane effect, including defoliation, shaking of trees, wind throws, and stem breakage (Lugo and Scatena 1996). Trees can also die owing to sun scalding on the limbs (Wadsworth and Englerth 1959). Nevertheless, many trees recover from these effects through root or stem sprouts, epicormic growth, and reestablishment of bark over wounds.
In the tabonuco forest, fine root biomass decreased to zero at the 0 to 10 cm depth over a 3-month period after Hurricane Hugo passed over the forest (Parrotta and Lodge 1991). Silver and Vogt (1993) found a 70- to 77-percent fine root decline occurring with a 6-month delay, and because root decomposition was slow, 48 to 65 percent of the fine root necromass remained on site, which retained nutrients within the ecosystem. High root mortality, however, may result in significant declines of nutrient availability to trees if the nutrients are leached out of the system rather than retained in the vegetation. Conversely, Silver (1992) found that the survival of a stand’s root structure results in high nutrient retention by vegetation. Hurricanes can also increase populations of some species. For example, after the passage of the hurricane, shrimp populations increased from the availability of food and the reduced washout of invertebrate consumers (Covich et al. 1991).
Ostertag et al. (2003) measured initial litter stocks in six types of forests in the LEF before Hurricane Georges made landfall in 1998, documented the litter and nutrient transfer from the canopy to the forest floor immediately after the hurricane hit, and followed the decomposition of the litter for 1 year (fig. 38). The forest floor standing stocks returned to prehurricane values very quickly, within 2 to 10 months. The concentrations of N and P were, respectively, 1.1 to 1.5 and were 1.7 to 3.3 times higher in hurricane leaffall than in nonhurricane leaffall (Lodge et al. 1991). It took 30 to 40 months (2.5 to 3.3 years) for nutrient concentrations in leaffall to return to prehurricane levels after the passage of Hurricane Hugo (Scatena et al. 1996). Nutrient concentrations of throughfall water decreased immediately after the hurricane passed and continued decreasing for several weeks resulting from the reduction of leaf surfaces (Heartsill Scalley et al. 2007). This rapid disappearance of hurricane inputs suggests that such pulses are incorporated quickly into nutrient cycles and may be one factor contributing to the extraordinary resilience of these forests to hurricanes.
Anthropogenic Anthropogenic alteration of the landscape is a long-term disturbance. Therefore, it should be considered a part of the disturbance regime of an area along with other nonanthropogenic disturbances (Thomlinson et al. 1996).
Forest Recovery From Agriculture/PastureOver the past century, Puerto Rico has been transformed from an agriculturally based economy in a deforested landscape to an industrial and service-based economy in a reforested and developed landscape (Grau et al. 2003). This increase in forest cover is in contrast to the deforestation that is occurring in most of the tropics. The economic base of Puerto Rico has changed dramatically during the past 60 years, from a largely agricultural
Figure 38.— Changes in total forest floor mass and leaf mass over time in three forest types over 1 year. Values represent plot-level means and standard errors. Each value is expressed on an ash-free, dry-mass basis and was corrected for incoming litterfall. Points to the left of the dotted lines are from samples taken before the hurricane using the same methodology. From Ostertag et al. (2003).

Luquillo Experimental Forest: Research History and Opportunities 39
system to a more urbanized economy, with an emphasis on manufacturing (Morales Carrión 1983). In 1934, approximately 43 percent of the island’s gross national product (GNP) was from agricultural products, primarily sugar cane and coffee; by 1980, that figure had decreased to just 4 percent (Dietz 1986). At the same time, the manufacturing sector increased from 7 to 48 percent of the GNP. Associated with these economic changes was the movement of people from rural to urban areas. In 1940, 45 percent of employment was rooted in agriculture, compared with only 5 percent in 1982. The conversion of land from sugar cane cultivation was due mainly to the overall decline in competitiveness of Puerto Rican sugar on the world market (Morales Carrión 1983). An additional factor was the 1941 Land Law that restricted corporate land holdings and broke up some of the large sugar estates (Koenig 1953, Dietz 1986).
As agriculture declined in Puerto Rico, forest cover increased. At the peak of agricultural activity in the late 1940s, forest cover was reduced to 5 percent of the island, with about the same area in shade coffee plantations (Koenig 1953). By 1985, however, 34 percent of the island was forested (Birdsey and Weaver 1987). Before agriculture declined and forest regeneration began, most of the remaining forest was located in isolated mountainous areas such as the Luquillo Mountains. As economic drivers have led to the abandonment of agricultural lands, the area in secondary forests in Puerto Rico has increased substantially.
Marín Spiotta et al. (2007) examined changes in plant species composition and aboveground biomass on a chronosequence of abandoned pasturelands that spanned eight decades of tropical secondary succession. Tree species composition in all secondary forests differed from primary forests, and the highest rates of aboveground biomass accumulation occurred in the first 20 years (table 11). Reforestation of pastures resulted in an accumulation of 125 Mg ha-1 (metric tons per hectare) in aboveground standing live biomass over 80 years, a higher value than measured in primary forests due to the replacement of woody species by palm species in the primary forests. In a related study, Marín Spiotta et al. (2008) showed that soil C turnover rates of the mineral-associated C in secondary forests recovering from abandoned pasture resembled those of primary forests in as little as 20 years of succession.
In another study of forest regeneration, Aide et al. (2000) combined data from four regions of Puerto Rico to examine the recovery of forest structure following pasture abandonment and found that structural characteristics (stem density, basal area, biomass, number of species) were similar to the oldest sites after approximately 40 years of natural regeneration, suggesting that natural regeneration can be an effective strategy for tropical forest restoration.
In a study of soil C accumulation in reforested pastures, Silver et al. (2004) found that significant soil C can accumulate with reforestation. They also found strong legacies of pasture use and
reforestation in plant community structures and rates of plant C sequestration. In the reforested ecosystem studied, the total soil C pool was greater than the aboveground C pool, and more soil C was in the forest (102 ± 10 Mg ha-1) than was in an adjacent pasture of similar age (69± 6 Mg ha-1). Forest soil C increased at a rate of 0.9 Mg ha-1 yr-1 (metric tons per hectare per year), but residual pasture C was lost at a rate of 0.4 Mg ha-1 yr-1, yielding a net gain of 33 Mg ha-1 as a result of 61 years of forest regrowth. Few indices of C cycling were correlated with plant community composition or structure.
More generally, Silver et al. (2004) showed that aboveground biomass production in rehabilitated forests on abandoned land in tropical moist, wet, and dry life zones was a function of the type of land degradation. Past land use also had an impact on the rate of soil C accumulation, although patterns are much less clear than for aboveground biomass. Biomass production was fastest in abandoned agriculture, slower in abandoned pastures, and slowest in cleared land with arrested succession. It is possible that crops or pasture were not successful at these sites due to nutrient, water, pest, or physical factors that could also inhibit forest regeneration. All of these rates are slower, however, than those measured in natural successions (Aide et al. 1995, Silver at al. 2004). The overall rate of aboveground biomass accumulation across forests in all life zones studied was 2.36 Mg ha-1 yr-1, but the rate of aboveground biomass accumulation was significantly faster during the first 20 years of regrowth (6.17 Mg ha-1 yr-1). There was no effect of life zone during the first 20 years of regrowth, but wet forests accumulated C faster than moist forests during later phases (years 20 to 80). Overall (80 years), wet forests accumulated biomass at a rate of 3.24 Mg ha-1 yr-1 and moist forests at a rate of 2.17 Mg ha-1 yr-1, while dry forests showed no significant pattern with time.
Age
TAB for trees≥ 10 cm DBH
(Mg/ha)
TAB for trees≥ 1.5 cm DBH
(Mg/ha)
Secondary forests
10 yr 6a (5) 53a (6)
20 yr 135b (25) 135ab (25)
30 yr 89ab (5) 97ab (10)
60 yr 166b (4) 181bc (7)
80 yr 269c (41) 272c (43)
Primary forests 161b (16) 173abc (19)
Table 11. Total aboveground biomass (TAB) estimates for large trees (DBH ≥ 10 cm) and all trees (DBH ≥ 1.5 cm) across a secondary forest chronosequence in Puerto Rico. Biomass calculated from general allometric biomass equations in Weaver and Gillespie (1992). From Marin Spiotta et al. (2007).
Notes: Values are means with standard error in parentheses. Different letters following values represent significant differences at P < 0.05 within columns. DBH = diameter at breast height.

40 Luquillo Experimental Forest: Research History and Opportunities
Climate Effects of UrbanizationMuch of the freshwater supply for the San Juan Metropolitan Area (SJMA) originates in the Luquillo Mountains. This water supply is barely adequate in dry years, and there is new concern that overall precipitation trends in Puerto Rico during the 20th century have decreased by about 16 percent (van der Molen 2002), and that 3 of the top 10 driest years in the past century were recorded in the 1990s (Larsen 2000). A growing body of evidence further suggests that urbanization may affect regional climates even more than increasing global temperatures (Hulme and Viner 1995, Scatena 1998b, Brazel et al. 2000). Therefore, research efforts should focus not only on global climate change, but also on the regional climatic effects of urbanization, especially the effects of the urban temperature phenomenon known as urban heat islands (UHIs).
As urban development continues in Puerto Rico, forests and grasslands are being converted to nonvegetated surfaces, changing the magnitude and geographic range of the UHI. Murphy et al. (2010) quantified the spatial and temporal variations of the UHI in and around the SJMA and found that San Juan exhibits an average urban heat island of 1.75 °C during nighttime hours and 0.93 °C during daytime hours (table 12), with the UHI during the early evening reaching at least to the foothills of the Luquillo Mountains. Only trees and shading were successful agents in reducing daytime warming; green space was insufficient for abating the warming trend during the day. Predictions of future development and temperatures suggest that if the present pattern of development continues in Puerto Rico, more than 140 square kilometers (km2) of land, that showed no signs of UHI in 2000, will have an average UHI between +0.4 °C and +1.55 °C by 2050 (fig. 39). Furthermore, more than 130
UHI (°C), ∆TCBD-HB
Wet season
Hobo Land local coverEarly night UHI(1900 – 2359)
Late night UHI(0000 – 559)
Day UHI(0600 – 1859)
1S Abandoned agricultural fields 1.25 1.47 0.97
2S Urban center 0.71 (min) 0.83 (min) 0.55 (min)
3S Industrial 1.32 1.61 0.90
4S Residential 0.31 0.64 0.25
5S Major road crossing 0.78 0,93 0.55
6S Mowed-grassland 2.44 2.43 0.91
2A Old-growth forest 2.14 1.86 2.23 (max)
3A Grassland mix 1.47 1.44 1.10
4A Residential limits 2.01 1.76 1.81
1F Residential recreation park 2.05 2.28 0.80
2F Residential church 1.47 1.74 0.55
3F Suburban mix 1.69 1.90 0.51
4F Rural road 2.09 2.42 0.65
5F Major road 3.01 (max) 2.80 1.02
6F Rural dirt road 2.79 3.02 (max) 1.20
Average ± Standard Error 1.70 ± 0.19 1.81 ± 0.17 0.93 ± 0.13
Dry season
2A Old-growth forest 1.78 2.02 1.77 (max)
3F Suburban mix 0.86 (min) 1.32 (min) 0.40
4F Rural road 1.21 1.65 0.34 (min)
5F Major road 1.95 (max) 2.27 (max) 0.77
6F Rural dirt road 1.48 2.22 1.00
Average ± Standard error 1.46 ± 0.19 1.96 ± 0.15 0.86 ± 0.26
Table 12. Average temperature difference for all Hobo temperature sensors along an urban to rural gradient in northern Puerto Rico, calculated as Turban reference –Tindividaual Hobos. Maximum and minimum values for each time period indicated in parentheses. Urban Heat Island is UHI. From Murphy et al. (2007).

Luquillo Experimental Forest: Research History and Opportunities 41
Figure 39.—Maps of the San Juan Metropolitan Area showing the current (a) and projected (b–f) urban heat island effect in northeastern Puerto Rico. From Murphy et al. (2010).

42 Luquillo Experimental Forest: Research History and Opportunities
km2 of land area with a UHI between +0.4 °C and +1.4 °C in 2000 will have an average UHI greater than +1.55 °C by 2050. Future research in this area should focus on how urbanization around the LEF may affect lifting condensation levels and hence the average elevation at which precipitation occurs.
Infrastructure (Roads and Dams)Roads can have both direct and indirect effects on surrounding vegetation (Auerbach et al. 1997, Guariguata and Dupuy 1997), can be major sources of landslides and sediment deposits (Larsen and Torres Sánchez 1992, 1996; Megahan and Ketcheson 1996; Larsen and Parks 1997), and can increase forest fragmentation by creating barriers to migration and gene flow (Andrews 1990, Mader 1984). The presence of roads often increases the extent of anthropogenic activities in remote areas, providing a conduit for the introduction of nonnative flora and fauna (Mader 1984, Andrews 1990, Wein et al. 1992, Hamilton et al. 1995, Raynor 1995, Whistler 1995). Roads can also be considered as ecosystems—albeit human-dominated—in their own right, with a unique ecology to be considered before making policy or management decisions (Lugo and Gucinski 2000).
The first study of the effects of road construction by Olander et al. (1998) was conducted in the elfin forest along the road that the U.S. Navy built in 1960 to provide access to communication facilities at Pico del Este (Sowers 1971, Scatena 1995). Results indicated that recent roadfills have higher light levels, soil temperatures, bulk densities, large pools of exchangeable soil nutrients, and higher soil oxygen concentrations but have lower seedling and tree densities, basal area, woody biomass, soil moisture, SOM, and total soil N than a mature forest (tables 13
and 14). The total aboveground biomass of the 6-month-old roadfill was about 2 Mg ha-1 and was dominated by a variety of monocot and herbaceous species (no woody biomass), while the 35-year-old roadfill areas had a higher biomass of 10.5 Mg ha-1, 77 percent of which was nonwoody. Seedling density, tree density, and total woody biomass in roadfill areas were 12, 28, and 2 percent of mature forest sites, respectively. In these areas where soils were disturbed during construction, accumulation of biomass was the slowest known for the LEF (Olander et al. 1998). The time for biomass reaccumulation after road construction is likely to be faster for forests growing at low to mid elevations not limited by the climatic conditions of high rainfall and high wind found at upper elevations in the LEF (Heyne 2000).
The later study by Heyne (2000) broadened the Olander et al. (1998) study by presenting successional trends in soil and vegetation characteristics along a chronosequence of abandoned paved roads at lower elevations (80 to 530 m elevation) that ranged in age from 4 to 60 years. After 11 years, abandoned road site litterfall and soil characteristics were found to be similar to those at forest sites of similar age, despite the presence of residual pavement. Net nitrogen mineralization (g g-1 dry soil) and percent SOM were similar on abandoned roads and adjacent forest sites (fig. 40), while soil pH required 60 years of abandonment for full recovery to forest conditions (fig.40). The paved surfaces of roads must first accumulate soils before any forest recovery process can begin, and, judging from the results of Heyne (2000), it seems that the physical accumulation of soil above the pavement was the delaying factor to the full recovery of soil properties.
Site type nSeedling
density (ha-1)Tree
density (ha-1)Basal area(m2 ha-1)
Woody biomass(Mg ha-1)a
New road (6 months) 5 0 a 0 a 0.00a 0.00 a
Old road (35 years) 9 4,185 b 3,148 a 2.07a 2.17 a(1,167) (747) (0.46) (0.52)
Mature forest 12 34,014 c 11,257A 37.56b 91.67 b(4,202) (1,079) (3.85) (11.65)
Mature cloud forest 3 37,236A 13,722A 32.70A 73.05A
(6,098) (821) (3.02) (13.36)
Forest with 3 28,222A 12,028 b 15.79A 33.13A
grass understory (3,192) (2,816) (6.67) (15.80)
Table 13. Effects of road construction and management on vegetative structure by plot type along the East Peak road, Luquillo Experimental Forest. Totals of individuals <1.5 m height for each plot type with standard error of the mean in parentheses. The number of 120 m2 plots measured is specified by n. Means with the same letter are not significantly different at the 0.01 level according to Tukey’s range test on log transformed data. Means for grass dominated plots were compared to the means for the 6 mature forest plots located in the cloud forest. For this comparison significance is denoted with capital letters. From Olander et al. (1998).
* Woody biomass was calculated using equations for dicots (Weaver 1990) and palms (Frangi and Lugo 1985).

Luquillo Experimental Forest: Research History and Opportunities 43
Litter mass on abandoned roads also reached quantities similar to those at forest sites after 11 years (fig. 40); at one site, litter recovered after only 4 years. This fast recovery of litter mass highlights that the localized canopy removal that is often associated with roadbuilding—and the presence of adjacent forest—facilitates the rapid return of organic matter inputs to the system and thus supports the soil formation process. Furthermore, litter on these newly deposited soils above roads likely alters environmental conditions by minimizing soil temperatures, providing physical structure for retaining seeds, creating soil fauna microhabitats, and minimizing erosive soil loss due to rainfall (Heyne 2000).
Measured differences in understory vegetation structure between abandoned roads and adjacent forest areas were very clear (fig. 41a). After 30 years, stem densities and the number of species reached the same values as those observed in adjacent forests (fig. 41b-c). Canopy structure was similar between abandoned roads and adjacent forests after 40 years. Basal areas on abandoned road sites were similar to those found in adjacent forests only after 60 years (fig. 41d), and variation in floristic composition began to approximate, but was never attained, at any of the measured sites (Heyne 2000). From the work of Heyne (2000), we can conclude that the ecosystem dynamics of primary succession on abandoned roads in the LEF are rapid; the noted exception to this pattern of recovery is the elfin cloud forest sites on the mountain peaks, which have longer biomass recovery times (Olander et al. 1998).
In addition to building roads, dam building is another primary means by which humans alter ecosystems. Compared with other regions, the rivers of Puerto Rico historically have had a high level of damming (fig. 42a). Over the past century, the number of large dams built per unit area in Puerto Rico has outpaced, by an average of 2 to 1, the number built in California, which is well known for its extensive hydrological engineering (fig. 42b).
Dams change the physical, chemical, and biological structure and function of rivers and streams dramatically. When considering the effects of dams on tropical island streams, it is instructive to separate dams into two size classes (large, defined as those with a spillway height more than 15 m, and small, with a spillway height less than 15 m) and streams into low- and high-elevation/gradient streams.
Large dams can alter the distribution and abundance of island faunas significantly by blocking migratory pathways (Holmquist et al. 1998), although the extent of alteration depends on characteristics of dam design, dam operation, and fauna. The first major Puerto Rican study of large dams and diadromous fauna, which focused on the loss of native migratory fauna from low-gradient streams (Holmquist et al. 1998), found a complete extirpation of all native fish and shrimp from the upstream habitat. In contrast, large dams with spillways (i.e., structures that allow water to flow over the face of a dam) allow the passage of some native fish and shrimp. Greathouse et al. (2006b) extended the findings of Holmquist et al. (1998) to high-gradient streams of the LEF, where native
New road
Mature tall stature(Cloud forest)
Mature tall stature(Grass understory) Old road Fertilized Unfertilized
Bulk density g cm-3 0.39 a 0.24 (0.01) a 0.6 (0.04) ab 1.03 1.04 bc
% Soil moisture 0.59 (0.02) a 0.67 (0.05) b 0.45 (0.01) c na 0.32 (0.02) d
% Soil O2 8 (0.8) a 11 (0.065) b 15 (0.4) c na na
pH (KCl) 3.8 (0.04) a 3.7 (0.07) a 4.1 (0.07) a 53 (0.3) b 5.4 (0.4) b
C:N 22.1 (0.35) a 24 (0.4) a 19 (0.5) b 31 (3) c 34 (5.8) c
C Mg ha-1 55.7 (2.4) a 57 (4.6) a 19 (1.2) b 1.2 (2.5) c 13 (1.9) c
N Mg ha-1 2.5 (0.1) a 24 (0.2) a 1 (0.06) b 0.4 (0.1) c 0.5 (1.9) c
P kg ha-1 1.18 (0.26) ab 0.85 (0.2) a 0.75 (0.06) b 1.3 (0.1) b 1.7 (0.14) b
Ca kg ha-1 138 (22) a 114 (-11) a 529 (100) b 2,152 (434) c 2,784 (615) c
Mg kg ha-1 34 (6.6) a 20 (5.8) a 74 (14) b 84 (12) b 49 (6) b
K kg ha-1 35 (2.6) a 14 (2.1) b 65 (2.3) c 1.8 (9) d 88 (11) d
Mn kg ha-1 6.1 (1.5) a 3.9 (0.6) a 84 (113) b 81 (11) b 1.9 (16) b
Al kg ha-1 753 (47) a 430 (24) ab 510 (58) b 524 (194) c 310 (66) c
Table 14. Impacts of road construction and management on soil nutrient properties for the 0 to 10 cm horizon by plot type along the East Peak road, Luquillo Experimental Forest. Standard error in parentheses. Different lowercase letters identify statistically significant differences among sites. From Olander et al. (1998).
na = not applicable

44 Luquillo Experimental Forest: Research History and Opportunities
Figure 40.—Soil and litter properties of a chronosequence of abandoned paved roads versus forest plots of a similar age. From Heyne (2000).

Luquillo Experimental Forest: Research History and Opportunities 45
Figure 41.—Vegetation characteristics of a chronosequence of abandoned paved road plots versus forest plots of a similar age; (a) relative cover of vegetation less than 2 meters (m) in height in plots on roads versus forest cover, (b) stem count (± SE ) by form for vegetation greater than or equal to 2 m on roads and in adjacent plots, (c) species richness blox plots, and (d) mean basal areas by vegetation form greater than or equal to 2 m tall (± SE of total basal area). * indicates no significant differences between road and forest treatments. See Heyne (2000) for sample sizes. From Heyne (2000).
41a. 41b.
41c. 41d.
ROADROAD
ROAD
FORESTFOREST
FOREST
Time Since Road Abandonment (yr)
Time Since Road Abandonment (yr)
Time Since Road Abandonment (yr)Time Since Road Abandonment (yr)
Stem
Cou
nt (
m-2)
Bas
al A
rea
(cm
2 m-2)
Spec
ies
Ric
hnes
s (m
-2)
Smal
l Plo
t R
elat
ive
Cov
er (
%)

46 Luquillo Experimental Forest: Research History and Opportunities
Figure 42.—Numbers of large dams (height >15 meters) per unit land area in Puerto Rico and selected regions of North America and the tropics. (a) Number per unit land area over time in Puerto Rico, California, and the Dominican Republic. (b) Estimates of current number of dams (completed and under construction) in selected regions: bars are numbers per unit land area; numbers above bars are total number of large dams. From Greathouse et al. (2006a).
predatory fish are naturally absent (i.e., above waterfalls). The studies showed that populations of migratory fauna differed dramatically among sites upstream from large dams compared with sites without large dams; numbers of migratory shrimp and Sicydium at undammed sites were more than 300 times higher than in dammed sites (fig. 43). While conducting field work at three streams above dams without regular spillway discharge, however, Greathouse et al. (2006b) visually observed extremely rare occurrences of migratory shrimp and fish that were undetectable by electroshocking and snorkeling methods. The studies of Holmquist et al. (1998) and Greathouse et al. (2006b) together indicate that migratory shrimp and fish are nearly—but not completely—extirpated from sites above large dams that lack regular spillway discharge. Many native fish and shrimp of tropical islands have evolved to migrate over high waterfalls. Shrimp simply walk over dams with spillways, sometimes leaving the water but remaining in the wetted area near the stream. Fish such as gobies and some eleotrids use modified pelvic fins as suction cups to climb vertical rocks and waterfalls. Although these native fish and shrimp are able to climb, they need flowing water as a cue to direct them (Hamano and Hayashi 1992; Benstead et al. 1999). Without it, they are unable to determine the direction of waterflow, and they remain below the dam. Large dams and associated reservoirs may also disrupt the downstream migration of fish and shrimp larvae by reducing water flow, thereby lengthening the time water takes to reach the estuary. First-stage larvae of amphidromous shrimp and gobies are typically nonfeeding, and must reach saltwater to metamorphose into more advanced feeding stages. Laboratory studies have shown that amphidromous shrimp larvae die after only a few days in fresh water (e.g., Lewis and Ward 1965). Similarly, gobiid larvae have limited food resources, and increased retention time in freshwater can lead to starvation (Moriyama et al. 1998, Iguchi and Mizuno 1990). Furthermore, reduced flows through reservoirs may also increase predation on larvae.
Small, low-head dams also interfere with the migration of tropical island faunas (fig. 44). The effects of low-head dams on the upstream migration of faunas appear to be similar to those of large dams with spillways; small low-head dams do not act as a complete barrier to upstream migration. Shrimp, fish, and snails are able to scale the dam and were found to be abundant in upstream reaches in the study by Benstead et al. 1999. The low-head dam, however, acted as a bottleneck that increased the densities of upstream migrating animals below the dam. The bottleneck effect observed at this dam may have been exacerbated by the absence of a working shrimp or fish ladder. Upstream migrating animals at this site experienced increased difficulty during periods of low river flow, when no water was coming over the dam. During these periods, migrating shrimp lacked the directional cue provided by flowing water and became disoriented and experienced 100-percent mortality (Benstead et al. 1999). In addition to impeding the upstream migration of migratory faunas, water withdrawal resulted in significant
Figure 43.—Number of migratory and nonmigratory macroconsumers captured per point sample (mean and SE; n = 7 dammed and 10 undammed sites) at high-gradient sites without large dams or upstream from large dams. Migratory fauna are native adult shrimp (Xiphocaris elongate, atyids, Macrobrachium spp.) and the native green stream goby, Sicydium plumier. Nonmigratory fauna are the native crab, Epilobocera sinuatifrons, nonnative poeciliid fish, and the native tadpole, Leptodactylus albilabris. From Greathouse et al. (2006b).

Luquillo Experimental Forest: Research History and Opportunities 47
mortality of downstream migrating shrimp larvae (Benstead et al. 1999). During periods of low river flow, all the water and thus all the shrimp larvae were entrained into the intake. Over the course of the study, 42 percent of the migrating shrimp larvae were entrained into the water intake (Benstead et al. 1999). Long-term estimates of larval shrimp mortality were between 34 and 62 percent, depending on the amount of water withdrawn.
Effects of both large and small dams on migratory faunas can have consequences that reach far beyond simply altering the relative abundance and distribution of fish and shrimp. For example, in many tropical island streams, freshwater shrimp account for the great majority of secondary production (Bright 1982) and significantly affect many aspects of benthic community composition and ecosystem processes (Pringle et al. 1999). Small-scale experimental exclusions of shrimp result in increased quantity and quality of organic matter (Pringle et al. 1999), increased sediment cover, shifts in insect and algal assemblage composition and biomass (March et al. 2002), and decreased rates of litter processing (March et al. 2001). Large-scale “experiments” caused by anthropogenic disturbance support the results of these small-scale exclusions. For example,
Figure 44.—The number of (a) fish and (b) shrimp found above and below a low-head dam (Río Espíritu Santo) and in-channel water intake (Río Mameyes). Figure from March et al. (2003); data reported originally in Benstead et al. (1999).
elimination of shrimp from an entire reach due to chlorine poisoning resulted in dramatic increases in sediment cover and algal biomass (Greathouse et al. 2005).
Introduced Species Human activities that alter land use can change the species composition of residual forest stands and cause new forests to form (Lugo and Helmer 2004) because a proportion of the species that are successful in anthropogenic landscapes are not native to the area (Horvitz et al. 1998). Ecologists have not reached a consensus on the implications of human-mediated changes in species composition of ecosystems, because many nonnative naturalized tree species may have benefits such as reforesting abandoned pasture (e.g., Spathodea campanulata in Puerto Rico; Lugo 2004b, Lugo and Helmer 2004), while others may have negative effects through changing ecosystem structure and function, causing the loss of native plants and animals or changing the genetic structure of native populations through hybridization (Richardson et al. 2000b, Nyoka 2003). Some introduced species in the 16-ha Luquillo Forest Dynamics Plot (LFDP) in the tabonuco forest of the LEF are listed in table 15.
Thompson et al. (2007) found that the total number of individuals per hectare of most introduced species in table 15 were relatively small and changed little over the 15-year period analyzed (fig. 45a) and that the maximum basal area (m2 ha-1) of introduced species was also very low (<1 percent of the total stand basal area) and changed little over the period analyzed (fig. 45b). Thus, the introduced species survived over the 15-year study and remained small components of the forest. Some species spread, but only over relatively small distances with only a few individuals establishing in the mature forest.
Bamboo, another nonnative tree species that was introduced to montane wet forests of the LEF in the 1930s and 1940s to stabilize downhill slopes along roads (White and Childers 1945), has led to present-day monocultures in numerous riparian areas in the LEF, spreading downstream at a rate of 8 m yr-1, with culms growing an average of 15.3 cm day-1 (O’Connor et al. 2000). If this expansion rate continued, colonies of bamboo would extend only 1 km downstream over 125 years, suggesting that the rate of spread is slow. Over a 10-month study, leaffall from bamboo stands exceeded that of native mixed species forest by about 30 percent (fig. 46), and concentrations of nutrients important to stream communities (e.g., Ca, P, K, Mg, N) were lower in bamboo than in native forest leaffall (O’Connor et al. 2000). Elemental losses in streams were rapid, suggesting a change in riparian zone/stream dynamics following bamboo invasion. As nonnative bamboo spreads along streams in Puerto Rico, this species could potentially alter aquatic communities that are dependent on leaf input.

48 Luquillo Experimental Forest: Research History and Opportunities
Species Status Seed dispersal Vegetative growth Shade response
Artocarpus altilis (Parkinson, Fosberg) A Animal Root sproutingd Intolerant
Calophyllum calaba (Jacq.) N/P Animal Intolerant
Citrus paradis (Macfad.) A Animal Intolerant
Coffea arabica (L.) A Animal Tolerant
Genipa americana (L.) N Animal Intolerant
Hibiscus pernambucensis (Arruda) I/Na Animal Roots from fallen stems Intolerant
Mangifera indica (L.) A Animal Intolerant
Musa sp. A Culmsb Intolerant
Simarouba glauca (DC) P Animal Intolerant
Spathodea campanulata (Beauv.) E Windc Intolerant
Swietenia macrophylla (King) E/P Wind Intolerant
Syzygium jambos ((L.) Alston) E Animal Tolerante
Table 15. Characteristics of introduced species in the Long-Term Forest Dynamics Plot (LFDP) including status of introduction (Little and Woodbury 1976; Francis and Logier 1991), mode of dispersal, and response to shade. From Thompson et al. (2007).
A = Introduced planted for agricultural use, E = Naturalised (sensu Richardson et al. 2000) introduced, N = native species planted for agricultural or ornamental use, P = plantation species for timber.a I/N = Either introduced (Little and Woodbury 1976) or native (Logier 1994).b Spread by sprouting new culms.c Francis (2000a).d Francis (2000b).e Parrotta (1994).Nomenclature follows Logier (1985, 1988, 1994, 1995, 1997).

Luquillo Experimental Forest: Research History and Opportunities 49
Figure 45.—(a) Number per hectare of live individual plants and (b) total basal area (square meters per hectare) of introduced trees with stems greater than or equal to 1 cm DBH (diameter at breast height) in at least one in three censuses over 15 years of the Luquillo Forest Dynamics Plot, Luquillo Experimental Forest, Puerto Rico. Species codes are: ARTALT Artocarpus altilis, CALBRA Calophyllum calaba, GENAME Genipa rabicaa, CITPAR Citrus paradis, COFARA Coffea rabica, HIBTIL Hibiscus pernambucensis, MANIND Mangifera indica, MUSSPP Musa sp., SIMGLA Simarouba glauca, SWIMAC Swietenia macrophylla, SYZJAM Syzygium jambos, SPACAM Spathodea campanulata. From Thompson et al. (2007).
Figure 46.—(a) Mean daily leaffall rates under bamboo (hatched bars) and mixed native forest stands (open bars) from August 1996 to May 1997 and (b) Input rates of selected elements in leaffall within bamboo (hatched bars) and native mixed (open bars) forest stands in the Bisley Experimental Watersheds, Luquillo Experimental Forest, Puerto Rico. * denotes native forest leaffall N from nonhurricane leaffall from Lodge et al. (1991). From O’Connor et al. (2000).
46a.
46b.

50 Luquillo Experimental Forest: Research History and Opportunities
The Luquillo Mountains are a major source of water for the island and an important recreation site. The mountains
supply more than 20 percent of the island’s municipal water each year, with El Yunque National Forest providing an average of 276 hm3 (cubic hectometer) of water per year for municipal uses (Scatena and Johnson 2001). The nine rivers that drain the Luquillo Experimental Forest (LEF) all have steep gradients, boulder- and bedrock-lined channels with steep-pool morphology, and waterfalls (Ahmad et al. 1993). The watersheds draining the LEF and the locations of stream gauges and water intakes as of 2004 are shown in figures 47 and 48, respectively (Crook et al. 2007).
Puerto Rico receives precipitation from at least five major weather systems: the northeast trade winds, tropical depressions and hurricanes, northern cold fronts, systems originating in the Pacific, and systems originating in the Amazon basin. Headwater basins in the LEF have complex hydrologic regimes dominated by variability at two scales: daily and multiyear. The daily scale responses are attributable to short precipitation inputs, including daily orographic storms, whose inputs are transmitted on the scale of hours to stream channels by shallow saturated flow through numerous macropores in the upper 0.5 meters (m) of
7. HydrologyN.L. Harris and W. Wu
soil. Annual and interannual scale responses are attributable to moisture storage in the very deep (9 m) clay soils, which appears to be released slowly into stream channels as base flow. Approximately 70 percent of total streamflow goes out to sea during storms. Municipal uses of this water are impossible due to the large, short-term fluctuations in streamflow and because even the largest reservoirs on the island are small and can be filled several times during one large storm.
Rainfall and ThroughfallRainfall and runoff occur every month of the year and increase with elevation (García Martinó et al. 1996). Annual precipitation ranges from approximately 1,500 mm yr-1 (millimeters per year) near the coast to more than 5,000 mm yr-1 in the uppermost cloud forests. These rainfall data are summarized in the previous section on climate. Throughfall levels depend on the balance among precipitation, evaporation, and canopy storage (Horton 1919, Leonard 1967, Rutter et al. 1972).
Scatena (1990) estimated annual canopy throughfall and stemflow in the Bisley Experimental Watersheds as 59 percent and 2.3 percent of annual rainfall, respectively. Canopy throughfall was highest in gaps and along stream channels, with 91 percent falling over 75 percent of the watershed area; however, 50 percent of the total stemflow came from less than 12 percent of the total stems. More recently, Heartsill Scalley et al. (2007) summarized canopy rainfall and throughfall data in the Bisley Experimental Watersheds for a 15-year time series (fig. 5). Over the 15-year study period, mean annual rainfall and throughfall was 3,482 and 2,131 mm yr-1, respectively, indicating that close to 40 percent of incoming rainfall is intercepted and absorbed by the forest vegetation and the other 60 percent reaches the forest floor. These data are summarized in the previous section on climate and are not repeated here. The forest’s relatively high annual interception and low throughfall are attributed to the high frequency of low-intensity, short-duration rainfall events; net upward transport of evaporated moisture associated with heat from condensation; advected energy; and a relatively low aerodynamic resistance of the canopy (Scatena 1990, Schellekens et al. 2000).
Streamflow In addition to developing a regression equation between rainfall and elevation, García Martinó et al. (1996) also developed a regression equation between runoff (i.e., stream discharge) and elevation for the LEF (fig. 49). Although both relationships are strong, the regression that uses the weighted average elevation (WAE) (fig. 49a) is a better predictor than the relationship that uses elevation of the gauge outlet itself (fig. 49b). Higher confidence should be placed on figure 49a because the WAE accounts for the spatial distribution of elevation within the watersheds, while figure 49b has a large concentration of data points at lower elevations.
Figure 47.—Watersheds draining the Luquillo Experimental Forest (identified as El Yunque National Forest). The Río Grande and Río Espíritu Santo join near the estuary. The Río Grande is located on the west side of the Espíritu Santo watershed. The Río Canovanas and Canovanillas join the Río Grande de Loiza watershed. The Río Canovanas is east of the Río Canovanillas. From Crook et al. (2007).

Luquillo Experimental Forest: Research History and Opportunities 51
Wu et al. (2007) used Landsat imagery, hydrological modeling, and simulation analysis to investigate the influence of recent and future land-cover changes on streamflow of the Fajardo watershed, including part of the LEF. Monthly and annual streamflows were compared between an agricultural period (1973 to 1980) and an urbanized/reforested period (1988 to 1995) using a revised Generalized Watershed Loading Function model. Validated results of streamflow (fig. 50) show that a lower proportion of rainfall became streamflow in the urbanized/forested period compared with the agricultural period (fig. 51), apparently due to a higher effect from reforestation than from urbanization on streamflow. Simulations of projected land-cover scenarios indicate that annual streamflows would increase by 9.6 percent in a total urbanization scenario, decrease by 3.6 percent in a total reforestation scenario, and decrease by 1.1 percent if both reforestation and urbanization continue at their current rates to the year 2020. An imposed hurricane event that was similar in scale to the largest recent event on the three land-cover
scenarios would increase the daily streamflow by 62.1, 68.4, and 67.1 percent, respectively (fig. 52).
An accurate forecast of future streamflow is vital for water resource managers, especially during droughts. In the past 40 years, seven severe islandwide droughts have occurred, between 1956 and 1957, 1964 and 1965, and 1967 and 1968; in 1976, 1994, and 1996 (Scatena 1996); and, most recently, in 2002. It is thus desirable to be able to calculate a watershed parameter that describes how streamflow diminishes in the absence of rainfall. This parameter is called the recession constant and describes the slope of the streamflow decline following a recharge event (Arnold et al. 1995).
The most common mathematical function to describe how streamflow diminishes after a rainfall event is a simple exponential decay function (Hall 1968, Nathan and McMahon
Figure 48.—U.S. Geological Survey (USGS) stream gauges. Water intakes are shown in relation to stream gauges for reference. Watersheds, clockwise from left, bottom corner are Gurabo, Canóvanas (Loíza), Espíritu Santo, Mameyes, Sabana, Fajardo, Blanco. From Crook et al. (2007).

52 Luquillo Experimental Forest: Research History and Opportunities
1990, Arnold et al. 1995, Tallaksen 1995, Rutledge and Mesko 1996):
Qt = Q0kt
where Q0 is the initial discharge at any time; Q
t is the discharge
t time units after Q0; and k is the recession constant. A large k
value indicates that drainage is very slow, while a smaller k value indicates a rapid drainage and little storage. Rivera Ramírez et al. (2002) developed master recession curves (and k values) for two LEF watersheds (Río Espíritu Santo and Río Fajardo) shown in figure 53.
EvapotranspirationEvapotranspiration and related processes in tropical forests can explain 70 percent of the lateral global energy transport through latent heat, making them very important in the redistribution of water on the Earth’s surface (Mauser and Schädlich 1998). Few spatial studies of evapotranspiration in these redistribution processes for tropical forests exist, but several point estimates are available for the LEF (table 16) and range from 1.93 to 5 mm d-1 (millimeters per day), depending on forest type and method of estimation.
Wu et al. (2006b) integrated one Landsat Thematic Mapper (TM) image and three MODIS images with a hydrological model (Granger and Gray 1989) to estimate the spatial pattern of actual evapotranspiration (aET) in the LEF for the month of January (fig. 54), when these remote sensing images were acquired. The derived January aETs from this study ranged from 0 to 7.22 mm day-1 with a mean of 3.08± 1.35 mm day-1, which were comparable to other estimates (table 16). Simulated aET was highest in the low-elevation forest and decreased progressively toward higher elevations. Because of differences in
Figure 49.—(a) Relationship between the weighted average elevation (WAE) of the watershed and average runoff and (b) the elevation at each stream gauge and gauge runoff for nine-gauge stations draining the Luquillo Experimental Forest. From García Martinó et al. (1996).
49a.
49b.
Figure 50.—Average daily streamflow for each month of each simulation year (top: 1974 to 1980; bottom: 1988 to 1995). From Wu et al. (2007).

Luquillo Experimental Forest: Research History and Opportunities 53
Figure 51.—The proportion of rainfall that contributed to streamflow for each month over two simulation time periods: 1973 to 1980, when the area was under agriculture, and 1988 to 1995, when the area was under urbanization/reforestation (upper graph: model simulation; lower graph: empirical observations). From Wu et al. (2007).
Figure 52.—Simulated daily streamflows for every month under the three projected land cover scenarios with or without hurricane disturbance in September 2020. From Wu et al. (2007).
Figure 53.—Master recession curves for Río Espíritu Santo and Río Fajardo watersheds in the Luquillo Experimental Forest; correlation method. Dry Season: January through April and June through July; average rainfall 194 to 311 mm mo-1 (millimeters per month). Wet Season: May and August through December; average rainfall, 289 to 378 mm mo-1. From Rivera Ramírez et al. (2002).
solar radiation at different elevations, aspects and topographic positions, aET tended to be higher on south slopes and along ridges than on north slopes and in valleys. In addition, the Bowen ratio (the ratio of sensible heat to latent heat) varied across different vegetation types and increased with elevation,
thus reflecting differences in the distribution of net solar radiation incident on the Earth’s surface. Over a 24-hour period, the highest simulated aET occurred around noon.
Wu et al. (2007) investigated the influence of recent and future land-cover changes on evapotranspiration (ET) in the Fajardo watershed, including part of the LEF. From the 1970s to 1990s, the average simulated ET decreased 15.2 percent between May and August, when it was warm and rainy. The average simulated ET stayed almost the same the rest of the year (fig. 55). This pattern could result from urbanization in the watershed. The highest ET occurred in February or March, when few clouds were present, and the lowest occurred in May, when the probability of cloud cover is high (Wu et al. 2006a). In general, closed forests had a higher predicted ET than urban areas. During the relatively wet season (September to January), ET was higher for the forests than for agricultural lands and pastures. During the March-to-August growing season, ET varied little among forests, agricultural lands, and pastures. The calculated ET in urban areas was generally lower than in other land cover types except during the months of January and May 1990, when ET calculated for urban areas was slightly greater than ET in agricultural areas and pastures, respectively. This seeming inconsistency may be due to the uncertainties associated with the large area (56.9 percent) excluded from the analysis in the 1991 Landsat imagery due to cloud cover.

54 Luquillo Experimental Forest: Research History and Opportunities
Water Budgets for the LEFA catchment’s water balance can be calculated as
P = Q + ET + ∆S + ∆G + L
where P is the precipitation input, Q is the amount of streamflow leaving the catchment, ET is evapotranspiration, ∆S and ∆G are the changes in soil moisture and ground water storages over the period of measurement, respectively, and L is the leakage into or out of the catchment (all expressed as millimeters of water). It is typically assumed that when completing water budgets based on
long-term data, soil moisture (∆S) should be relatively constant and this term is eliminated. Also, groundwater contributions (∆G) to streamflow are small in the LEF (Larsen 1997, Ortiz Zayas 1998)
Naumann (1994) developed a water use budget for the LEF using estimates of rainfall and ET for each forest type and life
Wu et al. (2006)
(mm/day)
Other estimates(mm/day) Reference
2.06 Wang (2001)
Whole forest
3.15 4.8 Brown et al. (1983)
4.7 García Martinó et al. (1996)
2.92 Van der Molen (2002)
Tabonuco 3.43 3.5 – 5.0 Odum (1970)
2.0 – 2.4 Schellekens et al. (2000)
Colorado 2.93 2.86 Van der Molen (2002)
Palm 2.88 1.99 Van der Molen (2002)
Elfin 1.62 1.93 Van der Molen (2002)
Table 16. Comparison between modeled estimates of evapotranspiration (Wu et al. 2006) and other point estimates of evapotranspiration in the Luquillo Experimental Forest. From Wu et al. (2006).
Figure 54.—Derived daily average actual evapotranspiration (aET) in January displayed in 3-D (unit: mm day-1). From Wu et al. (2006b).
Figure 55.—Average daily evapotranspiration (ET) for each month for different land cover types (upper: between 1973 and 1980; lower: between 1988 and 1995). From Wu et al. (2007).

Luquillo Experimental Forest: Research History and Opportunities 55
zone found in the LEF, based on an earlier study by Lugo (1986). Runoff was calculated as the difference between estimates of rainfall and ET and estimates of streamflow from Hansen et al. (1985) were used. Water withdrawals were based on available information from Puerto Rico Aqueduct and Sewer Authority and existing water permits. Naumann’s water budget estimated an average annual rainfall of 3,390 mm yr-1, ET of 1,320 mm yr-1 and stream runoff of 2,070 mm yr-1 for the entire forest.
In 1996, García Martinó et al. developed hydrologic budgets by forest type in the LEF based on relationships between rainfall and elevation and the U.S. Geological Survey (USGS) long-term streamflow data and elevation (table 17). On an average annual basis, results indicate that the forest receives 3,869 mm yr-1 of rainfall, 65 percent of which is converted to stream runoff and 35 percent is recycled by evapotranspiration or lost by other abstractions. Unlike the Naumann (1994) budget, García Martinó et al. (1996) assumed that the withdrawal of water for municipal uses did not affect stream discharge significantly. Although this assumption is incorrect, most large water intakes are located downstream of the gauging stations used in their analysis (Naumann 1994).
Naumann’s 1994 water budget for the LEF indicated that more than one-half of all water flowing from the LEF was extracted for municipal use. Between 1994 and 2004, urbanization and water withdrawals from the forest increased, with at least six new points of water withdrawal (i.e., intakes) added on rivers draining the LEF to meet present and projected municipal water demand. Four intakes were added within the forest and two intakes were added outside the forest on the Río Fajardo, Río Mameyes, Río
Espíritu Santo, and Río Blanco. Two intakes draw particularly large amounts of water: the intake at Río Mameyes (outside the forest) is permitted to extract 5 million gallons per day (mgd) (18,939 m3 day-1) and the intake at Río Fajardo is permitted to extract 12 mgd (45,455 m3 day-1) (Ortiz Zayas and Scatena 2004). The Mameyes intake was discontinued after the construction of a reservoir elsewhere in the region.
Crook et al. (2007) updated the water budget for the LEF for the year 2004 to incorporate these new intakes. The rainfall-elevation regression developed by García Martinó et al. (1996), used to estimate average annual rainfall and average monthly runoff for each watershed, was calculated from long-term daily runoff rates from 17 USGS stream gauges. The water budget of Crook et al. estimated an average annual rainfall of 3,580 mm yr-1, ET of 1,300 mm yr-1, and stream runoff of 2,280 mm yr-1 for the entire forest. The amount of water extracted from the LEF is estimated at 250 mm yr-1, or 7 percent of the average annual rainfall and 11 percent of the average annual runoff. The daily percentage of water typically generated within the forest but diverted before reaching the ocean increased from 54 percent in 1994 to 70 percent in 2004 (Naumann 1994, Crook et al. 2007). Watersheds with large water intakes have the most dramatic decrease in streamflow, particularly the Río Espíritu Santo watershed, where 82 percent of the median flow is diverted.
Table 18 compares the various water budgets for the LEF. In general, about 40 percent of total precipitation is recycled through evapotranspiration and the other 60 percent ends up in streamflow.
Forest typeDrainagearea (ha)
Weighted averageelevation (m)
Average rain(mm yr-1)
Average runoff(mm yr-1)
ET=Rainfall-runoff
Tabonuco 5,787 402 3,537 1,830 1,707Colorado 3,476 720 4,191 3,197 994Palm 1,856 711 4,167 3,158 1,009Elfin 372 897 4,849 3,958 1,144Weighted average 3,879 2,526 1,245
Table 17. Water inputs and outputs from four forest types inside the Luquillo Experimental Forest (García Martinó et al. 1996).
Study Precipitation (mm yr-1) Runoff (mm yr-1)Evapotranpiration
(mm yr-1)
Lugo (1986) (42%)Naumann (1994) 3,390 2,070 (61%) 1,320 (39%)García Martinó et al. (1996) 3,869 2,526 (65%) 1,338 (35%)Crook et al. (2007) 3,580 2,280 (64%) 1,300 (36%)Wu et al. (2006)* 1,021
Table 18. Comparison of water budgets for the Luquillo Experimental Forest. Numbers in parentheses indicate the percentage of total precipitation in each component.
*Based on model of evapotranspiration by Granger and Gray (1989).

56 Luquillo Experimental Forest: Research History and Opportunities
Water quality reflects the composition of water as affected by natural processes and by humans’ cultural activities,
expressed as measurable quantities and related to intended water use (Novotny and Chesters 1981). Surface waters contain many chemical constituents in the dissolved state that play an important role in the survival of both terrestrial and aquatic ecosystems, and these chemical constituents are related to the geology, vegetation, precipitation, topography, and human activities within a watershed. Although necessary to sustain ecosystems, excessive amounts of some dissolved species and microorganisms can degrade water quality and be detrimental to the health of many organisms, including humans.
Puerto Rico has approximately 1,300 streams, 17 of which are large enough to be classified as rivers (Pringle and Scatena 1999), but has no natural lakes, and locations for reservoirs are few. The contamination of groundwater from accidental spills, industrial wastes, and leaking septic tanks has limited the groundwater and surface water that can be developed without treatment in Puerto Rico (Pringle and Scatena 1999).
On the other hand, streamwater quality within the El Yunque National Forest is excellent, and these streams are considered to be the cleanest and most natural on the island (Santos Roman et al. 2003). Water temperature in headwater streams is relatively consistent throughout the year and ranges between 18 and 24 ºC (Covich and McDowell 1996). The average pH of streamwater is 7.2. Stream discharge is highly variable and high flows can occur at any time of the year; 10-fold increases in discharge have been recorded within hours (Scatena and Johnson 2001).
Although the headwaters of these rivers have been protected for more than a century, and some areas have been protected since Columbus landed on the island, the lowlands support a mixture of urban, suburban, and agricultural land uses. In recent decades, land use in the periphery of the Luquillo Mountains has changed drastically as agricultural lands have been abandoned and changed to forests or developed areas (Grau et al. 2003; land cover maps in Lugo et al. 2000 and, 2004). Increases in population, combined with increases in the number of second homes and resorts, have also increased the demands for the region’s natural and aquatic resources.
Because Puerto Rico is a Commonwealth Territory of the United States, island residents are subject to the environmental regulations of the U.S. Environmental Protection Agency and other Federal agencies. Many Federal agencies are involved in the island’s water management, including the U.S. Geological Survey, which monitors the island’s water quality and quantity; the U.S. Army Corps of Engineers, which is responsible for navigable waters and wetlands; the U.S. Fish and Wildlife Service, which manages threatened and endangered species and wetlands; the Natural Resources Conservation Service, which helps farmers implement best land and soil conservation
8. Water Quality of Rivers N.L. Harris
practices; and the Forest Service and National Park Service, which manage national forests and national parks, respectively.
By the early 1900s, it was estimated that on a typical day more than 50 percent of the water draining the El Yunque National Forest was appropriated for municipal uses before it reached the ocean (Scatena and Johnson 2001). In 1995, the area’s per capita water use was among the highest in the world at 732 liters per person per day (Ortiz Zayas and Scatena 2004). Unfortunately, water use efficiency is low and nearly 42 percent of the water processes in water treatment plants are unaccounted for and lost to leaks either in the water distribution systems, illegal connections, or in accounting errors. Today, the region faces nearly all the management issues associated commonly with urban hydrology, including those related to stormwater management, drinking water supply, and wastewater management. The complexity of these issues is increased due to differences in the quality of water supply infrastructure between the new developments and modern resort complexes and the aging water supply infrastructure of the older, and generally poorer, communities.
Although the Luquillo region has abundant rainfall and numerous surface water bodies, it has limited opportunities for developing additional municipal water sources. Moreover, few areas exist where dams can be built (Ortiz Zayas and Scatena 2004). Most municipal water in the region is abstracted directly from streams, and is thus constrained by the temporal variation in streamflows and chemistry. Although demand for municipal water supplies has increased, so have instream uses for recreation and the consequent need to maintain instream flows and water quality.
The following section reviews the chemistry of rainfall, throughfall, and cloud water because a portion of all these water sources ends up ultimately as streamwater.
Rainfall and Throughfall ChemistryRainfall and throughfall are major sources of nutrients in tropical forests and streams (Proctor 2005). Heartsill Scalley et al. (2007) explored the seasonal and interannual variations in rainfall and throughfall constituent fluxes in the Bisley Experimental Watersheds by analyzing weekly rainfall and throughfall data over a 15-year period that included the effects of 10 named tropical storms, several prolonged dry periods, and volcanic activity in the region. Mean weekly fluxes and volume-weighted concentrations during the 15-year study period for rainfall and throughfall are presented in table 19. Average annual rainfall and throughfall fluxes of K+ (potassium), Ca2+ (calcium), Mg2+ (magnesium), Cl- (chlorine), Na+ (Sodium), and SO
4-S (sulfate) were similar
but somewhat larger than those reported for most tropical forests. Rainfall inputs of N (nitrogen) were comparatively low and reflect the relative isolation of the air shed. More chemical
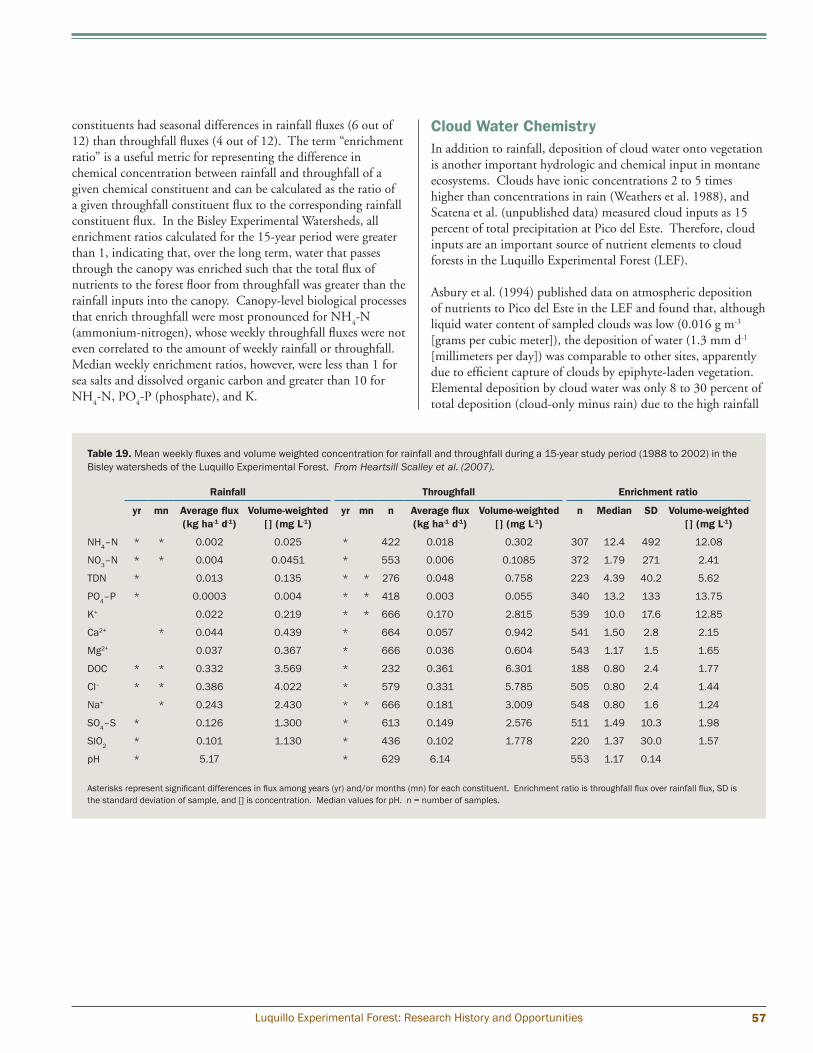
Luquillo Experimental Forest: Research History and Opportunities 57
constituents had seasonal differences in rainfall fluxes (6 out of 12) than throughfall fluxes (4 out of 12). The term “enrichment ratio” is a useful metric for representing the difference in chemical concentration between rainfall and throughfall of a given chemical constituent and can be calculated as the ratio of a given throughfall constituent flux to the corresponding rainfall constituent flux. In the Bisley Experimental Watersheds, all enrichment ratios calculated for the 15-year period were greater than 1, indicating that, over the long term, water that passes through the canopy was enriched such that the total flux of nutrients to the forest floor from throughfall was greater than the rainfall inputs into the canopy. Canopy-level biological processes that enrich throughfall were most pronounced for NH
4-N
(ammonium-nitrogen), whose weekly throughfall fluxes were not even correlated to the amount of weekly rainfall or throughfall. Median weekly enrichment ratios, however, were less than 1 for sea salts and dissolved organic carbon and greater than 10 for NH
4-N, PO
4-P (phosphate), and K.
Cloud Water ChemistryIn addition to rainfall, deposition of cloud water onto vegetation is another important hydrologic and chemical input in montane ecosystems. Clouds have ionic concentrations 2 to 5 times higher than concentrations in rain (Weathers et al. 1988), and Scatena et al. (unpublished data) measured cloud inputs as 15 percent of total precipitation at Pico del Este. Therefore, cloud inputs are an important source of nutrient elements to cloud forests in the Luquillo Experimental Forest (LEF).
Asbury et al. (1994) published data on atmospheric deposition of nutrients to Pico del Este in the LEF and found that, although liquid water content of sampled clouds was low (0.016 g m-3 [grams per cubic meter]), the deposition of water (1.3 mm d-1 [millimeters per day]) was comparable to other sites, apparently due to efficient capture of clouds by epiphyte-laden vegetation. Elemental deposition by cloud water was only 8 to 30 percent of total deposition (cloud-only minus rain) due to the high rainfall
Rainfall Throughfall Enrichment ratio
yr mn Average flux(kg ha-1 d-1)
Volume-weighted[] (mg L-1)
yr mn n Average flux (kg ha-1 d-1)
Volume-weighted[] (mg L-1)
n Median SD Volume-weighted[] (mg L-1)
NH4–N * * 0.002 0.025 * 422 0.018 0.302 307 12.4 492 12.08
NO3–N * * 0.004 0.0451 * 553 0.006 0.1085 372 1.79 271 2.41
TDN * 0.013 0.135 * * 276 0.048 0.758 223 4.39 40.2 5.62
PO4–P * 0.0003 0.004 * * 418 0.003 0.055 340 13.2 133 13.75
K+ 0.022 0.219 * * 666 0.170 2.815 539 10.0 17.6 12.85
Ca2+ * 0.044 0.439 * 664 0.057 0.942 541 1.50 2.8 2.15
Mg2+ 0.037 0.367 * 666 0.036 0.604 543 1.17 1.5 1.65
DOC * * 0.332 3.569 * 232 0.361 6.301 188 0.80 2.4 1.77
Cl– * * 0.386 4.022 * 579 0.331 5.785 505 0.80 2.4 1.44
Na+ * 0.243 2.430 * * 666 0.181 3.009 548 0.80 1.6 1.24
SO4–S * 0.126 1.300 * 613 0.149 2.576 511 1.49 10.3 1.98
SlO2 * 0.101 1.130 * 436 0.102 1.778 220 1.37 30.0 1.57
pH * 5.17 * 629 6.14 553 1.17 0.14
Table 19. Mean weekly fluxes and volume weighted concentration for rainfall and throughfall during a 15-year study period (1988 to 2002) in the Bisley watersheds of the Luquillo Experimental Forest. From Heartsill Scalley et al. (2007).
Asterisks represent significant differences in flux among years (yr) and/or months (mn) for each constituent. Enrichment ratio is throughfall flux over rainfall flux, SD is the standard deviation of sample, and [] is concentration. Median values for pH. n = number of samples.

58 Luquillo Experimental Forest: Research History and Opportunities
at the site. Solute concentrations in throughfall and stemflow were greater than in cloud water for all measured constituents except H+ (Hydrogen ion), NO
3- (nitrate ion), NH
4+, and total
N (table 20). Na and Cl from marine aerosols dominated cloud chemistry, reflecting the proximity of Pico del Este to the ocean and consequent high concentrations of these ions in cloud water. Deposition rates of SO
42- (sulfate ion) and NO
3- were
surprisingly high at this remote site, and estimated deposition rates of other constituents were in the ranges found at other sites. After passage through the canopy, concentrations of base cations in deposited cloud water increased and concentrations of N decreased.
Streamwater ChemistrySchaefer et al. (2000) present a long-term (2.5 to 11 yr) weekly record of streamwater chemistry on eight forested watersheds (catchment basins) in the Luquillo Mountains. NO
3– (nitrate),
K, and NH4
+ concentrations increased after the passage of Hurricane Hugo in 1989 and remained elevated for up to 2 years. Sulphate, chloride, Na+, Mg2+, and Ca2+ showed smaller relative significant changes. Average streamwater exports of K+, NO
3–, and NH
4+ increased by 13.1, 3.6, and 0.54 kg ha-1 yr-1
(kilograms per hectare per year) in the first posthurricane year across all watersheds (fig. 56). These represent increases of 119, 182, and 102 percent, respectively, compared with the other years of record. The increased stream outputs of K+ and N in the
first 2 years after the hurricane are equivalent to 3 percent (K) and 1 percent (N) of the hurricane-derived plant litter.
For both El Verde and the Bisley Experimental Watersheds, the streamwater ionic concentrations most affected by disturbance included K+ (fig. 57a and fig. 58a), NO
3– (fig. 57b and fig. 58b),
and NH4
+ (fig. 57e and fig. 58e). The posthurricane NO3–
peak was of unprecedented magnitude and duration regarding long-term sampling and was observed in all eight watersheds. NO
3– concentrations returned to their prehurricane values in all
watersheds by March 1991. The posthurricane K+ concentration peak (fig. 57a and fig. 58a) was of similar relative magnitude to the NO
3– peak (i.e., both approximately tripled prehurricane
concentrations). Concentrations of K+ declined to prehurricane levels in seven of eight watersheds by October 1990. The posthurricane K+ peak was higher in the Bisley Experimental Watersheds than in the El Verde watersheds.
Hurricane disturbance appeared to have only minor effects on Mg2+ (fig. 57c and fig. 58c) and Ca2+ (fig. 57d and fig. 58d) concentrations. For these two ions, the annual periodicity in concentrations result from inverse concentration/discharge relationships and seasonality in streamflow. Sodium, sulphate, and chloride concentrations were the least affected by hurricane disturbance.
Figure 56.—Comparison of stream chemical fluxes in the first year after Hurricane Hugo (1989) in the Luquillo Experimental Forest, Puerto Rico, with those averaged over all other years of record. Bars show mean values across watersheds ± 95-percent confidence intervals (n=6). From Schaefer et al. (2000).
Solute Events Cloud water Stemflow Throughfall Rainfall
H+ 12 27.6 8.3 4.1 6.4
SO42– 12 181 219 166 47.0
NO3– 12 63.6 32.8 14.6 7.9
NH4+ 3 31.5 4.5 5.4 9.9
Cl– 12 384 550 498 175
Na+ 12 397 450 442 215
K+ 12 13 23.6 29.3 13.6
Ca2+ 12 62.3 98.0 78.2 47.1
Mg2+ 12 87.6 122 109 49.3
PO43– 3 0.12 0.32 0.34 ----
Total N 3 65 52 74 ----
Total P 3 0.13 0.64 1.2 ----
Table 20. Volume-weighted mean solute concentrations in cloud water, stemflow, and throughfall during cloud events at Pico del Este. Units are μeq L-1, except total N and total P (μm L-1). Values for concentrations in rainfall at Pico del Este included for comparision. From Asbury et al. (1994).
N = Nitrogen. P = Phosphorus.

Luquillo Experimental Forest: Research History and Opportunities 59
Figure 57.—Chemical concentrations in El Verde, Puerto Rico, streams (QS, QT, QPA, and QPB) before and after the passage of Hurricane Hugo, 9-week moving averages; (a) potassium, (b) nitrate-N, (c) magnesium, (d) calcium, and (e) ammonium-N. The vertical lines mark the time of the hurricane disturbance. From Schaefer et al. (2000).
Figure 58.—Chemical concentrations in Bisley, Puerto Rico, streams (PRM, BQ1, BQ2, and BQ3) before and after the passage of Hurricane Hugo, 9-week moving averages; (a) potassium, (b) nitrate-N, (c) magnesium, (d) calcium, and (e) ammonium-N. The vertical lines mark the time of the hurricane disturbance. From Schaefer et al. (2000).

60 Luquillo Experimental Forest: Research History and Opportunities
Puerto Rico has been shaped by its history as a volcanic oceanic island and has been described as a geologic “heap of
volcanic debris” (Hodge 1920, Mitchell 1954). Like mountains on other high-elevation Caribbean islands, the Luquillo Mountains have a central igneous core, formed in association with Cretaceous and Tertiary volcanoes, surrounded by an apron of sedimentary rocks that become progressively younger as they spread toward the coast.
Like other islands in the Greater Antilles, Puerto Rico is part of a large volcanic island-arc complex that rests along the junction between the American and Caribbean crustal plates. The region’s geologic history is a complex sequence of accretionary and fragmentary events that occurred during the separation of North and South America. During its development, Puerto Rico underwent a full cycle of mountain development and is now relatively stable (King 1977).
Compared with the geology on the islands of Hispaniola and Cuba, fault and valley formation have played relatively minor roles in the geologic history of Puerto Rico, yet two distinct northwest trending fault zones divide the island into three major structural blocks (fig. 59). The Luquillo Mountains form the core of the northeastern structural block. A fault-line scarp that separates the northeastern and central structural bodies forms the southern margin of the asymmetric Luquillo range. Along the
9. GeologyN.L. Harris
northern and eastern flanks of the range, radiating ridges extend from the mountain into the lower lying coastal regions.
Volcanoclastic sediments or dioritic intrusions underlie most of the Luquillo Experimental Forest (LEF). Both types of rock were derived from a similar andesitic magma that was active during the Cretaceous and lower Tertiary periods (Seiders 1971a). Following the accumulation of the volcanoclastic sediments, late Eocene or early Oligocene tectonic activity produced the dominant structural features of the mountains. The subsequent intrusion of the quartz-rich dioritic Río Blanco complex marks the last phase of igneous activity in the area (Seiders 1971a). Because earlier intrusions were quartz poor, this last episode of igneous activity probably contained differentiated and reworked magma.
Early Oligocene tectonic activity was followed by a period of quiescence, stability, and degradation. This period lasted from the Upper Oligocene to Middle Miocene, during which time the Caribbean plate drifted eastward and the Antilles began to take on their current configuration (Rosen 1985). Partial base leveling of Puerto Rico is thought to have occurred during this period and an upper or a ‘St. John’ peneplain developed (Lobeck 1922, Meyerhoff 1933, Beinroth 1982). The St. John period was terminated in the Upper Miocene by a series of uplifts that raised the island to its present elevation (Beinroth 1982). A
Figure 59.—The principal geological elements of Puerto Rico. From Glover (1971), reprinted in Scatena (1989).

Luquillo Experimental Forest: Research History and Opportunities 61
second period of prolonged stability during the Pliocene period is believed to have formed a second and lower erosion surface, the Caguana Peneplain. Since the end of the Tertiary period, Puerto Rico has been tectonically stable, yet Pleistocene sea levels at various times have reached 25 to 65 meters (m) above present levels (Monroe 1968).
The Luquillo Mountains have a structurally complex terrain dominated by northwest-trending faults and associated northeast-trending folds. The major structural features in the northern section of the mountains are two broad, northeast trending folds: the Río Canóvanas syncline and the Luquillo anticline (Seiders 1971a). Northwest dipping beds cut by faults of small to medium displacement largely underlie the area between the fold axes.
The Río Blanco complex dominates the southern section of the Luquillo Mountains. The rectilinear outline of this intrusion suggests that its emplacement was influenced by northwest-trending fractures and northeast-trending bedding (Seiders 1971a). Although the emplacement of the stock produced little or no folding in the adjacent host rocks, a zone of contact metamorphisms surrounds the stock. Many of the large landslides in the LEF are associated with this contact zone.
Bedded volcanoclastic rocks underlie most of the northern Luquillo Mountains. In the Bisley area, these sedimentary rocks are members of the lower Cretaceous, Albian age, Fajardo Formation (Briggs and Aguilar Cortés 1980). The source of clastic sediment for these rocks was an active volcanic complex standing at or near sea level (Seiders 1971b). Volcanic debris was deposited into moderately deep water after it was transported and reworked by submarine slides, turbidity currents, ash flows, and ash falls. Alternating episodes of rapid volcanoclastic deposition and slow pelagic sedimentation resulted in a net accumulation of approximately 7,600 m of sediment (Seiders 1971b).
The bedrock underlying the Bisley Experimental Watersheds has been mapped as the upper thick-bedded tuff unit of the Fajardo Formation (Briggs and Aguilar Cortés 1980). This unit consists of thick-bedded, very dark- to light-bluish-gray and dark-greenish-gray tuff that is interbedded with thick-bedded to massive tuff breccias and thin- to thick-bedded tuffaceous sandstone. The typical thick-bedded tuff weathers to an olive gray color, whereas the tuffaceous sandstone weathers to a pale brown color. The total thickness of this unit ranges from 800 to 1,100 m.
Within the Bisley Experimental Watersheds, outcrops of bedrock are generally limited to the headwaters of the mainstream channels. The dominant exposures are thick-bedded tuffaceous
sandstones that are saprolitic and riddled with clay-lined faults, and joints. Primary sedimentary structures are difficult to distinguish, but conglomeritic lenses and well-indurated siltstone beds are definable. Relic grains of plagioclase and mafic minerals are recognizable in some hand specimens. Weathering of these mafic, quartz-poor rocks produces a clay-rich, sand-poor residuum; however, where intersecting joint planes breaks outcrops, resistant angular boulders can be formed. The size and shape of these boulders are similar to those found along stream channels and drainages.
Regarding chemical rock weathering, a compilation of solute fluxes from a worldwide distribution of watersheds (White and Blum 1995) indicates that the effects of high temperature and precipitation combine to make solute fluxes from the Río Icacos watershed in the LEF the fastest documented chemical weathering rate of granitoid rocks on the Earth’s surface (McDowell and Asbury 1994).
Advances in our understanding of geology in the LEF will be obtained from the newly developed Luquillo Critical Zone Observatory (LCZO), part of a National Critical Observatory program, which focuses on landforms and watersheds that have different bedrock but similar climate and land use (http://www.sas.upenn.edu/lczo). Although bedrock lithology and chemistry have been considered primary state factors in landscape and soil development for over a century, the influences of lithology on denudation, hydrologic routing, and geochemical processing are poorly constrained in most studies. To address this challenge, the LCZO will use the natural laboratory of the LEF to quantify and contrast how critical zone processes (those processes between rock, water, soils and atmosphere) in watersheds underlain by different bedrock are coupled and decoupled with climatic conditions and hydrologic, geochemical and biogeochemical cycles.
Differences in weathering patterns have a profound influence on landslide frequency, chemical denudation, and the morphology and longitudinal profiles of streams and hillslopes within the two watersheds. The LCZO will focus on two main study watersheds, the Río Mameyes and the Río Blanco, which have similar climatic and environmental histories but different lithology. The Río Mamayes watershed is primarily volcaniclastic bedrock that weathers to produce clays and boulders with a wide range of grainsizes, while the Río Blanco watershed is underlain by granodiorite which weathers into saprolite comprised of sand and large granodiorite corestones. Some of the planned research includes laboratory and field studies that will examine the sediment mobility in these watersheds over two very different timescales: event-based response to individual floods, and millenial-scale estimates of bed material transport through streams.
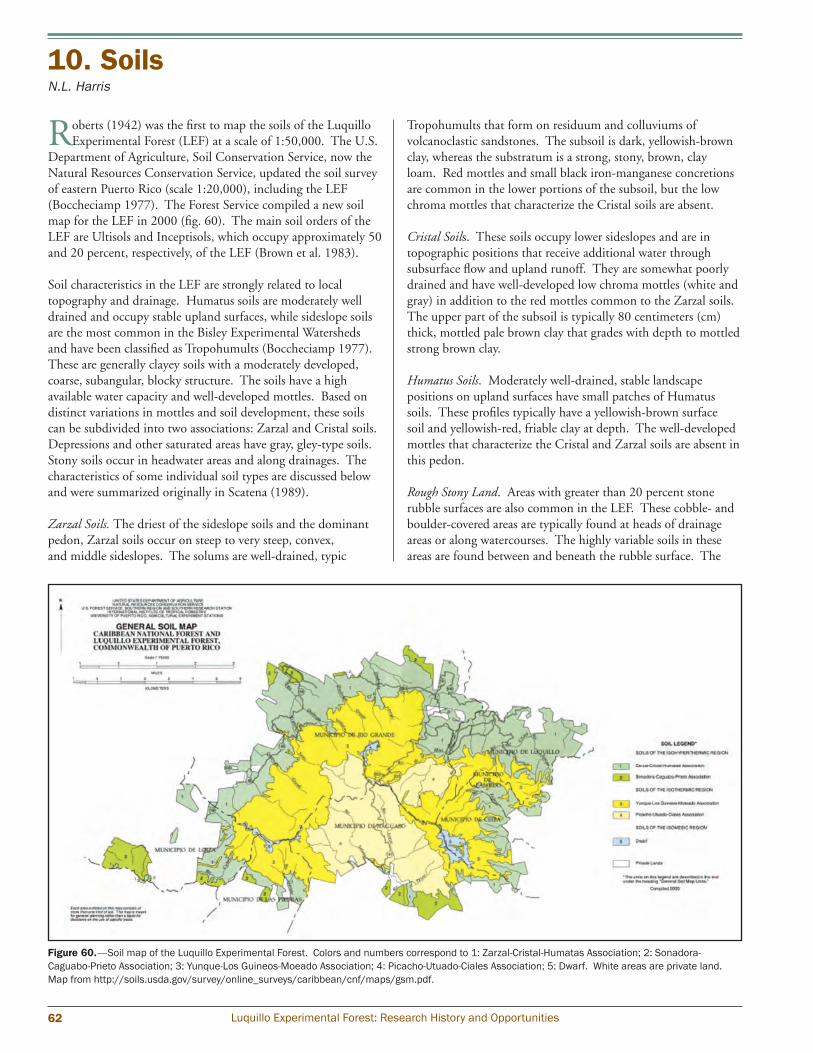
62 Luquillo Experimental Forest: Research History and Opportunities
Roberts (1942) was the first to map the soils of the Luquillo Experimental Forest (LEF) at a scale of 1:50,000. The U.S.
Department of Agriculture, Soil Conservation Service, now the Natural Resources Conservation Service, updated the soil survey of eastern Puerto Rico (scale 1:20,000), including the LEF (Boccheciamp 1977). The Forest Service compiled a new soil map for the LEF in 2000 (fig. 60). The main soil orders of the LEF are Ultisols and Inceptisols, which occupy approximately 50 and 20 percent, respectively, of the LEF (Brown et al. 1983).
Soil characteristics in the LEF are strongly related to local topography and drainage. Humatus soils are moderately well drained and occupy stable upland surfaces, while sideslope soils are the most common in the Bisley Experimental Watersheds and have been classified as Tropohumults (Boccheciamp 1977). These are generally clayey soils with a moderately developed, coarse, subangular, blocky structure. The soils have a high available water capacity and well-developed mottles. Based on distinct variations in mottles and soil development, these soils can be subdivided into two associations: Zarzal and Cristal soils. Depressions and other saturated areas have gray, gley-type soils. Stony soils occur in headwater areas and along drainages. The characteristics of some individual soil types are discussed below and were summarized originally in Scatena (1989).
Zarzal Soils. The driest of the sideslope soils and the dominant pedon, Zarzal soils occur on steep to very steep, convex, and middle sideslopes. The solums are well-drained, typic
10. SoilsN.L. Harris
Tropohumults that form on residuum and colluviums of volcanoclastic sandstones. The subsoil is dark, yellowish-brown clay, whereas the substratum is a strong, stony, brown, clay loam. Red mottles and small black iron-manganese concretions are common in the lower portions of the subsoil, but the low chroma mottles that characterize the Cristal soils are absent.
Cristal Soils. These soils occupy lower sideslopes and are in topographic positions that receive additional water through subsurface flow and upland runoff. They are somewhat poorly drained and have well-developed low chroma mottles (white and gray) in addition to the red mottles common to the Zarzal soils. The upper part of the subsoil is typically 80 centimeters (cm) thick, mottled pale brown clay that grades with depth to mottled strong brown clay.
Humatus Soils. Moderately well-drained, stable landscape positions on upland surfaces have small patches of Humatus soils. These profiles typically have a yellowish-brown surface soil and yellowish-red, friable clay at depth. The well-developed mottles that characterize the Cristal and Zarzal soils are absent in this pedon.
Rough Stony Land. Areas with greater than 20 percent stone rubble surfaces are also common in the LEF. These cobble- and boulder-covered areas are typically found at heads of drainage areas or along watercourses. The highly variable soils in these areas are found between and beneath the rubble surface. The
Figure 60.—Soil map of the Luquillo Experimental Forest. Colors and numbers correspond to 1: Zarzal-Cristal-Humatas Association; 2: Sonadora-Caguabo-Prieto Association; 3: Yunque-Los Guineos-Moeado Association; 4: Picacho-Utuado-Ciales Association; 5: Dwarf. White areas are private land. Map from http://soils.usda.gov/survey/online_surveys/caribbean/cnf/maps/gsm.pdf.

Luquillo Experimental Forest: Research History and Opportunities 63
soil’s surface layer is commonly thin with dark-grayish-brown, plastic clay containing abundant leaf litter. The subsoil consists of either well-mottled clays of the Cristal series or gley-type soils.
Gley Soils. In areas with excess soil moisture, gley structureless soils are common. These soils are typically found at the heads of drainages, adjacent to stream channels, and in footslopes below eroding hillslope scarps. Gley soils are commonly, but not exclusively, associated with stony land. The typical subsoil is structureless, gray, plastic, heavy clay, 1 to 20 cm thick. Beneath the gley surface, horizons range from bluish gray to mottled rusty brown. In some areas, the gley soils cap relatively unaltered Cristal soils.
Soil erosion is a complex and interactive process between eroding forces and the resistance of the surface to them. The universal soil loss equation (Wischmeier and Smith 1978) indicates that erosion increases with increased rainfall and rainfall intensity. This relationship is confounded, however, by many interrelated factors. In the Bisley Experimental Watersheds of the LEF, Basnet (1992) used erosion pins to assess soil movement rates before and after the passage of Hurricane Hugo at three topographic positions: ridges, slopes, and valleys. Ridges had a significantly lower rate of erosion than slopes, most likely because ridges are underlain by stable geologic substrates and support a dense tree canopy that protects the ground from the direct impact of rainfall. Valleys experienced high sedimentation due to low slope angles and high runoff from both ridges and slopes. After this large-scale disturbance hurricane hit, the rate of soil movement increased 10-fold, masking any effects of topography (fig. 61).
Research currently being conducted by the newly developed Luquillo Critical Zone Observatory will advance our understanding soils in relation to landforms and bedrock (http://www.sas.upenn.edu/lczo).
Figure 61.—Rate of soil erosion in the Bisley Experimental Watersheds before and after the passage of Hurricane Hugo in (a) forest and (b) nonforest areas. From Basnet (1992).
61a.
61b.

64 Luquillo Experimental Forest: Research History and Opportunities
The first forest supervisor and chief forester of the then Luquillo National Forest and eventual Luquillo
Experimental Forest (LEF) recognized four forest types in the national forest. These forest types were based on the “nature, circumstance, and elevation of the vegetation” for “convenience in description and to aid in preparation of management plans” (Bruner 1919). The four forest types are riparian, slope, sierra palm, and elfin forests. Bruner’s classification formed the basis for the forest “sites” or “areas of distinct productivity,” as later renamed by Wadsworth (1951), and this nomenclature is presently in common usage: tabonuco, palo colorado, palm, and elfin (also termed dwarf, cloud, or mossy forest) forest types. We don’t recommend the use of dwarf or cloud forest to identify elfin forests because these elfin or mossy forests (sensu Howard 1968) are not dwarfed sensu stricto nor are they uniquely cloud forests. All forests above the cloud condensation level at the LEF are cloud forests, including the elfin forests. Elfin forests have the highest concentration of epiphytic mosses and other plants along the elevation gradient of the LEF, thus the name mossy forest. The height of elfin forests ranges from 1 to 5 meters (m) depending on their aspect or local hydrologic conditions.
Brown et al. (1983) described Wadsworth’s four forest types according to their spatial distribution, species composition, and structural attributes. Since the publication of Brown et al. (1983), a key realization of many researchers has been that the vegetation of the LEF is distributed along both longitudinal (elevational) and lateral (topographical) gradients. Although the four-forest-types model has served well to describe general patterns at a coarse scale, the tradeoff is the simplification of vegetation patterns observed at finer scales. Advances in the way researchers analyze and understand data on vegetation distribution and patterns signal a need to develop a new paradigm of vegetation associations in the LEF. Therefore, the gradient concept has replaced the four-forest-types model and presents a more thorough view of vegetation associations within the LEF. The section below organizes vegetation types by elevation range and by the topographic gradients that occur within the elevation ranges. Finally, the section reviews some species of concern within the LEF. This section does not address plantation forests or the effects on vegetation of past land use or hurricanes or other disturbances because these topics are covered elsewhere in the text.
Factors Influencing Species Distribution PatternsA panoramic view of the forested LEF landscape reveals a continuous canopy (fig. 62), but, upon closer examination, the codominance of various tree species at different elevations begins to emerge. Although specks of silvery white (Cecropia schreberiana) and dark yellow (Schefflera morototoni) can be seen on days with strong winds, most apparent are the conspicuous patches of light-green fronds that comprise the palm forest,
breaking up an otherwise darker green canopy. In fact, the most widespread and abundant canopy-forming species—the sierra palm, Prestoea montana—occurs from the lowest elevations of the LEF to elevations of more than 1,000 m above sea level.
What factors control the distribution of plant species in the LEF? Vegetation patterns along environmental gradients historically have been described using individualistic-continuum models in which the vegetation present at any particular site is the result of the co-occurrence of species with similar habitat requirements (Gleason 1926, Austin and Smith 1989, Collins et al. 1993, Hoagland and Collins 1997). Most studies of tropical montane vegetation along elevation gradients, however, tend to describe vegetation as discrete (sensu Clements 1936) community types (Gleason and Cook 1927, Weaver and Murphy 1990, Waide et al. 1998). A recent community-level study (Barone et al. 2008) focused on species distribution and species turnover variance along the LEF’s elevation gradient. The study’s results indicate a more complex framework of vegetation communities and metacommunities, forest types, associations, and individual species distribution dynamics than the Clementian model or the four-forest type paradigm would suggest. As described previously (Brown et al. 1983, Weaver and Murphy 1990, Waide et al. 1998), a pattern of decreasing species richness with increasing elevation is apparent, but individual tree species also respond to environmental conditions such as rainfall, soil moisture, and geomorphic position (Frangi 1983, Weaver 1991, Lugo et al. 1995, Lugo and Scatena 1995, Scatena and Lugo 1995, Heartsill Scalley 2005, Barone et al. 2008). The Barone et al. (2008) data set clearly shows that species occurrence and distribution conform to the continuum models, but also shows that species groups tend to form discrete community units (fig. 63). Tree species along the Sonadora stream elevation gradient in the LEF have various distribution patterns (fig. 64), with species such as Prestoea montana and Psychotria berteriana occurring in great abundance at all elevations, while others such
11. Vegetation T. Heartsill Scalley
Figure 62.—Landscape view from the west of the Luquillo Experimental Forest. Note Cyathea arborea and Cecropia schreberiana in the foreground. Photo by T. Heartsill Scalley.

Luquillo Experimental Forest: Research History and Opportunities 65
as Dacryodes excelsa and Manilkara bidentata occur exclusively at lower elevations. From mid-elevations to higher elevations, Rhedia portoricensis and Magnolia splendens are more abundant, while Cyathea bryophylla and Lobelia portoricensis are found only in the highest elevation sites. The intensively sampled elevation transects of Barone et al. (2008) demonstrate that boundaries of vegetation associations are not as clear as boundaries in surrounding palm forests.
Community types are influenced by environmental factors that vary along the elevation gradient (referred to here as “longitudinal” gradients), but riparian to upland gradients (i.e., “lateral” gradients) also influence vegetation characteristics as a result of fine-scale variations in soil moisture and the accumulation of nutrients and organic materials from litterfall and woody debris. Changes in most species associations are subtle and gradual, with each species honing in on specific habitat requirements, such as the documented differences in tree species distributions in ridges, slopes, upland areas, and riparian valleys within sites at various elevations in the LEF (Weaver
Figure 64.—Total number of stems of dominant tree species measured in 0.1 hectare plots across an elevation gradient in the Sonadora watershed. Luquillo Long Term Ecological Research data set lterdb123, compiled by T. Heartsill Scalley.
Figure 63.—Total number of stems of all tree species measured in 0.1 hectare plots across an elevation gradient in the Sonadora watershed. Luquillo Long Term Ecological Research data set lterdb123, compiled by T. Heartsill Scalley.

66 Luquillo Experimental Forest: Research History and Opportunities
1991; Scatena and Lugo 1995; Lugo and Scatena 1995; Weaver 2000; Heartsill Scalley et al. 2009b).
The vegetation communities in the LEF are also associated with periodic disturbances, including treefalls, landslides, and hurricanes (Scatena and Larsen 1991, Weaver 1991, Scatena and Lugo 1995, Zimmerman et al. 1995, Reagan and Waide 1996, Lugo 2008). An additional factor that influences vegetation community structure is the massenerhebung, or mountain mass elevation, effect. The mountainous terrain of the LEF rises steeply and abruptly to above 1,000 m in elevation over a linear distance of 8 kilometer (km) from the coast, resulting in distinctive changes in vegetation structure (fig. 65a) and composition (such as the presence of the cloud forest types) at a relatively low elevation (Grubb 1971, Weaver 1991). The observations of Barone et al. (2008) suggest that the extent of cloud cover is an important factor that influences species distribution along the LEF elevation gradient. Although no experimental evidence is currently available, they proposed that the observed decrease in species richness at mid-elevations of the LEF (fig. 65b) could be related to the lower boundary of the cloud cover base in the LEF, as other studies have connected the frequency of fog with the transitions among different forest types on tropical mountains (Grubb 1971).
Silver et al. (1999) documented a soil O2 (oxygen) concentration
gradient with elevation and along topography at the LEF (see section on nutrient fluxes) and found that tree species density decreased as the average soil O
2 concentration declined along
a ridge, slope, valley catena (their table 1). It appears from this study and the observations of Frangi (1983) that all plant communities above the cloud condensation level are wetland communities (fig. 66a). Above this level, soil O
2 concentrations
decrease, soil saturation increases, and plant species density and distributions are affected.
Figure 65.—Stem (a) and species (b) density versus elevation in the Mameyes and Sonadora watersheds of the Luquillo Experimental Forest. From Luquillo Long Term Ecological Research data set lterdb123, compiled by T. Heartsill Scalley.
65a.
65b.
Figure 66.—(a) Conceptual model of wetland ecosystems in the Luquillo Experimental Forest. Arrows indicate movement of water flow. From Frangi (1983). (b) Pterocarpus forest, one of the wetland ecosystems of the Luquillo Experimental Forest. Photos by Neftalí Ríos and Samuel Moya.
66a. 66b.

Luquillo Experimental Forest: Research History and Opportunities 67
Low-Elevation Vegetation Below the Cloud Condensation Level Tall trees with canopy heights extending up to ~30 m along with lianas (i.e., woody vines) dominate low elevations (<600 m) of the LEF and are abundant and important structural elements of these forest communities. Dominant tree species at low elevations—Dacryodes excelsa (tabonuco) and Sloanea berteriana (motillo)—are distributed primarily as a function of the geomorphology of the underlying terrain (lateral gradients), as these species tend to occupy ridges and ridge tops (Basnet et al. 1993). Other common emergent trees at low elevations in the LEF include Manilkara bidentata (ausubo), Guarea guidonia (guaraguao), Buchenavia capitata (granadillo), and Ocotea leucoxylon (laurel geo) (table 21). This tree community, referred to commonly as the tabonuco forest, ranges in elevation from approximately 200 to 600 m above sea level. Younger successional forest stands are observed commonly at the periphery of the LEF, ranging from low to mid elevations, and
include tree species such as Tabebuia heterophylla, C. schreberiana, S. morototoni, and the shrub Miconia prasina. Animals disperse the seeds of most of these tree species—M. prasina and S. morototoni by birds and C. schreberiana by bats—while only the T. heterophylla seeds are dispersed by wind. Landscape views of the western periphery of the LEF at low elevations are particularly identifiable by Tabebuia heterophylla during its flowering periods (fig. 67).
The most abundant lianas in the low-elevation forests are Marcgravia spp., Rourea surinamensis, Schlegia brachyata, and Paullinia pinnata (Rice et al. 2004). Two of these lianas, R. surinamensis and S. brachyata, contribute nearly 5 percent of annual litterfall (Zalamea and González 2008). Epiphytes that rely on other vegetation for structural support—such as bromeliads and ferns—are also present in both upland and riparian areas, but are much more abundant in riparian areas (Sharpe 1997). Ferns also tend to dominate the forest
a. Stems ha-1
Pre Hugo 1989 Post Hugo 1989 1994 1999 2004
Sloanea berteriana 92.87 Sloanea berteriana 76.72 Cecropia schreberiana 104.4 Cecropia schreberiana 107.3 Cecropia schreberiana 103.3
Prestoea montana 71.90 Prestoea montana 55.50 Prestoea montana 61.52 Psychotria berteriana 95.85 Prestoea montana 100.4
Dacroydes excelsa 61.41 Dacroydes excelsa 45.70 Sloanea berteriana 60.09 Prestoea montana 94.42 Sloanea berteriana 76.39
Inga laurina 40.44 Inga laurina 26.11 Dacroydes excelsa 37.2 Sloanea berteriana 84.41 Psychotria berteriana 76.39
Ocotea leucoxylon 38.94 Casearea arborea 19.58 Inga laurina 27.18 Dacroydes excels 48.64 Dacroydes excelsa 52.34
C. portorricensis 35.92 C. portorricensis 17.95 Casearea arborea 24.32 Sapium laurocerasus 41.49 C. portorricensis 42.44
Guarea glabra 28.46 Guarea guidonia 16.32 Guarea guidonia 18.6 C. portorricensis 37.2 Ocotea leucoxylon 38.2
Guarea guidonia 25.46 Cordia borinquensis 14.69 Sapium laurocerasus 18.6 Inga laurina 34.33 Sapium laurocerasus 35.37
Casearea arborea 25.46 Ocotea leucoxylon 14.69 C. portorricensis 17.17 Ocotea leucoxylon 34.33 Inga laurina 32.54
Psychotria berteriana 25.46 Guarea glabra 13.05 Cordia borinquensis 12.88 Casearea arborea 32.9 Casearea arborea 32.54
b. Percent Biomass
Pre Hugo 1989 Post Hugo 1989 1994 1999 2004
Dacroydes excelsa 39.87 Dacroydes excelsa 43.88 Dacroydes excelsa 39.39 Dacroydes excelsa 34.99 Dacroydes excelsa 33.06
Guarea guidonia 16.38 Guarea guidonia 11.39 Cecropia schreberiana 14.14 Cecropia schreberiana 18.68 Cecropia schreberiana 18.82
Sloanea berteriana 8.85 A. floribunda 8.26 Guarea guidonia 12.53 Guarea guidonia 9.23 Guarea guidonia 13.94
A. floribunda 4.27 Buchenavia capitata 6.96 Guarea guidonia 5.48 Prestoea montana 7.76 Prestoea montana 8.10
Ormosia krugii 3.77 Ormosia krugii 4.21 Prestoea montana 4.72 Sloanea berteriana 5.64 Sloanea berteriana 3.60
Buchenavia capitata 3.48 Inga laurina 3.86 Inga laurina 4.58 Inga laurina 4.04 Alchornea latifolia 2.63
Schefflera morototoni 2.62 Prestoea montana 2.79 A. floribunda 3.11 Buchenavia capitata 2.64 Buchenavia capitata 2.22
Cecropia schreberiana 2.49 Sloanea berteriana 2.71 Buchenavia capitata 2.72 A. floribunda 2.13 Manilkara bidentata 1.78
Prestoea montana 2.44 Alchornea latifolia 2.61 Ormosia krugii 2.26 Laetia procera 1.81 Laetia procera 1.70
Sapium laurocerasus 2.09 Laetia procera 1.93 Alchornea latifolia 2.02 Alchornea latifolia 1.67 Inga laurina 1.47
Table 21. Stem density and biomass of various species of the tabonuco forest in the Bisley watersheds. Data from (Heartsill Scalley et al. 2010). In bold low light/primary forest species, underlined high light/secondary forest species, other species are intermediary in their successional status and light requirements. C. portorricensis = Cyathea portorricensis, A. floribunda = Alchorneopsis floribunda.

68 Luquillo Experimental Forest: Research History and Opportunities
understory, however, and have been shown to constitute up to 34 percent of the total vegetation (Chinea 1999). Another epiphyte seen commonly on large trees in open canopy areas of the low-elevation forest is the cactus known as the “tree beard” (Rhipsalis baccifera). This species has long, thornless stems that hang from tree trunks and branches, and birds readily consume its fruits (Santiago 2008). It is the only member of the cactus family that grows in the LEF (fig. 68).
Orchids (both epiphytic and terrestrial) are also present in low-elevation forests, with epiphytic orchids present typically above the first branch of larger diameter trees (>16.5 cm DBH [diameter at breast height]) (Migenis and Ackerman 1993). Guarea guidonia and Dacryodes excelsa are the two tree species that have been observed to host the most epiphytic orchids (such as Maxillaria coccinea, Pleurothallis ruscifolia, and Jaquiniella globosa) within the tabonuco forest type (Migenis and Ackerman 1993). The spatial distribution of terrestrial orchids in the tabonuco forest type has been related to disturbances and past land use (Bergman et al. 2006). This is the case of Wullschlaegelia calcarata, the aclorophyllous, saprophytic (nonphotosynthetic) orchid found in primary, closed canopy forests and absent from areas with past land use history and natural disturbances such as canopy gaps. There were positive associations of W. calcarata and D. excelsa and a negative association of W. calcarata and C. schreberiana, a light-demander pioneer (early successional) tree. Another positive relationship was found with W. calcarata and leaf litter abundance (but not basal area) of Buchenavia tetraphylla, a deciduous tree species with a unimodal (March and April) leaffall pattern. Previous land use effects on the soils and the fungal leaf litter symbionts of W. calcarata may be part of the complex environmental requirements of this orchid’s distribution. Other easily observed orchids are those occurring along riparian zones on streamside boulders and stems, in particular the various species of the endemic genus Lepanthes (fig. 69).
In addition to the tabonuco-dominated, low-elevation forests, wetlands in the LEF found below the cloud condensation level include riparian forests (fig. 66a). In the lower elevations of the Mameyes river watershed, the wetland tree P. officinalis (Álvarez López 1990) forms stands along riparian areas. This tree, with its characteristic massive buttress roots and floating seeds, has leaves that are readily consumed by stream fauna (Crowl et al. 2006, Welsh et al. unpublished data). Buttress roots up to 8 m in width and 5 m in height have been recorded, and root color varies with age such that younger roots are yellow and change to reddish and dark gray as they age. A P. officinalis stand of approximately 3.7 hectares occurs at 500 m above sea level in the LEF; it is described as a montane riverine forest system with organic soil over clay (Álvarez López 1990). Other species within this rare wetland forest type include Casearia arborea, Cordia borinquensis, Inga laurina, Manilkara bidentata, the tree fern Nephelea portoricensis, and the palm Prestoea montana. The
Figure 67.—Tabebuia heterophylla, a common tree species that inhabits low elevations of the Luquillo Experimental Forest, during a flowering period. Photo by T. Heartsill Scalley.
Figure 68.—Rhipsalis baccifera, or “tree beard,” a common epiphyte of the tabonuco forest type. Photo by Eugenio Santiago Valentín.
Figure 69.—Orchid of the genus Lepanthes, which is seen commonly on streamside boulders and in adjacent riparian areas. Photo by T. Heartsill Scalley.

Luquillo Experimental Forest: Research History and Opportunities 69
upper canopy is 25 to 30 m in height, and a second canopy layer is found at 15 m, with abundant epiphytes and woody vines. Pterocarpus officinalis, a species with a wide Caribbean distribution (Rivera Ocasio et al. 2006), also occurs in small groups of individuals along streamsides at elevations below the LEF boundary (fig. 66b).
More diverse riparian communities dominate other low-elevation wetland areas. In the Luquillo Forest Dynamics Plot along the Prieta and Toronja streams, Heartsill Scalley et al. (2009b) calculated the minimum distance of individual stems (>10 cm DBH) to the nearest of the two streams. The species with stems in close proximity to streams were Clusia rosea, Coccoloba diversifolia, Margaritaria nobilis, Ixora ferrea, Trichilia pallida, and Guettarda valenzuelana, with a median distance to streams between 21 and 29 m. Margaritaria nobilis and C. diversifolia, however, were most abundant closer to the streams, with 75 percent of their stems within 30 to 40 m of the stream. Other species had 75 percent of their stems within 40 to 50 m from the stream and included C. rosea, Guatteria caribaea, G. valenzuelana, Byrsonima wadsworthii, and Eugenia stahlii (fig. 70).
Cloud and Wetland Forests Above the Cloud Condensation LevelAs rainfall increases toward higher elevations of the LEF as a result of adiabatic cooling, forest structure shifts to an increased presence of epiphytes and to a higher density of shorter and smaller trees and shrubs. The lifting condensation level, which occurs typically around 600 m above sea level, determines where clouds will form and, thus, where the cloud forest community begins. The lower elevation cloud forest (~600 to 800 m) is characterized by the late successional species Cyrilla racemiflora (palo colorado) but is dominated on a stem density basis by Prestoea montana, Micropholis garciniifolia, and Calycogonium squamulosum. Bromeliads are common on the forest floor in the palo colorado forest particularly those of the genus Guzmania. Weaver (1991, 2000) has described the tree species in this vegetation association in great detail and discussed lateral gradients in relation to aspect (leeward versus windward) observed regarding both composition and structure. Lateral gradients in vegetation structure and community characteristics described for forests below the cloud condensation level are also observed in higher elevation cloud forests, with higher stem density, species richness, and aboveground biomass on ridges versus slopes and riparian valleys.
Figure 70.—Tree species distribution in relation to distance from streams. From Heartsill Scalley et al. (2009b).

70 Luquillo Experimental Forest: Research History and Opportunities
Large stands of the sierra palm (Prestoea montana) begin to occur at approximately 500-m elevation—at the intersection of premontane wet and rain forest life zones—and extend up to the mountain peaks on steep slopes and ravines adjacent to elfin cloud forests (Brown et al. 1983, Weaver and Murphy 1990, Lugo et al. 1995). Palm forests are generally classified as either palm brake (i.e., palm slope) or palm floodplain forest, depending on the specific environmental and geomorphic conditions present. Palm brake forests are found on steep slopes where soils undergo long periods of saturation, while floodplain forests are periodically inundated with water (Brown et al. 1983, Frangi and Lugo 1985, Lugo et al. 1995). Common tree species in the palm brake forest include Daphnopsis philippiana and Calycogonium squamulosum in addition to the palm P. montana, a species that is found in all LEF elevation gradients (Barone et al. 2008).
Lugo et al. (1995) found that the species composition and species density of palm brakes varied with aspect. More species occur on leeward slops than windward slopes, presumably due to greater rainfall and soil saturation in the windward slopes. Long-term records of species density changes in these palm brakes also showed that after the 1932 hurricane and the initial enrichment of sites due to pioneer species, the number of species decreased over the next 40 years in the windward slopes, while in the leeward slopes species continued to accumulate. Apparently differences in the long-term patterns of soil saturation determined the number of tree species capable of surviving in these contrasting palm brakes. Lugo and Scatena (1995) observed that the length of successional sequences after disturbances were shorter above the cloud condensation level when compared to communities below the cloud condensation level (their fig. 4.8).
The most common trees based on stem density in the palm floodplain forest include Croton poecilanthus, Micropholis crysophylloides, and Eugenia eggersii, but the trees with the highest aboveground biomass are M. splendens and S. berteriana. In contrast to the adjacent palo colorado and elfin forest types, the most abundant bromeliad in the palm floodplain forest, Guzmania berteriana, is found more commonly along canopy tree trunks than on the forest floor, whereas Selaginella spp. and other bryophytes cover the ground at various distances from the river floodplain (Frangi and Lugo 1985). In a study relating P. montana fecundity to hurricane disturbance, Gregory and Sabat (1996) found that palms with more fronds in exposed areas produced more fruit than palms in less disturbed sites, and that hurricane effects on the canopy opening resulted in increased palm seed production. Therefore, one can conclude that palm forest areas subjected to hurricane effects will grow and reproduce more than those in undisturbed areas. The peak timing time for the palm fruit to fall in the palm floodplain forest occurs between May and June (Lugo and Frangi 1993), and fruit production of P. montana individuals in the palm
floodplain forest is an order of magnitude higher than that in the tabonuco forest (Bannister 1970, Lugo and Frangi 1993).
All vegetation above the cloud condensation level is classified as wetlands (Frangi 1983, Scatena 1993, Heartsill Scalley 2005). Many environmental gradients reach their extreme values at the mountain peaks (e.g., highest wind speeds, lowest air temperatures, lowest incoming sunlight, highest rainfall, lowest soil O
2 concentrations, etc.). The vegetation responds in
unique ways including unique vegetation structures, unique even between the forests of East Peak and West Peak (Howard 1968). Most notable is the woody vegetation of the elfin forest with an abundance of vascular flowering plants that adopt an epiphytic habit, particularly in the seedling and immature stages. At elevations above ~800 m, the elfin cloud forest is characterized by abundant stems of the tree fern Cyathea bryophylla, stunted individuals of the tree species Ocotea spathulata and Tabebuia rigida, and an abundance of epiphytes, of which the most striking and abundant is the small red bromeliad Werahuia sintenisii (fig. 71). This bromeliad is so common that it can be found in densities of up to 32,000 individuals per hectare (Lasso 2001) and contributes 12 percent of the net primary productivity of this forest type. It can also hold up to 3.3 tons of water per hectare and accumulate 25 percent of the phosphorus and K rainfall inputs (Richardson et al. 2000a).
Figure 71.—The most abundant epiphyte of the elfin cloud forest in the Luquillo Experimental Forest, the bromeliad Werahuia sintenisii. Photo by Alexis Molinares.

Luquillo Experimental Forest: Research History and Opportunities 71
The elfin cloud forest’s narrow ranges of temperature, precipitation, and cloud cover make this forest particularly vulnerable to changes in environmental factors, such as those changes proposed to occur as a result of global climate change. In particular, the epiphytic vegetation in the cloud forests may serve as indicators of climate change. For example, Lasso and Ackerman (2003 and 2004) observed an earlier flowering period for the elfin forest bromeliad W. sintenisii and showed that monthly mean minimum temperatures and monthly mean irradiance in the months leading up to flowering events explained 66 percent of the variation in the number of open flowers per month. It seems that W. sintenisii is responding to changes in the elfin cloud forests’ environment by timing its flowering correspond to the cues of the nocturnal minimum temperatures and to the changes in cloud cover as measured indirectly by increases in solar irradiance.
Another distinction of the cloud forests when compared with the lower elevation forest types is the abundance of epiphytes, including liverworts and mosses (Bryophyta). The LEF contains more than one-half of Puerto Rico’s moss flora (Sastre De Jesús and Tan 1995). One characteristic bryophyte is Sphagnum portoricense (fig. 72), whose presence has been identified as an indicator of the striking differences in ecosystem conditions existing between cloud forests and lower elevation tabonuco forests (Wadsworth 1951, Wadsworth and Bonnet 1951). With a very low tolerance for desiccation, S. portoricense is found next to open water in coastal areas, rivers, or wet banks throughout the rest of its geographical range (from the eastern coast of the United States to Venezuela). Throughout most of the LEF, S. portoricense is present as forest floor mats and surrounding the base of trees and shrubs where stem flow accumulates. However, it is also abundant next to disturbed roadsides and trails in saturated cloud forest soils. This species occasionally forms small bogs over exposed soil surfaces of uprooted trees or other small soil surface depressions (Karlin 2006). Within the LEF elfin cloud forests, Karlin (2006) describes the distribution of S. portoricense as “patchy”; it has been observed more commonly on the easternmost mountain summits (e.g., along the road to and at Pico del Este) while not observed along the trails to El Yunque and El Toro Peaks. The ecology of S. portoricense has not been studied extensively, however, and limited information is available regarding the threshold conditions that limit its distribution, growth, reproduction, survival, and roles in succession and competition in the forest types where it occurs. Also, very few notes exist on the distribution of S. portoricense before anthropogenic disturbances occurred in the cloud forests of the LEF; one hypothesis is that its present distribution may reflect its ability to colonize after disturbance.
Herbaceous and sphagnum bogs, riparian vegetation, and palm floodplain forests (Frangi 1983, Frangi and Lugo 1985, Lugo
et al. 1990) also occur above the cloud condensation level. The functioning of floodplain palm forests is discussed below in the nutrient cycling section. In environments with high light levels, one can observe herbaceous bog areas that include clumps of Carex polystachya, Eleocharis spp., large masses of Sphagnum, and other wetland vegetation (Howard 1968, Karlin 2006).
Although the LEF supports most of the moss flora found across the island of Puerto Rico, 19 percent of the moss species found in the LEF are endemic. It is estimated, however, that the cloud forests have lost many more moss species than the lowland and mid-elevation forests; one-half of the moss species originally observed in cloud forests have not been observed again since their initial reporting (Sastre De Jesús and Tan 1995, Sastre De Jesús and Santiago Valentín 1996). One hypothesis for the loss of species, such as Thamniopsis incurve, Bryoerythrophyllum recurvirostre, Squamidium isocladum, Cyrtohypnum minitulum, Schoenobryum concavifolium, and Breutelia scoparia, from the cloud forests is the loss of suitable habitat resulting from disturbances related to the establishment of a communications infrastructure and road construction in the elfin cloud forests (Sastre De Jesús and Tan 1995). Although the opening of canopy structure and a resulting loss of forest cover are considered to be the main factors leading to the decline of most moss species, the role of climate change, changes in air quality, and other factors associated with land use change and pollution may also contribute to the decline. One species, S. portoricense, seems to be able to occupy disturbed areas in the elfin cloud forest. The distribution, physiology, and ecology of bryophytes in the LEF remain to be further described and studied particularly in the elfin cloud forest.
Figure 72.—Sphagnum portoricense mat surrounding a terrestrial bromeliad in cloud forest near the summit of Pico del Este, Puerto Rico. Photo by E.F. Karlin, from Karlin (2006).

72 Luquillo Experimental Forest: Research History and Opportunities
Species of ConcernTree species found in the LEF that are listed as endangered include Ilex sintenisii (Sintenis’ holly), Styrax portoricensis (jazmin tree), Ternstroemia luquillensis (colorado), and Ternstroemia subsessilis (yunque colorado). All four species are endemic to Puerto Rico and exist only in the Luquillo Mountains (Santiago Valentín and Rivera 1993). In 2009, the U.S. Fish and Wildlife Service initiated a 5-year review of the state of these species to consider programs that propagate and re-introduce some of these species into their native ranges. Another endangered tree species, Callicarpa ampla (capá rosa), which previously had distribution in the U.S. Virgin Islands, is now restricted to the Luquillo Mountains. Other rare and threatened species of concern include the tree Pleodendron macranthum (chupacallos) and Lepanthes eltoroensis, the Luquillo Mountain babies’ boots orchid (fig. 73).
Figure 73.—Lepanthes eltoroensis, the Luquillo Mountain babies’ boots orchid. Photo by Raymond Tremblay.

Luquillo Experimental Forest: Research History and Opportunities 73
Of the approximately 1.5 million fungal species in the world, about 95 percent are undescribed (Hawksworth
1993). Therefore, the fungi of Puerto Rico and the Luquillo Experimental Forest (LEF) are relatively well known by comparison. In Puerto Rico, Stevenson (1975) found 27 percent of the 11,268 species of fungi reported for the Caribbean Basin (Minter et al. 2001). The highest numbers of fungal species in the Caribbean have been reported from Cuba and Puerto Rico, where many resident and visiting mycologists have conducted research. Lodge (1996a) compiled a checklist with 400 of the approximately 1,000 fungal species identified in the LEF. These were primarily higher basidiomycetes and large ascomycetes found at the El Verde Field Station. Lodge’s checklist represents about 30 percent of the total number of macromycetes, and 10 to 20 percent of those listed were new to science at the time the checklist was published. In a given field expedition to any site in the LEF, approximately 15 to 30 percent of the fungal species collected are new records or species. Table 22 summarizes the number of plant species (and endemics), the estimated number of fungal species based on fungi: plant ratios, and the number of known fungal species for various islands in the Caribbean Basin.
Some of the earliest records of fungi from the LEF were based on opportunistic collections of durable fruit bodies (such as polypores and shelf fungi and xylariaceous ascomycetes) by botanists such as Britton (Stevenson 1975, Lodge 1996b). The El Verde Research Area has been studied most intensively, with fungal surveys focused primarily on habitat partitioning (Lodge and Cantrell 1995, Lodge 1997). For example, Padgett (1976) found a low diversity of aquatic hyphomycetous fungi, within six-leaf litter species, submerged in a stream at El Verde, possibly due to fungal host specificity. The earliest fungal surveys at El Verde included a study by Cowley (1970), who showed that microfungal decomposer communities differed more among leaf species than among sites, but that canopy disturbance had the strongest effect in driving microbial community patterns. In addition, Holler and Cowley (1970) showed almost complete nonoverlap (i.e., high complementarity or species turnover) in
12. FungiS.A. Cantrell and D.J. Lodge
fungal species composition among decomposing leaf litter, soil, and roots, but they identified only a few of the microfungi to the species level.
The ecological studies by Cowley (1970) and Holler and Cowley (1970) were important, but were based primarily on morpho-species. The checklist of fungi at El Verde published by Lodge (1996a) was the first taxonomically based ecological survey in the LEF organized by substratum that revealed strong habitat partitioning. Huhndorf and collaborators surveyed ascomycetes occurring on large and small woody debris in the Luquillo Forest Dynamics Plot (Huhndorf and Lodge 1997; Huhndorf and Fernández 1998; Huhndorf et al. 1999, 2003, 2004, 2005; Fernández and Huhndorf 2005; Fernández et al. 2006), described new species and genera, and confirmed fungal habitat partitioning based primarily on substratum size (but rarely by host). Læssøe and Lodge (1994) demonstrated host specificity in three species of Xylaria at El Verde, and Lodge et al. (2008) used a meta-analysis of Xylaria records from the LEF and elsewhere to show specificity of some Neotropical species for cloud forest habitat. Schmit (2005) found a positive relationship between initial C (carbon) density and macrofungal diversity on large woody debris at El Verde. Samuels and his collaborators contributed to knowledge of hypocreaceous ascomycetes in the LEF–a group that includes plant, animal, and fungal parasites and also decomposers (Lu and Samuels 2003; Mantiri et al. 2001; Poldma et al. 1997; Samuels and Chaverri 2004; Samuels and Lodge 1996a, 1996b), while Liu and collaborators (Liu and Hodge 2005, Liu et al. 2006) described new species of clavicipitaceous parasites on scale insects. Surveys of microfungi included those by Lodge et al. (1996) who showed partitioning of endophytic fungi (fungi growing in plants without causing disease) among co-occurring tree species. Polishook et al. (1996) showed strong partitioning of leaf decomposer fungi among leaf species that occurred together on the forest floor (58 percent nonoverlap), confirming Cowley’s (1970) earlier work based on morphospecies. Furthermore, Lodge (1997) observed that decomposers rapidly replaced 95 percent of endophytic fungi
Island/regionNative seed plant
species (endemics)a
Estimated number offungal speciesb
Number of known fungal speciesc
Caribbean Region 12,000 (7,000) 60,000-72,000 11,268
West Indies 10,948 (7,868) 54,740-65,688 10,329
Cuba 5,991 (3,187) 29, 955-35, 946 5, 668
Hispaniola 4, 612 23, 060-27,672 2,468
Puerto Rico 2,221 (305) 11,105-13,326 3,315
Jamaica 2,540 (874) 12,700-15,240 322
Table 22. Floristic and fungal diversity in the Caribbean Basin.
a The number of endemic species is shown in parentheses. From Acevedo Rodríguez and Strong (2008).b Hawksworth (1993) used a 6:1 ration of plant to fungal species while Mueller et al. (2007) used a 5:1 ratio.c From Minter et al. (2001).
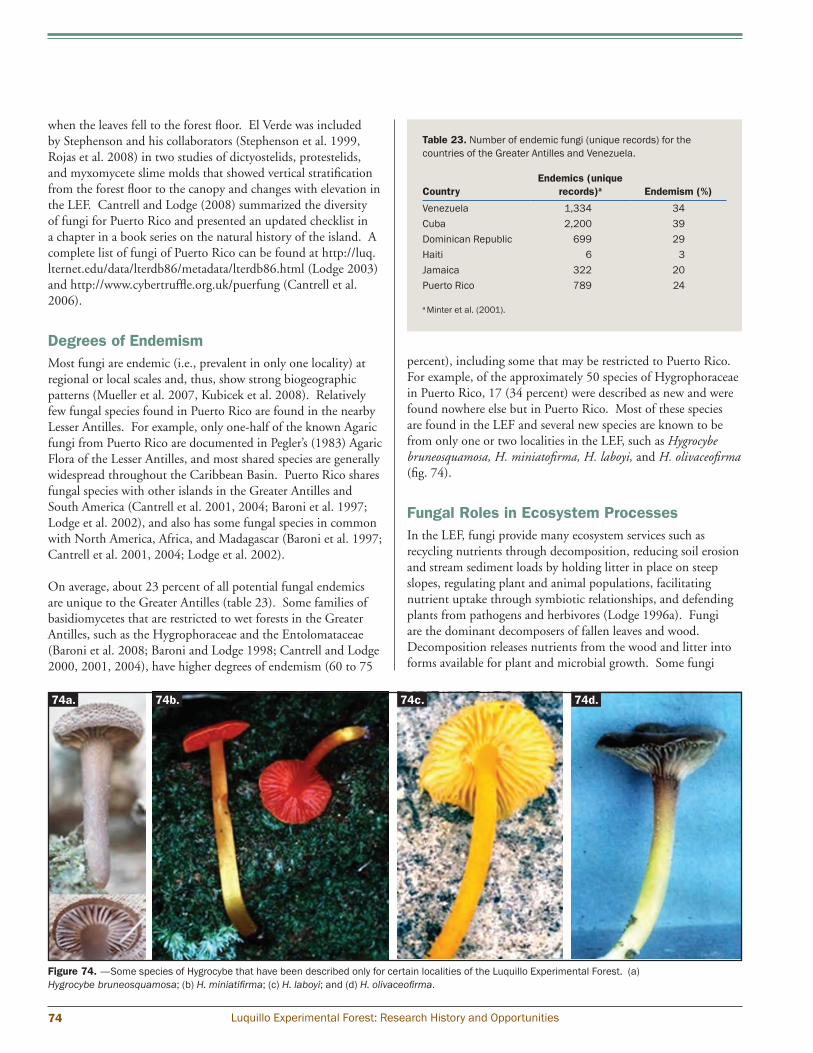
74 Luquillo Experimental Forest: Research History and Opportunities
when the leaves fell to the forest floor. El Verde was included by Stephenson and his collaborators (Stephenson et al. 1999, Rojas et al. 2008) in two studies of dictyostelids, protestelids, and myxomycete slime molds that showed vertical stratification from the forest floor to the canopy and changes with elevation in the LEF. Cantrell and Lodge (2008) summarized the diversity of fungi for Puerto Rico and presented an updated checklist in a chapter in a book series on the natural history of the island. A complete list of fungi of Puerto Rico can be found at http://luq.lternet.edu/data/lterdb86/metadata/lterdb86.html (Lodge 2003) and http://www.cybertruffle.org.uk/puerfung (Cantrell et al. 2006).
Degrees of EndemismMost fungi are endemic (i.e., prevalent in only one locality) at regional or local scales and, thus, show strong biogeographic patterns (Mueller et al. 2007, Kubicek et al. 2008). Relatively few fungal species found in Puerto Rico are found in the nearby Lesser Antilles. For example, only one-half of the known Agaric fungi from Puerto Rico are documented in Pegler’s (1983) Agaric Flora of the Lesser Antilles, and most shared species are generally widespread throughout the Caribbean Basin. Puerto Rico shares fungal species with other islands in the Greater Antilles and South America (Cantrell et al. 2001, 2004; Baroni et al. 1997; Lodge et al. 2002), and also has some fungal species in common with North America, Africa, and Madagascar (Baroni et al. 1997; Cantrell et al. 2001, 2004; Lodge et al. 2002).
On average, about 23 percent of all potential fungal endemics are unique to the Greater Antilles (table 23). Some families of basidiomycetes that are restricted to wet forests in the Greater Antilles, such as the Hygrophoraceae and the Entolomataceae (Baroni et al. 2008; Baroni and Lodge 1998; Cantrell and Lodge 2000, 2001, 2004), have higher degrees of endemism (60 to 75
percent), including some that may be restricted to Puerto Rico. For example, of the approximately 50 species of Hygrophoraceae in Puerto Rico, 17 (34 percent) were described as new and were found nowhere else but in Puerto Rico. Most of these species are found in the LEF and several new species are known to be from only one or two localities in the LEF, such as Hygrocybe bruneosquamosa, H. miniatofirma, H. laboyi, and H. olivaceofirma (fig. 74).
Fungal Roles in Ecosystem Processes In the LEF, fungi provide many ecosystem services such as recycling nutrients through decomposition, reducing soil erosion and stream sediment loads by holding litter in place on steep slopes, regulating plant and animal populations, facilitating nutrient uptake through symbiotic relationships, and defending plants from pathogens and herbivores (Lodge 1996a). Fungi are the dominant decomposers of fallen leaves and wood. Decomposition releases nutrients from the wood and litter into forms available for plant and microbial growth. Some fungi
Figure 74. —Some species of Hygrocybe that have been described only for certain localities of the Luquillo Experimental Forest. (a) Hygrocybe bruneosquamosa; (b) H. miniatifirma; (c) H. laboyi; and (d) H. olivaceofirma.
74a. 74b. 74c. 74d.
CountryEndemics (unique
records)a Endemism (%)
Venezuela 1,334 34 Cuba 2,200 39 Dominican Republic 699 29 Haiti 6 3 Jamaica 322 20 Puerto Rico 789 24
Table 23. Number of endemic fungi (unique records) for the countries of the Greater Antilles and Venezuela.
a Minter et al. (2001).

Luquillo Experimental Forest: Research History and Opportunities 75
form symbioses with algae or cyanobacteria to form lichens, many of which are important in nitrogen fixation in the LEF. Other types of fungi form symbiotic relationships with tree roots known as mycorrhizae. In the LEF, 98 percent of all the trees depend on mycorrhizal fungi for nutrient uptake from the soil (Lodge 1996a). Some leaf decomposer mushrooms are important because they bind the litter together; preventing litter and soil export from steep slopes during heavy rains (Lodge and Asbury 1998, Lodge et al. 2008). The percentage of ground covered by litter fungal mats generally increases with slope, indicating their importance in preventing erosive soil-nutrient loss on steep terrain in the LEF (fig. 75) (Lodge et al. 2008). The abundance of fungal litter mats (fig. 75) and the fatty acid fungal marker (18:2w6) (fig. 76) decrease with elevation, although not consistently; there is a strong dip at 600 meters above sea level at the lower boundary of the palo colorado forest type, which corresponds with the cloud base level and with abrupt changes in plant communities.
Fungal diversity in decomposing leaves in tabonuco forest at the LEF is high (Polishook et al. 1996). Microfungal species found in decomposing leaves recur on particular host plants and to decomposition state (Polishook et al. 1996, Lodge 1997, Santana et al. 2005). Patterns of host-exclusivity and host-recurrence among different leaf species might be explained by responses of decomposers to differences in physical structure, differences in nutrient and lignin concentrations, and different responses to the presence of secondary plant compounds among host plants. Santana et al. (2005) used a replicated complete factorial microcosm experiment to study the mass loss of 10 dominant early stage decomposer microfungi obtained from 5 leaf species (50 source-substratum combinations) and found
a highly significant interaction between microfungi and leaf species. Decomposition was faster when fungal source leaves were of the same species or family as the substratum, or when the fungal source resembled the substratum in quality than when the fungal source and substratum leaves were mismatched (i.e., unrelated and of dissimilar quality) (fig. 77). A basidiomycete contaminant was present in some microcosms and had a strong additive effect on decomposition of Croton poecilanthus leaves, increasing rates by 22 percent above that of microfungi alone (fig. 77). Agaric basidiomycetes produce enzymes that degrade lignin, thereby providing greater microbial access to labile C. Decomposition by agaric fungi accelerated the mass loss of leaf litter by 16.3 percent in the field at Sabana in the LEF (Lodge et al. 2008).
Effects of Disturbance on Fungi The effects of natural disturbances on leaf and soil fungi have been studied at El Verde Field Station by Cowley (1970), Lodge (1996a), Lodge and Cantrell (1995), and Stephenson et al. (1999). Lodge (1997) and Miller and Lodge (1997, 2007) reviewed the earlier studies of disturbance effects on decomposer fungi. Stephensen et al. (1999) found that diversity of protestelids, dictyostelids, and myxomycetes in the litter layer was highest at El Verde, in the most disturbed part of the LFDP, corresponding to areas with a higher functional diversity and to areas with an abundance of bacteria, which are their primary food source (Willig et al. 1996). One main environmental factor that negatively affects the diversity and abundance of fungi in wet tropical forests, such as the LEF, is desiccation (Lodge 1993, Lodge et al. 1994, Lodge and Cantrell 1995). After the passage of Hurricane Hugo at El Verde in the LEF, some species of
Figure 75.—Percent of land area covered by decomposer basidiomycete litter mats as a function of slope (percent) and elevation class in the Luquillo Experimental Forest. Elevation classes: 1- 150 to 300 meters (m); 2-301 to 450 m; 3- 451 to 600 m; 4-601 to 750 m; 5-751 to 1,000 m. Slope classes: 1-0 to 10 percent; 2-11 to 20 percent; 3-21 to 30 percent; 4-31 to 40 percent; 5- 41 to 50 percent. From Lodge et al. (2008).
Figure 76.—Concentration (Mol percent) of the fungal fatty acid marker (18:2w6) along an elevation gradient and across different forest types. From García Orta (unpublished data).

76 Luquillo Experimental Forest: Research History and Opportunities
agaric leaf decomposer fungi completely disappeared from sites on ridges that were exposed to greater sun and wind, including Collybia johnstonii (Lodge and Cantrell 1995). Data on changes in fungal biovolumes and nutrient stores in response to hurricane disturbance and drying in the LEF were used to illustrate fungal importance in controlling nutrient availability to trees in wet tropical forests through pulsed nutrient dynamics (Lodge et al. 1994, Miller and Lodge 1997). An ongoing simulation of the effects of canopy opening and the subsequent addition of
Figure 79.—Concentration of the fungal fatty acid marker (18:2w6) in soil before and after canopy opening and debris addition (T = Canopy Trim, NT = No Trim, D = Debris added). From Rivera Figueroa (2008).
Figure 78.—Diversity of fungi based on ITS TRFLP phylotypes in (a) decomposing green leaves and (b) decomposing senesced leaves in relation to canopy opening and debris addition (T = Canopy Trim, NT = No Trim, D = Debris added). From Ortiz Hernández (2008).
78a.
78b.
Figure 77.—Percent mass remaining of two leaf species decomposed by microfungi in microcosms when the fungal source (plant and substratum) were matched by leaf quality and phylogenetic relatedness. Open bars represent a basidiomycete contaminant that appeared after gamma radiation in addition to microfungi. From Santana et al. (2005).
debris monitors how such disturbances affect the biota. Ortiz Hernández (2008) demonstrated that canopy opening decreased the diversity of fungi in green and senesced leaves while debris addition increased the diversity (fig. 78a). The diversity of fungi declined as the canopy closed and decomposition progressed (fig. 78b). Canopy opening had a delayed effect on the abundance of the fatty acid fungal marker (18:2w6) in soil, which declined a few months after canopy was trimmed (Rivera Figueroa 2008, fig. 79).

Luquillo Experimental Forest: Research History and Opportunities 77
Early studies on fauna in the Luquillo Experimental Forest (LEF) represented an effort to understand the population
and community dynamics of animals in the forest and understand their importance to forest function. More recent research on faunal communities has focused heavily on the effect of disturbance. Reagan and Waide (1996) summarized the natural history and trophic dynamics of the tropical rain forest community at El Verde; much of the information summarized below is taken from this source.
Terrestrial FaunaTermitesThe chief role of termites in the LEF is the consumption of dead wood and litter, which recycles organic matter through the decomposer community. Compared with other tropical ecosystems, however, the LEF has few termite species, relatively low termite densities, and no termite species that feed primarily on soil and fungus gardens, suggesting that termites play a less dominant role in the LEF ecosystem than in many other tropical forests. Only four species of termites (Order Isoptera) have been reported from the tabonuco forest of the LEF: Nasutitermes costalis (Holmgren), N. nigriceps (Haldeman), Parvitermes discolor (Banks), and Glyptotermes pubescens (Snyder). These four species represent about one-third of the termite species reported from Puerto Rico. Wiegert (1970) carried out one of the first studies of wet forest termite population dynamics on N. costalis in the El Verde tabonuco forest. Most research on termites in the LEF has concentrated on this species.
All the El Verde termites appear to seek out relatively firm, standing dead wood as food, although they may also consume twigs and leaf litter on the forest floor. None of the four species is known to consume living wood. Two of the four species (N. costalis and N. nigriceps) build carton nests (the dark, ovoid nests that dot the landscape at El Verde), P. discolor excavates stumps for its nests, and G. pubescens is a drywood species that lives in chambers and tunnels within the sound wood on which it feeds.
Wiegert (1970) made the only quantitative evaluation so far of the role of N. costalis in the total decomposer energy budget of the tabonuco forest. He estimated total numbers of the various termite castes and the number of developmental stages from harvested nests, obtained dry weights for the various castes, measured oxygen consumption of individual termites and carbon dioxide (CO
2) production of entire nests, and
determined calorific content per gram of each caste and stage. He also measured the calorific content and ash percentage of the C (carbon) material from termite nests. From these data, Wiegert estimated a total energy flow of 20.5 to 24.5 kJ m-2 y-1 (kilojoules per meter squared per year) which represents such a small fraction of the total energy flow into the detritus-decomposer food chain that N. costalis may not be of much importance in the total decomposer energy budget of the LEF.
13. FaunaN.L. Harris
Of course, this study did not include the other three termite species, and together their effect probably exceeds that of N. costalis, but even when biomass figures for N. costalis, P. discolor and N. nigriceps are added (table 24), the biomass value becomes 1.01 g m-2 (gram per meter squared) wet weight or about 0.22 g m-2 dry weight. Even if G. pubescens data were available, the biomass figure for the termites of El Verde would still represent a relatively low energy flow. A significant route of energy return from termite colony to ecosystem is via predation. As food for predators, termites probably make their greatest contribution during the swarming season, when alates may provide a large part of the diet of arthropods, lizards, bats, and possibly frogs.
InsectsInsect herbivores are a prevalent component of forest ecosystems and a key factor in regulating canopy processes (Schowalter et al. 1986, Huntly 1991, Rinker et al. 2001) due to their high level of mobility and rapid rate of reproduction that enable them to respond quickly to alterations in their environment and exploit emerging resources. Selective feeding by insect herbivores exerts a strong influence on several forest ecosystem properties (Schowalter 2000). In addition to the well-documented and conspicuous effects they can have on plant growth and survival, herbivores can substantially alter plant species composition (Ritchie et al. 1998) and the flow of nutrients within forest systems (Schowalter et al. 1991, Hunter 2001).
Despite the important role insect herbivores play in ecosystem processes, very little is known about their true number and diversity. Several new species have been discovered in the LEF in recent years, including Omicrus ingens, a hydrophilid beetle (Hansen and Richardson 1998) and Tanytarsus bromelicola, a chironomid with tube-constructing larvae (Cranston 2007). A potential new psychodid species endemic to Puerto Rico—Alepia zavortinki spec. nov.—was reported by Wagner et al. (2008) after sampling bromeliad plants in an ongoing study recording the diversity of their invertebrate fauna at different elevations in the LEF.
Herbivorous insects modify nutrient flows directly by altering the timing, quantity, and quality of canopy inputs to the forest floor. Herbivore-derived inputs are commonly in the form of insect feces (frass), green leaf fragments (greenfall), and modified
Species Density (individuals m-2)
Biomass (g m-2)
Nasutitermes costalis 75 0.24
Parvitermes discolor 374 0.71
Nasutitermes nigriceps 9.4 0.06
Total 458.4 1.01
Table 24. Density and biomass (wet weight) for termites in El Verde.

78 Luquillo Experimental Forest: Research History and Opportunities
throughfall, all of which form a chemically distinct component of canopy inputs to the forest floor. These herbivore-induced alterations generally increase the availability, and often the quantity, of nutrients that fall on the forest floor and could further modify ecosystem nutrient flow by altering patterns of nutrient input to the soil subsystem. After Willig et al. (1993) demonstrated that walking sticks (Lamponius portoricensis (Phasmatidea)) occur on the prevalent understory plant Piper treleaseanum almost twice as often as expected, based on plant “apparency” values (i.e., the number of times a leaf of a given plant species in a particular site is hit by a string at any height along measured transects), Fonte and Schowalter (2005) manipulated herbivory levels in the LEF using walking sticks on Piper glabrescens and measured the effects on nutrient input to the forest floor and rates of litter decomposition. A significant positive relationship was found between all measures of herbivory and the concentration of NO
3- (nitrate ion) in ion exchange resin
bags located in the litter layer. Rates of litter decomposition were significantly affected by frass-related herbivore inputs. This study demonstrated a modest but direct relationship between herbivory and both litter decomposition and NO
3- transfer to
the forest floor, with results that suggest insect herbivores can influence forest floor nutrient dynamics.
Richardson and Hull (2000) studied insect larval communities in Heliconia caribaea (fig. 80) and found that, although the composition, relative abundance, and populations of species were consistent from year to year, most species were specific to Heliconia and different species utilized different bracts (i.e., modified leaves), with populations peaking at different stages of bract development. Ceratopogonid larvae were the earliest colonizers, followed by psychodids, syrphids, and culicids. Tipulid larvae appeared much later in the cycle of bract development and aging.
Recent research in the LEF has focused on changes in forest processes over the elevation gradient. Richardson et al. (2000a and 2005) shed light on the trends in litter invertebrate communities with elevation and showed that mineral concentrations in litter are significantly lower at higher elevations, with invertebrate abundance and species richness mirroring this pattern, showing populations declined significantly in mid- and high-elevation forests. Elfin forest bromeliads contained the lowest amount of debris and the lowest concentrations of nutrients in plant tissues. Richardson et al. (2000a) report a mid-elevational peak in species richness while abundance showed no apparent pattern with elevation, but after sierra palm (P. montana), which occurs along the extent of the elevation gradient, was used as a control in Richardson et al. (2005), neither insect abundance nor species richness changed significantly over the gradient. Richardson et al. (2005) suggest that the differences in abundance, species richness, and the uniformity of insect communities observed from the lower slopes to the summits are better explained by the contribution of forest composition to the chemical and physical nature of litter and forest heterogeneity, rather than to direct effects of temperature and rainfall differences.
Earthworms and Soil FaunaMany organisms spend all or part of their lives in the soil, with earthworms being one conspicuous group of soil dwellers that are often viewed as the most important animals influencing soil ecosystem functioning (Hendrix and Bohlen 2002). In the tabonuco forest of the LEF, earthworms dominate the soil food web in terms of biomass (Moore and Burns 1970), and their density and community structure is affected by land use changes (González et al. 1999, Zou and González 1997).
Earthworms are generally classified into endogeic, anecic, and epigeic species to represent soil, soil and litter, and litter feeders, respectively (Bouché 1977). Earthworms alter a soil’s physical properties and biogeochemical processes according to their functionality. Endogeic (soil feeding) earthworms (e.g., Pontoscolex corethrurus Müller) alter a soil’s properties primarily through changing soil physical and chemical properties, and epigeic (litter feeding) earthworms affect microbial inoculation and associated decomposition processes. Anecic (soil and litter feeding) earthworms (e.g., native species Estherella gatesi Borges and Moreno and exotic species Amynthas rodericensis Grube) influence soils through both burrowing and inoculation activities (González et al. 2006).
Earthworms, through their burrowing activities, may alter soil structure and water infiltration rates and thus affect the environmental conditions for microbial growth and biogeochemical fluxes (González et al. 2006). Earthworms also act as inoculators of soil microbes for the freshly fallen plant materials, and consequently accelerate the decomposition of plant materials (fig. 81, Liu and Zou 2002, Dechaine et al.
Figure 80.—Heliconia plants are a common sight in the Luquillo Experimental Forest and support diverse invertebrate communities. Heliconia caribaea is shown here. Photo by Jerry Bauer.

Luquillo Experimental Forest: Research History and Opportunities 79
2005, Ruan et al. 2005). In addition to direct consumption, earthworms accelerate plant litter decomposition through elevating soil microbial activity and possibly enhancing the inoculation of soil microbes in worm casts to the fresh plant leaf materials (Liu and Zou 2002). This acceleration of organic matter mineralization provides a reliable flow of nutrients for continuous growth and maintenance of ecosystem production.
Previous research on earthworms in the Luquillo Mountains was centered in the tabonuco forest. Recently, González et al. (2007) expanded this research to include three other forest types within the LEF and four at lower elevations in northeastern Puerto Rico; sites were situated along an elevation gradient that spanned more than 1,000 meters (m). The study quantified both native and nonnative earthworm abundance and species diversity and found significant differences in the mean total density and biomass of earthworms among forest types. The Pterocarpus forest had the highest density of total earthworms (1,024 worms m-2), and the mangrove forest the lowest (2.7 worms m-2) (fig. 82a). In terms of biomass, the elfin forest and the Pterocarpus forest had the highest (168.2 and 180.6 g m-2, respectively) and the dry and mangrove forests had the lowest (<1.2 g m-2). The palm, palo colorado, tabonuco, and lowland moist forests had values of earthworm biomass ranging from 27.8 to 49.4 g m-2. A total of 14 species belonging to 6 families were sampled along the elevation gradient. The elfin forest had the highest total number of earthworm species found at a given forest type (12 species); the second highest was the palo colorado forest with 6 earthworm species (fig. 82b). Earthworm biomass, density, and species numbers were consistently higher in the upper soil horizons than in the lower soil horizons.
In addition to changes in earthworm populations with elevation, Zou and González (1997) also demonstrated changes in earthworm density and community structure during secondary succession in abandoned tropical pastures. The chronological sequence of plant communities was pasture, grass-vine-fern, shrub-small tree, and forest. Earthworm density was highest in the active pasture (831 worms m-2 in top 0.25 m soil), decreased as secondary succession proceeded, and reached the lowest (32 worms m-2) in the forest (table 25). Furthermore, worm biomass measured in the pasture was nine times higher than worm biomass in the mature forest. Whereas P. corethrurus (nonnative) was the only worm species present in the pasture and grass-vine-fern communities, both anecic species A. rodericensis and E. gatesi were also present in the shrub-small tree and forest communities (table 25). Zou and González (1997) suggest that the decrease in earthworm density and increase in worm
Figure 81.—Correlation between the natural logarithm (ln) values of earthworm abundance and rates of plant litter decomposition. From Dechaine et al. (2005).
Figure 82.—(a) Mean total density (per square meter ± S.E.; n = 9) of earthworms and (b) mean number of earthworm species in upper (0 to 10 cm) soil depths and lower (11 to 30 cm) soil depths in eight forest types along an elevation gradient in northeastern Puerto Rico. Asterisks indicate a significant effect of soil depth within a forest type (one-way Analysis of Variance; α = 0.05). From González et al. (2007).
82a.
82b.

80 Luquillo Experimental Forest: Research History and Opportunities
community diversity during secondary succession may result from changes in the chemistry of organic inputs rather than in soil properties and litter quantity. For example, González et al. (1999) found that soil water content, which ranged from 40 to more than 100 percent, had no influence on earthworm communities and P. corethrurus densities in wet (tabonuco) forests. With the conversion of pastures to secondary forests, the richness of earthworm species increases due to the presence of native species (Zou and González 1997), yet the nonnative earthworms still dominate in terms of biomass and density (Zou and González 1997, Sánchez de Leon et al. 2003); González et al. (1996) found that P. corethrurus dominated both plantations and secondary forests but native earthworms occurred only in secondary forests.
Yang et al. (2007) investigated effects of nutrient addition through fertilization (applied quarterly since 1989) on litter arthropods and earthworm populations in the tabonuco and elfin cloud forests in the LEF. Fertilization significantly increased monthly litterfall production and litter quality, and this higher litter production led to significant litter accumulation on the forest floor. Litter arthropod abundance increased in the wet forest fertilized plots due to the accumulated litter, but higher quality of litter did not affect litter arthropod density in either forest. A significant reduction in earthworm populations in fertilized plots may have offset the positive effect of litter quality on litter turnover in the wet forest. The Shannon biodiversity index for litter arthropod taxa was similar among treatments in the wet forest, and was higher in the wet forest than cloud forest. Litter arthropod abundance and dominance in both forest types are shown in table 26.
SnailsIn terrestrial ecosystems, land mollusks such as snails rank second in species richness; only arthropods have more species (Russell Hunter 1983). The terrestrial snail fauna of the tabonuco forest include 34 species (Álvarez 1991, Garrison and Willig 1996), the most abundant being Caracolus caracolla. Álvarez (1991) and Álvarez and Willig (1993) identified seven species of snails at El Verde that were not previously recorded for the tabonuco
forest: Lamellaxis micra, Opeas pumilum, Nesovitrea subhyalina, Guppya gundlachi, Habroconus ernsti, Striatura meridionalis, and Chondropoma riisei. These taxa may have been absent from earlier inventories at El Verde due to their small size (diameter or length less than 5 millimeters (mm)) and due to their soil or litter microhabitat associations during the day (Garrison and Willig 1996). Table 27 (Willig et al. 1998) shows a list of terrestrial snail species captured in the LEF from 1990 to 1995 after the passage of Hurricane Hugo. Snail activity in the LEF is primarily nocturnal or associated with high relative humidity during rain showers.
Recent research on terrestrial snails in the LEF has evaluated the response of snail populations and communities to disturbances from treefall gaps (Álvarez 1991, Álvarez and Willig 1993) and hurricanes (Willig and Camilo 1991, Secrest et al. 1996). Willig et al. (1998) report data from the long-term (1990 to 1995) monitoring of snail populations after the passage of Hurricane Hugo at the 16-hectares (ha) grid (Hurricane Recovery Plot) at El Verde and a 13-ha plot at the Bisley Experimental Watersheds. Two species of snails sampled at Bisley, C. caracolla and N. tridens, suffered significant reductions in density in the aftermath of Hurricane Hugo, to the point that no specimens of N. tridens were detected in posthurricane surveys (Willig and Camilo 1991) but increased to densities three- and six-fold higher than prehurricane estimates (fig. 83). Willig et al. (1998) also showed that historical land use at El Verde had no significant effect on the abundance of most snail species. Trends in population density of each snail species at the El Verde Hurricane Recovery Plot are shown in figures 84 and 85. Bloch and Willig (2006) extended this data set and report population density trends for seven gastropods from 1991 to 2004 (fig. 86).
Puerto Rico has a low diversity of freshwater snails (van der Schalie 1948) that have not been studied extensively. Pyron and Covich (2003) measured snail-size frequency distributions in Ríos Espíritu Santo and Mameyes and showed that Neritina punctulata has similar migration and life history patterns to other tropical coastal streams, with snails migrating upstream at a rate of 0.08 to 0.17 cm s-1 (centimeters per second). Snails with
Successionalcommunity Density (no. m-2)
Biomass (g m-2)
Soil H2O% Soil pHGround litter
(g m-2)Total % Anecic worm
Pasture 831 a 175 a 0 a 73 a 4.8 a 14 a
Grass-vine-fern 403 a 110 ab 0 a 83 a 5.1 a 26 a
Shrub-small tree 141 b 41 ab 15 ab 61 b 4.7 a 524 b
Forest 32 b 19 b 52 b 70 ab 5.0 a 335 b
Table 25. Changes in earthworm density, biomass, soil pH and water content, and ground litter biomass during secondary succession in abandoned tropical pastures in Puerto Rico. Common letters within a column indicate no significant difference (Scheffe’s multi-range test, α = 0.10) between successional communities. From Zou and González (1997).

Luquillo Experimental Forest: Research History and Opportunities 81
Lowland wet forest Cloud forest
Abundance (individuals m-2) % Abundance (individuals m-2) %
Fertilization Control Fertilization Control Fertilization Control Fertilization Control
Mean SE Mean SE Mean SE Mean SE
Acari 7504.381A 2848.52 4031.619B 667.58 63.79 64.33 2496.91A 709.84 2496.00A 928.30 78.68 86.31
Collembola 1055.248A 324.11 723.429A 342.99 8.97 11.54 263.314A 67.94 123.657B 61.75 8.30 4.28
Ants (Hymenoptera) 1299.429A 361.55 427.429B 80.51 11.04 6.82 159.77A 122.80 132.57A 129.02 5.03 4.58
Homoptera 495.238A 506.52 173.714A 38.80 4.21 2.77 1.37A 1.68 8.00A 12.07 0.04 0.28
Isoptera 79.62A 96.89 171.810A 197.10 0.68 2.74 – – – – – 0.–
Pseudoscorpiones 169.524A 116.79 120.000A 103.10 1.44 1.91 4.11A 6.65 10.971B 7.39 0.13 0.38
Aranene 155.810A 51.87 118.857A 54.70 1.32 1.90 10.286A 6.00 4.342B 4.30 0.32 1.15
Diptera 199.238A 68.22 92.19A 54.89 1.69 1.47 108.8A 48.45 32.914B 14.80 3.43 1.14
Coleoptera (adult) 219.048A 98.31 89.905B 19.93 1.86 1.43 48.91A 21.70 41.14A 19.50 1.54 0.42
Diplopoda 134.476A 59.36 52.571B 17.80 1.14 0.84 14.63A 7.76 8.00A 7.48 0.46 0.28
Coleoptera (larvae) 94.095A 11.05 49.905B 16.73 0.80 0.80 10.971A 5.63 1.143B 0.72 0.35 0.04
Hemiptera 104.762A 59.12 40.762B 23.18 0.89 0.65 16.229A 6.32 7.314B 4.00 0.51 0.25
Isopoda 58.667A 37.14 38.476A 13.66 0.50 0.61 16.91A 7.76 14.17A 2.85 0.53 0.49
Psocoptera 27.81A 14.13 37.333A 33.78 0.24 0.60 14.17A 16.46 8.23A 7.24 0.45 0.28
Thysanoptera 40.381A 26.17 30.095A 25.34 0.34 0.48 0.23A 0.46 0.91A 1.83 0.01 0.03
Blattodea 25.905A 7.83 12.952B 10.28 0.22 0.21 – – – – – –
Opiliones 14.476A 2.35 9.524A 7.94 0.12 0.15 1.60A 2.12 1.37A 2.22 0.05 0.05
Lepidoptera 20.952A 15.08 8.381A 8.67 0.18 0.13 0.23 0.46 – – 0.01 –
Trichoptera 9.143A 1.87 8.000A 5.20 0.08 0.13 0.23 0.46 – – 0.01 –
Symphyia 13.333A 7.00 8.000A 6.12 0.11 0.13 – – – – – –
Protura 6.48A 5.93 6.476A 6.75 0.06 0.10 – – – – – 0.02
Chilopoda 5.714A 2.80 4.952A 2.69 0.05 0.08 2.514A 1.83 0.457B 0.56 0.08 0.02
Diplura 28.95A 14.65 3.429B 0.93 0.25 0.05 0.46A 0.91 0.23A 0.46 0.01 0.01
Neuroptera 1.524A 1.43 1.905A 1.94 0.01 0.03 – – – – – –
Orthoptera – – 0.762 1.08 – 0.01 1.37A 1.68 0.46A 0.91 0.04 0.02
Demaptera 0.38 0.54 – – – – – – – – – –
Microcoryphia 0.381A 0.54 – – – – – – – – – –
Total 11,746.95A 4209.82 6267.05B 1015.59 3173.49A 752.20 2891.89A 1019.52
Diversity index 1.36A 0.05 1.33A 0.08 0.87A 0.06 0.63B 0.04
Table 26. Litter arthropod abundance and dominance (%) in control and fertilization treatments in lowland wet and cloud forests in the Luquillo Experimental Forest. From Yang et al. (2007).
Different upper case letters indicate statistical significance between treatments (repeated measures Analysis of Variance).

82 Luquillo Experimental Forest: Research History and Opportunities
Alcadia alta Nenia tridens
Alcadia striata Obeliscus terebrasier
Austroselenites alticola Oleacina glabra
Caracolus caracolla Oleacina playa
Caracolus marginella Platysuccinea portorricensis
Cepolis squamosa Polydones acutangula
Gaeotis nigrolineata Sublina octana
Megatomastoma croceum Vaginulus occidentalis
Table 27. List of snails captured in the Luquillo Experimental Forest (El Verde and Bisley watersheds) from 1990 to 1995. From Willig et al. (1998).
Figure 83.—Temporal sequence (numbers on x-axis refer to years, letters refer to seasons; W = wet, D = dry) of density estimates (mean ± SE) for common snails (Caracolus caracolla, shaded bars; Nenia tridens, unshaded bars) on the 13-hectare grid at the Bisley site of the Luquillo Experimental Forest. From Willig et al. (1998).
Figure 84.—Temporal trend of density estimates (mean ± SE) for nine common snails at the El Verde Hurricane Recovery Plot in the Luquillo Experimental Forest from 1990 to 1995. Numbers on the x-axis refer to years, letters refer to seasons: W = wet, D = dry. From Willig et al. (1998).

Luquillo Experimental Forest: Research History and Opportunities 83
Figure 85.—Temporal trend of density estimates (mean ± SE) for seven less common snails at the El Verde Hurricane Recovery Plot in the Luquillo Experimental Forest from 1990 to 1995. Numbers on the x-axis refer to years, letters refer to seasons: W = wet, D = dry. From Willig et al. (1998).
Alcadia alta Caracolus marginella
Obeliscus terebraster
Sublina octana
Megalomastoma croceum
Platysuccinea portoricensis
Vaginulus occidentalis
Den
sity
(pe
r hec
tare
)D
ensi
ty (
per h
ecta
re)
Den
sity
(pe
r hec
tare
)D
ensi
ty (
per h
ecta
re)
Den
sity
(pe
r hec
tare
)
Den
sity
(pe
r hec
tare
)
Den
sity
(pe
r hec
tare
)
91W 92D 92W 93D 93W 94D 94W 95DSeason
91W 92D 92W 93D 93W 94D 94W 95DSeason
91W 92D 92W 93D 93W 94D 94W 95DSeason
91W 92D 92W 93D 93W 94D 94W 95DSeason
91W 92D 92W 93D 93W 94D 94W 95DSeason
91W 92D 92W 93D 93W 94D 94W 95DSeason
91W 92D 92W 93D 93W 94D 94W 95DSeason
80
60
40
20
0
30
20
10
0
30
25
20
15
10
5
0
100
80
60
40
20
0
200
160
120
80
40
0
150
120
90
60
30
0
120
90
60
30
0

84 Luquillo Experimental Forest: Research History and Opportunities
Figure 86.—Terrestrial gastropod population densities through time in the Luquillo Experimental Forest. From Bloch and Willig (2006).

Luquillo Experimental Forest: Research History and Opportunities 85
shell lengths greater than 30 mm were the most abundant size class at upstream sites, while snails with shorter shells were more abundant at downstream sites (fig. 87). Smaller individuals also grow at approximately twice the rate of larger individuals, with growth rates of 0.015 mm day-1 (millimeters per day) for a large cohort (~25 mm shell length) and 0.035 mm day-1 for a small (~15 mm shell length). These growth data suggest a minimum longevity between 3 and 7 years.
Blanco and Scatena (2006, 2007) studied another dominant diadromous snail, Neritina virginea. The density of this snail species increases with water depth (fig. 88), and no populations of N. virginea were found in rivers that were disconnected from the ocean for most of the year. Likely reasons for the absence of
N. virginea in these rivers include channel dewatering, formation of sediment bars at their mouths, and low mean monthly discharge.
CoquisEleutherodactylus coqui is the most widespread and abundant of the frog species of Puerto Rico (Rivero 1978, Stewart and Woolbright 1996, Beard et al. 2003), and its mating call is the most distinct sound heard in the forest at night. The coqui develops directly from terrestrial deposition of eggs without an aquatic tadpole stage (Townsend and Stewart 1985), so this frog can develop independent of bodies of water. Stewart and Pough (1983) increased the population density of coquis in study plots by supplementing retreats with artificial “frog houses” that protect frogs from predators, and results suggest that the primary factor limiting population density is not related to predation, but to the availability of suitable retreat and nest sites. Woolbright (1996) also reported substantial increases of E. coqui populations associated with increases in retreat and nest sites created by the debris from fallen trees in the wake of Hugo. Although Woolbright et al. (2006) reported census results for the LEF at 1,846 frogs ha-1 (per hectare) with a male to female sex ratio of 2.5 for a 4-plot sample in 2002 (table 28), the density of the Puerto Rican population of coquis has been estimated over the long term using the sum of estimated population numbers for adult and juvenile frogs, which yielded a figure of 20,570 frogs ha-1 (Stewart and Woolbright 1996).
Beard et al. (2002) recorded large, observable, and significant effects of E. coqui on nutrient concentrations and fluxes in the LEF, presumed to result from the conversion of insects into nutrient forms that are more readily available for microbes and plants. In a manipulative experiment, coquis at natural densities were contained or excluded from 1 m3 enclosures for 4 months, and the chemistry of leaf wash (throughfall), foliage, and decomposed leaf litter in the enclosures was measured as indicators of coqui effects on nutrient cycling. Coqui exclusion decreased elemental concentrations in leaf washes by 83 percent for dissolved organic C, 71 percent for NH
4+ (ammonium) 33
Indicator Value
Total adults marked over 4 nights 42.3 ± 4.9
Jolly-Seber estimate of adult abundance (frogs ha-1)
1846 ± 323
Sex ratio male/female 2.5 ± 0.5
Maximum juvenile count over 4 nights 136.3 ± 58.0
Ratio daily juvenile count to adult count 9.2 ± 1.9
Table 28. The 2002 census results for adult and juvenile Eleutherodactylus coqui (mean ± SE) in 20 x 20 m study plots in the Luquillo Experimental Forest. N = 4 plots. From Woolbright et al. (2006).
Figure 87.—Regressions of mean snail size against distance from the ocean for the sites of Ríos Mameyes and Espíritu Santo in the Luquillo Experimental Forest. Equations are Y = 5.89 + 2.04X (R2 = 0.92) and Y = -13.9 + 3.24X (R2 = 0.98), respectively. Elevations are listed next to each site. From Pyron and Covich (2003).
Mea
n S
ize
(mm
)
Distance from ocean (km)
Figure 88.—Variation in Neritina virginea density relative to water depth in two pool types in the Luquillo Experimental Forest. From Blanco and Scatena (2006).
Sna
il de
nsity
(in
d./m
2 )
Water depth (cm)

86 Luquillo Experimental Forest: Research History and Opportunities
percent for NO3
-, 60 percent for dissolved organic N (nitrogen) and between 60 and 100 percent for Ca (calcium), Fe (iron), Mg (magnesium), Mn (manganese), P (phosphorous), K (potassium), and Zn (table 29). Although coqui exclusion also had no effect on foliar chemistry of plants transplanted into the enclosures, exclusion decreased nutrient availability in decomposing mixed leaf litter by 12 percent and 14 percent for K and P, respectively, and increased C:N ratios by 13 percent. A model of nutrient cycling in coqui populations in the LEF is displayed in figure 89. In a later study, Beard et al. (2003) also showed that E. coqui populations reduce populations of aerial invertebrates and reduce leaf herbivory rates and increase foliage production and decomposition rates, most likely through elimination and excretion of nutrients rather than through controlling herbivorous prey.
Anoline LizardsThe lizard genus Anolis is a common and conspicuous component of the fauna of all terrestrial environments found in the Caribbean islands. The Anolis genus comprises approximately 300 species and is among the largest vertebrate genera. Rand (1964) first described the patterns of distribution in Puerto Rican anoles and explained differences based on variations in structural habitat (perch height and perch diameter) and climatic habitat (exposure to the sun). Reagan
Element
Piper Manilkara
Coquís No Coquís Effect Coquís No coquís Effect
DOC 12.62±7.55 1.52±0.34 -88% 6.02±3.23 1.35±0.34 -78%
DON 0.61±0.90 0.35±0.16* -43% 1.50±0.47 0.34±0.09* -77%
NH4+ 1.50±0.47 0.34±0.09* -75% 0.58±0.23 0.19±0.09* -67%
NO3- 0.17±0.11 0.04±0.01 -76% 0.09±0.03 0.10±0.08 +11%
Al 0.017±0.01 0.014±0.00 -18% 0.017±0.00 0.021±0.01 +24%
Ca 1.87±0.77 0.70±0.14* -63% 0.78±0.34 0.33±0.03* -58%
Fe 0.28±0.27 0.010±0.00* -96% 0.14±0.13 0.02±0.01 -88%
Mg 0.20±0.08 0.086±0.02* -58% 0.078±0.02 0.04±0.01* -49%
Mn 0.12±0.11 0.003±0.00* -97% 0.055±0.05 0.005±0.00* -90%
P 8.62±8.52 0.55±0.54* -94% 0.98±0.67 0.065±0.03* -93%
K 22.22±21.67 0.34±0.06* -98% 10.38±10.13 0.89±0.74* -91%
Zn 0.12±0.12 0.00±0.00 -100% 0.052±0.05 0.00±0.00 -100%
Table 29. Mean elemental concentrations in mg L-1 (± SE) in leaf washes collected biweekly from June to October 1999 in enclosures with coquis at post-disturbance densities and without coquis in the Bisley watersheds in the Luquillo Experimental Forest. Effect was determined as the percent change in concentrations in leaf washes collected as a result of coqui exclusion and was calculated as the percent in the variable: (without coquis – with coquis) / (with coquis); DOC = dissolved organic carbon and DON = dissolved organic nitrogen. From Beard et al. (2002).
* There were significant differences when making comparisons by element between treatments for that plant species using a t = test at p=0.05.
Figure 89.— Model of nutrients cycling in coqui populations at average densities in the Luquillo Experimental Forest. Values for ingestion, egestion, and biomass are independent estimates. Coqui respiration and production are dependent estimates and were estimated using parameters from Stewart and Woolbright (1996). The missing calcium source may be from prey items, such as snails, that were not included in the analysis. From Beard et al. (2002).

Luquillo Experimental Forest: Research History and Opportunities 87
(1996) reported the vertical distribution patterns of the three anoles found in the LEF—A. gundlachi, A. evermanni, and A. stratulus—and these patterns are presented in figure 90. Although A. stratulus is relatively uncommon near ground level in the forest interior, it is extremely abundant in the forest canopy 8 to 24 m above ground level. Of the three common species, only A. stratulus appears to prefer perches of a particular size (fig. 91). By comparing the availability of perches in different size categories with the observed vertical distributions of the three common anole species, data suggest that most A. stratulus inhabit the canopy where small perches are more abundant.
Like coquis, anolis lizards have been shown to have significant effects on invertebrate populations and herbivory rates (Dial and Roughgarden 1995). When Anolis lizards were excluded for 6 months from tree crowns in the LEF, lizard removal had strong, significant, and positive effects on arthropods greater than 2 mm in length and weak negative effects on arthropods less than 2 mm in length (fig. 92). Herbivory effects were significantly greater in lizard removal crowns than in controls, indicating an indirect effect of anoles on plants.
BirdsPuerto Rico has 269 species of birds, 106 of which are breeding residents and 126 are nonbreeding migrants or visitors (Raffaele 1983). The tabonuco forest is home to 49 of the 66 species of land birds found in the Luquillo Mountains (Wiley and Bauer 1985), and 40 of these species have been recorded at El Verde. Of these 40 species, 30 are found regularly in the forest surrounding the El Verde Field Station and are considered to constitute the avian component of the tabonuco forest food web.
The 30 common species at El Verde occur in 8 orders, each represented by a single family, and the Passeriformes, which comprises 4 families (1 of which has 5 subfamilies). Of the 30 species, 8 are endemic to Puerto Rico, 2 others are found only in Puerto Rico and the Virgin Islands (Raffaele 1983), and one-half (15 of 30) of the avifauna at El Verde and two-thirds of the breeding avifauna are West Indian endemics. Both the endemic parakeet (Aratinga maugei) and the White-Necked Crow (Corvus leucognaphalus) became extinct. The endangered Puerto Rican parrot, once reduced to only 13 birds in the wild, reached a population of about 49 individuals before the passage
Figure 90.—The vertical distribution of Anolis gundlachi, A. evermanni, and A. stratulus in tabonuco forest near El Verde in the Luquillo Experimental Forest. From Reagan (1996), originally presented in Reagan (1992).
Hei
ght (
m)
Figure 91.—Frequencies of perch diameters selected by the three common anole species in tabonuco forest. From Reagan (1996), originally presented in Reagan (1992).
Per
cent
Per
cent
Per
cent

88 Luquillo Experimental Forest: Research History and Opportunities
Figure 92.—Responses of small (less than 2 millimeters) and large (larger than 2 millimeters) arthropods to lizard removal compared with controls: (a) large arthropods caught in sticky traps; (b) large arthropods observed on leaflets; (c) small arthropods caught in sticky-traps; (d) small arthropods observed on leaflets. Closed circles represent data from lizard removals, open circles represent data from controls. Data points are mean ± 1 SE. The dotted line shows the mean date of lizard removal. From Dial and Roughgarden (1995).
of Hurricane Hugo. The parrot, however, has not been seen in the El Verde area since 1981.
The avifauna of El Verde experience both annual and seasonal population density fluctuations (fig. 93) related to patterns of reproduction and mortality and to effects from long-distance migration. Annual changes in avifauna population density
Figure 93.—Breeding seasons of birds in the Luquillo Experimental Forest. Principal nesting periods are indicated by a solid line, sporadic nesting by a dotted line, and species for which there are no data by a dashed line. From Waide (1996).
Figure 94.—Relative abundance of species caught in mist nets at El Verde. Data are from Reagan et al. (1982) and Wunderle et al. (1987); figure from Waide (1996).
estimates may reflect long-term trends, but few tropical sites have sufficiently long records to detect such tendencies. Seasonal changes in population density estimates may reflect fluctuations in actual numbers or seasonal cycles in behavior such as breeding, dispersal, or migration; a thorough understanding of temporal changes in bird populations is needed.
The rank abundance distribution of mist net captures from El Verde (fig. 94) shows clearly the dominance of the Ruddy Quail-Dove, followed in rank by the Bananaquit, Puerto Rican Emerald, Puerto Rican Tody, Puerto Rican Tanager, and Pearly-Eyed Thrasher. The remaining eight species in the sample (57 percent) were rare (less than 2 percent of the sample). Mist net samples from mainland tropical forests reveal a much larger proportion of rare species (85 percent from Pipe Line road in Panama, Karr 1990; 90 percent from the central Amazon, Bierregaard 1990). The relatively small sample size from the El Verde mist net samples may partially explain the relatively low proportion of rare species, indicating that as the sample size increases, more rare species are likely to be found. If all the species at El Verde with the potential to be captured by mist nets

Luquillo Experimental Forest: Research History and Opportunities 89
were included in the count, 82 percent of the species would be considered rare.
The largest avian predator in the forest is the Red-Tailed Hawk, which feeds on vertebrates and large invertebrates such as rats, small birds, and centipedes. The diets of other birds found at El Verde are shown in table 30. In Puerto Rico, Red-Tailed Hawks reach their highest population densities (higher than at most sites in the North American continent) on the eastern slopes of the Luquillo Mountains, where they are an important predator of the endangered Puerto Rican Parrot (Santana and Temple 1988). These hawks also prey on the introduced small Indian mongoose (Herpestes auropunctatus), which makes them the top predator in the forest.
Bats Compared with mainland areas of similar size and habitat diversity, Puerto Rico harbors few mammal species, and population numbers for these mammals are generally low. Bats compose the major portion of the Puerto Rican mammal fauna in terms of species richness and density (Willig and Bauman 1984, Gannon and Willig 1994), with 13 species representing 5 feeding guilds currently found on the island. Within the LEF, four species of bats dominate, although some are common in certain habitats and rare or absent in others. Three of these species, Stenoderma rufum, Artibeus jamaicensis, and Brachyphylla carvernarum, are primarily frugivorous (i.e., fruit eating). The fourth, Monophyllus redmani, feeds on flower nectar. Bats have been implicated as major seed dispersers of important species of trees in the tabonuco forest (Devoe 1990), and for some species, such as Manilkara bidentata, they appear to be the only seed dispersal agent (You 1991). In fact, S. rufum is the only frugivorous bat known to consume Manilkara in appreciable amounts, comprising approximately 23 percent of its diet (Gannon and Willig 1994).
Stenoderma rufum, the Red Fig-Eating Bat, has been found at only two localities on Puerto Rico and on the nearby islands of St. John and St. Thomas (Genoways and Baker 1972). Until recently, the Red Fig-Eating Bat was thought to be extinct and was known only from fossil records. As a result, this poorly known species is rare in scientific collections. The status of other Red Fig-Eating Bat populations on Puerto Rico or the Virgin Islands is unknown. Stenoderma rufum consumes a variety of fruits, exhibits asynchronous biomodal polyestry, roosts in canopy foliage, and has a relatively small home range (mean = 2.1 ha) to which it exhibits high site fidelity for several months during the rainy season (Gannon 1991, Gannon and Willig 1992, Gannon and Willig 1994, Willig and Bauman 1984).
Artibeus jamaicensis, the Jamaican Fruit Bat, has a wide geographic distribution in tropical and sub-tropical America. It is a much-studied species and is known to consume a wide variety of fruits as well as some flowers and insects. Although
extensive work has examined aspects of the ecology of several mainland Jamaican Fruit Bat populations (Morrison 1975, 1978a, 1978b, 1979; Handley et al. 1991), little has been studied regarding island populations in general, or specifically regarding Puerto Rican populations. Previous research indicates A. jamaicensis comprises at least 60 percent of LEF bat fauna (Willig and Bauman 1984) and exhibits aseasonal polyestry (Willig and Bauman 1984, Gannon and Willig 1994).
Monophyllus redmani, the Greater Antillean Long-Tongued Bat, feeds primarily on flower nectar. It has a distributional range restricted to the Greater Antilles and several islands in the Bahamas (Homan and Jones 1975). Little is known of its ecology other than anecdotal observations. It is common on Puerto Rico, where it comprises a substantial portion of the LEF bat fauna (Willig and Bauman 1984, Gannon and Willig 1994).
Current distribution patterns of bats in the LEF (fig. 95) suggest that the tabonuco forest is the most diverse zone because it contains a larger number of bat species and those species have a relatively even distribution. Moreover, the tabonuco forest is unique in harboring a population of S. rufum. The palo colorado forest is almost as diverse in bat species as the tabonuco forest but does not contain S. rufum. In the palo colorado forest, B. cavernarum occurs at a much higher population density than elsewhere in the LEF. The elfin forest is the least diverse zone regarding bat populations; bat fauna comprises only three species and the nectarivorous bat, M. redmani (fig. 95) dominates bat distribution.
Gannon and Willig (1994) estimated the effect of recent hurricanes on the demographic parameters of S. rufrum. The proportion of captured juvenile individuals, a measure of recent reproductive success and an index of the potential of the population to increase in density in the near future, decreased after the passage of Hurricane Hugo. Juveniles represented
Figure 95.—Proportional representation of species in the bat fauna within each of three life zones (tabonuco rain forest, palo colorado forest, and elfin forest [labeled as dwarf]) of the Luquillo Experimental Forest. From Gannon and Willig (1994).

90 Luquillo Experimental Forest: Research History and Opportunities
TaxonTrophic leveld Principal foode
Foraging location
Order: Falconiformes
Family: Accipitridae
red-tailed hawka (Buteo jamaicensis) 3 rats, birds canopy
broad-winged hawk (Buteo platypterus) 2, 3 reptiles, birds, invertebrates, canopy
sharp-shinned hawk (Accipeter striatus) 3 birds canopy
Order: Charadriiformes
Family: Scolopacidae
spotted sandpiper (Actitis mascularia) 2 crustaceans, insects streams
Order: Columbiformes
Family: Columbidae
scaly-naped pigeona (Columba squamosa) 1 fruit canopy
zenaida dovea (Zenaida aurita) 1 seeds litter
ruddy quail-dovea (Geotrygon montana) 1 seeds litter
Order: Psittaciformes
Family: Psittacidae
Puerto Rican parrota (Amazona vittata) 1 fruit canopy
Order: Cuculiformes
Family: Cuculidae
Puerto Rican lizard-cuckooa (Saurothera vielloti) 2, 3 lizards, spiders, Lepidoptera, insects understory
Order: Strigiformes
Family: Strigidae
Puerto Rican screech-owla (Otus nudipes) 2, 3 insects, lizards, birds understory
Order: Apodiformes
Family: Apodidae
black swift (Cypseloides niger) 2 flies, beteles open air
Family: Trochilidae
Puerto Rican emeralda (Chlorostilbon maugaeus) 1, 2 nectar, spiders, insects understory
green mangoa (Anthracothorax viridis) 1, 2 nectar, Diptera, spiders understory
Order: Coraciiformes
Family: Alcedinidae
belted kingfisher (Ceryle alcyonb) 3 fish, shrimp streams
Family: Todidae
Puerto Rican todya (Todus mexicanus) 2, 3 Diptera, Coleoptera understory
Order: Piciformes
Family: Picidae
Puerto Rican woodpeckera, d (Melanerpes portoricensis) 1, 2 insects, fruits canopy
Order: Passeriformes
Family: Tyrannidae
Puerto Rican flycatchera (Myiarchus antillarum) 1, 2 Hemiptera, coleoptera, caterpillars, fruit canopy
loggerhead kingbird (Tyrannus caudifasciatus) 1, 2, 3 fruit, insects, reptiles, amphibians clearings
gray kingbird (Tyrannus dominicensis) 1, 2 fruit, insects clearings
Family: Muscicapidae
Table 30. Diets of birds at El Verde. From Waide (1996).

Luquillo Experimental Forest: Research History and Opportunities 91
red-legged thrusha (Turdus plumbeus) 1, 2, 3 fruit, caterpillars, lizards litter
Family: Mimidae
pearly-eyed thrashera (Margarops fuscatus) 1 fruit, vertebrates, invertebrates canopy
Family: Vireonidae
Puerto Rican vireoa, c (Vireo latimeri) 1, 2 Orthoptera, Homoptera, Lepidoptera, fruit canopy
black-whiskered vireod (V. alltiloquus) 1, 2 fruit, insects
Family: Emberizidae
Sub family: Parulinae
black-and-white warblera, b (Mniotilta varia) 2 Coleoptera, Orthoptera understory
parula warblera, b (Parula Americana) 2, 3 spiders, Homoptera, Coleoptera understory
Cape May warblera, b (Dendroica tigrina) 1, 2 nectar, insects understory
black-throated blue warblera, b (D. caerulescens) 1, 2, 3 insects, fruit, spiders understory
black-throated green warblera, b (D. virens) 2 insects canopy
prairie warblera, b (D. discolor) 2, 3 fulgoroids, spiders understory
elfin woods warbler (D. angelae) 2 insects canopy
ovenbirdb (Seiurus aurocapillus) 1, 2 snails, insects, seeds litter
Louisiana waterthrusha, b (S. motacilla) 2 insects litter
American redstarta, b (Setophaga ruticilla) 2 fulgoroids, Diptera understory
Sub family: Coerebinae
bananaquita (Coereba flaveola) 1, 2 nectar, caterpillars, spiders understory
Sub family: Thraupinae
Antillean euphoniaa (Euphonia música) 1 mistletoe canopy
stripe-headed tanagera (Spindalis zena) 1 fruit canopy
Puerto Rican tanagera (Nesospingus speculiferus) 1, 2 caterpillers, fruit understory, canopy
Sub family: Icterinae
black-cowled oriole (Icterus dominicensis) 2, 3 Coleoptera, spiders, earwigs canopy
Sub family: Emberizinae
Puerto Rican bullfincha (Loxigilla portorricensis) 1, 2 fruit, insects understory, canopy
black-faced grassquita (Tiaris bicolor) 1 seeds openings
Sources: Names correspond to nomenclature used in the Checklist of American Birds (AOU 1983). Data on principal foods from Wetmore (1916) modified by results from Waide (unpublished), Wiley (pers. comm.), and Arendt (pers. comm.). Foraging locations are from Raffaele (1983), Wunderle et al. (1987), Waide (unpublished), Wiley (pers. comm.), and Arendt (pers. comm.).a Species regularly found in El Verde.b Breeds in North America, winters in Puerto Rico.c Breeds in Puerto Rico, winters in South America.d 1, 2, 3 = Primary, secondary, and tertiary consumers, respectively. Species are included in a trophic level if at least 10 percent of their diet comes from the next lowest
trophic level.e In order of importance. Major invertebrate groups in the diet are listed when possible.
TaxonTrophic leveld Principal foode
Foraging location

92 Luquillo Experimental Forest: Research History and Opportunities
Figure 97.—Number of bats (per 10 net hours) in six habitat sites sampled in July before and after the passage of Hurricane Georges over Puerto Rico. Continuous lines join habitat sites. From Jones et al. (2001).
between 30 and 40 percent of the population before the hurricane came ashore, with a substantial decline in juvenile representation (to about 10 percent) after the hurricane made landfall (fig. 96a). Changes in female reproductive patterns occurred as well (fig. 96b). Before Hurricane Hugo hit, at least 55 percent of the adult female S. rufrum bats sampled were reproductively active (pregnant or lactating). After the hurricane passed over the forest, the proportion of females that were breeding declined, with relatively few individuals producing young. This decline persisted for at least 3 years (i.e.,
until 1992), when less than 5 percent of the females exhibited reproductive activity.
Jones et al. (2001) also studied bat recovery rates in a broader variety of habitat types across Puerto Rico after the passage of Hurricane Georges. At all sites sampled, bat abundance decreased after the hurricane (fig. 97), and some evidence showed that frugivorous and nectarivorous species may be more affected by hurricane disturbance than insectivorous species.
The Stream CommunityThe benthic invertebrate community in the LEF is overwhelmingly dominated by three genera of freshwater shrimp—Atya, Xiphocaris, and Macrobrachium (table 31)—and a relatively low abundance of benthic insects (Pringle et al. 1993). Ten species of omnivorous shrimp inhabit rivers of the LEF and represent most of the functional feeding groups found in stream macroinvertebrate communities. Xiphocaris is best characterized as a predator, shredder, and particle feeder (Crowl et al. 1996, 2001); Atya is both a filter-feeder and a scraper-grazer (Covich 1988); and Macrobrachium is a predator (Crowl and Covich 1994). The palaemonid shrimp Macrobrachium carcinus (L), M. faustinum (De Saussure), M. crenulatum Holthuis, M. acanthurus (Wiegmann), and M. heterochirus (Wigmann) are thought to consume decomposing leaf litter, fine particulate
Figure 96.—Histograms representing (a) the demographic structure, and (b) the proportion of breeding females of the population of Stenoderma rufum in the tabonuco forest at El Verde. An arrow represents the occurrence of Hurricane Hugo. From Willig and Gannon (1996).
Per
cent
Per
cent

Luquillo Experimental Forest: Research History and Opportunities 93
Table 31. Common aquatic fauna of the Luquillo Experimental Forest’s streams. Provided by Omar Pérez Reyes.
Species SpeciesDescription DescriptionPicture (arrow shows detail) Picture (arrow shows detail)
Claws equal in shape but unequal in size; but both are narrow. Body likely to be heavily banded. Fingers 2/3 as long as palm.
Lateral lobes of rostrum subacute and directed anteriorly. Periopods extremely robust with tubercles.
Claws of equal size and shape, not hairy, tends towards dark blue longitudinal stripes down sides and back.
Lateral lobes of rostrum obtuse. Periopods robust with tubercles.
Claws unequal in size and shape with spines between fingers, telson orange, fourth and fifth terga purplish red each with narrow yellow transverse band.
Periopods with long hair at end of fingers. Rostrum with dorsal teeth. Body with vertical bands or median stripe.
Claws unequal in size and shape, palm of larger claw is inflated and claws thickly pubescent, fingers banded.
Rostrum armed with teeth in the basal part of the dorsal margin; ventral margin serrate. Body color translucent with internal organs visible.
Claws of equal size and shape, thin and narrow, claw thickly pubescent, yellow articulation of podomeres, dorsally banded.
Freshwater crab. Body color brown.
Absence of horizontal lobe or tooth on either side of the rostrum. Periopods without tubercles or scales, and thin.
Macrobrachium heterochirus
Macrobrachium carcinus
Macrobrachium crenulatum
Macrobrachium faustinum
Macrobrachium acanthurus
Atya lanipes
Atya scabra
Atya innocous
Micratya poeyi
Xiphocaris elongata
Epilobocera sinuatifrons

94 Luquillo Experimental Forest: Research History and Opportunities
organic matter, algae, macrophytes, insects, mollusks, small fish, and other shrimp (Covich and McDowell 1996). The atyid shrimp, represented by Atya lanipes Holthuis, A. scabra (Leach), A. innocuous (Herbst), and Micratya poeyi (Guérin Méneville), consume fine particulate organic matter, leaf material, algae, and small sessile insects by brushing with their cheliped fans (Pringle et al. 1993). They use the same cheliped fans to filter feed when flow conditions are suitable (Covich 1988). Xiphocaris elongata (Guérin Méneville) consumes leaf matter, periphyton, fine particulate organic matter, insects, small flowers, and fruit, using tiny pincers (Covich and McDowell 1996, Pringle 1996).
One endemic freshwater crab (Epilobocera sinuatifrons: Pseudothelphusidae) also inhabits LEF rivers and streams, as do predatory fish including the freshwater mullet (Agonostomus monticolus: Mugilidae), the freshwater eel (Anguilla rostrata: Anguillidae), and three species of omnivorous gobies (Awaous taiasica, Bathygobius soporator, and Gobiomorus dormitor: Gobiidae). At high elevations, the only fish species present is the algivorous goby Sycidium plumier (Gobiidae) that can negotiate waterfalls and rapids with its modified pelvic fins (Townsend et al. 2002). Two genera of freshwater snails, Niritina spp. and Thiara granifera (Lamarck), inhabit mid- and low-elevation sites. Although the stream insect community is represented by most major taxa (Masteller and Buzby 1993), the mayflies Baetidae and Leptophlebiidae comprise the majority of individuals (Pescador et al. 1993). Despite the presence of these other fauna, shrimp represent as much as 95 percent of the standing stock biomass of total stream organisms (Covich et al. 1991, 1996; Crowl and Covich 1994) and shrimp density is approximately 20 individuals m-2 (Covich 1988).
All the LEF’s shrimp species are amphidromous—spending most of their life cycle in freshwater where they grow from postlarvae into reproductive adults (Covich and McDowell 1996, Johnson et al. 1998). Gravid females release planktonic larvae into flowing waters, where the larvae are carried downstream to coastal lagoons and estuaries where they continue to develop in brackish water. In stream reaches that contain predatory fish, most migratory drift by shrimp occurs at night, with a nocturnal peak in drift occurring from 7 to 10 p.m. Diel pattern in drift, however, does not occur where predatory fish are absent (March et al. 1998). Larvae spend 50 to 110 days in the estuary before migrating back upstream as metamorphosed postlarvae (Chase and Hobbs 1969, Hunte 1978, Benstead et al. 2000) where they occupy pools at different elevations and distances from the coast. High elevation sites are dominated by atyid shrimp (mostly A. lanipes) and X. elongatea, while Macrobrachium spp. and X. elongata comprise most of the shrimp assemblage at lower elevation sites (March et al. 2001, 2002). With increased elevation and travel distances, these migratory shrimp confront time and energy tradeoffs between avoiding predators and avoiding habitats where physical washout of food and potential injury during stormflows may occur (Covich et al. 1996).
Until recently, shrimp population dynamics had not been studied extensively within the LEF. An initial study by Covich et al. (1991) reported atyid shrimp populations following hurricane-associated stormflows in LEF streams. Although declines in shrimp population densities were predicted, results indicated that neither extensive shrimp removal nor washout of organic detritus (food resources) was observed after the passage of Hurricane Hugo; overall average atyid shrimp density increased from 4.7 to 6.5 shrimp m-2. However, the effect of the hurricane on atyid population density varied by the pool type in which shrimp lived. Pool type was classified by pool size, pool elevation, and pool gradient. In headwater pools, Atya densities were reduced by an average of 20 percent, apparently as a result of washout from flooding associated with the hurricane, while densities increased by 60 percent in the mid-elevation pools and by more than 100 percent in the low-elevation pools, presumably as a result of accumulation of displaced individuals from headwater reaches and minor tributaries. Large leaf piles found in debris dams served to slow the washout of invertebrate consumers while also providing more crevice structure and increasing detrital food supplies (Covich and Crowl 1990, O’Connor 1991). Over the 8 months that followed Hurricane Hugo’s landfall, debris dams were slowly undercut by the stream’s base flow so that microbially conditioned leaf detritus was carried downstream in a relatively continuous manner. High sunlight conditions after the hurricane occurred resulted in abundant growth of algae, so that between scraping conditioned leaf detritus and filtering periphyton, shrimp had a superabundance of food resources.
After studying longer term effects of hydrological disturbance on shrimp populations at multiple elevations in the LEF (50 months post-Hugo and a 12-month low-flow period), Covich et al. (1996) found that Atya densities had increased beyond pre-Hugo levels at all elevations, even in the headwater pools that initially experienced reductions in population density. The distribution of the three shrimp genera studied (Atya, Xiphocaris, Macrobrachium) varied both along an elevational gradient and in response to hydrological disturbance (fig. 98). Atya density and abundance along the elevational gradient generally increased in both post-Hugo and dry periods, while Xiphocaris densities and abundance increased with elevation during pre- and post-Hugo periods but decreased with elevation during the dry period (fig. 98). Macrobrachium density and abundance decreased with elevation and were unaffected by hydrologic disturbance. Several potential mechanisms may explain these shrimp distributions. For example, because Macrobrachium is predatory, prey species Atya and Xiphocaris may obtain a spatial refuge from predation by occupying high-elevation pools (Crowl and Covich 1994). The coexistence of Atya and Xiphocaris with predatory Macrobrachium in the lower elevation pools possibly occurs because low-elevation pools have greater depths and greater spatial complexity.

Luquillo Experimental Forest: Research History and Opportunities 95
In another study of Atya population dynamics, Heartsill Scalley et al. (2001) compared the size-class structure of shrimp in pools with different physical conditions along an elevation gradient over a 4-year sampling period in the first order tributary Quebrada Prieta, part of the Río Espíritu Santo watershed. The pools were sampled every 2 months, from January 1996 to December 1999. For all captured individuals carapace length
Figure 98.—Elevational gradient and least squares analysis of log mean density distributions of Atya (top graph), Xiphocaris (middle graph), and Macrobrachium (bottom graph) for three periods: Prehurricane Hugo (black circle for mean densities per pool, solid line for regression); post-Hurricane Hugo (open circle, dashed line); and dry (open triangle, dotted line). From Covich et al. (1996).
was measured, and three size class categories were established. Although the size-class structure for juveniles was not significantly different among pools and did not show seasonal patterns, there were clear seasonal trends in the proportion of gravid females (fig. 99). The low abundance of juveniles in the population (fig. 100) is thought to be a result of low adult mortality, high fecundity, and a relatively long life span. Large recruitment events may not be important to the stability of this population; it seems that enough adults are always present in the population to produce eggs and release large numbers of potential new recruits.
Covich et al. (2006) extended the data set shown in figure 98 and reported long-term trends in Macrobrachium shrimp populations to determine their distributions along an elevational gradient during a series of disturbances (Hurricane Hugo in 1989, a drought in 1994, and Hurricane Georges in 1998) that occurred over a 15-year period (1988 to 2002). In general, Macrobrachium abundance declined with elevation during most years (fig. 101). The lowest mean abundance of Macrobrachium occurred during the 1994 drought, the driest year in 28 years on record in the Espíritu Santo drainage. Macrobrachium increased in abundance for 6 years following the 1994 drought. In contrast, hurricane and storm flow disturbances had relatively little effect on Macrobrachium abundance (fig. 102).
Given their high population densities, relatively high biomass per individual, and high mobility, shrimp play an important functional role in organizing stream community structure (Pringle et al. 1999) and detrital processing (Crowl et al. 2001, March et al. 2001, Wright and Covich 2005, Crowl et al. 2006). For example, atyid shrimp reduce sediment cover and algal standing crop on the substratum and alter insect and algal community composition (Pringle et al. 1993; Pringle and Blake
Figure 99.—The percent of gravid females in Atya shrimp populations within different pools of the Quebrada Prieta, a first order tributary of the Espíritu Santo River. From Heartsill Scalley et al. (2001).

96 Luquillo Experimental Forest: Research History and Opportunities
Figure 100.—Size class structure of Atya shrimp populations across pools in the Quebrada Prieta, a first order tributary of the Espíritu Santo River in the Luquillo Experimental Forest. Individuals smaller than 10 millimeters (mm) carapace length were classified as juveniles, individuals between 10 and 19.9 mm were considered to be reproductive females, and individuals larger than 19.9 mm were considered males. From Heartsill Scalley et al. (2001).
Figure 101.—Relationship between total abundance of Macrobrachium (1988 to 2002) and elevation in Quebrada Prieta. The outlier point represents shrimp abundance in a pool that was consistently larger and deeper relative to other middle-elevation pools. From Covich et al. (2006).
Figure 102.—Mean (± 1 SE) total abundance of Macrobrachium in 20 pools in Quebrada Prieta from 1988 to 2002. Years with the same letter are not significantly different. The arrows indicate flow-based events: Hurricane Hugo (1989), Hurricane Georges (1998), and the most severe drought in 28 years (1994). From Covich et al. (2006).
1994; Pringle 1996). Xiphocaris shred intact, large leaves and convert them into fine, medium, and coarse particulates, thereby increasing the concentration and rate of downstream transport of suspended particulate organic matter and increasing the concentration of both total dissolved N and dissolved organic C (Crowl et al. 2001). March and Pringle (2003) used stable isotope analysis to determine the relative importance of algae and leaves as a food source to stream consumers and found that shrimp in the LEF rely more on algal-based C resources than terrestrially derived resources at all three sites measured, although there were variations in dependence on algal versus leaf based detritus among shrimp taxa and size classes within taxa (table 32). Insect shredders obtained more C from terrestrially derived
detritus than from algae, collector-gathering leptophlebiid and baetid mayflies relied almost equally on both algal and leaf-derived C, and the collector-filtering caddisfly Chimarra albomaculata was found only at the low-elevation site and depended more on algal-based than leaf-based C (table 32). Snail species, Neritina spp. and T. granifera, were abundant only at the low-elevation site and relied on 69 and 76 percent algal resources, respectively, while the omnivorous crab Epilobocera sinuatifrons was found only at the high elevation site and relied on slightly more leaf-based than algal-based C.

Luquillo Experimental Forest: Research History and Opportunities 97
Percent algal dependenceδ13C δ15N Mean
(% linear model) SE (%)Consumers/organic matter sources N x SD x SD
High-elevation reach 9 -22.23 0.61 6.97 1.19 58 3Machrobrachium crenulatum (28-37) 7 -19.67 0.90 6.81 0.24 79 5Machrobrachium spp. Small (14-18) 6 -23.07 0.56 5.74 0.28 52 3Atya lanipes large (17-19) 6 -21.52 2.02 5.29 0.49 65 8A. lanipes medium (11-13) 8 -22.19 0.87 5.41 0.54 60 4A. lanipes small (6-10) 3 -22.97 0.06 5.71 0.30 53 3A. innocuous large (17-19) 3 -23.10 0.23 5.73 0.24 52 3A. scabra (9-11) 2 -23.14 0.13 5.69 0.24 52 3Xiphocaris elongate large (11-13) 5 -22.31 0.87 4.94 0.17 59 4X. elongate medium (8-9) 4 -19.07 1.72 5.26 0.29 86 9X. elongate small (6-7) 5 -17.56 1.19 6.64 0.33 99 7Sicydium plumier 3 -17.77 2.92 6.49 0.64 97 15Epilobocera sinuatifrons 1 -23.78 4.91 46 9Leptophlebiidae 3 -24.25 0.72 2.51 0.20 46 4Stream leaves 5 -30.01 0.14 0.13 0.68Algae 5 -18.24 1.32 1.40 0.63Biofilm 10 -22.96 1.51 5.12 1.34
Mid-elevation reachMachrobrachium carcinus (40-51) 2 -20.13 1.03 7.31 0.37 65 14M crenulatum (31) 1 -23.75 5.73 34 11Machrobrachium spp. small (13-16) 5 -19.44 0.81 7.11 0.11 71 14Xiphocaris elongate medium (9-10) 5 -15.43 0.53 6.06 0.31 106 21X. elongate small (6) 5 -17.60 1.02 7.84 0.17 88 18Agonostomus monticola 5 -18.92 0.88 8.93 0.56 75 15Anguila rostrata 1 -19.41 8.68 71 16Gobiomorus dormitor 1 -17.56 8.02 87 19Sicydium plumier 4 -16.69 1.70 7.57 1.77 96 20Leptophlebiidae, Baetidae 2 -22.11 0.69 4.35 0.57 53 11Phanocerus spp. 2 -25.88 0.04 1.28 0.03 21 4Stream Leaves 5 -28.79 0.40 0.62 0.12Algae 2 -17.03 2.16 2.16 0.30Biofilm 11 -20.15 3.38 3.38 0.43
Low-elevation reachMachrobrachium acanthurus (27) 1 -19.16 9.44 82 25M. heterochirus (not measured) 1 -21.53 7.03 59 21Machrobrachium spp. medium (10-11) 5 -20.99 3.16 9.88 2.35 71 17Machrobrachium small (3-6) 5 -20.27 1.30 9.34 0.65 64 20Xiphocaris elongata medium (8-10) 5 -19.85 2.20 8.11 0.32 78 18X. elongata small (5) 4 -19.80 0.90 7.42 0.12 78 20Eleotris pisonis 1 -20.46 9.53 70 23Gobiomorus dormitor 5 -19.28 0.42 9.03 0.84 81 18Sicydium plumieri 1 -21.55 8.72 61 21Neritina spp. 5 -21.48 2.94 8.55 0.35 62 19Thiara granifera 5 -20.84 0.92 7.29 0.19 68 16Leptophlebiidae, Baetidae 1 -23.30 6.13 48 20Chimarra albomaculata 1 -21.78 6.42 63 22Phanocerus spp. 1 -25.30 3.66 28 18Stream Leaves 4 -28.55 0.29 1.47 0.75Algae 1 -18.36 5.96Biofilm 1 -24.11 6.42Macrophytes 4 -32.79 0.55 7.99 0.89
Table 32. Index of algal reliance for consumers at each reach measured in the Luquillo Experimental Forest. The range of carapace length for shrimps is in parentheses. The index of algal reliance was based on carbon and nitrogen isotope values. From March and Pringle (2003).

98 Luquillo Experimental Forest: Research History and Opportunities
Carbon Cycling in the Luquillo Experimental ForestCarbon (C) in forests resides in various pools: aboveground biomass, belowground biomass, litter, deadwood, and soil. At the most fundamental level, C fluxes through a forest ecosystem include CO
2 uptake by leaves through the process of
photosynthesis and CO2 release to the atmosphere through the
respiration of leaves, stems, roots (autotrophs), and heterotrophs (soil microorganisms and forest fauna). Net primary productivity (NPP) is the difference between total photosynthesis (gross primary productivity—GPP) and total plant respiration in an ecosystem. Due to past difficulties quantifying the gas exchange through an ecosystem, NPP has also been measured in the field as the total new organic matter produced during a specified interval (Clark et al. 2001, fig. 103).
Several studies of NPP—and individual components of NPP such as litterfall and herbivory rates—have been conducted in the Luquillo Experimental Forest (LEF). Early efforts focused on measuring the aboveground biomass increment of forests at various elevations, while later research focused on long-term rates of leaf litterfall and decomposition. Technological advances such as the use of infrared gas analyzers and computer models have shaped recent studies of NPP, resulting in a more holistic approach in quantifying primary productivity (Wang et al. 2002,
14. Ecosystem ProcessesA.E. Lugo and N.L. Harris
2003; Harris 2006; Harris et al. 2008; Harris et al., in press). In the following sections, note that forest biomass is approximately 50 percent C.
Biomass StudiesBrown et al. (1983) reported a range of biomass measured for mature forests in the LEF from about 100 Mg ha-1 (metric tons per hectare) in the elfin forest to about 400 Mg ha-1 in the tabonuco forest. Later, Lugo and Scatena (1995) observed that biomass measurements vary within the tabonuco forest, such that the same biomass range observed from the bottom to the top of the mountains (400 to 100 Mg ha-1) existed within El Verde sector of the tabonuco forest. Brown et al. (1983) also reported data on biomass distribution within tabonuco and elfin forests, and some preliminary information on animal biomass and temporal changes in aboveground biomass. Since that data synthesis, significant progress has been made on the following aspects, which we summarize below: biomass along the elevation gradient, biomass distribution with topography, biomass levels and distribution in other forest types, biomass distribution by tree species, and biomass accumulation after disturbance events. This section is illustrative rather than exhaustive of all the biomass data for LEF forests.
Biomass Along the Elevation GradientRecent data along the elevation gradient do not change the range reported by Brown et al. (1983) but they provide information about forest types at mid-elevations. As discussed in the vegetation section, however, data collection at the LEF has used the forest type designation, as a surrogate for elevation and it is possible that the variability within each forest type masks elevation gradients found in biomass. For example, the total biomass for mature stands of the four forest types shows that the tabonuco forest at about 400 meters (m) elevation, the palm floodplain forest at about 800 m elevation and the palo colorado forest above 600 m elevation have higher values than the elfin forest at about 1,000 m elevation (fig. 104). These data do not reflect a smooth gradient with elevation but suggest that more data need to be systematically collected to see if there are gradients or, alternatively, if biomass peaks at low and intermediate elevations as reflected through other structural parameters observed in the LEF (Brown et al. 1983).
Biomass Distribution With TopographyWithin the Bisley Experimental Watersheds of the LEF, researchers observed that mean aboveground biomass changes with topographic position such that biomass is highest on ridges, intermediate on slopes, and lowest on upland and riparian valleys (fig. 105); however, only the mean aboveground biomass on ridges is statistically different from the aboveground biomass on the other topographic positions. As already observed by Lugo and Scatena (1995), aboveground biomass is spatially variable in the LEF, with the highest variability observed on ridges and in riparian valleys. Scatena and Lugo (1995) found
Figure 103.—Components of net primary productivity. From Clark et al. (2001).

Luquillo Experimental Forest: Research History and Opportunities 99
that other structural parameters of forests and forest species richness varied with topographic position. Weaver (1995) found similar topographic effects on structural parameters in both palo colorado and elfin forests. He also reported that aboveground biomass of elfin forests ranged from 48 Mg ha-1 on exposed ridges to 110 Mg ha-1 on the leeward side of the summit. These and other data led to the conclusion that topographic position is a strong determinant of forest structure and composition in Puerto Rican forests (Lugo 2005).
Biomass Distribution Among and Within ForestsAge and land use also influence biomass accumulation in forests of the LEF. Aboveground biomass increases with age in secondary forests and plantations, which collectively have lower aboveground biomass than mature forests, with the exception being elfin forests. Plantation forests had higher aboveground biomass than secondary forests of a similar age.
Biomass distribution in native LEF forests is characterized by a high proportion of root biomass versus a low proportion of root biomass in plantations (fig. 106). Plantation forests had a higher proportion of their biomass in wood than native forests had; however, the elfin forest, with a high proportion of woody biomass, was an exception. Pine plantations had a higher proportion of biomass in leaves and the highest proportional biomass in litter when compared with native forests.
Animals, microbes, bryophytes, and epiphytes constitute a small fraction of total biomass found in the LEF, except in the elfin forest where epiphytes can exceed 5 percent of the total biomass. The range of biomass in organisms other than trees at the LEF extends six orders of magnitude (fig. 107). The highest biomass values are those of epiphytes at high elevation forests, followed by earthworms that represent the highest biomass values for animal species, and fungi and bacteria found in the top 10 centimeters (cm) of soil. On the lower extreme of biomass value are spiders, with the lowest estimated biomass in El Verde tabonuco forest. Birds and frogs share similar biomass values. Lugo and Scatena (1992, 1995), Frangi and Lugo (1992), Reagan and Waide (1996), and Beard et al. (2002, 2003) showed that although
Figure 104.—Total biomass (aboveground and roots) for different forests in the Luquillo Experimental Forest. Data are from Weaver and Murphy (1990) for the bottom four mature forests and from Lugo (1992) for paired plantations and secondary forests. The age of secondary forests is approximately similar to that of its paired plantation. The paired plantation-secondary forests are presented in the same order from oldest to youngest.
Figure 105.—Aboveground biomass for forest stands on different topographic positions in the Bisley Experimental Watersheds, Luquillo Experimental Forest. Data are from Scatena and Lugo (1995) and include mean and standard error. The number of sample plots was 22, 40, 12, and 9 for ridge, slope, upland valley, and riparian valley, respectively.
Figure 106.—Distribution of total biomass in several forest stands in the Luquillo Experimental Forest. The percentages are based on total stand data in figure 104.

100 Luquillo Experimental Forest: Research History and Opportunities
these organisms constitute a relatively low proportion of total biomass, they play disproportionate and critical roles in nutrient and C cycling of forests at all elevations.
Biomass of Tree Species in Relation to Importance ValueThe Importance Value (IV) of a tree species is the combination of its basal area, tree density, and frequency in relation to other species in a community. It is assumed that the IV of a species is proportional to its functional importance in terms of uptake and storage of biomass and nutrients. For example, Heartsill Scalley et al. (2010) found that after Hurricane Hugo occurred, the high IV of pioneer species was reflected in an increment of the cycling and accumulation of Mg (magnesium) in forest stands, due to the high proportion of Mg-rich leaves of pioneer species. Scatena and Lugo (1995) found that the relative biomass of a tree species in the Bisley Experimental Watersheds was always higher than its IV and generally declined as the IV declined (fig. 108). Some species, however, had relative biomass values that were higher than expected based on their IV in the community (species 4, 10, 12, and 15 in fig. 108). This disproportion is probably related to larger diameter trees than expected found in the population, as biomass accumulation is calculated as a cubed power of the tree diameter. If this observation is true, the functional importance of an arboreal species, while proportional to its IV, appears to be influenced by the size of its trees, which in turn might be a function of the quality of the site those trees occupy or the age of the trees.
Biomass After DisturbanceFigure 109 contains four temporal aboveground biomass records from the LEF following three types of disturbance events: hurricanes, radiation, and land degradation. All these records are from low-elevation forests (below 400 m above sea level).
The steeper rates of aboveground biomass accumulation are associated with mature vegetation during the first two decades after a hurricane occurred. In comparison, gamma radiation exposure decreased both the level and rate of aboveground biomass accumulation in a mature tabonuco forest. The slowest rate of biomass accumulation was observed after deforestation, agricultural activity, and land abandonment, interpreted as
Figure 107.—Levels of dry weight biomass of spiders, birds, all animals, fungi, earthworms, and epiphytes in the Luquillo Experimental Forest (LEF). Data and the original sources are found in Moore and Burns (1970), Brown et al. (1983), Frangi and Lugo (1992), Lugo and Scatena (1992), and Reagan and Waide (1996). The epiphyte data are for high elevation forests and all the rest are for the El Verde sector of the Luquillo Experimental Forest.
Figure 108.—Importance Value (open circles) and relative aboveground biomass of tree species in the Bisley Experimental Watersheds of the Luquillo Experimental Forest. From Scatena and Lugo (1995).
Figure 109.—Temporal trends of aboveground biomass after disturbance events at low elevations of the Luquillo Experimental Forest. Data are from Drew et al. (2009) and Scatena et al. (1996) for hurricane responses at El Verde-3 (EV-3) and Bisley, respectively; Aide et al. (1995) for degradation; and Taylor et al. (1995) for radiation disturbances.

Luquillo Experimental Forest: Research History and Opportunities 101
land degradation. This chronic disturbance event reduced woody aboveground biomass to zero for almost a decade after abandonment, and after 60 years of growth, aboveground biomass was still about half way from that of mature native forests.
Litter StudiesLeaf litterfall has been studied extensively in the tabonuco and elfin forests of the LEF (at El Verde and Pico del Este), initially as part of the Minority Research Centers of Excellence (MRCE) experiment and then monitored continuously as part of the National Science Foundation’s Long Term Ecological Research data collection starting in 1998. The MRCE decomposition experiment was designed to examine short-term disappearance of foliage from three important species: Prestoea montana, Dacryodes excelsa, and Cyrilla racemiflora. Hurricane Hugo provided a unique opportunity to study effects of this type of natural disturbance on decomposition rates. The MRCE study was repeated in 1990 with some design modifications to allow for comparisons between short-term foliar litter biomass and N (nitrogen) dynamics.
Production of new leaves in the tree species D. excelsa, M. bidentata, G. guidonia, Palicourea riparia, S. berteriana, Tabebuia heterophylla, Casearia arborea, and Piper glabrescens was not correlated to rainfall during a 2-year study by Angulo Sandoval and Aide (2000). They followed leaf production in 20 individuals of 8 species (fig. 110) and found a positive relationship between leaf production and the photosynthetic photon flux density of the previous 2 months. In addition, they observed that more than 30 percent of annual leaf production during the study period occurred between May and June (fig. 111). Although synchronous leaf production was observed in this forest type, differences in herbivory rates were not observed when comparing peak production periods with the rest of the year. In terms of leaffall patterns, Zalamea and González (2008) found two community-level peaks of leaf litter fall, one from April to June and another from August to September (fig. 112). These peaks occurred in the LEF during periods with higher solar radiation levels. Patterns of leaffall were correlated with various factors, such as solar radiation, photon flux, day length, and temperature. Of the 32 studied species, 16 had a unimodal phenological pattern. Two dominant species in the tabonuco forest, D. excelsa and G. guidonia, along with Matayba dominguensis, were observed to have bimodal leaf-fall patterns, while the tree Drypetes glauca and the vine R. surinamensis had multimodal patterns (fig. 113). These findings highlight the need for continued research on individual species phenology patterns. Further, Zalamea and González (2008) demonstrate that leaf litter is a spatially and temporally heterogeneous resource whose species composition changes throughout the year, and thus changes in its quality and quantity can have potentially localized effects on organic matter processing and nutrient cycling. Using a 10-year data set patterns were established for
Figure 110.— Annual leaf production for eight common species in the Luquillo Experimental Forest from year 1 (November 1994 to October 1995) and year 2 (November 1995 to October 1996). In year 1, only 2 of 20 individuals of Tabebuia heterophylla produced leaves. From Angulo Sandoval and Aide (2000).
Figure 111.—Annual leaf production in the Luquillo Experimental Forest. Data were collected between November 1994 and October 1996. Error bars represent standard deviation. From Angulo Sandoval and Aide (2000).

102 Luquillo Experimental Forest: Research History and Opportunities
peak flowering and fruiting (fig. 114) that also correlated with monthly mean irradiance (Zimmerman et al. 2007); however, fruit development times varied during the year. Species in which fruits established in sunnier months took an average of 3 months to develop, while those species that fruited during October and February took nearly 6 months to develop.
Leaf litter decomposition has also been a long-term focus of research in the LEF. Rates of leaf litter decomposition depend on the particular interactions between vegetation and decomposer food webs. Prather (unpublished data) recently compiled and standardized leaf litter decay constants, which are summarized in table 33.
Zou et al. (1995) compared litterfall and litter decomposition rates between a mid-successional forest and an adjacent mature forest in the LEF and found that basal area, litterfall, and leaf decomposition were not significantly different, even though
tree species composition in the mid-successional forest had not yet returned to that of mature forest. These results suggest that ecosystem function in secondary forests recovers more quickly than ecosystem structure.
Several models assume that climate and environmental factors are the primary controllers of leaf litter decomposition (Meentemeyer 1977, 1978), and similar patterns may or may not occur with root decomposition, a process which is somewhat buffered from extremes in climate by its location in the soil. Silver and Miya (2001) reviewed global patterns of root decomposition and found that the parameters that explained the largest amount of variability in root decay were root Ca (calcium) concentrations and root C to N ratios, with a smaller proportion explained by latitude, mean annual temperature, mean annual precipitation and actual evapotranspiration. Bloomfield et al. (1993) studied decomposition rates of both fine roots and foliage in the LEF and found that at all locations studied in the tabonuco forest, fine roots decayed significantly more slowly than foliage, most likely due to higher levels of nondigestible cell wall fiber and lignin (table 34).
Dead Wood Dead wood as a C pool has not been studied as extensively as other pools in the LEF. Under nonhurricane conditions, Odum (1970b) found that the decomposition rate of about 10 percent per year for coarse woody debris in tabonuco forests balances with rates of woodfall. In general, wood decomposition in the LEF is rapid, with most—but not all—woody debris produced by a hurricane decomposing before the forest reaches prehurricane biomass (Frangi and Lugo 1998, Beard et al. 2005). Coarse wood (>10 cm in diameter) of species such as Manilkara bidentata, Dacryodes excelsa, and Cyrilla racemiflora decompose at rates that require more than 20 years to complete the process (Odum 1970b, Torres 1994, Beard et al. 2005, Torres and González 2005, Zalamea et al. 2007). This rate of decomposition is due to wood characteristics and to the reduction of decomposition rates as decomposers encounter the heartwood. For example, Zalamea et al. (2007) found that the decomposition rate of D. excelsa declines from 3.2 percent yr-1 the first 6 years after the hurricane occurred to 1.3 percent yr-1 after 15 years. Torres (1994) and Torres and González (2005) observed that the initial decomposition of coarse wood of C. racemiflora is due to the loss of sapwood and that, after 15 years, the heartwood of this species was almost intact. The decomposition process can also be retarded by water saturation of partially decomposed logs, which reduces the supply of oxygen to decomposers (Torres 1994). Even if constant decomposition rates were applied to M. bidentata, using the initial average rates of 4 percent yr-1 (Odum 1970a, Beard et al. 2005), it would still require more than 20 years to decompose all the material. Moreover, Zalamea et al. (2007) found that, as the wood decomposes, soil organic matter increases, thus contributing to a long-term C sink.
Figure 112.—Monthly rates of total litterfall (dashed line), leaffall (solid line), reproductive parts (crosses), wood (closed circles), and miscellaneous components (open circles). From Zalamea and González (2008).
Figure 113.—Leaffall pattern for bimodal species; represented as percentage of the annual leaffall for each species. The genera are Dacryodes (D), Guarea (G), and Matayba (M). From Zalamea and González (2008).

Luquillo Experimental Forest: Research History and Opportunities 103
Figure 114.—Patterns of peak flowering and fruiting in the Luquillo Experimental Forest. From Zimmerman et al. (2007).

104 Luquillo Experimental Forest: Research History and Opportunities
Soil CarbonSoil C stocks were sampled throughout the LEF by Wang et al. (2002) and used to validate a spatially explicit version of the CENTURY soil model applied to the LEF landscape (Parton et al. 1987, 1988, 1989). The model simulated spatial patterns of storage and flux of soil organic carbon (SOC) stocks in the top 30 cm of soil (0 to 30 cm depth) over 100 years as functions of climate, vegetation, and soil type. The model was driven by monthly estimates of average air temperature, precipitation, and potential evapotranspiration (see the previous section on climate models) and estimates of GPP and the distribution of aboveground and belowground biomass production. Simulated storage of SOC in the LEF is highly variable, ranging from approximately 20 to 230 Mg ha-1 and varies with elevation
Decay constant(k)
(years-1) r2 nLeaves P. montana 1.6 0.92 58 D. excelsa 1.3 0.91 58Roots P. montana 0.60 0.85 56 D. excelsa 0.83 0.85 57
Table 34. Decay constant (k) values for a single exponential model. In (X) = -kt, where X = Xt/Xo, X = weight remaining and t = time in years for leaf and root tissues of Prestoea montana and Dacroydes excelsa. From Bloomfield et al. 1993.
r2 = Coefficient of determination. n = Number of observations.
Table 33. Leaf litter decay constants (k) for various species of leaves in the LEF. Compiled by C. Prather.
Species FamilyLitterType Life form
Monthlyk value
Annual K value Reference
Cecropia schreberiana Cecropiaceae Brown Tree -0.122 -1.465 González and Seastedt, 2001
Cecropia schreberiana Cecropiaceae Brown Tree -0.098 -1.181 Harris, unpublished
Cecropia schreberiana Cecropiaceae Brown Tree -0.070 -0.838 Sheils and Yang, unpublished
Cecropia schreberiana Cecropiaceae Brown Tree -0.057 -0.680 Sheils, 2006
Cecropia schreberiana Cecropiaceae Brown Tree -0.057 -0.680 La Caro, 1985
Cyathea arborea Cyatheaceae Brown Tree -0.078 -0.930 Sheils, 2006
Cyrilla racemiflora Cyrillaceae Brown Tree -0.071 -0.850 Sullivan et al., 1999
Dacryodes excelsa Burseraceae Brown Tree -0.164 -1.963 Sullivan et al., 1999
Dacryodes excelsa Burseraceae Brown Tree -0.108 -1.300 Bloomfield and Vogt, 1993
Dacryodes excelsa Burseraceae Brown Tree -0.104 -1.253 Harris, unpublished
Dacryodes excelsa Burseraceae Brown Tree -0.096 -1.150 La Caro, 1985
Dacryodes excelsa Burseraceae Green Tree -0.296 -3.550 Fonte and Schowalter, 2004
Drypetes glauca Euphobiaceae Brown Tree -0.128 -1.540 La Caro, 195
Guarea guidonia Meliaceae Brown Tree -0.097 -1.160 Fonte and Schowalter, 2006
Guarea guidonia Meliaceae Green Tree -0.225 -2.700 Fonte and Schowalter, 2006
Inga vera Fabaceae Brown Tree -0.053 -0.640 La Caro, 1985
Manilkara bidentata Sapotaceae Brown Tree -0.099 -1.190 Fonte and Schowalter, 2004
Manilkara bidentata Sapotaceae Brown Tree -0.063 -0.756 Harris, unpublished
Manilkara bidentata Sapotaceae Green Tree -0.171 -2.050 Fonte and Schowalter, 2004
Microphyllis garciniifolia Sapotaceae Brown Tree -0.043 -0.511 Harris, unpublished
Prestoea montana Arecaceae Brown Palm -0.123 -1.479 Sheils and Yang, unpublished
Prestoea montana Arecaceae Brown Palm -0.082 -0.986 Harris, unpublished
Prestoea montana Arecaceae Green Palm -0.133 -1.600 Bloomfield et al., 1993
Sloanea berteriana Elaeocarpaceae Brown Tree -0.083 -0.900 La Caro, 1985

Luquillo Experimental Forest: Research History and Opportunities 105
(fig. 115). This variability in SOC reflects the heterogeneity in vegetation, soil, and climate resulting from the complex topography of the Luquillo Mountains. For example, rainfall, relative humidity, soil moisture, and wind velocity increase with elevation, whereas air temperature, evapotranspiration, and solar insolation decrease with elevation. The interaction of these climatic factors with vegetation and soils determines the distribution of SOC across the gradients of physical conditions within the Luquillo landscape. Furthermore, Zalamea et al. (2007) showed that decaying wood can also contribute to variability in soil organic matter (SOM) dynamics by changing the relative quantity and quality of different SOM fractions depending on the species and the stage of decomposition. On the other hand, Vogt et al. (1996) reviewed global patterns of SOM accumulation and found that the chemistry of the soil (i.e., soil order) was more important in determining SOM accumulation than climate. Soil orders that were high in aluminum, iron, and clay (e.g., Ultisols, Oxisols) had high total living and dead organic matter accumulations, especially in the tropics. Although continuous fertilization over 7 years in the tabonuco forest of the LEF resulted in increased rates of both litterfall and leaf litter decomposition, fertilization did not affect the SOC pool (Li et al. 2006a). Results suggest, however, that fertilization may enhance long-term C sequestration by enhancing the proportion of the heavy-fraction organic C pool.
In general, soil respiration rates in the LEF decrease with elevation in response to cooler temperatures and more saturated soils (McGroddy and Silver 2000; Harris 2006; Harris et al., in press). The proportion of soil respiration attributable to autotrophic respiration (R
A) versus heterotrophic respiration,
however, has not been well studied in wet tropical forests. In the LEF, Li et al. (2006b) used root exclusion experiments to separate root respiration from heterotrophic respiration in a pine plantation and adjacent secondary forest. The results suggest that the proportion of total soil respiration from root respiration is higher in secondary forest than in pine plantation (69 percent versus 56 percent, respectively). These percentages are generally higher than those reported in broad-leaved forests in the same temperate zone and much higher than those percentages found in a similar study conducted by Silver et al. (2005) in tropical lowland forest soils in the Amazon, where the proportion of root respiration to soil respiration varied from 29 to 35 percent. Nakane et al. (1996) suggest that the proportion of root respiration to soil surface CO
2 efflux may converge to
a proportion of about 50 percent irrespective of forest types, when the cycle of soil C is near a dynamic equilibrium in a forest ecosystem. The fact that root contribution to total soil respiration in the LEF was higher than average values might be explained by analyzing the aggrading stage of both the plantation and the secondary forest.
Figure 115.—Simulated distribution of soil organic carbon storage (0–30 cm depth, (unit: Mg ha-1) in the Luquillo Experimental Forest, Puerto Rico. From Wang et al. (2002).

106 Luquillo Experimental Forest: Research History and Opportunities
Primary ProductivityAfter the pioneer work of Odum (1970a), primary productivity (C fluxes) as an ecosystem process has been studied in the LEF by several authors (Weaver 1986a; Weaver and Murphy 1990; Scatena et al. 1996; Frangi and Lugo 1998; Lugo 1992b, Wang et al. 2003; Harris 2006; Harris et al. 2008; Harris et al., in review) using different methods. Frangi and Lugo (1998) measured aboveground NPP (ANPP) in palm forests before and after the passage of Hurricanes Hugo and Georges and found the ANPP increased from 1.5 Mg C ha-1 (metric tons of C per hectare) before the hurricane passed to 4.6 Mg C ha-1 after the hurricane occurred. Scatena et al. (1996) report ANPP values as high as 20 Mg C ha-1 yr-1 in tabonuco forest with a 5-year mean of 10.8 Mg C ha-1 yr-1. Wang et al. (2003) simulated NPP across the whole LEF using the FOREST-BGC model (Running and Coughlan 1988, Running and Gower 1991). Simulated values ranged from 0.5 to 24 Mg C ha-1 yr-1, with a mean of 9.4 Mg C ha-1 yr-1 (Wang et al. 2003), but very few empirical data were available to validate the model. Harris et al. (in review) measured the photosynthesis and respiration of trees and soil respiration from the lowlands to the top of the Luquillo Mountains and scaled measurements to the landscape level using empirically based modeling techniques. Forest GPP in the LEF ranged from 38 Mg C ha-1 yr-1 at low elevations to 11 Mg C ha-1 yr-1 at high elevations, with a forestwide mean of 29 Mg C ha-1 yr-1 (fig. 116a). Total R
A also
decreased along the elevation gradient, from 27 Mg C ha-1 yr-1 at the lowest elevations to 4 Mg C ha-1 yr-1 at the highest elevations (fig. 116b), and varied slightly over the year in response to changing temperatures. Soil respiration was the highest component of total respiration per unit ground area, and woody stem respiration (Harris et al. 2008) was typically the lowest component. Annual NPP in the LEF ranged from 8 Mg C ha-1 yr-1 at the lowest elevations to a maximum value of 24 Mg C ha-1 yr-1 at the intermediate elevation of 450 m to 6.5 Mg C ha-1 yr-1 at the highest elevations (fig. 116c). Results from all data collected on NPP suggest that forests have the capacity to accumulate biomass after disturbances such as hurricanes at rates sufficient to overcome soil respiration.
Figure 116.—Annual (a) gross primary production, (b) autotrophic respiration, and (c) net primary productivity (metric tons of carbon per hectare per year) for the Luquillo Experimental Forest, Puerto Rico, extrapolated from field measurements. The green areas on each map reflect the four peaks of this mountain system. From Harris et al. (in press).
116a.
116b.
116c.
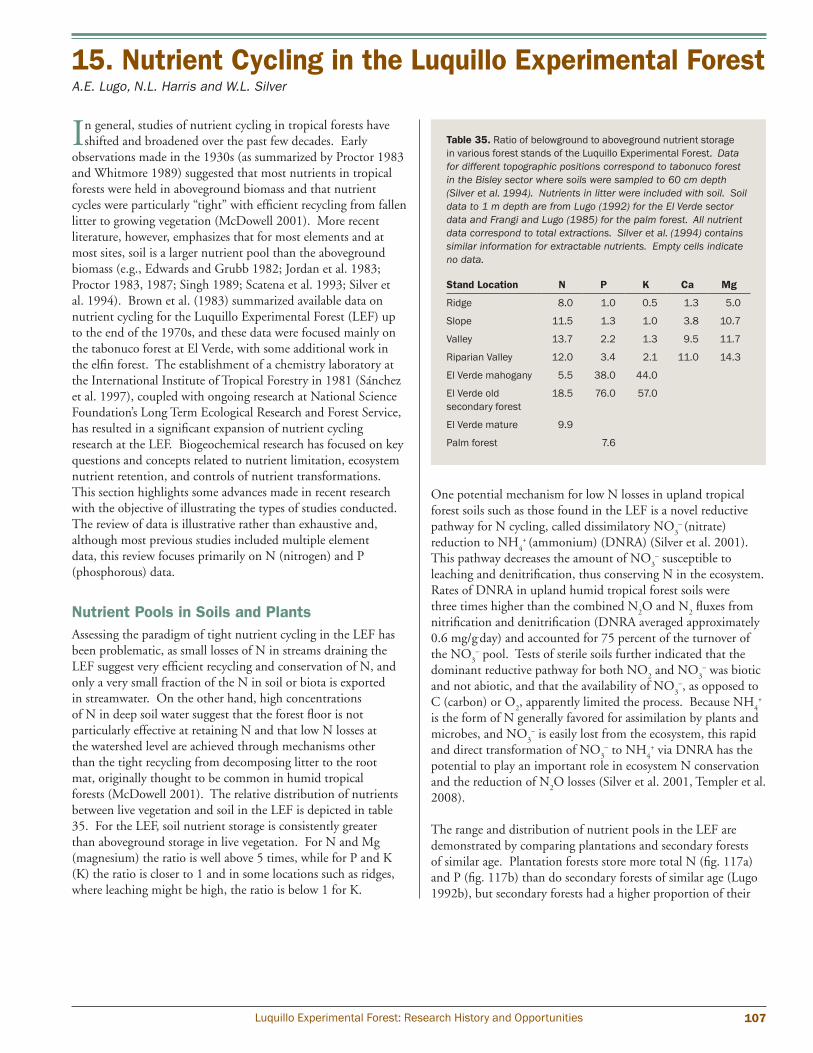
Luquillo Experimental Forest: Research History and Opportunities 107
In general, studies of nutrient cycling in tropical forests have shifted and broadened over the past few decades. Early
observations made in the 1930s (as summarized by Proctor 1983 and Whitmore 1989) suggested that most nutrients in tropical forests were held in aboveground biomass and that nutrient cycles were particularly “tight” with efficient recycling from fallen litter to growing vegetation (McDowell 2001). More recent literature, however, emphasizes that for most elements and at most sites, soil is a larger nutrient pool than the aboveground biomass (e.g., Edwards and Grubb 1982; Jordan et al. 1983; Proctor 1983, 1987; Singh 1989; Scatena et al. 1993; Silver et al. 1994). Brown et al. (1983) summarized available data on nutrient cycling for the Luquillo Experimental Forest (LEF) up to the end of the 1970s, and these data were focused mainly on the tabonuco forest at El Verde, with some additional work in the elfin forest. The establishment of a chemistry laboratory at the International Institute of Tropical Forestry in 1981 (Sánchez et al. 1997), coupled with ongoing research at National Science Foundation’s Long Term Ecological Research and Forest Service, has resulted in a significant expansion of nutrient cycling research at the LEF. Biogeochemical research has focused on key questions and concepts related to nutrient limitation, ecosystem nutrient retention, and controls of nutrient transformations. This section highlights some advances made in recent research with the objective of illustrating the types of studies conducted. The review of data is illustrative rather than exhaustive and, although most previous studies included multiple element data, this review focuses primarily on N (nitrogen) and P (phosphorous) data.
Nutrient Pools in Soils and PlantsAssessing the paradigm of tight nutrient cycling in the LEF has been problematic, as small losses of N in streams draining the LEF suggest very efficient recycling and conservation of N, and only a very small fraction of the N in soil or biota is exported in streamwater. On the other hand, high concentrations of N in deep soil water suggest that the forest floor is not particularly effective at retaining N and that low N losses at the watershed level are achieved through mechanisms other than the tight recycling from decomposing litter to the root mat, originally thought to be common in humid tropical forests (McDowell 2001). The relative distribution of nutrients between live vegetation and soil in the LEF is depicted in table 35. For the LEF, soil nutrient storage is consistently greater than aboveground storage in live vegetation. For N and Mg (magnesium) the ratio is well above 5 times, while for P and K (K) the ratio is closer to 1 and in some locations such as ridges, where leaching might be high, the ratio is below 1 for K.
15. Nutrient Cycling in the Luquillo Experimental ForestA.E. Lugo, N.L. Harris and W.L. Silver
One potential mechanism for low N losses in upland tropical forest soils such as those found in the LEF is a novel reductive pathway for N cycling, called dissimilatory NO
3–
(nitrate)
reduction to NH4
+ (ammonium) (DNRA) (Silver et al. 2001). This pathway decreases the amount of NO
3– susceptible to
leaching and denitrification, thus conserving N in the ecosystem. Rates of DNRA in upland humid tropical forest soils were three times higher than the combined N
2O and N
2 fluxes from
nitrification and denitrification (DNRA averaged approximately 0.6 mg/g.day) and accounted for 75 percent of the turnover of the NO
3– pool. Tests of sterile soils further indicated that the
dominant reductive pathway for both NO2 and NO
3– was biotic
and not abiotic, and that the availability of NO3
–, as opposed to C (carbon) or O
2, apparently limited the process. Because NH
4+
is the form of N generally favored for assimilation by plants and microbes, and NO
3– is easily lost from the ecosystem, this rapid
and direct transformation of NO3
– to NH4
+ via DNRA has the potential to play an important role in ecosystem N conservation and the reduction of N
2O losses (Silver et al. 2001, Templer et al.
2008).
The range and distribution of nutrient pools in the LEF are demonstrated by comparing plantations and secondary forests of similar age. Plantation forests store more total N (fig. 117a) and P (fig. 117b) than do secondary forests of similar age (Lugo 1992b), but secondary forests had a higher proportion of their
Stand Location N P K Ca Mg
Ridge 8.0 1.0 0.5 1.3 5.0
Slope 11.5 1.3 1.0 3.8 10.7
Valley 13.7 2.2 1.3 9.5 11.7
Riparian Valley 12.0 3.4 2.1 11.0 14.3
El Verde mahogany 5.5 38.0 44.0
El Verde old secondary forest
18.5 76.0 57.0
El Verde mature 9.9
Palm forest 7.6
Table 35. Ratio of belowground to aboveground nutrient storage in various forest stands of the Luquillo Experimental Forest. Data for different topographic positions correspond to tabonuco forest in the Bisley sector where soils were sampled to 60 cm depth (Silver et al. 1994). Nutrients in litter were included with soil. Soil data to 1 m depth are from Lugo (1992) for the El Verde sector data and Frangi and Lugo (1985) for the palm forest. All nutrient data correspond to total extractions. Silver et al. (1994) contains similar information for extractable nutrients. Empty cells indicate no data.

108 Luquillo Experimental Forest: Research History and Opportunities
N and P stored in roots (fig. 118a,b) than did plantation forests of similar age (fig. 119a,b). Plantation forests stored most of their N and P in woody parts, and pine plantations had a higher proportion of their N and P stored in leaves than did secondary forests and mahogany plantations (fig. 119a,b).
Ridge vegetation also contains higher nutrient levels than vegetation found at other topographic positions. Silver et al. (1994) found that soil nutrient storage was generally linearly correlated to soil organic matter (SOM), although the level of correlation changed with topographic position. They compared soils in the Bisley Experimental Watersheds with other tropical montane forests and found that for Ca (calcium), Mg
(magnesium), and K the soil storage was within the range for other forests, while P tended to be higher and N tended to be lower than in other tropical montane forest soils.
The importance of understory palms, bark, and branches as sinks of N and P after the passage of Hurricane Hugo is illustrated by the distribution of N and P in aboveground biomass of a tabonuco forest at Bisley (fig. 120). Bacteria and fungi are also important N and P sinks in the tabonuco forest, as are bryophytes in palm forests (fig. 121a,b). Animals, saplings, and herbaceous plants are minor sinks of N and P in tabonuco forests.
Figure 117.—Total nitrogen (a) and phosphorus (b) in paired plantations and secondary forests of similar age in the Luquillo Experimental Forest (LEF). Data include aboveground and belowground biomass. Forest location refers to different sectors of the LEF. Data are from Lugo (1992).
117a.
117b.
Figure 118.—Distribution of total nitrogen (a) and total phosphorus (b) in secondary forests in the Luquillo Experimental Forest (LEF) (Lugo 1992b). Forest location refers to different sectors of the LEF. The actual size of the nitrogen or phosphorous pool is given inside each bar in kilograms per hectare.
118a.
118b.

Luquillo Experimental Forest: Research History and Opportunities 109
Figure 119.—Distribution of total nitrogen (a) and total phosphorus (b) in plantation forests in the Luquillo Experimental Forest (Lugo 1992b). The plantation species are Pinus caribaea (pine), Swietenia macrophylla (mahogany, age 17 yr), and Swietenia macrophylla X S. mahagoni (mahogany, age 49 yr). The actual size of the N or P pool is given inside each bar in kilograms per hectare.
119a.
119b.
Figure 120.—Distribution of nitrogen and phosphorus in the vegetation of Bisley Experimental Watersheds in the Luquillo Experimental Forest after the passage of Hurricane Hugo in 1989. Data are from Scatena et al. (1993). These data reflect the mean for two watersheds covering 13 ha.
Figure 121.—Nitrogen (a) and phosphorus (b) pools in organisms other than trees in tabonuco and palm floodplain (bryophytes) forests in the Luquillo Experimental Forest. Data are from Lugo and Scatena (1995), Lodge (1996a), Frangi and Lugo (1992), Scatena et al. (1993), and Beard et al. (2002).
121a.
121b.
An extensive study of belowground nutrient pools and soil physical properties was conducted in the Bisley Experimental Watersheds before and after Hurricane Hugo occurred. Two watersheds covering 13 hectares (ha) were sampled every 40 meters (m) using small quantitative pits, and soils were analyzed using multiple extraction procedures. These data, together with detailed studies of plant species composition, tree diameter and height, allometry, and chemical composition showed how nutrients were distributed spatially across the landscape, within and across species, and aboveground and belowground (Scatena et al. 1993, Silver and Vogt 1993, Silver et al. 1994). The spatial patterns of nutrient distribution showed that most soil nutrients pools increased along a gradient from ridges to

110 Luquillo Experimental Forest: Research History and Opportunities
valley bottoms, while plant nutrient pools decreased along the topographic gradient. The change in plant nutrient content was due to a decrease in biomass from ridges to valleys. These studies demonstrated that there is a considerable plant-available capital and total nutrient capital of most elements in Bisley soils, with the possible exception of K and P (table 35). In the case of P, the most commonly limiting nutrient to plant growth in highly weathered tropical soils, the size of extractable soil pools and aboveground plant pools were approximately the same (Silver et al. 1994). The total N and P pools in soil were larger than their corresponding pool in aboveground vegetation (table 35).
Although nutrient pools have been studied extensively at specific sites within the LEF (e.g., the Bisley Experimental Watersheds), spatial models have the advantage of scaling point-specific data over the landscape. Wang et al. (2002) developed a spatially explicit version of the CENTURY soil model (Parton et al., 1987, 1988, 1989) to characterize the spatial patterns of soil N pools and N mineralization rates in the LEF as a function of climate, vegetation, and soils. Model results indicate large variations in soil N pools (fig. 122) and N mineralization rates along elevational and topographic gradients over the LEF. As elevation increases, pools of soil total N increase. On the other hand, N mineralization rates peak in middle elevations and then decrease as elevation increases. Total N pools decrease along a topographic gradient from ridge to valleys (e.g., near riparian zones). Model results suggest, however, that N mineralization rates have no significant topographic variation over the LEF. Precipitation and clay content appear to be the major factors that determine the elevational and topographic gradients of soil N pools and N mineralization rates in the LEF.
Nutrient FluxesThe range of N and P flux rates at the LEF is illustrated in figure 123. The fastest fluxes are associated with primary productivity, uptake, and return of nutrients to the forest floor. Fluxes associated with water (throughfall and enriched throughfall) and retranslocation had intermediate rates, while fluxes associated with normal rainfall and N gas exports had the lowest rates. Ingestion by the common frog Eleutherodactylus coqui had the same N flux rate as watershed export, but watershed export was higher in P export at high elevations.
Figure 122.—Distribution of simulated soil total nitrogen (0 to 30 cm) in the Luquillo Experimental Forest, Puerto Rico (Unit: t ha-1). From Wang and Hall (2004).
Figure 123.—Nitrogen (a) and phosphorus (b) fluxes in various locations in the Luquillo Experimental Forest. Rainfall and throughfall data are from Heartsill Scalley et al. (2007); watershed output data and fruitfall data are from Frangi and Lugo (1985) and Lewis et al. (1999); coqui data are from Beard et al. (2002); retranslocation, uptake, and NPP (net primary productivity) data are from Lugo (1992); return to forest floor data are for Hernandia sonora in Cuevas and Lugo (1998).
123a.
123b.

Luquillo Experimental Forest: Research History and Opportunities 111
A tabonuco stand at El Verde was continuously fertilized for 7 years with quarterly additions of nutrients at an annual equivalence rate of kg ha-1 (kilograms per hectare) 300 N, 100 P, 100 K, and (kg ha-1) 8 boron, 15.4 copper, 2.2 Fe (iron), 25 Mn (manganese), 26 zinc, and 19 Mg. Li et al. (2006a) measured several ecosystem attributes, found that fertilization may enhance long-term C sequestration in forest soils, and reported three significant responses among the measured attributes (fig. 124).
Nutrient BudgetsInput-output budgets for the Luquillo Mountains show that the site is a net exporter of most elements, with both high weathering rates and relatively large elemental inputs from precipitation due to the influence of marine aerosols (McDowell and Asbury 1994).
Chestnut et al. (1999) quantified inputs, outputs, and internal fluxes of N for a hillslope in the tabonuco forest type of the LEF (table 36), improving the one reported in Brown et al. (1983). The budget highlights the effects of disturbance, gaseous and groundwater losses, and atmospheric deposition. Because data
Figure 124.—Response of annual litterfall, leaf decomposition constant, and fungal biomass in fertilized and control plots in a wet forest located in the El Verde sector of the Luquillo Experimental Forest (Li et al. 2006a). Differences are all significant. Fungal biomass was to 25 cm depth.
Externalinput
Outflows Biomassaccumulation
Internal flux
Precipitation1 4Dry deposition 0-2a
Geological weathering 0b
Nitrogen fixation ?Total inputs 4-6 + ?
Groundwater2, 3 5-11Particulate organic N losses3 0.3-0.7Gaseous N losses4, 5 1-4Total outputs 6.3-15.7
Aboveground biomass accumulation6, 7, 8 6Belowground biomass accumulation6, 7, 8 2Total biomass accumulation 8
Whole tree mortality5, 9 18Coarse woody debris (branchfall) 6, 10 6Coarse root turnover5, 10 1Fine litterfall7, 11 101-103Fine root turnover6, 12, 13 17Net throughfall1, 14, 15 3
Total N Uptake Requirement 154-156c
Table 36. Fluxes of nitrogen (kg ha-1yr-1) in a hillslope tabonuco forest in the Luquillo Experimental Forest. Data reported as ranges of published values. From Chestnut et al. (1999).
1McDowell et al. 1990; 2McDowell et al. 1992; 3McDowell and Asbury 1994; 4Erickson in prep.; 5Chestnut et al. 1999; 6Scatena et al. 1993; 7Weaver and Murphy 1990; 8Crow 1980; 9Lugo & Scatena 1996; 10Vogt et al.; 11Lodge et al.; 12Silver and Vogt 1993; 13Vogt et al. 1995; 14McDowell 1998; 15Scatena 1990.aEstimates potential range based on dry deposition rates at other sites.bEstimate based on basin geologic characteristics.cTotal N uptake requirement equals biomass accumulation and internal flow.

112 Luquillo Experimental Forest: Research History and Opportunities
for aboveground and belowground N fixation are lacking, the budget is unbalanced by 8.3 to 19.7 kg N ha-1 yr-1 (kilograms of N per hectare per year) suggesting that inputs from N fixation may be a large fraction of total N inputs to this forest type. They also found that N storage in soils and vegetation is very large relative to inputs and outputs and that the soil N pool to 0.6 m depth is an order of magnitude larger than the vegetation pool (7,488 versus 754 kg ha-1 in belowground versus aboveground pools, respectively). Internal fluxes of N in throughfall and soil solution are also large relative to inputs and outputs, suggesting that this forest type is a N-rich system with considerable control over N losses in streamwater.
Cusack et al. (2009) added values for N-fixation for soil, forest floor, and surface and canopy lichens, epiphylls, and mosses for both the tabonuco and palo colorado forest zones. The relative rates of biological N-fixation were highest for the mosses (up to 26 ± 14 µg N m-2 h-1 (micrograms of N per square meter per hour)), but most of N fixed on a mass basis came from soils due to the large volume of potential N fixing sites (7.2 ± 1.7 kg N ha-1 yr-1 (kilograms of N per hectare per year) in the tabonuco forest and 3.4 ± 1.2 kg N ha-1 y-1 in the palo colorado forest). Overall, N inputs via biological N fixation amounted to approximately 12.3 ± 2.7 kg N ha-1 y-1 in the tabonuco forest and 8.4 ± 1.4 kg N ha-1 y-1 in the palo colorado forest. In the tabonuco forest the inputs via N fixation are within the range of the missing N in the Chestnut et al. (1999) budget, but insufficient to balance the N budget in the upper elevation forest.
The K pools and fluxes illustrate the opposite end of the spectrum, with large K stores in aboveground biomass relative to the exchangeable pool in soils, and little change in K flux as water moves through the soil profile and is lost from the ecosystem as streamflow.
The P budget of a palm floodplain forest at 750 m elevation in the LEF (fig. 125) shows that despite internal conservation mechanisms (Frangi and Lugo 1985), the forest exported about 5 kg P ha-1 yr-1 (kilograms of Phosphorus per hectare per year) in excess of inputs from rainfall and overland litter input. Export rates were about nine times higher than rainfall input rates. Soil up to 1 m depth contained seven times the amount of P in vegetation, and, with only 0.5 percent of the soil P accumulation, it was still enough to supply the annual growth requirements of the forest. An estimated 0.58 g m-2 yr-1 of P inputs to the forest would be required to maintain a steady state (Frangi and Lugo 1985).
High deposition rates of mercury (Hg) were shown for the LEF by Shanley et al. (2008), who reported on 2 years of wet Hg deposition at Río Icacos in the LEF. Despite receiving unpolluted air masses off the Atlantic Ocean from northeasterly trade winds, the site averaged 27.9 µg m-2 yr-1 wet Hg deposition, or about 30 percent more than Florida and the Gulf Coast,
the highest deposition areas of the United States. These high Hg deposition rates are driven in part by high rainfall, which averaged 2,855 mm yr-1 (millimeters per year). The volume-weighted mean Hg concentration was 9.8 ng L-1, somewhat lower than the Southeastern United States, but high concentrations occurred even in high-rainfall weeks; there was no significant relation between Hg concentration and weekly rainfall depth. During a 2-month period, they measured atmospheric concentration and speciation of Hg at sea level and on a mountain ridge (750 m elevation) above the deposition station (476 m elevation). Particulate Hg and reactive gaseous mercury (RGM) concentrations were low, consistently less than 12 pg m-3. Given this apparent lack of RGM at ground level to support the high wet Hg deposition, they suggest that RGM is being scavenged by precipitation and cloud water either after formation in the mixing layer, or by high cloud tops scavenging RGM from above the mixing layer. Photo oxidation of Hg
0 from the global
pool is likely more intense in the tropics and helps to maintain a pool of RGM. Data showed a low fraction of methylmercury (MeHg) in streamwater (0.7 percent). Total mercury (THg) (MeHg) concentrations and export were dominated by particulate fraction in association with DOC at high flows, with maximum concentrations of 112 (75) ng L-1. Mercury export was episodic in response to discharge increase. Bromeliad water, which has a best-case scenario for methylation, was collinear with stream samples on the filtered THg versus DOC plot. There did not appear to be any Hg, C, sulfur, or bacterial limitations for methylation in bromeliads. The low percentage of MeHg in streamwater is probably due to high rates of demethylation.
Figure 125.—Phosphorus budget for a palm (Prestoea montana) floodplain forest at 750 m elevation in the Luquillo Experimental Forest (Frangi and Lugo 1985).

Luquillo Experimental Forest: Research History and Opportunities 113
Soil O2 (oxygen) is another critical resource for plant and
microbial processes and plays an important role in ecosystem-level biogeochemical cycling (Gambrell and Patrick 1978, Crawford 1992). Reduced O
2 availability can change the
composition and activity of soil microbial communities (Morris 1984, Magnusson 1992, 1994), lower redox potential (Gambrell and Patrick 1978, Hook 1984), and alter nutrient availability and utilization (Drew 1991, Crawford 1992, Silver et al. 1994). Studies in the LEF have shown that surface soils in wet forests experience very low soil C availability for all or part of the year (Silver et al. 1999, McGroddy and Silver 2000). These studies identified high clay soils, perhumid conditions, high microbial activity, and warm temperatures as mechanisms that lead to rates of O
2 consumption that exceed diffusional resupply, creating
anaerobic conditions that lead to nitrous oxide (N2O) and
methane (CH4) emissions.
Soil O2 concentrations along a rainfall and elevation gradient
and along topographic gradients in the LEF were measured by Silver et al. (1999). Along the rainfall gradients at the LEF, soil
O2 availability decreases significantly with increasing annual
rainfall and reached very low levels (<3 percent) in individual chambers for up to 25 consecutive weeks over the 82 weeks of the study (fig. 126). Along localized topographic gradients, soil O
2 concentrations are more variable and decrease significantly
from ridges to valleys (fig. 127). In the valleys, soil O2 was
frequently less than 3 percent (ambient O2 is 21 percent). Cross
correlation analyses showed that soil O2 concentrations have
significant positive correlation along the topographic gradient, and are sensitive to rainfall and hydrologic output. Soil O
2
concentrations in valley soils are correlated with rainfall from the previous day, while ridge sites were correlated with cumulative rainfall inputs over 4 weeks.
Because methane (CH4) is so readily oxidized in the presence of
O2, above-ambient CH
4 concentrations and efflux are perhaps
the best indicators of strongly reducing conditions in soils (Gambrell and Patrick 1978). Methane concentrations in the elfin and palo colorado forests averaged above ambient levels in the study by Silver et al. (1999), and exceeded ambient levels by
Figure 126.—Mean soil O2 concentrations (±1 standard error) over time at (A) 10 cm depth and (B) 35 cm depth in the upper elevation cloud forest, mid-elevation palo colorado forest and lower elevation tabonuco forest in the Luquillo Experimental Forest, Puerto Rico. From Silver et al. (1999).
Figure 127.—Average soil O2 concentrations at (a) 10 cm depth and (b) 35 cm depth on ridges (open circles), slopes (triangles), and valleys (squares) in the Bisley Research Watersheds. Error bars were excluded for clarity; soil O2 content decreases significantly from ridges to slopes to valleys. From Silver et al. (1999).

114 Luquillo Experimental Forest: Research History and Opportunities
more than four orders of magnitude in the elfin forest, indicating a strong influence of anaerobic processes at these elevations. In fact, methane emissions from sites with low O
2 concentrations
in the LEF were shown to be equal in magnitude to methane emissions from natural wetlands (Teh et al. 2005).
Controls on CH4 dynamics have been studied extensively in
the LEF (Teh et al. 2005, Teh and Silver 2006, Teh et al. 2006, Teh et al. 2008) and have shown that CH
4 oxidation through
anaerobic respiration is the dominant control on CH4 fluxes
from these forests. Methane production occurred even in relatively well-aerated soils, due to the high degree of aggregation typical of these iron and aluminum oxide clays. The dominance of iron reducers in these soils has the potential to inhibit methanogenesis through competition for acetate as the primary substrate for iron or C reduction, but soil structure is likely to physically separate these two groups of microbes, allowing both processes to occur under natural conditions (Teh and Silver 2006, Teh et al. 2008). Other measures of biogeochemical function such as SOM content and P availability are sensitive to chronic O
2 depletion along the rainfall gradient, but less sensitive
to the variable soil O2 environment exhibited at lower elevations
along topographic gradients (Silver et al. 1999).
Stream O2 concentrations provide an indication of ecosystem
metabolism, and they were measured in a stream within the Bisley Experimental Watersheds by Mulholland et al. (2001) as part of a larger study across streams of North America. Rates of gross primary productivity (GPP) and R in streams (in units of g O
2 m-2 d-1) were established by measuring diurnal changes in
dissolved O2 in open systems. The Bisley site showed no evidence
of GPP, and the rate of net ecosystem production (NEP) was highly negative and somewhat variable, with no diurnal trend (fig. 128). These highly negative NEP values emphasize the importance of allochthonous (external to the stream) sources of C in fueling heterotrophic metabolism.
Nutrient Use EfficiencyThe ecosystems of the LEF are generally nutrient rich and exhibit low N use efficiency (Lugo 1992b, Scatena et al. 1996). These ecosystems exhibit numerous nutrient conservation mechanisms, especially considering the heavy rainfall to which they are exposed (Lugo and Scatena 1995). These conservation mechanisms are illustrated here (fig. 129) with ratios of organic matter to P, known as nutrient use efficiencies (NUE). Three different estimates of NUE are illustrated: ratios of mass fall to P in mass for leaf and litterfall, ratios of aboveground biomass to aboveground P, and ratios of P stored by net primary productivity to P taken up by roots. For illustrative purposes, data are shown for tabonuco (successional and mature stands), palm, and plantation forests of many species. For comparison, we show in red the mean NUE for litterfall in tropical forests. Most values in figure 129 are larger than the mean values for
Figure 128.—Daily rates of gross primary productivity (GPP), total respiration (R), and net ecosystem production (NEP) in eight streams across North America. Streams are ordered from lowest (left) to highest latitude (right); Quebrada Bisley (QBPR) is located in the Luquillo Experimental Forest and is the only tropical site, see inset map. Values on bars in (c) are GPP:R ratios. From Mulholland et al. (2001).

Luquillo Experimental Forest: Research History and Opportunities 115
many tropical forests, indicating higher use efficiency. Low NUE is associated with fruitfall; leaffall after the passage of Hurricane Hugo; leaffall of Hernandia sonora, a planted native tree species; and biomass accumulation in tabonuco forests’ riparian and valley locations at the Bisley Experimental Watersheds. Some species such as plantations of mahogany, eucalyptus, and pines (two species) exhibit high NUE, as does the fall of highly senesced brown palm fronds at high elevation in the LEF. Secondary forests had lower NUE than paired plantation species. High fine root biomass and rapid root regrowth after Hurricane Hugo occurred have also been cited as important nutrient conservation mechanisms in this forest (Silver and Vogt 1993, Silver et al. 1996).
Changes in Carbon and Nutrients With ElevationLess work has been done on the elevation gradient regarding nutrient pools compared with, for example, variations in community structure or C fluxes. As mentioned in an earlier paragraph, phosphorus is thought to be the most commonly
limiting element to net primary productivity in tropical forests on highly weathered soils such as those in the LEF. McGroddy and Silver (2000) measured soil P and C fractions at five sites along the elevation gradient and found that total P was generally higher in low- to mid-elevation soils than in upper elevations where high rainfall is likely to augment leaching losses. Soil P at low- to mid-elevations was associated predominantly with iron and aluminum oxides, which are generally thought to be relatively unavailable to plants, while P in soil at higher elevations was more likely to be associated with organic matter. The variable redox dynamics of wet tropical forest soils, however, have the potential to release P bound to iron oxides and contribute to plant and microbial nutrient cycling. Work in the LEF has documented significant P release during intermediate and low redox events (Chacón et al. 2006, Liptzin and Silver 2009). The reduction of iron oxides and hydroxides during these events is also likely to be responsible for significant CO
2 efflux
from soils (Chacón et al. 2006, Liptzin and Silver 2009).
Richardson et al. (2000a) constructed preliminary budgets of tank bromeliads along an elevation gradient and found that they
Figure 129.—Nutrient use efficiency (NUE; ratio of organic matter to P) for tabonuco (successional and mature stands), palm, and plantation forests of many species. For comparison, the mean NUE for litterfall in tropical forests is shown in red. Compiled by A. Lugo.
0 2000 4000 6000 8000 10000
Fruit fall palm forest Litterfall Hernandia sonora
Flower fall palm forest Leaffall post-hurricane Bisley
NPP/Uptake Sabana secondary Litterfall Hibiscus elatus
Leaffall pre-hurricane Bisley Green-yellow palm leaves leaffall
Litterfall Terminalia ivorensis Mean tropical forest litterfall
Litterfall Anthocephalus chinensis NPP/Uptake Cubuy secondary Aboveground biomass valleys
NPP/Uptake El Verde secondary All litter fall palm forest Litterfall Khaya nyasica
Branchwood fall palm forest Litterfall Pinus caribaea
Litterfall Swietenia macrophylla NPP/Uyptake pine 4-yr
NPP/Uptake Guzman secondary Litterfall Eucalyptus patentinervis
Litterfall Pinus elliottii NPP/Uptake pine 18.5-yr
Dicotyledonous leaffall palm forest Aboveground biomass riparian valleys
Litterfall Eucalyptus saligna NPP/Uptake mahogany 17-yr
Watershed-level aboveground biomass Bisley NPP/Uptake mahogany 49-yr Aboveground biomass slopes Aboveground biomass ridges Miscellaneous fall palm forest
Brown palm leaves leaffall
kg Organic Matter / kg Phosphorus

116 Luquillo Experimental Forest: Research History and Opportunities
exported between 93 and 96 percent of the N and between 74 and 97 percent of the P entering the system. The elfin forest bromeliads retained the most P of the three forests studied. Richardson et al. (2000a) studied an elevation gradient of nutrient inputs to tank bromeliads, the concentration, storage, and turnover of nutrients and biomass of these bromeliads, and the diversity, nutrient, and biomass content of animal inhabitants of tank bromeliads. They found that the nutrient concentration of canopy-derived debris declined with elevation and that at the elfin forest bromeliads had the lowest amounts of debris per plant and lowest concentrations of nutrients in these debris components. The elfin forest had the highest turnover rate and density of bromeliads, however, and thus accounted for 12.8 percent of forest net primary productivity (0.48 Mg ha-1 yr-1 (metric tons per hectare per year)) and contained 3.3 Mg ha-1 of water. Total N and P storage in bromeliads was low in tabonuco forest and increased above the cloud condensation level in palo colorado and elfin forests (fig. 130). The bromeliad microcosm is nutrient abundant and accumulates less than 5 percent of most nutrients passing through, with the exception of elfin
forest bromeliads, which accumulated about 25 percent of the inputs. Within this microcosm, most of the N and P were stored in plant tissue and water, with lower amounts in animals and debris, and generally higher values at elfin forests (fig. 131).
Tropical elevation gradients are a convenient surrogate for climate change studies. The humid elevation gradient in the LEF has been used to examine relationships among climate, edaphic conditions, belowground C storage, and soil respiration rates (McGroddy and Silver 2000). Total soil C, the light C fraction, and all component fractions of the P pool were significantly related to soil moisture, and all but total soil C
Figure 130.—Total nitrogen (a) and phosphorus (b) storage in tank bromeliads along an elevation gradient in the Luquillo Experimental Forest. Forests are arranged from low elevation to the top of the mountain (Richardson et al. 2000a). The cloud condensation level is above the tabonuco forest.
130a.
130b.
Figure 131.—Nitrogen (a) and phosphorus (b) storage of compartments of tank bromeliads along an elevation gradient in the Luquillo Experimental Forest. Forests are arranged from low elevation to the top of the mountain (Richardson et al. 2000a). The cloud condensation level is above the tabonuco forest.
131a.
131b.

Luquillo Experimental Forest: Research History and Opportunities 117
were also significantly related to temperature along the gradient, but few patterns followed an expected linear trend. Both labile and recalcitrant soil P fractions were negatively correlated to the labile C pool (light C fraction), while the dilute hydrochloride-extractable P pool, generally thought of as intermediate in availability, was positively correlated to light C suggesting that P may play an important role in C cycling in these systems. Total fine root biomass was greatest at 1,000 m elevation and lowest at 150 m elevation, and was strongly positively correlated with soil moisture content. Soil respiration rates showed significant negative correlation to fine root biomass and to the light C fraction. In forested sites, soil respiration rates had a strong negative correlation to total belowground C pools (soils + roots + forest floor). Belowground C pools did not follow the expected increasing trend with decreases in temperature along the gradient. The results indicate relationships in wet forests among soil C and nutrient pools, soil respiration rates, and climate are complex. Frequent and prolonged anaerobic events may be important features of these environments that help explain the observed trends (McGroddy and Silver 2000).
Effects of Disturbance on Nutrient Pools and FluxesBiogeochemical response to hurricanes was rapid but short lived. Losses of most nutrients declined to predisturbance levels in 1.5 to 2.5 years (McDowell et al. 1996, Schaefer et al. 2000), most likely associated with forest regrowth (McDowell et al. 1996). The elements most affected by hurricane disturbance were those with significant biotic control over concentrations: N and K were most responsive to disturbance, and sodium and silica the least responsive (McDowell et al. 1996). NO
3 concentrations
increased approximately four-fold over background concentrations, but the peak was short lived (fig. 132).
In a palm floodplain forest after the passage of Hurricane Hugo, the combined instantaneous and delayed hurricane-induced P fluxes to the forest floor were 3.3 times higher than the normal flux (compare fig. 125 with fig. 133b). The high nutrient flux to the forest floor was due to wind-induced mass transfer to the ground (fig. 133), and the high concentration of nutrients in
Figure 132.—Monthly average nitrate-N concentrations in Quebrada Prieta before and after Hurricane Hugo occurred (September 1989; marked by an arrow). Data are originally from Schaefer et al. (2000) but replotted in McDowell (2001).
Figure 133.—Transfer by Hurricane Hugo of mass (a) nitrogen (b) and phosphorus (c) from aboveground and upland forests to the forest floor of a palm (Prestoea montana) floodplain forest at 750-meter elevation in the Luquillo Experimental Forest. Tanks represent the accumulation in Mg ha-1 (metric tons per year) for mass and kg ha-1 (kilograms per acre) for nutrients. Dotted lines connect aboveground live accumulation before the hurricane in 1989 to tanks depicting the corresponding accumulation after the hurricane in 1990. Solid lines depict transfer of mass or nutrients to necromass and as import or export to and from the forest floor. Fluxes after the disturbance event are reported in Mg ha-1 and kg ha-1 for nutrients (Frangi and Lugo 1991).

118 Luquillo Experimental Forest: Research History and Opportunities
that mass was because it was mostly live mass as opposed to the senesced biomass that normally falls. Frangi and Lugo (1991) found that 10 percent of the aboveground biomass and 12 to 16 percent of the nutrients (depending on which nutrient) were transferred to the ground after the event. About 18 percent of the nutrient pool was found as necromass 7 months after the hurricane passed (table 37). This was 10.7 times greater than the prehurricane ratio.
The disturbance effects caused by harvesting aboveground biomass and Hurricane Hugo on soil chemical and physical properties and live and dead root biomass have been studied for more than 13 years in the Bisley Experimental Watersheds. The goal of these studies was to (1) quantify nutrient loss and retention following aboveground disturbance, (2) identify nutrient conservation mechanisms, and (3) determine how aboveground and belowground processes changed at different temporal scales including the period immediately before revegetation (9 weeks), the intermediate period of initial regrowth (9 months), and the longer term reorganization of the vegetation and biogeochemical cycling (>1 year). Harvesting aboveground biomass resulted in temporary increases in the availability of exchangeable nutrients, but forest floor and soil nutrient pools had generally returned to preharvest values over a 9-week period. Significant amounts of K moved through the soil over this time period, amounting to 29 to 46 kg/ha, and resulted in a size reduction of the exchangeable soil K pool. The hurricane deposited approximately 845 kg ha-1 of forest floor mass and considerable nutrients on the soil surface, and increased soil NO
3-N (nitrate-nitrogen) and exchangeable K pools, but
ComponentTotal aboveground
(kg ha-1)Necromass (% of total)
Biomass 198,100 18
Nitrogen 1047 19
Phosphorus 67 18
Potassium 817 17
Calcium 711 23
Magnesium 192 16
Table 37. Fraction of aboveground nutrients and mass in necromass 7 months after the passage of Hurricane Hugo in a floodplain forest in the Luquillo Experimental Forest (Frangi and Lugo 1991).
pool sizes always returned to prehurricane values within 9 months. Examination of the data on an annual time step over a 6-year period revealed an increase in soil cation pools and a significant decrease in soil pH. No change in SOM was detected at any time step following the disturbances. Live fine root biomass was dramatically reduced as a result of the hurricane’s disturbance, and was only beginning to show signs of recovery at the 6-year point of the experiment (Silver et al. 1996). In general, root biomass, relatively slow root decomposition, and maintenance of organic matter pools function to conserve nutrients following disturbance in this ecosystem.
The effects of road disturbance and subsequent succession on nutrient pools were studied in the upper montane forests of the LEF (Olander et al. 1998). They found that recently disturbed sites had higher Al (aluminum) and soil O
2 than older
successional sites and intact forest. Forest vegetation appeared to be uniquely adapted to low redox conditions of the older sites. Abandoned roads, which ranged in age since abandonment from 4 to 60 years, had litter and soil characteristics similar to their adjacent forest areas after 11 years (Heyne 2000). Net N mineralization (g g-1 dry soil) and percent SOM were not different between abandoned roads and adjacent forest, while soil pH required more than 60 years of abandonment for recovery to forest conditions.
Epiphytes generally occupy arboreal perches, which are inherently unstable environments due to periodic windstorms, branch falls, and treefalls. During high wind events, arboreal bromeliads are often knocked from the canopy and deposited on the forest floor. Pett Ridge and Silver (2002) tested the effects of displacement on the common bromeliad Guzmania berteroniana using a reciprocal transplant experiment to and from trees and the forest floor. Although survival rates were relatively high in all habitats, bromeliads transplanted to trees grew significantly longer roots (189 ± 43 cm) than those moved to the forest floor (53 ± 15 cm), and bromeliads transplanted to trees also experienced lower rates of leaf area loss. All transplanted bromeliads rapidly altered the substrate they occupied. Individuals transplanted to and among trees rapidly decreased base cation concentrations, but significantly increased P concentrations of their underlying substrate. On the ground, bromeliads increased C, N, and P concentrations within 9 months of placement. These results suggest that in this montane forest, bromeliads respond rapidly to displacement, can locally modify their substrates, and can access the resources needed for survival regardless of habitat.

Luquillo Experimental Forest: Research History and Opportunities 119
Historical Economy in Puerto RicoAfter the arrival of the Spanish in 1493, the economy of Puerto Rico was dominated by gold mining. At the end of the 16th century, the human population was less than 4,000. By 1776, the population had grown to more than 80,000, and agriculture was still just a minor activity in a landscape dominated by forests (Dietz 1986). During the 19th century, however, changes accelerated. Puerto Rico’s population exhibited a 10-fold increase (fig. 134a), and agriculture (sugarcane, coffee, plantain, corn, cotton, and rice) spread throughout the island (Dietz 1986). Even though political control of Puerto Rico shifted from Spain to the United States in 1898, socioeconomic conditions did not change during the ensuing decades. Until 1940, Puerto Rico’s economy resembled that of most Neotropical countries. Pastureland, the most common type of land use in the Neotropics, covered 55 percent of the island in 1899; in 1934, agriculture (including cattle production) represented about 45 percent of the gross national product, while manufacturing accounted for only 7 percent (fig. 134b). Population growth before 1940 was accompanied by a consistent decrease in forest cover (fig. 134a).
Shifts From Agriculture to IndustryIn the late 1940s, the political status of Puerto Rico changed, and the postwar efforts to promote industrialization (Operation Bootstrap; Dietz 1986) shifted the economy from agriculture to light industry. Between 1940 and 1980, the percentage of farmland in Puerto Rico decreased from 85 to 37 percent (Cruz Baez and Boswell 1997); by 1989, agriculture represented less than 5 percent of the gross national product, while manufacturing had grown to almost 50 percent (fig. 134b; Dietz 1986). The human population of the island continued to increase, from slightly less than 1 million inhabitants in 1900 to more than 3.5 million in 1990 (fig. 134c) to just under 4 million today. Furthermore, the spatial distribution of the population changed (fig. 135) because economic changes promoted migration from rural to urban areas and to continental urban centers such as New York, Philadelphia, Miami, and Chicago (Cruz Baez and Boswell 1997, Rudel et al. 2000). Since the 1940s, while out-migration dominated the central to western mountains, immigration and population growth occurred mainly in the urban areas and along the northeast coast. Between 1940 and 1990, the rural population did not change significantly (fig. 134c), but the rural working population (between 15 and 64 years old) decreased (Cruz Baez and Boswell 1997), reflecting the decrease in agricultural activities.
Puerto Rico and the Luquillo Experimental Forest in the 21st CenturyUrban sprawl has been part of the Puerto Rican environment for the past 40 years, but has become an increasingly dominant land use pattern. The Transportation Research Board (2002) defines urban sprawl as “peripheral growth that expands in an unlimited and noncontiguous way outward from the solid built-up core of a metropolitan area.” It is characterized by low-density development (Edwin 1997), significant per capita land
16. Socioeconomic IndicatorsN.L. Harris
Figure 134.—(a) Population growth (as a percentage of current population) and forest cover (as a percentage of total land area) since 1800, (b) percentage of gross national product attributed to agriculture and manufacturing since 1930, and (c) rural and urban population during the 20th century. From Grau et al. (2003).

120 Luquillo Experimental Forest: Research History and Opportunities
consumption of exurban lands, and almost total reliance on the automobile for transportation. Principal consequences include traffic congestion, increased energy consumption, increased costs for community services, reduction of open spaces, the fragmentation of habitats, and the pollution of airways and waterways.
Today, Puerto Ricans are suffering the consequences and paying the costs of sprawl. On the island, traffic jams are common, enhanced by a high proportion of cars per person equal to 0.54 (U.S. DOT 2002). Industrial electricity costs are 73 percent higher than for developed economies and are dependent upon imported oil. Forty percent of water bodies are affected and do not meet quality standards (Puerto Rico Vision 20252). Productive agricultural lands have been transformed into urban
areas (Helmer 2004), and even forest reserves like the Luquillo Experimental Forest (LEF) have come under increasing human pressure (Lugo et al. 2000, 2004).
Martinuzzi et al. (2007) integrated geospatial technology and population census data to understand how Puerto Ricans are using and developing land according to imagery obtained between 1999 and 2003. Rather than using a dichotomous urban/rural classification to map land use, three new regions for Puerto Rico were defined: urban, densely populated rural, and sparsely populated rural. Their interpretation defined 11 percent of the island (95,342 hectares) as being composed of urban built-up surfaces (fig. 136a), with approximately 40 percent corresponding to low-density developments expanding outward from urban centers in linear patterns that follow the road network and other isolated construction. As seen from, figure 136a developed pixels are distributed throughout the island as a major “urban ring” around the island and another minor urban ring that encircles the LEF.
Figure 135.—Human population migration in and out of each municipality of Puerto Rico between 1940 and 1990. From Grau et al. (2003).
2 Puerto Rico Vision 2025 is a governmental long-term vision for the island, encompassing all aspects of economic, social, environmental, and infrastructure development.

Luquillo Experimental Forest: Research History and Opportunities 121
The results of Martinuzzi et al. (2007) show a clear increase in tendency toward urban sprawl in people moving away from urban centers to the periphery, to exurban agglomerations, and to developments along rural roads (fig. 136b). Most of the 78 urban centers of Puerto Rico are relatively poorly populated (as compared with urbanized areas of similar population in different countries) and are surrounded by sprawl developments. Nearly
one-half of the total development covers one-fourth of the best lands for agriculture, thereby affecting watersheds and reducing open spaces. This study reinforces the necessity of an effective and efficient land use plan for Puerto Rico and emphasizes the importance of protected areas such as the LEF for maintaining ecosystem services such as water quality and quantity amidst increasing pressure from urbanization.
Figure 136.—(a) Patterns of urban development of Puerto Rico: high-density developments (in black) and low-density developments (in red). (b) Map of Puerto Rico’s developed lands, showing different tendencies toward urban sprawl. From Martinuzzi et al. (2007).
136a.
136b.

122 Luquillo Experimental Forest: Research History and Opportunities
Figure 137.—Traditional single use of data model and new model with metadata and data archives modified from J. Porter, University of Virginia.
Level Benefits
Individual scientist
Facilitates collaboration and publication, wider recognition among peers, higher number of citations
Research institutions
Larger role in science, increased potential for additional research funding
Broader scientific community
Catalyzes new analyses and syntheses, integrates data resources
Society Better science leads to better policy
Table 38. Benefits of sound information management systems and data archival policies. Based on Costello (2009).
Data Archival and Long-Term Data Sets
“Advances in science, engineering, and all fields of research depend on the reliability of the research record. Sustained public trust in the research enterprise also requires confidence in the research record and in the processes involved in its ongoing development.”
Forest Service Manual, 4086 Scientific Ethics
Sound information management systems and data archival policies facilitate the publication and accessibility of data sets and deliver benefits to individual scientists, research institutions, and the general scientific community (table 38). Data archival allows for an easy connection to be made between past and present research in terms of where data were collected, when, by whom, and which products, reports, and publications were generated from a given study so that scientists’ ability to interpret and understand data in the future is maintained. In this way, the useful lifespan of data is much longer due to increased collective data access and data accumulation over time. This approach represents a new model for conducting research and managing data (Fig. 137).
Since its establishment in 1988, the Luquillo (LUQ) Long Term Ecological Research (LTER) has had a formal Information and Data Management System (IMS), part of which is the publication of data generated by ongoing research activities. All long-term data sets for the Luquillo Experimental Forest (LEF) are available at the LTER Web site3 and currently include data sets on meteorology, hydrology, disturbance, nutrient and carbon dynamics, vegetation dynamics, animal population dynamics, and biological diversity. Information Management System guidelines for the LUQ LTER are in the Handbook to
17. History and Focus of ResearchN.L. Harris and T. Heartsill Scalley
Data Management Policies, Data Archival, and Data Requests (Meléndez Colom 2009), which includes instructions and best practices for filing a new data set4. One fundamental aspect of this data archival process is metadata, or “data about the data.” Metadata provide users with critical details about the data set under consideration, and documentation standards for metadata are also available at the LUQ LTER Web site5.
The LUQ LTER follows Ecological Metadata Language (EML) standards because these comply with current archival mandates for both the LTER and Forest Service, which include the Federal Geographic Data Committee for both geographic and spatial data and the National Biological Information Infrastructure for biological and nongeospatial data. Furthermore, EML can be cross-walked to other standards, which facilitates correspondence to other data sets if needed and guarantees future accessibility and minimizes loss of information. Because the data management and archival policies of the LEF are stated explicitly, adequate data usage and interpretation and proper acknowledgment of data and resources are possible.
Another advantage to having a centralized site from which to access data and metadata for the LEF is that potential data users can request particular data sets from the information manager. In this way, the requests and usage of the data are recorded can thus be used to gauge a given data set’s influence and value to scientists over time. These records are an important part of assessing the greater effect and influence of LEF research.
3 http://luq.lternet.edu/data
4 http://luq.lternet.edu/datamng/imdocs/division.html5 http://luq.lternet.edu/datamng/imdocs/MetadataGuidelines.htm

Luquillo Experimental Forest: Research History and Opportunities 123
Major Research FindingsThe LEF has been an LTER site since 1988, but has been a hub for ecological research for more than a century. The list below highlights some major research findings that have emerged since the inception of the LUQ LTER site:
n Forests are resilient. Research in the LEF has shown that forests are much more resilient in the face of disturbance than previously assumed. Forests are not particularly susceptible to long-term degradation following large-scale natural disturbances. Nutrient cycles return to predisturbance levels within 1.5 to 2.5 years, litterfall rates return to predisturbance levels within 5 years, and biomass accumulation exceeds soil respiration resulting in a net carbon sink in as few as 15 years after a large-scale disturbance.
n Climate change is upon us. Although a 20-year rainfall record for the Bisley Experimental Watersheds indicates no significant change in mean annual rainfall, the dry months (February and March) are getting drier, and intense rainfall events of more than 60 mm day-1 (millimeters per day) are without precedent. Other weather stations in the region suggest a long-term decrease in precipitation, potentially in response to global climate change. Urban heat islands with net temperatures of up to 1.75 °C radiate heat to at least the foothills of the Luquillo Mountains during the early evenings.
n Consumers can have major effects. Single groups of consumers (shrimp, coquis, walking sticks), although a minor component of total forest biomass, can affect key ecosystem processes such as nutrient cycling, decomposition, and primary productivity.
n The “four-forest-types” paradigm is dead. The four-forest-types paradigm within the LEF has shifted to a recognition that the distribution of vegetation across a landscape results from plant responses to multiple environmental gradients that vary over space and time. Although this paradigm has heuristic value and has been convenient for displaying data, as we do in this review, we now recognize that discrete boundaries between one forest type and another do not exist; species assemblages occur as a continuum across a landscape.
n Most nutrients are in the soil. Modern studies of nutrient cycling in tropical forests have shifted and broadened compared with earlier research. There has been a paradigm shift away from the notion that most nutrients in tropical forests are held in aboveground biomass; recent literature emphasizes that for most elements and at most sites, soil is a larger nutrient pool than aboveground biomass.
n Energy transfer occurs through food webs, not food chains. The classic concept of a “food chain” is too simplistic for describing energy flow and trophic interactions in the LEF; recent studies have supported the concept of a much more complex “food web.”
n The cloud condensation level is likely a determinant of forest structure and function. The point at which clouds begin to form in the LEF, at approximately 600-meter elevation, may induce changes in climatic conditions and, therefore, changes in forest structure and function. Net primary productivity peaks at mid-elevations, stem density exhibits a mid-elevation dip, and species richness starts to decline at mid-elevations.

124 Luquillo Experimental Forest: Research History and Opportunities
The document by Brown et al. (1983) and this document both contain comprehensive reviews of available
information for the Luquillo Experimental Forest (LEF), in particular, and the Luquillo Mountains, in general. The richness of information available in publications, the National Science Foundation’s Long Term Ecological Research (LTER) Web site (http://luq.lternet.edu), research files of the Forest Service, and other agencies (Federal and State) and universities with research programs in the Luquillo Mountains makes the LEF an attractive site for research collaboration. Research facilities discussed below in this document and the cadre of local scientists and students with active research programs in the LEF complete the case for the attractiveness of the LEF as a place to conduct research on tropical systems of all kinds (ecological, hydrological, geological, urban, atmospheric, etc.). Research opportunities in the Luquillo Mountains are unlimited, but some areas outlined below are not well represented in current research programs, yet are of particular interest to scientists and forest managers. Other research opportunities will emerge as knowledge about the Luquillo Mountains expands.
Research opportunities are emerging in the following areas:
n The interaction between visitors to the forest and the natural ecosystems of the LEF. As discussed earlier, the LEF and El Yunque National Forest receive hundreds of thousands of visitors annually. These visitors have an effect on the biota and ecological systems of the Luquillo Mountains, for example, in the propagation of introduced species, on the water quality of streams, conditions of trails, and other demands placed on facilities and on natural ecosystems. An opportunity exists to conduct socioecological research that will begin to unravel the complex interactions between people (both visitors and people in communities surrounding the LEF) and ecosystems in the LEF. This research is a priority for forest managers responsible for managing visitors, interactions with local communities, and ecological systems of the national forest.
n How climate change will affect the elevational gradients of the Luquillo Mountains. This review has established the many elevation gradients of the LEF, including climate, vegetation, soils, and hydrology. One critical gradient in the LEF is the adiabatic lapse rate and the critical cloud condensation point at about 600-meter elevation. These two physical indicators of environmental conditions have particular influence on vegetation, and vegetation extends
its influence to many other components of the biota along the elevation gradient. Climate change scenarios for the Caribbean, coupled with the influence that urbanization has on climatic gradients on the mountain, anticipate increases in air temperature and an upward movement of the critical cloud condensation level. These dramatic scenarios provide impetus for unique long-term research opportunities in the LEF.
n The global connectivity of the Luquillo Mountains. The Luquillo Mountains are exposed to five global airsheds discussed previously in the Climate section above. Each airshed, whether originating over the Atlantic or in Africa, the Northeastern United States, or Central America, is characterized by its own chemical and particulate signature, which presumably affects local ecosystems in different ways. Research opportunities exist to continue the characterization of these airsheds and establish the effects of these global connections on the biota. Puerto Rico’s effects on the quality of the air masses as they pass over the island also require further characterization.
n The interface between urban and natural ecosystems. The LEF is a terminus of the urban to pristine forest gradient in Puerto Rico. Although much research has been conducted on the pristine forests of the Luquillo Mountains, very little research attention has been given to the urban and suburban portions of the gradient or to the interactions among the systems found along the gradient. With the urban population of the world increasing everywhere, there is a research need and an opportunity to further understand how ecosystem services from different parts of the gradient are delivered and sustained as human pressure for those services increases. The research opportunity is focused on socioecological research, an emerging new integrative science with a focus on people and ecosystems.
In addition to the opportunities listed above, there is an opportunity to connect the LEF to local and global networks such as the National Environmental Observatory Network (NEON) of the National Science Foundation. Puerto Rico will have a NEON site at the Guánica dry forest, and this brings an opportunity to compare the moist, wet, and rain forests of Luquillo with the dry ones of Guánica. Already Lugo et al. (2002) compared these forests and identified the similarities and differences that need further comprehensive documentation and analysis.
18. Research OpportunitiesA.E. Lugo

Luquillo Experimental Forest: Research History and Opportunities 125
Concerted efforts by scientists affiliated with the Institute for Tropical Ecosystems Studies [ITES; formerly the Terrestrial
Ecology Division of the Center for Energy and Environmental Research, University of Puerto Rico-Río Piedras] and the Forest Service’s International Institute for Tropical Forestry (IITF), Luquillo (LUQ) Long Term Ecological Research (LTER) Program, and El Yunque National Forest have led to developing an array of venues for environmental education and public outreach. Current education and outreach strategies range from the training of future professionals and researchers in ecological and environmental sciences to activities aimed at educating the public on issues related to water and to ecosystem conservation and management strategies in the Luquillo Mountains.
Graduate Education—The LUQ LTER Program has been a magnet for graduate students seeking to conduct research in areas related to tropical ecology. Between 2000 and 2007, more than 30 students working under the sponsorship of the LUQ LTER have earned doctoral or master’s degrees. Three current LUQ LTER senior investigators began their careers as graduate students with LUQ LTER senior investigator advisors. The ITES contributes to graduate education in the Luquillo Mountains through the management of the El Verde Field Station (EVFS), which provides logistical support and lodging to ecology course participants who visit the station regularly and on- and off-island graduate students who conduct research for their degree programs.
Summer Internships—Accessible, hands-on research experiences have been proven as an effective strategy for the recruitment and retention of students into the field of ecology because these experiences get them excited about science in general. Each summer, the EVFS, home base of the LUQ LTER Program, hosts the Research Experience for Undergraduates in Ecology and Evolution (REU) summer program (http://ites.upr.edu/REU/). This program is part of a nationwide initiative sponsored by the National Science Foundation’s (NSF’s) Research Experience for Undergraduate Program that was designed to develop and enhance the knowledge and skills needed for students to conduct their own independent research. Students become familiar with ongoing research at the Luquillo Experimental Forest (LEF) and are paired with research mentors who are actively conducting research in various disciplines (e.g., plant ecology, community ecology, ecosystem research, nutrient cycling, and plant-animal interactions), in different systems (e.g., plant, soils, streams) and levels of organization (from microorganisms to ecosystems). Students are expected to attend workshops and research seminars and conduct scientific research that they will write and publish an article about after completing the internship. The 8-week REU program has been active at the EVFS since 2000 and has supported full fellowships for undergraduate students. The program has become very popular among students; more than 130 applications are received each year from students from all over the country to fill
the 8 fellowships offered each summer. Since 2000, the REU program has sponsored research experiences for 76 students from Puerto Rico and the continental United States. Additional undergraduate student research training has also been possible in part through supplemental NSF-REU funds and individual grants from LTER scientists working in the LEF.
Kindergarten to Grade 12 Outreach—Researchers from ITES and IITF have been key contributors in developing science education and training activities that target both teachers and students at the Kindergarten to Grade 12 (K-12) level. Some of the most successful activities incorporate data and lessons learned from the LUQ LTER. Some of the programs are described below.
The Journey to El Yunque (http://elyunque.net/journey.html) program is a joint effort between ITES (LTER scientist J.K. Zimmerman) and The Learning Partnership (educational researcher S. McGee), intended to replace 4 weeks of the standard biology curriculum devoted to ecology at the 6th grade level. The Puerto Rico Department of Education has held workshops for more than 500 teachers to share with them this educational resource. In Journey to El Yunque, students are able to work with predictive models and compare predictions with LUQ LTER-generated data.
The mission of the LUQ LTER Schoolyard (http://luq.lternet.edu/outreach/schoolyard/index.html) program is to increase ecological literacy and promote a scientific culture in K-12 environments and disseminate workshops, internships, and seminars to K-12 teachers and students. This program has leveraged funds from NSF’s Instructional Materials Development program and the Puerto Rico Department of Education to develop programs that have reached some 900 Puerto Rico high school teachers. Workshops and internships led by ITES and IITF have been provided to students and teachers at the EVFS, the official research site of LUQ LTER.
Ecoplexity is an NSF-funded Web site created by the Teaching Ecological Complexity program (http://ecoplexity.org/home; LTER-ITES scientist Jorge Ortiz Co-PI). This Web site is designed to train high school science teachers to conduct field ecology research and use qualitative modeling to broaden their understanding of complexity, diversity, and ecology as a science. The Web site incorporates products from five LTER Schoolyard sites (including LUQ LTER) and contains a variety of resources (protocols, databases, field guides, links) to help teachers design experiments.
The Hydrology for the Environment, Life, and Policy (HELP) program is a joint global initiative between the United Nations Scientific Organization (UNESCO) and the World Metereological Organization aimed at improving the linkage between hydrology and society through facilitating the development of global watershed networks where scientists,
19. Education and OutreachE. Meléndez Ackerman

126 Luquillo Experimental Forest: Research History and Opportunities
policymakers, and stakeholders can form alliances to maximize economic and social welfare without compromising the sustainability of watershed ecosystems (Ortiz Zayas and Scatena, 2004). In 2001, this UNESCO and Forest Service Washington Office partnership initiative established an international network of watersheds and incorporated seven watersheds in Eastern Puerto Rico (Río Grande de Loíza, Río Espíritu Santo, Río Mameyes, Río Sabana, Río Fajardo, Río Santiago, Río Blanco) that all originate in the Luquillo Mountains. Guided by the goals of the international principle of integrated watershed resource management, HELP’s goal is to promote the concept of integrated management of water resources in the Luquillo Mountains (http://luquillohelp.upr.edu/). With that guiding principle, the Luquillo-HELP program seeks to foster the effective dissemination of information related to the water resources of the Luquillo Mountains among all the social sectors of the eastern region of Puerto Rico accountable for managing water resources. Targeted groups include the communities that depend on the water supply from the Luquillo Mountains, water resource managers, scientists focused on hydrology research, government agencies in charge of administering water resources, and government officials in charge of developing public policy on water use. The program is sustained using external funds that support annual workshops and panel discussions to educate the
public on issues related to water use, management, and research and includes sponsors from Federal and State agencies including the Forest Service’s El Yunque National Forest and IITF, U.S. Geological Survey, U.S. Army Corps of Engineers, Puerto Rico Aqueduct and Sewer Authority, Water Resources Division, Water Plan Office of Department of Natural and Environmental Resources, and The Environmental Quality Board of the Commonwealth of Puerto Rico.
The El Portal Visitor Center for the El Yunque National Forest is located on Highway PR 191 at the entrance to the El Yunque National Forest. El Portal offers interactive exhibits designed to inform the visiting public about important aspects related to tropical rain forest diversity and function. Visitors can also request guided tours through the forest. The El Portal Visitor Center is one of several visitor information centers located throughout the forest. The El Yunque receives an estimated 1.2 million visitors annually from Puerto Rico and the continental United States combined. Given the large influx of people into the Luquillo Mountains, El Portal, and associated facilities at El Yunque National Forest, these facilities provide an important outlet for scientific information generated by research and academic institutions about the LEF.

Luquillo Experimental Forest: Research History and Opportunities 127
Years Activity
1940s The U.S. Department of Agriculture, Forest Service starts ecological research in four vegetation zones.
1960s Rain Forest Project, sponsored by the Atomic Energy Commission, studied ecosystem processes at large scales.
1970s Terrestrial Ecology Division of the Center for Energy and Environment Research conducted research on nutrient cycling and energy flow.
1980s Rain Forest Cycling and Transport Project initiated by the U.S. Department of Energy and the University of Puerto Rico.
1988 to today
Large-scale, long-term monitoring projects and experi-ments implemented, many based out of the El Verde Research Area. Some of the largest and most recent include the nutrient addition plots (NSF-MRCE, NSF-CREST), population and community monitoring projects of The Luquillo Long-Term Ecological Research Program (NSF-LTER), The Forest Dynamics Plot (NSF, Andrew Mellon Foundation), and, the most recent, the Canopy Trimming Experiment, established in 2006 (NSF-LTER).
Table 39. Activities associated with the El Verde Research Station over the past seven decades.
NSF is National Science FoundationMRCE is Minority Research Centers of ExcellenceCREST is Center for Research Excellence in Science and Technology
Building FacilitiesThe El Yunque National Forest, also the Luquillo Experimental Forest (LEF), is home to several research facilities that provide logistical support to researchers, students, technicians, and managers from local and off-island institutions. The living and working facilities throughout the forest are described below. The establishment and maintenance of these facilities have contributed greatly to developing cutting-edge research in ecosystem function at the LEF and its position as one of the most well studied tropical forests in the world.
The El Verde Field Station (EVFS), which is situated at 350-meter (m) elevation on the northeastern slope of the Luquillo Mountains, has been a vital location for research and training efforts since the middle of the past century (table 39). It has a rich history, both culturally and scientifically, with some facilities dating back to the late 1930s and some long-term research sites dating back to the 1940s. The station is surrounded by tabonuco forest, the most well-studied vegetation type in the LEF. In 1988, the National Science Foundation established the Luquillo (LUQ) Long Term Ecological Research (LTER) Program and the EVFS has been the principal site for LTER research ever since. The EVFS has provided logistical
support to scientists from more than 50 institutions in Puerto Rico and overseas. It is probably the oldest terrestrial ecology field station in Puerto Rico and has increased in usage over time.
The Institute for Tropical Ecosystem Studies (ITES) administers the EVFS and surrounding research area (80 acres) under an agreement with the Forest Service. Core facilities include two dormitory buildings and laboratory facilities. An original building with historic value was constructed in 1937 and renovated in the early 1960s at the start of the Howard Odum’s Rain Forest Project. A second dormitory-style apartment building was inaugurated in 2007 and has improved the quality of the accommodations at El Verde significantly. Laboratory facilities at EVFS include offices, wet and dry laboratories, storage rooms, a locker room, a carpentry shop, a biodiversity collections room, and a combined conference and computer room. Laboratories at the field station are supplemented by modern analytical facilities operated by ITES in San Juan. Biodiversity collections at the EVFS contain complete collections of the fungi, ferns and dicots, amphibians, and reptiles of the LEF. The herbarium collection will be digitized to incorporate El Verde specimens to the University of Puerto Rico-Río Piedras Virtual Herbarium.
In the forest, researchers have access to a permanent walkup tower that supports environmental monitoring equipment and provides access to canopy vegetation and fauna. This tower also houses a station for the National Atmospheric Deposition Program. A footbridge within the research area allows passage over the Quebrada Sonadora to experimental field plots.
Sabana Field Research Station and Bisley Experimental Watersheds—The Sabana Field Research Station is situated at 265-m elevation within a small community at the outskirts of the LEF. The station is managed by the Forest Service, International Institute of Tropical Forestry (IITF), and houses laboratory facilities and living quarters for visiting students and senior researchers. High-speed Internet is also available within facilities. The site has year-round road access and is just a short drive from the three Bisley Experimental Watersheds where several researchers conduct their studies. The IITF has conducted detailed watershed studies in these adjacent watersheds since 1987, and the site has been part of the LUQ LTER Program since its creation in 1988. The Bisley Experimental Watersheds are located within forest dominated by tabonuco trees and consist of three drainages dedicated to the study of watershed processes within steep forest areas. The research area contains two canopy towers with climate stations and three gauged watersheds nested within the gauged Río Mameyes watershed. Experimental research areas also include a network of permanent vegetation and soil plots and areas dedicated to the study
20. FacilitiesE. Meléndez Ackerman
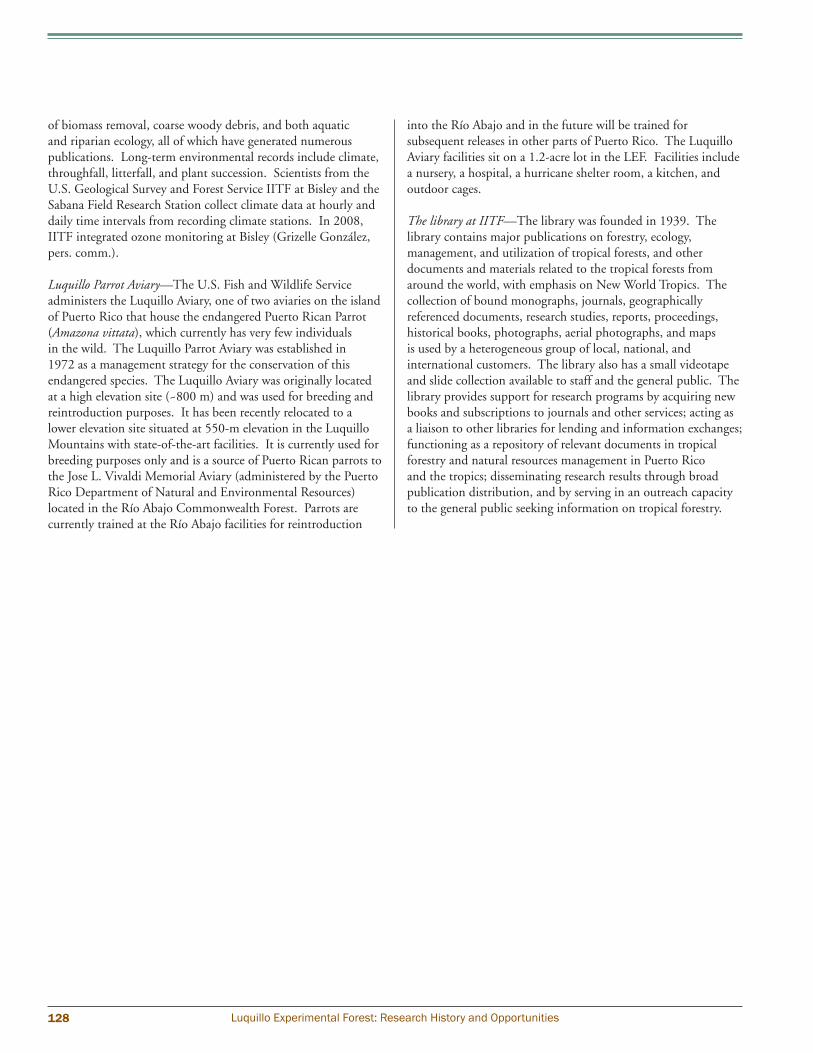
128 Luquillo Experimental Forest: Research History and Opportunities
of biomass removal, coarse woody debris, and both aquatic and riparian ecology, all of which have generated numerous publications. Long-term environmental records include climate, throughfall, litterfall, and plant succession. Scientists from the U.S. Geological Survey and Forest Service IITF at Bisley and the Sabana Field Research Station collect climate data at hourly and daily time intervals from recording climate stations. In 2008, IITF integrated ozone monitoring at Bisley (Grizelle González, pers. comm.).
Luquillo Parrot Aviary—The U.S. Fish and Wildlife Service administers the Luquillo Aviary, one of two aviaries on the island of Puerto Rico that house the endangered Puerto Rican Parrot (Amazona vittata), which currently has very few individuals in the wild. The Luquillo Parrot Aviary was established in 1972 as a management strategy for the conservation of this endangered species. The Luquillo Aviary was originally located at a high elevation site (~800 m) and was used for breeding and reintroduction purposes. It has been recently relocated to a lower elevation site situated at 550-m elevation in the Luquillo Mountains with state-of-the-art facilities. It is currently used for breeding purposes only and is a source of Puerto Rican parrots to the Jose L. Vivaldi Memorial Aviary (administered by the Puerto Rico Department of Natural and Environmental Resources) located in the Río Abajo Commonwealth Forest. Parrots are currently trained at the Río Abajo facilities for reintroduction
into the Río Abajo and in the future will be trained for subsequent releases in other parts of Puerto Rico. The Luquillo Aviary facilities sit on a 1.2-acre lot in the LEF. Facilities include a nursery, a hospital, a hurricane shelter room, a kitchen, and outdoor cages.
The library at IITF—The library was founded in 1939. The library contains major publications on forestry, ecology, management, and utilization of tropical forests, and other documents and materials related to the tropical forests from around the world, with emphasis on New World Tropics. The collection of bound monographs, journals, geographically referenced documents, research studies, reports, proceedings, historical books, photographs, aerial photographs, and maps is used by a heterogeneous group of local, national, and international customers. The library also has a small videotape and slide collection available to staff and the general public. The library provides support for research programs by acquiring new books and subscriptions to journals and other services; acting as a liaison to other libraries for lending and information exchanges; functioning as a repository of relevant documents in tropical forestry and natural resources management in Puerto Rico and the tropics; disseminating research results through broad publication distribution, and by serving in an outreach capacity to the general public seeking information on tropical forestry.

Luquillo Experimental Forest: Research History and Opportunities 129
Web ResourcesThe technological advances related to Internet-based data archival during the past 15 years have greatly facilitated data transfer and dissemination, particularly for long-term projects at the Luquillo Experimental Forest (LEF). These advances have generated a proliferation of Web resources that enhance research and education activities. Some of the most important Web resources are listed below and are arranged by topic of interest.
Climatic and Hydrological Data—El Yunque National Forest houses three meteorological stations and eight hydrological stations managed by the U.S. Geological Survey (USGS), the International Institue of Tropical Forestry (IITF), the Luquillo Long Term Ecological Research (LUQ LTER) Program and the Institute for Tropical Ecosystems Studies (ITES) of University of Puerto Rico in Río Piedras. Hydrological data date from 1945 and meteorological data date from 1975. Data can be accessed at http://pr.water.usgs.gov/public/webb/.
Long-term records under the LUQ LTER Program—The LUQ LTER Program Web site currently consists of 45 data sets in the following topics: meteorology, hydrology, disturbance, nutrient and carbon dynamics, vegetation dynamics, animal population dynamics, biological diversity, maps and photos, primary productivity, population dynamics, organic matter accumulation, inorganic inputs and nutrient movements, patterns and frequency of disturbance, environmental monitoring, and simulation models. Data can be accessed at http://luq.lternet.edu/.
Publications—Active research at LEF has resulted in a large number of publications, particularly through research sponsored by IITF, USGS, the LUQ LTER Program, and institutions affiliated with these research groups. The Luquillo Water, Energy, and Biogeochemical Budgets (WEBB) research project is a cooperative effort led by USGS Caribbean Water Science Center and USGS National Research Program researchers and in collaboration with LTER researchers. It is part of a larger network of WEBB sites across the United States and its territories aimed at improving the ability to predict water, energy, and biogeochemical budgets over a range of spatial and temporal scales. Many of the bibliographies related to this and other research programs at the LEF can be searched at the following Web sites:
n LUQ LTER Program—http://luq.lternet.edu/publications/.n IITF-FS—http://www.fs.fed.us/global/iitf/pubdir1.html. n Luquillo WEBB Project (USGS)—http://pr.water.usgs.gov/
public/webb/webb_biblio.html.
Research Field Stations—Web addresses for the three main research facilities at LEF are as follows:
n El Verde Field Station (Managed by ITES, University of Puerto Rico at Río Piedras)—http://ites.upr.edu/EVFS/.
n Sabana Field Station (Managed by the IITF–Forest Service)—http://www.tropicalforestry.net/facilities/sabana.
n Luquillo Aviary (Managed by the U.S. Fish and Wildlife Service)—http://www.fws.gov/caribbean-ecoteam/PRP_aviaries.htm.
Educational Resources and Public Outreach—El Yunque National Forest has the largest collection of educational and public outreach Web resources in the Caribbean. Educational sites target different audiences from Kindergarten to Grade 12 students and teachers to higher education. Public outreach and educational resources offer information that promotes the integrated management of El Yunque’s Ecosystem.
n Journey to El Yunque—http://elyunque.net/journey.html.n Ecoplexity–Luquillo-LTER—http://ecoplexity.org/tropical_
forest (in English and Spanish).n LUQ LTER Schoolyard Program—http://luq.lternet.edu/
outreach/schoolyard/index.html. n Hydrology for the Environment, Life, and People (HELP)—
http://luquillohelp.upr.edu/index.html (Spanish only).n Research Experience for Undergraduates in Ecology and
Evolution—http://ites.upr.edu/REU/.n El Portal—http://www.fs.fed.us/r8/el_yunque/ (Spanish and
English).n ITES—http://www.ites.upr.edu/.n IITF—http://www.fs.fed.us/global/iitf/.
Additional ResourcesCurrent sources for nomenclature and taxonomic identification guides are available at no cost from the Antilles Flora project, directed by Pedro Acevedo Rodríguez, Department of Botany, National Museum of Natural History, and Smithsonian Institution6.
Guide to Vines: http://botany.si.edu/Antilles/PRFlora/vines.html.
Guide to Monocotyledons: http://botany.si.edu/Antilles/PRFlora/monocots.html.
In addition to the El Verde Field Station facilities and collections described above, botanical specimen collections for the LEF are also in Puerto Rico at two main sites: the University of Puerto Rico Botanical Garden Herbarium and the Río Piedras Campus Herbarium (http://www.herbarium.uprr.pr/).
Resources
6 http://botany.si.edu/Antilles/WestIndies/catalog.htm.

130 Luquillo Experimental Forest: Research History and Opportunities
Acevedo Rodríguez, P.; Strong, M.T. 2008. Floristic richness and affinities in the West Indies. Botanical Review. 74: 5–36.
Ahmad, R.; Scatena, F.N.; Gupta, A. 1993. Morphology and sedimentation in Caribbean montane streams: examples from Jamaica and Puerto Rico. Sedimentary Geology. 85: 157–169.
Aide, T.M.; Zimmerman, J.K.; Herrera, L.; Rosario, M.; Serrano, M. 1995. Forest recovery in abandoned tropical pastures in Puerto Rico. Forest Ecology and Management. 77: 77–86.
Aide, T.M.; Zimmerman, J.K.; Pascarella, J.B.; Rivera, L.; Marcano Vega, H. 2000. Forest regeneration in a chronosequence of tropical abandoned pastures: implications for restoration ecology. Restoration Ecology. 8: 328–338.
Álvarez López, M. 1990. Ecology of Pterocarpus officinalis forested wetlands in Puerto Rico. In: Lugo, A.E.; Brinson, M.; Brown, S., eds. Forested wetlands of the world. Amsterdam, The Netherlands: Elsevier and Atlanta: Wildlife Service: 251–265.
Álvarez, J. 1991. The effects of treefall gaps on a tropical land snail community. Lubbock, TX: Texas Tech University. 72 p. M.S. thesis.
Álvarez, J.; Willig. M.R. 1993. Effects of treefall gaps on the density of land snails in the Luquillo Experimental Forest of Puerto Rico. Biotropica. 25: 100–110.
American Ornithologists’ Union. 1983. Check-list of North American birds. 6th edition. American Ornithologists’ Union, Washington, DC.
Andrews, A. 1990. Fragmentation of habitat by roads and utility corridors: a review. Australian Zoologist. 26: 130–141.
Angulo Sandoval, P.; Aide, T.M. 2000. Leaf phenology and leaf damage of saplings in the Luquillo Experimental Forest, Puerto Rico. Biotropica. 32: 415–422.
Arnold, J.G.; Allen, P.M.; Muttiah, R.; Bernhardt, G. 1995. Automated baseflow separation and recession analysis techniques. Groundwater. 33: 1010-1017.
Asbury, C.E.; McDowell, W.H.; Trinidad Pizarro, R.; Berrios, S. 1994. Solute deposition from cloud water to the canopy of a Puerto Rican montane forest. Atmospheric Environment. 28: 1773–1780.
Auerbach, N.A.; Walker, M.D.; Walker, D.A. 1997. Effects of roadside disturbance on substrate and vegetation properties in arctic tundra. Ecological Applications. 7: 218–235.
Austin, M.P.; Smith, T.M. 1989. A new model for the continuum concept. Vegetatio. 83: 35–47.
Bannister, B.A. 1970. Ecological life cycle of Euterpe globosa Gaertn. In: Odum, H.T.; Pigeon, R.F., eds. A tropical rain forest: a study of irradiation and ecology. Oak Ridge, TN: Atomic Energy Commission: 299–314.
Barone, J.A.; Thomlinson, J.; Cordero, P.A.; Zimmerman, J.K. 2008. Metacommunity structure of tropical forest along an elevation gradient in Puerto Rico. Journal of Tropical Ecology. 24: 525–534.
Baroni, T.J.; Cantrell, S.A.; Perdomo Sánchez, O.P.; Lodge, D.J. 2008. New species of Pouzarella (Entolomataceae, Agaricales) from the Dominican Republic. North American Fungi. 3: 241–260.
Baroni, T.J.; Lodge, D.J.; Cantrell, S.A. 1997. Tropical connections: sister species and species in common between the Caribbean and the Eastern United States. McIlvainea. 13: 4–19.
Baroni, T.J.; Lodge, D.J. 1998. Basidiomycetes of the Greater Antilles I: new species and new records of Alboleptonia from Puerto Rico and St. John, USVI. Mycologia. 90: 680–696.
Basnet, K. 1992. An experimental study of the slope stability of the rain forest in Puerto Rico. Tropical Ecology. 33: 181–185.
Basnet, K.; Scatena, F.N.; Likens, G.E.; Lugo, A.E. 1993. Ecological consequences of root grafting in Tabonuco (Dacryodes excelsa) trees in the Luquillo Experimental Forest, Puerto Rico. Biotropica. 25: 28–35.
Basnet, K.; Likens, G.E.; Scatena, F.N.; Lugo, A.E. 1992. Hurricane Hugo: damage to a tropical rain forest in Puerto Rico. Journal of Tropical Ecology. 8: 47–55.
Bates, C.G. 1930. Hurricane damage to Porto Rican forests. Journal of Forestry. 28: 772–774.
Beard, K.H.; Vogt, K. A.; Kulmatiski, A. 2002. Top-down effects of a terrestrial frog on forest nutrient dynamics. Oecologia. 133: 583–593.
Beard, K.H.; Eschtruth, A.K.; Vogt, K.A.; Vogt, D.J.; Scatena, F.N. 2003. The effects of the frog Eleutherodactylus coqui on invertebrates and ecosystem processes at two scales in the Luquillo Experimental Forest, Puerto Rico. Journal of Tropical Ecology. 19: 607–617.
Beard, K.H.; Vogt, K.A.; Vogt, D.J.; Scatena, F.N.; Covich, A.P.; Sigurdardottir, R.; Siccama, T.G.; Crowl, T.A. 2005. Structural and functional responses of a subtropical forest to 10 years of periodic hurricanes and droughts. Ecological Monographs. 75: 345–378.
Beatty, S.W.; Stone, E.L. 1986. The variety of soil microsites created by tree falls. Canadian Journal of Forest Research. 16: 539–548.
Beinroth, F.H. 1982. Some highly weathered soils of Puerto Rico, 1. Morphology, formation and classification. Geoderma. 27: 1–73.
Benstead, J.P.; March, J.G.; Pringle, C.M. 2000. Estuarine larval development and upstream post-larval migration of freshwater shrimps in two tropical rivers of Puerto Rico. Biotropica. 32: 545–548.
Benstead, J.P.; March, J.G.; Pringle, C.M.; Scatena, F.N. 1999. Effects of a low-head dam and water abstraction on migratory tropical stream biota. Ecological Applications. 9: 656–668.
Bergman, E.; Ackerman, J.D.; Thompson, J.; Zimmerman, J.K. 2006. Land-use history affects the distribution of the saprophytic orchid Wullschlaegelia calcarata in Puerto Rico’s tabonuco forest. Biotropica. 38: 492–499.
Literature Cited

Luquillo Experimental Forest: Research History and Opportunities 131
Bierregard, R.O., Jr. 1990. Species composition and tropic organization of the understory bird community in a Central Amazonian terra firme forest. In: Gentry, A., ed. Four neotropical rainforests. New Haven, CT: Yale University Press: 217–236.
Birdsey, R.A.; Weaver, P.L. 1982. The forest resources of Puerto Rico. Resour. Bull. SO-85. New Orleans, LA: U.S. Department of Agriculture, Forest Service, Southern Forest Experiment Station. 59 p.
Birdsey, R.A.; Weaver. P.L. 1987. Forest area trends in Puerto Rico. Res. Note SO-331. New Orleans: U.S. Department of Agriculture, Forest Service, Southern Forest Experiment Station. 5 p.
Blanco, J.F.; Scatena, F.N. 2006. Hierarchical contribution of river-ocean connectivity, water chemistry, hydraulics and substrate to the distrubtion of diadromous snails in Puerto Rican streams. Journal of the North American Benthological Society. 25: 82–98.
Blanco, J.F.; Scatena, F.N. 2007. The spatial arrangement of Neritina virginea (Gastropoda: Neritidae) during upstream migration in a split-channel reach. River Research and Applications. 23: 235–245.
Bloch, C.P.; Willig, M.R. 2006. Context-dependence of long-term responses of terrestrial gastropod populations to large-scale disturbance. Journal of Tropical Ecology. 22: 111–122.
Bloomfield, J.; Vogt, K.A.; Vogt, D.J. 1993. Decay rate and substrate quality of fine roots and foliage of two tropical tree species in the Luquillo Experimental Forest, Puerto Rico. Plant and Soil. 150: 233–245.
Boccheciamp, R.A. 1977. Soil survey of the Humacao area of Eastern Puerto Rico. Washington, DC: U.S. Department of Agriculture, Soil Conservation Service. 103 p.
Boose, E.R.; Foster, D.R.; Fluet, M. 1994. Hurricane impacts to tropical and temperate forest landscapes. Ecological Monographs. 64: 369–400.
Bouché, M.B. 1977. Ecologie et paraecologie: peut-on apprecier le role de la faune dans les cycles biogeochimiques? Soil Organism as Components of Ecosystems. 25: 157–163.
Brazel A.J.; Selover, N; Vose, R; Heisler, G. 2000. The tale of two climates–Baltimore and Phoenix urban LTER sites. Climate Research. 15: 123–135.
Briggs, R.P.; Aguilar Cortés, E. 1980. Geologic map of the Fajardo and Cayo Icacos Quadrangles, Puerto Rico. U.S. Geological Survey Miscellaneous Geological Investigations, scale 1:20,000.
Bright, G.R. 1982. Secondary benthic production in a tropical island stream. Limnology and Oceanography. 27: 472–480.
Briscoe, C.B. 1966. Weather in the Luquillo Mountains of Puerto Rico. Res. Pap. ITF-3. Río Piedras, Puerto Rico: U.S. Department of Agriculture, Forest Service, International Institute of Tropical Forestry. 258 p.
Brokaw, N.V.L. 1985. Gap-phase regeneration in a tropical forest. Ecology. 66: 682–687.
Brokaw, N.V.L. 1987. Gap-phase regeneration of three pioneer tree species in a tropical forest. Journal of Ecology. 75: 9–19.
Brokaw, N.V.L. 1998. Cecropia schreberiana in the Luquillo Mountains of Puerto Rico. Botanical Review 64: 91–120.
Brokaw, N.V.L.; Walker, L.R. 1991. Summary of the effects of Caribbean hurricanes on vegetation. Biotropica. 23: 442–447.
Brown, S.; Lugo, A.E.; Silander, S.; Liegel, L.H. 1983. Research history and opportunities in the Luquillo Experimental Forest. Gen. Tech. Rep. SO-44. New Orleans, LA: U.S. Department of Agriculture, Forest Service, Southern Forest Experiment Station. 132 p.
Bruner, E.M. 1919. El bosque nacional de Luquillo. Revista de Agricultura de Puerto Rico. 2: 33–42.
Calderón González, F.J. 1993. The role of mycorrhizae in the nutrient absorptive strategy of important landslide colonizers. Río Piedras, Puerto Rico: University of Puerto Rico. M.S. thesis.
Cantrell, S.A.; Iturriaga, T.; Pfister, D.H. 2004. An updated checklist of the Discomycetes for the Dominican Republic and the Caribbean region. Caribbean Journal of Science. 40:139–144.
Cantrell, S.A.; Lodge, D.J. 2004. Hygrophoraceae of the Greater Antilles: Section Coccineae. Mycological Research. 108: 1301–1314.
Cantrell, S.A.; Lodge, D.J.; Baroni, T.J. 2001. Basidiomycetes of the Greater Antilles project. The Mycologist. 15:107–112.
Cantrell, S.A.; Lodge, D.J. 2000. Hygrophoraceae (Agaricales) of the Greater Antilles. Hygrocybe subgenus Hygrocybe. Mycological Research. 104: 873–878.
Cantrell, S.A.; Lodge, D.J. 2001. Hygrophoraceae (Agaricales) of the Greater Antilles, subgenus Pseudohygrocybe section Firmae. Mycological Research. 103: 215–224.
Cantrell, S.A.; Lodge, D.J. 2008. Hongos. In: Joglar, R.L., Ed. Historia Natural de Puerto Rico. San Juan, PR: University of Puerto Rico Press: 249 –295.
Cantrell, S.A.; Lodge, D.J.; Minter, D.W.; Ortíz Santana, B. 2006. Fungi of Puerto Rico. http://www.cybertruffle.org.uk/puerfung [Web site, version 1.00]. (December 2007).
Chacón, N.; Silver, W.L.; Dubinsky, E.A.; Cusack, D.F. 2006. Iron reduction and soil phosphorus solubilization in humid tropical forests soils: the roles of labile carbon pools and an electron shuttle compound. Biogeochemistry. 78: 67–84.
Chase, F.A.; Hobbs, H.H. 1969. The freshwater and terrestrial decapods crustaceans of the West Indies with special references to Dominica. United States National Museum Bulletin 292. Washington, DC: National Building Museum. 1–258.
Chazdon, R.L.; Fetcher, N. 1984. Photosynthetic light environments in a lowland tropical rain forest in Costa Rica. Journal of Ecology. 72: 553–564.
Chestnut, T.J.; Zarin, D.J.; McDowell, W.H.; Keller, M. 1999. A nitrogen budget for late-successional hillslope tabonuco forest, Puerto Rico. Biogeochemistry. 46: 85–108.

132 Luquillo Experimental Forest: Research History and Opportunities
Chinea, J.D. 1999. Changes in the herbaceous and vine communities at the Bisley Experimental Watersheds, Puerto Rico, following Hurricane Hugo. Canadian Journal of Forest Research. 29: 1433–1437.
Clark, D.A.; Brown, S.; Kicklighter, D.W.; Chambers, J.Q.; Thomlinson, J.R.; Ni, J. 2001. Measuring net primary production in forests: concepts and field methods. Ecological Applications. 11: 356–370.
Clements, F.E. 1936. Nature and structure of the climax. The Journal of Ecology. 24: 252–284.
Collins, S.L.; Glenn, S.M.; Roberts, D.W. 1993. The hierarchical continuum concept. Journal of Vegetation Science. 4: 149–156.
Connell, J.H. 1978. Diversity in tropical rain forests and coral reefs. Science. 199: 1302–1310.
Cooper, W.S. 1926. The fundamentals of vegetation change. Ecology. 7: 391–413.
Costello, M.J. 2009. Motivating online publication of data. Bioscience. 59: 418–429.
Covich, A.P.; Crowl, T.R.; Johnson, S.L.; Varza, D.; Certa, D.L. 1991. Post-hurricane Hugo increases in Atyid shrimp abundance in a Puerto Rican montane stream. Biotropica. 23: 448–454.
Covich, A.M.; Crowl, T.A. 1990. Effects of hurricane storm flow on transport of woody debris in a rain forest stream (Luquillo Experimental Forest, Puerto Rico). In: Tropical hydrology and Caribbean water resources. San Juan, Puerto Rico: American Water Resources Association: 197–205.
Covich, A.P. 1988. Atyid shrimp in the headwaters of the Luquillo Mountains, Puerto Rico: Filter feeding in natural and artificial streams. Verhandlungen der Internationalen Vereinigung für theoretische und angewandte Limnologie. 23: 2108–2113.
Covich, A.P.; McDowell, W.H. 1996. The stream community. In: Reagan, D.P.; Waide, R.B., eds. The food web of a tropical rain forest. Chicago, IL: University of Chicago Press: 433–459.
Covich, A.P.; Crowl, T.A.; Heartsill Scalley, T. 2006. Effects of drought and hurricane disturbances on headwater distributions of palaemonid river shrimp (Macrobrachium spp.) in the Luquillo Mountains, Puerto Rico. Journal of the North American Benthological Society. 25: 99–107.
Covich, A.P.; Crowl, T.A.; Johnson, S.L.; Pyron, M. 1996. Distribution and abundance of tropical freshwater shrimp along a stream corridor: response to disturbance. Biotropica. 28: 484–492.
Covich, A.P.; Crowl, T.A.; Johnson, S.L.; Varza, D.; Certain, D.L. 1991. Post-hurricane Hugo increases in atyid shrimp abundance in a Puerto Rican montane stream. Biotropica. 23: 448–454.
Cowles, H.C. 1899. The ecological relations of the vegetation on the sand dunes of Lake Michigan. Botanical Gazette. 27: 95–117, 167–202, 281–308, 361–391.
Cowley, G.T. 1970. Effect of radiation on the microfungal populations of six litter species in the Luquillo Experimental Forest. In: Odum, H.T.; Pigeon, R.F., eds. A tropical rainforest: A study of irradiation and ecology at El Verde, Puerto Rico. Oak Ridge, TN: U.S. Atomic Energy Commission: F25–F28.
Cranston, P.S. 2007. A new species of a Bromeliad phytotelm-dwelling Tanytarsus (Diptera: Chironomidae). Annals of the Entomological Society of America. 100: 617–622.
Crawford, R.M.M. 1992. Oxygen availability as an ecological limit to plant distribution. Advances in Ecological Research. 23: 93–185.
Crook, K.E.; Scatena, F.N.; Pringle, C.M. 2007. Water withdrawn from the Luquillo Experimental Forest, 2004. Gen. Tech. Rep. IITF-GTR-36. San Juan, PR: U.S. Department of Agriculture, Forest Service, International Institute of Tropical Forestry. 26 p.
Crowl, T. A.; Welsh, V.; Heartsill Scalley, T.; Covich, A. P. 2006. Effects of different types of conditioning on rates of leaf-litter shredding by Xiphocaris elongata, a neotropical freshwater shrimp. Journal of North American Benthological Society. 25:198–208.
Crowl, T.A.; Covich, A.P. 1994. Responses of a freshwater shrimp to chemical and tactile stimuli from a large decapods predator. Journal of the North American Benthological Society. 13: 291–298.
Crowl, T.A.; Covich, A.P.; Johnson, S.L.; McDowell, W.H. 1996. The role of omnivorous shrimp in controlling stream community structure, detrital processing and predation effects. Bulletin of the Ecological Society of America. 77: 147.
Crowl, T.A.; McDowell, W.H.; Covich, A.P.; Johnson, S.L. 2001. Species-specific responses in leaf litter processing in a tropical headwater stream (Puerto Rico). Ecology. 82: 775–783.
Cruz Baez, A.D.; Boswell, T.D. 1997. Atlas of Puerto Rico. Miami, FL: Cuban American National Council.
Cuevas, E.; Lugo, A.E. 1998. Dynamics of organic matter and nutrient return from litterfall in stands of ten tropical tree plantation species. Forest Ecology and Management. 112: 263–279.
Cusack, D.F.; Silver, W.L.; McDowell, W.H. 2009. Biological nitrogen fixation in two tropical forests: ecosystem-level patterns and effects of nitrogen fertilization. Ecosystems. 12: 1299–1315.
Dames and Moore. 1980. Report on the rehabilitation of Río Blanco Hydroelectric Project for Puerto Rico Electric Power Authority. Houston, TX. Job No. 11905-002-14. 77 p.
Dechaine, J.; Ruan, H.; Sánchez de Leon, Y.; Zou, X. 2005. Correlation between earthworms and plant litter decomposition in a tropical wet forest of Puerto Rico. Pedobiologia. 49: 601–607.
Denslow, J. S. 1987. Tropical rainforest gaps and tree species diversity. Annual Review of Ecology and Systematics. 18: 431–451.
Denslow, J.S.; Schultz, J.C.; Vitousek, P.M.; Strain, B.R. 1990. Growth responses of tropical shrubs to treefall gap environments. Ecology. 71:165–179.
Devoe, N.N. 1990. Differential seedling and regeneration rates in openings and under closed canopy in subtropical wet forests. New Haven, CT: Yale University. 147 p. Ph.D. dissertation.

Luquillo Experimental Forest: Research History and Opportunities 133
Dial, R.; Roughgarden, J. 1995. Experimental removal of insectivores from rain forest canopy: direct and indirect effects. Ecology. 76: 1821–1834.
Dietz, J.L. 1986. Economic history of Puerto Rico: institutional change and capitalist development. Princeton, NJ: Princeton University Press: 339 p.
Drew, A.P.; Boley, J.D.; Zhao, Y.; Johnston, M.H.; Wadsworth, F.H. 2009. Sixty-two years of change in subtropical wet forest structure and composition at El Verde, Puerto Rico. Interciencia. 34: 34–40.
Drew, M.C. 1991. Oxygen deficiency in the root environment and plan mineral nutrition. In: Jackson, M.B.; Davies, D.D.; Lambers, H., eds. Plant life under oxygen deprivation. The Hague, The Netherlands: SPB Academic Publishing: 303–316.
Edwards, P.J.; Grubb, P.J. 1982. Studies of mineral cycling in a montane rain forest in New Guinea. Iv. Soil characteristics and the division of mineral elements between the vegetation and soil. Journal of Ecology. 70: 649–666.
Edwin, R. 1997. Is Los Angeles style sprawl desirable? Journal of the American Planning Association. 63: 107–126.
Emanuel, K.A. 1987. The dependence of hurricane intensity on climate. Nature. 326: 483–485.
Emanuel, K.A. 2005. Increasing destructiveness of tropical cyclones over the past 30 years. Nature. 436: 686–688.
Everham, III. E. M. 1996. Hurricane disturbance and recovery: An empirical and simulation study of vegetation dynamics in the Luquillo Experimental Forest, Puerto Rico. Syracuse, NY: State University of New York College of Environmental Science and Forestry. Ph.D. dissertation.
Food and Agriculture Organization. 2003. State of the world’s forests 2003. Rome, Italy.
Fastie, C.L. 1995. Causes and ecosystem consequences of multiple pathways of primary succession at Glacier Bay, Alaska. Ecology. 76: 1899–1916.
Fernandez, D.S.; Fetcher, N. 1991. Changes in light availability following Hurricane Hugo in a subtropical montane forest in Puerto Rico. Biotropica. 23: 393–399.
Fernández, F.A.; Huhndorf, S.M. 2005. New species of Chaetosphaeria, Melanopsammella and Tainosphaeria gen. nov. Fungal Diversity. 18: 15–57.
Fernández, F.A.; Miller, A.N.; Huhndorf, S.M.; Lutzoni, F.M.; Zoller, S. 2006. Systematics of the genus Chaetosphaeria and its allied genera: morphological and phylogenetic diversity in north temperate and neotropical taxa. Mycologia. 98: 121–130.
Fonte, S. J. and T. D. Schowalter. 2004. Decomposition of greenfall vs. senescent foliage in a tropical forest ecosystem in Puerto Rico. Biotropica. 36: 474-482.
Fonte, S.J.; Schowalter, T.D. 2005. The influence of a neotropical herbivore (Lamponius portoricensis) on nutrient cycling and soil processes. Oecologia. 146: 423–431.
Foster, D. 1992. Land-use history (1730-1990) and vegetation dynamics in central New England, USA. Journal of Ecology. 80: 753–772.
Foster, D.R. 1988. Disturbance history, community organization, and vegetation dynamics of the old-growth Pisgah Forest, south-western New Hampshire, U.S.A. Journal of Ecology. 76: 105–134.
Foster, D.R.; Boose, E.R. 1995. Hurricane disturbance regimes in temperate and tropical forest ecosystems. In: Coutts, M.P.; Grace, J., eds. Wind and Trees. Cambridge, England: Cambridge University Press: 305–338.
Frangi, J.L. 1983. Las tierras pantanosas de la montaña Puertorriqueña. In: Lugo, A.E., ed. Los bosques de Puerto Rico. San Juan, PR: U.S. Department of Agriculture, Forest Service International Institute of Tropical Forestry and Puerto Rico Department of Natural Resources: 233-247.
Frangi, J.L.; Lugo, A.E. 1998. A flood plain palm forest in the Luquillo Mountains of Puerto Rico five years after Hurricane Hugo. Biotropica. 30: 339–348.
Frangi, J.L.; Lugo, A.E. 1992. Biomass and nutrient accumulation in ten year old bryophyte communities inside a flood plain in the Luquillo Experimental Forest, Puerto Rico. Biotropica. 24: 106–112.
Frangi, J.L.; Lugo, A.E. 1985. Ecosystem dynamics of a subtropical floodplain forest. Ecological Monographs. 55: 351–369.
Frangi, J.L.; Lugo, A.E. 1991. Hurricane damage to a flood plain forest in the Luquillo Mountains of Puerto Rico. Biotropica. 23: 324–335.
Frizano, J.; Johnson, A.H.; Vann, D.R.; Scatena, F.N. 2002. Soil phosphorus fractionation during forest development on landslide scars in the Luquillo Mountains, Puerto Rico. Biotropica. 34: 17–26.
Fu, S.; Rodriguez Pedraza. C.; Lugo, A.E. 1996. A twelve-year comparison of stand changes in a mahogany plantation and a paired natural forest of similar age. Biotropica. 28: 515–524.
Gambrell, R.P.; Patrick, W.H. 1978. Chemical and microbiological properties of anaerobic soils and sediments. In: Hook, D.D.; Crawford, R.M.M., eds. Plant life in anaerobic environments. Ann Arbor, MI: Ann Arbor Science Publ Inc.: 375–423.
Gannon, M.R. 1991. Foraging ecology, reproductive biology, and systematics of the red fig-eating bat (Stenoderma rufum) in the tabonuco rain forest of Puerto Rico. Lubbock, TX: Texas Tech University. Ph.D. dissertation.
Gannon, M.R.; Willig, M.R. 1992. Bat reproduction in the Luquillo Experimental Forest of Puerto Rico. The Southwestern Naturalist. 37: 414–419.
Gannon, M.R.; Willig, M.R. 1994. The effects of Hurricane Hugo on bats of the Luquillo Experimental Forest of Puerto Rico. Biotropica. 26: 320–331.
Gannon, M.R.; Kurta, A.; Rodriguez Duran, A.; Willig, M.R. 2005. Bats of Puerto Rico: An Island Focus and a Caribbean perspective. Lubbock, TX: Texas Tech University Press. 239 p.

134 Luquillo Experimental Forest: Research History and Opportunities
García Martinó, A.R.; Warner, G.S.; Scatena, F.N.; Civco, D.L. 1996. Rainfall, runoff and elevation relationships in the Luquillo Mountains of Puerto Rico. Caribbean Journal of Science. 32: 413–424.
Garrison, R.W.; Willig, M.R. 1996. Arboreal invertebrates. In: Reagan, D.P.; Waide, R.B., eds. The Food Web of a Tropical Rain Forest. Chicago, IL: University of Chicago Press: 183–246.
Gellis, A. 1993. The effects of Hurricane Hugo on suspended sediment loads, Lago Loíza basin, Puerto Rico. Earth Surface Processes and Landforms. 18: 505–517.
Genoways, H.H.; Baker, R.J. 1972. Stenoderma rufum. Mammalian Species. 18: 1–4.
Gentry, A. H. 1990. Four Neotropical rainforests. New Haven, CT: Yale University Press. 640 p.
Gifford, J.C. 1905. The Luquillo Forest Reserve, Porto Rico. U.S. Department of Agriculture Bureau of Forestry Bulletin Number 54.
Gleason, H. A. 1926. The individualistic concept of the plant association. Bulletin of the Torrey Botanical Club. 53:7–26.
Gleason, H. A.; Cook, M.T. 1927. Plant ecology of Porto Rico. In: Scientific Survey of Porto Rico and the Virgin Islands. New York, NY: New York Academy of Sciences: 1–173.
Glover, Lynn III. 1971. Geology of the Coamo area, Puerto Rico, and its relation to the volcanic arc-trench association: U.S. Geological Survey Professional Paper 636. 102 p.
González, G.; Seastedt, T.R. 2001. Soil fauna and plant litter decomposition in tropical and subalpine forests. Ecology. 82: 955–964.
González, G.; Huang, C.-Y.; Zou, X.; Rodriguez, C. 2006. Earthworm invasions in the tropics. Biological Invasions. 8: 1247–1256.
González, G.; García, E.; Cruz, V.; Borges, S.; Zalamea, M.; Rivera, M.M. 2007. Earthworm communities along an elevation gradient in Northeastern Puerto Rico. European Journal of Soil Biology. 43: S24–S32.
González, G.; Zou, X.; Borges, S. 1996. Earthworm abundance and species composition in abandoned tropical croplands: comparison of tree plantations and secondary forests. Pedobiologia. 40: 385–391.
González, G.; Zou, X.; Sabat, A.; Fetcher, N. 1999. Earthworm abundance and distribution pattern in contrasting plant communities within a tropical wet forest in Puerto Rico. Caribbean Journal of Science. 35: 93–100.
Graham, E.A.; Mulkey, S.S.; Kitajima, K.; Phillips, N.G.; Wright, S.S. 2003. Cloud cover limits net CO
2 uptake and growth of a rainforest
tree during tropical rainy seasons. Proceedings of the National Academy of Sciences. 100: 572–575.
Granger, R.J.; Gray, D.M. 1989. Evaporation from natural nonsaturated surfaces. Journal of Hydrology. 111: 21–29.
Grau, H.R.; Aide, T.M.; Zimmerman, J.K.; Thomlinson, J.R.; Helmer, E.; Zou, X. 2003. The ecological consequences of socioeconomic and land-use changes in postagriculture Puerto Rico. BioScience. 53: 1159–1168.
Gray, W.M. 1990. Strong association between West African rainfall and U.S. landfall of intense hurricanes. Science. 249: 1251–1256.
Gray, W.M.; Sheaffer, J.D.; Landsea, C.W. 1997. Climate trends associated with multidecadal variability of Atlantic hurricane activity. In: Diaz, H.F.; Pulwarty, R.S., eds. Hurricanes, Climate and Socioeconomic Impacts. Berlin: Springer-Verlag: 15–53.
Greathouse, E.A.; Pringle, C.M.; Holmquist, J.G. 2006a. Conservation and management of migratory fauna: dams in tropical streams of Puerto Rico. Aquatic Conservation: Marine and Freshwater Ecosystems. 16: 695–712.
Greathouse, E.A.; Pringle, C.M.; McDowell, W.H.; Holmquist, J.G. 2006b. Indirect upstream effects of dams: consequences of migratory consumer extirpation in Puerto Rico. Ecological Applications. 16: 339–352.
Greathouse, E.A.; March, J.G.; Pringle, C.M. 2005. Recovery of a tropical stream after a harvest-related chlorine poisoning event. Freshwater Biology. 50: 603–615.
Gregory, F.A.; Sabat, A.M. 1996. The effect of hurricane disturbance on the fecundity of sierra palms (Prestoea montana). Bios. 67:135–139.
Grubb P.J. 1971. Interpretation of the ‘Massenerhebung’ effect on tropical mountains. Nature. 229: 44–45.
Guariguata, M.R. 1990. Landslide disturbance and forest regeneration in the upper Luquillo mountains of Puerto Rico. Journal of Ecology. 78: 814–832.
Guariguata, M.R.; Depuy, J.M. 1997. Forest regeneration in abandoned logging roads in lowland Costa Rica. Biotropica. 29: 15–28.
Guariguata, M.R.; Larsen, M.C. 1990. Preliminary map showing landslides in El Yunque quadrangle, Puerto Rico. U.S. Geological Survey Open-file Report, 89–257, scale 1:20,000, 1 sheet.
Hall, C.A.S.; Sanford, J.A.; Hauer, F.R. 1992. The distribution and abundance of organisms as a consequence of energy balances along multiple environmental gradients. Oikos. 65: 377–390.
Hall, F.R. 1968. Baseflow recessions: a review. Water Resources Research. 4: 973–983.
Hamano, T.; Hayashi, K. 1992. Ecology of an atyid shrimp Caridina japonica (de Man, 1892) migrating to upstream habitats in the Shiwagi rivulet, Tokushima prefecture. Researches on Crustacea. 21: 1–13.
Hamilton, L.S.; Juvik, J.O.; Scatena, F.N. 1995. The Puerto Rico Tropical Cloud Forest Symposiuim: Introduction and Workshop Synthesis. In: Hamilton, L.S.; Juvik, J.O.; Scatena, F.N., eds. Tropical montane cloud forests ecological studies. 110: 1–23.
Handley, C.O.; Wilson, D.E.; Gardner, A.L. 1991. Demography and natural history of the common fruit bat Artibeus jamaicensis on Barro Colorado Island, Panama. Smithsonian Contributions to Zoology. 511, Smithsonian Institution Press.

Luquillo Experimental Forest: Research History and Opportunities 135
Hansen, M.; Richardson, B.A. 1998. A new species of Omicrus Sharp (Coleoptera: Hydrophilidae) from Puerto Rico and its larva, the first known larva of Omicrini. Systematic Entomology. 23: 1–8.
Hansen, W.F.; Marion, Huffaker, L.; Dissmeyer, G. 1985. Procedures used for determining water rights on the Caribbean National Forest. Unpublished report. 23 p. On file with: International Institute of Tropical Forestry Library, 1201 Calle Ceiba, San Juan, PR 00926–1119.
Harris, N.L. 2006. The carbon balance of a tropical forested ecosystem along and elevational gradient in the Luquillo Mountains, Puerto Rico: scaling from leaves to landscapes. Syracuse, NY: State University of New York, College of Environmental Science and Forestry. Ph.D. dissertation.
Harris, N.L.; Hall, C.A.S.; Lugo, A.E. 2008. Estimates of species- and ecosystem-level respiration of woody stems along an elevational gradient in the Luquillo Mountains, Puerto Rico. Ecological Modelling. 216: 253–264.
Harris, N.L., Hall, C.A.S. and Lugo A.E. [in press]. A test of the maximum power hypothesis along an elevational gradient in the Luquillo Mountains of Puerto Rico. Ecological Bulletins.
Harris, N.L. and Medina, E. [in press]. Changes in leaf properties across an elevation gradient in the Luquillo Mountains, Puerto Rico. Ecological Bulletins.
Hawksworth, D.L. 1993. The tropical fungal biota: census, pertinence, prophylaxis, and prognosis. In: Issac, S.; Frankland, J.C.; Watling, R.; Whalley, A.J.S., eds. Aspects of Tropical Mycology. Cambridge: Cambridge University Press: 265–293.
Heartsill Scalley, T. 2005. Characterization of riparian zone vegetation and litter production in tropical, montane rainforest along an environmental gradient. Logan, Utah: Utah State University. 114 p. Ph.D. dissertation.
Heartsill Scalley, T.; Scatena, F.N.; Lugo, A.E.; Moya, S.; Estrada Ruiz, C. R. 2010. Changes in structure, composition, and nutrients during 15 years of hurricane-induced succession in a subtropical wet forest in Puerto Rico. Biotropica. 42: 455–463.
Heartsill Scalley, T.; Crowl, T.A.; Thompson, J. 2009b. Tree Species Distributions in Relation to Stream Distance in Mid-Montane Wet Forest, Puerto Rico. Caribbean Journal of Science. 45:1–12.
Heartsill Scalley, T.; Estrada Ruiz, C.R.; Moya, S. 2006 (2009a). Patrones de lluvia, transcolación y flujo de nutrientes en las cuencas de Bisley, Bosque Experimental de Luquillo, Puerto Rico. Acta Científica. 20: 67–88.
Heartsill Scalley, T.; Scatena, F.N.; Estrada, C.; McDowell. W.H.; Lugo, A.E. 2007. Disturbance and long-term patterns of rainfall and throughfall nutrient fluxes in a subtropical wet forest in Puerto Rico. Journal of Hydrology. 333: 472–485.
Heartsill Scalley, T.; Crowl. T.A.; Townsend, M.; Covich, A.P. 2001. Freshwater shrimp population structure and distribution dynamics in a tropical rainforest stream. In: Ganeshaiah, K.N.; Uma Shaanker, R.; Sawa, K.S., eds. Tropical Ecosystems: Structure, Diversity and Human Welfare. Proceedings of the International Conference on Tropical Ecosystems. New Delhi: Oxford-ISH: 732-735.
Helmer, E.H.; Ramos, O.; López, T. del M.; Quinones, M.; Diaz, W. 2002. Mapping the forest type and land cover of Puerto Rico, a component of the Caribbean Biodiversity Hotspot. Caribbean Journal of Science. 38: 165–183.
Helmer, E.H. 2004. Forest conservation and land development in Puerto Rico. Landscape Ecology. 19: 29–40.
Hendrix, P.F.; Bohlen, P.J. 2002. Exotic earthworm invasions in North America: ecological and policy implications. BioScience. 52: 801–811.
Heyne, C.M. 2000. Soil and vegetation recovery on abandoned paved roads in a humid tropical rain forest, Puerto Rico. Las Vegas, NV: University of Nevada, Las Vegas. M.S. thesis.
Hoagland, B.W.; Collins, S.L. 1997. Gradient models, gradient analysis, and hierarchical structure in plant communities. Oikos. 78: 23–30.
Hodge, E.T. 1920. Geology of the Coamo-Guyama District: Introduction to the geology of Puerto Rico. Scientific Survey of Puerto Rico and the Virgin Islands. N.Y. Academy of Science: 2.
Holben, B.N.; Colon, J.A.; Canals, M.; Santos, F.; Clements, R.G. 1979. Precipitation distribution and raingauge networks in the Luquillo Mountains. In: River Basin energy and Environmental Planning, CEER T-40. Rio Piedras, PR: University of Puerto Rico Center for Energy and Environmental Research: 57–66.
Holdridge, L.R. 1967. Life zone ecology. Tropical Science Center. San José, Costa Rica.
Holler, J.R.; Cowley, G.T. 1970. Response of soil, root, and litter microfungal populations to radiation. In: Odum, H.T.; Pigeon, R.F., eds. A tropical rain forest: A study of irradiation and ecology at El Verde, Puerto Rico. Oak Ridge, TN: U.S. Atomic Energy Commission: F35–F39.
Holmquist, J.G.; Schmidt Gengenbach, J.M.; Yoshioka, B.B. 1998. High dams and marine-freshwater linkages: effects on native and introduced fauna in the Caribbean. Conservation Biology. 12: 621–630.
Holwerda, F., Burkard, R., Eugster, W., Scatena, F.N., Meesters, A.G.C.A., and Bruijnzeel, L.A. 2006. Estimating fog deposition at a Puerto Rican elfin cloud forest site: comparison of the water budget and eddy covariance methods. Hydrological Processes 20: 2669-2692.
Homan, J.A; Jones Jr., J.K.1975. Monophyllus redmani. Mammalian Species 57: 1–3.
Hook, D.D. 1984. Adaptations to flooding with fresh water. In: Kozlowski, T.T., ed. Flooding and plant growth, New York, NY: Academic Press: 265–294.
Horn, S.P.; Sanford, R.L. 1992. Holocene fires in Costa Rica. Biotropica. 24: 354-361.
Horton, R.E. 1919. Rainfall interception. Mon. Weather Rev. 47: 603–623.

136 Luquillo Experimental Forest: Research History and Opportunities
Horvitz, C.C.; Pascarella, J.B.; McMann, S.; Freedman, A.; Hofstetter, R.H. 1998. Functional roles of invasive non-indigenous plants in hurricane-affected subtropical hardwood forests. Ecological Applications. 8: 947–974.
Howard, R.A. 1968. The ecology of an elfin forest in Puerto Rico, 1. Introduction and composition studies. Journal of the Arnold Arboretum. 49: 381–418.
Huhndorf, S.A.; Fernández, F.A.; Lodge, D.J. 1999. Neotropical Ascomycetes 9. Jobellisia species from Puerto Rico and elsewhere. Sydowia. 51: 183–196.
Huhndorf, S.A.; Fernández, F.A.; Miller, A.N.; Lodge, D.J. 2003. Neotropical Ascomycetes 12. Mirannulata samuelsii gen. and sp. nov. and M. costaricensis sp. nov., new taxa from the Caribbean and elsewhere. Sydowia. 55: 172–180.
Huhndorf, S.A.; Miller, A.N.; Fernández, F.A. 2004. Molecular systematics of the Corolophorales and new species of Bertia, Lasiobertia and Nitschkia. Mycologia. 108: 1384–1398.
Huhndorf, S.M.; Fernández, F.A. 1998 (1999). Neotropical ascomycetes 7. Caudatispora biapiculata sp. nov. from Puerto Rico. Sydowia. 50: 200–204.
Huhndorf, S.M.; Lodge, D.J. 1997. Host specificity among wood inhabiting pyrenomycetes (Fungi, Ascomycetes) in a wet tropical forest in Puerto Rico. Tropical Ecology. 38: 307–315.
Huhndorf, S.M.; Miller, A.N.; Fernández, F.A.; Lodge, D.J. 2005. Neotropical Ascomycetes 13. Cornipulvina and Erythromada, two new genera from the Caribbean and elsewhere. Fungal Diversity. 20: 59–69.
Hulme M.; Viner, D. 1995. A climate change scenarío for assessing the impact of climate change on tropical rain forests. A report for the World Wildlife Service by the Climatic Research Unit, School of Environmental Sciences, University of East Anglia, Norwich, UK.
Hunte, W. 1978. The distribution of freshwater shrimps (Atyidae and Palaemonidae) in Jamaica. Zoological Journal of the Linnean Society of London. 64: 135–150.
Hunter, M.D. 2001. Insect population dynamics meets ecosystem ecology: effects of herbivory on soil nutrient dynamics. Agricultural and Forest Entomology. 3: 77–84.
Huntly, N. 1991. Herbivores and the dynamics of communities and ecosystems. Annual Review of Ecology and Systematics. 22: 477–503.
Iguchi, K.; Mizuno, N. 1990. Diel changes in larval drift among amphidromous gobies in Japan, especially Rhinogobius brunneus. Journal of Fish Biology. 37: 255–264.
Johnson, S.L.; Covich, A.P.; Crowl, T.A.; Estrada Pinto, A.; Bithorn, J.; Wurtsbaugh, W. 1998. Do seasonality and disturbance influence reproduction in freshwater atyid shrimp in headwater streams, Puerto Rico? Verhandlungen der Internationalen Vereinigung für theorestische und angewandte Limnologie. 26: 2076–2081.
Jones, K.E.; Barlow, K.E.; Vaughan, N.; Rodríguez Duran, A.; Gannon, M.R. 2001. Short-term impacts of extreme environmental disturbance on the bats of Puerto Rico. Animal Conservation. 4: 59–66.
Jordan, C.; Caskey, W.; Escalante, G.; Herrera, R.; Montaginini, F.; Todd, R.; Uhl, C. 1983. Nitrogen dynamics during conversion of primary Amazonian rain forest slash and burn agriculture. Oikos. 40: 131–139.
Karr, J. R. 1990. The avifauna of Barro Colorado Island the Pipeline Road, Panama. In A. H. Gentry, ed. Four Neotropical rainforests. New Haven, CT: Yale University Press: 183–198.
Karlin, E. F. 2006. Update on the distribution and ecology of Sphagnum portoricense. Bryologist. 109: 541–550.
Keefer, D.K. 1984. Landslides caused by earthquakes. Geological Society of America Bulletin. 95: 406–421.
King, P.B. 1977. The evolution of North America. Princeton, NJ: Princeton University Press.: 197 p.
Koenig, N. 1953. A comprehensive agricultural program for Puerto Rico. Washington, DC: U.S. Department of Agriculture, Forest Service.
Kubicek, C.P.; Komon Zelazowska, M.; Druzhinina, I.S. 2008. Fungal genus Hypocrea/Trichoderma: from barcodes to biodiversity. Journal of Zhejaiang University. Sciences B. 10: 753–763.
La Caro, F. and R. L. Rudd. 1985. Leaf litter disappearance rates in a Puerto Rican montane rain forest. Biotropica. 17.
Læssøe, T.; Lodge, D.J. 1994. Three host-specific Xylaria species. Mycologia. 86: 436–446.
Larsen, M.C. 2000. Analysis of 20th century rainfall and stream flow to characterize drought and water resources in Puerto Rico. Physical Geography. 21: 494–521.
Larsen, M.C. 1997. Tropical geomorphology and geomorphic work: a study of geomorphic processes and sediment and water budgets in montane humid-tropical forested and developed watersheds, Puerto Rico. Boulder, CO: Department of Geography, University of Colorado. Ph.D. dissertation.
Larsen, M.C.; Simon, A. 1993. A rainfall intensity-duration threshold for landslides in a humid-tropical environment, Puerto Rico. Geografiska. Annaler. 75A: 13–23.
Larsen, M.C.; Torres Sánchez, A.J. 1992. Landslides triggered by Hurricane Hugo in eastern Puerto Rico, September 1989. Caribbean Journal of Science. 28: 113–120.
Larsen, M.C.; Torres Sánchez, A.J. 1996. Geographic relations of landslide distribution and assessment of landslide hazards in the Blanco, Cibuco and Coamo Basins, Puerto Rico. U.S. Geological Survey Water-Resource Investigation Report 95–4029.
Larsen, M.C.; Torres Sánchez, A.J. 1998. The frequency and distribution of recent landslides in three montane tropical regions of Puerto Rico. Geomorphology. 24: 309–331.

Luquillo Experimental Forest: Research History and Opportunities 137
Larsen, M.C.; Torres Sánchez, A.J.; Conceptión, I.M. 1999. Slopewash, surface runoff and fine-litter transport in forest and landslide scars in humid-tropical steeplands, Luquillo Experimental Forest, Puerto Rico. Earth Surface Processes and Landforms. 24: 481–502.
Larsen, M.C.; Parks, J.E. 1997. How wide is a road? The association of roads and mass-wasting disturbance in a forested montane environment. Earth Surface Processes and Landforms. 22: 835–848.
Lasso, E. 2001. Reproductive constraints (resources and pollen limitation) in an elfin forest of Puerto Rico: An experimental study of Werahuia sintenisii (Bromeliaceae). Río Piedras, PR: University of Puerto Rico. M.S. thesis.
Lasso, E.; Ackerman, J.D. 2004. The flexible breeding system of Werauhia sintenisii, a cloud montane forest bromeliad from Puerto Rico. Biotropica. 36: 414–417.
Lasso, E.; Ackerman, J.D. 2003. Flowering phenology of Werauhia sintenisii, an epiphytic bromeliad from the dwarf montane forest in Puerto Rico: a possible indicator of climate change. Selbyana. 24: 95–104.
Leonard, R.E. 1967. Mathematical theory of interception. In: Sopper, W.E.; Lull, H.W., eds. Forest Hydrology. Oxford: Pergamon: 131–136.
Lewis, J.B.; Wawrd, J. 1965. Developmental stages of the palaemonid shrimp Macrobrachium carcinus (Linneaus, 1758). Crustaceana. 9: 137–148.
Lewis, W.M.J.; Melack, J.M.; McDowell, W.H.; McCLain, M.; Richey, J.E. 1999. Nitrogen yields from undisturbed watersheds in the Americas. Biogeochemistry. 46: 149–162.
Li, Y.; Xu, M.; Zou, X. 2006a. Effects of nutrient additions on ecosystem carbon cycle in a Puerto Rican tropical wet forest. Global Change Biology. 12: 284–293.
Li, Y.; Xu, V.; Zou, X. 2006b. Heterotrophic soil respiration in relation to environmental factors and microbial biomass in two wet tropical forests. Plant and Soil. 281: 193–201.
Liptzin, D.; Silver, W.L. 2009. Effects of carbon additions on iron reduction and phosphorus availability in a humid tropical forest soil. Soil Biology and Biochemistry. 41: 1696–1702.
Liu, M.; Chaverri, P.; Hodge, K.T. 2006. A taxonomic revision of the insect biocontrol fungus Aschersonia aleyrodis, its allies with white stromata and their Hypocrella sexual states. Mycological Research. 110: 537–554.
Liu, M.; Hodge, K.T. 2005. Hypocrella shong dongii sp. nov., the teleomorph of Aschersonia incrassata. Mycological Research. 109: 818–824.
Liu, Z.G.; Zou, X.M. 2002. Exotic earthworms accelerate plant litter decomposition in a Puerto Rican pasture and a wet forest. Ecological Applications. 12: 1406–1417.
Lobeck, A.K. 1922. The physiography of Porto Rico: New York Academy of Sciences, Scientific survey of Porto Rico and the Virgin Islands. Vol. 1, pt. 4: 301–379.
Lodge D.J. 1997. Factors related to diversity of decomposer fungi in tropical forests. Biological Conservation. 6: 681–688.
Lodge, D.J. 1993. Nutrient cycling by fungi in wet tropical forests. In: Isaac, S.; Frankland, J.C.; Watling, R.; Whalley, A.J.S, eds. Aspects of Tropical Mycology, BMS Symposium Series 19. Cambridge: Cambridge University Press: 37–57.
Lodge, D.J. 1996b. Fungi of Puerto Rico and the U.S. Virgin Islands: a history of previous surveys, current status, and the future. In: Figeroa Colón, J.C., ed. The scientific survey of Puerto Rico and the Virgin Islands. New York, NY: New York Academy of Sciences: 123–129.
Lodge, D.J. 1996a. Microorganisms. In: Reagan, D.P.; Waide, R.B. The food web of a tropical rain forest. Chicago, IL: University of Chicago Press: 53–108.
Lodge, D.J. 2003. Fungi of Puerto Rico, Luquillo Long Term Ecological Research [database]. 86. http://luq.lternet.edu/data/lterdb86/metadata/lterdb86.html. (December 2007).
Lodge, D.J.; Asbury, C.E. 1988. Basidiomycetes reduce export of organic matter from forest slopes. Mycologia. 80: 888–890.
Lodge, D.J., T.J. Baroni, and S.A. Cantrell. 2002. Basidiomycetes of the Greater Antilles project. pp. 45-60 In: R. Watling, J. C. Frankland, A. M. Ainsworth, S. Isaac and C. Robinson, eds., Tropical Mycology, Vol. 1, Macromycetes. Egham, UK: CABI Publishing.
Lodge, D.J.; Cantrell, S. 1995. Fungal communities in wet tropical forests: variation in time and space. Canadian Journal of Botany. (suppl. 1): S1391–S1398.
Lodge, D.J.; Scatena, F.N.; Asbury, C.E.; Sánchez, M.J. 1991. Fine litterfall and related nutrient inputs resulting from Hurricane Hugo in subtropical wet and lower montane rain forests of Puerto Rico. Biotropica. 23: 336–342.
Lodge, D.J.; Fisher, P.J.; Sutton, B.C. 1996. Endophytic fungi of
Manilkara bidentata leaves in Puerto Rico. Mycologia. 88: 733–738.
Lodge, D.J.; McDowell, W.H.; Macy, J.; Ward, S.K.; Leisso, R.; Claudio Campos, K.; Kühnert, K. 2008. Distribution and role of mat-forming saprobic basidiomycetes in a tropical forest. In: Boddy, L.; Frankland, J.C., eds. Ecology of saprobic Basidiomycetes. Amsterdam: Academic Press, Elsevier LTD: 195–208.
Lodge, D.J.; McDowell, W.H; McSwiney, C.P. 1994. The importance of nutrient pulses in tropical forests. Trends in Ecology and Evolution. 9: 384–387.
Lodge, D.J.; Læssøe, T.; Aime, M.C.; Henkel, T.W. 2008. Montane and cloud forest specialists among neotropical Xylaria species. North American Fungi. 3: 193–213.
Lu, B.; Samuels, G.J. 2003. Hypocrea stilbohypoxyli and its Trichoderma koningii-like anamorph: a new species from Puerto Rico on Stilbohypoxylon muelleri. Sydowia. 55: 255–266.
Lugo A.E.; Brinson, M.M.; Brown, S. 1990. Forested wetlands. Ecosystems of the World. New York, NY: Elsevier. 527 p.
Lugo, A.E. 1992. Comparison of tropical tree plantations with secondary forests of similar age. Ecological Monographs. 62: 1–41.

138 Luquillo Experimental Forest: Research History and Opportunities
Lugo, A. E. 2000. Effects and outcomes of Caribbean hurricanes in a climate change scenario. The Science of the Total Environment. 262: 243-251.
Lugo, A.E. 2005. Los bosques. Joglar, R.L., ed. Biodiversidad de Puerto Rico. Vertebrados terrestres y ecosistemas. San Juan, PR: Editorial del Instituto de Cultura Puertorriqueña: 395-548.
Lugo, A. E. 2004. H.T. Odum and the Luquillo Experimental Forest. Ecological Modelling. 178: 65-74.
Lugo, A.E. 2008. Visible and invisible effects of hurricanes on forest ecosystems: an international review. Austral Ecology. 33: 368–398.
Lugo, A.E.; Scatena, F.N. 1992. Epiphytes and climate change research in the Caribbean: a proposal. Selbyana. 13: 123–130.
Lugo, A.E.; Scatena, F.N. 1995. Ecosystem-level properties of the Luquillo Experimental Forest with emphasis on the tabonuco forest. In: Lugo, A.E.; Lowe, C. Tropical forests: management and ecology. New York, NY: Springer Verlag: 59–108.
Lugo, A.E.; Frangi, J.L. 1993. Fruit fall in the Luquillo Experimental Forests, Puerto Rico. Biotropica. 25: 73–84.
Lugo, A.E.; Waide, R.B. 1993. Catastrophic and background disturbance of tropical ecosystems at the Luquillo Experimental Forest. Journal of Biosciences. 18: 475–481.
Lugo, A.E.; Brown, S. 1991. Comparing tropical and temperate forests. Cole, J.G.; Lovett, G.; Findlay, S., eds. Comparative analysis of ecosystems: patterns, mechanisms, and theories. New York, NY: Springer-Verlag: 319–330.
Lugo, A.E.; Bokkestijn, A.; Scatena, F.N. 1995. Structure, succession soil chemistry of palm forests in the Luquillo Experimental Forest. In: Lugo, A.E.; Lowe, C. Tropical forests: management and ecology. New York, NY: Ecological Studies, Springer Verlag: Chapter 6.
Lugo, A.E.; Scatena, F.N.; Silver, W.; Molina Colón, S.; Murphy, P.G. 2002. Resilience of tropical wet and dry forests in Puerto Rico. In: Gunderson, L.H.; Pritchard, L.J., eds. Resilience and the behavior of large-scale systems. Washington, DC: Island Press: 195–225.
Lugo, A.E. 1986. Water and the ecosystems of the Luquillo Experimental Forest. Gen. Tech. Rep. 50-63. New Orleans, LA: U.S. Department of Agriculture, Forest Service, Southern Forest Experiment Station. 17 p.
Lugo, A.E. 1992. The search for carbon sinks in the tropics. Water, Air and Soil Pollution. 64: 3–9.
Lugo, A.E. 2004. The outcome of alien tree invasions in Puerto Rico. Frontiers in Ecology and the Environment. 2: 265–273.
Lugo, A.E.; Helmer, E. 2004. Emerging forests on abandoned land: Puerto Rico’s new forests. Forest Ecology and Management. 190: 145–161.
Lugo, A.E.; Scatena, F.N. 1995. Ecosystem-level properties of the LEF with emphasis on the Tabonuco Forest. In: Lugo, A.E.; Lowe, C., eds. Tropical Forests: Management and Ecology. New York, NY: Ecological Studies, Springer Verlag: 59–108.
Lugo, A.E.; Scatena, F.N. 1996. Background and catastrophic tree mortality in tropical moist, wet and rain forests. Biotropica. 28: 585–599.
Lugo, A.E.; Zimmerman, J.K. 2002. Ecological life histories. In: Vozzo, J.A., ed. Tropical Tree Seed Manual. Agricultural Handbook 721. Washington, DC: U.S. Department of Agriculture, Forest Service. 191–213.
Lugo, A.E.; Bokkestijn, A.; Scatena, F.N. 1995. Structure, succession, and soil chemistry of palm forests in the Luquillo Experimental Forest. In: Lugo, A.E.; Lowe, C. Tropical Forests: Management and Ecology. New York, NY: Springer-Verlag: 142–177.
Lugo, A.E.; López, T.d.M.; and Ramos, O.M. 2000. Zonificación de terrenos en la periferia de El Yunque. General Technical Report IITF-16, Río Piedras, PR: U.S. Department of Agriculture, Forest Service, International Institute of Tropical Forestry. 12 p.
Lugo, A.E.; López, T.d.M.; Ramos González, O.M.; Velez, L.L. 2004. Urbanizacion de los terrenos en la periferia de El Yunque. Gen. Tech. Rep. WO-66. Washington, DC: U.S. Department of Agriculture, Forest Service. 29 p.
Lugo, A.E.; Gucinski, H. 2000. Function, effects and management of forest roads. Forest Ecology and Management. 133: 249–262.
Lugo, A.E. and T. Heartsill Scalley. [in press] Disturbance ecology and tropical forest management at the Luquillo Experimental Forest. Experimental Forests and Ranges Book. U.S. Department of Agriculture, Forest Service.
Mader, H.J. 1984. Animal habitat isolation by roads and agricultural fields. Biological Conservation. 29: 81–96.
Magnusson, T. 1992. Studies of soil characteristics and the related soil atmosphere in forest mineral soils. Journal of Soil Science. 43: 767–790.
Magnusson, T. 1994. Studies of the soil atmosphere and related physical characteristics in peat forest soils. Forest Ecology and Management. 67: 203–224.
Mantiri, F.R.; Samuels, G.J.; Rahe, J.E. ; Honda, M. 2001. Phylogenetic relationships in Neonectria species having Cylindrocarpon anamorphs inferred from mitochondrial ribosomal DNA sequences. Canadian Journal of Botany. 79: 334–340.
March, J.G.; Pringle, C.M. 2003. Food web structure and basal resource utilization along a tropical island stream continuum, Puerto Rico. Biotropica. 35: 84–93.
March, J.G.; Pringle, C.M.; Townsend, M.J.; Wilson, A.I. 2002. Effects of freshwater shrimp assemblages on benthic communities along an altitudinal gradient of a tropical island stream. Freshwater Biology. 47: 377–390.
March, J.G.; Benstead, J.P.; Pringle, C.M.; Scatena, F.N. 1998. Migratory drift of larval freshwater shrimps in two tropical streams, Puerto Rico. Freshwater Biology. 40: 261–273.
March, J.G.; Benstead, J.P.; Pringle, C.M.; Scatena, F.N. 2003. Damming tropical island streams: problems, solutions and alternatives. BioScience. 53: 1069–1078.

Luquillo Experimental Forest: Research History and Opportunities 139
March, J.G.; Benstead, J.P.; Pringle, C.M.; Ruebel, M.W. 2001. Linking shrimp assemblages with rates of detrital processing along an elevational gradient in a tropical stream. Canadian Journal of Fisheries and Aquatic Sciences. 58: 470–478.
Marín Spiotta, E.; Swanston, C.W.; Torn, M.S.; Silver, W.L.; Burton, S.D. 2008. Chemical and mineral control of soil carbon turnover in abandoned tropical pastures. Geoderma. 143: 49–62.
Marín Spiotta, E., Ostertag, R.; Silver, W.L. 2007. Long-term patterns in tropical reforestation: plant community composition and aboveground biomass accumulation. Ecological Applications. 17: 828–839.
Marley, D.P. 1998. Spatial Modeling of Climate and Photosynthesis in the Luquillo Mountains, Puerto Rico. Syracuse, NY: State University of New York College of Environmental Science and Forestry. M.S. thesis.
Martinuzzi, S.; Gould, W.A.; Ramos González, O.M. 2007. Land development, land use, and urban sprawl in Puerto Rico integrating remote sensing and population census data. Landscape and Urban Planning. 79: 288–297.
Masteller, E.C.; Buzby, K.M. 1993. Emergence phenology of Empididae, Ceratopogonidae, and Simuliidae (Diptera) from a tropical rainforest stream at El Verde, Puerto Rico. Journal of the Kansas Entomological Society. 66: 187–191.
Mauser, M.; Schädlich, S. 1998. Modelling the spatial distribution of evapotranspiration on different scales using remote sensing data. Journal of Hydrology. 212–213: 250–267.
McDowell, W.H. 2001. Hurricanes, people and riparian zones: controls on nutrient losses from forested Caribbean watersheds. Forest Ecology and Management. 154: 443–451.
McDowell, W.H.; Estrada Pinto, A. 1988. Rainfall at the El Verde Field Station, 1964-1986. University of Puerto Rico Center for Energy and Environment Research Technical Report 228.
McDowell, W.H.; Asbury, C.E. 1994. Export of carbon, nitrogen, and major ions from three tropical montane watersheds. Limnology and Oceanography. 39: 111–125.
McDowell, W.H.; Gines Sánchez, C.; Asbury, C.E.; Ramos Perez, C.R. 1990. Influence of sea salt aerosols and long range transport on precipitation chemistry at El Verde, Puerto Rico. Atmospheric Environment. 24 (A): 2813–2821.
McDowell, W.H.; McSwiney, C.P.; Bowden, W.B. 1996. Effects of hurricane disturbance on groundwater chemistry and riparian function in a tropical rain forest. Biotropica. 28: 577–584.
McGroddy, M.; Silver, W.L. 2000. Variations in belowground carbon storage and soil CO
2 flux rates along a wet tropical climate gradient.
Biotropica. 32: 614–624.
McMahan, E. A. 1996. Termites. Pages 111-135 in D. P. Reagan and R. B. Waide, eds. The food web of a tropical rain forest. Chicago, IL: The University of Chicago Press.
Meentemeyer, V. 1977. Climatic regulation of decomposition rates of organic matter in terrestrial ecosystems. In: Adriano, D.C.; Brisbin, I.L., eds. Environmental chemistry and cycling processes. U.S. Department of Energy symposium series CONF-760429. Washington, DC: U.S. Department of Energy: 779 –789.
Meentemeyer, V. 1978. Microclimate and lignin control of litter decomposition rates. Ecology. 59: 465–472.
Megahan, W.F.; Ketcheson, G.L. 1996. Predicting downslope travel of granitic sediments from forest roads in Idaho. Water Resources Bulletin. 32: 371–382.
Meléndez Colom, E. C. 1999. Regression relationships of air temperature and elevation along an elevation gradient in the Luquillo Experimental Forest (LEF), Puerto Rico. http://luq.lternet.edu/data/lterdb90/data/bistempdata/Bis-temp.htm.
Meléndez Colom, E.C. 2009. Luquillo Experimental Forest LTER Data Management System Guidelines: A handbook to data management policies, data archival and requests. Rev. 4.2 <http://luq.lternet.edu/datamng/imdocs/division.html>.
Meyerhoff, H.A. 1933. Geology of Puerto Rico. Puerto Rico University Monography Ser. B, No. 1. 306 p.
Migenis, L.E.; Ackerman, J.D. 1993. Orchid-phorophyte relationships in a forested watershed in Puerto Rico. Journal of Tropical Ecology. 9: 231–240.
Millas, J.C. 1968. Hurricanes of the Caribbean and adjacent regions 1492-1800. Miami, FL: Academy of the Arts and Sciences of the Americas: 328 p.
Miller, R.M.; Lodge, D.J. 1997. Fungal responses to disturbance–Agriculture and Forestry. In: Esser, K.; Lemke, P.A.; Wicklow, D.T., eds. The Mycota, 1st ed., Vol. V. Environmental and microbial relationships. Berlin: Springer-Verlag: 65–84.
Miller, R.M.; Lodge, D.J. 2007. Fungal responses to disturbance–Agriculture and Forestry. In: Esser, K.; Lemke; Kubicek, P.; Druzhinina, I.S., eds. The Mycota, 2nd ed., vol IV, Environmental and microbial relationships. Berlin: Springer-Verlag: 44–67.
Minter, D.W.; Rodríguez Hernández, M.; Mena Portales, J. 2001. Fungi of the Caribbean. An annotated checklist. UK: PDMS Publishing. 946 p.
Mitchell, R.C. 1954. Survey of the geology of Puerto Rico. University of Puerto Rico Agricultural Experiment Stations Technical Paper. 13 p.
Molinelli, J.A. 1984. Geomorphic processes along the Autopista Las Americas in north central Puerto Rico: implications for highway construction, design and maintenance. Ann Arbor, MI: Clark University, University Microfilms International. 156 p. Ph.D. dissertation.
Monroe, W.H. 1968. High-level quaternary beach deposits in northwestern Puerto Rico. U.S. Geological Survey Professional Paper 600-C: 140–143.

140 Luquillo Experimental Forest: Research History and Opportunities
Moore, A.M.; Burns, L. 1970. Preliminary observations on the earthworm populations of the forest soils at El Verde. In: Odum, H.T.; Pigeon, R.F., eds. A Tropical Rain Forest: A Study of Irradiation and Ecology at El Verde. Oak Ridge, TN: U.S. Atomic Energy Commission: 283–284.
Morales Carrión, A. 1983. Puerto Rico, a political and social history. New York, NY: Norton.
Moriyama, A.; Yanagisawa, Y.; Mizuno, N.; Omori, K. 1998. Starvation of drifting goby larvae due to retention of free embryos in upstream reaches. Environmental Biology of Fishes. 52: 321–329.
Morris, J.G. 1984. Changes in oxygen tension and the microbial metabolism of organic carbon. In: Codd, G.A., ed. Aspects of microbial metabolism and ecology. New York: Academic Press: 59–96.
Morrison, D.W. 1975. The foraging behavior and feeding ecology of a neotropical fruit bat, Artibeus jamaicensis. Ithaca, NY: Cornell University. Ph.D. dissertation.
Morrison, D.W. 1978a. Influence of habitat on the foraging distances of the fruit bat Artibeus jamaicensis. Journal of Mammalogy. 59: 622–624.
Morrison, D.W. 1978b. Foraging ecology and energetics of the frugivorous bat Artibeus jamaicensis. Ecology. 59: 716–723.
Morrison, D.W. 1979. Apparent male defense of tree hollows in the fruit bat Artibeus jamaicensis. Journal of Mammalogy. 60: 11–15.
Mueller, G.M.; Schmit, J.P.; Leacock, P.R.; Buyck, B.; Cifuentes, J.; Desjardin, D.E.; Halling, R.E.; Hjortstam, K.; Iturriaga, T.; Larsson, K. H.; Lodge, D.J.; May, T.W.; Minter, D.; Rajchenberg, M.; Redhead, S.A.; Ryvarden, L.; Trappe, J.M.; Watling, R.; Wu, Q. 2007. Global diversity and distribution of macrofungi. Biodiversity and Conservation. 16: 37–48.
Mulholland, P.J.; Fellows, C.S.; Tank, J.L.; Grimm, N.B.; Webster, J.R.; Hamilton, S.K.; Marti, E.; Ashkenas, L.; Bowden, W.B.; Dodds, W.K.; McDowell, W.H.; Paul, M.J.; Peterson, B.J. 2001. Inter-biome comparison of factors controlling stream metabolism. Freshwater Biology 46: 1503–1517.
Muñoz, J.E. 1965. Timber management plan for the Luquillo Experimental Forest. Open-file Report. U.S. Department of Agriculture, Forest Service, Caribbean National Forest .
Murphy, D. J.; Hall, M.H.; Hall, C.A.S.; Heisler, G.M.; Stehman, S.V.; Anselmi Molina, C. 2010. The relationship between land cover and the urban heat island in northeastern Puerto Rico. International Journal of Climatology. DOI 10.1002/joc.2145.
Murray, M.; VanVeldhuizen, R.M., eds. 1980. Forest regeneration at high latitudes. Gen. Tech. Rep. PNW-107. Portland, OR: U.S. Department of Agriculture, Forest Service.
Myster, R.W.; Schaefer, D.A. 2003. Species and microsite effects on litter decomposition in a Puerto Rican landslide. Community Ecology. 4: 157–162.
Myster, R.W.; Walker, L.R. 1997. Plant successional pathways on Puerto Rican landslides. Journal of Tropical Ecology. 13: 165–173.
Nakane, K.; Kohno, T.; Horikoshi, T. 1996. Root respiration before and just after clear-felling in a mature deciduous, broad-leaved forest. Ecological Research. 11: 111–119.
Nathan, R.J.; McMahon, T.A. 1990. Evaluation of automated techniques for baseflow and recession analysis. Water Resources Research. 26: 1465–1473.
National Weather Service (NWS). 1990. Monthly weather reports. San Juan, Puerto Rico: U.S. Department of Commerce, National Oceanic and Atmospheric Administration, National Weather Service, Forecast Office.
Naumann, M. 1994. A water use budget for the Caribbean National Forest of Puerto Rico. Trier, Germany: Universitat Trier. 53 p. M.S. thesis.
Neumann, C.J.; Jarvinen, B.R.; Pike, A.C. 1987. Tropical cyclones of the North Atlantic Ocean 1871-1986. Third revised edition. Asheville, NC: NOAA-National Climatic Data Center.
Neumann, C.J.; Cry, G.W.; Caso, E.L.; Jarvinen, B.R. 1978. Tropical cyclones of the North Atlantic Ocean, 1871-1977. Asheville, NC: U.S. Dept. of Commerce, NOAA, National Climatic Center.
Novotny, V.; Chesters, G. 1981. Handbook of non-point pollution
sources and management. New York, NY: Van Nostrand Reinhold Company.
Nyoka, B.I. 2003. Biosecurity in forestry: a case study on the status of invasive forest tree species in Southern Africa. Forest Biosecurity Working Paper FBS/1E. Rome, Italy: Food and Agriculture Organization, Forestry Department.
O’Connor, N.A. 1991. The effects of habitat complexity on the macroinvertebrates colonizing wood substrates in a lowland stream. Oecologia. 85: 504–512.
O’Connor, P.J.; Covich, A.P.; Scatena, F.N.; Loope, L.L. 2000. Non-indigenous bamboo along headwater streams of the Luquillo Mountains, Puerto Rico: leaf fall, aquatic leaf decay and patterns of invasion. Journal of Tropical Ecology. 16: 499–516.
Odum, H.T. 1970a. An emerging view of the ecological system at El Verde. In: Odum, H.T.; Pigeon, R.F., eds. A Tropical Rain Forest: A Study of Irradiation and Ecology at El Verde. Oak Ridge, TN: U.S. Atomic Energy Commission: I–191 to I–289.
Odum, H.T. 1970b. Rain forest structure and mineral cycling homeostasis. In: Odum, H.T.; Pigeon, R.F., eds. A Tropical Rain Forest: A Study of Irradiation and Ecology at El Verde. Oak Ridge, TN: U.S. Atomic Energy Commission: Chapter H–3.
Odum, H.T. 1970c. Introduction to section F. In: Odum, H.T.; Pigeon, R.F., eds. A Tropical Rain Forest: A Study of Irradiation and Ecology at El Verde. Oak Ridge, TN: U.S. Atomic Energy Commission: F-3–F-7.
Odum, H.T. 1995. Tropical forest systems and the human economy. In: Lugo, A.E.; Lowe, C. Tropical forests: management and ecology. New York: Springer Verlag: 343–393.

Luquillo Experimental Forest: Research History and Opportunities 141
Odum, H.T.; Jordan, C. 1970. Metabolism and evapotranspiration of the lower forest in a giant plastic cylander. In: Odum, H.T.; Pigeon, R.F., eds. A Tropical Rain Forest: A Study of Irradiation and Ecology at El Verde. Oak Ridge, TN: U.S. Atomic Energy Commission: Chapter I–9.
Odum, H.T.; Pigeon, R.F., eds. 1970. A Tropical Rain Forest: A Study of Irradiation and Ecology at El Verde. Oak Ridge, TN: U.S. Atomic Energy Commission.
Odum, H.T.; Drewry, G.; Kline, J. R. 1970. Climate at El Verde, 1963-1966. In: Odum, H.T.; Pigeon, R.F., eds. A Tropical Rain Forest: A Study of Irradiation and Ecology at El Verde. Oak Ridge, TN: U.S. Atomic Energy Commission: Chapter B–22.
Olander, L.P.; Scatena, F.N.; Silver, W.L. 1998. Impacts of disturbance initiated by road construction in a subtropical cloud forest in the Luquillo Experimental Forest, Puerto Rico. Forest Ecology and Management. 109: 33–49.
Ortiz Hernández, M. 2008. Comunidades microbianas presentes en la hojarasca en diferentes estados de descomposición con o sin la abertura del dosel y la adición de detrito. Turabo, PR: Universidad del Turabo. M.S. thesis.
Ortiz Zayas J.R.; Scatena, F.N. 2004. Integrated Water Resources Management in the Luquillo Mountains, Puerto Rico: An Evolving Process. International Journal of Water Resources Development. 20: 387–398.
Ortiz Zayas, J.R. 1998. The metabolism of the Río Mameyes, Puerto Rico: carbon fluxes in a tropical rain forest river. Boulder, CO: Department of Environmental, Population and Organismal Biology, University of Colorado. Ph.D. dissertation.
Ostertag, R.; Scatena, F.N.; Silver, W.L. 2003. Forest floor decomposition following hurricane litter inputs in several Puerto Rican forests. Ecosystems. 6: 261–273.
Ostertag, R.; Silver, W.L.; Lugo, A.E. 2005. Factors affecting mortality and resistance to damage following hurricanes in a rehabilitated subtropical moist forest. Biotropica. 37: 16–24.
Padgett, D. 1976. Leaf decomposition by fungi in a tropical rainforest stream. Biotropica. 8: 166–178.
Parotta, J.A.; Lodge, D.J. 1991. Fine root dynamics in a subtropical wet forest following hurricane disturbance in Puerto Rico. Biotropica. 23: 343–347.
Parton, W.J.; Schimel, D.S.; Cole, C.V.; Ojima, D.S. 1987. Analysis of factors controlling soil organic matter levels in Great Plains grasslands. Soil Science Society of America Journal. 51: 1173–1179.
Parton, W.J.; Stewart, J.W.B.; Cole, C.V. 1988. Dynamics of C, N, P and S in grassland soils: a model. Biogeochemistry. 5: 109–131.
Parton, W.J.; Sanford, R.L.; Sánchez, P.A.; Stewart, J.W.B. 1989. Modeling soil organic matter dynamics in tropical soils. In: Coleman, D.C.; Oades, J.M.; Uehara, G., eds. Dynamics of soil carbon matter in tropical ecosystems. Honolulu, HI: University of Hawaii Press: 153–172.
Pegler, D.N. 1983. Agaric flora of the Lesser Antilles. Kew Bulletin Additional Series 9. London, England: Her Majesty’s Stationary Office.
Pescador, M.L.; Masteller, E.C.; Buzby, K.M. 1993. Composition and phenology of Ephemeroptera from a tropical rainforest stream at El Verde, Puerto Rico. Journal of the Kansas Entomological Society. 66: 151–159.
Pett Ridge, J.; Silver, W.L. 2002. Survival, growth, and ecosystem dynamics of dispersed bromeliads in a montane tropical forest. Biotropica. 34: 211–224.
Pfeiffer, W.J. 1996. Arboreal arachnids. In: Reagan, D.P.; Waide, R.B. The Food Web of a Tropical Rain Forest. Chicago, IL: The Unversity of Chicago Press: 247–271.
Pickett, S.T.A. 1989. Space-for-time substitution as an alternative to long-term studies. In: Likens, G.E., ed. Long term studies in ecology: approaches and alternatives. New York: Springer-Verlag: 110–135.
Poldmaa, K.; Samuels, G.J., Lodge, D.J. 1997. Three new polyporicolous species of Hypomyces and their Cladobotryum anamorphs. Sydowia. 49: 80–93.
Polishook, J.D.; Bills, G.F.; Lodge, D.J. 1996. Microfungi from decaying leaves of two rain forest trees in Puerto Rico. Special issue on Microbial Diversity, Journal of Industrial Microbiology. 17: 284–294.
Pringle C.M.; Scatena, F.N. 1999. Freshwater Resource Development: Case Studies from Puerto Rico and Costa Rica. In: Hatch, L.U.; Swisher, M.E., eds. Managed Ecosystems: The Mesoamerican Experience. Oxford, U.K.: Oxford University Press: 114–121.
Pringle, C.M. 1996. Atyid shrimps influence the spatial heterogeneity of algal communities over different scales in tropical montane streams, Puerto Rico. Freshwater Biology. 35: 125–140.
Pringle, C.M.; Blake, G.A. 1994. Quantitative effects of atyid shrimp (Decapoda: Atyidae) on the depositional environment in a tropical stream: use of electricity for experimental exclusion. Canadian Journal of Fisheries and Aquatic Sciences. 51: 1443–1450.
Pringle, C.M.; Blake, G.A.; Covich, A.P.; Buzby, K.M.; Finley, A. 1993. Effects of omnivorous shrimp in a montane tropical stream: sediment removal, disturbance of sessile chironomids and enhancement of understory algae biomass. Oecologia. 93: 1–11.
Pringle, C.M.; Hemphill, N.; McDowell, W.H.; Bednarek, A.; March, J.G. 1999. Linking species and ecosystems: effects of different macrobiotic assemblages on interstream differences in benthic organic matter. Ecology. 80: 1860–1872.
Proctor, J. 1983. Mineral nutrients in tropical forests. Progress in Physical Geography. 7: 422–431.
Proctor, J. 1987. Nutrient cycling in primary and old secondary rain forest. Applied Geography. 7: 132–135.

142 Luquillo Experimental Forest: Research History and Opportunities
Proctor, J. 2005. Rainforest mineral nutrition: the ‘black box’ and a glimpse inside it. In: Bonell, M.; Bruijnzeel, L.A., eds. Forests, Water, and People in the Humid Tropics. Cambridge, U.K.: Cambridge University Press: 422 –446.
Prospero, J.M.; Nees, R.T. 1986. Impact of the North African drought and El Niño on mineral dust in the Barbados trade winds. Nature. 320: 735–738.
Putz, F.E. 1983. Treefall pits and mounds, buried seeds, and the importance of soil disturbance to pioneer trees on Barro Colorado Island, Panama. Ecology. 64: 1069–1074.
Putz, F.E.; Coley, P.D.; Lu, K.; Montalvo, A.; Aiello, A. 1983. Uprooting and snapping of trees: structural determinants and ecological consequences. Canadian Journal of Forest Research. 13: 1011–1020.
Pyron, M.; Covich, A.P. 2003. Migration patterns, densities and growth of Neritina puctulata snails in Río Espíritu Santo and Río Mameyes, northeastern Puerto Rico. Caribbean Journal of Science. 39: 338–347.
Raffaele, H.A. 1983. A guide to the birds of Puerto Rico and the Virgin Islands. San Juan, PR: Fondo Educativo Interamericano.
Rand, A.S. 1964. Ecological distribution in anoline lizards of Puerto Rico. Ecology. 45: 745–752.
Raynor, B. 1995. Montane cloud forests in Micronesia: status and future management. In: Hamilton, L.S.; Juvik, J.O.; Scatena, F.N., eds. Tropical Montane Cloud Forests Ecological Studies, vol. 110. p. 274–283.
Reagan, D.P.; Waide, R.B., eds. 1996. Food web of a tropical rain forest. Chicago, IL: University of Chicago Press: 640 p.
Reagan, D.P. 1992. Congeneric species distribution and abundance in a three-dimensional habitat: the rain forest anoles of Puerto Rico. Copeia. 1992: 392–403.
Reagan, D.P. 1996. Anoline Lizards. In: Reagan, D.P.; Waide, R.B.,eds. The Food Web of a Tropical Rain Forest. Chicago, IL: University of Chicago Press: 321–346.
Reagan, D.P.; Garrison, R.W.; Martínez, J.E.; Waide, R.B.; Zucca, C.B. 1982. Tropical rain forest cycling and transport program: Phase I report. CEER-T-137. Río Piedras, PR: Center for Energy and Environment Research.
Reagan, D.P. 1991. The response of Anolis lizards to hurricane-induced habitat changes in a Puerto Rican rain forest. Biotropica. 23: 468–474.
Rice, K.; Brokaw, N.; Thompson, J. 2004. Liana abundance in a Puerto Rican forest. Journal of Forest Ecology and Management. 190: 33–41.
Richards, P.; Williamson, G.B. 1975. Treefalls and patterns of understory species in a wet lowland tropical forest. Ecology. 56: 1226–1229.
Richardson, B.A.; Richardson, M.J.; Scatena, F.N.; McDowell, W.H. 2000a. Effects of nutrient availability and other elevational changes on bromeliad populations and their invertebrate communities in a humid tropical forest in Puerto Rico. Journal of Tropical Ecology. 16: 167–188.
Richardson, B.A.; Richardson, M.J.; Soto Adames, F.N. 2005. Separating the effects of forest type and elevation on the diversity of litter invertebrate communities in a humid tropical forest in Puerto Rico. Journal of Animal Ecology. 74: 926–936.
Richardson, B.A.; Hull, G.A. 2000. Insect colonization sequences in bracts of Heliconia caribaea in Puerto Rico. Ecological Entomology. 25: 460–466.
Richardson, D.M.; Pysek, M.R.; Rejmanek, M.; Barbour, M.G.; Panetta, F.D.; West, C.J. 2000b. Naturalization and invasion of alien plants: concepts and definition. Diversity and Distributions. 6: 93–107.
Riehl. 1979. Climate and Weather in the Tropics. New York: Academic Press. 611 p.
Rinker, H.B.; Lowman, M.D.; Hunter, M.D.; Schowalter, T.D.; Fonte, S.J. 2001. Literature review: canopy herbivory and soil ecology, the top-down impact of forest processes. Selbyana. 22: 225–231.
Ritchie, M.E.; Tilman, D.; Knops, J.M.H. 1998. Herbivore effects on plant and nitrogen dynamics in oak savanna. Ecology. 79: 165–177.
Rivera Figueroa, F.J. 2008. Efecto de un disturbio natural en el perfil de ácidos grasos de comunidades microbianas en el Bosque Experimental de Luquillo en Puerto Rico. Turabo, PR: Universidad del Turabo. M.S. thesis.
Rivera Ocasio, E.; Aide, T.M.; McMillan, W.O. 2006. The influence of spatial scale on the genetic structure of a widespread tropical wetland tree, Pterocarpus officinalis (Fabaceae). Conservation Genetics. 7: 251–266.
Rivera Ramírez, H.D.; Warner, G.S.; Scatena, F.N. 2002. Prediction of master recession curves and baseflow recessions in the Luquillo Mountains of Puerto Rico. Journal of the American Water Resources Association. 38: 693–704.
Rivero, J.A. 1978. Los Anfibos y Reptiles de Puerto Rico. Río Piedras, PR: Universidad de Puerto Rico Press.
Roberts, R.C. 1942. Soil survey of Puerto Rico. U.S. Department of Agriculture, Bureau of Plant Industry Series. 1936: 38. 503 p.
Rojas, C.; Schnittler, M.; Biffi, D.; Stephenson, S.L. 2008. Microhabitat and niche separation in species of Ceratiomyxa. Mycologia. 100: 843–850.
Rosen, D.E. 1985. Geological hierarchies and biogeographic congruence in the Caribbean. Annals of the Missouri Botanical Gardens. 72: 636–959.
Ruan, H.H.; Li, Y.Q.; Zou, X.M. 2005. Soil communities and plant litter decomposition as influenced by forest debris: variation across tropical riparian and upland sites. Pedobiologia. 49: 529–538.

Luquillo Experimental Forest: Research History and Opportunities 143
Rudel, T.K.; Perez Lugo, M.; Zichal, H. 2000. When fields revert to forest: Development and spontaneous reforestation in post-war Puerto Rico. Professional Geographer. 52: 386–397.
Running, S.W.; Coughlan, J.C. 1988. A general model of forest ecosystem processes for regional applications. Part I. Hydrologic balance, canopy gas exchange and primary production processes. Ecological Modelling. 42: 125–154.
Running, S.W.; Gower, S.T. 1991. FOREST-BGC: a general model of forest ecosystem processes for regional applications. Part II. Dynamic carbon allocation and nitrogen budgets. Tree Physiology. 9: 147–160.
Russell Hunter, W.D. 1983. Overview: planetary distribution of and the ecological constraints upon the mollusca. In: Russell-Hunter, W.D., ed. The Mollusca, Volume 6, Ecology. Orlando, FL: Academic Press: 1–27.
Rutledge, A.T.; Mesko, T.O. 1996. Estimated hydrologic characteristics of shallow aquifers systems in the valley and ridge, the Blue Ridge, and the Piedmont physiographic provinces based on analysis of streamflow recession and baseflow. U.S. Geological Survey Professional Paper 1422-B.
Rutter, A.J.; Kershaw, P.C.; Robins, P.C.; Morton, A.J. 1972. A predictive model of rainfall interception in forests. 1. Derivation of the model from observations in a plantation of Corsican pine. Agricultural and Forest Meteorology. 9: 367–387.
Salivia, L.A. 1950. Historia de los temporales de Puerto Rico. San Juan, PR: Editorial Edil, Inc.
Salivia, L.A. 1972. Historia de los Temporales de Puerto Rico y las Antillas, 1492-1970. Río Piedras, PR: Editorial Edil, Inc.: 385 p.
Samuels G.J.; Lodge, D.J. 1996a. Three species of Hypocrea with stipitate stromata and Trichoderma anamorphs. Mycologia. 88: 302–315.
Samuels, G.; Chaverri, P. 2004. Hypocrea/Trichoderma (Ascomycota, Hypocreales, Hypocreaceae) species with green ascospores. Studies in Mycology. 48: 1–116.
Samuels, G.J.; Lodge, D.J. 1996b. Rogersonia, a new genus of the Hypocreales. Sydowia. 48: 250–254.
Sánchez de León, Y.; Zou, X.; Borges, S.; Ruan, H. 2003. Recovery of native earthworms in abandoned tropical pastures. Conservation Biology. 17: 999–1006.
Sánchez, M. J.; López, E.; and Lugo, A.E. 1997. Chemical and physical analyses of selected plants and soils from Puerto Rico (1981-1990). International Institute of Tropical Forestry Research Note-1. Río Piedras, PR: U.S. Department of Agriculture, Forest Service.
Santana M.; Lodge, D.J.; Lebow, P. 2005. Relationship of host recurrence in fungi to rates of tropical leaf decomposition. Pedobiologia. 49: 549–564.
Santana, C.E.; Temple, S.A. 1988. Breeding biology and diet of red-tailed hawks in Puerto Rico. Biotropica. 20: 151–160.
Santiago Valentín, E. 2008. Flora. In: Joglar, R.L., ed. Biodiversidad de Puerto Rico; Agustin Stah, flora, Hongos. Serie de historia natural. San Juan, Puerto Rico: La Editorial Universidad de Puerto Rico: 79–786.
Santiago Valentín, E.; Rivera. M. 1993. Callicarpa ampla, Ilex sintenisii, Styrax portoricensis, Ternstroemia luquillensis, and Temstroemia subsessilis recovery plan. Washington, DC: U.S. Fish and Wildlife Service.
Santos Roman, D.M.; Warner, G.S.; Scatena, F. 2003. Multivariate analysis of water quality and physical characteristics of selected watersheds in Puerto Rico. Journal of the American Water Resources Association. 39: 829–839.
Sastre, D.J.I.; Tan, B.C. 1995. Problems of bryophyte conservation in the tropics: A discussion with case example from Puerto Rico and the Philippines. Caribbean. Journal of Science. 31: 200–206.
Sastre, D.J.I.; Santiago Valentín, E. 1996. Bryology in Puerto Rico: knowledge prior to and after the Scientific Survey of Puerto Rico and the Virgin Islands. Annals of the New York Academy of Sciences. 776: 115–122.
Scatena F.N. 1998. Climate change and the Luquillo Experimental Forest of Puerto Rico: assessing the impacts of various climate change scenarios. American Water Resources Association TPS. 98: 91–96.
Scatena, F.N. 1993. The management of Luquillo cloud forest ecosystems: irreversible decisions in a non-substitutable ecosystem. Chapter 21 in Hamilton, L.S.; Juvik, J.; Scatena, F.N.; editors. Tropical montane cloud forests. Ecological Studies. Springer-Verlag. 110: 296-309.
Scatena, F.N. 1998a. A comparative ecology of the Bisley biodiversity plot and experimental watersheds, Luquillo Experimental Forest, Puerto Rico. In: Dallmeier, F.; Comiskey, J.A., eds. Forest biodiversity in North, Central, and South America and the Caribbean. New York, NY: The Parthenon Publishing Group: 213–230.
Scatena, F.N.; Lugo, A.E. 1995. Geomorphology, disturbance, and the soil and vegetation of two subtropical wet steepland watersheds of Puerto Rico. Geomorphology. 13: 199–213.
Scatena, F.N.; Larsen, M.C. 1991. Physical aspects of Hurricane Hugo in Puerto Rico. Biotropica. 23: 317–323.
Scatena, F.N.; Moya, S.; Estrada, C.; Chinea, J.D. 1996. The first five years in the reorganization of aboveground biomass and nutrient use following Hurricane Hugo in the Bisley Experimental Watersheds, Luquillo Experimental Forest, Puerto Rico. Biotropica. 28: 424–440.
Scatena, F.N. 1989. An introduction to the physiography and history of the Bisley Experimental Watersheds in the Luquillo Mountains of Puerto Rico. Gen. Tech. Rep. SO-72: San Juan, PR: U.S. Department of Agriculture, Forest Service, Southern Forest Experiment Station. 22 p.
Scatena, F.N. 1990. Watershed scale rainfall interception on two forested watersheds in the Luquillo Mountains of Puerto Rico. Journal of Hydrology. 113: 89–102.
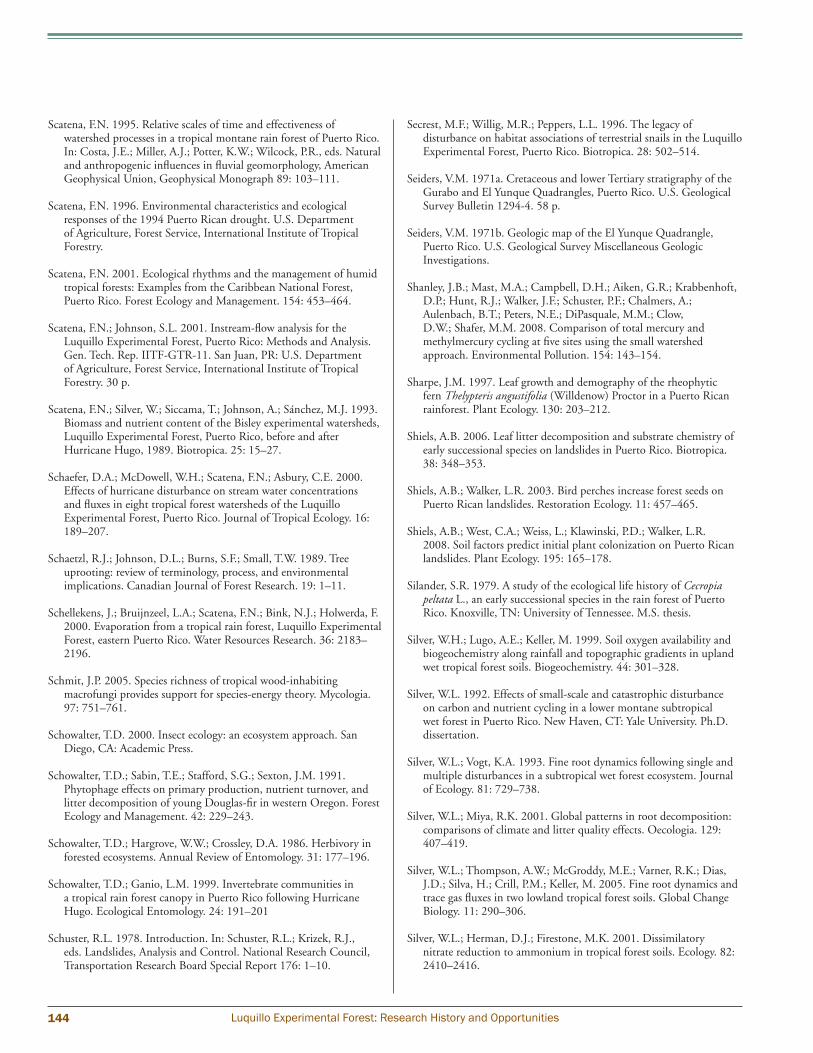
144 Luquillo Experimental Forest: Research History and Opportunities
Scatena, F.N. 1995. Relative scales of time and effectiveness of watershed processes in a tropical montane rain forest of Puerto Rico. In: Costa, J.E.; Miller, A.J.; Potter, K.W.; Wilcock, P.R., eds. Natural and anthropogenic influences in fluvial geomorphology, American Geophysical Union, Geophysical Monograph 89: 103–111.
Scatena, F.N. 1996. Environmental characteristics and ecological responses of the 1994 Puerto Rican drought. U.S. Department of Agriculture, Forest Service, International Institute of Tropical Forestry.
Scatena, F.N. 2001. Ecological rhythms and the management of humid tropical forests: Examples from the Caribbean National Forest, Puerto Rico. Forest Ecology and Management. 154: 453–464.
Scatena, F.N.; Johnson, S.L. 2001. Instream-flow analysis for the Luquillo Experimental Forest, Puerto Rico: Methods and Analysis. Gen. Tech. Rep. IITF-GTR-11. San Juan, PR: U.S. Department of Agriculture, Forest Service, International Institute of Tropical Forestry. 30 p.
Scatena, F.N.; Silver, W.; Siccama, T.; Johnson, A.; Sánchez, M.J. 1993. Biomass and nutrient content of the Bisley experimental watersheds, Luquillo Experimental Forest, Puerto Rico, before and after Hurricane Hugo, 1989. Biotropica. 25: 15–27.
Schaefer, D.A.; McDowell, W.H.; Scatena, F.N.; Asbury, C.E. 2000. Effects of hurricane disturbance on stream water concentrations and fluxes in eight tropical forest watersheds of the Luquillo Experimental Forest, Puerto Rico. Journal of Tropical Ecology. 16: 189–207.
Schaetzl, R.J.; Johnson, D.L.; Burns, S.F.; Small, T.W. 1989. Tree uprooting: review of terminology, process, and environmental implications. Canadian Journal of Forest Research. 19: 1–11.
Schellekens, J.; Bruijnzeel, L.A.; Scatena, F.N.; Bink, N.J.; Holwerda, F. 2000. Evaporation from a tropical rain forest, Luquillo Experimental Forest, eastern Puerto Rico. Water Resources Research. 36: 2183–2196.
Schmit, J.P. 2005. Species richness of tropical wood-inhabiting macrofungi provides support for species-energy theory. Mycologia. 97: 751–761.
Schowalter, T.D. 2000. Insect ecology: an ecosystem approach. San Diego, CA: Academic Press.
Schowalter, T.D.; Sabin, T.E.; Stafford, S.G.; Sexton, J.M. 1991. Phytophage effects on primary production, nutrient turnover, and litter decomposition of young Douglas-fir in western Oregon. Forest Ecology and Management. 42: 229–243.
Schowalter, T.D.; Hargrove, W.W.; Crossley, D.A. 1986. Herbivory in forested ecosystems. Annual Review of Entomology. 31: 177–196.
Schowalter, T.D.; Ganio, L.M. 1999. Invertebrate communities in a tropical rain forest canopy in Puerto Rico following Hurricane Hugo. Ecological Entomology. 24: 191–201
Schuster, R.L. 1978. Introduction. In: Schuster, R.L.; Krizek, R.J., eds. Landslides, Analysis and Control. National Research Council, Transportation Research Board Special Report 176: 1–10.
Secrest, M.F.; Willig, M.R.; Peppers, L.L. 1996. The legacy of disturbance on habitat associations of terrestrial snails in the Luquillo Experimental Forest, Puerto Rico. Biotropica. 28: 502–514.
Seiders, V.M. 1971a. Cretaceous and lower Tertiary stratigraphy of the Gurabo and El Yunque Quadrangles, Puerto Rico. U.S. Geological Survey Bulletin 1294-4. 58 p.
Seiders, V.M. 1971b. Geologic map of the El Yunque Quadrangle, Puerto Rico. U.S. Geological Survey Miscellaneous Geologic Investigations.
Shanley, J.B.; Mast, M.A.; Campbell, D.H.; Aiken, G.R.; Krabbenhoft, D.P.; Hunt, R.J.; Walker, J.F.; Schuster, P.F.; Chalmers, A.; Aulenbach, B.T.; Peters, N.E.; DiPasquale, M.M.; Clow, D.W.; Shafer, M.M. 2008. Comparison of total mercury and methylmercury cycling at five sites using the small watershed approach. Environmental Pollution. 154: 143–154.
Sharpe, J.M. 1997. Leaf growth and demography of the rheophytic fern Thelypteris angustifolia (Willdenow) Proctor in a Puerto Rican rainforest. Plant Ecology. 130: 203–212.
Shiels, A.B. 2006. Leaf litter decomposition and substrate chemistry of early successional species on landslides in Puerto Rico. Biotropica. 38: 348–353.
Shiels, A.B.; Walker, L.R. 2003. Bird perches increase forest seeds on Puerto Rican landslides. Restoration Ecology. 11: 457–465.
Shiels, A.B.; West, C.A.; Weiss, L.; Klawinski, P.D.; Walker, L.R. 2008. Soil factors predict initial plant colonization on Puerto Rican landslides. Plant Ecology. 195: 165–178.
Silander, S.R. 1979. A study of the ecological life history of Cecropia peltata L., an early successional species in the rain forest of Puerto Rico. Knoxville, TN: University of Tennessee. M.S. thesis.
Silver, W.H.; Lugo, A.E.; Keller, M. 1999. Soil oxygen availability and biogeochemistry along rainfall and topographic gradients in upland wet tropical forest soils. Biogeochemistry. 44: 301–328.
Silver, W.L. 1992. Effects of small-scale and catastrophic disturbance on carbon and nutrient cycling in a lower montane subtropical wet forest in Puerto Rico. New Haven, CT: Yale University. Ph.D. dissertation.
Silver, W.L.; Vogt, K.A. 1993. Fine root dynamics following single and multiple disturbances in a subtropical wet forest ecosystem. Journal of Ecology. 81: 729–738.
Silver, W.L.; Miya, R.K. 2001. Global patterns in root decomposition: comparisons of climate and litter quality effects. Oecologia. 129: 407–419.
Silver, W.L.; Thompson, A.W.; McGroddy, M.E.; Varner, R.K.; Dias, J.D.; Silva, H.; Crill, P.M.; Keller, M. 2005. Fine root dynamics and trace gas fluxes in two lowland tropical forest soils. Global Change Biology. 11: 290–306.
Silver, W.L.; Herman, D.J.; Firestone, M.K. 2001. Dissimilatory nitrate reduction to ammonium in tropical forest soils. Ecology. 82: 2410–2416.

Luquillo Experimental Forest: Research History and Opportunities 145
Silver, W.L.; Scatena, F.N.; Johnson, A.H.; Siccama, T.G.; Watt. F. 1996. At what temporal scales does disturbance affect belowground nutrient pools? Biotropica. 28: 441–457.
Silver, W.L.; Scatena, F.N.; Johnson, A.H.; Siccama, T.G.; Sánchez, M.J. 1994. Nutrient availability in a montane wet tropical forest in Puerto Rico: spatial patterns and methodological considerations. Plant and Soil. 164: 129–145.
Silver, W.L.; Kueppers, L.M.; Lugo, A.E.; Ostertag, R.; Matzek, V. 2004. Carbon sequestration and plant community dynamics following reforestation of tropical pasture. Ecological Applications. 14: 1115–1127.
Singh, K.P. 1989. Mineral nutrients in tropical dry deciduous forest and savanna ecosystems in India. In: Proctor, J. (ed.), Mineral nutrients in tropical forest and savanna ecosystems. London, England: Blackwell Scientific Publications: 153–168.
Snyder, N.F.R.; Wiley, J. W.; Kepler, C. B. 1987. The parrots of Luquillo: natural history and conservation of the Puerto Rican Parrot. Los Angeles, CA: Western Foundation of Vertebrate Zoology.
Sowers, G.F. 1971. Landslides in weathered volcanic in Puerto Rico. Proceedings of the 4th Panamerican Conference on Soil Mechanics and Foundation Engineering, vol. 11 Selected papers, American Society of Civil Engineers, New York: 105–115.
Stephenson, S.L.; Landolt, J.C.; Moore, D.L. 1999. Protestelids, dictyostelids and myxomycetes in the litter microhabitat of the Luquillo Experimental Forest, Puerto Rico. Mycological Research. 103: 209–214.
Stevenson, J.A. 1975. Fungi of Puerto Rico and the American Virgin Islands. Contributions of Reed Herbarium 23. Baltimore, MD: Reed Herbarium.
Stewart, M.M.; Woolbright, L.L. 1996. Amphibians. In: Reagan, D.P.; Waide, R.B., eds. The Food Web of a Tropical Rain Forest. Chicago, IL: University of Chicago Press: 273–320.
Stewart, M.M.; Pough, F.H. 1983. Population density of tropical forest frogs: relation to retreat sites. Science. 221: 570–572.
Sullivan, N. H., W. B. Bowden, and W. H. McDowell. 1999. Short-term disappearance of foliar litter in three species before and after a hurricane. Biotropica. 31: 382–393.
Tallaksen, L.M. 1995. A review of baseflow recession analysis. Journal of Hydrology. 165: 349–370.
Taylor, C. M.; Silander, S.; Waide, R. B.; Pfeiffer, W. 1995. Recovery of a tropical forest after gamma irradiation: a 23-year chronicle. In: Lugo, A.E.; Lowe, C., eds. Tropical forests: management and ecology. New York, NY: Springer-Verlag: 258–285.
Teh, Y.A.; Silver, W.L. 2006. Effects of soil structure destruction on methane production and carbon partitioning between methanogenic pathways in tropical rain forest soils. Journal of Geophysical Research-Biogeosciences. 111: G01003. doi:10.1029/2005jg000020.
Teh, Y.A.; Dubinski, E.A.; Silver, W.L.; Carlson, C.M. 2008. Suppression of methanogenesis by dissimilatory Fe(III)-reducing bacteria in tropical rain forest soils: implications for ecosystem methane flux. Global Change Biology. 14: 413–422.
Teh, Y.A.; Silver, W.L.; Conrad, M. E. 2005. Oxygen effects on methane production and oxidation in humid tropical forest soils. Global Change Biology. 11: 1283–1297.
Teh, Y.A.; Silver, W.L.; Conrad, M.E.; Borglin, S.E.; Carlson, C.M. 2006. Carbon isotope fractionation by methane-oxidizing bacteria in tropical rain forest soils. Journal of Geophysical Research. 111: G02001. doi:10.1029/2005JG000053.
Templer, P.M.; Silver, W.L.; Pett Ridge, J.; Firestone, M.K. 2008. Plant and microbial controls on nitrogen retention and loss in tropical forest soils. Ecology. 89: 3030–3040.
Thomlinson, J.R.; Rivera, L.Y. 2000. Suburban growth in Luquillo, Puerto Rico: some consequences of development on natural and semi-natural systems. Landscape and Urban Planning. 49: 15–23.
Thomlinson, J.R.; Serrano, M.I.; López, T.D.M.; Aide, T.M.; Zimmerman, J.K. 1996. Land-use dynamics in a post-agricultural Puerto Rican landscape (1936-1988). Biotropica. 28: 525–536.
Thompson, J. N. 1980. Treefalls and colonization patterns of temperate forest herbs. American Midland Naturalist. 104: 176–184.
Thompson, J.; Lugo, A.E.; Thomlinson, J. 2007. Land use history, hurricane disturbance, and introduced species survival in a subtropical wet forest in Puerto Rico. Plant Ecology. 192: 289–301.
Tiessen, H.; Cuevas, E.; Chacon, P. 1994. The role of soil organic matter in sustaining soil fertility. Nature. 371: 783–785.
Torres, J.A. 1988. Tropical cyclone effects on insect colonization and abundance in Puerto Rico. Acta Cientifica. 2: 40–44.
Torres, J.A. 1992. Lepidoptera outbreaks in response to successional changes after the passage of Hurricane Hugo in Puerto Rico. Journal of Tropical Ecology. 8: 285–298.
Torres, J.A. 1994. Wood decomposition of Cyrilla racemiflora in a tropical montane forest. Biotropica. 26: 124-140.
Torres, J.A.; González, G. 2005. Wood decomposition of Cyrilla racemiflora (Cyrillaceae) in Puerto Rican dry and wet forests: a 13-year case study. Biotropica. 37: 452–456.
Tossas, A.G. 2006. Effects of Hurricane Georges on the resident avifauna of Maricao State Forest, Puerto Rico. Caribbean Journal of Science. 42: 81–87.
Townsend, D.S.; Stewart, M.M.. 1985. Direct development in Eleutherodactylus coqui (Anura: Leptodactylidae): a staging table. Copeia. 1985: 423–436.
Townsend, M.J.; Crowl, T.A.; Phillips, R.; Covich, A.P.; Scatena, F.N. 2002. Indirect and direct abiotic controls on a species-poor stream insect assemblage. Verhandlungen der Internationalen Vereinigung für theoretische und angewandte Limnologie. 28: 919–922.
Transportation Research Board. 2002. Costs of Sprawl 2000. Transit Cooperative Research Program Report 74. Washington, DC: National Academy Press. 88 p.

146 Luquillo Experimental Forest: Research History and Opportunities
Turton, S.M. 2008. Landscape-scale impacts of Cyclone Larry on the forests of northeast Australia, including comparisons with previous cyclones impacting the region between 1858 and 2006. Austral Ecology. 33: 409–416.
Turton, S.M.; Stork, N.E. 2008. Impacts of tropical cyclones on forests in the Wet Tropics of Australia. In: Stork, N.E.; Turton, S.M., eds. Living in a Dynamic Tropical Forest Landscape. Oxford, U.K.: Wiley-Blackwell Publishing.
Uhl, C.; Clark, K.; Dezzeo, N.; Maquirino, P. 1988. Vegetation dynamics in Amazonian treefall gaps. Ecology. 69: 751–763.
Uhl, C.; Jordan, C.; Clark, H.; Herrera, R. 1982. Ecosystem recovery in Amazon caatinga forest after cutting, burning and bulldozer clearing treatments. Oikos. 38: 313–320.
U.S. Census Bureau. 2000. http://www.census.gov/census2000/states/pr.html.
U.S. Department of Commerce. 1990. National disaster survey report. Hurricane Hugo September 10-22, 1989.
U.S. Department of Energy (DOE). 2000 (July). Carbon dioxide emissions from the generation of electric power in the United States. http://www.eia.doe.gov/cneaf/electricity/page/co2_report/co2emiss.pdf.
U.S. Department of Transportation (DOT). 2002. Federal Highway Administration. http://www. Fhwa.dot.gov/ohim/hs01/mv1.htm.
Van der Molen, M.K. 2002. Meteorological impacts of land use change in the maritime tropics. Amsterdam, Netherlands: Vrije University. Ph.D. dissertation.
Van der Schalie, H. 1948. The Land and Freshwater Mollusks of Puerto Rico. Miscellaneous Publication, Museum of Zoology, University of Michigan, No. 70.
Varnes, D.J. 1978. Slope movement types and processes. In: Schuster, R.L.; Krizek, R.J., eds. Landslides, Analysis and Control. Special Report 176. Washington, DC: Transportation Research Board. National Academy of Sciences: 12–33.
Vázquez Yanes, C.; Smith, H. 1982. Phytochrome control of seed germination in the tropical rain forest pioneer trees Cecropia obtusifolia and Piper auritum and its ecological significance. New Phytologist. 92: 477–485.
Vitousek, P.M.; Denslow, J.S. 1986. Nitrogen and phosphorus availability in treefall gaps of a lowland tropical fainforest. Journal of Ecology. 74: 1167–1178.
Vogt, K.A.; Vogt, D.J.; Palmiotto, P.A.; Boon, P.; O’Harra, J.; Asbjornsen, H. 1996. Review of root dynamics in forest ecosystems grouped by climate, climatic forest type and species. Plant and Soil. 187: 159–219.
Wadsworth, F.H. 1949. The development of the forest land resources of the Luquillo Mountains of Puerto Rico. Ann Arbor, MI: University of Michigan. 480 p.
Wadsworth, F.H. 1951. Forest management in the Luquillo Mountains, part I. The setting. Caribbean Forester. 12: 93–114.
Wadsworth, F.H.; Englerth, G.H. 1959. Effects of the 1956 hurricane on forests in Puerto Rico. Caribbean Forester. 20: 38–51.
Wadsworth, F.H.; Bonnet, J. A. 1951. Soil as a factor in the occurrence of two types of montane forest in Puerto Rico. Caribbean Forester. 12: 67–70.
Wagner, R.; Richardson, B.A.; Richardson, M.J. 2008. A new psychodid species from Puerto Rican tank bromeliads. Studies on Neotropical Fauna and Environment. 43: 209–216.
Waide, R. B.; Zimmerman, J. K.; Scatena, F. N. 1998. Controls of primary productivity: Lessons from the Luquillo mountains in Puerto Rico. Ecology. 79: 31–37.
Waide, R.B. 1991. The effect of Hurricane Hugo on bird populations in the Luquillo Experimental Forest, Puerto Rico. Biotropica. 24: 475–480.
Waide, R.B. 1996. Birds. In: Reagan, D.P.; Waide, R.B., eds. The Food Web of a Tropical Rain Forest. Chicago, IL: University of Chicago Press: 363–398.
Waide, R.B.; Lugo, A.E. 1992. A research perspective on disturbance and recovery of a tropical montane forest. In: Goldammer, J.G., ed. Tropical Forests in Transition. Basel, Switzerland: Birkhäuser Verlag: 173–190.
Walker, J. [in press]. The prehistoric island to 1508. In: Robinson, K.; Bauer, J.; Lugo, A.E., eds. Passing the baton from the tainos to tomorrow: forest conservation in Puerto Rico. Rio Piedras, PR: U.S. Department of Agriculture Forest Service, International Institute of Tropical Forestry. 17–27.
Walker, L.R. 1991. Tree damage and recovery from Hurricane Hugo in Luquillo Experimental Forest, Puerto Rico. Biotropica. 23: 379–385.
Walker, L.R. 1994. Effects of fern thickets on woodland development on landslides in Puerto Rico. Journal of Vegetation Science. 5: 525–532.
Walker, L.R. 1995. Timing of post-hurricane tree mortality in Puerto Rico. Journal of Tropical Ecology. 11: 315–320.
Walker, L.R. 2000. Seedling and sapling dynamics of treefall pits in Puerto Rico. Biotropica. 32: 262–275.
Walker, L.R.; Shiels, A.B. 2008. Post-disturbance erosion impacts carbon fluxes and plant succession on recent tropical landslides. Plant and Soil. 313: 205–216.
Walker, L.R.; Zarin, D.J.; Fetcher, N.; Myster, R.W.; Johnson, A.H. 1996a. Ecosystem development and plant succession on landslides in the Caribbean. Biotropica. 28: 566–576.
Walker, L.R.; Voltzow, J.; Ackerman, J.D.; Fernandez, D.S.; Fetcher, N. 1992. Immediate impact of Hurricane Hugo on a Puerto Rican rain forest. Ecology. 73: 691–694.
Walker, L.R.; Zimmerman, J.K.; Lodge, D.J.; Guzman Grajales, S. 1996b. An altitudinal comparison of growth and species composition in hurricane-damaged forests in Puerto Rico. Journal of Ecology. 84: 877–889.

Luquillo Experimental Forest: Research History and Opportunities 147
Wang, H. 2001. Dynamic modeling of the spatial and temporal variations of forest carbon and nitrogen inventories, including their responses to hurricane disturbances, in the Luquillo Mountains, Puerto Rico. Dissertation. Syracuse, NY: State University of New York.
Wang, H.; Hall, C.A.S. 2004. Modeling the effects of Hurricane Hugo on spatial and temporal variation in primary productivity and soil carbon and nitrogen in the Luquillo Experimental Forest, Puerto Rico. Plant and Soil. 263: 69–84,
Wang, H.; Hall, C.A.S.; Scatena, F.N.; Fetcher, N.; Wu, W. 2003. Modeling the spatial and temporal variability in climate and primary productivity across the Luquillo Mountains, Puerto Rico. Forest Ecology and Management. 179: 69–94.
Wang, H.; Hall, C.A.S.; Cornell, J.D.; Hall, M.H.P. 2002. Spatial dependence and the relationship of soil organic carbon and soil moisture in the Luquillo Experimental Forest, Puerto Rico. Landscape Ecology. 17: 671–684.
Wang, H.; Cornell, J.D.; Hall, C.A.S.; Marley, D.P. 2002. Spatial and seasonal dynamics of surface soil carbon in the Luquillo Experimental Forest, Puerto Rico. Ecological Modelling. 147: 105–122.
Weathers, K.C.; Likens, G.E.; Bormann, F.H.; Bicknell, S.H.; Bormann, B.T.; Daube, B.C.J.; Eaton, J.S.; Galloway, J.N.; Keene, W.C.; Kimball, K.D.; McDowell, W.H.; Siccama, T.G.; Smiley, D.; Tarrant, R.A. 1988. Cloudwater chemistry from ten sites in North America. Environmental Science and Technology. 22: 1018–1026.
Weaver, P.L. 1995. The colorado and dwarf forests of Puerto Rico’s Luquillo Mountains. In: Lugo, A.E.; Lowe, C., eds. Tropical forests: management and ecology. New York, NY: Springer Verlag 112: 109–141.
Weaver, P.L. 1991. Environmental gradients affect forest composition in the Luquillo Mountains of Puerto Rico. Interciencia. 16: 142–151.
Weaver, P.L. 2000. Environmental gradients affect forest structure in Puerto Rico’s Luquillo Mountains. Interciencia. 25: 254–259.
Weaver, P.L.; Murphy, P. G. 1990. Forest structure and productivity in Puerto Rico’s Luquillo Mountains. Biotropica. 22: 69–82.
Weaver, P.L. 1986a. Growth and age of Cyrilla racemiflora L. in montane forests of Puerto Rico. Interciencia. 11: 221–228.
Weaver, P.L. 1986b. Hurricane damage and recovery in the montane forests of the Luquillo Mountains of Puerto Rico. Caribbean Journal of Science. 22: 53–70.
Weaver, P.L. 1987. Structure and dynamics in the colorado Forest of the Luquillo Mountains of Puerto Rico. East Lansing, Michigan: Michigan State University. Ph.D. dissertation.
Webb, S.L. 1988. Windstorm damage and microsite colonization in two Minnesota forests. Canadian Journal of Forest Research. 18: 1186–1195.
Wein, R.W.; Wein, G.; Bahret, S.; Cody, W. 1992. Northward invading non-native vascular plant species in and adjacent to Wood Buffalo National Park, Canada. The Canadian Field Naturalist. 106: 216–224.
Wetmore, A. 1916. Birds of Puerto Rico. U.S. Department of Agriculture Bulletin 326. Washington, DC: U.S. Government Printing Office.
Whistler, W.A. 1995. The cloud forest of Samoa. In: Hamilton, L.S.; Juvik, J.O.; Scatena, F.N., eds. Tropical Montane Cloud Forests Ecological Studies. 110: 353–362.
White, A.F.; Blum, A.E. 1995. Effects of climate on chemical weathering rates in watersheds. Geochimica et Cosmochimica Acta. 59: 1729–1747.
White, D.G.; Childers, N.F. 1945. Bamboo for controlling soil erosion. Journal of the American Society of Agronomy. 37: 839–847.
Whitmore, T.C. 1989. Tropical forest nutrients, where do we stand? A tour de horizon. In: Proctor, J., ed. Mineral nutrients in tropical forest and savanna ecosystems. London, England: Blackwell Scientific Publications: 1–13.
Whittaker, R.J. 1996. Disturbed island ecology. Trends in Ecology and Evolution. 10: 421–425.
Wiegert, R.G. 1970. Energetics of the nest-building termite, Nasutitermes costalis (Holm-gren), in a Puerto Rican forest. In: Odum, H. T.; Pigeon, R.F., eds. A Tropical Rain Forest: A Study of Irradiation and Ecology at El Verde. Oak Ridge, TN: U.S. Atomic Energy Commission.
Wiley, J.W.; Bauer, G.P. 1985. Caribbean National Forest, Puerto Rico. American Birds. 39: 12–18.
Willig, M.R.; Bauman, A. 1984. Notes on bats from the Luquillo Mountains of Puerto Rico. CEER-R-194: 1-12, Center for Energy and Environmental Research, University of Puerto Rico.
Willig, M.R.; Camilo, G.R. 1991. The effect of Hurricane Hugo on six invertebrate species in the Luquillo Experimental Forest of Puerto Rico. Biotropica. 23: 455–461.
Willig, M.R.; Gannon, M.R. 1996. Mammals. In: Reagan, D.P.; Waide, R.B., eds. The Food Web of a Tropical Rain Forest. Chicago, IL: University of Chicago Press: 399–432.
Willig, M.R.; Bloch, C.P.; Brokaw, N.; Higgins, C.; Thompson, J.; Zimmermann. C.R. 2007. Cross-scale responses of biodiversity to hurricane and anthropogenic disturbance in a tropical forest. Ecosystems. 10: 824–838.
Willig, M.R.; Sandlin, E.A.; Gannon, M.R. 1993. Structural and taxonomic components of habitat selection in ithe neotropical folivore Lamponius portoricensis (Phasmatodea: Phasmatidae). Population Ecology. 22: 634–641.
Willig, M.R.; Secrest, M.F.; Cary, J.F.; Cox, S.B.; Camilo, G.R.; Gannon, M.R. 1998. Long-term monitoring of snails in the Luquillo Experimental Forest of Puerto Rico: heterogeneity, scale, disturbance, and recovery. In: Dallmeier, F.; Comisky, J., eds. Forest Biodiversity in North, Central, and South America and the Caribbean: Research and Monitoring. Lancashire, UK: UNESCO and The Parthenon Press: 293 –322.

148 Luquillo Experimental Forest: Research History and Opportunities
Willig, M.R.; Moorehead, D.L.; Cox, S.B.; Zak, J.C. 1996. Functional diversity of soil bacteria communities in the tabonuco forest: The interaction of anthropogenic and natural disturbance. Biotropica. 28: 471–483.
Wischmeier, W.H.; Smith, D.D. 1978. Predicting rainfall erosion losses–a guide to conservation planning. Agriculture Handbook No. 537. Washington, DC: U.S. Department of Agriculture.
Woolbright, L.L. 1996. Disturbance influences long-term population patterns in the Puerto Rican frog, Eleutherodactylus coqui (Anura: Leptodactylidae). Biotropica. 28: 493–501.
Woolbright, L.L. 1991. The impact of Hurricane Hugo on forest frogs in Puerto Rico. Biotropica. 23: 426–467.
Woolbright, L.L.; Hara, A.H.; Jacobsen, C.M.; Mautz, W.J.; Benevides, F.L.J. 2006. Population densities of the coqui, Eleutherodactylus coqui (Anura: Leptodactylidae) in newly invaded Hawaii and in native Puerto Rico. Journal of Herpetology. 40: 122–126.
Wooster, K.M., 1989. A geographically-based microclimatological computer model for mountainous terrain with application to the Luquillo Experimental Forest in Puerto Rico. Syracuse, NY: State University of New York College of Environmental Science and Forestry. M.S. thesis.
Wright, M.S.; Covich, A.P. 2005. Relative importance of bacteria and fungi in a tropical headwater stream: leaf decomposition and invertebrate feeding preference. Microbial Ecology. 49: 536–546.
Wu, W.; Hall, C.A.S.; Zhang, L. 2006a. Predicting the temporal and spatial probability of orographic cloud cover in the Luquillo Experimental Forest in Puerto Rico using generalized linear (mixed) models. Ecological Modelling. 192: 473–498.
Wu, W.; Hall, C.A.S.; Scatena, F.N.; Quackenbush, L.J. 2006b. Spatial modeling of evapotranspiration in the Luquillo Experimental Forest of Puerto Rico using remotely-sensed data. Journal of Hydrology. 328: 733–752.
Wu, W.; Hall, C.A.S.; Scatena, F.N. 2007. Modeling the impact of recent land cover changes on the stream flows in North-Eastern Puerto Rico. Hydrological Processes. 21: 2944–2956. DOI: 10.1002/hyp.6515.
Wunderle, J.M.J.; Lodge, D.J.; Waide, R.B. 1992. Short-term effects of Hurricane Gilbert on terrestrial bird populations on Jamaica. The Auk. 109: 148–166.
Wunderle, J.M. J.; Mercado, J.E.; Parrsol, B.; Terranova, E. 2004. Spatial ecology of Puerto Rican boas (Epicrates inornatus) in a hurricane-impacted forest. Biotropica. 36: 555–571.
Wunderle, J.M. J. 1995. Responses of bird populations in a Puerto Rican forest to Hurricane Hugo: the first 18 months. Condor. 97: 879–896.
Wunderle, J.M., J.; Díaz, A.; Velázquez, I.; Scharron, R. 1987. Forest openings and the distribution of understory birds in a Puerto Rican rainforest. Wilson Bulletin. 99: 22–37.
Yang, X.; Warren, M.; Zou, X. 2007. Fertilization responses of soil litter fauna and litter quantity, quality and turnover in low and high elevation forests of Puerto Rico. Applied Soil Ecology. 37: 63–71.
You, C. 1991. Population dynamics of Manilkara bidentata (A.DC.) Cher. In the Luquillo Experimental Forest, Puerto Rico. Knoxville, TN: University of Tennessee. Ph.D. dissertation.
Zalamea, M.; González, G. 2008. Leaffall phenology in a subtropical wet forest in Puerto Rico: From species to community patterns. Biotropica. 40: 295–304.
Zalamea, M.; González, G.; Ping, C.; Michaelson, G. 2007. Soil organic matter dynamics under decaying wood in a subtropical wet forest: effect of tree species and decay stage. Plant and Soil. 296: 173–185.
Zarin, D.J. 1993. Nutrient accumulation during succession in subtropical lower montane wet forests, Puerto Rico. Philadelphia, PA: University of Pennsylvania. Ph.D. dissertation.
Zarin, D.J.; Johnson, A.H. 1995. Base saturation, nutrient cation, and organic matter increases during early pedogenesis on landslide scars in the Luquillo Experimental Forest, Puerto Rico. Geoderma. 65: 317–330.
Zimmerman, J.K.; Wright, S.J.; Calderón, O.; Pagan, M.A.; Paton, S. 2007. Flowering and fruiting phenologies of seasonal and aseasonal neotropical forests: the role of annual changes in irradiance. Journal of Tropical Ecology. 23: 231–251.
Zimmerman, J. K.; Pulliam, W. M.; Lodge, D.J.; Quiñones Orfila, V.; Fetcher, N.; Guzmán Grajales, S.; Parrotta, J.A.; Asbury, C.E.; Walker, L.R.; Waide, R.B. 1995. Nitrogen immobilization by decomposing woody debris and the recovery of tropical wet forest from hurricane damage. Oikos 72: 314–322.
Zimmerman, J.K.; Everham, E.M., III; Waide, R.B.; Lodge, D.J.; Taylor, C.M.; Brokaw, N.V.L. 1994. Responses of tree species to hurricane winds in subtropical wet forest in Puerto Rico: implications for tropical tree life histories. Journal of Ecology. 82: 911–922.
Zou, X.; González, G. 1997. Changes in earthworm density and community structure during secondary succession in abandoned tropical pastures. Soil Biology and Biochemistry. 29: 627–629.
Zou, X.; Zucca, C.; Waide, R.B.; McDowell, W.H. 1995. Long-term influence of deforestation on tree species composition and litter dynamics of a tropical rain forest in Puerto Rico. Forest Ecology and Management. 78: 147–157.

