lubricant consumption and used oil generation in ...20141512.pdf · contractor s report i lubricant...
TRANSCRIPT

Contractor s Report i
Lubricant Consumption and
Used Oil Generation in
California: A Segmented
Market Analysis
Part II: Collectable Used Oil
Availability in California, 2000-2011
California Department of Resources Recycling and Recovery January 7, 2012
’
Contractor’s Report Produced Under Contract By:
Kline & Company, Inc.
S T A T E O F C A L I F O R N I A
Edmund G. Brown Jr. Governor
Matt Rodriquez Secretary, California Environmental Protection Agency
DEPARTMENT OF RESOURCES RECYCLING AND
RECOVERY
Caroll Mortensen Director
Department of Resources Recycling and Recovery Public Affairs Office
1001 I Street (MS 22-B) P.O. Box 4025
Sacramento, CA 95812-4025 www.calrecycle.ca.gov/Publications/
1-800-RECYCLE (California only) or (916) 341-6300
Publication # DRRR 2014-1512
To conserve resources and reduce waste, CalRecycle reports are produced in electronic format only. If printing copies of this document, please consider use of recycled paper containing
100 percent postconsumer fiber and, where possible, please print images on both sides of the paper. Copyright © 2014 by the California Department of Resources Recycling and Recovery
(CalRecycle). All rights reserved. This publication, or parts thereof, may not be reproduced in any form without permission.
Prepared as part of contract number DRR 12004 ($95,000).
The California Department of Resources Recycling and Recovery (CalRecycle) does not discriminate on the basis of disability in access to its programs. CalRecycle publications are available in accessible formats upon request by calling the Public Affairs Office at (916) 341
6300. Persons with hearing impairments can reach CalRecycle through the California Relay Service, 1-800-735-2929.
Disclaimer: This report was produced under contract by Kline & Company, Inc. The
statements and conclusions contained in this report are those of the contractor and not
necessarily those of the Department of Resources Recycling and Recovery (CalRecycle), its
employees, or the State of California and should not be cited or quoted as official Department
policy or direction.
The state makes no warranty, expressed or implied, and assumes no liability for the
information contained in the succeeding text. Any mention of commercial products or
processes shall not be construed as an endorsement of such products or processes.
Contractor’s Report ii
TABLE OF CONTENTS
Page Number
1. FOREWORD 1
2. INTRODUCTION 3 2.1. Methodology 3 2.2. Definitions of Lubricant Losses in Consumption 5 2.3. Comparing Used Oil “Recoverability” with Actual Collection Data 5
3. STUDIES OF LUBRICANTS LOSSES IN CONSUMPTION 7 3.1. Available Studies 7 3.2. Estimated Losses-in-Use 10 3.3. Commentary on Methodology of Other Studies 11
4. KLINE’S LOSS-IN-USE ASSESSMENTS AND END-USE MODELS 12 4.1. Overall Approach 12 4.2. Passenger Car Motor Oil (PCMO) 13 4.3. Two- and Four-Stroke Non-Commercial Engine Oil 14 4.4. Heavy-Duty Motor Oil (HDMO) 15 4.5. Railroad Locomotive Engine Oil 17 4.6. Marine Engine Oil 18 4.7. Transformer Oil 22
4.8. Metalworking Fluids 24 4.9. White Oils 25 4.10. Other Lubricant Applications 26
5. CALIFORNIA LUBRICANTS CONSUMPTION, USED OIL RECOVERABILITY, AND COLLECTION EFFICIENCY 28
5.1. Lubricants Consumption and Overall Losses 28 5.2. Used Oil Recoverability 31 5.3. Dry Used Oil Collected 32 5.4. Collection Efficiency 34
APPENDIX 36 Reference Studies and Sources Reviewed 36

1. FOREWORD
LUBRICANT CONSUMPTION AND USED OIL GENERATION IN CALIFORNIA: A Segmented Market Analysis examines California, whose economy is the largest of all the states; in addition, California’s legislative efforts to improve its understanding of opportunities to enhance the collection and recycling of used lubricating oils reinforce the focus on this state. Specifically, California S.B. 546 mandates the conduct of the Used Oil Life-Cycle (LCA) Assessment Project, under the auspices of CalRecycle. Kline’s study will provide valuable insights to all engaged in the ongoing analysis of the California lubricants market. Kline’s study of the California lubricants market is in two parts: Part I (published in September 2012) details the methodology employed in, and results of, Kline’s projections of historical and future California lubricants consumption by major segments and applications from 2000 to 2020. Detailed statistics on the consumption of lubricants at the state level are available from neither public nor proprietary sources. Crude estimates of state-level base stock consumption by blenders are made in the U.S. Energy Information Administration’s SEDS database, but these data are unreliable. CalRecycle’s Used Oil Recycling Rate Annual Reports also provide summary figures on California’s lubricants consumption, but these reports are widely believed to overstate industrial demand, due to the data-gathering procedures employed. Moreover, no public data source attempts to segment state-level lubricants consumption in California beyond aggregated Automotive and Industrial end-use totals. As a result Kline employed allocation proxies to estimate California’s likely share of total U.S. lubricant consumption for each end-use application. These proxies were based, in general, on California’s share of total U.S. consumption, as variously measured by fuels use (gasoline, diesel or bunker fuel), industry segment economic activity (manufacturing GDP, employment and other industrial activity measures), or o ther measures of activity related to the specific application analyzed. Part II (this report, published in December 2012), which develops estimates of historical “theoretically-collectable” used oil availability in California, from 2000-2011. These projections were developed by applying estimated percentages of losses-in-use in a broad range of automotive and industrial lubricants applications to the California consumption estimates prepared in Part I of the study. Consumption less losses-in-use are taken to be the volume of theoretically collectable used oil. To be consistent with other work in progress on CalRecycle’s LCA study, Kline has prepared estimates of “dry” used oil collectability (net of assumed water content), grouped into the state’s definitions of Lubricant (internal combustion engine-related uses) and Industrial use.
1

A second part of the Part II study draws on the work by the University of California at Santa Barbara (UCSB), an LCA study contractor retained by CalRecycle to refine the state’s understanding of used oil collection data in California, as variously reported to CalRecycle and the California Department of Toxic Substances Control (DTSC). In order to make these data directly comparable with Kline’s estimates of “collectable” used oil, the CalRecycle and DTSC data, as classified by UCSB, were adjusted downward by Kline to reflect the projected water contents of used oil and oily wastewater volumes recycled. These adjustments have thus produced estimates of “dry” used oil collection in California. Finally, this report compares Kline’s estimated dry collectable used oil availability in California with adjusted actual dry used oil recycled volumes for 2000-2011, in order to understand the state’s effective used oil “collection efficiency.” This measure indicates the potential gap between actual and potential used oil collection and, hence, a sense of how much uncollected waste lubricating oil may be targeted by additional regulatory or educational policy instruments crafted by the state.
2
2.1. Methodology
2. INTRODUCTION
Fewer than 10 studies (see Chapter 3 and Appendix A for bibliography and sources) have been published over the past 30 years which attempt to estimate the “losses-inuse” associated with lubricants use in a variety of applications. Some of these studies estimate losses in certain applications, but not others; a few describe the processes and data u sed to derive their estimates, though using flawed methodologies; and some estimate losses with no justification whatsoever. Accordingly it is not possible, from the previous work published in this field, to develop a consensus of lubricants losses in key applications, nor any reliable basis for understanding how advances in lubricants specifications and end-use technology may have caused those losses to evolve over time. As a result, Kline has returned to first principles in its analysis of those lubricant applications where used oil collectability is material (such as for Passenger Car Motor Oil – PCMO), or where there is significant uncertainty as to the means of disposal of used oil, for example in marine engines. Conversely, Kline has not examined in detail those applications where lubricants are completely consumed in industrial process operations, such as in the tire and rubber industry, where all process oil used forms part of the finished product. A second use where technical losses are total is in small two-stroke engines, where lubricating oil is mixed with fuel and fully combusted in operation. Used oil recoverability is thus a function of the volume of lubricants originally consumed in each application and the loss-in-use in that application. In the major automotive lubricant uses of PCMO and HDMO (Heavy-Duty Motor Oils used in trucks and off-road equipment) a simple lifecycle model was employed to simulate the mass balance of lubricant entering and exiting a typical vehicle engine over its useful life (Figure 2-1).
3
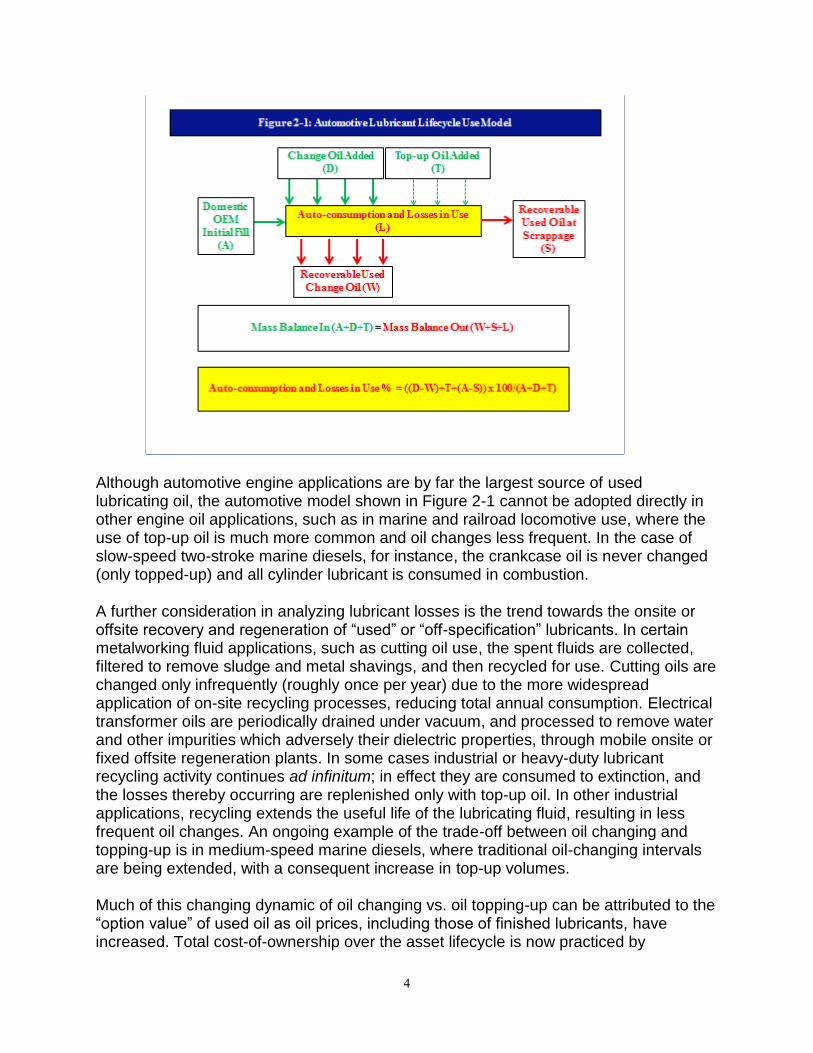
Although automotive engine applications are by far the largest source of used lubricating oil, the automotive model shown in Figure 2-1 cannot be adopted directly in other engine oil applications, such as in marine and railroad locomotive use, where the use of top-up oil is much more common and oil changes less frequent. In the case of slow-speed two-stroke marine diesels, for instance, the crankcase oil is never changed (only topped-up) and all cylinder lubricant is consumed in combustion.
A further consideration in analyzing lubricant losses is the trend towards the onsite or offsite recovery and regeneration of “used” or “off-specification” lubricants. In certain metalworking fluid applications, such as cutting oil use, the spent fluids are collected, filtered to remove sludge and metal shavings, and then recycled for use. Cutting oils are changed only infrequently (roughly once per year) due to the more widespread application of on-site recycling processes, reducing total annual consumption. Electrical transformer oils are periodically drained under vacuum, and processed to remove water and other impurities which adversely their dielectric properties, through mobile onsite or fixed offsite regeneration plants. In some cases industrial or heavy-duty lubricant recycling activity continues ad infinitum; in effect they are consumed to extinction, and the losses thereby occurring are replenished only with top-up oil. In other industrial applications, recycling extends the useful life of the lubricating fluid, resulting in less frequent oil changes. An ongoing example of the trade-off between oil changing and topping-up is in medium-speed marine diesels, where traditional oil-changing intervals are being extended, with a consequent increase in top-up volumes. Much of this changing dynamic of oil changing vs. oil topping-up can be attributed to the “option value” of used oil as oil prices, including those of finished lubricants, have increased. Total cost-of-ownership over the asset lifecycle is now practiced by
4

sophisticated lubricant consumers. If used oil can be burned onsite at the generator’s facility, as opposed to being sold or donated to a collector, it may have significantly greater value to the generator than its “collection value.” Thus used marine engine oil not employed in cylinder applications may be, after extensive recycling, burned onboard as bunker fuel, thereby reducing the amount of Bunker C or marine diesel fuel which the vessel operator must purchase. A more common example is in the use of waste change oil collected at retail oil-change shops, or in municipal and commercial fleet service garages. These used oil generators may be paid a nominal sum (usually no more than 50 cents/gallon, and more often less) for waste oil supplied to collectors. If these generators are located in colder climates with significant space heating needs during winter it is far more economical for them to burn the used lube oil for heat than to purchase No. 2 heating oil or natural gas, whose cost to the generator is several multiples of the used oil’s collection value. Such internal use is never reported in used oil flows, but is responsible for the materially lower levels of used oil collection reported in northern states with significant heating degree-day climates. This effect may, as a result, impact used oil “collectability” in Northern California, where winter temperatures may create a need for seasonal space heating.
2.2. Definitions of Lubricant Losses in Consumption
In this study Kline has elected to define lubricant losses and auto-consumption according to two distinct definitions:
Technical Loss – which describes the estimated proportion of lubricants consumption “disappearance” due to auto-consumption and related losses in handling, and
Practical Loss – which estimates the amounts of theoretically-recoverable used oil which may be recoverable in each application after certain common practices for internal consumption of generated used oil are recognized. Though some recovered used automotive engine oil may be burned for space heating in Northern California, an analysis of the specifics of such possible internal use is beyond the scope of this study. Accordingly, Kline has assumed that all technically-available used PCMO and HDMO volumes are practically-recoverable in California.
The above loss factors have been applied to the estimated consumption of lubricants in each end-use application, developed in Kline’s Part I study, to derive an assessment over time of used oil recoverability.
2.3. Comparing Used Oil “Recoverability” with Actual Collection Data
This Part II study draws on ongoing work by the University of California at Santa Barbara (UCSB), a Senate Bill 546-funded LCA study contractor, to refine the state’s understanding of reported used oil collection in California, as variously reported to CalRecycle and DTSC. In order to make these data directly comparable with Kline’s
5

estimates of “collectable” used oil, the CalRecycle and DTSC data, as modified by UCSB, were adjusted downward by Kline to reflect the estimated “typical” water contents of used oil and oily wastewater volumes recycled, of 5 percent and 85 percent, respectively. These adjustments, which were agreed with UCSB, produced data on “dry” used oil collection in the state. By comparing “dry” used oil recoverability on a technical and practical basis with adjusted “dry” used oil collections data, as determined by UCSB and Kline, it was possible to develop a time series of “percent recovery,” indicating the progress achieved in California in approaching 100 percent collection of recoverable used oil generated instate.
6

3. STUDIES OF LUBRICANTS LOSSES IN CONSUMPTION
3.1 Available Studies
The increasing price of crude oil on world markets has driven lubricants prices ever higher, prompting a series of OEM and end-user responses to more efficiently employ this valuable resource. Some of the key trends impacting lubricant consumption worldwide are:
Extended vehicle engine oil drain intervals.
Transition from two-stroke to four-stroke engines in certain uses.
Increased use of in-plant or on-board recycling in some large volume applications.
These trends, in aggregate, will run counter to the demographic and econometric growth imperatives of higher vehicle populations and increasing GDP. Thus lubricating oil consumption will grow slowly, at best, in mature markets as these forces collide.
Despite the global cost of finished lubricants, which is roughly $100 billion/year, relatively little serious study has been devoted to-date towards gaining a better understanding of end-use efficiency and after-market used lube disposition. Players in the used oil collection, aggregation and re-refining businesses are mostly small, privately-owned organizations who do not reveal much, if anything, about their operations in the public domain.
Over the past 40 years only a handful of published studies have addressed the topic of lubricant losses and auto-consumption in use. Some are derivative, and none can be regarded as academically rigorous. These studies (listed in Appendix A) focus on lubricants losses (or their reciprocal, used oil recoverability after use) in North America or Europe, drawing principally on earlier work published by Weinstein (1974), Bider (1985) and Dietly (1991). The two most comprehensive studies on the subject are:
(i) Argonne National Laboratory’s 1995 study, “Assessment of Opportunities to Increase the Recovery and Recycling Rates of Waste Oils,” authored by Graziano and Daniels, and
(ii) The U.S. Department of Energy’s 2006 report to Congress, “Used Oil Re-refining Study to Address Energy Policy Act of 2005, Section 1838.”
Neither of these studies developed original research on, or estimates of, lubricants losses-in-use, choosing instead to cite the by-then outdated papers of Weinstein, Bider, Dietly et al. Other more recent studies, published in Europe, the U.S. and Canada also address the issue of lubricants losses in consumption, but are either not comprehensive in their coverage of losses by end-use, do not reveal the basis for their estimates, or are based on flawed methodology.
7

Kline has summarized the various estimates of used lube oil recoverability prepared or referenced in these various studies in Table 3-1. The eight sources displayed in this table show a wide divergence in estimated lubricating oil recoverability, ranging from 6795 percent in PCMO and 59-85 percent in HDMO.
8

-
Table 3 1: Estimated "Collectable" Percentage of Annual Lubricants Consumption
Product Grade and/or
Application
Weinstein
1974
Argonne
1995
EuropaLab
2002
Netcen
2004
Spence (B.C.)
2005
UNEP
2006
RGS
2006
Kline
2009
PCMO Multigrade 67% 75% 92% 85% 95% 94%
Monograde 90%
Off-Road 2-Stroke 0%
4-Stroke 93%
ATF 80% 96% 50% 88%
Gear Oils 95% 30% 88% Light Duty
Greases 0% 10%
HDMO Multigrade 59% 75% 83% 85% 83% 81%
HTF Hydraulic 10% 80% 95% 80% 89%
Tractor 75% 80%
Gear Oils 80% 30% 84% Heavy-
Duty
Greases
0% 10%
Process
Oils
Electrical 27% 95% 98%
White Oils 10% 0% 0%
Rubber 10% 0% 0%
Aromatic 0% 0%
Paraffinic 0% 0%
Naphthenic 0% 0%
Synthetic 0% 0%
Industrial
Engine
Oils
Marine 50% 10% 40% 34%
Railroad 20% 37% 93%
Natural Gas 20% 20% 93%
Other 93%
Metalwork
ing
Fluids
(MWF)
Removal 100% 20% 34%
Forming 60% 20% 0%
Treating 60% 20% 0%
Other/Total 10% 20% 0% Hydraulic
Fluids Non-synthetic 76% 80% 70-80% 10% 90%
Other
Industrial
Oils
Gear Oils 59% 80% 20%
Turbine Oils 59% 50% 80%
Compressor Oils 60% 50% 30% Refrigeration
Oils 32% 20%
All/Other 73% 80% 71% Industrial
Greases 0% 10% 0%
9

- - -
TOTAL LUBRICANTS NA 58% 46% 52% 70% NA NA 66%
3.1. Estimated Losses-in-Use
The reciprocal of used oil recoverability is “auto-consumption and losses-in-use.” For those studies which have estimated total lubricant losses (consumption less recoverable used oil) a time series of overall losses as a percentage of consumption is displayed in Figure 3-1.
60
55
50
45
Overall
Loss % 40
35
30
25
20
Dietly Argonne
Europalab
Netcen
Spence
Kline Kline Loss % = 864 - 0.41(Year)
R² = 0.16
1985 1990 1995 2000 2005 2010 2015
Figure 3 1: Comparison of Estimated Total Losses in Use
in North American or European Lubricants Consumption
Year of Loss Estimate
While the correlation coefficient (R2) in this chart is relatively low, the negative slope of minus 0.4%/year tends to support the anecdotal evidence in support of greater used oil recoverability over time, as previously discussed. The estimates use (or are believed to use) different estimating methodologies, contributing to the low degree of correlation. Not coincidentally the two outliers in Figure 3-1 (the Europalab and Spence studies) are the most methodologically inferior; thus the degree of confidence in the trend towards lower lubricants losses is actually greater than might be inferred from the totality of the data points. The apparent trend towards lower aggregate lubricant losses cannot continue ad infinitum. Industrial process lubricants will continue to be consumed totally in the manufacture of the product of which they form part (excluding dielectric fluids and small volumes of white oils). Marine lubricants, and two-stroke engine oils, will continue also
10

to be largely or completely consumed in operation. Due to advances in engine design and lubricant formulations PCMO and HDMO losses will continue to drop, but are unlikely to fall below 5 percent and 10 percent respectively. As a result aggregate losses in lubricants consumption will likely asymptote in the range of 20-25 percent. Accordingly, Kline has assumed an average decline rate in aggregate lubricant losses of 0.3%/year in the 2000-2010 decade, and 0.2%/year during the 2011-2020 time frame.
3.2. Commentary on Methodology of Other Studies
Most studies available in the public domain do not describe the methodology used to derive the estimated percentages of lubricants consumption which may be recoverable as used oil. As such it is not possible to critique the estimates – they are reported as-is. Only the Weinstein (1974) and Spence (2005) studies describe their methodologies. The Weinstein study used the most comprehensive approach, surveying end-users in a wide variety of applications regarding their lubricant consumption experience. The actual data developed by Weinstein was not reported, nor were the methods used to convert the survey data into used oil recoverability percentages. Since the Weinstein paper was produced almost 40 years ago we have elected to give its findings limited weight, due to the changes in lubricants end-use patterns in the ensuing timeframe. Spence, in his study of the British Columbia used oil market, obtained data from commercial and municipal establishments on top-volumes supplied to the vehicles they serviced. Spence equated top-up volumes with total losses; from Kline’s lifecycle model (shown in Figure 2-1) it is evident that Spence failed to account for losses in change oil, thereby underestimating total losses.
11

4. KLINE’S LOSS-IN-USE ASSESSMENTS AND END-USE MODELS
4.1. Overall Approach
In this study Kline has returned to first principles in estimating lubricant auto-consumption and losses-in-use in the key, large volume applications. Eight end-uses were specifically singled out for analysis, either because they were large-volume applications which contributed materially to used oil recoverability, or because there was uncertainty in the basis for estimating losses. The end-uses so analyzed were:
Passenger Car Motor Oil (PCMO)
Two- and Four-stroke Non-Commercial Engine Oil
Heavy-Duty Motor Oil (HDMO)
Railroad Locomotive Engine Oil
Marine Engine Oil
Transformer Oil
Metalworking Fluids (MWFs), and
White Oils
These eight uses constitute at least two-thirds of California’s estimated lubricants consumption in 2010, and three-quarters of the state’s expected used oil recoverability. Process oil losses (other than in electrical and white oils) were not evaluated, since lubricants are consumed entirely in operation and form part of the finished product; as a result there is no uncertainty regarding the percentage of loss. Losses in all other, minor uses were estimated by Kline based on a review of other studies.
Kline’s estimates of lubricants losses in the above uses were developed through a program of interviews with key players in each application, supplemented by literature reviews of public domain articles or studies which addressed lubricants consumption or losses in those end-uses. In most cases a total U.S. model construct was developed to simulate annual flows of lubricants in these applications. The losses, expressed as a percent of total annual U.S. consumption in that application, were then applied to California.
An important distinction must be made between used oil which is theoretically recoverable at the point of generation, and that which may stand a reasonable chance of actual collection. Loss-in-use studies can only estimate the used oil which may remain after the user has decided that the oil has reached the end of its useful life, and that used oil has been physically removed from its point of use. Kline refers to this amount as “Technically Recoverable” used oil. In practice, however, some part of used oil thereby obtained may be practically uncollectable due to losses in recycling, or to industry practice, such as the burning of used marine engine oils as bunker fuel. A more salient example, previously discussed in Section 2.1 of this report, is the situation of DIFM oil-change shops and commercial garages which burn used oil they aggregate from oil changes for space heating in winter. This practice is driven completely by the economic imperative of the used oil’s “collection value” vis-à-vis its “option value” as a
12

fuel in competition with natural gas or heating oil. While Southern California has very limited winter space heating needs, this is less true in Northern California or in the mountains, where some collected used oil may be burned at the generator’s location. Amassing data on on-site used oil burning at California generators’ facilities is a topic which may be within the purview of the LCA contractors to analyze, but is well beyond the scope of this study. As a result, Kline has elected to equate “Technically Recoverable” and “Practically Recoverable” used oil volumes in PCMO and HDMO applications, recognizing that this may overstate somewhat the true extent of practical recoverability in these uses in California.
4.2. Passenger Car Motor Oil (PCMO)
PCMO used in the lubrication of light-duty vehicle (LDV) internal combustion engines is the largest single source of prospectively-recoverable used oil, and thus is a key end-use for loss analysis. Somewhat surprisingly, no peer-reviewed academic study of lifecycle lubricants losses in the U.S. light-duty vehicle fleet has ever been performed. The range of estimated losses in PCMO use, expressed as a percentage of annual consumption, varies from 5-33 percent between the various sources identified by Kline. Due to the unknown, derivative, or at best questionable methodologies used in these cited sources, Kline returned to first principles in developing estimates of PCMO losses in operation.
A survey was conducted with more than 20 DIFM (do-it-for-me) fast lube franchises, where the owner was asked to provide records or, in the absence of records, estimates of the relative volumes of used oil collected vs. fresh change oil added at each oil change. The responses were then processed to derive an estimate of average annual losses per oil change. T he average recoverability of used oil collected vs. fresh fill added indicated by the survey was 89.7 percent, equivalent to a loss of 10.3 percent.
These data were then embedded in a pro forma model of U.S. lubricants consumption derived from Kline’s proprietary databases and studies (summarized in T able 4-1). Kline’s studies suggest that, proportionally, relatively small volumes of PCMO are consumed in domestic OEM original fill, and in LDV crankcase fluid topping-up, and limited volumes of used oil are recovered upon scrappage. By far the largest use of PCMO is in fresh change oil, and by far the largest source of used oil is from DIFM and DIY (do-it-yourself) oil changes. The data developed from the survey of DIFM operators was adjusted to account for the losses associated with DIY oil changers, where losses are expected to be somewhat higher (14 percent) due to greater vehicle ages, less frequent oil changes, and inferior used oil draining and handling practices. This produced an estimated overall loss of 12.5 percent. In addition, Kline attempted to reproduce the survey data, based on a theoretical construct of oil consumption per LDV engine-rated power output, at an assumed oil loss of 0.03 grams/KWh. This alternative analysis produced an estimated annual loss of 15 percent. These two approaches were averaged to obtain a loss of 13.8 percent, as shown in Table 4-1.
13

-
Table 4 1: Indicative U.S. Light Duty Vehicle Engine Oil (PCMO) Flows in 2009
PCMO Engine Oil
Sources & Disposition
Inventory Volume Balance
Light Duty
Vehicle
Population
Gross
Volume
In
Gross
Volume
Out
(Million Units)
(Million Gals)
(Million Gals)
Domestic OEM Initial Fill 5.7/year 7.1 0.0 Operations 239 Fresh Fill - Change Oil (Fast Lubes) 196.5 0.0 Fresh Fill - Change Oil (Other DIFM) 141.2 0.0 Fresh Fill - Change Oil (DIY) 135.3 0.0 Fresh Fill - Top Up Oil 10.6 0.0 Change Oil Disposed of 0.0 416.1 Auto-consumption, Leakage & Other Losses 0.0 67.5
Scrappage 10.4/year 0.0 8.3 TOTAL 490.7 491.9
TECHNICAL LOSS AS % OF CONSUMPTION 13.8%
As noted above, the range of losses variously estimated by others in PCMO use is very wide; Kline’s estimate of PCMO losses is somewhat higher than certain recent studies, largely due to the fact that these studies, we believe, did not fully account for oil-change losses. The variations in vehicle types, power rating, use characteristics, and age of the U.S. LDV fleet renders a simple “one-size-fits-all” model potentially unrepresentative. Moreover, oil losses in a single vehicle vary over its useful life; oil consumption is typically high during the break-in period of the first 1,000 miles, then it drops to a lower, threshold level when rings and cylinders become fully compatible. As the vehicle ages further, specific oil consumption rises once again as oil blow-by increases with cylinder deformation and ring wear.
The LDV analysis summarized in Table 4-1 is thus indicative of norms in U.S. automobile and light truck use. Kline has not attempted to simulate different parameters around use of the LDV fleet in California, though fleet composition and miles-driven are somewhat different from those in the country as a whole. Though miles-driven per vehicle are lower in California than the U.S. average (10,400 vs. 12,300 for the entire vehicle fleet in 2010), this effect may be offset by the higher proportion of stop-and-go driving in the state, which would act to counter that disparity.
4.3. Two- and Four-Stroke Non-Commercial Engine Oil
Kline’s Part I report discussed the diverse set of largely off-road two- and four-stroke engine-powered vehicles and equipment making up the U.S. 2-T and 4-T park. Essentially all uses of two-stroke engines are in off-road applications, where they may be preferred on account of their greater portability and handling capability relative to
14

four-strokes. Thus 2-Ts are found in non-lawnmower garden equipment (chain saws, leaf blowers, trimmers, edgers, etc.), some marine outboard engines, smaller off-road motorcycles (dirt bikes), snowmobiles, and certain types of ATVs. By definition, since lubricating oil is admixed with fuel in the operation of this equipment, losses-in-use are 100 percent of consumption, save for minor volumes of lubricants which may be salvageable upon retirement. However, any such volumes are likely more than offset by OEM or user initial fill; as a result Kline considers that all lubricants volumes sold in off-road 2-T u ses are totally consumed in use and are, thereby, completely unrecoverable.
From an overall inventory perspective, lawnmowers account for the largest number of off-road 4-T units, numbering some 55 million in the U.S. Other principal uses of non-LDV 4-T driven units are in pleasure boats (essentially all stern-drive, and a majority of outboard, engines), larger ATVs, on-road motorcycles, snow blowers, and smaller, low-HP farm tractors. Due to the wide variety of applications using such engine types, the large spread in rated power output, and the irregularity of their use, it is not possible to develop a single model of lubricants use which fits all applications. However, with the possible exception of motorcycles, all other 4-T engine uses are more appropriately judged based on engine-hours (where certain norms of engine oil loss per HP-hour may apply), rather than miles-driven. Additionally, care and maintenance of 4-T units is almost always less stringent than in LDVs, and engine design is frequently more about ruggedness and reliability than fuel and lubricating oil use-efficiency. Based on our assessment of lubricating oil losses in LDV and heavy-duty automotive applications, Kline believes that annual lubricant percentage losses in the 4-T category would exceed those in modern, high-efficiency on-road gasoline- and diesel-powered engines, due to their smaller scale, erratic use, and lower efficiency. This led to an estimate of 20-30 percent of losses in consumption in annual 4-T lubricating oil use (a mean loss estimate of 25 percent of annual consumption was used in this analysis).
4.4. Heavy-Duty Motor Oil (HDMO)
Heavy-duty vehicle (HDV) engine oil is consumed in a broad array of on-and off-road vehicles, including tractor-combos, single-unit Class 3-8 trucks (both ICE- and dieselengine-powered), larger farm tractors, and all other heavy off-road equipment, used primarily in the agricultural, mining and construction sectors. While diesel engines power all large engines in this group, gasoline-powered units account for some 10-12 percent of the total of 25 million vehicles in the heavy-duty vehicle category, heavily concentrated in on-road single-unit Class 3-8 trucks. Unlike LDVs, where oil pan capacity is traditionally estimated at an average 5 quarts, with a nominal amount dedicated to the oil filter, lubricating oil inventory becomes significant in the HDV fleet. Tractor-trailer motive units, depending on the manufacturer and engine displacement, may have sump capacities ranging from 5-15 gallons. Additionally, oil filters may hold from 1-3 gallons. Large off-road units, such as earthmovers, may have substantially greater sump capacities still.
15

The HDV category embodies some characteristics of the LDV category (as applied to on-road vehicles) and some of the 4-T group, which is essentially off-road. Thus tractor-combos and Class 3-8 single unit trucks may be evaluated based on miles-driven, while farm tractors and other off-road equipment are judged on engine-hours. A second, key distinction between the LDV and HDV classes is that the former are essentially all ICE gasoline-powered units, while more than 90 percent of fuel consumed by HDVs is in diesel engines. The fundamental design of diesel engines, though leading to higher thermodynamic efficiency, results incidentally in higher specific lubricant consumption due to their higher compression ratios and operating temperatures, which produce more blow-by, volatility loss, and contaminant deposition in the crankcase oil, than internal combustion engines. Kline conducted a limited survey of single unit Class 3-8 truck fleets in municipal or commercial operation, using the same methodology as for the DIFM survey in the LDV category. This survey confirmed the generally higher level of losses in this category vis-à-vis LDV use, with a median loss of 14.2 percent of annual consumption. This loss percentage could not be applied to the entire inventory of HDV vehicles, however, due to the profoundly different demographics of on-road and off-road fleets, and because tractor-combos are employed substantially more, and in different modes, from single unit trucks. Accordingly Kline constructed a model of typical operating characteristics of the four key groups of HDV vehicles, based on either miles-driven or engine-hours operated, and applying estimated engine oil losses in grams/KWh to each group. This analysis showed that lubricant losses in off-road vehicles exceeding 50 percent are much higher than on-road uses, and that the tractor-combo loss rate is roughly double that of single-unit trucks. HDV vehicles are the first in a series of increasingly heavy-duty engine oil applications where specific engine oil loss percentages are noted to increase with engine design, capacity and mobility. For example, tractor-combos are engaged largely in interstate commerce with the result that oil changes are less frequent than in vehicles with lower mileage which return frequently to a central service facility.
16

- Table 4 2: Indicative U.S. Heavy Duty Vehicle Engine Oil (HDMO) Flows in 2008
HDMO Engine Oil Sources & Disposition
Inventory Volume Balance
Heavy-Duty Vehicle
Population
Gross Volume
In
Gross Volume
Out
(Thousand) (Million Gals)
(Million Gals)
Domestic OEM Initial Fill 270/year 1.6 0.0 Operations
Fresh Fill - Change Oil (Tractor-Combos) 2,590 124.3 0.0 Fresh Fill - Change Oil (Other Class 3-8 Vehicles) 9,130 87.6 0.0 Fresh Fill - Change Oil (Off-Highway Vehicles) 13,200 141.2 0.0 Fresh Fill - Top Up Oil (On-Highway Vehicles) 33.0 0.0 Fresh Fill - Top Up Oil (Off-Highway Vehicles) 30.2 0.0
Change Oil Disposed of 0.0 332.3 Auto-consumption, Leakage & Other Losses 0.0 84.1
Scrappage 150/year 0.0 0.8 TOTAL 418.0 417.1
TECHNICAL LOSS AS % OF CONSUMPTION 20.1%
As a result, and as illustrated in Table 4-2, topping-up accounts for a greater proportion of HDMO consumption (15 percent) than in PCMO (only 2 percent). When the various groups of HDV engine types and use characteristics are combined, overall engine oil losses in this category are estimated at fractionally over 20 percent.
4.5. Railroad Locomotive Oil
Railroad locomotives in the U.S. are supplied by two dominant manufacturers (GE Transportation (a division of General Electric) whose main plant is in Erie, Pennsylvania, and Electro-Motive Diesel (EMD, a subsidiary of Caterpillar) based in McCook, Illinois. All GE locomotives are, and have always been, 4-stroke units, while those of EMD have been predominantly 2-stroke until recently. At the present time GE controls nearly 70 percent o f the U.S. freight locomotive market, while EMD’s share is 30 percent. A characteristic design of locomotive engines employed in the U.S. is the workhorse GE four-stroke AC4400CW series, with a rated power output of 4,400 HP and an e ngine lubricating oil tank capacity of 410 gallons. Interviews were conducted with GE Transportation and with select railroad companies to understand conventional practices and protocols for locomotive lubricants use, as well as means of disposition of used engine oils. Unlike large slow-speed marine diesels, locomotive 2-stroke engine designs function more or less similarly to 4-strokes, since there is no discrete cylinder oil lubricant use where the oil is burned along with the fuel. Thus 2-stroke diesel locomotives have somewhat higher specific lubricant consumption (approximately 10-15 percent) relative to 4-strokes of the same capacity, but not materially so.
17
-
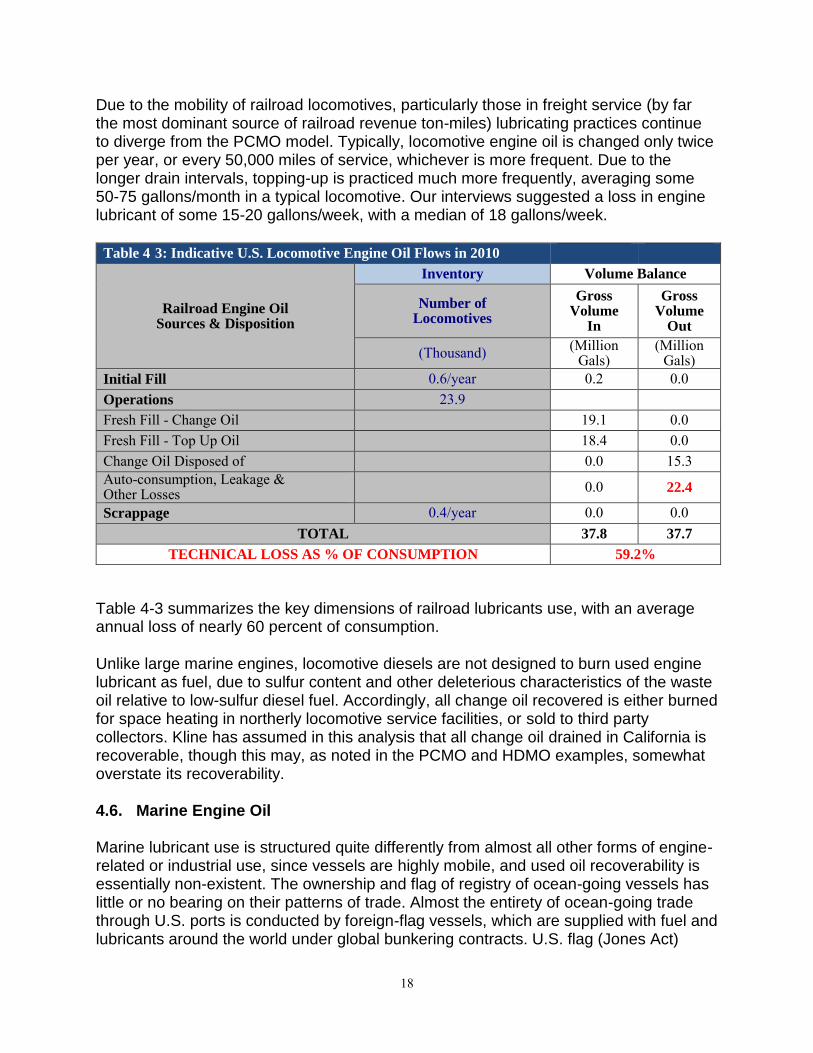
Due to the mobility of railroad locomotives, particularly those in freight service (by far the most dominant source of railroad revenue ton-miles) lubricating practices continue to diverge from the PCMO model. Typically, locomotive engine oil is changed only twice per year, or every 50,000 miles of service, whichever is more frequent. Due to the longer drain intervals, topping-up is practiced much more frequently, averaging some 50-75 gallons/month in a typical locomotive. Our interviews suggested a loss in engine lubricant of some 15-20 gallons/week, with a median of 18 gallons/week.
Table 4 3: Indicative U.S. Locomotive Engine Oil Flows in 2010
Railroad Engine Oil Sources & Disposition
Inventory Volume Balance
Number of Locomotives
Gross Volume
In
Gross Volume
Out
(Thousand) (Million Gals)
(Million Gals)
Initial Fill 0.6/year 0.2 0.0 Operations 23.9 Fresh Fill - Change Oil 19.1 0.0 Fresh Fill - Top Up Oil 18.4 0.0 Change Oil Disposed of 0.0 15.3 Auto-consumption, Leakage & Other Losses 0.0 22.4
Scrappage 0.4/year 0.0 0.0 TOTAL 37.8 37.7
TECHNICAL LOSS AS % OF CONSUMPTION 59.2%
Table 4-3 summarizes the key dimensions of railroad lubricants use, with an average annual loss of nearly 60 percent of consumption.
Unlike large marine engines, locomotive diesels are not designed to burn used engine lubricant as fuel, due to sulfur content and other deleterious characteristics of the waste oil relative to low-sulfur diesel fuel. Accordingly, all change oil recovered is either burned for space heating in northerly locomotive service facilities, or sold to third party collectors. Kline has assumed in this analysis that all change oil drained in California is recoverable, though this may, as noted in the PCMO and HDMO examples, somewhat overstate its recoverability.
4.6. Marine Engine Oil
Marine lubricant use is structured quite differently from almost all other forms of engine-related or industrial use, since vessels are highly mobile, and used oil recoverability is essentially non-existent. The ownership and flag of registry of ocean-going vessels has little or no bearing on their patterns of trade. Almost the entirety of ocean-going trade through U.S. ports is conducted by foreign-flag vessels, which are supplied with fuel and lubricants around the world under global bunkering contracts. U.S. flag (Jones Act)
18
commercial trade in vessels of greater than 50DWT is essentially restricted to coast-wise, lake-wise and riverine movements, principally in PADD’s II and III, propelled almost totally by tugs, powered barges, ferries and marine supply boats. As a result, there is no significant relationship between the location of marine lubricants supply, and its disposition, since the vast majority of tonnage-weighted shipping calling in U.S. ports may elect to procure lubricants at any port-of-call around the world. In practice, the means by which marine lubricants are employed, with high levels of top-volumes and relatively insignificant oil changes, require ship operators to purchase marine lubricants at frequent intervals, often at every port. Reported U.S. sales of marine lubricants, as shown in Table 4-4 (sourced from Kline proprietary studies) are driven to a very small degree by vessels under U.S. registry and engaged in inter- or intra-state commerce in the U.S. and much more by foreign-flag commerce. The mobility of this demand, as it is for marine bunkers and jet fuel, is such that, if marine lubricants prices at U.S. ports become out of line with those in foreign ports, substantial volumes of demand will migrate to the lower-cost supply option. Management of ocean-going fleets also extends to regular maintenance and end-of-life scrapping. Thus dry-docking of all but U.S. flag vessels occurs outside the U.S. (impacting the location of marine oil-changing). Vessel scrapping and end-of-useful-life recovery of marine lubricants likewise occurs in low-labor-cost environments, such as the Indian Subcontinent, again resulting in only nominal recovery of retired engine oil in the U.S. Marine engine propulsion systems fall into three principal categories: slow-speed 2stroke diesels, medium-speed 4-stroke diesels, and high-speed diesels and other forms of propulsion. Of these, slow-speed diesels predominate in power-weighted tonnage in the world vessel fleet (82 percent), while medium-speed diesels account for 16 percent. Medium-speed diesels are usually reserved for vessels which require higher average cruising speeds such as container ships. High-speed diesels and other propulsion systems (such as diesel-electric and gas turbines) account for only 2 percent of the global fleet by DWT-HP, and are reserved for specialized vessels, such as cruise ships, ferries, and small-scale vessels. Table 4-4 summarizes estimated sources of uses in marine lubricants in 2010; each engine type is discussed in the following sub-sections.
19

-
Table 4 4: Indicative U.S. Marine Engine Oil Flows in 2010
Marine Engine Oil Sources & Disposition
Inventory Volume Balance
World Fleet by
Engine HP
Gross Volume
In
Gross Volume
Out
(%) (Million
Gals) (Million
Gals) Initial Fill in U.S. Shipyards 0.1 0.0 Operations
Fresh Fill - Cylinder Change Oil (2-stroke Slow Speed) 82 0.0 0.0 Fresh Fill - Crankcase Change Oil (2-stroke Slow Speed) 0.0 0.0
Fresh Fill - Change Oil (4-stroke Medium Speed) 16 0.7 0.0 Fresh Fill - Change Oil (All Other Engine Types) 2 3.9 0.0 Fresh Fill - Cylinder Top Up Oil (2-stroke Slow Speed) 33.9 0.0 Fresh Fill - Crankcase Top Up Oil (2-stroke Slow Speed) 8.5 0.0
Fresh Fill - Top Up Oil (4-stroke Medium Speed) 7.3 0.0 Fresh Fill - Top Up Oil (All Other Engine Types) 3.1 0.0 Change Oil Disposed of - U.S. 0.0 3.9 Consumption, Leakage & Other Losses 0.0 53.5
Scrappage 0.0 0.0 TOTAL 57.5 57.4
TECHNICAL LOSS AS % OF CONSUMPTION 93.0%
NON-TECHNICAL LOSS AS % OF CONSUMPTION 7.0%
This table shows that almost 60 percent of marine lubricants supplied at U.S. ports are supplied for cylinder lubricant used in foreign-flag slow-speed diesel-powered vessels. By definition this application results in complete combustion of the lubricant during use. The other 40 percent of consumption is related to change oil and top-up oil used in crankcase lubrication. Recovered used oil from oil changes is almost never collectable, being preferred as a supplemental fuel in the limited circumstances it is theoretically recoverable on U.S. soil.
4.6.1. Slow-Speed Two-Stroke Diesels
Slow-speed two-stroke crosshead marine diesels are the largest motive units in the world. Due to their low revolutions (circa 100-150 rpm) and tremendous torque they are connected directly to vessel propulsion sh afts without gearing. In slow-speed 2-stroke engine designs the cylinders are separated from the crankcase, and lubricants are used separately in each application. Cylinder lubricants, as in most 2-stroke designs, are completely consumed in operation, and are thus unrecoverable. Crankcase lubricants, however, are recirculated on-board, where they are filtered and treated to adjust Total Base Number (TBN) through the addition of top-up lubricants and additives. Crankcase oil in such designs is never changed; it is completely consumed to extinction, with operating losse s being replaced with fresh top-up oil procured at most port calls. Very
20

occasionally, the lubricating oil inventory may be contaminated to a degree where it must be condemned; in this case the off-spec crankcase oil is most often burned as bunker fuel (or occasionally incinerated on-board). Under no circumstances, therefore, is slow-speed diesel cylinder or crankcase oil recoverable; all cylinder lubricant is combusted, while crankcase lubricants are completely consumed on-board.
Kline contacted a major global supplier of marine lubricants to discuss lubricating oil practice in slow-speed diesels, as well as other forms of marine engine. This contact was supplemented by interviews with several vessel fleet operators. Estimates of the average cylinder lubricant consumption rate varied in these interviews, ranging from 0.2 to as high as 1.0 gram/KWh; based on confidential sales data provided by one company, we were able to cross-check the ratio of cylinder-to-crankcase slow-speed diesel lubricating o il consumption (at 4:1) which suggested that typical cylinder oil consumption in the world slow-speed 2-stroke diesel-powered f leet is around 0.4 grams/KWh.
Currently the world’s largest marine diesel engine design is the Wärtsilä-Sulzer RTA 96C, with a rated power output of up to 84,000 KW (113,000 HP). It has two primary engine lubricating oil holding ta nks (one clean and one dirty) with a combined capacity of more than 50,000 gallons, in addition to the crankcase itself. This engine is designed for a cylinder lubricant consumption rate, at full power, of 0.9-1.3 grams/KWh, plus crankcase oil consumption of 12 Kg per cylinder per day (the largest version of the 96-C design has 14 cylinders).
Due to the fact that crankcase oil is never changed in slow-speed diesels, no change oil is recoverable. Even when there is the occasional need to dispose of off-spec crankcase oil, this material is always consumed on-board and never discharged overboard or at port. Consequently all crankcase oil (as well as all cylinder lubricant) in this application is assumed to be consumed in use.
4.6.2. Medium-Speed 4-Stroke Diesels
In 4-stroke marine diesels, engine design is more similar to other heavy-duty diesel engines, with lubrication restricted to crankcase use. Because of the higher efficiency of 4-stroke marine diesels, crankcase oil consumption per KWh of power output tends to be about 20 percent lower than in 2-stroke slow-speed diesels.
Unlike 2-stroke marine diesel crankcase oil use, historical practice has been to perform periodic changes of 4-stroke crankcase oil (typically every 8,000 engine-hours, or roughly once every 18 months). Due to the relatively large amount of fresh fill required for each oil change, ship operators have been working with marine lubricants suppliers to modify lubricating protocols to extend oil-change intervals, offset by a smaller increase in top-up volumes. Oil quality, notably TBN, is monitored on-board, and the specifications of top-up materials are adjusted to maintain overall crankcase lubricant quality within acceptable limits. Interviews with ship operators suggested that the ratio of
21

top-up oil to change oil is roughly 10:1 in this engine type, as fleet operators are extending drain intervals.
As noted, crankcase oil is periodically changed, though service intervals are being extended. Used crankcase oil is never discharged at port, being burned for fuel on-board, in the same manner as is employed for off-spec 2-stroke crankcase oil. Since oil changes during periodic servicing a re unlikely to occur at U.S. dry-docks when vessels undergo regular refits and maintenance, no land-based change oil is assumed to be recoverable.
4.6.3. High-Speed Diesels and Other Marine Propulsion Units
Only 2 percent of the world’s vessel fleet, by power-weighted tonnage, is contained in high-speed diesel, diesel-electric and other forms of motive units. A disproportionate part of such vessels are located in the U.S. due to the extent of river traffic, especially on the Mississippi, on the Great Lakes, and in cabotage on the East, West and Gulf Coasts. High-speed diesels and other unconventionally-powered vessels are primarily U.S. flag, and, of substantially smaller tonnage, than the slow-and medium-speed diesel-driven vessels discussed above. Oil changing practice suggests an average two changes/year, with an average change volume of about 300 gallons. Used change oil recovered at U.S. ship service facilities is typically blended with marine diesel fuel and burned on-board. Consequently, used change oil may be technically recoverable, but is not considered to be practically recoverable.
4.7. Transformer Oil
Consumption of dielectric fluids (transformer oils, breaker fluids, and cable oils) in the U.S. is typically around 85 million gallons per year, with transformer oils representing nearly 90 percent of the combined volume. This analysis focuses on transformer oils, as the key dielectric fluid.
The U.S. transformer market is composed of large power transformers, used to step-up and step-down transmission voltages at power plants and utility sub-stations, respectively, as well as smaller-scale distribution transformers, to further step-down sub-station voltages to commercial and residential levels. Of the roughly 40 million utility and 10 million privately-owned transformers currently in operation, over 99 percent are in distribution service. A typical pole-mounted distribution transformer, of 40 kVA, contains 30 gallons of transformer fluid. These transformers are long-lived, since there are no moving parts and no combustion process in such equipment. Typically, distribution transformers remain in service for 30-50 years before being replaced.
Since transformer oils are used as insulating mediums and moisture barriers, there are no losses due to combustion. Operating losses arise primarily from leakage and from occasional catastrophic failures caused by power surges of man-made or natural (lightning) occurrence. Such losses are properly estimated based on the inventory of existing transformers, as opposed to a proportion of annual consumption, and are
22

estimated at 0.25 percent of inventory per year, based on discussion with selected electric utilities and transformer service providers.
Periodically, transformer insulating fluids are drained under vacuum and treated to restore their dielectric properties, which slowly decline through flux-induced degeneration. Treatment processes involve dehydration, degassing and sludge removal, and (occasionally) clay treatment using Fullers Earth. A substantial proportion of transformer oil processing is conducted by small, mobile regeneration equipment, while the balance is conducted by remote transformer oil re-refiners. There are four major transformer oil re-refineries in North America, with the largest being Hydrodec in Canton, OH. Hydrodec, specifically, is now able to guarantee used oil performance equal or superior to fresh-fill transformer oil due to its hydrotreating process capability.
Due to the large number of transformers in service, some 0.5 million are taken out of service each year. A small proportion of these retired transformers contains PCB fill as the insulating medium. These transformers are handled according to toxic waste protocols, with the removed PCBs incinerated at licensed waste disposal facilities. Retired transformer oil inventory with insulating mediums containing from 50-500ppm PCBs have traditionally also been condemned (though Hydrodec has recently been licensed to remediate them). Only transformer oils of less than 50ppm PCBs have hitherto been subject to regenerative processing. In these cases, some proportion of the reprocessed transformer oil may be recycled into dielectric uses, with the balance entering other industrial uses which rely on naphthenic lubricating oil properties.
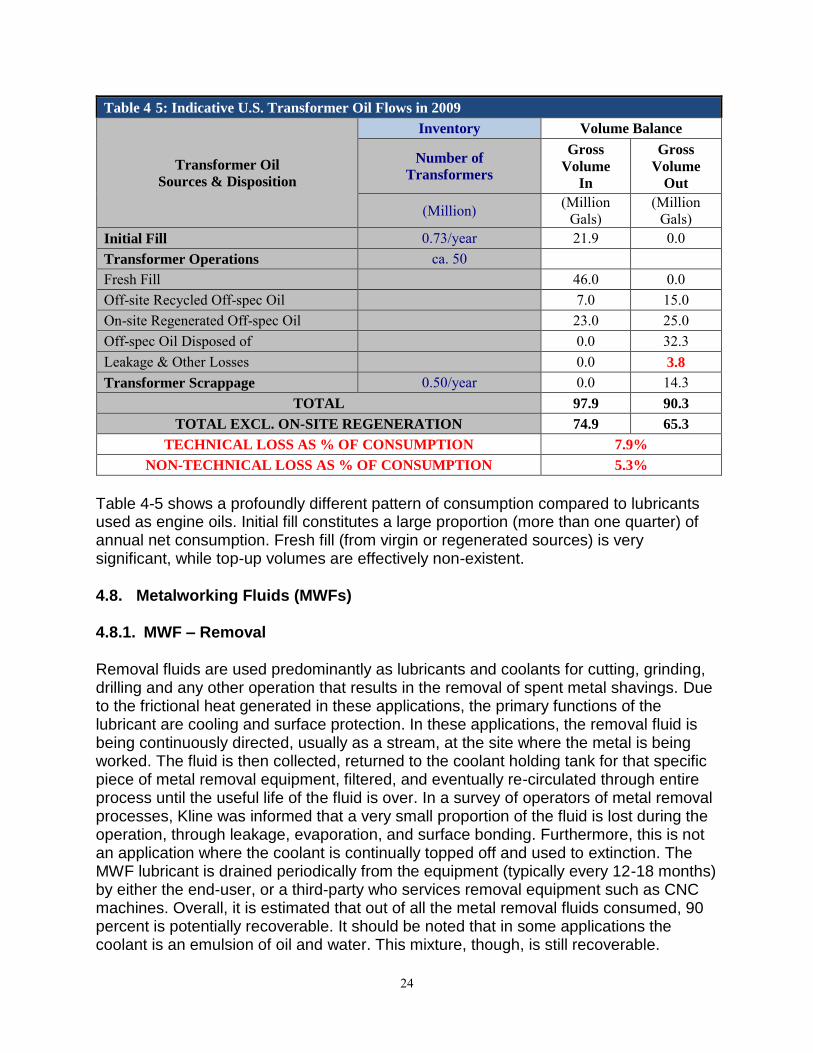
Table 4-5 summarizes estimated annual transformer fluid flows. As noted above, losses in operation are more properly related to inventory, but are equivalent to some 5 percent of annual consumption. To this figure Kline has added an estimate of losses due to incineration of retired dielectric fluids with high PCB contents. This adjustment raises annual technical losses to nearly 8 percent of annual consumption. In addition, regeneration losses, which we consider to be the product of conventional operating protocols for electric utilities, are considered as non-technical losses. Excluded from such non-technical losses is the redirection of regenerated transformer oils to non-dielectric use. As transformer oil re-refining becomes a more mainstream technology, Kline expects that greater proportions of off-spec transformer oils will be recycled into their original uses, since performance can be guaranteed as equal to that of fresh fill.
23
-
Table 4 5: Indicative U.S. Transformer Oil Flows in 2009
Transformer Oil
Sources & Disposition
Inventory Volume Balance
Number of
Transformers
Gross
Volume
In
Gross
Volume
Out
(Million) (Million Gals)
(Million Gals)
Initial Fill 0.73/year 21.9 0.0 Transformer Operations ca. 50 Fresh Fill 46.0 0.0 Off-site Recycled Off-spec Oil 7.0 15.0 On-site Regenerated Off-spec Oil 23.0 25.0 Off-spec Oil Disposed of 0.0 32.3 Leakage & Other Losses 0.0 3.8
Transformer Scrappage 0.50/year 0.0 14.3 TOTAL 97.9 90.3
TOTAL EXCL. ON-SITE REGENERATION 74.9 65.3
TECHNICAL LOSS AS % OF CONSUMPTION 7.9%
NON-TECHNICAL LOSS AS % OF CONSUMPTION 5.3%
Table 4-5 shows a profoundly different pattern of consumption compared to lubricants used as engine oils. Initial fill constitutes a large proportion (more than one quarter) of annual net consumption. Fresh fill (from virgin or regenerated sources) is very significant, while top-up volumes are effectively non-existent.
4.8. Metalworking Fluids (MWFs)
4.8.1. MWF – Removal
Removal fluids are used predominantly as lubricants and coolants for cutting, grinding, drilling and any other operation that results in the removal of spent metal shavings. Due to the frictional heat generated in these applications, the primary functions of the lubricant are cooling and surface protection. In these applications, the removal fluid is being continuously directed, usually as a stream, at the site where the metal is being worked. The fluid is then collected, returned to the coolant holding tank for that specific piece of metal removal equipment, filtered, and eventually re-circulated through entire process until the useful life of the fluid is over. In a survey of operators of metal removal processes, Kline was informed that a very small proportion of the fluid is lost during the operation, through leakage, evaporation, and surface bonding. Furthermore, this is not an application where the coolant is continually topped off and used to extinction. Th e MWF lubricant is drained periodically from the equipment (typically every 12-18 months) by either the end-user, or a third-party who services removal equipment such as CNC machines. Overall, it is estimated that out of all the metal removal fluids consumed, 90 percent is potentially recoverable. It should be noted that in some applications the coolant is an emulsion of oil and water. This mixture, though, is still recoverable.
24

4.8.2. MWF – Forming
Forming fluids are used to lubricate metal objects undergoing changes in their dimensions through the application of pressure. Kline interviewed several large metal-rolling and pressing companies, who advised that approximately 10 percent of the forming fluid leaves the process as a thin film over the entire useful life of the fluid. These oils are changed out when their fluid system requires repair, and it is quite common for each fluid system to be repaired at least once per year. Within the U.S. many of these systems are quite old, as they were built when the country had a growing primary metals industry. Thus, due to the age of these systems, we estimate an additional 10 percent volume loss through leaks and other inefficiencies. Therefore, out of the entire volume of forming fluid that is used by a plant, approximately 20 percent is not recoverable.
During the research, it was discovered that in certain instances, hot steel rolling mills will take their used forming fluid and spray it on top of their coal piles to reduce dust. Although the used oil is thereby being burned with coal in the rolling mill furnaces used to heat the steel ingots, the oil is being recovered first, and thus we consider this as being theoretically recoverable.
4.8.3. MWF – Other
The third p rincipal group of MWF applications is protecting and treating fluids. Protecting fluids are used to prevent metal from corroding, oxidizing, or undergoing any other type of surface deterioration. Since these fluids remain on the metal object to form a protective barrier, it is assumed that none of this fluid is potentially recoverable. Treating fluids serve as quenching and tempering oils. In these applications, some 30 percent of the volume p urchased is lost during operations (technical loss) while the other 70 percent is non-technical loss, representing the volume of fluid that is used to extinction.
4.9. White Oils
White oils (often referred to as baby oils) are produced by extreme processing of conventional base stocks to produce a pure, odorless, sulfur-free, tasteless, water-white product. Many different process applications are served by white oils, such as the food processing, pharmaceutical, chemical, and electronics industries. They are used also as process oils in the production of certain cosmetics, household cleaners, animal feed and other materials, and in produce (fruit and vegetable) coatings. In almost all circumstances, white oil is consumed by the actual process, incorporated into the final product, or is otherwise not recoverable. The only application where it is possible to recover used white oils economically is in food processing plants, where white oils replace traditional gear, hydraulic and other lubricating oils when the machinery is in reasonable proximity to the food product. In such food processing applications, the losses in consumption of white oils are typically low, leading to a potential used oil recovery rate of 90 percent. Since food processing represents only 10 percent of total
25

white oil consumption, we have estimated that only 9 percent of overall white oil consumption may be recoverable as used oil. 4.10. Other Lubricant Applications
4.10.1. Approach
Lubricant use, other than in the applications discussed in 4.2 to 4.9 above, is either small in volumetric terms, or there is little or no uncertainty as to their degree of recoverability (such as in the case of most process oils). Kline conducted no original research into these uses, relying on estimates made in previous studies of lube oil losses and recoverability.
4.10.2. Other Process Oils With the exception of dielectric fluids and white oils, whose usage is discussed in 4.8 and 4.9, industrial process oils either form part of the final product (as in tire and rubber, or printing ink, manufacture), or are completely lost in use (such as in agricultural spray oils). The principal industry uses of “other process oils” in 2009 have been estimated by Kline as follows (in millions of gallons):
Tire and rubber industry 205 Printing ink manufacture 88 Chemical industry 56 Agricultural spray oils 20 All other process oils 24 Total 393
In all cases all process oils are completely consumed in operation and recoverability is, in consequence, zero. 4.10.3. Non-Engine Automotive Fluids This category includes automotive transmission fluids, brake fluids and commercial and industrial hydraulic fluids. Unlike engine oils, which are directly or indirectly exposed to combustion activity, these classes of fluids are used in other parts of the drive train, or in ancillary uses not related to vehicle movement. Losses are typically quite low, and are trending lower, as fill-for-life is practiced in certain automotive hydraulics applications, such as light-duty transmissions. Technical losses, based on other studies, are estimated at 12 percent in consumer automotive use, and at somewhat higher levels in more stringent commercial and industrial heavy-duty service. 4.10.4. Gear Oils
26

Gear oils are employed widely in automotive and non-automotive use. Based on other studies we estimate losses in consumption in the range of 12-20 percent. 4.10.5. Greases Greases are a unique example of lubricant use, due to their high viscosity and semisolid nature. Though technical grease consumption and loss-in-use is typically low, ranging from an estimated 10 percent in consumer automotive axle and other drive-train uses, to 20 percent in industrial applications, Kline has applied a non-technical loss of 100 percent to all grease applications on the assumption that, since it cannot be drained from its point of use, it is totally unrecoverable in practice. 4.10.6. Other Industrial Oils Well-maintained turbine, compressor, and particularly refrigeration systems offer a high degree of recoverability. If no leaks are experienced, and losses due to equipment failure and servicing are minimized, 90 percent or more of oils in this class are recoverable after the useful life of the fluid ends. A total of 15 percent for all losses, accounting for machinery incidents, leaks, spillage, and other inefficiencies is estimated for these applications.
27
5. CALIFORNIA LUBRICANTS CONSUMPTION, USED OIL
RECOVERABILITY, AND COLLECTION EFFICIENCY
5.1. Lubricants Consumption and Overall Losses
- -
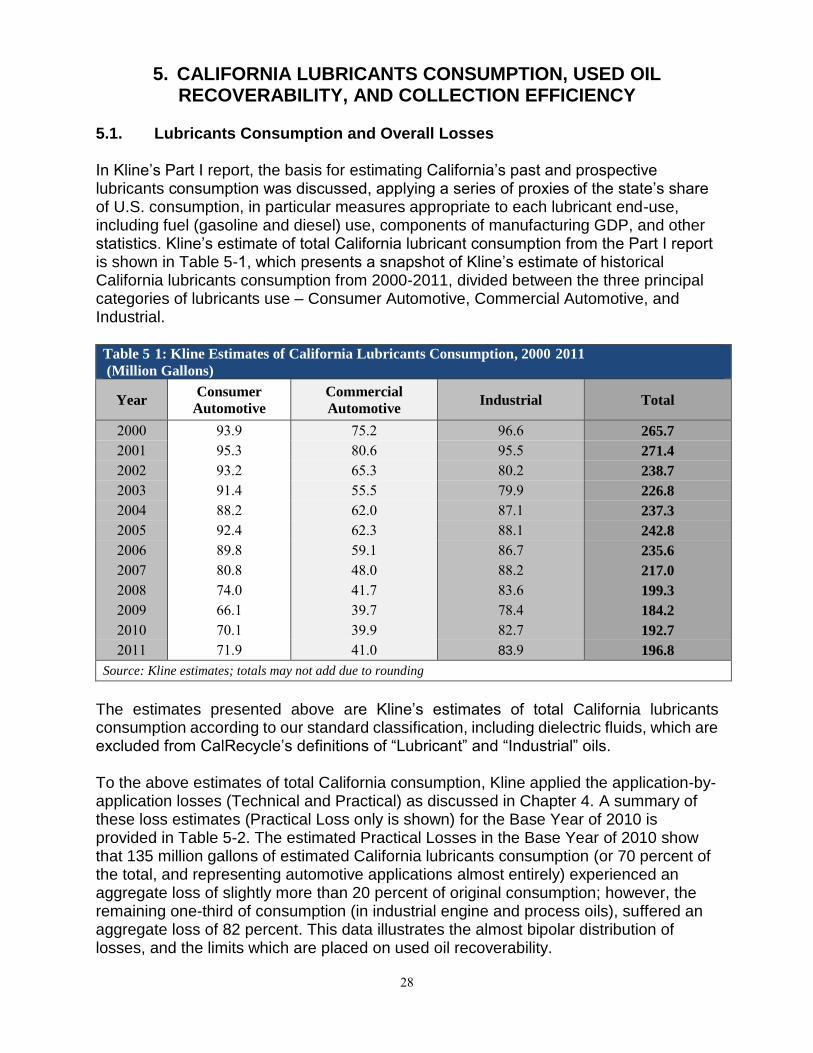
In Kline’s Part I report, the basis for estimating California’s past and prospective lubricants consumption was discussed, applying a series of proxies of the state’s share of U.S. consumption, in particular measures appropriate to each lubricant end-use, including fuel (gasoline and diesel) use, components of manufacturing GDP, and other statistics. Kline’s estimate of total California lubricant consumption from the Part I report is shown in Table 5-1, which presents a snapshot of Kline’s estimate of historical California lubricants consumption from 2000-2011, divided between the three principal categories of lubricants use – Consumer Automotive, Commercial Automotive, and Industrial.
Table 5 1: Kline Estimates of California Lubricants Consumption, 2000 2011
(Million Gallons)
Year Consumer
Automotive
Commercial
Automotive Industrial Total
2000 93.9 75.2 96.6 265.7
2001 95.3 80.6 95.5 271.4
2002 93.2 65.3 80.2 238.7
2003 91.4 55.5 79.9 226.8
2004 88.2 62.0 87.1 237.3
2005 92.4 62.3 88.1 242.8
2006 89.8 59.1 86.7 235.6
2007 80.8 48.0 88.2 217.0
2008 74.0 41.7 83.6 199.3
2009 66.1 39.7 78.4 184.2
2010 70.1 39.9 82.7 192.7
2011 71.9 41.0 83.9 196.8
Source: Kline estimates; totals may not add due to rounding
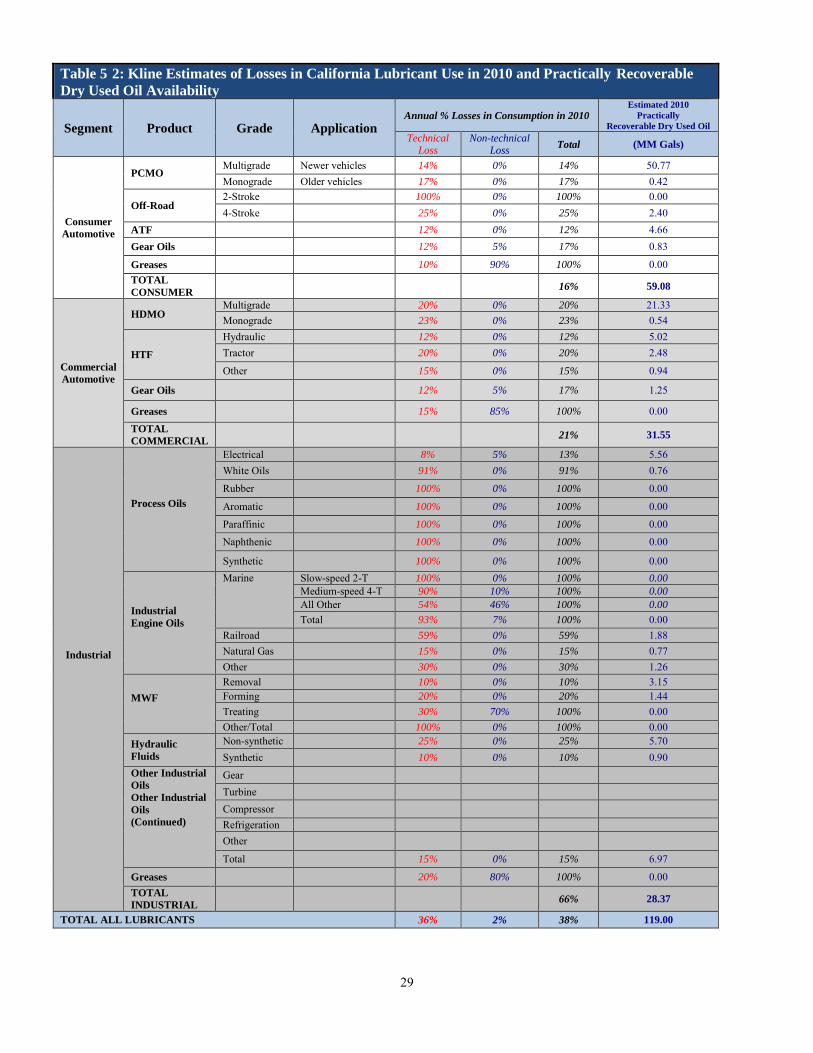
The estimates presented above are Kline’s estimates of total California lubricants consumption according to our standard classification, including dielectric fluids, which are excluded from CalRecycle’s definitions of “Lubricant” and “Industrial” oils. To the above estimates of total California consumption, Kline applied the application-byapplication losses (Technical and Practical) as discussed in Chapter 4. A summary of these loss estimates (Practical Loss only is shown) for the Base Year of 2010 is provided in Table 5-2. The estimated Practical Losses in the Base Year of 2010 show that 135 million gallons of estimated California lubricants consumption (or 70 percent of the total, and representing automotive applications almost entirely) experienced an aggregate loss of slightly more than 20 percent of original consumption; however, the remaining one-third of consumption (in industrial engine and process oils), suffered an aggregate loss of 82 percent. This data illustrates the almost bipolar distribution of losses, and the limits which are placed on used oil recoverability.
28
- -
Table 5 2: Kline Estimates of Losses in California Lubricant Use in 2010 and Practically Recoverable
Dry Used Oil Availability
Segment Product Grade Application Annual % Losses in Consumption in 2010
Estimated 2010
Practically
Recoverable Dry Used Oil
Technical Loss
Non-technical Loss
Total (MM Gals)
Consumer
Automotive
PCMO Multigrade Newer vehicles 14% 0% 14% 50.77 Monograde Older vehicles 17% 0% 17% 0.42
Off-Road 2-Stroke 100% 0% 100% 0.00 4-Stroke 25% 0% 25% 2.40
ATF 12% 0% 12% 4.66 Gear Oils 12% 5% 17% 0.83
Greases 10% 90% 100% 0.00 TOTAL
CONSUMER 16% 59.08
Commercial
Automotive
HDMO Multigrade 20% 0% 20% 21.33 Monograde 23% 0% 23% 0.54
HTF
Hydraulic 12% 0% 12% 5.02 Tractor 20% 0% 20% 2.48
Other 15% 0% 15% 0.94
Gear Oils 12% 5% 17% 1.25
Greases 15% 85% 100% 0.00 TOTAL
COMMERCIAL 21% 31.55
Industrial
Process Oils
Electrical 8% 5% 13% 5.56 White Oils 91% 0% 91% 0.76
Rubber 100% 0% 100% 0.00
Aromatic 100% 0% 100% 0.00
Paraffinic 100% 0% 100% 0.00 Naphthenic 100% 0% 100% 0.00
Synthetic 100% 0% 100% 0.00
Industrial
Engine Oils
Marine Slow-speed 2-T 100% 0% 100% 0.00
Medium-speed 4-T 90% 10% 100% 0.00
All Other 54% 46% 100% 0.00
Total 93% 7% 100% 0.00 Railroad 59% 0% 59% 1.88 Natural Gas 15% 0% 15% 0.77 Other 30% 0% 30% 1.26
MWF
Removal 10% 0% 10% 3.15 Forming 20% 0% 20% 1.44 Treating 30% 70% 100% 0.00 Other/Total 100% 0% 100% 0.00
Hydraulic
Fluids
Non-synthetic 25% 0% 25% 5.70 Synthetic 10% 0% 10% 0.90
Other Industrial
Oils
Other Industrial
Oils
(Continued)
Gear Turbine Compressor Refrigeration Other
Total 15% 0% 15% 6.97
Greases 20% 80% 100% 0.00 TOTAL
INDUSTRIAL 66% 28.37
TOTAL ALL LUBRICANTS 36% 2% 38% 119.00
29
30
The year 2010 was used as the Base Year for developing application-specific loss estimates. A weighted-average loss was then determined for 2010 over the entirety of California’s lubricant application, which was 36 percent for Technical and 2 percent higher for Practical Losses. Years prior to 2010 were assumed to have weighted average losses which decreased by 0.3%/year for each year from 2000 to 2010 (that is weighted average losses in 2000 were 3.0 percent higher than those in 2010). Aggregate losses in the future are projected to decline at 0.2%/year over the next 10 years. In terms of comparisons with other estimates, it is difficult to draw too much inference from a side-by-side analysis of this report’s conclusions vis-à-vis those of other studies, due to the differences in real or implicit methodologies, and their variable timing. However, for the five studies for which estimates of total used oil losses were made, Kline adjusted these to a 2010 equivalent by reducing estimated losses at the rate of 0.3%/year from the date of the estimate until 2010. This produced the following adjusted total loss estimates: Argonne (1995) 37% Europalab (2002) 51% Netcen (2004) 45% Spence (2005) 29% Kline (2009) 34% The mean of these loss estimates, adjusted to a 2010 basis, is 39 percent, which is close to Kline’s current estimates of 36 percent for Technical Loss and 38 percent for Practical Loss. As noted in other chapters of this report, used engine oil drained in retail and commercial garages, in locomotive service facilities, and in select industrial applications may be burned on-site in certain circumstances, which would tend to increase slightly the loss estimates made in this report.
5.2. Used Oil Recoverability
Estimates of used oil recoverability were based on the above approach; essentially, Kline assumed that any oil which is practically-recoverable is available for collection by a third party, or disposal at a certified collection center (CCC). Estimates were made of Technically and Practically Recoverable used oil from 2000-2011 split between Lubricant and Industrial uses, according to the CalRecycle definitions (dielectric fluids were included in Industrial volumes, however, since significant volumes of such materials are recoverable annually for regeneration or disposition to other uses). Table 5-3 summarizes Kline’s estimates of aggregate losses in use, and dry used oil recoverability on a practical basis.

-
Table 5 3: Summary of Aggregate Losses in Lubricant Consumption and Recoverable Used Oil in California (MM Gallons)
Year
Lubricants Consumption
Practically Recoverable Dry Used Oil
Average Practical Loss (%)
Lubri cants
Industrial Total Lubricants Industrial Total Lubricants Industrial Total
2000 175.7 90.0 265.7 121.4 36.4 157.8 30.9% 59.6% 40.6% 2001 180.9 90.5 271.4 125.7 36.8 162.5 30.6% 59.3% 40.1% 2002 168.3 70.4 238.7 117.3 28.9 146.2 30.3% 58.9% 38.7% 2003 157.3 69.5 226.8 110.1 28.7 138.8 30.0% 58.7% 38.8% 2004 160.4 76.9 237.3 112.8 32.0 144.8 29.7% 58.4% 39.0% 2005 166.8 76.0 242.8 117.9 31.8 149.7 29.3% 58.2% 38.3% 2006 161.1 74.5 235.6 114.3 31.4 145.7 29.1% 57.9% 38.2% 2007 142.2 74.8 217.0 101.3 31.8 133.1 28.7% 57.5% 38.6% 2008 130.7 68.6 199.3 93.5 29.4 122.9 28.5% 57.1% 38.3% 2009 118.4 65.8 184.2 85.0 28.4 113.4 28.1% 56.8% 38.4% 2010 (1)
123.0 69.7 192.7 88.8 30.3 119.1 27.8% 56.5% 38.2%
2011 126.0 70.8 196.8 91.2 30.9 122.1 27.7% 56.4% 38.0% Note (1) 2010 was used as the Base Year for the purpose of loss estimation
5.3. Dry Used Oil Collected
Kline’s study relied upon data regarding used oil collection in California, based on information originally sourced from CalRecycle and DTSC. As a part of the LCA study, UCSB is collating the raw data from these original sources and is attempting to improve the quality of this data, through the elimination of identifiable double-counting and other adjustments. While Kline drew upon UCSB’s latest (mid-November 2012) adjusted used oil collection data, it became apparent during discussions with UCSB staff engaged in the LCA study that these adjustments did not (at that time) account for the entrained water content of used oils and oily wastewaters.
Lubricant consumption estimates are traditionally expressed on a “dry” basis, since the water content of finished lubricants must be, by specification or custom, very low (typically not exceeding 0.2-0.3 percent by volume) in almost all applications. Estimated losses determined in this study are related to the loss of dry lubricant utility through leakage, spillage, combustion, evaporation, chemical bonding, and chemical transformation. Consequently, Kline’s estimates of consumption losses, and of recoverable used oil volumes which are theoretically collectable, are also on a dry basis.
However, many lubricating functions are exposed in their use to processes (such as combustion) where water is a by-product, which may then find its way, in part, into the lubricant inventory. In certain metalworking applications lubricants may be mixed with water to form emulsions used in the particular cooling or flushing activity for which they are designed. Water ingress may also occur through leaks in containment systems. Finally, collected used oil may be stored in circumstances where it is exposed to ambient water, or be actively mixed with other liquid wastes which may contain water. In extreme examples, waste oil may be discharged into settling ponds or other aqueous media, which results in oily wastewater with a high specific ratio of water to oil.
31
- -
As a result the water content of collected used oil may vary widely. The used oil collection and resale industry has recognized this issue by adjusting the pricing basis for sales of treated used oil (RFO, or Recovered Fuel Oil) to organizations such as lubricant re-refineries, where the purchase and sale is determined on the basis of net dry gallons delivered, after adjusting for water content. Many RFO supply contracts limit water content to 5 percent by volume, and shipments may be rejected if the water content exceeds that threshold.
While the actual water content of used oil collected in California is not known, Kline contacted UCSB, the LCA contractor charged with processing the raw CalRecycle and DTSC collection data, to review what adjustments should be made to the estimated “wet” gallons collected in order to net out entrained water. Based on these discussions, UCSB’s database of “wet” gallons collected was adjusted to a “net dry oil” basis in two steps:
Estimated used oil collected was multiplied by 0.95, on the assumption that it contained, on average, 5 percent water. Estimated oily wastewater volumes, with an assumed water content of 85 percent, were multiplied by 0.15.
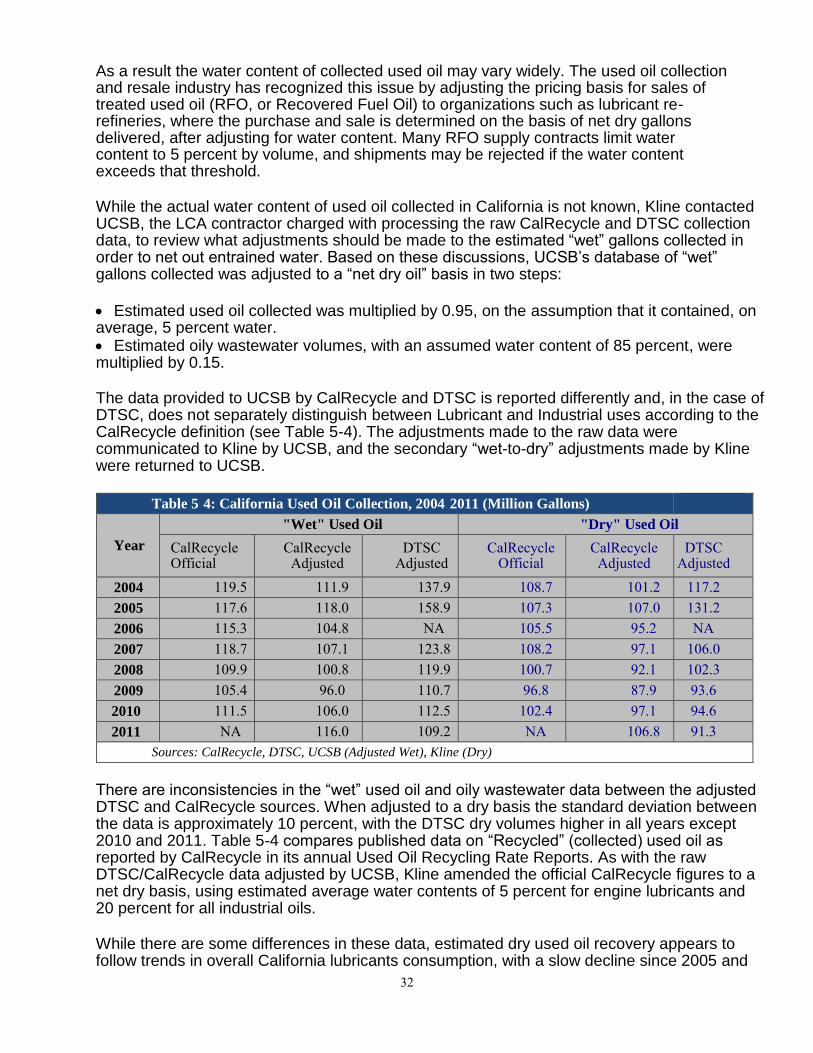
The data provided to UCSB by CalRecycle and DTSC is reported differently and, in the case of DTSC, does not separately distinguish between Lubricant and Industrial uses according to the CalRecycle definition (see Table 5-4). The adjustments made to the raw data were communicated to Kline by UCSB, and the secondary “wet-to-dry” adjustments made by Kline were returned to UCSB.
Table 5 4: California Used Oil Collection, 2004 2011 (Million Gallons)
Year
"Wet" Used Oil "Dry" Used Oil
CalRecycle Official
CalRecycle Adjusted
DTSC Adjusted
CalRecycle Official
CalRecycle Adjusted
DTSC Adjusted
2004 119.5 111.9 137.9 108.7 101.2 117.2 2005 117.6 118.0 158.9 107.3 107.0 131.2 2006 115.3 104.8 NA 105.5 95.2 NA 2007 118.7 107.1 123.8 108.2 97.1 106.0 2008 109.9 100.8 119.9 100.7 92.1 102.3 2009 105.4 96.0 110.7 96.8 87.9 93.6 2010 111.5 106.0 112.5 102.4 97.1 94.6 2011 NA 116.0 109.2 NA 106.8 91.3
Sources: CalRecycle, DTSC, UCSB (Adjusted Wet), Kline (Dry)
There are inconsistencies in the “wet” used oil and oily wastewater data between the adjusted DTSC and CalRecycle sources. When adjusted to a dry basis the standard deviation between the data is approximately 10 percent, with the DTSC dry volumes higher in all years except 2010 and 2011. Table 5-4 compares published data on “Recycled” (collected) used oil as reported by CalRecycle in its annual Used Oil Recycling Rate Reports. As with the raw DTSC/CalRecycle data adjusted by UCSB, Kline amended the official CalRecycle figures to a net dry basis, using estimated average water contents of 5 percent for engine lubricants and 20 percent for all industrial oils.
While there are some differences in these data, estimated dry used oil recovery appears to follow trends in overall California lubricants consumption, with a slow decline since 2005 and
32

-
-
2009 as a low year, followed by a modest recovery. Average dry used oil collection (between the three estimates in Table 5-3) ranges from a high of 115 million gallons in 2005 to a low of 96 million gallons in 2009.
5.4. Collection Efficiency Kline compared its estimates of dry recoverable used oil generation with the CalRecycle and DTSC collection data, adjusted to a “dry” basis.
100%
90%
80%
70%
60%
50%
40%
Figure 5 1: Total Dry Used Oil Recycled in California as a Percent of Estimated
Practically Recoverable Dry Waste Oil, based on CalRecycle and DTSC data
CalRecycle Official Dry Total
CalRecycle UCSB-Adjusted Dry
Total
DTSC Adjusted Dry Total
2000 2001 2002 2003 2004 2005 2006 2007 2008 2009 2010 2011
Figure 5-1 shows total California dry oil percentage recoverability in the range of 70-80 percent since the early 2000s, based on practically-recoverable estimated used oil generation. Variances between adjusted DTSC and CalRecycle collection data do not significantly influence this conclusion. Figures 5-2 and 5-3 compare official and UCSB-adjusted CalRecycle collection efficiency in the Lubricants and Industrial categories (DTSC does not split their data between the two uses).
33

- "
-
-
-
100%
90%
80%
70%
60%
50%
40%
2000 2001 2002 2003 2004 2005 2006 2007 2008 2009 2010 2011
Figure 5 2: Dry Used "Lubricant Recycled in California as a Percent of
Estimated Practically Recoverable Dry Lubricant, based on
CalRecycle Data
CalRecycle Official
Dry Lubricant
CalRecycle UCSB-
Adjusted Dry
Lubricant
Figure 5 3: Dry Used Industrial Oil Recycled in California as a Percent of
Estimated Practically Recoverable Industrial Dry Lubricant, based on
CalRecycle Data 100%
90%
80%
70%
60%
50%
40%
30%
20%
10%
0% 2000 2001 2002 2003 2004 2005 2006 2007 2008 2009 2010 2011
CalRecycle Official
Dry Industrial
CalRecycle UCSB-
Adjusted Dry
Industrial
Effective recoverability of used engine-related Lubricants (shown in Figure 5-2) has shown a consistent improvement, from around 70 percent in the early 2000s to around 90 percent currently. Figure 5-3 shows estimated Industrial used recovery was around 80-90 percent in the early 1980s, but has since declined to a lower level of some 60 percent. There is no immediate explanation for this apparent decline in Industrial dry used oil recovery efficiency.
34
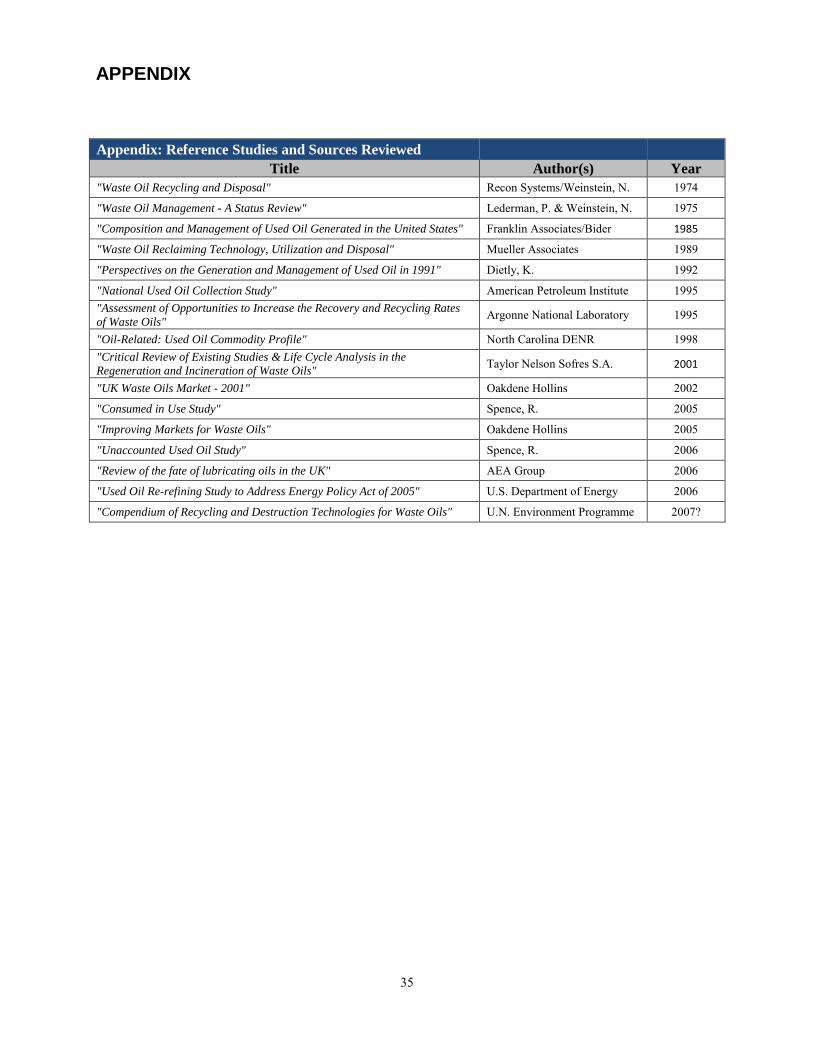
APPENDIX
Appendix: Reference Studies and Sources Reviewed
Title Author(s) Year
"Waste Oil Recycling and Disposal" Recon Systems/Weinstein, N. 1974
"Waste Oil Management - A Status Review" Lederman, P. & Weinstein, N. 1975
"Composition and Management of Used Oil Generated in the United States" Franklin Associates/Bider 1985
"Waste Oil Reclaiming Technology, Utilization and Disposal" Mueller Associates 1989
"Perspectives on the Generation and Management of Used Oil in 1991" Dietly, K. 1992
"National Used Oil Collection Study" American Petroleum Institute 1995 "Assessment of Opportunities to Increase the Recovery and Recycling Rates
of Waste Oils" Argonne National Laboratory 1995
"Oil-Related: Used Oil Commodity Profile" North Carolina DENR 1998 "Critical Review of Existing Studies & Life Cycle Analysis in the
Regeneration and Incineration of Waste Oils" Taylor Nelson Sofres S.A. 2001
"UK Waste Oils Market - 2001" Oakdene Hollins 2002
"Consumed in Use Study" Spence, R. 2005
"Improving Markets for Waste Oils" Oakdene Hollins 2005
"Unaccounted Used Oil Study" Spence, R. 2006
"Review of the fate of lubricating oils in the UK" AEA Group 2006
"Used Oil Re-refining Study to Address Energy Policy Act of 2005" U.S. Department of Energy 2006
"Compendium of Recycling and Destruction Technologies for Waste Oils" U.N. Environment Programme 2007?
35