lsu health sciences center new orleans … · +7% (63) school of ... were off-cycle due to...
TRANSCRIPT

LOUISIANA STATE UNIVERSITY HEALTH SCIENCES CENTER—NEW ORLEANS: 2016 GRAD ACT ANNUAL REPORT 1
LSU HEALTH SCIENCES CENTER—NEW ORLEANS 2016 GRAD ACT ANNUAL REPORT | PERFORMANCE OBJECTIVES NARRATIVE
1. STUDENT SUCCESS
a. Implement policies established by the institution's management board to achieve cohort graduation rate and graduation productivity goals that are consistent with institutional peers. LSU Health Sciences Center at New Orleans (LSUHSC-NO) utilizes the LSU System Performance Metrics Process (implemented in January 2010), which provides campus leadership and the Board of Supervisors a mechanism for evaluating annual institutional performance. Metrics data allow institutions to discuss descriptive metrics and performance measures within the context of their mission, including, amongst others, measures related to retention, graduation, licensure, and pass rates, degrees, and credentialing. These metrics are collected and reported on an annual basis, and they represent a significant analysis and measuring tool for the Louisiana State University System and its institutions.
a.i. 1st to 2nd Year Retention Rate:
LSUHSC-NO School Baseline
(2008-09) 2009-10 2010-11 2011-12 2012-13 2013-14 2014-15
School of Allied Health Professions 97% 95% 87% 95% 97% 95% 94% (185/196) School of Dentistry—Dentistry 97% 98% 99% 99% 98% 98% 100% (65/65) School of Dentistry—Dental Hygiene 100% 100% 98% 94% 100% 100% 97% (37/38) School of Dentistry—Dental Lab Tech 100% 100% 91% 83% 100% 100% 100% (8/8) School of Dentistry—Combined* N/A N/A N/A N/A 99% 99% 99% (110/111) School of Graduate Studies 89% 90% 75% 85% 90% 76% 69% (9/13) School of Medicine 99% 97% 97% 95% 97% 96% 98% (193/196) School of Nursing 93% 82% 91% 89% 90% 82% 86% (398/464) School of Public Health 100% 92% 92% 98% 97% 98% 91% (48/53)
* NOTE: For GRAD Act Years 4-6, School of Dentistry metrics will be assessed using combined program benchmarks.
a.iv. Same Institution Graduation Rate:
LSUHSC-NO School Baseline
(2008-09) 2009-10 2010-11 2011-12 2012-13 2013-14 2014-15
School of Allied Health Professions 93% 92% 94% 93% 85% 93% 92% (168/183) School of Dentistry—Dentistry 95% 100% 100% 98% 100% 98% 95% (62/65) School of Dentistry—Dental Hygiene 100% 100% 100% 98% 100% 100% 97% (37/38) School of Dentistry—Dental Lab Tech 100% 100% 100% 100% 80% 100% 100% (8/8) School of Graduate Studies* N/A N/A N/A N/A N/A N/A N/A School of Medicine 94% 95% 95% 96% 97% 93% 94% (174/186) School of Nursing* N/A N/A N/A N/A N/A N/A N/A School of Public Health 91% 83% 96% 100% 67% 85% 100% (47/47)
* Due to small class sizes and various acceptable lengths of study, graduation rates for the Schools of Graduate Studies and Nursing cannot be calculated.
During the 2014-2015 academic year, nearly all Schools met or exceeded performance benchmarks. The School of Graduate Studies saw a sharp percentage decline in 1st to 2nd year retention in Year 6 (due primarily to small cohort numbers—four students withdrew for personal or medical reasons; however small cohort numbers led to a drastic percentage decline). The School of Public Health failed to meet retention goals in Year 6 due to five MPH students dropping out of the program—four for personal reasons and one due to receiving a more competitive financial package out of state. All Schools met same institution graduation metrics in Year 6.

LOUISIANA STATE UNIVERSITY HEALTH SCIENCES CENTER—NEW ORLEANS: 2016 GRAD ACT ANNUAL REPORT 2
a.x. Median Professional School Entrance Exam: Each school within LSUHSC‐NO establishes its own requirements for professional school entrance exams. All applicants to the School of Dentistry must take the Dental Admissions Test (DAT) sponsored by the American Dental Association, with a minimum acceptable score of 16. Applicants to the School of Nursing’s BSN program are required to take the HESI Admissions Assessment Exam A from Evolve Testing & Remediation; a minimum score is not published. The School of Public Health utilizes the GRE, which changed its format and scoring in the spring of 2011; the School currently accepts students based on ranking, not raw scores.
LSUHSC‐NO School Baseline (2008‐09)
2009‐10 2010‐11 2011‐12 2012‐13 2013‐14 2014‐15
School of Dentistry—Dentistry 18.9 18.9 18.9 18.9 18 18 20
School of Nursing* 80.25 80.25 83.3 83.9 83.07 83.78 83.8
School of Public Health** 1078 1115 1092 297 305 303 305
* SoN Baseline & Year 1 scores reflect the TEAS entrance exam; the entrance exam changed in Fall 2010 to HESI A2. ** NOTE: ETS changed its GRE scoring scale from 1600 maximum in the old test to 346 maximum in new test.
b. Increase the percentage of program completers at all levels each year.
Percent change in completers by award level, from baseline year
LSUHSC‐NO School 2008‐2009 2009‐2010 2010‐2011 2011‐2012 2012‐2013 2013‐2014 2014‐2015
School of Allied Health Professions* BACHELOR’S MASTER’S PROFESSION
Baseline: 30 Baseline: 47 Baseline: 23
+13% (34) +32% (62) +52% (35)
+27% (38) +43% (67)
+104% (47)
+37% (41) +83% (86)
+126% (52)
+33% (40) +64% (77) +74% (40)
+60% (48) +43% (67)
+104% (47)
+40% (42) +83% (86) +91% (44)
School of Dentistry—Dentistry** PROFESSIONAL
Baseline: 59
+2% (60)
‐12% (53)
‐2% (58)
+15% (68)
+10% (65)
+7% (63)
School of Dentistry—Dental Hygiene BACHELOR’S
Baseline: 41
+5% (43)
‐2% (40)
‐17% (34)
‐2% (40)
‐7% (38)
‐10% (37)
School of Dentistry—Dental Lab Tech ASSOCIATE’S
Baseline: 4
+/‐0% (4)
+175% (11)
+25% (5)
+/‐0% (4)
+100% (8)
+125% (9)
School of Graduate Studies*** MASTER’S
Baseline: 2 Baseline: 31
+/‐0% (2) ‐23% (24)
‐100% (0) ‐39% (19)
‐50% (1) ‐52% (15)
+100% (4) ‐32% (21)
+50% (3) ‐61% (12)
+/‐0% (2) ‐32% (21)
School of Medicine PROFESSIONAL
Baseline: 187
+2% (190)
‐2% (184)
‐4% (179)
+1% (188)
‐4% (180)
‐3% (181)
School of Nursing BACHELOR’S MASTER’S
Baseline: 176 Baseline: 51 Baseline: 2
+/‐0% (176) +/‐0% (51) +/‐0% (2)
+11% (196) +45% (74) +/‐0% (2)
+26% (222) +86% (95) +/‐0% (2)
+46% (257) +61% (82) ‐100% (0)
+49% (263) +71% (87) +450% (11)
+43% (251) +65% (84) +350% (9)
School of Public Health MASTER’S
Baseline: 29 Baseline: 2
‐3% (28) +50% (3)
‐10% (26) ‐100% (0)
‐10% (26) ‐50% (1)
+31% (38) +50% (0)
+38% (40) ‐100% (0)
+55% (45) +/‐0% (2)
* The School of Allied Health Professions has two Doctoral‐level programs, AuD and DPT, which are both listed as Professional degrees within the GRAD Act report. At present, the AuD is listed as a Doctoral program on BoR CRIN reports, while the DPT is listed as a Professional program on CRIN reports.
** The School of Dentistry graduated 19 MSD (Master's of Science in Dentistry) completers in 2015; however, these students are not reflected above since this is a new degree program, not featured in prior year reports.
*** In 2011, the Biostatistics and Epidemiology programs were moved from the School of Graduate Studies to the School of Public Health; all other existing Graduate School MS programs were terminated by the Board of Regents (and thus MS performance benchmarks were eliminated). A single MS/ Biomedical Sciences program has since been established in the School of Graduate Studies to fill this gap.

LOUISIANA STATE UNIVERSITY HEALTH SCIENCES CENTER—NEW ORLEANS: 2016 GRAD ACT ANNUAL REPORT 3
In Year 6 GRAD Act reporting the following Schools/Programs fell short of GRAD Act completer goals: Dental Hygiene Bachelor’s completers; Professional completers in the School of Medicine; and Doctoral completers in the School of Public Health. Graduates of the Dental Hygiene program declined 10% from baseline levels (37/41) and fall short of Year 6 goals; this can be attributed to the Board of Regents’ discontinuation of the Baton Rouge DHY program in 2010, which led to a decline in overall program acceptances from 42 to 36 annually. In the School of Medicine, a relatively large group of 4th-year students began the 2015 academic year off-cycle as a result of taking longer than usual to pass USMLE Step 1. Additionally, a subset of these students subsequently had difficulty in passing both the practice and actual USMLE Step 2 exam in time to qualify for graduation in 2015. Public Health Doctoral completers fell short of Year 6 benchmarks as the School’s Ph.D. program just began in 2008, thus cohort and completer numbers are growing slowly. c. Develop partnerships with high schools to prepare students for postsecondary education. N/A d. Increase passage rates on licensure and certification exams and workforce foundational skills. Each LSUHSC-NO School sets its own standards for state and national licensure/certification exams. • The School of Allied Health requires passage of national certification exams for state licensure. • The School of Dentistry requires all students to challenge the National Board Dental Examination,
Part II prior to graduation. • A certification/licensure exam does not exist for students in the School of Graduate Studies. • The School of Medicine requires passage of the USMLE prior to graduation. • Students of the School of Nursing’s undergraduate program must have graduated prior to sitting for
their licensure exams. • Certification is not mandatory for graduates of the School of Public Health, as it is not available to
non-CEPH-accredited school graduates and is not required by U.S. Governmental Agencies.
With the exception of the School of Medicine’s USMLE Step 2CK exam scores, all Schools met or exceeded GRAD Act passage rate benchmarks for Year 6, as outlined on the following pages. The decline in successful first-time Step 2CK test takers is most likely a result of weak performances by students who were off-cycle due to difficulties in passing both practice NBME Step 1 exams prior to taking the actual Step exam, as well as students who exhibited weak or poor performances on 3rd-year shelf exams for specific clerkships. To address these shortfalls, students are now advised to take practice exams for their specific 3rd-year clerkships prior to the actual NBME shelf exams. These practice exams should improve student understanding of the material and help them to identify areas of weakness. In addition, this allows students to “practice” the type of questions they will see both on the shelf exams and USMLE Step 2CK. LSUHSC-NO expects to see an increase in both student performance on specific specialty shelf exams and on USMLE Step 2CK. SCHOOL OF ALLIED HEALTH PROFESSIONS
Year/Program HSC Pass Rate Nat’l Pass Rate
2014-2015: Cardiopulmonary Science 100% (9/9) 72%
2014-2015: Audiology and Speech-Language Pathology
100% (33/33) AUD 68% | SLP 84%
2014-2015: Medical Technology 100% (25/25) 80%
2014-2015: Occupational Therapy 100% (27/27) 97%
2014-2015: Physical Therapy 100% (33/33) 94%

LOUISIANA STATE UNIVERSITY HEALTH SCIENCES CENTER—NEW ORLEANS: 2016 GRAD ACT ANNUAL REPORT 4
2013-2014: Cardiopulmonary Science 90% (9/10) 60%
2013-2014: Audiology & SLP 100% (36/36) AUD 63% | SLP 84%
2013-2014: Medical Technology 100% (30/30) 86%
2013-2014: Occupational Therapy 100% (30/30) 86%
2013-2014: Physical Therapy 97% (35/36) 97%
2012-2013: Cardiopulmonary Science 100% (13/13) 79%
2012-2013: Audiology & SLP 100% (36/36) N/A
2012-2013: Medical Technology 100% (27/27) 84%
2012-2013: Occupational Therapy 91% (30/33) 93%
2012-2013: Physical Therapy 100% (30/30) 88%
2011-2012: Cardiopulmonary Science 100% (13/13) 68%
2011-2012: Audiology & SLP 100% (34/34) 72%
2011-2012: Medical Technology 96% (25/26) 81%
2011-2012: Occupational Therapy 95% (35/37) 85%
2011-2012: Physical Therapy 100% (40/40) N/A
2010-2011: Cardiopulmonary Science 92% (11/12) 67%
2010-2011: Audiology & SLP 100% (30/30) 88%
2010-2011: Medical Technology 100% (25/25) 82%
2010-2011: Occupational Therapy 100% (31/31) 84%
2010-2011: Physical Therapy 100% (40/40) 88%
2009-2010: Cardiopulmonary Science 90% (9/10) 72%
2009-2010: Audiology & SLP 100% (22/22) 86%
2009-2010: Medical Technology 95% (18/19) 82%
2009-2010: Occupational Therapy 97% (33/34) 78%
2009-2010: Physical Therapy 100% (29/29) 89%
SoD—PROGRAM IN DENTISTRY
Percentage Pass Rate: National Board Dental Examination (Clinical)
Year HSC Pass Rate Nat’l Pass Rate
2015 95% (60/63) Data Unavailable 2014 100% (66/66) Data Unavailable
2013 100% (68/68) Data Unavailable
2012 100% (59/59) Data Unavailable
2011 98% (52/53) Data Unavailable
2010 96% (55/57) Data Unavailable
Percentage Pass Rate: LA State Board of Dentistry Licensure Examination (Written)
Year HSC Pass Rate Nat’l Pass Rate
2015 100% (62/62) Data Unavailable 2014 100% (66/66) Data Unavailable
2013 100% (68/68) Data Unavailable
2012 98% (58/59) Data Unavailable
2011 100% (53/53) Data Unavailable
2010 100% (60/60) Data Unavailable
SoD—PROGRAM IN DENTAL HYGIENE
Percentage Pass Rate: National Board DH Examination (Clinical)
Year HSC Pass Rate Nat’l Pass Rate
2014-2015 100% (38/38) Data Unavailable 2013-2014 100% (38/38) Data Unavailable
2012-2013 100% (40/40) Data Unavailable
2011-2012 100% (34/34) Data Unavailable
2010-2011 100% (40/40) Data Unavailable
2009-2010 100% (43/43) Data Unavailable
Percentage Pass Rate: Dental Hygiene Clinical Licensure Examination (Written)
Year HSC Pass Rate Nat’l Pass Rate
2014-2015 100% (38/38) Data Unavailable 2013-2014 100% (38/38) Data Unavailable
2012-2013 100% (40/40) Data Unavailable
2011-2012 100% (34/34) Data Unavailable
2010-2011 100% (40/40) Data Unavailable
2009-2010 100% (43/43) Data Unavailable

LOUISIANA STATE UNIVERSITY HEALTH SCIENCES CENTER—NEW ORLEANS: 2016 GRAD ACT ANNUAL REPORT 5
SCHOOL OF MEDICINE
Year/Test HSC Pass Rate Nat’l Pass Rate
2014-2015: USMLE Step 1 97% (186/192) 95%
2014-2015: USMLE Step 2CK 91% (165/182) 96%
2014-2015: USMLE Step 2CS 92% (164/178) 95% 2013-2014: USMLE Step 1 97% (173/178) 95%
2013-2014: USMLE Step 2CK 93% (171/183) 97%
2013-2014: USMLE Step 2CS 95% (174/184) 97%
2012-2013: USMLE Step 1 95% (177/187) 96%
2012-2013: USMLE Step 2CK 98% (180/183) 98%
2012-2013: USMLE Step 2CS 97% (183/188) 98%
2011-2012: USMLE Step 1 94% (180/191) 95%
2011-2012: USMLE Step 2CK 98% (177/180) 97%
2011-2012: USMLE Step 2CS 90% (157/177) 97%
2010-2011: USMLE Step 1 98% (183/186) 95%
2010-2011: USMLE Step 2CK 99% (181/183) 99%
2010-2011: USMLE Step 2CS 100% (180/180) 99%
2009-2010: USMLE Step 1 95% (164/172) 94%
2009-2010: USMLE Step 2CK 99% (166/167) 96%
2009-2010: USMLE Step 2CS 94% (155/165) 97%
SCHOOL OF NURSING
Year/Exam HSC Pass Rate Nat’l Pass Rate
2014-2015: NCLEX 97% (181/187) 85% 2013-2014: NCLEX 97% (171/177) 82%
2012-2013: NCLEX 96% (170/178) 83%
2011-2012: NCLEX 98% (206/210) 87%
2010-2011: NCLEX 98% (175/178) 91%
2009-2010: NCLEX 97% (169/175) 90%
NOTE: NCLEX passages rates for calendar year 2015 are being furnished for Year 6, as LSUHSC-NO used calendar year 2009 passage rates as baseline data.

LOUISIANA STATE UNIVERSITY HEALTH SCIENCES CENTER—NEW ORLEANS: 2016 GRAD ACT ANNUAL REPORT 6
2. ARTICULATION AND TRANSFER—N/A TO LSUHSC a. Phase in increased admission standards and other necessary policies by the end of the 2012 Fiscal Year in order to increase student retention and graduation rates. N/A b. Provide feedback to community colleges and technical college campuses on the performance of associate degree recipients enrolled at the institution. N/A c. Develop referral agreements with community colleges and technical college campuses to redirect students who fail to qualify for admission into the institution. N/A d. Demonstrate collaboration in implementing articulation and transfer requirements provided in R.S. 17:3161 through 3169. N/A
LOUISIANA STATE UNIVERSITY HEALTH SCIENCES CENTER—NEW ORLEANS: 2016 GRAD ACT ANNUAL REPORT 7
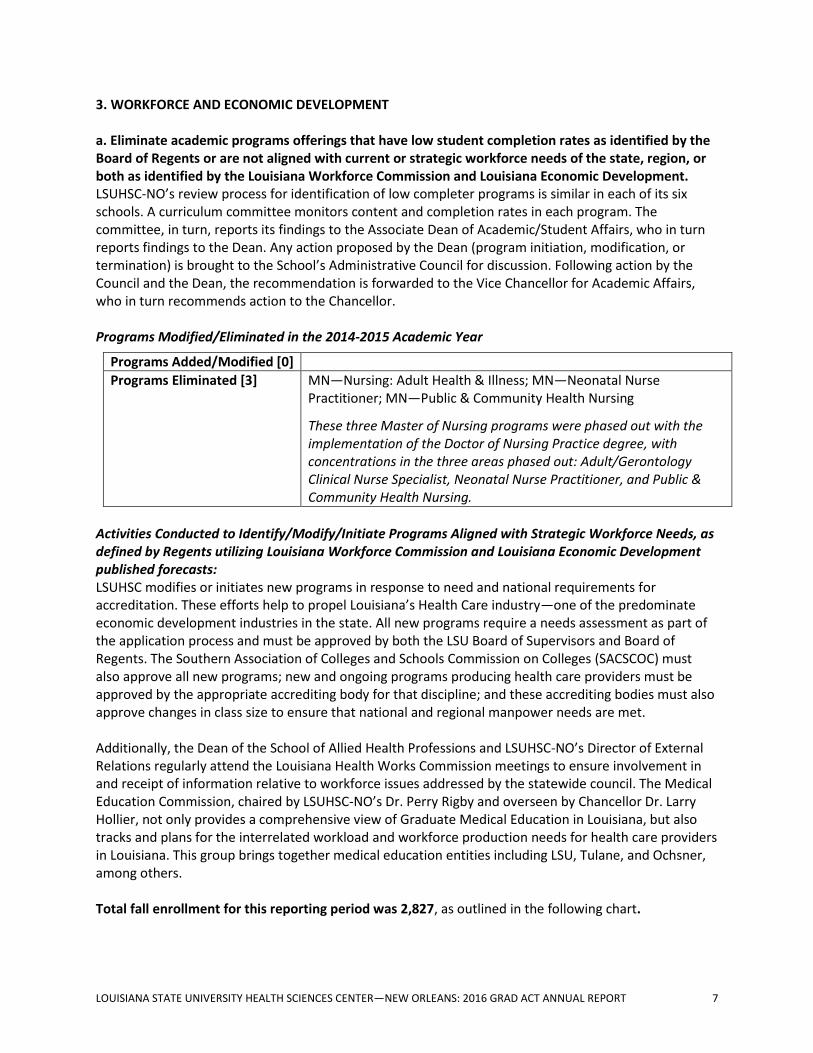
3. WORKFORCE AND ECONOMIC DEVELOPMENT a. Eliminate academic programs offerings that have low student completion rates as identified by the Board of Regents or are not aligned with current or strategic workforce needs of the state, region, or both as identified by the Louisiana Workforce Commission and Louisiana Economic Development. LSUHSC-NO’s review process for identification of low completer programs is similar in each of its six schools. A curriculum committee monitors content and completion rates in each program. The committee, in turn, reports its findings to the Associate Dean of Academic/Student Affairs, who in turn reports findings to the Dean. Any action proposed by the Dean (program initiation, modification, or termination) is brought to the School’s Administrative Council for discussion. Following action by the Council and the Dean, the recommendation is forwarded to the Vice Chancellor for Academic Affairs, who in turn recommends action to the Chancellor. Programs Modified/Eliminated in the 2014-2015 Academic Year
Programs Added/Modified [0]
Programs Eliminated [3] MN—Nursing: Adult Health & Illness; MN—Neonatal Nurse Practitioner; MN—Public & Community Health Nursing
These three Master of Nursing programs were phased out with the implementation of the Doctor of Nursing Practice degree, with concentrations in the three areas phased out: Adult/Gerontology Clinical Nurse Specialist, Neonatal Nurse Practitioner, and Public & Community Health Nursing.
Activities Conducted to Identify/Modify/Initiate Programs Aligned with Strategic Workforce Needs, as defined by Regents utilizing Louisiana Workforce Commission and Louisiana Economic Development published forecasts: LSUHSC modifies or initiates new programs in response to need and national requirements for accreditation. These efforts help to propel Louisiana’s Health Care industry—one of the predominate economic development industries in the state. All new programs require a needs assessment as part of the application process and must be approved by both the LSU Board of Supervisors and Board of Regents. The Southern Association of Colleges and Schools Commission on Colleges (SACSCOC) must also approve all new programs; new and ongoing programs producing health care providers must be approved by the appropriate accrediting body for that discipline; and these accrediting bodies must also approve changes in class size to ensure that national and regional manpower needs are met. Additionally, the Dean of the School of Allied Health Professions and LSUHSC-NO’s Director of External Relations regularly attend the Louisiana Health Works Commission meetings to ensure involvement in and receipt of information relative to workforce issues addressed by the statewide council. The Medical Education Commission, chaired by LSUHSC-NO’s Dr. Perry Rigby and overseen by Chancellor Dr. Larry Hollier, not only provides a comprehensive view of Graduate Medical Education in Louisiana, but also tracks and plans for the interrelated workload and workforce production needs for health care providers in Louisiana. This group brings together medical education entities including LSU, Tulane, and Ochsner, among others. Total fall enrollment for this reporting period was 2,827, as outlined in the following chart.

LOUISIANA STATE UNIVERSITY HEALTH SCIENCES CENTER—NEW ORLEANS: 2016 GRAD ACT ANNUAL REPORT 8
LSUHSC-NO School Enrollment Baseline
(2008-09) 2009-10 2010-11 2011-12 2012-13 2013-14 2014-15
School of Allied Health Professions 296 351 385 392 367 378 410
(+39% baseline, +8% annual)
School of Dentistry 381 388 404 389 396 398 392
(+3% baseline, -2% annual)
School of Graduate Studies 114 113 102 98 100 88 88
(-23% baseline, +/-0% annual)
School of Medicine 714 745 763 763 762 771 773
(+8% baseline, +0.3% annual)
School of Nursing 846 958 975 1,033 1,046 1,060 1,049
(+24% baseline, -1% annual)
School of Public Health 81 86 89 102 116 133 115
(+42% baseline, -14% annual)
b. Increase use of technology for distance learning to expand educational offerings.
2008-09 2009-10 2010-11 2011-12 2012-13 2013-14 2014-15
Number of course sections offered with 50%-99% instruction through distance education
30 30 31 2 29 31 31
Number of students enrolled in courses with 50%-99% instruction through distance education
12 12 40 46 90 48 20
Number of course sections offered through 100% distance education
0 0 0 0 0 0 0
Number of students enrolled in courses with 100% instruction through distance education
0 0 0 0 0 0 0
Due to the hands-on, clinical learning requirements of most programs at LSUHSC-NO, few courses are offered via distance education. The exceptions are Dental Hygiene classroom courses (a total of 30 course sections in AY14-15), which were “beamed” to DHYI and DHYII students (11 total) in Lafayette, and one elective course in the School of Nursing—NURS 4367-Ethical and Legal Issues in Nursing (9 students in AY14-15). Outside of distance learning modules, LSUHSC-NO utilizes multiple avenues of online student assessment. Students in the School of Dentistry are required to use laptops preloaded with textbooks for their current year of study. Exams and self-assessment guides are also administered via these laptops. In the School of Medicine, virtually all examinations in the first and second year are taken on student laptops over a secure network. DXR, a diagnostic reasoning program, is used in the first two years and is available to students over the same network. This program assesses student performance in the evaluation of individual case studies. Technology also plays a vital role in LSUHSC’s Learning Center, where computer-controlled patient simulators are used to monitor student skills in a simulated clinical setting. Students from virtually all clinical programs are exposed to this technology in an interdisciplinary learning environment. These labs rank among the top three centers nationally in terms of this

LOUISIANA STATE UNIVERSITY HEALTH SCIENCES CENTER—NEW ORLEANS: 2016 GRAD ACT ANNUAL REPORT 9
technology. More information about the Learning Center can be found at: http://www.medschool.LSUHSC.edu/learning_center. c. Increase research productivity especially in key economic development industries and technology transfer at institutions to levels consistent with the institution's peers.
Performance Objectives/ Elements/Measures
Baseline (2009-10)
2010-11 2011-12 2012-13 2013-14 2014-15
i. Number of research/instructional faculty (FTE) at the institution during the reporting year
494.30 573 545.22 368.91 364.81 381.74
Percent of above research/instructional faculty (FTE) at the institution holding active research and development grants/contracts
N/A 29.84% 27.88% 25.75% 28.78% 26.90%
ii. Percent of above research/instructional faculty (FTE) holding active research and development grants/contracts in Louisiana’s key economic development industries.
N/A 29.84% 27.88% 25.75% 28.78% 26.90%
iii. Dollar amount of research and development expenditures, reporting annually, based on a five-year rolling average, by source (federal, industry, institution, other). Include all expenditures from S&E and non-S&E R&D grants/contracts as reported annually to the NSF.
N/A $59,613,963 $58,029,758 $55,810,013 $53,084,862 $50,497,177
iv. Dollar amount of research and development expenditures in Louisiana’s key economic development industries, reported annually, based on a five-year average. These data will be supplemented with the narrative report demonstrating how research activities align with Louisiana’s key economic development industries.
N/A $59,613,963 $58,029,758 $55,810,013 $53,084,862 $50,497,177
vi.
Direct research grants and contracts (recorded). Peer group percentile ranking – TARGET: 33rd percentile.
N/A 37th 37th 29th 21st 21st
* While there have been decreases in faculty headcount and faculty FTEs, there has also been a significant shift in the primary function of faculty as reported in the BOR salary database from Instruction to Public Service. Faculty who were reported as Instruction-Appropriated funds previously are now being reported as Public Service-Restricted funds due to the privatization of the Interim LSU Hospital in New Orleans, University Medical Center in Lafayette and the closure of Earl K. Long Medical Center in Baton Rouge.
** A list of active grant awards and Principal Investigators is provided as Attachment 1.

LOUISIANA STATE UNIVERSITY HEALTH SCIENCES CENTER—NEW ORLEANS: 2016 GRAD ACT ANNUAL REPORT 10
Louisiana's key economic development industries include but are not limited to key industry sectors identified in the Fostering Innovation through Research in Science and Technology in Louisiana (FIRST Louisiana) plan, as well as LED's Blue Ocean targeted industry sectors. One of the primary industry sectors identified in these plans is Health Care (specialty research hospital; obesity/diabetes research and treatment; pharmaceutical manufacturing; digital media/software development; health care IT). LSUHSC-NO's Dr. Perry Rigby, Dr. Charles Hilton, and Dr. Larry Hollier all participate in the Medical Education Commission (Dr. Rigby serving as Chair), which documents and tracks the nature and scope of all training programs for postdoctoral residents and fellows in Louisiana, highlighting the workload needs and interrelatedness of workforce production by the Health Science Centers. Commission reports characterize the public/private partnerships at work in the state and their effects on workforce production. Additionally, Dr. Hilton and Dr. James Cairo all participate in the Healthworks Council, which routinely reviews physician needs and production in Louisiana. Health Care is one of Louisiana’s primary economic development industries. Virtually all academic programs at LSUHSC-NO are aligned with the production of Health Care providers and researchers. A majority of the research at LSUHSC-NO is funded by the National Institutes of Health (NIH). Other sources of research funding include the Department of Defense, Centers for Disease Control and Prevention, National Science Foundation, American Heart Association, and the like. FY15 research expenditures at the HSC-NO were $46,838,416 as measured by NSF’s Higher Education Research and Development Survey. These externally funded outlays include salaries for numerous technicians and other employees that have a large multiplying effect in stimulating the local economy. The opening of the new Louisiana Cancer Research Center and University Medical Center should have positive impacts on clinical research and clinical trials. As an additional measure of research and scholarly productivity, there were a total of 800 publications produced by LSUHSC-NO students and faculty in 2015. Using the formulation provided by the Board of Regents {[(B + 0.5E)/n] * 100 = percentile rank, where B = number of peers below x, E = number of peers equal to x, and n = number of peers}, LSUHSC-NO currently ranks in the 21st percentile in its peer group for direct research grants and contracts (recorded).
Direct Federal Research Grants and Contracts
1 Oklahoma $ 36,234,289
2 Arkansas $ 34,681,924
3 Louisville $ 34,424,994
4 GRU MC Georgia $ 27,218,943
5 Eastern Virginia $ 25,033,279
6 Tennessee $ 22,025,551
7 Mississippi $ 21,773,804
8 Texas A&M $ 11,421,764
9 Missouri-Columbia $ 11,342,992
10 LSUHSC New Orleans $ 9,712,665
11 West Virginia $ 9,531,493
12 South Carolina $ 8,523,911
In recent years LSUHSC-NO’s percentile ranking for direct research grants and contracts among its peers has declined. There is a general trend of declining grant support for research both state- and nation-

LOUISIANA STATE UNIVERSITY HEALTH SCIENCES CENTER—NEW ORLEANS: 2016 GRAD ACT ANNUAL REPORT 11
wide. Contributing factors to this decline include losses of faculty with funded research and the institution’s inability to provide competitive recruitment packages to bring in faculty with research grants due to budget reductions.
Performance Measures: Intellectual Property
Baseline (2008-09)
Year 1 (2009-10)
Year 2 (2010-11)
Year 3 (2011-12)
Year 4 (2012-13)
Year 5 (2013-14)
Year 5 (2014-15)
v. I.P. Measure - Patents 4 8 3 8 12 21 16
I.P. Measure - Disclosures 14 13 3 12 33 52 37
I.P. Measure - Licenses 3 0 1 0 2 4 5
I.P. Measure - Options 0 0 0 1 1 1 1
I.P. Measure - New Companies
0 0 0 1 1 0 2
I.P. Measure - Surviving Start-Ups
1 1 1 2 4 1 3
The Office of Technology Management at LSUHSC-NO facilitates the institution’s research enterprise and brings significant novel intellectual property to the marketplace. Major steps in technology transfer include disclosure of inventions, evaluation, patent prosecution, marketing, and licensing. In addition to the actual technology transfer process, this Office is also charged with negotiating material transfer agreements, confidential disclosure agreements, intellectual property language in sponsored research agreements, and inter-institutional agreements. In 2015, adjusted gross licensing income was $69,102 from 8 licenses and options. Academic technology transfer serves to:
Facilitate the commercialization of research results for the public good;
Reward, retain, and recruit faculty;
Induce closer ties to industry; and
Generate income and promote economic growth. In fiscal year 2015, the disclosure rate stabilized at a level more in line with research expenditures. Faculty engagement with the Office of Technology Management continues to grow. Increased marketing efforts have proven successful, with six licenses or options executed during FY15. The Office of Technology Management was able to maintain a near 50% reimbursement of the legal fees it expended this period. Additionally, the LSUHSC-NO campus continues to achieve great success in winning proof-of-concept awards from the LSU System’s Leveraging Innovation for Technology Transfer grant program. To date and over three rounds of funding, the N.O. campus has been awarded 27% of all awards made, representing 27.5% of all funds awarded. The HSC is also making great progress in creating an environment in which entrepreneurially-minded faculty, staff, and students can move forward with their business ideas. LSUHSC-NO further collaborates with two major economic development engines in the city. The first is the New Orleans BioInnovation Center (NOBIC), a technology business incubator that aims to stimulate bioscience entrepreneurship in Greater New Orleans, funded in part by the Louisiana Department of Economic Development. The primary purpose of this facility is to translate research into therapeutic
LOUISIANA STATE UNIVERSITY HEALTH SCIENCES CENTER—NEW ORLEANS: 2016 GRAD ACT ANNUAL REPORT 12
agents, technology, and devices that can be patented and foster economic growth. NOBIC opened in May 2011 at 1441 Canal Street, housing 65,000 square feet of wet-lab space, stand-alone offices, and meeting/conference spaces. Biotechnology companies developing from LSUHSC-NO and other area institutions are able to lease lab and office in this facility, which is in close proximity to the HSC’s campus. More information about NOBIC can be found at: http://www.neworleansbio.com.
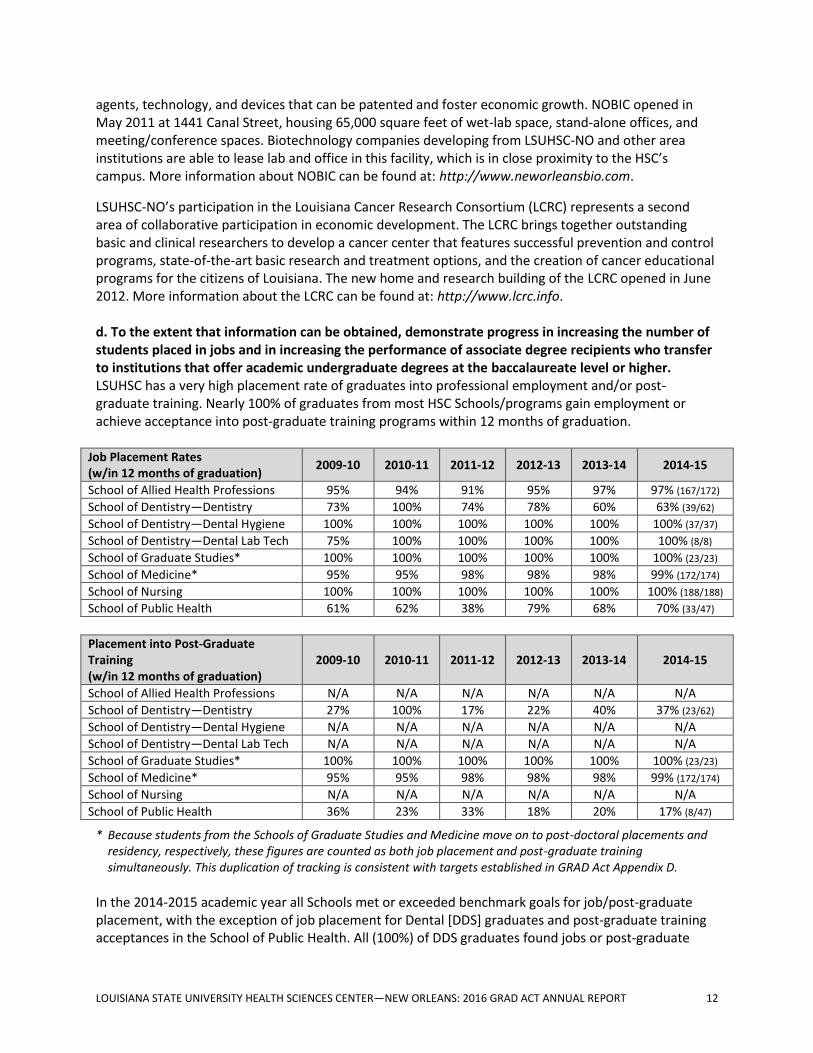
LSUHSC-NO’s participation in the Louisiana Cancer Research Consortium (LCRC) represents a second area of collaborative participation in economic development. The LCRC brings together outstanding basic and clinical researchers to develop a cancer center that features successful prevention and control programs, state-of-the-art basic research and treatment options, and the creation of cancer educational programs for the citizens of Louisiana. The new home and research building of the LCRC opened in June 2012. More information about the LCRC can be found at: http://www.lcrc.info. d. To the extent that information can be obtained, demonstrate progress in increasing the number of students placed in jobs and in increasing the performance of associate degree recipients who transfer to institutions that offer academic undergraduate degrees at the baccalaureate level or higher. LSUHSC has a very high placement rate of graduates into professional employment and/or post-graduate training. Nearly 100% of graduates from most HSC Schools/programs gain employment or achieve acceptance into post-graduate training programs within 12 months of graduation.
Job Placement Rates (w/in 12 months of graduation)
2009-10 2010-11 2011-12 2012-13 2013-14 2014-15
School of Allied Health Professions 95% 94% 91% 95% 97% 97% (167/172) School of Dentistry—Dentistry 73% 100% 74% 78% 60% 63% (39/62) School of Dentistry—Dental Hygiene 100% 100% 100% 100% 100% 100% (37/37) School of Dentistry—Dental Lab Tech 75% 100% 100% 100% 100% 100% (8/8) School of Graduate Studies* 100% 100% 100% 100% 100% 100% (23/23) School of Medicine* 95% 95% 98% 98% 98% 99% (172/174) School of Nursing 100% 100% 100% 100% 100% 100% (188/188) School of Public Health 61% 62% 38% 79% 68% 70% (33/47)
Placement into Post-Graduate Training (w/in 12 months of graduation)
2009-10 2010-11 2011-12 2012-13 2013-14 2014-15
School of Allied Health Professions N/A N/A N/A N/A N/A N/A
School of Dentistry—Dentistry 27% 100% 17% 22% 40% 37% (23/62)
School of Dentistry—Dental Hygiene N/A N/A N/A N/A N/A N/A
School of Dentistry—Dental Lab Tech N/A N/A N/A N/A N/A N/A
School of Graduate Studies* 100% 100% 100% 100% 100% 100% (23/23)
School of Medicine* 95% 95% 98% 98% 98% 99% (172/174)
School of Nursing N/A N/A N/A N/A N/A N/A
School of Public Health 36% 23% 33% 18% 20% 17% (8/47)
* Because students from the Schools of Graduate Studies and Medicine move on to post-doctoral placements and residency, respectively, these figures are counted as both job placement and post-graduate training simultaneously. This duplication of tracking is consistent with targets established in GRAD Act Appendix D.
In the 2014-2015 academic year all Schools met or exceeded benchmark goals for job/post-graduate placement, with the exception of job placement for Dental [DDS] graduates and post-graduate training acceptances in the School of Public Health. All (100%) of DDS graduates found jobs or post-graduate
LOUISIANA STATE UNIVERSITY HEALTH SCIENCES CENTER—NEW ORLEANS: 2016 GRAD ACT ANNUAL REPORT 13
training following graduation; however, a larger number than usual sought immediate post-graduate professional training as opposed to immediately entering the job market. A greater than anticipated number of Public Health graduates sought employment immediately following graduation, rather than applying for post-graduate training, which skewed benchmark percentages. It is believed in many cases the decision was made to seek immediate employment rather than taking on additional student loan debt.

LOUISIANA STATE UNIVERSITY HEALTH SCIENCES CENTER—NEW ORLEANS: 2016 GRAD ACT ANNUAL REPORT 14
4. INSTITUTIONAL EFFICIENCY AND ACCOUNTABILITY a. Eliminate remedial education course offerings and developmental study programs unless such courses or programs cannot be offered at a community college in the same geographical area. N/A b. Eliminate associate degree program offerings unless such programs cannot be offered at a community college in the same geographic area or when the Board of Regents has certified educational or workforce needs. N/A—The only associate degree program at LSUHSC-NO is the Dental Lab Technology program, which is housed in the School of Dentistry and is currently the only facility in the state with the required equipment to maintain such a program. c. Upon entering the initial performance agreement, adhere to a schedule established by the institution's management board to increase nonresident tuition amounts that are not less than the average tuition amount charged to Louisiana residents attending peer institutions in other Southern Regional Education Board states and monitor the impact of such increases on the institution. However, for each public historically black college or university, the nonresident tuition amounts shall not be less than the average tuition amount charged to Louisiana residents attending public historically black colleges and universities in other Southern Regional Education Board states.
Total Tuition & Fees Charged to Full-Time Non-Resident Students
LSUHSC-NO School
2008-09 2009-10 2010-11 2011-12 2012-13 2013-14 2014-15 Peer
Comp*
Allied Health Professions Undergraduate (Fall & Spring)
$6,691 $7,195 $7,533 $9,075 $10,436 $12,097 $13,912 $23,713
Allied Health Professions Graduate (Fall & Spring)
$7,304 $7,855 $8,243 $9,957 $11,450 $13,264 $15,254 $23,050
Allied Health Professions DPT (Annual)
$13,939 $14,910 $15,853 $19,223 $22,106 $25,542 $29,373 $35,661
Dentistry Program in Dentistry
$23,842 $25,640 $26,555 $32,391 $37,250 $43,839 $57,100 $57,100
Dentistry Dental Hygiene (Fall & Spring)
$4,518 $4,856 $5,104 $6,182 $7,109 $8,271 $9,512 $26,010
Dentistry Dental Lab Tech (Fall & Spring)
$4,127 $4,471 $4,701 $5,689 $6,542 $7,619 $8,762 N/A
Graduate Studies (Fall & Spring)
$7,304 $7,855 $8,243 $9,964 $11,459 $13,274 $15,265 $20,968
Medicine (Annual)
$27,545 $29,625 $30,694 $37,463 $43,082 $50,693 $56,087 $56,087
Nursing Undergraduate (Fall & Spring)
$4,867 $5,234 $5,490 $6,627 $7,621 $8,860 $10,189 $22,732

LOUISIANA STATE UNIVERSITY HEALTH SCIENCES CENTER—NEW ORLEANS: 2016 GRAD ACT ANNUAL REPORT 15
Nursing Graduate (Fall & Spring)
$6,257 $6,728 $7,030 $8,465 $9,735 $11,291 $12,985 $25,106
Nursing MN, Nurse Anesthesia (Annual)
$12,830 $13,798 $14,587 $17,743 $20,404 $23,585 $27,123 $31,468
Public Health MPH (Annual)
$6,834 $7,315 $7,808 $9,511 $10,938 $12,699 $14,604 $26,880
* SREB Peer Data is from 2013-2014 with the exception of Doctor of Physical Therapy.
Since the applicant pool for LSUHSC-NO is drawn almost entirely from Louisiana residents, there would be virtually no impact on either enrollment or revenue from a non-resident tuition increase in accordance with GRAD Act provisions. Similarly, a tuition increase for Louisiana residents is not anticipated to negatively impact enrollment in the schools of LSUHSC-NO. However, additional revenues that would be realized from such an in-state tuition increase are not expected to offset the anticipated budget reduction for Louisiana higher education. Most, but not all, non-resident students at LSUHSC-NO (Graduate Studies, MD-PhD, MS, and PhD in Public Health and a few Advanced Dental Education) receive tuition exemptions, which mitigate the impact of non-resident tuition increases and considerably limits the net revenue the institution realizes from non-resident tuition increases. With a relatively small overall enrollment, the resident tuition increases help to mitigate the impact of state general fund reductions—though they do not come close to offsetting cuts. Effective with the fall 2015 semester, LSUHSC-NO increased total non-resident tuition by 15% for all programs with the exception of MPS, MD, and DDS. Resident tuition was increased by 10% under the GRAD Act for most programs and an additional 5% under Act 297 of 2011 for MD and DDS students. It is LSUHSC-NO’s intent to increase total non-resident tuition as applicable up to another 15% effective with the fall 2016 semester, in accordance with the board resolution cited above. It is anticipated that the increase needed to bring MPS, MD, and DDS. Non-resident tuition up to peer levels will be less than 15%. LSUHSC-NO also intends to use its authority under the GRAD Act to increase resident tuition as applicable up to 10% for all programs effective with the fall 2016 semester. d. Designate centers of excellence as defined by the Board of Regents which have received a favorable academic assessment from the Board of Regents and have demonstrated substantial progress toward meeting the following goals:
Offering a specialized program that involves partnerships between the institution and business and industry, national laboratories, research centers, and other institutions.
Aligning with current and strategic statewide and regional workforce needs as identified by the Louisiana Workforce Commission and Louisiana Economic Development.
Having a high percentage of graduates or completers each year as compared to the state average percentage of graduates and that of the institution's peers.
Having a high number of graduates or completers who enter productive careers or continue their education in advanced degree programs, whether at the same or other institution.
Having a high level of research productivity and technology transfer.
N/A—No report on this element is required for the 2014-2015 annual report.

LOUISIANA STATE UNIVERSITY HEALTH SCIENCES CENTER—NEW ORLEANS: 2016 GRAD ACT ANNUAL REPORT 16
5. ORGANIZATIONAL DATA ATTACHMENT: LSU HEALTH SCIENCES CENTER—NEW ORLEANS a. Number of Students by Classification Headcount, undergraduate students and graduate/professional school students enrolled in fall of the reporting year.
LSUHSC-NO FALL 2015 ENROLLMENT
Undergraduate 879
Graduate 1,912
TOTAL 2,791
Budgeted FTE (full-time equivalent) undergraduate and graduate/professional school students, annual using reporting year fall and prior year spring.
LSUHSC-NO FALL 2015 BUDGETED FTE STUDENTS
Undergraduate 725
Graduate 1,964
TOTAL 2,689
b. Number of Instructional Staff Members Number and FTE instructional faculty for fall of the reporting year.
LSUHSC-NO INSTRUCTIONAL STAFF—FALL 2015
Instructional Faculty Headcount 410
Instructional Faculty FTE 334.24
c. Average Class Student-to-Instructor Ratio* Average undergraduate class size at the institution in the fall of the reporting year
LSUHSC-NO STUDENT-TO-INSTRUCTOR RATIO— FALL 2015
Average Undergraduate Class Size 5:1
d. Average Number of Students per Instructor* Ratio of FTE students to FTE instructional faculty in the fall of the reporting year.
LSUHSC-NO # OF STUDENTS/INSTRUCTOR— FALL 2015
Ratio: FTE Students to FTE Instructional Faculty 8:1
* PLEASE NOTE: Due to the large discrepancies in class sizes in LSUHSC-NO’s professional programs, which include the entire class for most didactic courses and one-on-one instruction in many clinical settings, this data is not comparable to traditional institutions. As LSUHSC-NO does not report to the Student Credit Hour (SCH) System, it is our recommendation that these items not be factored into GRAD Act reporting requirements.

LOUISIANA STATE UNIVERSITY HEALTH SCIENCES CENTER—NEW ORLEANS: 2016 GRAD ACT ANNUAL REPORT 17
e. Number of Non-Instructional Staff Members in Academic Colleges and Departments Number and FTE non-instructional staff members in the fall of the reporting year, by academic college (or school, if that is the highest level of academic organization for some units).
SCHOOL HEADCOUNT FTE
School of Allied Health Professions 18 18.00
School of Dentistry 10 10.00
School of Graduate Studies 0 0.00
School of Medicine 46 45.40
School of Nursing 4 4.00
School of Public Health 15 14.75
TOTAL NON-INSTRUCTIONAL STAFF 93 92.15
f. Number of Staff in Administrative Areas Number and FTE executive/managerial staff in the fall of the reporting year, as reported in the Employee Salary Data System (EMPSAL) in areas other than the academic colleges/schools, reported by division.
LSUHSC-NO ADMINISTRATIVE STAFF—FALL 2015
Headcount 107
FTE 104.95
g. Organizational Chart (Down to the Second Level of the Institution below the Chancellor) Please see Attachment 2. h. Salaries of All Personnel Identified in Subparagraph (g) Above, incl. Date, Amount, and Type of All Increases in Salary Received since June 30, 2008 Reported below on pages 18-22.
LOUISIANA STATE UNIVERSITY HEALTH SCIENCES CENTER—NEW ORLEANS: 2016 GRAD ACT ANNUAL REPORT 18
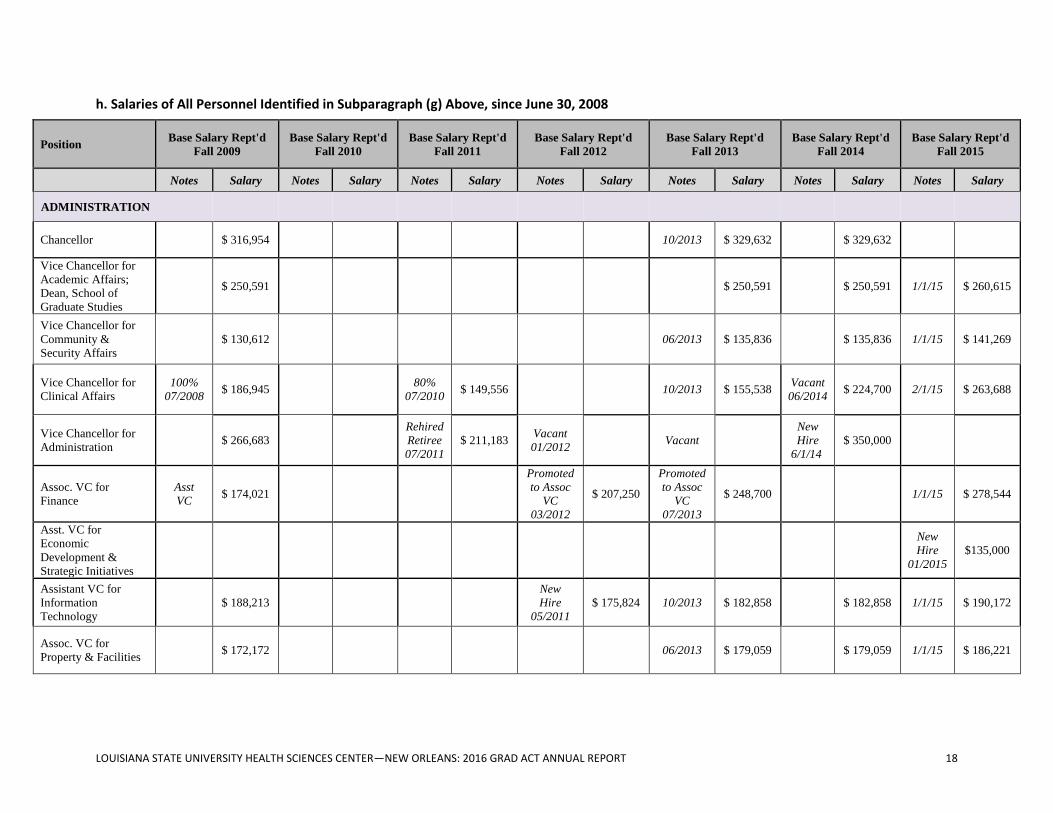
h. Salaries of All Personnel Identified in Subparagraph (g) Above, since June 30, 2008
Position Base Salary Rept'd
Fall 2009
Base Salary Rept'd
Fall 2010
Base Salary Rept'd
Fall 2011
Base Salary Rept'd
Fall 2012
Base Salary Rept'd
Fall 2013
Base Salary Rept'd
Fall 2014
Base Salary Rept'd
Fall 2015
Notes Salary Notes Salary Notes Salary Notes Salary Notes Salary Notes Salary Notes Salary
ADMINISTRATION
Chancellor $ 316,954 10/2013 $ 329,632 $ 329,632
Vice Chancellor for
Academic Affairs;
Dean, School of
Graduate Studies
$ 250,591 $ 250,591 $ 250,591 1/1/15 $ 260,615
Vice Chancellor for
Community &
Security Affairs
$ 130,612 06/2013 $ 135,836 $ 135,836 1/1/15 $ 141,269
Vice Chancellor for
Clinical Affairs
100%
07/2008 $ 186,945
80%
07/2010 $ 149,556 10/2013 $ 155,538
Vacant
06/2014 $ 224,700 2/1/15 $ 263,688
Vice Chancellor for
Administration $ 266,683
Rehired
Retiree
07/2011
$ 211,183 Vacant
01/2012 Vacant
New
Hire
6/1/14
$ 350,000
Assoc. VC for
Finance
Asst
VC $ 174,021
Promoted
to Assoc
VC
03/2012
$ 207,250
Promoted
to Assoc
VC
07/2013
$ 248,700 1/1/15 $ 278,544
Asst. VC for
Economic
Development &
Strategic Initiatives
New
Hire
01/2015
$135,000
Assistant VC for
Information
Technology
$ 188,213
New
Hire
05/2011
$ 175,824 10/2013 $ 182,858 $ 182,858 1/1/15 $ 190,172
Assoc. VC for
Property & Facilities $ 172,172 06/2013 $ 179,059 $ 179,059 1/1/15 $ 186,221

LOUISIANA STATE UNIVERSITY HEALTH SCIENCES CENTER—NEW ORLEANS: 2016 GRAD ACT ANNUAL REPORT 19
Position Base Salary Rept'd
Fall 2009
Base Salary Rept'd
Fall 2010
Base Salary Rept'd
Fall 2011
Base Salary Rept'd
Fall 2012
Base Salary Rept'd
Fall 2013
Base Salary Rept'd
Fall 2014
Base Salary Rept'd
Fall 2015
Notes Salary Notes Salary Notes Salary Notes Salary Notes Salary Notes Salary Notes Salary
SCHOOL OF ALLIED HEALTH
Dean, School of
Allied Health
Professions
As of
07/2008 $ 250,679
Comb
Base +
Supp
01/2010
$ 250,679 $ 250,679 1/1/15 $ 260,706
Assoc. Dean for
Academic Affairs $ 132,780
Vacant
07/2011
Acting
Asst
Dean
02/2013
$ 94,397 (Acting) $ 94,397 Prom
06/2014 $ 122,000
Asst. Dean for Fiscal
Affairs $ 91,604 06/2013 $ 95,268 $ 107,718
SCHOOL OF DENTISTRY
Dean, School of
Dentistry
New
Hire
10/2008
$ 250,000 $ 250,000 $ 270,000 1/1/15 $ 280,800
Assoc. Dean for
Academic Affairs $ 163,155 10/2013 $ 169,681 $ 169,681 1/1/15 $ 176,468
Assoc. Dean for
Research $ 186,221 10/2013 $ 193,670 $ 193,670 1/1/15 $ 201,417
Assistant Dean for
Clinical Education
As of
07/2008 $ 129,278
As of
07/2011
Fac.
Prom.
$ 144,791
Comb
Base +
Supp
08/2012
$ 155,513 10/2013 $ 161,734 $ 161,734 11/1/14 $ 193,989
Assistant Dean for
Fiscal Affairs $ 113,319 06/2013 $ 117,852 $ 117,852 3/1/16 $ 167,000
SCHOOL OF GRADUATE STUDIES
Assoc. Dean, School
of Graduate Studies $ 164,809 10/2013 $ 170,082 $ 170,082 1/1/15 $ 176,885

LOUISIANA STATE UNIVERSITY HEALTH SCIENCES CENTER—NEW ORLEANS: 2016 GRAD ACT ANNUAL REPORT 20
Position Base Salary Rept'd
Fall 2009
Base Salary Rept'd
Fall 2010
Base Salary Rept'd
Fall 2011
Base Salary Rept'd
Fall 2012
Base Salary Rept'd
Fall 2013
Base Salary Rept'd
Fall 2014
Base Salary Rept'd
Fall 2015
Notes Salary Notes Salary Notes Salary Notes Salary Notes Salary Notes Salary Notes Salary
SCHOOL OF MEDICINE
Dean, School of
Medicine $ 272,500
Ext
Equity
Adj.
12/2012
$ 299,750 $ 299,750 $ 299,750 1/1/15 $ 311,740
Assoc. Dean for
Academic Affairs $ 188,032 10/2013 $ 195,553 $ 195,553 1/1/15 $ 203,375
Assoc. Dean for
Admissions $ 228,469 10/2013 $ 233,038 $ 233,038 1/1/15 $ 242,360
Assoc. Dean for
Alumni Affairs &
Development
$ 141,057 $ 141,057 Prom
7/2014 $ 150,931
Assoc. Dean for
Clinical Affairs $ 224,700
Vacant
07/2011 01/2013 $ 286,000 $ 286,000
Assoc. Dean for
Community &
Minority Health
Education
$ 183,990
Equity
Adj
09/2010
$ 202,389 Prom
11/2013 $ 133,888 $ 133,888 1/1/15 $ 139,244
Assoc. Dean for
Faculty &
Institutional Affairs
$ 232,552 $ 232,552 $ 232,552 1/1/15 $ 241,854
Assoc. Dean for
Fiscal Affairs $ 234,705 10/2013 $ 244,093 $ 244,093 1/1/15 $ 268,502
Assoc. Dean for
Research $ 203,658 10/2013 $ 211,804 $ 211,804 1/1/15 $ 220,276
Assoc. Dean for
Student Affairs &
Records
$ 148,225 10/2013 $ 154,154 $ 154,154 1/1/15 $ 160,320

LOUISIANA STATE UNIVERSITY HEALTH SCIENCES CENTER—NEW ORLEANS: 2016 GRAD ACT ANNUAL REPORT 21
Position Base Salary Rept'd
Fall 2009
Base Salary Rept'd
Fall 2010
Base Salary Rept'd
Fall 2011
Base Salary Rept'd
Fall 2012
Base Salary Rept'd
Fall 2013
Base Salary Rept'd
Fall 2014
Base Salary Rept'd
Fall 2015
Notes Salary Notes Salary Notes Salary Notes Salary Notes Salary Notes Salary Notes Salary
SCHOOL OF MEDICINE (cont’d)
Assoc. Dean for
Baton Rouge Affairs $ 87,831 09/2010 $ 120,000 $ 120,000 $ 120,000 1/1/15 $ 124,800
Assoc. Dean for
Lafayette Affairs $ 165,959 $ 165,959 $ 165,959 1/1/15 $ 172,597
SCHOOL OF NURSING
Dean, School of
Nursing $ 179,760 01/2014 $ 228,764 $ 228,764 1/1/15 $ 237,915
Assoc. Dean for
Nursing Research,
Scholarship, and
Science
$ 114,688 Dean
(interim)
Assoc. Dean for Prof
Practice, Comm
Service, & Adv
Nursing Pract
07/2008 $ 116,931
07/2011
Fac.
Prom.
$ 130,963 10/2013 $ 136,202 $ 136,202 1/1/15 $ 141,650
Assoc. Dean for
Undergraduate
Nursing Programs
$ 113,077
07/2012
Fac.
Prom.
$ 126,646 10/2013 $ 131,712 $ 131,712 4/1/15 $ 146,290
Assistant Dean for
Business Affairs $ 94,159 06/2013 $ 97,925
Incr
06/2014 $ 107,718 1/1/15 $ 112,027
Assistant Dean for
Clinical Nursing
Education
$ 81,420 10/2013 $ 84,677 $ 84,677 1/1/15 $ 88,064
Assistant Dean for
Student Services $ 98,500 10/2013 $ 102,440 $ 102,440 1/1/15 $ 106,538
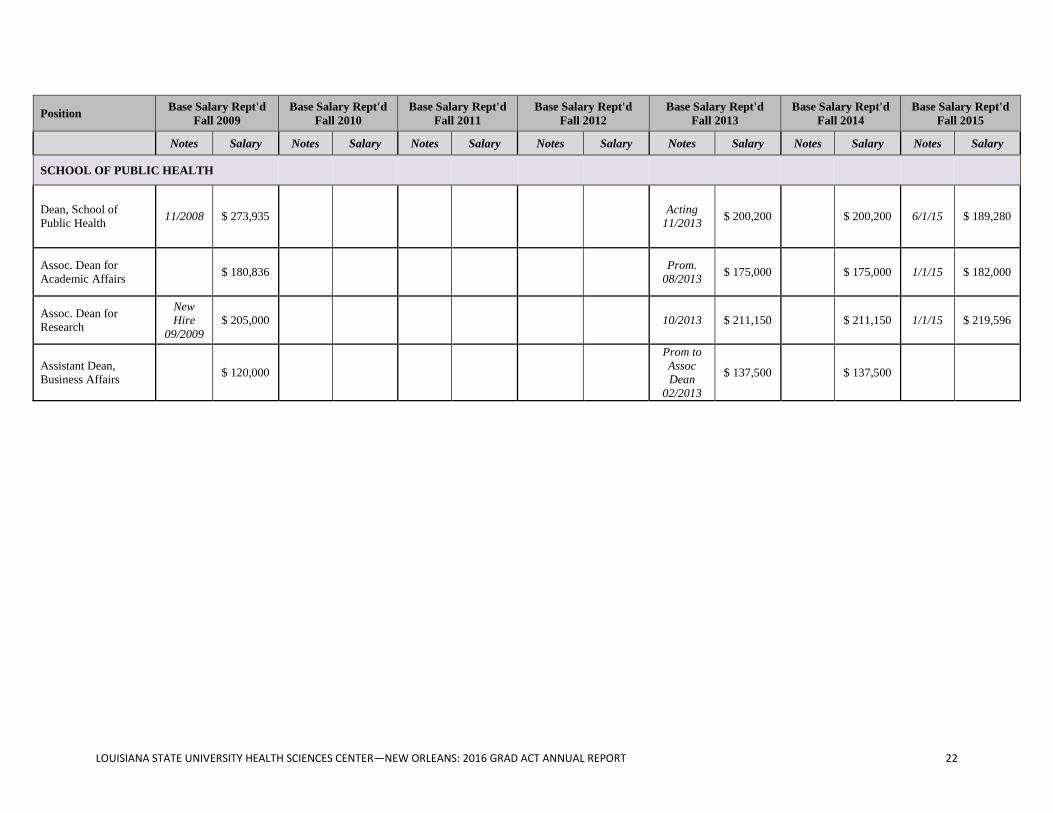
LOUISIANA STATE UNIVERSITY HEALTH SCIENCES CENTER—NEW ORLEANS: 2016 GRAD ACT ANNUAL REPORT 22
Position Base Salary Rept'd
Fall 2009
Base Salary Rept'd
Fall 2010
Base Salary Rept'd
Fall 2011
Base Salary Rept'd
Fall 2012
Base Salary Rept'd
Fall 2013
Base Salary Rept'd
Fall 2014
Base Salary Rept'd
Fall 2015
Notes Salary Notes Salary Notes Salary Notes Salary Notes Salary Notes Salary Notes Salary
SCHOOL OF PUBLIC HEALTH
Dean, School of
Public Health 11/2008 $ 273,935
Acting
11/2013 $ 200,200 $ 200,200 6/1/15 $ 189,280
Assoc. Dean for
Academic Affairs $ 180,836
Prom.
08/2013 $ 175,000 $ 175,000 1/1/15 $ 182,000
Assoc. Dean for
Research
New
Hire
09/2009
$ 205,000 10/2013 $ 211,150 $ 211,150 1/1/15 $ 219,596
Assistant Dean,
Business Affairs $ 120,000
Prom to
Assoc
Dean
02/2013
$ 137,500 $ 137,500

LOUISIANA STATE UNIVERSITY HEALTH SCIENCES CENTER—NEW ORLEANS: 2016 GRAD ACT ANNUAL REPORT 23
i. Cost Performance Analysis i. Total operating budget by function, amount, and percent of total, reported in a manner consistent with the National Association of College and University Business Officers guidelines.
Expenditures by Function: Amount % of Total
Instruction $ 56,075,742 40.7%
Research $ 16,508,831 12.0%
Public Service $ 6,535,890 4.7%
Academic Support** $ 13,813,875 10.0%
Student Services $ 2,982,756 2.2%
Institutional Services $ 16,946,869 12.3%
Scholarships/Fellowships $ 3,472,012 2.5%
Plant Operations/Maintenance $ 21,245,960 15.4%
Total E&G Expenditures $ 137,581,935 99.9%
Hospital $ - 0.0%
Transfers out of agency $ 113,618 0.1%
Athletics $ - 0.0%
Other $ - 0.0%
Total Expenditures $ 137,695,553 100.0%
Operating budget expenditures declined as a result of the public-private partnerships. Revenues and expenses related to Our Lady of the Lake in Baton Rouge, University Medical Center in Lafayette and Interim LSU Public Hospital in New Orleans are reflected in restricted accounts. ii. Average yearly cost of attendance for the reporting year as reported to the United States Department of Education. N/A iii. Average time to degree for completion of academic programs at 4-year universities, 2-year colleges, and technical colleges. N/A iv. Average cost per degree awarded in the most recent academic year. N/A v. Average cost per non-completer in the most recent academic year. Utilizing FY Formula Appropriation Per FTE for 4-year universities, 2-year colleges, and technical colleges. N/A vi. All expenditures of the institution for that year most recent academic year. $504,288,153*
* As reported in the 2014-2015 BoR-3 Report.