lshtm research onlineresearchonline.lshtm.ac.uk/4645574/1/variations in...background visceral...
TRANSCRIPT

LSHTM Research Online
Jervis, Sarah; Chapman, Lloyd AC; Dwivedi, Shweta; Karthick, Morchan; Das, Aritra; Le Rutte,Epke A; Courtenay, Orin; Medley, Graham F; Banerjee, Indranath; Mahapatra, Tanmay; +3 more...Chaudhuri, Indrajit; Srikantiah, Sridhar; Hollingsworth, T Déirdre; (2017) Variations in visceral leish-maniasis burden, mortality and the pathway to care within Bihar, India. Parasites & vectors, 10 (1).601-. ISSN 1756-3305 DOI: https://doi.org/10.1186/s13071-017-2530-9
Downloaded from: http://researchonline.lshtm.ac.uk/id/eprint/4645574/
DOI: https://doi.org/10.1186/s13071-017-2530-9
Usage Guidelines:
Please refer to usage guidelines at https://researchonline.lshtm.ac.uk/policies.html or alternativelycontact [email protected].
Available under license: http://creativecommons.org/licenses/by/2.5/
https://researchonline.lshtm.ac.uk

RESEARCH Open Access
Variations in visceral leishmaniasis burden,mortality and the pathway to care withinBihar, IndiaSarah Jervis1*†, Lloyd A. C. Chapman1*†, Shweta Dwivedi2, Morchan Karthick2, Aritra Das2, Epke A. Le Rutte3,Orin Courtenay1, Graham F. Medley4, Indranath Banerjee2, Tanmay Mahapatra2, Indrajit Chaudhuri2,Sridhar Srikantiah2 and T. Déirdre Hollingsworth1
Abstract
Background: Visceral leishmaniasis (VL) has been targeted by the WHO for elimination as a public health problem(< 1 case/10,000 people/year) in the Indian sub-continent (ISC) by 2020. Bihar State in India, which accounts for themajority of cases in the ISC, remains a major target for this elimination effort. However, there is considerable spatial,temporal and sub-population variation in occurrence of the disease and the pathway to care, which is largelyunexplored and a threat to achieving the target.
Methods: Data from 6081 suspected VL patients who reported being clinically diagnosed during 2012–2013 acrosseight districts in Bihar were analysed. Graphical comparisons and Chi-square tests were used to determinedifferences in the burden of identified cases by season, district, age and sex. Log-linear regression models werefitted to onset (of symptoms)-to-diagnosis and onset-to-treatment waiting times to estimate their associations withage, sex, district and various socio-economic factors (SEFs). Logistic regression models were used to identify factorsassociated with mortality.
Results: Comparisons of VL caseloads suggested an annual cycle peaking in January-March. A 17-fold variation inthe burden of identified cases across districts and under-representation of young children (0–5 years) relative toage-specific populations in Bihar were observed. Women accounted for a significantly lower proportion of thereported cases than men (41 vs 59%, P < 0.0001). Age, district of residence, house wall materials, caste, treatmentcost, travelling for diagnosis and the number of treatments for symptoms before diagnosis were identified ascorrelates of waiting times. Mortality was associated with age, district of residence, onset-to-treatment waitingtime, treatment duration, cattle ownership and cost of diagnosis.
Conclusions: The distribution of VL in Bihar is highly heterogeneous, and reported caseloads and associatedmortality vary significantly across different districts, posing different challenges to the elimination campaign.Socio-economic factors are important correlates of these differences, suggesting that elimination will requiretailoring to population and sub-population circumstances.
Keywords: Visceral leishmaniasis, Case burden, Bihar, India, Pathway to care, Onset-to-diagnosis time,Onset-to-treatment time, Mortality, Statistical analysis
* Correspondence: [email protected]; [email protected]†Equal contributors1School of Life Sciences, University of Warwick, Gibbet Hill Campus, CoventryCV4 7AL, UKFull list of author information is available at the end of the article
© The Author(s). 2017 Open Access This article is distributed under the terms of the Creative Commons Attribution 4.0International License (http://creativecommons.org/licenses/by/4.0/), which permits unrestricted use, distribution, andreproduction in any medium, provided you give appropriate credit to the original author(s) and the source, provide a link tothe Creative Commons license, and indicate if changes were made. The Creative Commons Public Domain Dedication waiver(http://creativecommons.org/publicdomain/zero/1.0/) applies to the data made available in this article, unless otherwise stated.
Jervis et al. Parasites & Vectors (2017) 10:601 DOI 10.1186/s13071-017-2530-9

BackgroundVisceral leishmaniasis (VL) on the Indian sub-continent(ISC) is a disease caused by the protozoan parasiteLeishmania donovani and transmitted from human tohuman by female Phlebotomus argentipes sand flies.The symptomatic form of the disease, also known askala-azar (KA), is characterised by fever, weight-lossand an enlarged liver and spleen, and has a case fatalityrate of over 95% if untreated [1]. In recent years, moreeffective treatments have reduced the case fatality rateto 10% on average [2], with studies suggesting thatproximity to a previous VL patient, bed net usage andlevels of insecticide spraying are important drivers ofVL risk [3–5]. However, the role of delays from onset-of-symptoms to treatment has not been well quantified.The two main strategies for control are improved casedetection and management (reductions in onset-to-treatment time), and indoor residual spraying withinsecticide.The ISC has historically suffered the majority of the
global burden of VL, with India, Bangladesh and Nepalaccounting for 80% of the estimated 200,000–400,000annual global cases between 2004 and 2008 [2]. How-ever, since 2011 there has been a significant decline inthe number of cases in the ISC [6–8]. Consequently,reduction in the incidence of symptomatic VL, to under1 case/10,000 people/year at sub-district level in the ISCby 2020, is one of the WHO elimination goals. Thegovernments of Bangladesh, India and Nepal have set amore ambitious goal of reaching the elimination targetby the end of 2017 [9]. The state of Bihar in northernIndia is by far the most affected area within the ISC,accounting for 80% of VL cases in India [7] and is stillfar from elimination with recent estimates of 1–5 casesper 10,000 per year at sub-district (block) level [10, 11].Over the last 50 years, reported national and regional
VL incidence has oscillated in an approximately 15-yearcycle [12, 13], with marked declines in recent years [14].However, there is some evidence of spatial variation inincidence rates [11, 15], the causes of which are poorlyunderstood. Previous studies have found evidence of sea-sonal variation [3, 12, 16–22], measured by incidence ofdiagnosis or numbers of sand flies, but the resulting in-ferences made on VL incidence are complicated by longincubation periods, an uncertain proportion of asymp-tomatically infected humans and long durations untildiagnosis [23]. There have also been few systematicstudies of seasonality across multiple areas with differentincidence rates. Variations in incidence by both age andsex have also been inferred from many previous studies[3, 5, 12, 21, 22, 24–28], but the majority of these are ei-ther single-location studies or based on small numbersof cases. Differences in incidence by location, age andsex have often been hypothesised to be due to
differences in access to care, both in terms of individualeffects and the indirect effect of long onset-to-diagnosistimes on transmission. However, there are few studies oflarge patient groups investigating drivers of onset-to-diagnosis or treatment patterns [29].As the VL control programme in Bihar builds towards
achieving elimination as a public health problem, and, inthe longer term, maintaining this goal and aiming forelimination of transmission, there is a shortage of quan-titative information on variation in case burden anddrivers of delays in diagnosis. By quantifying these fac-tors across multiple settings, we aim to characterise keysources of variability and inform the design of control pro-grammes to identify and treat the final cases. Using re-cords from 6081 suspected VL patients in eight districts inBihar, we highlight significant variations in the burden ofidentified cases (the number of cases identified per headof population per year) and mortality. Although incidenceof VL has been the main focus of most previous studies,we additionally study the pathway to care for infected in-dividuals. A large number of symptomatic cases in ourdataset, together with the multiple locations and detailedinformation on socio-economic factors (SEFs) such ashousing and cattle ownership, allow us to perform a thor-ough analysis identifying key differences in VL patients’pathway to care and odds of survival.
MethodsStudy population and VL case tracingCARE India, a non-governmental organization, under-took a rapid situational assessment of VL in 2013 to in-form the operation of the kala-azar eliminationprogramme in Bihar. The assessment was conducted aspart of the intervention programme funded by the Billand Melinda Gates Foundation (BMGF) in eight (out ofa total of 38) districts of Bihar, including both high andlow endemicity districts. Only eight districts were se-lected due to resource constraints and the need for rapidassessment, and due to CARE India having existing in-frastructures for conducting field research in these dis-tricts. Due to operational feasibility, the case trackingwas limited to symptomatic VL patients only. The refer-ence period for the assessment (the period during whichVL diagnosis took place) was January 2012 to June 2013.The following combination of methods was followed tomeet this objective (data collection and processing arealso described elsewhere [30]):
Index case tracing and snowballingLine lists of VL patients, whose date of diagnosis waswithin the reference period, reported by the state-runhealth facilities (block and district hospitals) were com-piled. In addition, healthcare facilities belonging to thestudy area, which specialized in kala-azar care, were
Jervis et al. Parasites & Vectors (2017) 10:601 Page 2 of 17

contacted to obtain information on potential VL cases.Cases obtained from these two sources were checked toidentify and remove duplicates. Attempts were made totrace every patient whose name appeared on thecompiled list.An interview was conducted by a trained study investi-
gator with the successfully traced patient or his/her fam-ily members. A medical record review, for patients whopossessed any documents about diagnosis and treatmentfor VL, was conducted along with the interview. Add-itionally, patient/family members were requested to pro-vide information on any other potential cases of VL inthe family or neighbourhood. The contact informationof such suspected patients was collected. If a patientcould not be traced to the particular address, the caseinformation was shared with other districts in the study,and if the patient could still not be traced, the case wasconsidered untraceable.Additionally, to increase the sensitivity of the case
finding effort, some key informants (such as communityhealth workers and school teachers) from the villagesmentioned in the address of potential cases were inter-viewed to determine if they were aware of any other VLpatients or cases of prolonged fever during the referenceperiod, either amongst residents of the same village orelsewhere. The contact information of any such sus-pected cases was also collected.
Mapping and interviewing private healthcare providersA mapping exercise was undertaken to identify all pri-vate laboratories and pharmacists in all villages/towns ofeach of the study districts. These private healthcare pro-viders were then interviewed to ascertain if they had di-agnosed or dispensed medications to any VL patientduring the reference period. Moreover, all qualified doc-tors, and all unqualified practitioners with a large clien-tele, who were captured through the provider mappingexercise, were contacted to obtain information on anyVL patients they had seen or treated (either confirmedor with VL-like symptoms).The list of potential additional cases generated in this
manner was compiled and screened for duplications andrepetitions of known cases from government reportedlists, and individuals that remained on the non-duplicatelist were considered ‘suspected’ VL cases. An attemptwas made to trace each suspected case to his or her resi-dence and interview him or her or his/her family, whereany documentary proof of diagnosis or treatment wascollected. These suspected cases were also asked aboutany other cases of VL or prolonged fever that they mayhave known. This iterative process continued until allsuspected cases had been interviewed.All available details of such suspected cases were re-
corded. No attempt was made to clinically examine
suspected cases or confirm their diagnosis throughlaboratory tests.The breakdown of the sources via which patients were
identified is shown in Table 1. Fourteen percent of casesreported by the national control programme (i.e. thosereported by the state-run health facilities) were untrace-able. However, approximately 15% of cases identified bythe case tracing process were not recorded by the na-tional programme, suggesting that the official figuresprovide an underestimate of the true VL burden, thoughmuch less of an underestimate than suggested by previ-ous studies [31, 32].
VL case definitionA patient was considered to be a case of VL if he/shemet any of the following criteria:(i) If the patient’s name and address were included in
the line list of VL patients who were diagnosed by anygovernment facility within the reference period and he/shecould be traced to the listed address, regardless of posses-sion of any documents related to diagnosis or treatment.(ii) If a potential case possessed any documents, from
a private or public facility, confirming his/her VL diag-nosis (serological test, splenic/bone marrow biopsy)within the study reference period.(iii) If a potential case possessed documents demonstrat-
ing VL treatment, such as prescriptions/pharmacy slips/drug packaging that indicated treatment with miltefosine,sodium stibogluconate (SSG) or amphotericin B, and thestart of treatment occurred within the reference period.
Participant interviewA face-to-face interview was conducted with every eli-gible VL patient identified using the case detection
Table 1 Sources via which VL cases were identified
Primary source via which case was identified Number Percentage
Official list from block PHC/SDH/FRU 3835 63.07
Official list from other block PHC/SDH/FRU 231 3.80
Official list from district hospital 1021 16.79
Official list from government medical college 5 0.08
Official list or patient of RMRI 7 0.12
Laboratory 31 0.51
Private hospital/doctor 126 2.07
Chemist/Pharmacist 23 0.38
Another patient 361 5.94
Key informantsa 388 6.38
Self-informed by patient 53 0.87
Total 6081 100
Abbreviations: PHC Primary Health Centre, SDH Sub-Divisional Hospital,FRU First Referral Unit, RMRI Rajendra Memorial Research Institute, Patna, BiharaKey informants: Accredited Social Health Activists (ASHAs), villagers, friends,relatives, school teachers
Jervis et al. Parasites & Vectors (2017) 10:601 Page 3 of 17
methodology. If a patient died in the interim, the inter-view was conducted with the next-of-kin. Data were col-lected on, among other things, socio-demographiccharacteristics (age, sex, district), date of onset of symp-toms, place and date of diagnosis, pre- and post-diagnosis treatment history, and type and duration ofdrug treatment. Whenever available, information ontreatment and diagnosis history was recorded from med-ical documents. Data were entered using the Census andSurvey Processing System CSPro 5.0 and assessed for lo-gical inconsistencies and to detect and remove duplicateentries.
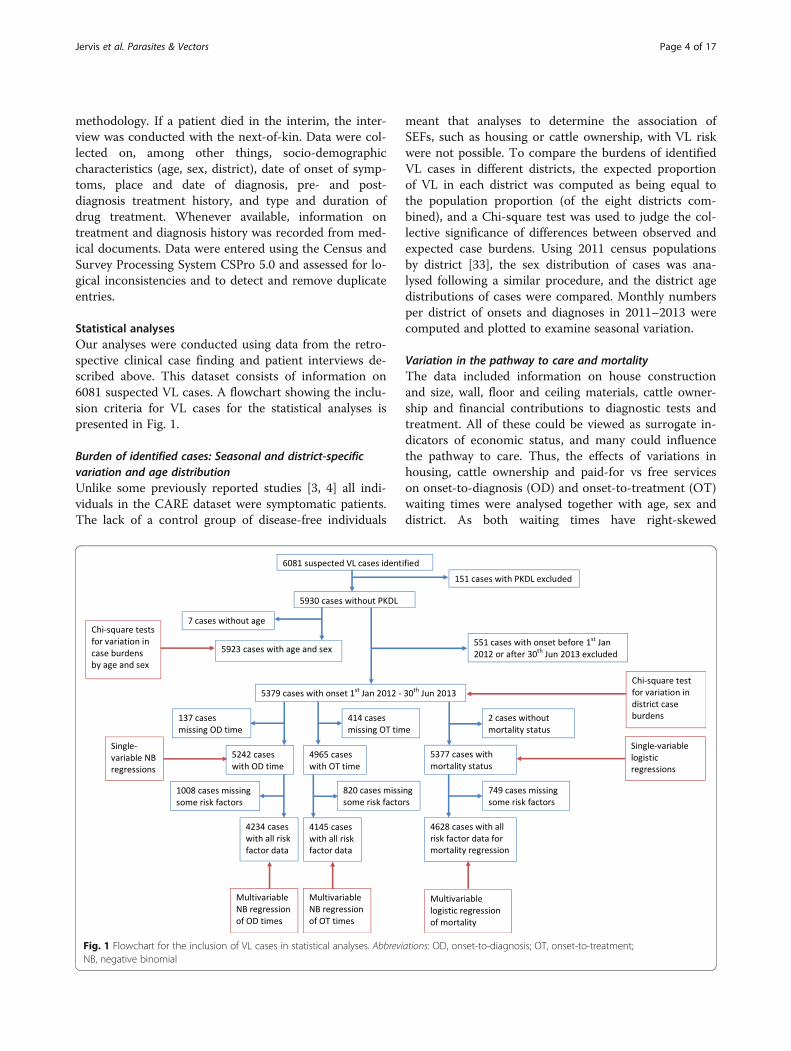
Statistical analysesOur analyses were conducted using data from the retro-spective clinical case finding and patient interviews de-scribed above. This dataset consists of information on6081 suspected VL cases. A flowchart showing the inclu-sion criteria for VL cases for the statistical analyses ispresented in Fig. 1.
Burden of identified cases: Seasonal and district-specificvariation and age distributionUnlike some previously reported studies [3, 4] all indi-viduals in the CARE dataset were symptomatic patients.The lack of a control group of disease-free individuals
meant that analyses to determine the association ofSEFs, such as housing or cattle ownership, with VL riskwere not possible. To compare the burdens of identifiedVL cases in different districts, the expected proportionof VL in each district was computed as being equal tothe population proportion (of the eight districts com-bined), and a Chi-square test was used to judge the col-lective significance of differences between observed andexpected case burdens. Using 2011 census populationsby district [33], the sex distribution of cases was ana-lysed following a similar procedure, and the district agedistributions of cases were compared. Monthly numbersper district of onsets and diagnoses in 2011–2013 werecomputed and plotted to examine seasonal variation.
Variation in the pathway to care and mortalityThe data included information on house constructionand size, wall, floor and ceiling materials, cattle owner-ship and financial contributions to diagnostic tests andtreatment. All of these could be viewed as surrogate in-dicators of economic status, and many could influencethe pathway to care. Thus, the effects of variations inhousing, cattle ownership and paid-for vs free serviceson onset-to-diagnosis (OD) and onset-to-treatment (OT)waiting times were analysed together with age, sex anddistrict. As both waiting times have right-skewed
Fig. 1 Flowchart for the inclusion of VL cases in statistical analyses. Abbreviations: OD, onset-to-diagnosis; OT, onset-to-treatment;NB, negative binomial
Jervis et al. Parasites & Vectors (2017) 10:601 Page 4 of 17

distributions with variances much larger than theirmeans (variance/mean = 47.06 days and 38.46 days forthe OD and OT times, respectively), negative binomialregression models with exponential link function wereused to analyse them. Due to the finite sampling period,there was a bias towards elongated waiting times at thestart of the sampling period and shorter waiting times atthe end. Therefore we restricted the analysis to the cen-tral portion of the data time-period (details in Results).First, single-variable models were fitted to eliminate theleast significant relationships, then multivariable modelsfor comparison purposes. Starting with all variablesjudged significant in single-variable models, factors wereaccepted or rejected using the likelihood ratio test(LRT). Using a logistic regression model, with a similarselection procedure, we investigated the effects of thesame set of factors together with OD and OT waitingtimes on patients’ risk of death. Although no informa-tion as to causes of individuals’ deaths was available,death rates appeared to be both much higher and differ-ently distributed over age and sex amongst patients thanin the general Bihar population, such that it seems likelythe excess mortality was VL related. To increase under-standing of factors influencing overall mortality amongstVL patients, we consequently analysed the risk of dyingfrom any cause during the study period. All regressionanalyses were performed using Stata 14 [34].
ResultsA total of 6081 suspected VL cases from 131 blocks ineight districts of Bihar were identified in the VL situationalassessment. One hundred and fifty-one cases were re-corded as having post-kala-azar dermal leishmaniasis(PKDL) and were excluded from all analyses due to uncer-tainty about whether their illness and treatment data re-ferred to VL or PKDL. Among the 5930 cases remaining,59% were male, and 41% female; median age was 20, vary-ing from 16 to 30 between districts (see Additional file 1:Table S1 and Additional file 2: Table S2).
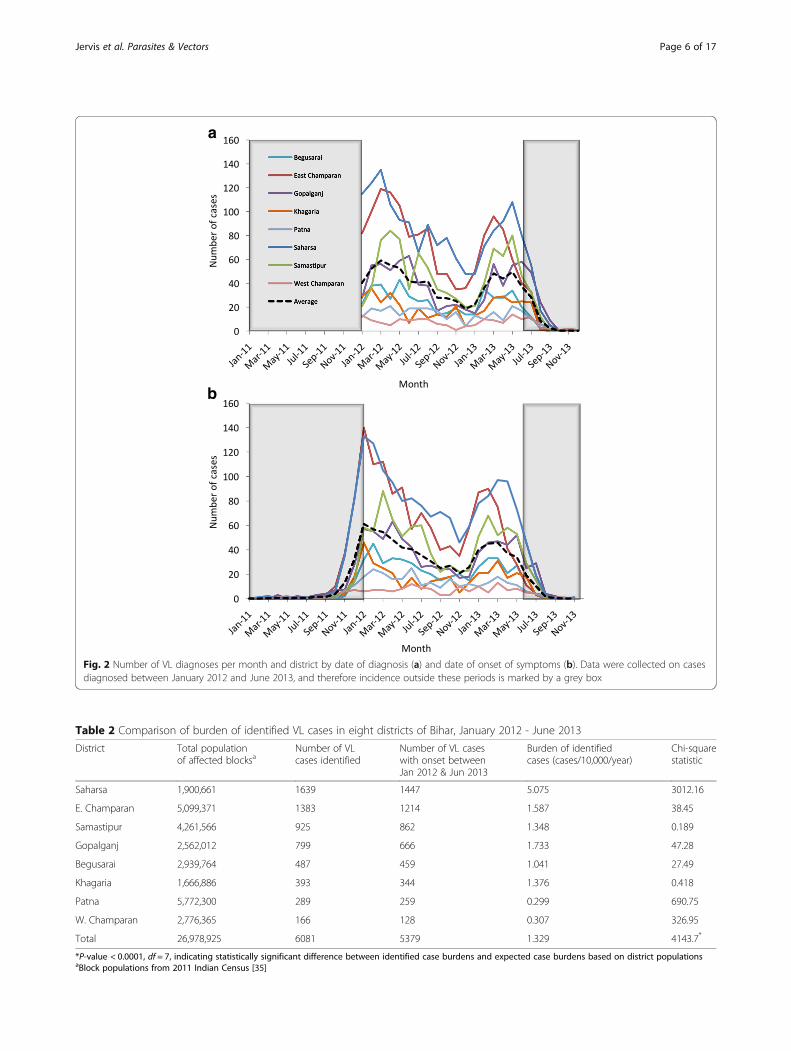
Burden of identified casesMonthly counts of diagnoses in January 2012 - June2013 by district are displayed in Fig. 2a. The monthlynumbers of cases by onset for each district have beenplotted from the patients’ self-reported onset dates inFig. 2b. Since inclusion in the study was based on thedate of diagnosis being between 1st January 2012 and30th June 2013, there was an inherent bias towards lon-ger OD times amongst cases with onset prior to 2012,and towards shorter OD times amongst cases with onsetafter June 2013 (see Additional file 3: Figure S1). Hence,these cases were excluded from the analysis. Patterns ofmonthly case numbers in most districts in 2012–2013suggest an annual cycle peaking early in the year
(Fig. 2b), though differences between the 2 years’ andeight districts’ maximum and minimum values make itdifficult to establish a consistent seasonal pattern.For comparison of identified case burden between
districts, the total population of the blocks in eachdistrict with at least one case in January 2012 - June2013 [35], defined by date of onset, was used to com-pute the case burden in 2012–2013. Displayed inTable 2 in decreasing order of number of cases, thedistrict burdens of identified cases varied 17-fold fromabout 1/2000/year to 3/100,000/year. This variationwas particularly marked in Saharsa with cases per head al-most 3-fold larger than any other district, and Patna andWest Champaran, where cases per head were 3-fold lowerthan any other district. The Chi-square test statisticcomparing observed and expected numbers was very large(χ2 = 4143.7, df = 7, P < 0.0001), indicating that relativeper-district reported numbers of cases are very different tothose expected from the district populations alone. Tolook for relationships between waiting times and rela-tive case counts, yearly district case burdens in January2012 - June 2013 (computed as annual num-ber of cases/10,000 of the population) were plottedagainst median OD and OT times in Fig. 3. Althoughthere was no apparent positive or negative relationship,this does not necessarily mean that reducing waitingtimes does not lead to significant reductions in caseburdens, as there will be a lag before the impact on thecase burden is observed. Furthermore, districts thathave high case burdens may have shorter OD and OTtimes due to greater awareness and surveillance of VL,and vice versa for districts with low case burdens.The maps of Bihar in Fig. 4a and b show the total
numbers of identified VL cases with onset betweenJanuary 2012 and June 2013 at the district level andblock level, respectively. Equivalent maps for the burdenof identified cases at district and block level are providedin Additional file 4: Figure S2. It is clear from thesemaps that there is considerable spatial heterogeneity inthe occurrence of VL. The block-level maps reveal thatthere is large variation in the identified burden withinhigh-burden districts, with cases per head per year ran-ging from 1.69/10,000 to over 9/10,000 in blocks inSaharsa and 0.04–6.17/10,000 in East Champaran, with asmall number of blocks contributing the majority of theoverall burden in these districts. While there appears tobe some spatial correlation in reported caseloads at theblock level (Additional file 4: Figure S2), there are alsoblocks with large numbers of identified cases neighbour-ing blocks with very few cases.
Age and sex distributionsAs illustrated in Fig. 5a, the age distribution of patientsdid not vary significantly between districts, despite large
Jervis et al. Parasites & Vectors (2017) 10:601 Page 5 of 17
a
b
Fig. 2 Number of VL diagnoses per month and district by date of diagnosis (a) and date of onset of symptoms (b). Data were collected on casesdiagnosed between January 2012 and June 2013, and therefore incidence outside these periods is marked by a grey box
Table 2 Comparison of burden of identified VL cases in eight districts of Bihar, January 2012 - June 2013
District Total populationof affected blocksa
Number of VLcases identified
Number of VL caseswith onset betweenJan 2012 & Jun 2013
Burden of identifiedcases (cases/10,000/year)
Chi-squarestatistic
Saharsa 1,900,661 1639 1447 5.075 3012.16
E. Champaran 5,099,371 1383 1214 1.587 38.45
Samastipur 4,261,566 925 862 1.348 0.189
Gopalganj 2,562,012 799 666 1.733 47.28
Begusarai 2,939,764 487 459 1.041 27.49
Khagaria 1,666,886 393 344 1.376 0.418
Patna 5,772,300 289 259 0.299 690.75
W. Champaran 2,776,365 166 128 0.307 326.95
Total 26,978,925 6081 5379 1.329 4143.7*
*P-value < 0.0001, df = 7, indicating statistically significant difference between identified case burdens and expected case burdens based on district populationsaBlock populations from 2011 Indian Census [35]
Jervis et al. Parasites & Vectors (2017) 10:601 Page 6 of 17

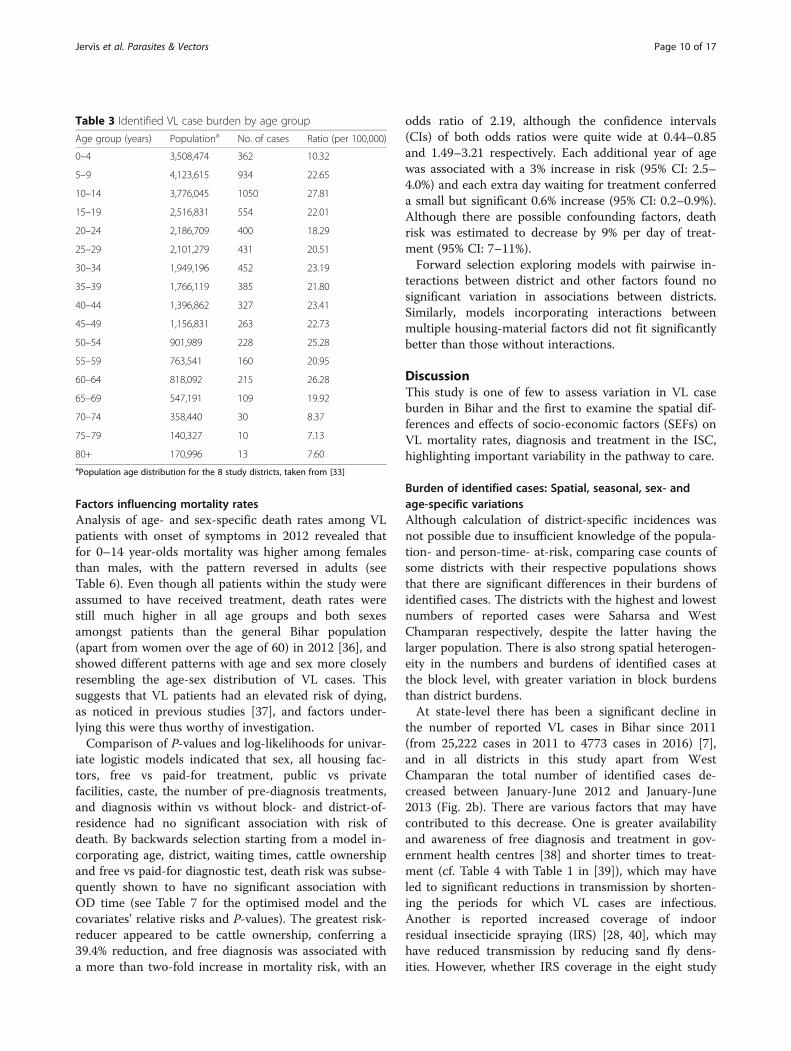
variability in case counts. For most districts, the propor-tion of overall cases increases from age 0 to a maximumin 10–14 year-olds, then decreases quickly up to aroundage 20, and after that decreases more slowly with age.Most districts showed a notable lack of juvenile cases,compared with the corresponding population age distri-bution. While the cumulative age-distribution of theeight districts shows a general decrease with age, thecases-per-head was only 10.32/100,000 among 0–5 year-olds increasing to 27.81/100,000 in the 10–14 age group,before dipping and then increasing to 26.28/100,000 inthe 60–64 age group (see Table 3). A Chi-square test com-paring male and female patient numbers of 3501:2422with population proportions of 14,737,088:13,445,449 gavea χ2 statistic of 109 (df = 1, P < 0.0001), suggesting thatmen have significantly higher chances of being diagnosedwith symptomatic VL than women. Comparing the bur-den of identified cases by age group for males and females(see Fig. 5b) showed that the under-representation of VLin children was common to both sexes and that the lower
rates in females were due to the numbers of reportedcases in adult women being reduced relative to men, par-ticularly in older age groups, rates in the 0–14 age rangebeing nearly identical.
Variation in the pathway to careThe district-specific distributions of OD lag, OT lag andtreatment durations are illustrated in Fig. 6, and theirsummary statistics are given in Table 4. Very little differ-ence in treatment duration was observed, with patientsin all districts undergoing a median of 4 weeks treat-ment. OD and OT time varied more, from 16.5 and17 days in Begusarai (IQR 7–32 and 8–31) to 55 and 45days (IQR 30.5–80 and 25–90) in West Champaran. Per-haps counterintuitively, patients appeared to wait slightlylonger on average for diagnosis than for treatment (me-dian 31 vs 30 days); however, this can be attributed tothe delay between clinical examination and diagnostictesting for VL and official confirmation of the VL diag-nosis. Treatment for VL, as a high-mortality-rate disease,
a
b
Fig. 3 Annual burden of identified cases by district plotted against median onset-to-diagnosis (OD) time (a) and median onset-to-treatment (OT)time (b)
Jervis et al. Parasites & Vectors (2017) 10:601 Page 7 of 17

is likely to have begun shortly after the patient presentedwith symptoms, but the official diagnosis may not havebeen recorded until 1 or 2 days later. Additionally, thereliance on self-reported onset dates and illness dura-tions is likely to have introduced some uncertainty intothe reported waiting times.Several factors were associated with variation in OD
and OT waiting times. The magnitudes of the effectsof age, sex, district, housing and diagnosis/treatmentfacility are displayed in Additional file 5: Table S3 asregression model rate ratios. Waiting times wereestimated to increase by 0.4% and 0.5%, respectively,for every year increase in age. OD time was estimatedto be up to 3.2 times longer and OT time 2.9 timeslonger in other districts relative to Begusarai, the
district with the shortest average waiting times. Livingin a mud-walled house was found to be associatedwith an 11–12% reduction and stone-walled housewith a 6% increase in both waiting times relative tohouses with other wall types. Cattle ownership wasassociated with a 6% increase in OD time while hav-ing a house with more than two rooms was estimatedto confer a 19–23% increase in waiting times. Payingfor diagnosis and being diagnosed at a private centrehad near identical effects, with both waiting timesappearing to be shorter for individuals choosing touse free services. Being lower-caste was also associ-ated with a 10–11% reduction in waiting times.Patients’ travelling outside their block of residencewas estimated to confer a 15–18% increase in their
a
b
Fig. 4 Maps of Bihar showing total numbers of identified VL cases in the eight study districts between January 2012 and June 2013 at districtlevel (a) and block level (b)
Jervis et al. Parasites & Vectors (2017) 10:601 Page 8 of 17

waiting times, while the effect of travelling outsidetheir home district appeared to be smaller but stillsignificant at 12–13%. Relative OD and OT waitingtimes appeared reduced for 1 or 2 pre-diagnosis treat-ments (PDTs) and significantly increased for 4 PDTs,with rate ratios rising from 0.53–0.66 for one PDT to1.21–1.51 for four PDTs. Neither waiting time showedany significant association with gender, house type,roofing or flooring materials, or public vs privatetreatment.In the multivariable regressions, house size, cattle
ownership, diagnosis cost and public vs private diagnosiswere eliminated from both waiting-time models. Treat-ment cost and same-block diagnosis were not signifi-cantly associated with OD, and caste was notsignificantly associated with OT in the multivariable
models (see Table 5 for the optimised models and theircovariates’ relative risks and P-values). In combinationwith other factors, the effect of paying for treatment ap-peared to be reversed, moving from an increase of 6–9%to a reduction of 8% (95% CI 3–13%). Waiting timeswere still estimated to increase with the number of pre-diagnosis treatments; considerably for OD, with rate ra-tios from 1.64 (95% CI: 1.22–2.21) for 1 PDT to 3.70(95% CI: 2.73–5.00) for 4, less markedly for OT, from1.04 (95% CI: 0.82–1.31) for 2 PDTs to 1.71 (95% CI:1.35–2.17) for 4. The measures of association for age,district, wall material, caste and travelling for diagnosisremained similar to those observed in the univariatemodel analyses. When interactions between variableswere added to the model, no significant improvement ingoodness-of-fit was observed.
a
b
Fig. 5 Age distribution of cases. The proportion of cases in 5-year age groups by district (a) and proportions of male and female cases in 5-yearage groups across all eight districts (b)
Jervis et al. Parasites & Vectors (2017) 10:601 Page 9 of 17
Factors influencing mortality ratesAnalysis of age- and sex-specific death rates among VLpatients with onset of symptoms in 2012 revealed thatfor 0–14 year-olds mortality was higher among femalesthan males, with the pattern reversed in adults (seeTable 6). Even though all patients within the study wereassumed to have received treatment, death rates werestill much higher in all age groups and both sexesamongst patients than the general Bihar population(apart from women over the age of 60) in 2012 [36], andshowed different patterns with age and sex more closelyresembling the age-sex distribution of VL cases. Thissuggests that VL patients had an elevated risk of dying,as noticed in previous studies [37], and factors under-lying this were thus worthy of investigation.Comparison of P-values and log-likelihoods for univar-
iate logistic models indicated that sex, all housing fac-tors, free vs paid-for treatment, public vs privatefacilities, caste, the number of pre-diagnosis treatments,and diagnosis within vs without block- and district-of-residence had no significant association with risk ofdeath. By backwards selection starting from a model in-corporating age, district, waiting times, cattle ownershipand free vs paid-for diagnostic test, death risk was subse-quently shown to have no significant association withOD time (see Table 7 for the optimised model and thecovariates’ relative risks and P-values). The greatest risk-reducer appeared to be cattle ownership, conferring a39.4% reduction, and free diagnosis was associated witha more than two-fold increase in mortality risk, with an
odds ratio of 2.19, although the confidence intervals(CIs) of both odds ratios were quite wide at 0.44–0.85and 1.49–3.21 respectively. Each additional year of agewas associated with a 3% increase in risk (95% CI: 2.5–4.0%) and each extra day waiting for treatment conferreda small but significant 0.6% increase (95% CI: 0.2–0.9%).Although there are possible confounding factors, deathrisk was estimated to decrease by 9% per day of treat-ment (95% CI: 7–11%).Forward selection exploring models with pairwise in-
teractions between district and other factors found nosignificant variation in associations between districts.Similarly, models incorporating interactions betweenmultiple housing-material factors did not fit significantlybetter than those without interactions.
DiscussionThis study is one of few to assess variation in VL caseburden in Bihar and the first to examine the spatial dif-ferences and effects of socio-economic factors (SEFs) onVL mortality rates, diagnosis and treatment in the ISC,highlighting important variability in the pathway to care.
Burden of identified cases: Spatial, seasonal, sex- andage-specific variationsAlthough calculation of district-specific incidences wasnot possible due to insufficient knowledge of the popula-tion- and person-time- at-risk, comparing case counts ofsome districts with their respective populations showsthat there are significant differences in their burdens ofidentified cases. The districts with the highest and lowestnumbers of reported cases were Saharsa and WestChamparan respectively, despite the latter having thelarger population. There is also strong spatial heterogen-eity in the numbers and burdens of identified cases atthe block level, with greater variation in block burdensthan district burdens.At state-level there has been a significant decline in
the number of reported VL cases in Bihar since 2011(from 25,222 cases in 2011 to 4773 cases in 2016) [7],and in all districts in this study apart from WestChamparan the total number of identified cases de-creased between January-June 2012 and January-June2013 (Fig. 2b). There are various factors that may havecontributed to this decrease. One is greater availabilityand awareness of free diagnosis and treatment in gov-ernment health centres [38] and shorter times to treat-ment (cf. Table 4 with Table 1 in [39]), which may haveled to significant reductions in transmission by shorten-ing the periods for which VL cases are infectious.Another is reported increased coverage of indoorresidual insecticide spraying (IRS) [28, 40], which mayhave reduced transmission by reducing sand fly dens-ities. However, whether IRS coverage in the eight study
Table 3 Identified VL case burden by age group
Age group (years) Populationa No. of cases Ratio (per 100,000)
0–4 3,508,474 362 10.32
5–9 4,123,615 934 22.65
10–14 3,776,045 1050 27.81
15–19 2,516,831 554 22.01
20–24 2,186,709 400 18.29
25–29 2,101,279 431 20.51
30–34 1,949,196 452 23.19
35–39 1,766,119 385 21.80
40–44 1,396,862 327 23.41
45–49 1,156,831 263 22.73
50–54 901,989 228 25.28
55–59 763,541 160 20.95
60–64 818,092 215 26.28
65–69 547,191 109 19.92
70–74 358,440 30 8.37
75–79 140,327 10 7.13
80+ 170,996 13 7.60aPopulation age distribution for the 8 study districts, taken from [33]
Jervis et al. Parasites & Vectors (2017) 10:601 Page 10 of 17

a
b
Fig. 6 Distributions of onset-to-diagnosis (OD) (a) and onset-to-treatment (OT) (b) waiting times by district
Table 4 District-specific summary statistics for onset-to-diagnosis times, onset-to-treatment times and mortality used in regressionanalyses
Onset-to-diagnosis time (days) (n = 4234) Onset-to-treatment time (days) (n = 4145) Mortality (n = 4628)
Mean Median IQR Mean Median IQR Number Died % died % deaths
Saharsa 36.58 31 19–44 34.17 30 20–40 1181 43 3.64 26.06
E. Champaran 51.00 42 28–63 51.22 42 29–61 1136 45 3.96 27.27
Samastipur 37.67 30 19–46 36.52 30 20–45 743 21 2.83 12.73
Gopalganj 47.52 35 18–61 46.70 34 17–60 620 26 4.19 15.76
Begusarai 22.50 16.5 7–32 21.99 17 7–31 356 14 3.93 8.48
Khagaria 37.18 30 20–43 34.43 30 20–38 294 6 2.04 3.64
Patna 48.95 38 27–62 44.54 35 23–59 223 9 4.04 5.45
W. Champaran 59.22 55 30.5–80 59.33 45 25–90 75 1 1.33 0.61
All districts 41.95 31 20–56 40.85 30 20–53 4628 165 3.57 100
Jervis et al. Parasites & Vectors (2017) 10:601 Page 11 of 17

districts increased before 2012 is uncertain, and there isevidence of sub-standard IRS implementation and wide-spread sand fly resistance to DDT (dichlorodiphenyltri-chloroethane, the insecticide used at the time) in Bihar[41–43]. Given the long-term cycles in reported casenumbers [12, 13], it is also possible that much of the de-crease is due to long-lasting immunity having built up in
populations affected during the previous epidemic in thelate 2000s, such that the pool of susceptible individualswho can become infected and develop VL has beendepleted [44].The annual cycle observed in 2012–2013 monthly
onsets and, to a lesser extent, in monthly diagnosis num-bers, is almost certainly attributable to seasonal variation
Table 5 Rate ratios (and 95% confidence intervals) for VL patients’ onset-to-diagnosis (OD) and onset-to-treatment (OT) times fordifferent factors, from multivariable negative-binomial regression models; Bihar, 2012–2013
Variable Onset-to-diagnosis time (n = 4234) Onset-to-treatment time (n = 4145)
No. of patients Rate ratio (95% CI) P-value No. of patients Rate ratio (95% CI) P-value
Age Each 1-year increase 4234 1.003 (1.002–1.004) < 10−4 4145 1.003 (1.002–1.004) < 10−4
Districta Saharsa 956 1.99 (1.82–2.18) < 10−4 927 1.94 (1.77–2.12) < 10−4
E. Champaran 1108 2.26 (2.07–2.47) < 10−4 1102 2.33 (2.14–2.54) < 10−4
Samastipur 710 2.17 (1.97–2.39) < 10−4 682 2.16 (1.97–2.38) < 10−4
Gopalganj 572 2.22 (2.01–2.45) < 10−4 567 2.28 (2.07–2.51) < 10−4
Begusarai 326 – – 318 – –
Khagaria 291 1.61 (1.44–1.80) < 10−4 277 1.56 (1.40–1.74) < 10–4
Patna 195 1.85 (1.63–2.10) < 10−4 194 1.76 (1.55–1.99) < 10–4
W. Champaran 76 2.75 (2.30–3.27) < 10−4 78 2.74 (2.29–3.28) < 10–4
Wallb Grass + straw 2034 1.05 (0.97–1.12) 0.220 1994 1.07 (0.99–1.14) 0.077
Mud 478 – – 469 – –
Mud, stone 812 1.10 (1.02–1.20) 0.014 787 1.14 (1.06–1.23) 0.001
Concrete 910 1.004 (0.93–1.09) 0.916 895 1.01 (0.94–1.09) 0.752
No. of pre-diagnosistreatments
0 23 – – 39 – –
1 1585 1.64 (1.22–2.21) < 10−4 1548 0.78 (0.61–0.98) 0.032
2 1452 2.18 (1.62–2.94) < 10−4 1407 1.04 (0.82–1.31) 0.758
3 748 2.99 (2.22–4.03) < 10−4 736 1.37 (1.09–1.74) 0.008
4 426 3.70 (2.73–5.00) < 10−4 415 1.71 (1.35–2.17) < 10−4
Lower caste No 2943 – – – – –
Yes 1291 0.95 (0.91–0.99) 0.029 –
Treatment cost Free – – – 3379 – –
Paid – – – 766 0.92 (0.87–0.97) 0.003
Same-district diagnosis No 332 – – 321 – –
Yes 3902 0.92 (0.85–0.99) 0.037 3824 0.90 (0.83–0.98) 0.011
Same-block diagnosis No – – – 1850 – –
Yes – – – 2295 0.95 (0.905–0.995) 0.032aBaseline is Begusarai as district with shortest average OD and OT waiting timesbBaseline is mud-walled housing as housing type with shortest average OT waiting time
Table 6 Comparison of age-specific death rates in VL patients and in Bihar population
Agegroup
VL patients (2012) Deaths (2012) Deaths per 1000 VL cases per year Deaths per 1000 general population per year (2012)a
Male Female Total Male Female Total Male Female Total Male Female Total
0–4 84 116 200 2 8 10 23.81 68.97 50.00 11.2 11.8 11.5
5–14 649 556 1205 5 18 23 7.70 32.37 19.09 0.9 0.8 0.9
15–59 1234 777 2011 60 32 92 48.62 41.18 45.75 3.2 2.6 2.9
60+ 174 51 225 26 3 29 149.43 58.82 128.89 42.9 49.0 45.7aFrom [36]
Jervis et al. Parasites & Vectors (2017) 10:601 Page 12 of 17

in sand fly populations. The majority of previousstudies of seasonal variation in sand fly numbersfound the vector density to be positively correlatedwith temperature and negatively correlated with rain-fall [16–19]. Peak populations were recorded in sum-mer and after the end of the rainy season, althoughwith variations (March-April and November [16],May-July and October-November [17], March-May[18], and June-July and November [19]). The summer(March-May) peak appears to coincide with that seenboth in the monthly onsets in this study and in otherstudies examining VL seasonality, which found casesto peak in March-April [20, 22]. This is unexpected;given an infected-symptomatic sojourn time of 2–5 months [3, 15, 23, 45], one would expect cases topeak later in the year than sand fly density, and in-deed some studies have observed highest numbers ofVL cases in July-September or April-June and lowestnumbers in January-March [3, 12, 18, 21]. However,the peak in cases in March - April fits with the peakin sand fly abundance after the rainy season (Octo-ber-November) in the previous year. One possible ex-planation for the lack of a second case peak after thesummer sand fly peak could be that the proportionof infective sand flies only peaks once, late in theyear [46]. Variation in the timing and appearance ofthe case peak is likely to be due to the considerablevariation in the incubation period for disease (sincelonger incubation periods dampen the seasonality inthe number of cases from that in the sand fly
abundance [47]). However, the previous studies sug-gesting a later peak incidence than our analyses hadsome weaknesses as ascertainers of seasonality. Thestudies by Bern and Perry et al. [3, 21] were bothcross-sectional studies with relatively low numbers ofactual symptomatic VL patients, and the historicalcase counts used by Bora [12] are likely to be num-bers of diagnoses rather than onsets, which couldeasily explain the relative delay in peak cases via theadded OD waiting times. Although both onset anddiagnosis numbers in our data show an annual cycle,the oscillation is much less clear in the monthlydiagnosis numbers. This adds uncertainty to the sea-sonality reported by Bora [12] and suggests thatadded variation from factors such as waiting timescan easily distort or cloud the results of diagnostictests as a representation of temporal VL distribution.Thus, future studies examining symptomatic VL epi-demiology might be better using patients’ records oftheir disease progression, as used here, rather thanclinical test results, even accounting for the greatermeasurement errors associated with self-reporteddata. To overcome the uncertainty about the rela-tionship between seasonally varying sand fly and casenumbers, the two need to be measured simultan-eously and a better understanding of asymptomaticsojourn times is needed.As illustrated in Fig. 5a and Table 3, young children
are noticeably less affected by VL relative to the age dis-tribution of the general population. Although this is in
Table 7 Odds ratios (and 95% confidence intervals) for VL patients’ risk of death for different factors, from multivariable logisticregression model; Bihar, 2012–2013 (n = 4628)
Variable No. of patients Odds ratio 95% CI P-value
Total Dead
Age Each 1-year increase 4628 165 1.03 1.025–1.04 < 10−4
District Saharsa 1181 43 2.65 1.07–6.57 0.036
E. Champaran 1136 45 2.60 1.04–6.48 0.040
Samastipur 743 21 1.58 0.60–4.15 0.357
Gopalganj 620 26 2.96 1.11–7.85 0.029
Begusarai 356 14 3.22 1.16–8.91 0.025
Khagaria 294 6 – – –
Patna 223 9 1.85 0.62–5.53 0.272
W. Champaran 75 1 0.71 0.08–6.18 0.754
Onset-to-treatment time Each 1-day increase 4628 165 1.006 1.002–1.009 0.002
Treatment duration Each 1-day increase 0.91 0.89–0.93 < 10−4
Cattle owner No 1767 79 – – –
Yes 2861 86 0.61 0.44–0.85 0.004
Paid for test Paid 1980 53 – – –
Free 2648 112 2.19 1.49–3.21 < 10−4
Jervis et al. Parasites & Vectors (2017) 10:601 Page 13 of 17

contrast to the study by Perry et al. [21] which estimatedthe 0–10 age group to be at highest risk and the 11–20age group at lowest risk of VL, Perry et al. [21] only in-cluded 45 symptomatic VL cases and a reduced inci-dence of VL in young children has been observed in themajority of previous studies [3, 5, 12, 22, 24, 27, 28]. Ifthe apparently low burden of cases in under-fives doesreflect the actual underlying age distribution of disease,a possible explanation is variation in sand fly exposure:via different patterns of daytime movement or prioritisa-tion of bed nets, young children have lower levels of VLinfection because they are less frequently bitten by sandflies. Another hypothesis for under-representation isunder-reporting of symptomatic VL in children: in re-gions where there are many infant deaths due to fever,many fatal VL cases in infants could have been passedover when collecting our dataset. This is suggested byBihar population surveys reviewed by Bora [12], wherethe 1989 number of cases in the 0–9 age group is 8.6%higher than that in 1979; given that the population-widecase counts are similar in the 2 years, it is possible thatan apparent increase in children is due to a reduction inunder-reporting rather than an actual change in age-specific levels due to the long-term dynamics of the dis-ease. It is also possible that there is little variation by agein actual biting and infection rates, but children have alower probability of an asymptomatic infection develop-ing into clinical VL, so are consequently rarer in thesymptomatic population.The hypotheses of lower exposure of susceptible indi-
viduals or lower probability of infected individuals becom-ing symptomatic could also account for the apparentshortfall in VL cases among women relative to men, alsoreported by previous studies [3, 5, 12, 21, 22, 24–27, 48].Another possible explanation is under-reporting of femalecases due to women having, on average, poorer access toappropriate healthcare. This hypothesis is supported byAlvar et al. [49], where 60–80% of health facility patientswere male while sex ratios were almost equal inpopulation-based studies. This theory could also explainwhy only adult women appear to have reduced risk: beforethe age of 15, say, males and females are equally likely fortheir parents/guardians to take them to a doctor when un-well, while adult women are less able than men to travelto healthcare facilities. Given that our analyses of fac-tors affecting waiting times for diagnosis and treatment(discussed in more detail below) found no significantdifference between sexes, it would seem probable thatreduced access to healthcare for women is more likelyto have manifest as a lack of, rather than a delay in,diagnosis and treatment for some symptomaticallyinfected women. The apparent widening of the gapbetween the numbers of identified cases in men and inwomen with age in our data is strikingly similar to that
observed in a study of 8749 VL patients from theVaishali district of Bihar [22], and emphasises the needfor further investigation of the factors affectingreported numbers of male and female cases.
Significant differences in the pathway to careIn our analyses of waiting times, we found significantdifferences between districts even after the inclusion ofmany SEFs one might expect to account for such vari-ation. Given that several SEFs found to be significant inunivariate regression models were subsequently excludedfrom multivariate models, this could be because an indi-vidual’s district is a more informative (summary) meas-ure of their effective socio-economic status than anyavailable single SEF and as such, the spatial associationmight be replaceable by the right combination of SEFs.Alternatively, the observed association might be attribut-able to unmeasured variation in health provision be-tween districts; this could include healthcare staffinglevels and VL awareness, as well as documented statis-tics such as relative availability of public health centres.Out of the other factors judged to have significant ef-fects, having more PDTs or having to travel outside one’sresidential area were unsurprisingly estimated to in-crease both waiting times. Somewhat unexpectedly, pay-ing for treatment appeared to decrease OT waitingtimes only when in combination with other variables,and lower-caste individuals were estimated to haveshorter diagnosis and treatment waiting times on aver-age. The apparent reduction in waiting times for lower-caste individuals is likely also due to a difference inawareness; as VL is a disease associated with poverty,clinical practitioners might be more likely to VL-test andmedicate a lower-caste patient with a fever.
MortalityAnother important issue for minimising the effects ofVL as a public health problem is the reduction of mor-tality related to the disease. To develop a strategy forthis, it is necessary to understand which factors signifi-cantly influence mortality among patients. Comparingthe effects of numerous factors on an individual’s prob-ability of death using logistic regression models, some-what surprisingly no significant difference was foundbetween sexes or different housing types and materials.The increase in mortality with age was unsurprising, aswas the small but significant increase with waiting-timeto treatment. The associations between increased treat-ment duration and cattle ownership and lower mortalityare more difficult to interpret: the former might bebiased by some individuals only receiving longer treat-ments because they survived the pre- or early-treatmentstage, while cattle ownership might be directly protectivevia better nutrition but alternatively could just be a
Jervis et al. Parasites & Vectors (2017) 10:601 Page 14 of 17
marker of higher average socio-economic status. Thelower mortality among patients paying for diagnosiscould be wealth-related: higher-income individualsmight be more likely to pay for care, or facilities provid-ing free diagnosis tests might be more accessible inpoorer areas, with differences in mortality thus attribut-able to wealth-associated differences in average baselinehealth. Due probably to the low numbers of VL patientsand thus even lower number of patient deaths observ-able from case-control studies, there appear to be veryfew previous studies examining factors affecting mortal-ity rates amongst VL patients. Barnett et al. [25] andHuda et al. [50] both reported differences in male andfemale mortality rates, whereas sex was not found to sig-nificantly affect death risk in our regression analyses.However, these two studies suggested opposing results -33 vs 75% of deaths among males - and were based onvery low numbers of deaths–8 and 9, respectively. Simi-larly to our analyses, a recent study using the same datasource, by Das et al. [30] found cattle ownership andshorter onset-to-diagnosis waiting times to be associatedwith a reduced death risk and age and private treatmentassociated with an increased risk, but gender to have littleeffect. Although the results in Das et al. [30] also sug-gested that house type and caste affected mortality whilethese were eliminated from our preferred model, this islikely due to a difference in methods; Das et al. measuredvariations in death risk over time using Cox proportionalhazard models while our analyses were of the total haz-ard of dying. Consequently, it could be that caste andhouse type have a significant effect on time-dependentrisk of death but not the overall risk. Alternatively, theinclusion of district in our regression analyses mighthave accounted for variations in mortality attributed tohousing or caste in [30].Our analyses did have several limitations. The lack of
information on disease-free individuals prevented anyinvestigation of the effects of SEFs on VL incidenceacross Bihar. The use of retrospective questionnaires fordata collection meanwhile meant that records of bothkey dates along the pathway to care and some SEFs wereincomplete and sometimes contradictory, while the re-cords of deaths within the study did not differentiate be-tween deaths caused by VL and those from other causes.Nevertheless, we were able to gain valuable insight intothe effects of housing, cattle and location on VL diagno-sis and treatment as well as variations in the distributionof the disease itself.
ConclusionsWe conclude that in various VL-endemic districts ofBihar there remain challenges in the elimination of VLand that there is considerable variation between regionsin the pathway to care. For long-term control, more
attention needs to be focused on districts with a highcase burden, and efforts should be made in all regions toreduce waiting times for diagnosis and treatment, eitherby increasing provision or awareness, and to improvehealthcare access for women.
Additional files
Additional file 1: Table S1. Distribution of socio-economic factorsacross the eight study districts. (DOCX 30 kb)
Additional file 2: Table S2. Distribution of continuous variables(age, waiting times and house size) for the eight study districts. (DOCX 15 kb)
Additional file 3: Figure S1. Box-plots of distribution of onset-to-diagnosis waiting times by season of onset. (DOCX 90 kb)
Additional file 4: Figure S2. Maps of Bihar showing burdens ofidentified cases in study districts for January 2012 - June 2013 at (a)district level and (b) block level. (DOCX 996 kb)
Additional file 5: Table S3. Single-variable negative-binomialregression models for OD and OT waiting times. (DOCX 23 kb)
AbbreviationsCI: Confidence interval; IQR: Interquartile range; ISC: Indian sub-continent;KA: Kala-azar; LRT: Likelihood ratio test; OD: Onset-to-diagnosis; OT: Onset-to-treatment; PKDL: Post-kala-azar dermal leishmaniasis; SEF: Socio-economicfactor; VL: Visceral leishmaniasis
AcknowledgementsNot applicable.
FundingSJ, LACC, EALR, OC, GFM and TDH gratefully acknowledge funding of theNTD Modelling Consortium by the Bill and Melinda Gates Foundation inpartnership with the Task Force for Global Health. Data collection wasconducted by the Bihar Technical Support Program of CARE India andfinancially supported by a grant from the Bill and Melinda Gates Foundation(Grant ID# OPP1016872CARE). The views, opinions, assumptions or any otherinformation set out in this article should not be attributed to the Bill &Melinda Gates Foundation or The Task Force for Global Health or any personconnected with them.
Availability of data and materialsDue to concerns for participant confidentiality, data are available on request.The full dataset has not been stored in a public repository as it containsmultiple identifiers that may lead to the identification of individual patients.In India, kala-azar is associated with considerable stigma. Thus, identificationof participants (from the full dataset) may lead to discrimination by therespective community members. However, identification of participants isnot possible from the data presented in the article as it contains summarizedresults only. The full dataset is freely available upon written request to theInstitutional Committee for Ethics and Review of Health ManagementResearch Office, under the Indian Institute of Health Management Research(IIHMR). Request for the study dataset may be sent to Dr Nutan Jain,Member-Secretary of Institutional Committee for Ethics and Review of HealthManagement Research Office (e-mail: [email protected]).
Authors’ contributionsSJ, LACC, GFM and TDH conceived the study. SD, IB, IC and SS designed andconducted the VL situational assessment and supervised the data collectionprocess. SJ and LACC performed the data cleaning and analysis. MK, AD andTM reviewed the analytical plan. SJ, LACC and TDH wrote the manuscript.SD, MK, AD, EALR, OC, TM, IB, IC, SS and GFM reviewed and edited themanuscript. All authors read and approved the final manuscript.
Ethics approval and consent to participateThe study was approved by the Institutional Committee for Ethics andReview of Health Management Research Office of Indian Institute of HealthManagement Research (IIHMR), Jaipur, India (www.iihmr.org). Informed
Jervis et al. Parasites & Vectors (2017) 10:601 Page 15 of 17

consent (including signature or left thumb impression of the respondent)was obtained from each agreeing participant before interview andmeasurements, after explaining the details of the study in a language thatthey could understand. The data were anonymised before sharing with theWarwick team for analysis.
Consent for publicationNot applicable.
Competing interestsThe authors declare that they have no competing interests.
Publisher’s NoteSpringer Nature remains neutral with regard to jurisdictional claims inpublished maps and institutional affiliations.
Author details1School of Life Sciences, University of Warwick, Gibbet Hill Campus, CoventryCV4 7AL, UK. 2CARE India Solutions for Sustainable Development, Patna,Bihar, India. 3Department of Public Health, Erasmus MC, University MedicalCenter Rotterdam, PO Box 2040, 3000, CA, Rotterdam, The Netherlands.4London School of Hygiene and Tropical Medicine, Keppel Street, LondonWC1E 7HT, UK.
Received: 26 December 2016 Accepted: 12 November 2017
References1. World Health Organisation. Leishmaniasis Fact Sheet. 2016. http://www.who.
int/mediacentre/factsheets/fs375/en/. Accessed 21 Dec 2016.2. Alvar J, Velez ID, Bern C, Herrero M, Desjeux P, Cano J, et al. Leishmaniasis
worldwide and global estimates of its incidence. PLoS One. 2012;7(5):e35671.
3. Bern C, Hightower AW, Chowdhury R, Ali M, Amann J, Wagatsuma Y, et al.Risk factors for kala-azar in Bangladesh. Emerg Infect Dis. 2005;11(5):655–62.
4. Bern C, Haque R, Chowdhury R, Ali M, Kurkjian KM, Vaz L, et al. Theepidemiology of visceral leishmaniasis and asymptomatic leishmanialinfection in a highly endemic Bangladeshi village. Am J Trop Med Hyg.2007;76(5):909–14.
5. Picado A, Ostyn B, Singh SP, Uranw S, Hasker E, Rijal S, et al. Risk factors forvisceral leishmaniasis and asymptomatic Leishmania donovani infection inIndia and Nepal. PLoS One. 2014;9(1):e87641.
6. Chowdhury R, Mondal D, Chowdhury V, Faria S, Alvar J, Nabi SG, et al. Howfar are we from visceral leishmaniasis elimination in Bangladesh? Anassessment of epidemiological surveillance data. PLoS Negl Trop Dis. 2014;8(8):e3020.
7. National Vector Borne Disease Control Programme DGoHS, Ministry ofHealth and Family Welfare, Government of India. Kala-azar Cases andDeaths in the Country since 2010. 2016. http://nvbdcp.gov.in/ka-cd.html.Accessed 21 Dec 2016.
8. World Health Organisation. Kala-azar elimination programme: report of aWHO consultation of partners, Geneva: World Health Organisation; 2015.http://apps.who.int/iris/bitstream/10665/185042/1/9789241509497_eng.pdf.Accessed 21 Dec 2016.
9. World Health Organisation South-East Asia, Government of Bangladesh,Government of the People’s Republic of Bangladesh, Royal Government ofBhutan, Government of India, Government of Nepal, Royal Thai GovernmentGovernment of Bangladesh: Memorandum of Understanding amongBangladesh, Bhutan, India, Nepal and Thailand on the Elimination of Kala-Azar from the South-East Asia Region. Dhaka; 2014.
10. Bhunia GS, Kesari S, Chatterjee N, Kumar V, Das P. The burden of visceralleishmaniasis in India: challenges in using remote sensing and GIS tounderstand and control. ISRN Inf Dis. 2012;2013:1-14.
11. Bhunia GS, Kesari S, Chatterjee N, Kumar V, Das P. Spatial and temporalvariation and hotspot detection of kala-azar disease in Vaishali district(Bihar), India. BMC Infect Dis. 2013;13:64.
12. Bora D. Epidemiology of visceral leishmaniasis in India. Natl Med J India.1999;12(2):62–8.
13. Malaviya P. Management of visceral leishmaniasis in Muzaffarpur, Bihar,India. PhD Thesis. University of Antwerp; 2015.
14. Singh OP, Hasker E, Boelaert M, Sundar S. Elimination of visceralleishmaniasis on the Indian subcontinent. Lancet Infect Dis. 2016;16(12):e304–9.
15. Mubayi A, Castillo-Chavez C, Chowell G, Kribs-Zaleta C, Ali Siddiqui N, KumarN, Das P. Transmission dynamics and underreporting of Kala-azar in theIndian state of Bihar. J Theor Biol. 2010;262(1):177–85.
16. Dinesh DS, Ranjan A, Palit A, Kishore K, Kar SK. Seasonal and nocturnallanding/biting behaviour of Phlebotomus argentipes (Diptera: Psychodidae).Ann Trop Med Parasitol 2001;95(2):197-202.
17. Picado A, Das ML, Kumar V, Dinesh DS, Rijal S, Singh SP, et al. Phlebotomusargentipes seasonal patterns in India and Nepal. J Med Entomol. 2010;47(2):283–6.
18. Chowdhury R, Dotson E, Blackstock AJ, McClintock S, Maheswary NP, Faria S,et al. Comparison of insecticide-treated nets and indoor residual spraying tocontrol the vector of visceral leishmaniasis in Mymensingh District,Bangladesh. Am J Trop Med Hyg. 2011;84(5):662–7.
19. Poche D, Garlapati R, Ingenloff K, Remmers J, Poche R. Bionomics ofphlebotomine sand flies from three villages in Bihar, India. J Vector Ecol.2011;36(Suppl 1):S106–17.
20. Malaviya P, Picado A, Singh SP, Hasker E, Singh RP, Boelaert M, Sundar S.Visceral leishmaniasis in Muzaffarpur district, Bihar, India from 1990 to 2008.PLoS One. 2011;6(3):e14751.
21. Perry D, Dixon K, Garlapati R, Gendernalik A, Poche D, Poche R. Visceralleishmaniasis prevalence and associated risk factors in the saran district ofBihar, India, from 2009 to July of 2011. Am J Trop Med Hyg. 2013;88(4):778–84.
22. Burza S, Sinha PK, Mahajan R, Lima MA, Mitra G, Verma N, et al. Five-yearfield results and long-term effectiveness of 20 mg/kg liposomalamphotericin B (Ambisome) for visceral leishmaniasis in Bihar, India. PLoSNegl Trop Dis. 2014;8(1):e2603.
23. Chapman LA, Dyson L, Courtenay O, Chowdhury R, Bern C, Medley GF,Hollingsworth TD. Quantification of the natural history of visceralleishmaniasis and consequences for control. Parasit Vectors. 2015;8:521.
24. Kumar R, Kumar P, Chowdhary RK, Pai K, Mishra CP, Kumar K, et al. Kala-azarepidemic in Varanasi district, India. Bull World Health Organ. 1999;77(5):371–4.
25. Barnett PG, Singh SP, Bern C, Hightower AW, Sundar S. Virgin soil: thespread of visceral leishmaniasis into Uttar Pradesh, India. Am J Trop MedHyg. 2005;73(4):720–5.
26. Ranjan A, Sur D, Singh VP, Siddique NA, Manna B, Lal CS, et al. Risk factorsfor Indian kala-azar. Am J Trop Med Hyg. 2005;73(1):74–8.
27. Singh SP, Picado A, Boelaert M, Gidwani K, Andersen EW, Ostyn B, et al. Theepidemiology of Leishmania donovani infection in high transmission foci inIndia. Tropical Med Int Health. 2010;15(Suppl 2):12–20.
28. Hasker E, Singh SP, Malaviya P, Picado A, Gidwani K, Singh RP, et al. Visceralleishmaniasis in rural Bihar, India. Emerg Infect Dis. 2012;18(10):1662–4.
29. Medley GF, Hollingsworth TD, Olliaro PL, Adams ER. Health-seekingbehaviour, diagnostics and transmission dynamics in the control of visceralleishmaniasis in the Indian subcontinent. Nature. 2015;528(7580):S102–8.
30. Das A, Karthick M, Dwivedi S, Banerjee I, Mahapatra T, Srikantiah S,Chaudhuri I. Epidemiologic correlates of mortality among symptomaticvisceral leishmaniasis cases: findings from situation assessment in highendemic foci in India. PLoS Negl Trop Dis. 2016;10(11):e0005150.
31. Singh SP, Reddy DC, Rai M, Sundar S. Serious underreporting of visceralleishmaniasis through passive case reporting in Bihar, India. Tropical Med IntHealth. 2006;11(6):899–905.
32. Singh VP, Ranjan A, Topno RK, Verma RB, Siddique NA, Ravidas VN, et al.Estimation of under-reporting of visceral leishmaniasis cases in Bihar, India.Am J Trop Med Hyg. 2010;82(1):9–11.
33. Office of the Registrar General & Census Commissioner I, Ministry of HomeAffairs, Government of India. Census of India 2011: C-14 Five year age groupdata by residence and sex; 2011. http://www.censusindia.gov.in/2011census/C-series/C-14.html. Accessed 21 Dec 2016.
34. StataCorp. Stata Statistical Software: Release 14. College Station: StataCorpLP; 2015.
35. Office of the Registrar General & Census Commissioner I, Ministry of HomeAffairs, Government of India. Census of India 2011; 2011. http://www.census2011.co.in/census/state/districtlist/bihar.html. Accessed 21 Dec 2016.
36. Office of the Registrar General I, Ministry of Home Affairs, Government ofIndia. Sample Registration System Statistical Report 2012: Chapter 4 -Estimates of Mortality Indicators. 2013. http://www.censusindia.gov.in/vital_statistics/SRS_Report_2012/11_Chap_4_2012.pdf. Accessed 21 Dec 2016.
37. Berman JD. Human leishmaniasis: clinical, diagnostic, and chemotherapeuticdevelopments in the last 10 years. Clin Infect Dis. 1997;24(4):684–703.
Jervis et al. Parasites & Vectors (2017) 10:601 Page 16 of 17

38. National Vector Borne Disease Control Programme DGoHS, Ministry ofHealth and Family Welfare, Government of India. Kala-azar: Guidelines onDiagnosis & Treatment. 2015. http://nvbdcp.gov.in/Doc/Guidelines-Diagnosis-Treatment-KA.pdf. Accessed 1 May 2017.
39. Boettcher JP, Siwakoti Y, Milojkovic A, Siddiqui NA, Gurung CK, Rijal S, et al.Visceral leishmaniasis diagnosis and reporting delays as an obstacle totimely response actions in Nepal and India. BMC Infect Dis. 2015;15:43.
40. Malaviya P, Picado A, Hasker E, Ostyn B, Kansal S, Singh RP, et al. Health &Demographic surveillance system profile: the Muzaffarpur-TMRC health anddemographic surveillance system. Int J Epidemiol. 2014;43(5):1450–7.
41. Chowdhury R, Huda MM, Kumar V, Das P, Joshi AB, Banjara MR, et al. TheIndian and Nepalese programmes of indoor residual spraying for theelimination of visceral leishmaniasis: performance and effectiveness. AnnTrop Med Parasitol. 2011;105(1):31–5.
42. Coleman M, Foster GM, Deb R, Pratap Singh R, Ismail HM, Shivam P, et al.DDT-based indoor residual spraying suboptimal for visceral leishmaniasiselimination in India. Proc Natl Acad Sci USA. 2015;112(28):8573–8.
43. Singh R, Kumar P. Susceptibility of the sand fly Phlebotomus argentipesAnnandale and Brunetti (Diptera: Psychodidae) to insecticides in endemicareas of visceral leishmaniasis in Bihar, India. Jpn J Infect Dis. 2015;68(1):33–7.
44. Dye C, Wolpert DM. Earthquakes, influenza and cycles of Indian kala-azar.Trans R Soc Trop Med Hyg. 1988;82(6):843–50.
45. Stauch A, Sarkar RR, Picado A, Ostyn B, Sundar S, Rijal S, et al. Visceralleishmaniasis in the Indian subcontinent: modelling epidemiology andcontrol. PLoS Negl Trop Dis. 2011;5(11):e1405.
46. Tiwary P, Kumar D, Mishra M, Singh RP, Rai M, Sundar S. Seasonal variationin the prevalence of sand flies infected with Leishmania donovani. PLoSOne. 2013;8(4):e61370.
47. Le Rutte EA, Chapman LA, Coffeng LE, Jervis S, Hasker EC, Dwivedi S, et al.Elimination of visceral leishmaniasis in the Indian subcontinent: acomparison of predictions from three transmission models. Epidemics. 2017;18:67–80.
48. Rahman KM, Islam S, Rahman MW, Kenah E, Ghalib CM, Zahid MM, et al.Increasing incidence of post-kala-azar dermal leishmaniasis in a population-based study in Bangladesh. Clin Infect Dis. 2010;50(1):73–6.
49. Alvar J, Yactayo S, Bern C. Leishmaniasis and poverty. Trends Parasitol. 2006;22(12):552–7.
50. Huda MM, Chowdhury R, Ghosh D, Dash AP, Bhattacharya SK, Mondal D.Visceral leishmaniasis-associated mortality in Bangladesh: a retrospectivecross-sectional study. BMJ Open. 2014;4(7):e005408.
• We accept pre-submission inquiries
• Our selector tool helps you to find the most relevant journal
• We provide round the clock customer support
• Convenient online submission
• Thorough peer review
• Inclusion in PubMed and all major indexing services
• Maximum visibility for your research
Submit your manuscript atwww.biomedcentral.com/submit
Submit your next manuscript to BioMed Central and we will help you at every step:
Jervis et al. Parasites & Vectors (2017) 10:601 Page 17 of 17