lower atmospheric wind dynamics as measured by the 1290
TRANSCRIPT
_____________________________________________________________________________________________________ *Corresponding author: Email: [email protected];
Asian Journal of Advanced Research and Reports
8(1): 22-35, 2020; Article no.AJARR.54286 ISSN: 2582-3248
Lower Atmospheric Wind Dynamics as Measured by the 1290 MHz Wind Profiler Radar Located at
Cardington (Lat. 52.10ºN, Long. 0.42ºE), UK and Their Comparisons with Near-by Radiosonde
Instrument
M. Satyavani1, P. S. Brahmanandam2*, P. S. V. Subba Rao1 and M. P. Rao1
1Depatment of Physics, Andhra University, Visakhapatnam- 530 003, India. 2Depatment of Basic Science, Shri Vishnu Engineering College for Women, Bhimavaram-534 202,
India.
Authors’ contributions
This work was carried out in collaboration among all authors. Author MS designed the study, performed the statistical analysis, wrote the protocol and wrote the first draft of the manuscript.
Authors PSB and PSVSR managed the analyses of the study. Author MPR managed the literature searches. All authors read and approved the final manuscript.
Article Information
DOI: 10.9734/AJARR/2020/v8i130190
Editor(s): (1) Dr. Hasan Aydogan, Associate Professor, Department of Mechanical Engineering, Selcuk University, Konya, Turkey.
Reviewers: (1) Peter Stallinga, University of the Algarve, Portugal.
(2) Jianhui Yang, Henan Polytechnic University, China. Complete Peer review History: http://www.sdiarticle4.com/review-history/54286
Received 15 November 2019 Accepted 19 January 2020
Published 21 January 2020
ABSTRACT
This study reports diurnal variations of wind directions, wind speed of vector winds, and the evolution of boundary layer (BL) over a mid-latitude measured using a transportable 1290 MHz wind profiling radar located at Cardington (Lat. 52.10ºN; Long. 0.42ºE), Bedfordshire, UK from 17 to 28 April 2010. The horizontal winds show benign behavior during nighttime hours, while winds during daytime hours had magnitudes around, on average, 10-20 m/s, in the majority of the cases. The heights of the boundary layer (BL) varied from as low as ~1100 m to ~2600 km and BL height had shown to have evolved from 0700 universal time (UT) onwards and collapsed by 0000 UT. Besides, a comparison made between winds measured by the 1290 MHz radar and near-by radiosonde showed a moderate similitude between them, albeit a few discrepancies are found in wind directions and speeds. The possible reasons for these discrepancies could be different volume
Original Research Article
Satyavani et al.; AJARR, 8(1): 22-35, 2020; Article no.AJARR.54286
23
sensing of observations of these independent observations. An attempt is, therefore, made to calculate radiosonde balloon drifts [1] for the ascending node of the balloons, which had confirmed that the balloons often drifted horizontally as long as up to 100 km. The large drifts, most probably, are the possible reasons for the mismatching of winds measured by these two independent remote sensing instruments.
Keywords: Wind profiling radar; horizontal winds; boundary layer; balloon borne radiosonde. 1. INTRODUCTION Wind profiling is one of the important remote sensing techniques that contributed enormously to understand various atmospheric phenomena including, zonal (u), meridional (v) and vertical (w) winds (with unprecedented resolutions), the clear-air turbulence, precipitation, convective boundary layer depth, turbulence parameters, low-level jet, wind shear, onset of different season, and raindrop size distribution of rain and snow. A wind profiler, which is also known as wind profiler radar, is a Doppler radar that is capable to measure backscatter echoes from the clear-air [2], which is, in turn, greatly affected by the humidity of the lower troposphere [3]. A typical wind profiler uses either radiowaves (radar) or sound waves (sodar) to be sent to the overlying atmospheric layers to detect wind speed and direction of both horizontal and vertical winds at various altitudes above the ground. Nevertheless, the range of operating frequencies dictates the type of wind profiles, which includes the boundary layer (BL) and tropospheric category. For instance, typical BL wind profilers emit radiowaves in L- (frequency range: 1-2 GHz) and ultra -high frequency (UHF, frequency range: 300 MHz- 3 GHz) bands, which correspond to wavelengths of 15-30 cm and 0.1-1 m, respectively. On the other hand, tropospheric wind profilers would use very high frequency (VHF, frequency range: 30-300 MHz and the corresponding wavelength is 1-10 m) to detect the targets. Though UHF wind profilers have initially been designed to provide wind profiling data, which were not covered by the 50-MHz radars, later it is realized that that could measure temperature, turbulence, boundary layer height measurements, apart from the measurement of heat and momentum fluxes and precipitation profiling [3]. Wind data provided by the wind profilers are exploited to provide short-term meteorological forecasting [4], to be used in the field of aviation (aero plane routing) and, in a few interesting areas including, ornithology [5]. By realizing the potential capability of wind profiles,
the Aeronomy Labs (AL) of the U. S. National Oceanic and Atmospheric Administration (NOAA) had developed a transportable 915 MHz wind profiler [6] to be used at tropical Pacific stations [7]. Later, several countries around the world installed UHF wind profilers that include Japan (WINDAS in 2001 at more than 31 places) [8], Australia (at more than 9 places) [9], and the UK [10]. As far as the reliability and accuracy of radar wind data is concerned, balloon-borne radiosonde measured winds have been used to make comparisons with radar wind profiler, since radiosondes are deemed to be the de facto standard for winds aloft [11]. Though wind profilers and radiosondes provide different types of vertical profiles of horizontal wind measurements, plenty of comparative studies carried out by several research workers [12,13,14,15,11]. Interestingly, the majority of the earlier studies reported that there exists great similitude between them and those comparisons have yielded relatively higher correlation co-efficients and standard deviations, and extremely low standard error estimates and lower biases. On the other hand, a few deviations between them were also observed, which could be due to the inherent systematic and extreme random errors of the observational systems being used, also due to differences in measurement principles, and the simultaneous comparisons of winds sampled at different temporal and spatial scales [16]. Further, relatively fewer studies were devoted to making comparisons of wind directions and speeds and it has been found that the relative distance between radar and radiosonde could be the possible reason for a discrepancy between them [17,18]. To further understand the so-called similitudes and discrepancies, a good number of research studies shall be carried out by using various remote sensing instruments and model-based datasets. The present research study, therefore, presents vertical profiles of horizontal and vertical wind components as well as signal-to-noise (SNR)
Satyavani et al.; AJARR, 8(1): 22-35, 2020; Article no.AJARR.54286
24
and spectral width measurements collected at the Met Office Research Unit, Cardington, Bedfordshire, UK, between 17 and 30 April. These data were collected by the NERC National Centre for Atmospheric Science (NCAS) Atmospheric measurement Facility's (AMF) 1290 MHz Mobile Wind Profiler, owned and operated by the University of Manchester, Manchester, UK. Added to the above, comparative studies of various winds, wind directions and speeds between wind profiler and radiosonde-measured will be presented. Last not least, the temporal evolution of the boundary layer (BL) is also presented and the heights of BL are tabulated.
2. DATA ANALYSIS METHODOLOGY
This radar operates at 1290 MHz (the corresponding wavelength is 23 cm) with a peak power of 3.5 kW and beam width of 8.5°. The radar consists of three panels that emit and receive three separate beams, each panel being an array of 64 dipole antennas. The vertical beam measures the vertical component of the wind and the two beams at an elevation of 73° and orthogonal azimuths sample radial velocities that have contributions from both vertical and horizontal wind components, to enable full wind vectors to be calculated. The radar provides measurements of wind speed and direction to an intrinsic accuracy of <1 ms
−1 and <10
0,
respectively, according to the manufacturer’s estimates. It may be worth mentioning here that we do not discuss any data processing methods and algorithms of this winds profiler and interested researcher may go through Barth et al. (1994) paper for further information. Data (http://weather.uwyo.edu/upperair/sounding.html) provided by radiosonde located at Herstmonceux (Station number: 3882 and its geographic co-ordinates are: Lat. 50.90° N, Long. 0.32° E, and Elevation 52.0 m) are considered to make typical comparisons with wind profiler data.
3. OBSERVATIONAL RESULTS AND DISCUSSION
3.1 Wind Profiler Radar Data-diurnal Variations of Vector Winds
In this section, we present the diurnal variation of horizontal winds (both direction and wind speed) measured by the 1290 MHz radar on 17 April, 18 April, 19 April, 20 April, 22 April, 23 April, 24 April, 25 April, 26 April, 27 April, and 28 April 2010, respectively. Fig. 1 shows the diurnal variation of 15-minute averaged horizontal wind direction (Fig. 1a) and wind direction (Fig. 1b) on
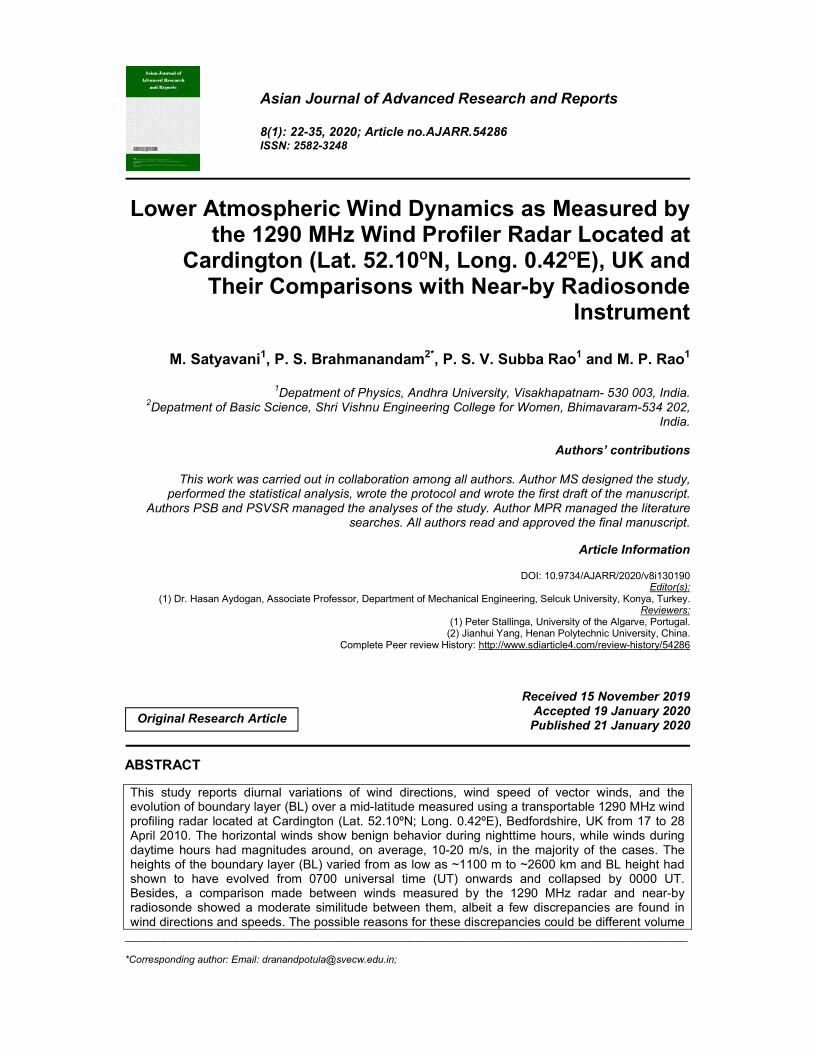
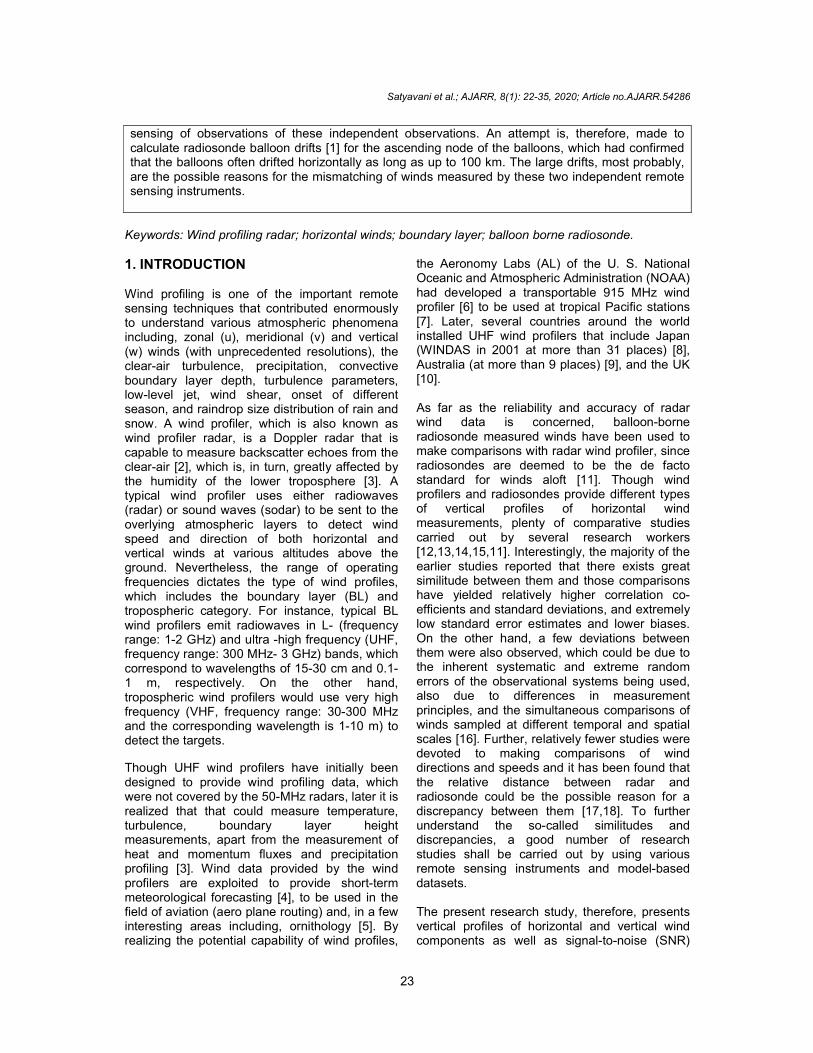
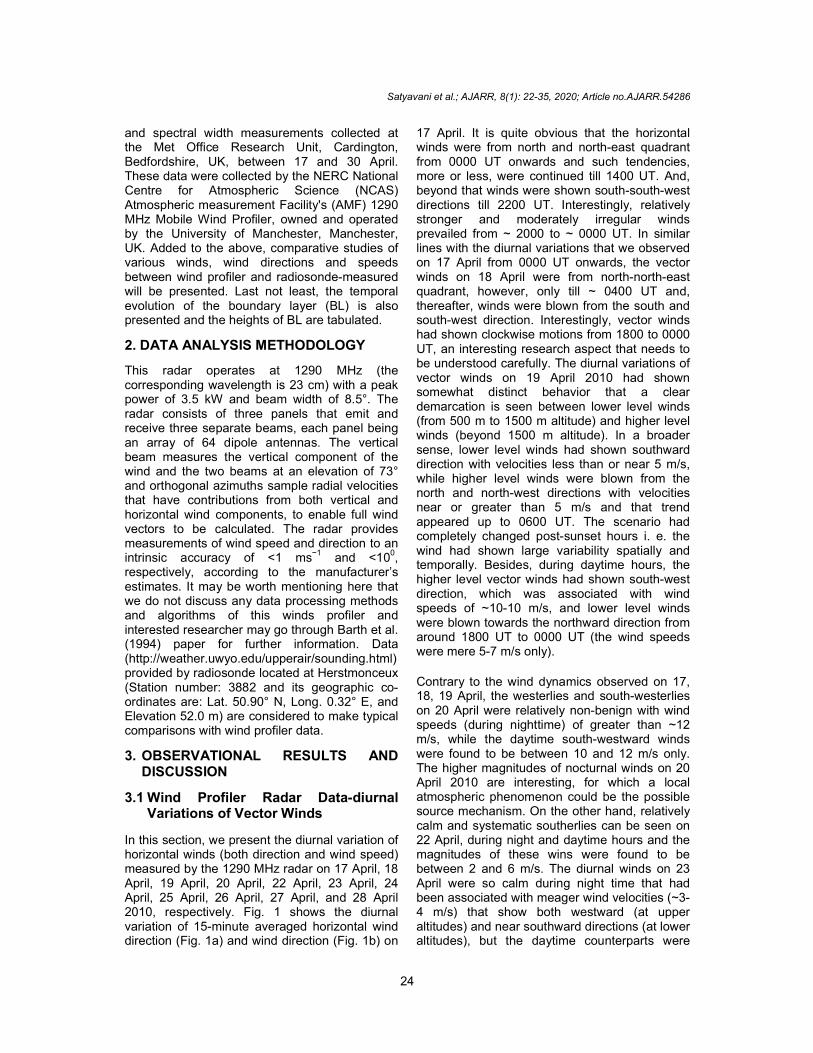
17 April. It is quite obvious that the horizontal winds were from north and north-east quadrant from 0000 UT onwards and such tendencies, more or less, were continued till 1400 UT. And, beyond that winds were shown south-south-west directions till 2200 UT. Interestingly, relatively stronger and moderately irregular winds prevailed from ~ 2000 to ~ 0000 UT. In similar lines with the diurnal variations that we observed on 17 April from 0000 UT onwards, the vector winds on 18 April were from north-north-east quadrant, however, only till ~ 0400 UT and, thereafter, winds were blown from the south and south-west direction. Interestingly, vector winds had shown clockwise motions from 1800 to 0000 UT, an interesting research aspect that needs to be understood carefully. The diurnal variations of vector winds on 19 April 2010 had shown somewhat distinct behavior that a clear demarcation is seen between lower level winds (from 500 m to 1500 m altitude) and higher level winds (beyond 1500 m altitude). In a broader sense, lower level winds had shown southward direction with velocities less than or near 5 m/s, while higher level winds were blown from the north and north-west directions with velocities near or greater than 5 m/s and that trend appeared up to 0600 UT. The scenario had completely changed post-sunset hours i. e. the wind had shown large variability spatially and temporally. Besides, during daytime hours, the higher level vector winds had shown south-west direction, which was associated with wind speeds of ~10-10 m/s, and lower level winds were blown towards the northward direction from around 1800 UT to 0000 UT (the wind speeds were mere 5-7 m/s only). Contrary to the wind dynamics observed on 17, 18, 19 April, the westerlies and south-westerlies on 20 April were relatively non-benign with wind speeds (during nighttime) of greater than ~12 m/s, while the daytime south-westward winds were found to be between 10 and 12 m/s only. The higher magnitudes of nocturnal winds on 20 April 2010 are interesting, for which a local atmospheric phenomenon could be the possible source mechanism. On the other hand, relatively calm and systematic southerlies can be seen on 22 April, during night and daytime hours and the magnitudes of these wins were found to be between 2 and 6 m/s. The diurnal winds on 23 April were so calm during night time that had been associated with meager wind velocities (~3-4 m/s) that show both westward (at upper altitudes) and near southward directions (at lower altitudes), but the daytime counterparts were

Satyavani et al.; AJARR, 8(1): 22-35, 2020; Article no.AJARR.54286
25
associated with wind velocities around 5-7 m/s. The southerly winds on 24 April were calm and, as expected, marginal difference in their magnitudes between nighttime and daytime can be seen easily. The nighttime winds on this day were associated with 5 m/s magnitudes, while nighttime counterparts were associated with greater than 15 m/s, however, only between 1300 and 1700 UT. The vector winds during nighttime on 25 April were south-west category with moderate winds speeds around 5-8 m/s at the lower altitudes and the upper altitude winds were associated with relatively higher values in the similar lines with what we observed on 20 April. On the other hand, though the higher magnitudes for higher altitudes winds continued till 1600 UT, not only
moderate magnitudes were associated with winds from 1600 UT onwards and winds had become westerlies. The vector winds on 26 April were westerlies during day and night times and associated with velocities ~ 4- 8 m/s. And, interestingly no significant spatial and temporal change is witnessed in the upper and lower atmospheric winds. The diurnal variations of winds (westerlies) on 27 April show near similar variations during both day and nighttimes, except during 1400- 1600 UT, wherein they had shown south-east direction initially followed by north-west directions with relatively higher magnitudes greater than 20 m/s. The diurnal variations of winds on 28 April show south-west directions from 0000 to 0000 UT and, however, from 1500 UT onwards the winds were associated with higher magnitudes ~ between 12 and 16 m/s.
Fig. 1. Diurnal variations of a) wind direction and b) speed on 17 April 2010 measured using the 1290 MHz wind profiler at Cardington, UK
Fig. 2. Diurnal variations of a) wind direction and b) speed on 18 April 2010
Satyavani et al.; AJARR, 8(1): 22-35, 2020; Article no.AJARR.54286
26
Fig. 3. Diurnal variations of a) wind direction and b) speed on 19 April 2010
Fig. 4. Diurnal variations of a) wind direction and b) speed on 20 April 2010
Fig. 5. Diurnal variations of a) wind direction and b) speed on 22 April 2010

Satyavani et al.; AJARR, 8(1): 22-35, 2020; Article no.AJARR.54286
27
Fig. 6. Diurnal variations of a) wind direction and b) speed on 23 April 2010
Fig. 7. Diurnal variations of a) wind direction and b) speed on24 April 2010
Fig. 8. Diurnal variations of a) wind direction and b) speed on25 April 2010

Satyavani et al.; AJARR, 8(1): 22-35, 2020; Article no.AJARR.54286
28
Fig. 9. Diurnal variations of a) wind direction and b) speed on 26 April 2010
Fig. 10. Diurnal variations of a) wind direction and b) speed on 27 April 2010
Fig. 11. Diurnal variations of a) wind direction and b) speed on 28 April 2010

Satyavani et al.; AJARR, 8(1): 22-35, 2020; Article no.AJARR.54286
29
Fig. 12. Diurnal variations of signal-to-noise-ratio (dB) on a) 17 April b) 18 April c) 19 April d) 21 April e) 22 April f) 23 April 2010 measured using the 1290 MHz wind profiler at Cardington, UK
Fig. 13. Diurnal variations of signal-to-noise-ratio (dB) on g) 24 April h) 25 April i) 26 April j) 27 April, and k) 28 April 2010 measured using the 1290 MHz wind profiler at Cardington, UK
3.2 ABL Evolution Studies Using the Wind Profiler Radar
The atmospheric boundary layer (ABL or simply BL) lies between the Earth’s ground surface and the free atmosphere. It is accepted that several aspects of the complex structure and the dynamics of the ABL are still unresolved. In this context, ground-based remote sensing instruments such as radar wind profilers may be used to study ABL dynamics and several such
profilers were installed in various places around the globe [19,20,21,22,23,24] (Mohankumar et al., 2017). And, this list would not have completed had we missed the pioneering work of Ecklund et al. [6], who successfully operated the 915-MHz wind profilers specially designed for the boundary layer and the lower atmosphere studies. The diurnal variations of signal-to-noise-ratio (dB) are shown in Figs. 13 and 14 on a) 17 April
Satyavani et al.; AJARR, 8(1): 22-35, 2020; Article no.AJARR.54286
30
b) 18 April c) 19 April d) 21 April e) 22 April, and f) 23 April and g) 24 April h) 25 April i) 26 April j) 27 April k) 28 April 2010, from which it is possible to know BL height. It is quite obvious from these figures that the evolution of boundary layer during daytime is quite obvious, particularly on 17, 18, 19, 23 April 2010. The exact heights of BL during this period are tabulated in Table 1. It is reported that boundary layer height is mostly controlled by its diurnal cycle [25]. It is reported that BL height was too shallow (~500 meters) at night (a stable layer), since the Earth’s surface layer would become stable because of the infrared radiative cooling [26]. It was shown that deeper magnitudes in daytime hours (a convec-
tive layer) due to solar heating that would cause convective unstable conditions [27].
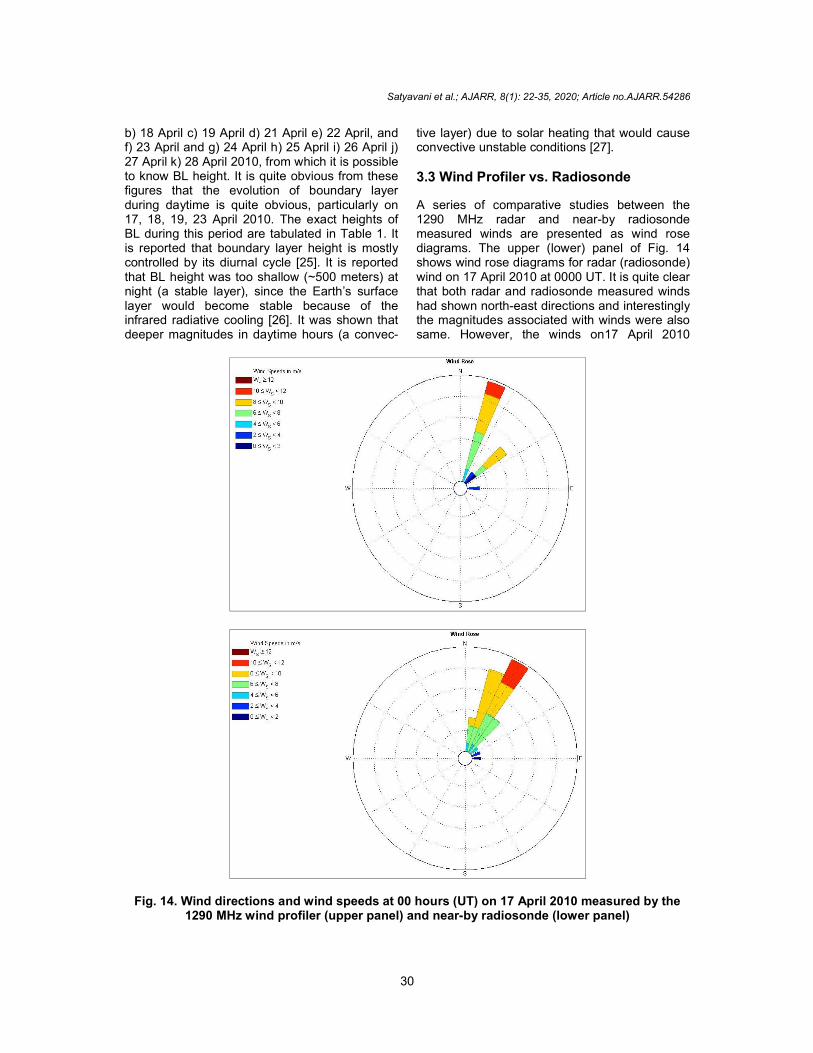
3.3 Wind Profiler vs. Radiosonde
A series of comparative studies between the 1290 MHz radar and near-by radiosonde measured winds are presented as wind rose diagrams. The upper (lower) panel of Fig. 14 shows wind rose diagrams for radar (radiosonde) wind on 17 April 2010 at 0000 UT. It is quite clear that both radar and radiosonde measured winds had shown north-east directions and interestingly the magnitudes associated with winds were also same. However, the winds on17 April 2010
Fig. 14. Wind directions and wind speeds at 00 hours (UT) on 17 April 2010 measured by the 1290 MHz wind profiler (upper panel) and near-by radiosonde (lower panel)

Satyavani et al.; AJARR, 8(1): 22-35, 2020; Article no.AJARR.54286
31
Table 1. Maximum height and evolution of the boundary layer (BL)
S. no. DD-MM-YEAR
Maximum height attained by boundary layer (meter)
Evolution of the boundary layer Starting time (UT) Ending time (UT)
1. 17-04-2010 1950 ~1050 ~1805 2. 18-04-2010 2400 ~1030 ~0000 3. 19-04-2010 2900 ~0910 ~2110 4. 21-04-2010 1950 ~0900 ~1710 5. 22-04-2010 1350 Irregular evolution 6. 23-04-2010 1900 ~0900 ~0000 7. 24-04-2010 1950 ~0800 ~1600 8. 25-04-2010 3400 ~0800 ~1100 9. 26-04-2010 2500 ~0730 ~1600 10. 27-04-2010 1700 ~0900 ~1500 11. 28-04-2010 Irregular evolution
Fig. 15. Wind directions and wind speeds at 06 hours (UT) on 17 April 2010 measured by the 1290 MHz wind profiler (upper panel) and near-by radiosonde (lower panel)
at 06 UT had shown completely different behaviors. In an elaborative sense, though both
winds confined to north-east directions, the magnitudes associated with them were

Satyavani et al.; AJARR, 8(1): 22-35, 2020; Article no.AJARR.54286
32
completely different. For instance, radar measured winds had shown maximum of ~4.5 m/s, while radiosonde winds had shown up to 8 m/s. The possible reasons for these discrepancies could be due to different volume sensing of these independent instruments. To confirm that aspect, it is desirable to verify the horizontal drifts of the balloons from the launch site during this study period. If the drift of a radiosonde is larger, the discrepancy between radiosonde and wind profiler-measured winds is also high and such typical deviations between them are presented in the ensuing section of this article. The horizontal drift is computed using the formula provided by Houchi et al. [1].
Fig. 17 shows three-dimensional (Longitude, Latitude, and Height) view of maximum reaching an altitude of the balloons and its corresponding drift (in km), while Fig. 18 shows two-dimensional (Longitude vs. Latitude) view of balloon drifts and it is also shown the location of wind profiling radar (blue open circle). Often, the drift of radiosonde balloon had reached as long as 100 km horizontally that led to the discrepancy of winds as measured by these two independent remote sensing instruments. The wind profiler provides simultaneous measurements over all heights at a fixed location, whereas the rawinsonde makes successive measurements at different heights, as it rises along the shear vector of its own ascent and is blown along by the wind. Nevertheless, an inclusive study using
Fig. 16. Wind directions and wind speeds at 12 hours (UT) on 17 April 2010 measured by the 1290 MHz wind profiler (upper panel) and near-by radiosonde (lower panel)

Satyavani et al.; AJARR, 8(1): 22-35, 2020; Article no.AJARR.54286
33
Fig. 17. Geographic locations of the 1290 MHz wind profiler and near-by radiosonde ascents in 3-D view (Longitude, Latitude, and Altitude)
Fig. 18. Geographic locations of the 1290 MHz wind profiler and near-by radiosonde ascents in 2-D view (Longitude and Latitude)
a huge database for a couple of months [28] could reveal the accurate possible mechanism.
4. CONCLUSION The conclusions of this present research study are summarized hereunder:
1) The wind variability is quite large not only with time but also with height. Both
direction and magnitude are varying considerably.
2) This multi-instrument research has carefully utilized several remote sensing instruments to study several aspects associated with winds of the Earth’s lower atmosphere and found a few interesting research aspects.
3) During this observation period (~10 days), winds were westerlies in daytime hours in the majority of the cases and were

Satyavani et al.; AJARR, 8(1): 22-35, 2020; Article no.AJARR.54286
34
confined to north-east and south-east directions.
4) Wind speeds in daytime hours are found to have higher velocities, while nocturnal winds show meager magnitudes, albeit a few cases show a reverse trend.
5) The evaluation of the boundary layer during several days is presented.
6) The BL altitude is tabulated during the observation period.
7) No proper similitude is found between radar-measured and the radiosonde-measured wind velocities and directions.
8) The possible reasons for the above discrepancy could be due to different volume sensing of these independent observations.
COMPETING INTERESTS
Authors have declared that no competing interests exist.
REFERENCES
1. Houchi K, Stoffelen A, Marseille GJ, de Kloe J. Comparison of wind and wind-shear climatologies derived from high resolution radiosondes and the ECMWF model. J. Geophys. Res. 2010;115: D22123. DOI: 10.1029/2009JD013196
2. Balsley BB. The MST technique- A review. J. Atmos. Terr. Phys. 1981;43:495-509.
3. Carter DA, Gage KS, Ecklund WL, Angevine WM, Johnston PE, Riddle AC, Wilson J, Williams CR. Developments in UHF lower tropospheric wind profiling at NOAA’s Aeronomy Laboratory. Radio Sci. 1995;30:977–1001.
4. Benjamin SG, Schwartz BE, Koch SE, Szoke EJ. The value of wind profiler data in U.S. weather forecasting. Bull. Amer. Meteor. Soc. 2004;85:1871–1886.
5. Weisshaupt N, Arizaga J, Maruri M. The role of radar wind profilers in ornithology. Ibis. 2018;160:516-527.
6. Ecklund WL, Carter DA, Balsley BB. A UHF wind profiler for the boundary layer: Brief description and initial results. J. Atmos. Oceanic Technol. 1988;5:432–441.
7. Gage KS, Balsley BB, Ecklund WL, Carter DA, McAfee JR. Wind profiler-related research in the tropical pacific. J. Geophys. Res. 1991;96:3209-3220.
8. Ishihara M, Kato Y, Abo T, Kobayashi K, Izumikawa Y. Characteristics and
performance of the operational wind profiler network of the Japan Meteoro-logical Agency. J. Meteor. Soc. Japan; 2006.
9. Dolman BK, Reid IM, Tingwell C. Stratospheric tropospheric wind profiling radars in the Australian network. Earth Planets Space. 2018;70:170.
10. Tim Oakley, John Nash. The challenges for an operational wind profiler remote and unattended. 13
th Symposium on meteoro-
logical observations and instrumentation, USA; 2005.
11. Tian Y, Lü D. Comparison of Beijing MST radar and radiosonde horizontal wind measurements. Adv. Atmos. Sci. 2017;34:39.
12. Farley DT, Balsley BB, Swartz WE, La Hoz C. Tropical winds measured by the Arecibo radar. J. Appl. Meteor. 1979;18:227-230.
13. Fukao S, Sato T, Yamasaki N, Harper RM, Kato S. Winds measured by a UHF Doppler radar and rawinsondes: Comparisons made on twenty-six days (August–September 1977) at Arecibo, Puerto Rico. J. Appl. Meteorol. 1982;21: 1357–1363.
14. Larsen MF. Can a VHF doppler radar provide synoptic wind data? A comparison of 30 days of radar and radiosonde data. Mon. Weather Rev. 1983;111:2047–2057.
15. Vincent RA, May PT, Hocking WK, Elford WG, Candy B, Briggs BH. First results with the Adelaide VHF radar: Spaced antenna studies of tropospheric winds. J. Atmos. Terr. Phys.1987;49:353-366.
16. Belu RG, Hocking WK, Donaldson N, Thayaparan T. Comparisons of CLOVAR wind profiler horizontal winds with radiosondes and CMC regional analyses. Atmos.–Ocean. 2001;39:107–126.
17. Luce H, Fukao S, Yamamoto M, Sidi C, Dalaudier F. Validation of winds measured by MU radar with GPS radiosonde during the MUTSI campaign. J. Atmos. Oceanic Technol. 2001;18:817–829.
18. Engler N, Singer W, Latteck R, Strelnikov B. Comparison of wind measurements in the troposphere and mesosphere by VHF/MF radars and in‐situ techniques. Ann. Geophys. 2008;26:3693–3705.
19. White AB, Fairwell CW, Thompson DW. Radar observations of humidity variability in and around the marine atmospheric boundary layer. J. Atmos. Oceanic Technol. 1991;8:639-658.
Satyavani et al.; AJARR, 8(1): 22-35, 2020; Article no.AJARR.54286
35
20. Rogers RR, Ecklund WL, Carter DA, Gage KS, Ethier SA. Research applications of a boundary‐layer wind profiler. Bull. Am. Meteorol. Soc. 1993;74:567–580.
21. May PT, Wilczak JM. Diurnal and seasonal variations of boundary layer structure observed with a radar wind profiler and RASS. Mon. Weather Rev. 1993;121:673–682.
22. Angevine WM, White AB, Avery SK. Boundary layer depth and entrainment zone characterization with a boundary-layer profiler. Boundary Layer Meteor. 1994;68:375–385.
23. Hashiguchi H, Fukao S, Tsuda T, Yamanaka MD, Tobing DL, Sribimawati T, Harijono SWB, Wiryosumarto H. Observations of the planetary boundary layer over equatorial Indonesia with an L-band clear-air Doppler radar: Initial results. Radio Sci.1995;30:1043–1054.
24. Grimsdell AW, Angevine WM. Convective boundary layer height measurement with wind profilers and comparison to cloud
base. J. Atmos. Oceanic Technol. 1998;15: 1331–1338.
25. Stull RB. An introduction to boundary layer meteorology. Kluwer Academic Publishers, London; 1988.
26. Naveen Kumar V, Brahmanandam PS, Purnachandra Rao M, Anil Kumar G, Samatha K, Rupa Dhanasri L. A study of atmospheric boundary layer (ABL) height estimation using various analytical methods- COSMIC RO measured temperature profiles. Indian J. Science and Technology. 2018;31:1-12.
27. Liu S, Liang XZ. Observed diurnal cycle climatology of planetary boundary layer height. Journal of Climate. 2010;23:5790–5807.
28. Venkat Ratnam M, Pravallika N, Ravindra Babu S, Basha G, Pramitha M, Krishna Murthy BV. Assessment of GPS radiosonde descent data. Atmos. Meas. Tech. 2014;7:1011–1025. Avaulable:https://doi.org/10.5194/amt-7-1011-2014
© 2020 Satyavani et al.; This is an Open Access article distributed under the terms of the Creative Commons Attribution License (http://creativecommons.org/licenses/by/4.0), which permits unrestricted use, distribution, and reproduction in any medium, provided the original work is properly cited.
Peer-review history: The peer review history for this paper can be accessed here:
http://www.sdiarticle4.com/review-history/54286