low standard bitumen surfaced roads in kenya: a case study on
TRANSCRIPT

Low Standard Bitumen Surfaced Roads in Kenya: A Case Study on
Mackenzie – Kandara (D415) Road
Albert Ndege & J.M. Mbarua
Ministry of Transport and Infrastructure
Materials Testing & Research Division
Address: 11873 – 00400 Nairobi
Emails: [email protected] & [email protected]
Abstract
Roads impose logistical, technical and financial burden on most agencies in the sub-
sector due to constraints on physical, human, financial and natural resources.
Substantial length of un-surfaced, particularly gravel feeder roads in Kenya is
increasingly becoming difficult to sustain.
While use of the conventional designs and construction procedures needs to be adhered
to, development and application of relaxed specifications in building of LVSRs has
better economic and environmental value compared to the traditional gravelling.
The Kenya Road Design Manual, Part III classifies Roads which carry traffic less than
500,000 cumulative equivalent standard axles (ESA) as Low Standard Bitumen Surfaced
Roads. These roads are also known as Low Traffic Volume Sealed Roads (LVSRs).
Mackenzie – Kandara (D415) Road was a 6.7km road constructed under the AfD/GoK
Roads 2000 Programme in Central Kenya as a trial section to a single layer pavement
standard, using labour intensive methods and utilizing different stabilizers and
materials under eleven (11) different sections to aid the development of design
standards and construction specifications for LVSRs.
The performance of the trial section was studied under the base line evaluation
indicated initial success in many aspects of the project. Level controls and construction
thickness tolerances were however not uniformly achieved in the project with the
subgrade not performing as expected.
Compared to the conventional gravelling of low traffic volume roads, the project
objectives were met with the cold mix asphalt surfacing effectively protecting the
pavement and subgrade layers from traffic and environmental effects.
The findings from this trials and other research backed by the provisions of Chapter 12
and 13 of the RDM III, culminated in the development of Design Guidelines for Low
Volume Sealed Roads in June, 2014 by Materials, Testing and Research Division, under
the Ministry of Transport and Infrastructure, which is expected to enhance effectiveness

ii | P a g e
and sustainability in implementing the LVSRs initiatives and have been used to
complement the phase II of the Roads 2000 Programme in central Kenya.
The design guideline has proved very useful in the implementation of the
Government’s Roads 10,000Km Programme. A total of over 3,000Km has been designed
using the guidelines and some LVSRs have been tendered.
Key Words:
Low Volume Sealed Roads, Equivalent Standard Axles, Cold Asphalt, Composite Bitumen
Emulsion, Hand Packed Stones and Design Guidelines

iii | P a g e
Table of Contents
Abstract…… .................................................................................................................................. i
Table of Contents ....................................................................................................................... iii
List of Tables ................................................................................................................................ v
List of Figures ............................................................................................................................. vi
Abbreviations and Acronyms ................................................................................................. vii
Section 1: Introduction ........................................................................................................... 1
1.1 Background ............................................................................................................................... 1
1.2 Study Objectives ....................................................................................................................... 1
Section 2: Pavement Design Review .................................................................................... 3
2.1 Design Pavement Standard .................................................................................................... 3
2.2 Design Sections ......................................................................................................................... 3
Section 3: Pavement Construction Review ......................................................................... 5
3.1 General ....................................................................................................................................... 5
3.2 Pavement Materials Properties .............................................................................................. 5
3.3 Achieved Results ...................................................................................................................... 7
Section 4: Pavement Condition Study ................................................................................. 9
4.1 Evaluation Criteria ................................................................................................................... 9
4.2 Traffic Studies ........................................................................................................................... 9
4.2.1 Traffic Counts ................................................................................................................ 9
4.2.2 Equivalence factor (E.F.) and Daily Equivalent Standard Axles (DESA) ............ 10
4.2.3 Traffic Growth Rate ..................................................................................................... 10
4.2.4 Cumulative Equivalent Standard Axles .................................................................. 11
4.3 Pavement Deflection measurement ..................................................................................... 11
4.3.1 FWD deflection test method and analysis ............................................................... 11
4.3.2 Determination of Homogenous Sections ................................................................. 12
4.3.3 Pavement deflection bowl and pavement strength ................................................ 13
4.3.4 Pavement residual life and strength ......................................................................... 14
4.3.5 Strengthening Requirements ..................................................................................... 15

iv | P a g e
4.4 Roughness Measurements .................................................................................................... 16
Section 5: Discussion, Conclusion and Recommendations ........................................... 18
5.1 Discussion on Study Findings .............................................................................................. 18
5.2 Conclusions ............................................................................................................................. 19
5.3 Recommendations .................................................................................................................. 19

v | P a g e
List of Tables
Table 4.1: Average Daily Traffic on Mackenzie – Kandara Road (D415) ......................... 9
Table 4-2: Daily Equivalent Standard Axles on Mackenzie – Kandara Road (D415) .. 10
Table 4-3: CESA on Mackenzie – Kandara Road (D415) ................................................... 11
Table 4-4: Pavement Layers’ Elastic Moduli of Homogenous Sections ......................... 14
Table 4-5: Pavement Residual Life of Homogenous Sections .......................................... 14
Table 4-6: Strengthening Requirements ............................................................................... 15
Table 4-7: Roughness (IRI) on Mackenzie – Kandara Road ............................................. 16

vi | P a g e
List of Figures
Figure 4-1: Graphs of Homogenous Sections from Cumulative Difference Method ....... 12
Figure 4-1: Deflection Bowls of Homogenous sections on D415 ........................................ 13

vii | P a g e
Abbreviations and Acronyms
AADT: Average Annual Daily Traffic AC: Asphalt Concrete ADT: Average Daily Traffic AHGV: Articulated Heavy Goods Vehicle BS: British Standards CBR: California Bearing Ratio CESA: Cumulative Equivalent Standard Axles CIG: Cement Improved Gravel DCP: Dynamic Core Penetrometer DESA: Daily Equivalent Standard Axles DSD: Double Surface Dressing EF: Equivalence Factor ESALs: Equivalent Standard Axles FDD: Field Dry Density FWD: Falling Weight Deflectometer HGV: Heavy Goods Vehicles KeRRA: Kenya Rural Roads Authority LGV: Light Goods Vehicles LVSR: Low Volume Sealed Road LHS: Left Hand Side LIG: Lime Improved Gravel MDD: Maximum Dry Density MG: Medium Goods vehicles mm: Millimeters NGR: Natural Gravel OMC: Optimum Moisture Content PI: Plasticity Index RC: Relative Compaction RDM: Road Design Manual RHS: Right Hand Side RMC: Relative Moisture Content TRL: Transport Research Laboratories VEF: Vehicle Equivalence Factor.

1 | P a g e
Section 1: Introduction
1.1 Background
The Kenya Road Design Manual, Part III classifies Sealed Roads which carry traffic less than
500,000 cumulative equivalent standard axles (ESA) as Low Standard Bitumen Surfaced Roads.
These roads are also known as Low Traffic Volume Sealed Roads (LVSRs). The two terms are
interchangeably used in this paper.
While use of the conventional designs and construction procedures needs to be adhered to,
development and application of relaxed specifications in building of LVSRs has better economic
and environmental value compared to the traditional gravelling.
Mackenzie – Kandara (D415) Road was constructed under AfD/GoK Roads 2000 Programme in
Central Kenya as a trial section to a single layer pavement standard, using labour intensive
methods on eleven (11) different trial sections, utilizing different materials and soil treatment
agents.
The objectives of the project were as follows:
(i) To construct sealed pavement for low traffic volume instead of the conventional
gravel wearing course;
(ii) To implement labour intensive pavements and surfacing construction methods;
(iii) To compare performance of alternative stabilizers with cement and lime;
(iv) To determine performance of low volume sealed pavement constructed by labour;
(v) To develop specifications for surfaced low traffic volume pavements constructed by
labour.
Compared to the conventional gravelling of low traffic volume roads, the project objectives
were met.
1.2 Study Objectives
The objectives of the case study were as follows:
(i) To carry out design review of the trial section;

2 | P a g e
(ii) To carry out pavement construction review; and
(iii) To determine the performance of the trial section.

3 | P a g e
Section 2: Pavement Design Review
2.1 Design Pavement Standard
The design of the project road was based on Chapter 12 & 13 of the RDM Part III and other
technical guidelines and adopted the following standards:
i. Subgrade
The adopted design subgrade was Class S3 and achieved by improving the in-situ red clay with
200mm of existing gravel wearing course (S4 quality material).
ii. Pavement Layers
A single layer pavement standard was adopted for the trial section using materials tabulated
below for respective cumulative length of the trial sections. The minimum design base thickness
was 100mm and constructed to subbase standard with a cold asphalt mix surfacing of 15mm
thickness across the entire trial section.
Pavement Material Design Layer Thickness (mm)
Cumulative Length (Km)
Natural Gravel 200 2.0 Cement Improved Gravel 100 1.0 Composite Bitumen Emulsion Treated Gravel 100 1.0 Consolid System Treated In situ Material 100 1.7 Hand Packed Stones 150 1.0
2.2 Design Sections
The length of each section and the corresponding pavement materials were as shown in the
table below.
Trial
Section
Chainage Type of Pavement Structure From To
1 0+000 0+100 Consolid Improved Gravel (Demonstration)
2 0+100 0+700 Cement Improved Grave (CIG)

4 | P a g e
3 0+700 0+940 Emulsion Treated Gravel (ETG) (Demonstration)
4 0+940 1+120 Composite - Emulsion Treated Gravel + Cement
Improved Gravel (ETG/CIG)
5 1+120 1+560 Cement Improved Gravel (CIG)
6 1+560 2+200 Composite - Emulsion Treated Gravel + Cement
Improved Gravel (ETG/CIG)
7 2+200 3+220 Consolid Improved Gravel + Red soil
8 3+220 4+000 Neat Gravel (NG)
9 4+000 5+760 Composite - Emulsion Treated Gravel + Cement
Improved Gravel (ETG/CIG)
10 5+760 6+260 Composite - Emulsion Treated Soft Stone + Cement
Improved Soft Stone (ETG/CIS)
11 6+260 6+780 Hand packed Stone (HPS)

5 | P a g e
Section 3: Pavement Construction Review
3.1 General
Construction of the trial section was achieved by both labour and equipment. The subgrade was
mechanically stabilized using gravel residue of existing gravel wearing course and constructed
by machine while the base and the surfacing were constructed by labour.
3.2 Pavement Materials Properties
The following are the properties of the materials utilized in the construction of each section of
the trial section.
Trial Section 1: Consolid System Improved Gravel (0+000-0+100)
Subgrade: Consolid liquid treated red clay (2cc of C444) of 15% 4 days soak CBR and PI of 27%.
Base: Consolid Improved gravel, neat CBR of 50% PI of 18%. The improvement was done using
a combination of 2cc Consolid liquid (C444) and 2% Consolid Solidry powder.
Trial Section 2: Cement Improved Gravel (0+100 – 0+700)
Subgrade: 4 days soak CBR ranging between 8% - 15% and maximum PI of 27%.
Base: 2% Portland Pozzolanic Cement (PPC) improved gravel of neat CBR of 50% and PI of
18%.
Trial Section 3: Emulsion Treated Gravel (ETG) (0+700 – 0+940)
Subgrade: 4 days soak CBR ranging between 8% - 15% and maximum PI of 25%.
Base: 1.5% A4-60 emulsion and 1% cement treated gravel, neat CBR of 33% and PI of 18%.
Trial Section 4: Composite - Emulsion Treated Gravel + Cement Improved Gravel
(ETG/CIG) (0+940 – 1+120)
Subgrade: 4 days soak CBR ranging between 10% - 17% and maximum PI of 25%.
Base: Composite of 1.5% A4-60 emulsion, 1% lime and 1% cement Emulsion treated gravel, neat
gravel CBR of 33% and PI of 18%.

6 | P a g e
Trial Section 5: Cement Improved Gravel (1+120 – 1+560)
Subgrade: 4 days soak CBR between 6% - 17% and maximum PI of 26%.
Base: 2% Pozzolanic Cement treated gravel, neat CBR of 33% and PI of 18%.
Trial Section 6: Composite - Emulsion Treated Gravel + Cement Improved Gravel
(ETG/CIG) (1+560 – 2+200)
Subgrade: 4 days soak CBR between 9% - 15% and maximum PI of 23%.
Base: Composite of 1.5% A4-60 emulsion, 1% lime and 1% cement treated gravel (33mm) on top
of neat gravel (67mm), neat gravel CBR of 40% and PI of 19%.
Trial Section 7: Consolid System Improved Gravel (2+200– 3+220)
Subgrade: Insitu red clay of 4 days soak CBR between 9% - 15% and PI of 24% and treated with
2cc of C444 Consolid liquid.
Base: Consolid Improved (2cc Consolid liquid (C444) and 2% Consolid Solidry powder) Insitu
gravel wearing course, neat CBR of 21% PI of 23%.
Trial Section 8: Neat Gravel base section (3+220 – 4+000)
Subgrade: 4 days soak CBR between 11% - 23% and maximum PI of 27%.
Base: Neat gravel of CBR of 33% - 36% and PI of 17% constructed in two layers of 100mm each.
Trial Section 9: Cement Improved Gravel (4+000 – 5+760)
Subgrade: 4 days soak CBR between 15% and maximum PI of 27%.
Base: Cement treated gravel, neat CBR of 40% and PI of 19%. The base was improved with 2%
Pozzolanic Cement.
Trial Section 10: Composite - Emulsion Treated Soft Stone + Cement Improved Soft Stone
(ETG/CIS) (5+760 – 6+260)
Subgrade: CBR (4 days soak) of 16%.
Base: Composite of 1.5% A4-60 emulsion, 1% lime and 1% cement treated gravel (33mm) on top
of neat soft stone (67mm), CBR of 39% and PI of 18%.

7 | P a g e
Trial Section 11: Hand Packed Stone (6+200 – 6+700)
Subgrade: In-situ black clay mechanically stabilized with gravel residue of the existing gravel
wearing course.
Base: Hand Packed Stone base with Non plastic fines from LAA constructed to a thickness of
150mm and 50mm Emulsion treated gravel of neat CBR of 40 and PI of 19%.
Surfacing Trial: Cold Asphalt Mix Surfacing
The surfacing was laid to a uniform compacted thickness of 15mm on all the sections. Aggregate
gradation of 0/6mm was used with K3-65 emulsion binder.
Coal Prime – E emulsion, manufactured by Colas East Africa was used as the primer instead of
conventional MC30.
3.3 Achieved Results
The constructed thickness of each section together with laboratory and field quality control tests
achieved on the project were as follows:
Trial Section
Control Parameters Achieved
Thickness (mm) CBR%
Consolid Improved Gravel 150 80
Cement Improved Grave (CIG) 85 - 115 110
Emulsion Treated Gravel (ETG) 75 - 90 42
Composite - Emulsion Treated Gravel + Cement
Improved Gravel (ETG/CIG)
87 - 105
120
Cement Improved Gravel (CIG) 70 -100 62 - 85
Composite - Emulsion Treated Gravel + Cement
Improved Gravel (ETG/CIG)
85 - 110
85 - 89
Consolid Improved Gravel + Red soil 100 – 140 61 - 63
Neat Gravel (NG) 80 – 112 per layer 36 - 37
Composite - Emulsion Treated Gravel + Cement
Improved Gravel (ETG/CIG)
90 - 140
67 - 110

8 | P a g e
Composite - Emulsion Treated Soft Stone +
Cement Improved Soft Stone (ETG/CIS)
85 – 130
240
Hand packed Stone (HP) 150 N/A

9 | P a g e
Section 4: Pavement Condition Study
4.1 Evaluation Criteria
Base line study was carried out in July 2012 and included both structural and functional aspects
of the trial section. Data related to the following activities were collected and analyzed.
i. Traffic Studies including Classified Axle load and traffic counts;
ii. Deflection Measurements using Falling Weight Deflectometer;
iii. Surface Condition Survey
4.2 Traffic Studies
4.2.1 Traffic Counts
The traffic counts were carried out on the trial road at Mackenzie between 7th and 12th July,
2012. The computed average daily traffic (ADT) from the data which consisted of a five-day 12
hour count and one-day 24 hour counts is summarized in the table below.
The 12 hour counts were converted to 24 hour counts using a 24/12hour ration determined
from the study.
Table 4.1: Average Daily Traffic on Mackenzie – Kandara Road (D415)
Vehicle Type
DAY OF THE WEEK
TOTAL ADT Tue Wed Thu Fri Sat Sun
Non-Motorized traffic (NMT)
Others 7 1 14 6 10 13 51 9
Bicycles 413 462 377 325 326 319 2220 370
Motorized traffic
Motor bikes 597 640 566 465 540 492 3300 550
Cars 68 57 48 42 56 36 306 51
Vans/Matatus 156 95 127 123 180 146 827 138

10 | P a g e
Small Trucks 0 0 8 6 6 4 24 4
Motorized Commercial Vehicles (MCV)
Buses 8 0 6 3 0 0 17 3
MGV 18 11 18 33 27 2 108 18
HGV 0 3 3 0 2 32 39 7
AHGV 0 0 0 0 1 1 2 0
TOTAL 1265 1268 1167 1003 1147 1044 6894 1149
Based on the motorized traffic, the ADT on Mackenzie – Kandara trial section was found to be
770 vehicles per day of which 3.6% are commercial vehicles.
4.2.2 Equivalence factor (E.F.) and Daily Equivalent Standard Axles (DESA)
The equivalence factors used in the traffic analysis for Mackenzie – Kandara were derived from
the Road Design Manual Part III.
Table 4-2: Daily Equivalent Standard Axles on Mackenzie – Kandara Road (D415)
Vehicle Type ADT E.F DESA BUS 3 1.0 3 HGV 18 1.0 18 MGV 7 4.0 26
A-HGV 0 4.0 1 TOTAL 28 48
Design traffic loading of 38 was adopted for the pavement analysis based on the assumption
that the central strip is trafficked by 80% of all commercial vehicles.
4.2.3 Traffic Growth Rate
The annual traffic growth rate for this road was estimated at 5.0% based on Gross Domestic
Product from 1961 to 2009 as given in World Bank, World Development Indicators - Updated in
December 22, 2010

11 | P a g e
4.2.4 Cumulative Equivalent Standard Axles
It was estimated that the trial section will carry 0.3 million cumulative equivalent standard axles
for a 15-year design period at 5.0% annual traffic growth rate. The calculated cumulative
equivalent standard axles for different design periods at various traffic growth rates were as
tabulated below.
Table 4-3: CESA on Mackenzie – Kandara Road (D415)
DESIGN
PERIOD
ANNUAL TRAFFIC GROWTH RATE
3.0% 4.0% 5.0% 6.0% 7.0% 8.0%
5 74,542 76,047 77,582 79,147 80,742 82,369
7 107,584 110,895 114,317 117,852 121,505 125,279
10 160,957 168,570 176,598 185,063 193,988 203,396
15 261,135 281,138 302,970 326,802 352,820 381,225
20 377,269 418,094 464,257 516,482 575,590 642,513
4.3 Pavement Deflection measurement
4.3.1 FWD deflection test method and analysis
Pavement deflection measurements were carried out using the Falling Weight Deflectometer
(FWD) on the road sections to determine the residual strength of the existing pavement.
Measurements were taken at intervals of approximately 100 m at an offset of about 0.6 m from
the edge of the carriageway, along the outer wheel paths.
The deflection data collected was used to identify homogenous sections along the road section
and to derive deflection bowls on each homogenous section. The data was then combined with
the existing pavement layer thicknesses, material properties and traffic loading characteristics
and analyzed using Rosy Design Software to determine the residual structural life, critical
layers and overlay requirements of the pavement.

12 | P a g e
4.3.2 Determination of Homogenous Sections
Cumulative sum of the difference from the mean of the central deflections, D0, was used to
identify the homogeneous sections. The cusum plot was as shown in Figure 4-1 below.
Figure 4-1: Graphs of Homogenous Sections from Cumulative Difference Method
From the graph above, eight homogenous section were identified on Mackenzie – Kandara
Road (D415) as Km 0+000 - Km 0+120, Km 0+120 - Km 0+580, Km 0+580 - Km 0+725, Km 0+725
- Km 1+430, Km 1+430 - Km 2+659, Km 2+659 - Km 5+200, Km 5+200 - Km 6+010 and Km6+010
- Km 6+780.
The homogenous sections shows overlap of different sections. This could be attributed to a
relatively comparable construction control parameters achieved from the different sections.

13 | P a g e
4.3.3 Pavement deflection bowl and pavement strength
The shape and form of the deflection bowl provides a comparative strength of the subgrade and
variation of strength in pavement layers for homogenous sections. The deflection bowls of
various homogenous sections were as shown below:
Figure 4-1: Deflection Bowls of Homogenous sections on D415
The following were deduced from the deflection bowls above:
a. The pavement layers at Km 0+750 - Km 1+430 are strongest as indicated by shallow
deflection bowl. This section overlaps both Composite Emulsion Treated gravel Section
and Cement Improved Section.
b. The pavement layers at Km 0+580 - Km 0+725 and Km 5+200 – Km 6+010 are weakest as
indicated by deepest deflection bowl. These sections covers mostly the Composite
Emulsion Treated Gravel + Cement Improved gravel and soft stone (Sections 9 &10).

14 | P a g e
The corresponding moduli of elasticity of pavement layers for the homogenous sections were as
shown in the table below.
Table 4-4: Pavement Layers’ Elastic Moduli of Homogenous Sections
Homogenous section
Elastic Modulus (MPa)
Surfacing Base Sub grade
Km 0+000 - Km 0+120 2076 888 163
Km 0+120 - Km 0+580 2987 1133 197
Km 0+580 - Km 0+725 1561 1057 140
Km 0+725 - Km 1+430 2365 1122 200
Km 1+430 - Km 2+659 1659 1137 162
Km 2+659 - Km 5+200 1758 1148 161
Km 5+200 - Km 6+010 1802 1019 157
Km6+010 - Km 6+780 2088 1175 180
Average (MPa) 2037 1085 170
The following were deduced from the average moduli of elasticity values:
a. Subgrade: The elastic moduli values indicate subgrade Classes S5 for all the sections
under in-situ moisture condition. This can be attributed to proper equipment compaction
for the subgrade.
b. Subbase: The elastic moduli values were above 300 MPa attributed to cement/lime
improved gravel subbase in all the sections under in-situ condition.
c. Surfacing: The cold mix asphalt surfacing achieved elastic moduli values between 1561 –
2987 MPa and were below the 4000MPa for hot mix AC in all the homogeneous sections.
4.3.4 Pavement residual life and strength
Table 4-5: Pavement Residual Life of Homogenous Sections
Homogenous section Residual Life (Years) Critical Layer
Km 0+000 - Km 0+120 2 3
Km 0+120 - Km 0+580 4 3
Km 0+580 - Km 0+725 2 3
15 | P a g e
Km 0+725 - Km 1+430 4 3
Km 1+430 - Km 2+659 3 3
Km 2+659 - Km 5+200 3 3
Km 5+200 - Km 6+010 3 3
Km6+010 - Km 6+780 3 3
Average (MPa) 3
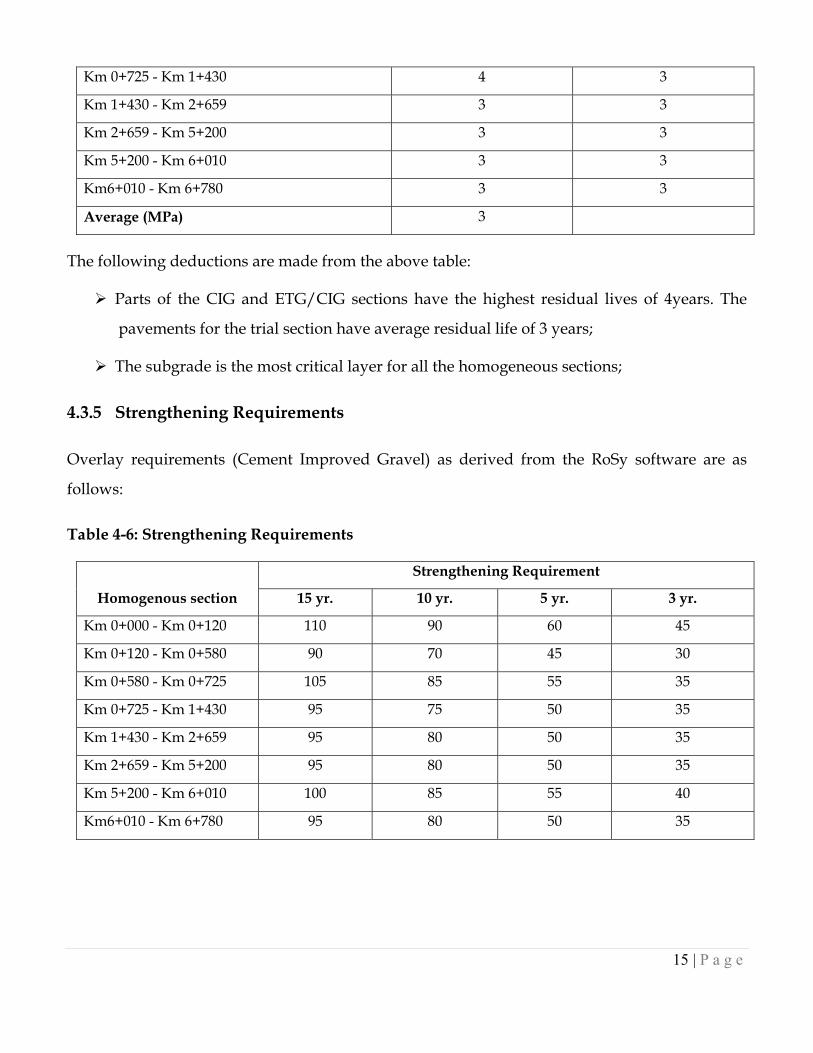
The following deductions are made from the above table:
Parts of the CIG and ETG/CIG sections have the highest residual lives of 4years. The
pavements for the trial section have average residual life of 3 years;
The subgrade is the most critical layer for all the homogeneous sections;
4.3.5 Strengthening Requirements
Overlay requirements (Cement Improved Gravel) as derived from the RoSy software are as
follows:
Table 4-6: Strengthening Requirements
Homogenous section
Strengthening Requirement
15 yr. 10 yr. 5 yr. 3 yr.
Km 0+000 - Km 0+120 110 90 60 45
Km 0+120 - Km 0+580 90 70 45 30
Km 0+580 - Km 0+725 105 85 55 35
Km 0+725 - Km 1+430 95 75 50 35
Km 1+430 - Km 2+659 95 80 50 35
Km 2+659 - Km 5+200 95 80 50 35
Km 5+200 - Km 6+010 100 85 55 40
Km6+010 - Km 6+780 95 80 50 35

16 | P a g e
4.4 Roughness Measurements
Different Roughness of roads with similar pavement construction is a good measure of the
relative pavement condition.
Most pavement defects contribute to increasing the roughness of the road pavement, either
directly from a deformed surface or indirectly as a result of repair work e.g. cracks and pot
holes. Changes in roughness over time are an indicator of pavement distress taking place.
Roughness measurements were done using MERLIN meter on all the wheel paths of every
section and summarized in table 4.6 below:
Table 4-7: Roughness (IRI) on Mackenzie – Kandara Road
Chainage
Outer Section Inner Section
RHS LHS RHS LHS
Km 0+040 - Km -0+060 4.0 4.0
Km 0+040 - Km 0+600 5.1 4.9 4.8 5.5
Km 0+600 - Km 0+870 4.8 4.6 4.9 4.8
Km 0+790- Km 1+060 4.9 4.8 4.8 4.6
Km 1+060 - Km 1+500 4.6 4.8 4.5 4.8
Km 1+580 - Km 2+070 5.3 5.0 4.5 4.5
Km 2+200 - Km 2+640 5.6 5.1 4.7 4.9
Km 2+700 - Km 3+150 4.8 4.9 5.4 4.7
Km 3+180 - Km 3+650 4.9 4.4 4.4 4.8
Km 3+700 - Km 3+950 5.2 4.9 5.2 4.7
Km 3+990 - Km 4+500 5.0 5.1 4.8 5.4
Km 4+500 - Km 4+940 4.7 5.0 5.3 5.3
Km 5+050 - Km 5+500 5.2 5.4 5.3 5.1
Km 5+500 - Km 6+200 5.4 5.5 5.4 5.4
Km 6+200 - Km 6+700 5.8 6.1 6.1 5.7
Average 5.0 5.0 5.0 5.0

17 | P a g e
The road IRI values achieved for all the sections indicates a fair serviceability rating with the
first section on Consolid achieving the lowest IRI. The hand packed stone section had the
highest IRI value indicating a poor serviceability rating.

18 | P a g e
Section 5: Discussion, Conclusion and Recommendations
5.1 Discussion on Study Findings
The performance of the trial section studied under the base line evaluation indicated
initial success in many aspects of the project.
Changes in traffic pattern is not anticipated on the trial section with the 15 years post
construction traffic projection at below 0.5 million cumulative equivalent standard axles
(Traffic Class T5) for the trial section.
The road section construction was achieved through labour intensive methods. The
construction control parameters such as compaction and mixing were achieved. There
was however difficulties in achieving tolerances due to manual construction level
control.
The constructed base layer in all the sections achieved results complying with subbase
construction specifications except in the first section of the Emulsion treated gravel
which recorded a 42% CBR. The achieved Plasticity Index did not uniformly comply
with the requirement of 5 – 12 % and maximum 15% on improved and neat subbase
material respectively.
The road IRI values achieved for all the sections indicates a fair serviceability rating
with the first section on Consolid achieving the lowest IRI. The hand packed stone
section had the highest IRI value indicating a poor serviceability rating. The IRI rating
achieved is attributed to irregular surface finish resulting from the manual control of
levels.
From the structural survey carried out, the road section with Consolid had the lowest
residual life of 2 years while the cement improved gravel section has the highest
residual life of 4 years.

19 | P a g e
The road sections with cement improved gravel subbase have considerable subbase
strength as compared to the other sections. The section with Emulsion Treated Gravel
has the least strength as indicated by lower elastic moduli.
The subgrade soils had soaked CBR values ranging from 8% - 25% indicating minimum
subgrade class S2, while the design subgrade was class S3. In in-situ condition the
subgrade materials have average strength of subgrade class S5 as determined from the
deflection measurements indicating that proper compaction of the subgrade. However
the subgrade, based on analysis is most critical indicating inadequacy in strength to
support the pavement layer for the road design life.
5.2 Conclusions
The following are conclusions from the pavement evaluation:
i) Cement treated sections performs better than the rest of the sections. The cement
improved gravel yielded better strength qualities than the non-conventional
stabilizer sections.
ii) The constructed subgrade did not achieve the design subgrade specification as
the pavement analysis indicated that the subgrade was the most critical layer.
iii) The construction pavement thickness tolerances and level controls were not
achieved by labour.
5.3 Recommendations
Further monitoring of the section should be carried out at six months, one year, two
years and five years and the results compiled to derive conclusive construction
specifications for labour intensive low cost bitumen surfaced pavements.
Further research on the construction technique and the cold mix asphalt need to be
carried out to complement this research.
Strict quality control at implementation stage for future trial sections.

20 | P a g e
References
World Bank (2010): World Development Indicators, Nairobi Kenya
CSIR (2002): Technical Guideline, a Guideline for the Design and Construction of Bitumen
Emulsion and Foamed Bitumen Stabilised Materials: Asphalt Academy, South Africa
Road Design Manual Part III (1987): Materials and Pavement Design for New Roads, Kenya
Road Design Manual Part V (1987): Rehabilitation and Overlay Design, Kenya