low-power task scheduling for gpu energy...
TRANSCRIPT
Low-power Task Scheduling for GPU Energy Reduction
Li Tang, Yiji ZhangDepartment of Computer Science and Engineering, University of Notre Dame
Abstract—Graphics processing units (GPU) have been in-tensively used by high-performance computing applications.However, GPU’s large power consumption is a big issuecoexisting with the high parallelism. Although Dynamic Voltageand Frequency Scaling (DVFS) [1] has been heavily studied andsuccessfully applied to real products for saving CPU powerconsumption, DVFS is still relatively new for GPU energystudies. The lack of DVFS and other power managementschemes on the GPU also makes its large power consumptionsignificant in recent computer systems. In this OperatingSystem course project, we propose a low-power scheme forGPU energy reduction. This project can be decomposed toGPU DVFS implementation and GPU linear regression powermodel. For enabling the DVFS on GPU, the settings of voltageand frequency in open-source Nouveau GPU driver [7] hasbeen studied. For supporting the DVFS choosing voltage andfrequency levels, a GPU linear regression power model hasbeen built and evaluated.
I. INTRODUCTION
With the continuous technology scaling, traditional single-core architecture is not able to help people hold Moore’sLaw [4]. Therefore, multi-core even many-core architecturesare deployed to further improve the processor performance.GPU, a typical single instruction multi data (SIMD) archi-tecture, possesses the capability of containing more than 500processing cores [6]. The large number of processing corespermits extremely high parallelism for some applications.However, unfortunately, these cores are inevitable to bringus high power consumption. So it is very imperative todevelop a efficient power management on GPU for reducingthe GPU power consumption. This is also the motivation ofthis project.
Power management techniques can be sorted into statictechnique and dynamic technique [15]. DVFS is a dynamicpower management technique in computer architecture anda method to provide variable amount of energy for a task byscaling the operating voltage/frequency. The basic motiva-tion for dynamic voltage and frequency scaling is capturedby the equations below:
P = α ∗CV 2F (1)
E = P∗ t = α ∗CV 2F ∗ t (2)
From these equations, the conclusion we can draw is thatsimply lowering the frequency can not necessarily lower thepower, because F ∗ t is a constant value for a given task.
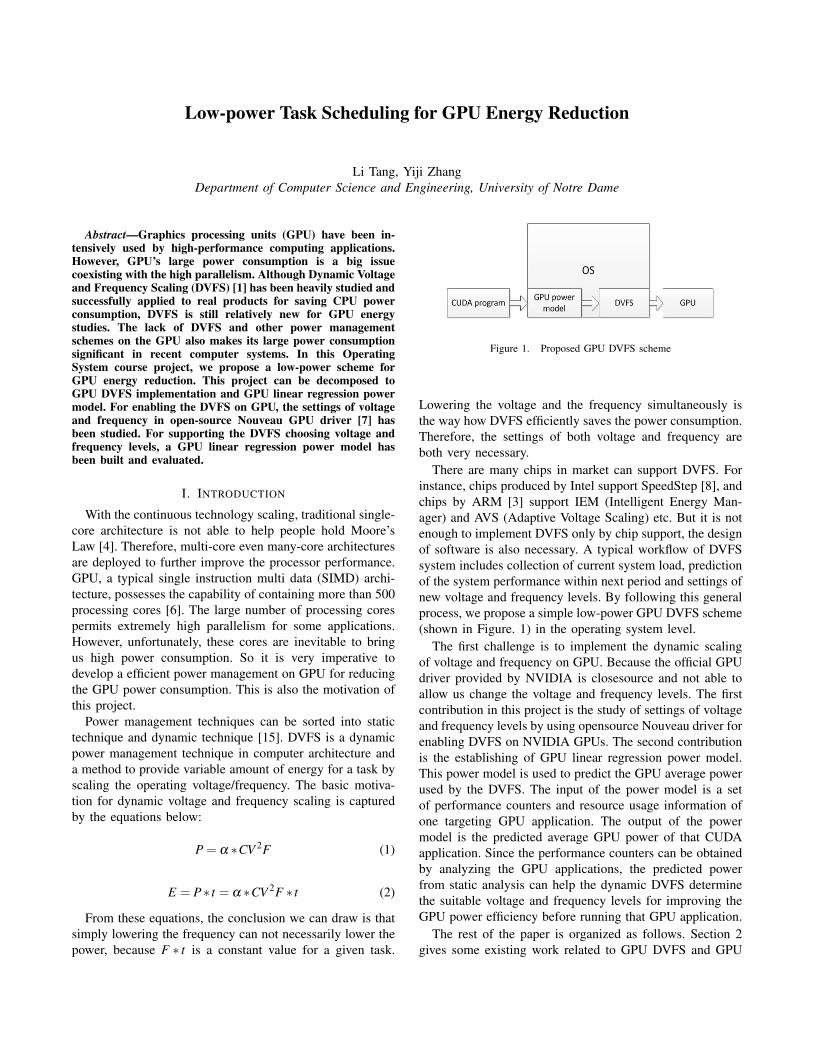
Figure 1. Proposed GPU DVFS scheme
Lowering the voltage and the frequency simultaneously isthe way how DVFS efficiently saves the power consumption.Therefore, the settings of both voltage and frequency areboth very necessary.
There are many chips in market can support DVFS. Forinstance, chips produced by Intel support SpeedStep [8], andchips by ARM [3] support IEM (Intelligent Energy Man-ager) and AVS (Adaptive Voltage Scaling) etc. But it is notenough to implement DVFS only by chip support, the designof software is also necessary. A typical workflow of DVFSsystem includes collection of current system load, predictionof the system performance within next period and settings ofnew voltage and frequency levels. By following this generalprocess, we propose a simple low-power GPU DVFS scheme(shown in Figure. 1) in the operating system level.
The first challenge is to implement the dynamic scalingof voltage and frequency on GPU. Because the official GPUdriver provided by NVIDIA is closesource and not able toallow us change the voltage and frequency levels. The firstcontribution in this project is the study of settings of voltageand frequency levels by using opensource Nouveau driver forenabling DVFS on NVIDIA GPUs. The second contributionis the establishing of GPU linear regression power model.This power model is used to predict the GPU average powerused by the DVFS. The input of the power model is a setof performance counters and resource usage information ofone targeting GPU application. The output of the powermodel is the predicted average GPU power of that CUDAapplication. Since the performance counters can be obtainedby analyzing the GPU applications, the predicted powerfrom static analysis can help the dynamic DVFS determinethe suitable voltage and frequency levels for improving theGPU power efficiency before running that GPU application.
The rest of the paper is organized as follows. Section 2gives some existing work related to GPU DVFS and GPU

power modeling. Section 3 presents the DVFS background.In section 4, we show some basic designs on the GPUDVFS. For supporting the GPU DVFS implementation, aGPU linear regression power model is presented in section5. After that, the model has been evaluated in the section 6.We also draw the conclusion in section 7.
II. RELATED WORK
Comparing to new GPU DVFS, CPU DVFS is well-studied. B. Lin et al in [1] develop and evaluate twonew, independently-applicable power reduction techniquesfor power management on processors DVFS: user-driven fre-quency scaling (UDFS) and process-driven voltage scaling(PDVS). The main contribution of these techniques is thatUDFS leads to lower average frequencies and PDVS allowsgreat decreases in voltage at low frequencies. Y. Liu et alin [2] propose design-time thermal optimization techniquesfor embedded systems by carefully planning DVFS at designtime. The main contribution is that they provide a frameworkfor system designers to determine a proper thermal solutionand provide a lower bound on the minimum temperatureachievable by DVFS. In this project, the main goal is tocrack the settings of voltage and frequency on our NVIDIAGPU.
For the GPU power model, X. Ma in [10] presents a sta-tistical power analysis and modeling scheme for GPU-basedcomputing. The model can estimate the near future runtimepower by dynamically obtaining power consumption, run-time performance, and dynamic work-loads of GPUs. Themain contribution of the scheme is that the scheme cantell users the power consumption estimation during GPUruntime, and it can be used for dynamically optimization.H. Nagasaka in [13] presents a statistical approach forestimating power consumption of GPU programs. The maindifference between this work and [10] is that this estimationonly works after the execution of GPU programs. In thisproject, we use a method similar with [13] to predict theGPU power for supporting the GPU DVFS. The differenceis we only consider four main GPU components which areinstruction units, global memory, register files and sharedmemory for building the GPU power model.
III. DVFS BACKGROUND
A. DVFS implementation on CPU
There are many DVFS implementation on CPU, whichcan be regarded as reference when considering implementingDVFS on GPU. The implementation can be based on soft-ware or hardware. Software-based implementation of DVFSis done as follows. First, hooks are placed in kernel systemcalls of the operating system to collect the informationof system call and thereby calculate the system load. Forexample, Scheduler and Timer are the two most commonplaces for hooks to be placed, which are used to record theexecution time of each task, and how long the time is when
Figure 2. DVFS Hardware Mechanism
a task actively takes rest, respectively. Second, prediction ofthe system load in the next period of time should be madeusing the current system load and specific algorithm. Asfor hardware-based implementation of DVFS, it improvesthe accuracy of system load calculating. In addition, it alsoreduces the burden of CPU for keeping track of system loadand performance prediction. The drawback is that it is notflexible to choose prediction algorithm, and this can be madeup to some extent by setting different prediction parameters.Taking i. MX31 by Freescale Semiconductor Company asan example, Figure 2 shows the DVFS hardware mechanismin i.MX3.
In Figure 2, CCM stands for Clock Control Module,which is responsible for adjusting CPU frequency. PMICis Power Management IC, which provides CPU voltage.The chip has two interfaces for CPU: the common SerialProgrammable Interface (SPI) and Dynamic Voltage Scaling(DVS). The later interface consists of two lines, and differentstates of line indicate different voltage levels: 00 means nochange on voltage; 01 means that the voltage increases byone unit; 10 means decreasing by one unit; and 11 meansthe voltage increase to maximum.
B. DVFS implementation on GPU
According to publicly available documentation [9]on NVIDIAs implementation of DVFS, there are twopredefined performance levels for their GPUs: Idleand MaximumPer f ormance. A third performance levelHDVideo is designed for mobile GPU devices. TheMaximumPer f ormance setting fixes the clock speeds to thehighest setting to achieve the best possible performance. Inthe Idle setting, on the other hand, when the driver detectsthat the GPU is idling, it will automatically lower down thefrequencies of the GPU cores and memory to the pre-definedIdle level, which is just enough for the display to work.Once the driver sees a computational kernel that is readyto be executed, the driver will increase the clocks up to thehighest level set by user. NVIDIA provide frameworks [9]that allow the upper limit on the frequency and voltage to be

Figure 3. Typical DVFS Procedure
scaled by users. In particular, the core clock of the NVIDIAGTX 280 can be set between 300 MHz and 700 MHz whilethe memory clock can be set to any value between 300 MHzand 1200 MHz.
IV. DVFS DESIGN
A. Theory
A typical DVFS procedure has five steps. Step 1 collectsthe signals which are related to system load, and calculatethe system load. This process can be implements by softwareor hardware. Step 2 predicts the system performance of nextperiod based on current system load. There are differentalgorithms that can be applied in this step, and the choiceof algorithm should be decided by the application. Step3 transfers the performance to frequency, and adjusts thesetting of frequency. Step 4 calculates the voltage by thenew frequency. Step 5 resets the voltage and frequency. Thewhole workflow is shown in Figure 3
B. Design
Power management has been partly implemented in Nou-veau, which in shown in Figure 4. There are two importantstructures which are Performance Level Tables and VoltageTables. Performance Level Tables should contain the clocks(frequencies) need to be set, the specific voltage levels, andthe fanspeed levels. On more recent GPU cards, they alsocontain the indices of the memory timings entries that shouldbe used. Nouveau prints performance levels in the kernellog during loading. For the Voltage Tables, they contain avoltage label and the GPIO that should be set in order toachieve that voltage level.
Voltage adjusting is accomplished in two parts. First, thevoltage can be read/written using the GPIO engine. Second,a control via onboard i2c chip should be implemented. Forgetting and setting different voltage levels, GPIO enginesare used to activate the hook, as shown in Figure 5.
Getting and setting voltage are done by looking up the vidwhich is corresponded to each level of voltage. This step isimplemented by the code shown in Figure 6 and Figure 7.Implementing a control via onboard i2c chip is left to befuture work. After this is done, the experiment of gettingand setting voltage externally can be really conducted.
Figure 4. Power Management in Nouveau
Figure 5. Engines for getting and setting voltage
Figure 6. Implementation of getting voltage
Figure 7. Implementation of setting voltage

Table IDVFS EXPERIMENT CONFIGURATION
Operating System CentOS release 5.6Graphic Card NVIDIA GeForce 210Driver Nouveau/linux-2.6
Figure 8. Example of Printing Performance Levels
C. Experiment
The configuration of the experiment is shown in table II.In this project, Nouveau is chosen to be the driver. It usesreverse engineering techniques to provide a high-quality,opensource driver for NVIDIA GPU cards.
One way to verify voltage and frequency setting is tomake performance levels printed by the following command.Nouveau prints these values in the kernel log file duringloading process by using available per f ormance level flagwith dmesg|grep command.
Figure 8 shows an example of printing performance levels.The output shows the values of several frequencies, voltageand fanspeed levels. These results can be used to checkwhether the value of frequency and voltage are set right.
V. GPU POWER ANALYSIS
A. GPU Architecture
The power of GPU comes from the SIMD architecture thatmany processing elements execute one instruction simulta-neously. Latest NVIDIA’s Fermi GPU architecture (shown inFigure 9) usually consists of hundreds of Compute UnifiedDevice Architecture (CUDA) cores, of which thirty-two areorganized into one Streaming Multiprocessor (SM). All theCUDA cores in one SM execute the same instruction. Onethread in CUDA program will be mapped to a physicalCUDA core. For the threads inside one SM, each onehas limited private register files. The threads in one SMcan access a block of shared memory which enables thecommunication between these threads. Since the registerfiles and shared memory are on-chip memory resource, theyare fast but limited by small sizes. Therefore the GPU cardsusually are equipped with more than one gigabytes externaloff-chip DRAM as the global memory that can be accessedby the threads from all the SM cores. The GPU DRAMsubsystem is optimized for block data accesses by coalescingsome consecutive accessing requests if they have closingaddresses. The data loads and stores to DRAM in the GPUcard can be configured to be cached in L1/L2, and 400-800
Figure 9. GPU architecture
Table IIGEFORCE GTX 570 SPECIFICATIONS.
CUDA Cores 480Processor Clock (MHz) 1464DRAM 1280 MB GDDR5BUS Support PCI-E 2.0 x 16Maximum Card Power (W) 219
cycles will be paid for the ones whose requesting data is notcached in L1/L2.
For our experiments, we have used another high-endNVIDIA GeForce GTX 570 card for building the powermodel. Because this card is more power hungry thanNVIDIA GeForce 210 [6]. GeForce GTX 570 belongs to thelatest Fermi family and supports the Compute Capability upto 2.1. The detailed specifications are in Table II.
B. Programming Model: CUDA
CUDA [5] is an acronym for Compute Unified DeviceArchitecture. CUDA could be considered as the extension ofc language that allows the developers using GPU resourcefor computation. It brings the concepts of kernels, threads,thread blocks and grids. These concepts can describe bemapping relationships between CUDA programs and phys-ical GPU resource. A GPU kernel is an invoking functionhappening in GPU. A CUDA thread is mapped to a CUDAcore that can access its own registers, shared memory orglobal memory for executing instructions. A thread blockcontaining several threads can be mapped to a SM core. OneSM core is able to have multiple blocks serially run on itself.For the data in the host memory space, CUDA provideskernels to deliver the data to the global memory (On-boardDRAM). The functions for data motion from global memoryto host memory are also provided. A group of threadsrunning on a single SM construct a thread block. A CUDAgrid represents all the thread blocks that are launched forexecuting one function. In order to use CUDA to programon GPU, the system has been configured as following TableIII.

Table IIISYSTEM CONFIGURATIONS.
Operating System CentOS 5.6 64bGCC 4.1CUDA 3.2
Figure 10. Schematic of GPU power supply
C. GPU Linear Regression Power Model
Linear regression [12] is a technique to model the re-lationship between a scalar variable and one or more ex-planatory variables. In [14], Isci and Martonosi presenteda power model for Pentium4 processors using performancecounters. They decompose the power consumption of thetarget processor into 22 components, and manually derivea model for each component using processor performancecounters. Similar with CPU, GPU can also be decomposedinto multiple different components for power modeling.Since most components of GPU are power independent witheach other, the linear regression model can be described asfollowing:
P =n
∑i=1
(αi ∗ui)+β (3)
The letter n represents the number of selected componentsin GPU. αi is the maximum power contribution of the i− thselected component. ui is the usage rate which could beobtained from the performance counters. β represents theintercept which means the basic power does not include theselected units. The model allows us to estimate the averagepower of a given CUDA program.
D. Power Measurement
The Figure 10 shows the schematic for the power supplyon the target GPU system. For the GPU card, since GeForceGTX 570 may reach the power of more than 200w, anauxiliary 12V trail has been added to the GPU card. Anotherpower supply goes through the PCI-E interface into the GPUcard. Therefore, for measuring the GPU runtime power, itis necessary to read the DC current readings from bothauxiliary trail and PCI-E interface. For the auxiliary trail,the wires transferring DC current can be easily picked and
Figure 11. Real system for power measurement
bundled together. However the difficulty comes from thePCI-E interface, because there are no wires between thepins of GPU card and the the PCI-E slot. So a PCI-E risercard is used to insert some wires for connecting the pinsof GPU card and the PCI-E slot. After making auxiliarytrail and PCI-E DC wires go through the two FLUKE 80i-110s clamps respectively, the clamps can generate variablevoltages describing the DC currents of the wires throughthe clamp. NI USB 6126 data acquisition is used to capturethe readings from the two clamps and deliver the data to acomputer for recording. The real system is shown in Figure11.
However, since that the measured real power also includesthe power of the card electrical units and the fan. Forobtaining the pure power for GPU computation, the idlepower must be subtracted from the measured power. Wealso assume the runtime power of GPU for displaying theLinux desktop is the idle power. The measured idle is28.5w. In the following sections, the power refers the averagepower subtracted the idle power from it during the programexecution.
E. Performance Counters
For the CUDA 3.2 we have selected, it provides a perfor-mance profiling tool named Compute Visual Profiler [11].By using this profiler to run the executable CUDA program,the statistical results for selected performance counters couldbe obtained. Since we mainly consider the power contribu-tions of instruction, register file, shared memory and globalmemory, within all the provided performance counters bythe visual profiler, only 5 counters have been chosen. Theyare shown in Table IV.
The value of the active warps divided by the activecycles can be used as the active rates of the GPU on theprofiling CUDA program. The inst executed is the numberof instructions executed by one thread. The total number ofDRAM operations of one thread is the sum of dram readsand dram writes. So we multiply the active rates with thenumber of instructions and use the product as the usage rate

Table IVSELECTED PERFORMANCE COUNTERS
inst executed Number of instructions executeddram reads Number of read requests to DRAMdram writes Number of write requests to DRAMactive warps Accumulated number of active warps per cycleactive cycles Number of cycles a multiprocessor has at
least one active warp
instruction component of GPU. For DRAM usage rate, weapply the same formula.
VI. EVALUATION
A. Micro-benchmarks
In order to train the GPU linear regression power model,multiple sets of known total power and usage rates forselected components should be used. Micro-benchmarks thatstress one type of operation on the associated componentin GPU are suitable for getting the results. Because theycould minimize the power noise comparing general CUDAprograms. The micro-benchmarks will repeat the same op-erations and try to highly press the associated unit. Sincewe mainly consider four components in GPU, accordingly,we plan to develop four micro-benchmarks for each. Dueto the time limitation, register and shared memory micro-benchmarks are still in progress.
Actually, the computation and global memory are the twomost important power contributors to the total power. Be-cause the maximum power contribution of each componentis roughly proportional with its area size. Therefore, with theconsiderations only of instruction components and globalmemory, the linear regression power model can almostpredict the GPU power misleadingly. In the final projectreport, we will finish the consideration of register and sharedmemory into the GPU linear regression power model. Thehypothesis is the model should be more precise than the onein this draft paper.
B. Training
The micro-benchmark stressing on instruction componentconsumes most of its execution time on a large numberof computation instructions. They are mainly floating pointaddition and multiplication. Since they are both executedby the CUDA cores, we consider them the same typeof instruction. For the micro-benchmark stressing globalmemory (DRAM), we consider the total number of theglobal memory transactions of reads and writes, becausethe global reads and writes have similar power dissipation.For register and shared memory, the sizes of used regis-ters and shared memory information can be obtained bysettling −− ptxas − options = −v to the nvcc compiler.For each micro-benchmark, we set different number ofthreads to achieve different usage rates and GPU power.
(a) Micro-benchmarks’ average power with different configurations
(b) Four components’ usage rates
Figure 12. Profiling of four micro-benchmarks
Each configuration of the threads will be executed five timesto get the average power. Since the performance countersfor each CUDA program are fixed, one time running ofeach configuration in the visual profiler is sufficient. Theaverage power and usage rates for instruction, global mem-ory (GMEM), register and shared memory (SMEM) withdifferent configurations are shown in Figure 12. The usagerates are increasing with the number of threads becomeslarge. When the number of threads gets close to 256, theusage rates for all micro-benchmarks are almost saturated.The power for the 512 threads configuration consumes someextra power on scheduling. However, the usage rates canpredict the GPU power trend misleadingly.
By using the four sets of power and usage rates to trainthe GPU linear regression power model, the αi which is themaximum power contribution to the total power is shown inFigure 13. For this current power model, we only considerthe power impacts from the instruction components andglobal memory. The other components in GPU have beenincluded in the intercept which may increase the error rateof this power model.
C. Power Prediction
For evaluating the accuracy of the GPU power model, fouropen-source CUDA sorting programs have been selectedfor the comparison of real average power and estimatedaverage power. The five GPU sorting programs are Thrust,SDK, BB-Sort, Bitonic and Hybrid in Table V. The accuracycomparison is shown in Figure 14. These results show the

Figure 13. Training results
Table VSORTING PROGRAMS
Thrust RadixSDK RadixBitonic BitonicHybrid Bucket + Merge
average error rate is 12.25%. There are two error sources.One is the usage rates can only roughly describe the busydegree of some associated components. The other one isthat this model only considers four contributors. The powerimpact from all the other components not considered isincluded in the intercept and assumed to be the averagepower of these components of the four micro-benchmarks.So, the intensively using of these components may make theprediction have high error ratio.
VII. CONCLUSION
DVFS is a dynamic power management technique, whichhas been implemented on CPU in many applications butrarely on GPU. DVFS implementation can be done by soft-ware or hardware. In software-based DVFS implementation,it is usually done by placing hooks in kernel system callsof operating system to collect the information of systemcall and thereby calculate the system load. The work ofcollecting voltage and frequency values and setting those
Figure 14. Evaluation of the GPU power model
values in Nouveau driver have been studied. For supportingthe DVFS implementation choosing voltage and frequencylevels of GPU, a GPU linear regression power model forpower prediction is built. With the considerations of powercontributions from instruction components, global memory,register and shred memory of GPU, the power model couldachieve 12.25% average error ratio for the four chosensorting CUDA programs on GPU.
REFERENCES
[1] B. Lin, A. Mallik, P. Dinda, G. Memik and R. Dick, User-and Process-driven dynamic voltage and frequency scaling,Performance Analysis of Systems and Software, Apr. 2009.
[2] Y. Liu, H. Yang, R. Dick, H. Wang and L. Shang, Thermalvs Energy optimization for DVFS-enabled processors in em-bedded systems, Quality Electronic Design, Mar. 2007.
[3] ARM. ARM: 1176 IEM Reference Methodology,2009.
[4] Moore, G. E. Cramming More Components onto IntegratedCircuits, Electronics (38:8), 1965, pp. 114-117.
[5] NVIDIA., NVIDIA CUDA C Programming Guide, 2010.
[6] www.nvidia.com.
[7] nouveau.freedesktop.org/wiki/FrontPage.
[8] Intel. Enhanced Intel SpeedStep Technology for the IntelPentiumM Processor, White Paper, March 2004.
[9] NVIDIA., PowerMizer 8.0 Intelligent Power ManagementTechnology, Technical report, June 2008.
[10] X. Ma, M. Dong, L. Zhong and Z. Deng, Statistical PowerConsumption Analysis and Modeling for GPU-based Com-puting, in HotPower 2009.
[11] NVIDIA. COMPUTE VISUAL PROFILER, User Guide,2011.
[12] W. Dupont and W. Plummer, Power and sample size cal-culations for studies involving linear regression, ControlledClinical Trials, 19, 589-601.
[13] H. Nagasaka, N. Maruyama, A. Nukada, T. Endo, S. Mat-suoka, Statistical Power Modeling of GPU Kernels UsingPerformance Counters, in IGCC 2010.
[14] C. Isci and M. Martonosi, Runtime power monitoring in high-end processors: Methodology and empirical data, in MICRO2003.
[15] Q. Wu, V.J. Reddi, Y. Wu, J. Lee, D. Connors, D. Brooks,M. Martonosi1 and D.W. Clark, A Dynamic CompilationFramework for Controlling Microprocessor Energy and Per-formance, in MICRO 2005.