low-impact renewable energy policy in canada: strengths
TRANSCRIPT

Low-Impact Renewable Energy Policy in Canada: Strengths, Gaps and a Path Forward
February, 2003 Prepared by: Andrew Pape-Salmon Jonathan Dogterom Carissa Wieler Mark Anielski

Pembina Institute
Low-Impact Renewable Energy Policy in Canada: Strengths, Gaps and a Path Forward ii
About the Pembina Institute The Pembina Institute is an independent, citizen-based organization involved in environmental education, research, public policy development and client-confidential environmental consulting services. Its mandate is to develop and promote policies and practices that lead to environmental protection, resource conservation and environmentally sound and sustainable energy and resource management. The mission of the Pembina Institute is to implement holistic and practical solutions for a sustainable world. Incorporated in 1985, the Institute’s head office is in Drayton Valley, Alberta, with offices in Ottawa and Calgary, and research associates in Edmonton, Vancouver and other locations across Canada. For more information on the Pembina Institute’s work, and details of the capabilities and services offered, please visit www.pembina.org.
About the Authors Andrew Pape-Salmon is the Director of Sustainable Energy at the Pembina Institute. He is a professional engineer and resource manager with a focus on sustainable energy policy, low-impact renewable energy technologies and community energy planning. He has led several sustainable energy policy advocacy efforts in Canada and has authored several related reports, including, “A Smart Electricity Policy for Alberta,” available free of charge on the Pembina Institute Web site. (For further information about the report, please contact the author at [email protected].) He has worked extensively on the implementation of low-impact renewable energy and energy efficiency at a community level with First Nations and small municipal government partners in Alberta, British Columbia and the Yukon. He is also a Director with the Canadian Wind Energy Association. Jonathan Dogterom is a Sustainable Energy Analyst with the Pembina Institute. His primary focus is on renewable energy policy and project assessment for corporations and communities. In previous work experience, Jonathan established international certification for Canada’s first large-scale wind turbine for remote applications, and has been involved with power electronic research and development for small wind and solar applications. Carissa Wieler is a researcher with the Eco-Solutions Group. Using her biology and environmental science background, she conducts research and analysis in areas of renewable energy, life cycle value assessment, and corporate sustainability performance. Mark Anielski is the Managing Director of Sustainability Measurement at the Pembina Institute. He provides strategic advice and conducts applied research on ecological economics, genuine progress indicator accounting, sustainable development accounting, ecological tax reform and full-cost pricing. Mark’s expertise encompasses government business planning, performance measurement, natural capital accounting, ecological economics, land-use planning and the re-design of the international system of national accounts to incorporate social, human and natural capital. Acknowledgements The Pembina Institute would like to acknowledge the financial support of the Canadian International Development Agency for preparing this report through the Canadian-India Energy Efficiency Project. This project is being managed by the International Institute for Sustainable Development under the direction of Stephan Barg, who contributed toward the content of this paper. We would also like to acknowledge input from Darren Swanson and Stuart Slayen of IISD.

Pembina Institute
Low-Impact Renewable Energy Policy in Canada: Strengths, Gaps and a Path Forward iii
About this Paper This paper was prepared as input to the TERI-Canada Energy Efficiency Project, a collaborative effort among the Tata Energy Research Institute (TERI) in India, and Canada’s International Institute for Sustainable Development (IISD) and the Pembina Institute for Appropriate Development. The TERI-Canada project was launched in 1999 with support from the Canadian International Development Agency (CIDA) with one objective being the promotion of Green Budget Reform (GBR). GBR aims to contribute to sustainable development at the national level, both in Canada and in India. GBR focuses on how government’s taxation and expenditure plans can work to better support more efficient use of energy, improvement of local environmental conditions and the reduction of greenhouse gas emissions. Policy research is underway in India and Canada. Specific GBR efforts include the development of a policy framework for energy sustainability assessment, the full-cost-pricing of electricity generation and estimating the impacts of scenarios of carbon emissions regulation on different income groups.

Pembina Institute
Low-Impact Renewable Energy Policy in Canada: Strengths, Gaps and a Path Forward iv
Executive Summary Low-impact renewable energy (LIRE) is a category of reliable source of energy sources, including wind, sun, biomass and moving water, that can provide a large proportion of Canada’s energy needs. LIRE costs are predictable and stable because the renewable energy resources are available and non-depletable. The utilization of LIRE technologies does not negatively impact on human health and environmental integrity. In fact, the introduction of LIRE in the energy system can reduce existing environmental and health impacts by displacing polluting sources of energy such as fossil fuels. Canada has made some progress towards diversifying its energy supply through the use of LIRE sources, but this process would be significantly accelerated through a comprehensive set of new policies and programs. This policy discussion paper covers lessons learned in Canada regarding renewable energy policy. Canada has vast amounts of renewable energy resources yet it is falling behind most industrialized nations in the expansion of LIRE due to a lack of supporting market structures and the absence of appropriate government policies. North America initiated the development and implementation of renewable energy in the early 1970s. Today, the new low-impact renewable energy industry (i.e., not including large hydro-electric power stations and biomass for wood stoves) has an annual turnover worldwide of about US$7 billion. This industry is expected to grow to $82 billion by the year 2010. The European Union (EU) has been one of the most progressive entities in its support of LIRE. Globally, Europe is at the forefront of the majority of LIRE developments. Significant employment is associated with the LIRE industries in the EU, encompassing several hundred companies, mainly small and medium-sized enterprises in primary assembling/manufacturing. The Canadian federal government has played a leadership role in advancing LIRE research, development, demonstration and commercialization programs. In 2002, it launched the CDN$260 million Wind Power Production Incentive and $50 million Market Incentive Program for renewable energy marketing programs. In addition, it has one of the largest “green-power procurement” programs in North America with an intention to purchase 20 per cent of its electricity supply from LIRE sources. This was instrumental in supporting a 47 per cent growth rate for wind power in 2001. Previous federal government initiatives, including the Renewable Energy Deployment Initiative, have had limited impact because of small budgets or limited scope. Federal government partnerships with other governments are paving the way toward substantial policy development. For example, the partnership with the Federation of Canadian Municipalities through the Green Municipal Enabling and Investment Fund is resulting in multiple investments in renewable energy. In some provinces and territories, notably the Yukon, British Columbia, Alberta, Quebec and Nova Scotia, provinces and regulated utilities are also providing significant support for “green energy.” Of the barriers to the implementation of LIRE in Canada highlighted in this report, the lack of pricing for environmental and human health “externalities” is considered the most significant. The energy marketplace includes several environmental and social externalities, defined as those costs and benefits that do not have a direct financial value but have indirect financial and/or social costs. Externalities include environmental impacts of energy production and consumption such as greenhouse gas (GHG) emissions, toxic wastes, local air pollutants, watershed impacts and human health impacts, among others. There are no well-established markets for GHG emissions, clean air or water as of yet and thus no financial cost for their production.

Pembina Institute
Low-Impact Renewable Energy Policy in Canada: Strengths, Gaps and a Path Forward v
Without such price signals, energy projects that produce environmental impacts, such as new coal or large hydro power plants, may be subsidized by the public through public funds into environmental clean-up, healthcare or other programs. To add to that, the lack of price signals means that LIRE projects are not rewarded financially for their environmental benefits. A series of response mechanisms are proposed in this paper to address the barriers. These include the following:
• increasing government funding support for research, development, demonstration and commercial programs for LIRE, with an emphasis on expanding the technology and market scope of existing programs;
• establishing low-interest financing mechanisms for LIRE developers who do not have access to capital similar to “revolving loan” programs established for municipalities in Canada. This is particularly important for thermal LIRE technologies such as solar water heaters;
• providing a financial incentive for LIRE producers that reflects their environmental and human health benefits, such as the proposal of the Clean Air and Renewable Energy (CARE) Coalition, which attempts to mimic mechanisms already established in the US;
• providing equitable market access for LIRE suppliers through net metering for small-scale suppliers and transmission or retail access for larger suppliers;
• establishing regulatory mechanisms such as a “portfolio standard” that would require electricity companies to generate or purchase a minimum proportion of their electricity supply from LIRE sources; and
• increasing consumer awareness programs. Any combination of these proposed mechanisms can help to achieve a balance in the Canadian energy economy such that low-impact renewable energy suppliers can expand in this country as they are among Canada’s industrialized trading partners in the US, Japan, and Europe.
Pembina Institute
Low-Impact Renewable Energy Policy in Canada: Strengths, Gaps and a Path Forward vi
Table of Contents 1 INTRODUCTION...............................................................................................................................1
2 THE CANADIAN ENERGY ECONOMY .......................................................................................2 2.1 MARKET STRUCTURE ....................................................................................................................2 2.2 NON-RENEWABLE ENERGY RESOURCES.......................................................................................3 2.3 ENERGY SUPPLY AND DEMAND ....................................................................................................3 2.4 GREENHOUSE GAS EMISSIONS ......................................................................................................6 2.5 HISTORY OF CANADIAN ENERGY POLICY .....................................................................................7
3 OVERVIEW OF LOW-IMPACT RENEWABLE ENERGY TECHNOLOGIES.....................10 3.1 INTRODUCTION AND DEFINITION ................................................................................................10 3.2 RESOURCE CERTIFICATION STANDARDS.....................................................................................10 3.3 CANADA’S LOW-IMPACT RENEWABLE ENERGY RESOURCE POTENTIAL ...................................11
3.3.1 Wind ....................................................................................................................................12 3.3.2 Solar ....................................................................................................................................12 3.3.3 Low-Impact Hydro ..............................................................................................................12 3.3.4 Sustainable Biomass............................................................................................................13
3.4 ECONOMICS OF LOW-IMPACT RENEWABLE ENERGY..................................................................13 4 OVERVIEW OF THE LOW-IMPACT RENEWABLE ENERGY MARKET IN CANADA AND WORLDWIDE.................................................................................................................................16
4.1 INTRODUCTION ............................................................................................................................16 4.2 SOLAR POWER .............................................................................................................................17 4.3 SOLAR THERMAL.........................................................................................................................17 4.4 WIND ENERGY.............................................................................................................................18 4.5 BIOMASS PLANTS ........................................................................................................................22 4.6 LOW-IMPACT HYDROELECTRICITY .............................................................................................23 4.7 ETHANOL .....................................................................................................................................24 4.8 BIO-OIL ........................................................................................................................................25 4.9 CURRENT DRIVERS FOR LOW-IMPACT RENEWABLE ENERGY DEVELOPMENT...........................26
4.9.1 Energy-Driven Markets .......................................................................................................27 4.9.2 Environmentally Driven Markets ........................................................................................27
5 CURRENT LOW-IMPACT RENEWABLE ENERGY POLICY IN CANADA........................29 5.1 FEDERAL GOVERNMENT LEADERSHIP ........................................................................................29
5.1.1 Wind Power Production Incentive.......................................................................................29 5.1.2 Market Incentive Program for Emerging Renewable Energy .............................................29 5.1.3 Climate Change Plan for Canada .......................................................................................29 5.1.4 Federal and Provincial Research and Development...........................................................30 5.1.5 Federal Taxation Measures.................................................................................................32 5.1.6 Federal Government “Renewable Energy Deployment Initiative”.....................................32 5.1.7 Federal Government and Federation of Canadian Municipalities Funds ..........................33 5.1.8 Micropower Connect Guidelines.........................................................................................33
5.2 CURRENT PROVINCIAL AND TERRITORIAL GOVERNMENT POLICY INITIATIVES ........................34 5.2.1 Yukon...................................................................................................................................34 5.2.2 British Columbia .................................................................................................................34 5.2.3 Alberta .................................................................................................................................35 5.2.4 Saskatchewan ......................................................................................................................36

Pembina Institute
Low-Impact Renewable Energy Policy in Canada: Strengths, Gaps and a Path Forward vii
5.2.5 Ontario ................................................................................................................................36 5.2.6 Quebec.................................................................................................................................37 5.2.7 Newfoundland......................................................................................................................37 5.2.8 New Brunswick ....................................................................................................................37 5.2.9 Nova Scotia..........................................................................................................................38
5.3 CANADIAN UTILITIES OFFERING GREEN-POWER PROGRAMS ....................................................39 5.3.1 BC Hydro.............................................................................................................................39 5.3.2 ENMAX................................................................................................................................39 5.3.3 EPCOR ................................................................................................................................40 5.3.4 SaskPower ...........................................................................................................................40 5.3.5 Ontario Power Generation (OPG)......................................................................................40 5.3.6 Toronto Hydro Energy Services Inc. ...................................................................................40 5.3.7 Nova Scotia Power ..............................................................................................................40 5.3.8 Maritime Electric ................................................................................................................41
5.4 GREEN-POWER PROCUREMENT...................................................................................................41 5.4.1 Canadian Federal Government...........................................................................................41 5.4.2 Provincial Governments......................................................................................................42 5.4.3 Municipal Governments ......................................................................................................42 5.4.4 Canadian Corporate Purchases of Low-Impact Renewable Energy...................................42
6 BARRIERS TO RENEWABLE ENERGY IN CANADA.............................................................44 6.1 INFORMATION BARRIERS.............................................................................................................44
6.1.1 Lack of Participation in Energy Market by Certain Consumers.........................................44 6.1.2 Lack of Awareness of LIRE Options....................................................................................44 6.1.3 Lack of Information on Suppliers ........................................................................................44 6.1.4 Lack of Information on LIRE Resource Availability ...........................................................44
6.2 INSTITUTIONAL AND POLICY BARRIERS......................................................................................45 6.2.1 Interconnection and Operational Barriers..........................................................................45 6.2.2 Market Barriers ...................................................................................................................48 6.2.3 Regulation of the Energy Sector..........................................................................................48
6.3 FINANCIAL BARRIERS..................................................................................................................48 6.3.1 Lack of Access to Capital ....................................................................................................48 6.3.2 Level Playing Field for Competing Energy Supplies ..........................................................48 6.3.3 Lack of Pricing for Environmental Externalities ................................................................49
6.4 TECHNICAL BARRIERS.................................................................................................................50 7 REGULATORY AND MARKET INCENTIVES TO CREATE THE RIGHT FISCAL CLIMATE FOR LOW-IMPACT RENEWABLE ENERGY EXPANSION.......................................51
7.1 FINANCING OPTIONS ...................................................................................................................52 7.2 FISCAL MECHANISMS ..................................................................................................................53 7.3 PROVIDE EQUITABLE ELECTRICITY MARKET ACCESS................................................................53 7.4 REGULATORY MECHANISMS .......................................................................................................54 7.5 INCREASE CONSUMER AWARENESS AND CHOICES.....................................................................55 7.6 ACCOUNTABILITY FOR SOCIO-ECONOMIC/ENVIRONMENTAL COSTS.........................................55 7.7 LEVEL THE PLAYING FIELD.........................................................................................................62 7.8 CLEAN AIR AND RENEWABLE ENERGY COALITION (CARE)......................................................63 7.9 CANWEA WIND VISION FOR CANADA ......................................................................................63
8 SUMMARY........................................................................................................................................66
9 MAJOR REFERENCES ..................................................................................................................68

Pembina Institute
Low-Impact Renewable Energy Policy in Canada: Strengths, Gaps and a Path Forward viii
10 APPENDIX 1: HISTORY OF ENERGY POLICY IN CANADA............................................69 FIGURES Figure 2.1 – Canada’s Greenhouse Gas Emissions by Sector.......................................................................7 Figure 4.1 – Predicted Worldwide PV Installed Capacity Growth .............................................................17 Figure 4.2 – Predicted Worldwide Wind Energy Market Growth………………………………………...19 Figure 4.3 – Forecast of Wind Energy Development, 1999–2003……………………………………….. 266 TABLES Table 2.1 – Canada’s End-Use Energy Demand (1990 to 2010) ..................................................................5 Table 2.2 – Electricity Supply and Demand (GWh) .....................................................................................6 Table 2.3 – Federal Government Spending on Energy .................................................................................8 Table 3.1 – Cost of Low-Impact Renewable Energy Supplies....................................................................14 Table 4.1 – Comparison of Wind Power Capacity at the end of 2001 (MW) .............................................19 Table 4.2 – Installed Wind Power Capacity in Canada...............................................................................20 Table 4.3 – Canadian Ethanol Production Facilities ...................................................................................25 Table 5.1 – Corporate Investments in Low-Impact Renewable Energy......................................................43 Table 6.1 – Barrier-Related Interconnection Costs for Small-Scale Technologies.....................................47 Table 7.1 – Life-Cycle Performance of Wind Power, Solar Power and Run-of-River Hydro....................57 Table 7.1 – Life-Cycle Performance of Wind Power, Solar Power and Run-of-River Hydro, Continued .58 Table 7.2 – Life-Cycle Performance of Coal, Large-Scale Hydro and Nuclear Power ..............................59 Table 7.2 – Life-Cycle Performance of Coal, Large-Scale Hydro and Nuclear Power ..............................59 Table 7.2 – Life-Cycle Performance of Coal, Large-Scale Hydro and Nuclear Power, Continued............60 Table 7.3 – Employment Creation Benefits of Competing Energy Investments ........................................61

Pembina Institute
Low-Impact Renewable Energy Policy in Canada: Strengths, Gaps and a Path Forward 1
1 Introduction Low-impact renewable energy (LIRE) is a category of reliable source of energy sources, including wind, sun, biomass and moving water, that can provide a large proportion of Canada’s energy needs. Based on non-depletable renewable energy resources such as moving water, wind, the sun and trees, LIRE costs are predictable and stable because the resources are available and non-depletable. The utilization of LIRE technologies does not negatively impact on human health and environmental integrity. In fact, the introduction of LIRE in the energy system can reduce existing environmental and health impacts by displacing polluting sources of energy such as fossil fuels. Canada has made some progress towards diversifying its energy supply through the use of LIRE sources, but this process would be significantly accelerated through a comprehensive set of new policies and programs. Canada has vast amounts of renewable energy resources like the wind, the sun, moving water and biomass, yet it is falling behind most industrialized nations in the expansion of LIRE due to a lack of supporting market economies and the absence of appropriate government policies. Canada derived less than 4 per cent of its primary energy supply from LIRE sources in 1996. In contrast, Denmark will produce at least 20 per cent of its electricity from wind power alone in 2003.1 Why? What are the barriers to renewable resource energy development in Canada? How do Canada’s current fiscal, tax and other government policy regimes encourage or discourage renewable energy development over non-renewable resource use? How can regulatory mechanisms, fiscal mechanisms (tax and other fiscal policies), and research, development and demonstration programs be modified to encourage more renewable energy development? These are some of the issues that will be examined in this policy discussion paper on the lessons learned in Canada regarding renewable energy policy. This paper includes:
• a review of the Canadian energy economy, market structures, supply and demand, energy policy, and greenhouse gas emissions;
• an overview of low-impact renewable energy technologies; • an overview of the LIRE market in Canada; • an overview of current government policies and market mechanisms to support LIRE in Canada; • existing barriers to the development of LIRE in Canada (i.e., gaps in current policy); • regulatory and incentive strategies to create the right fiscal climate for LIRE expansion; and • conclusions on the prospects for low-impact renewable energy in Canada.
Although this paper reviews components of all energy economies, including electricity, heating fuels and transportation fuels, the emphasis will be on electricity markets and associated governing policies.
1 Wind Power Monthly.
Pembina Institute
Low-Impact Renewable Energy Policy in Canada: Strengths, Gaps and a Path Forward 2
2 The Canadian Energy Economy
2.1 Market Structure Canadians have the luxury of some of the lowest electricity prices in industrialized countries, resulting from public subsidies for energy extraction, extensive and regionally diverse energy resource supplies and manageable demand. The diversity of sources has created the ability to optimize resources by using the cheapest forms available and conducting inter-provincial trade. The most common route of trade is from hydro-rich provinces (Quebec, Manitoba and British Columbia) to those with more expensive sources. Canada is also a net exporter of electricity to the US. This works effectively for Canada due to the different consumption levels during the year. The US uses more energy in the summer (running air conditioners) and less in the winter, whereas the reverse is true north of the border. Approximately 9 per cent of Canada’s generation is exported for use in the US2 The Canadian energy economy includes electricity markets that are primarily divided among the country’s 13 provinces and territories. The natural gas market has a national scope with many components of the market deregulated, except for residential and commercial sector rates. The electricity and natural gas markets each have private and public sector players, depending on the province or territory (there is no natural gas in northern Canada to date). A number of other heating fuels including oil, propane, diesel and firewood for residential and commercial sectors, are dominated by unregulated private players. Coal mining and utilization for industry is privately held as well, although there is a history of government subsidization in certain regions. Finally there are a variety of transportation fuels including gasoline, diesel and a variety of other fuels. In the traditional electricity market structure, electricity generation, transmission and distribution were all handled by a vertically integrated monopoly for each province (primarily government-owned). This structure resulted in the construction of large-scale power generation facilities and massive transmission systems owned by the same generator. Currently, however, the market is being opened up to competition under a new deregulated structure in some areas of the country. The reasons for this switch in the market structure are to:
• open up the transmission lines to cheaper supplies from neighbouring regions; • take advantage of emerging, less-expensive technologies; and • introduce competition between producers and service providers, which will eventually lead to less
expensive and broader products for customers. Deregulation can take place on two different levels. The first is on a wholesale basis where energy generators have access to the transmission system and can sell power to distribution companies or independent marketers. The second is retail deregulation where marketers have access to distribution systems and can sell to consumers, and consumers have a choice among the various marketers. The provinces of British Columbia, Saskatchewan, Manitoba, Quebec and New Brunswick have all implemented wholesale access to the electricity market. Full retail access was implemented by Alberta on January 1, 2001, and by Ontario in May 2002. Across the country, consumer rates for electricity have traditionally been stable; however, the recent market restructuring initiative in Alberta has caused a significant price surge. These price increases have
2 Canada’s National Energy Board. Canadian Electricity Trends and Issues: May 2001. http://www.neb.gc.ca/energy/emaelecti.pdf

Pembina Institute
Low-Impact Renewable Energy Policy in Canada: Strengths, Gaps and a Path Forward 3
slowed the political agenda for electricity market restructuring in other regions. Ontario is the only other province that will be implementing a “retail competition” market. Any efforts to establish such markets elsewhere have been affected by discussions about the economic efficiency of opening up retail markets to competition.
2.2 Non-Renewable Energy Resources
Traditionally, Canadian energy policy has been devoted to the development of Canada’s large oil, gas and coal resources. Royalty, tax and other fiscal policies, as well as provincial land-use policies, have helped to encourage the development of this non-renewable natural capital. In addition, government support for research and development of new technologies has made the production of bitumen and synthetic crude oil from Alberta’s vast supply of oil sands economically viable. The large public subsidy for oil sands development has resulted in it becoming the largest oil resource in Canada, all concentrated in the Fort MacMurray area of northeast Alberta. The provinces of Alberta and Saskatchewan have traditionally been the primary source of non-renewable energy for Canada. Now, the development of offshore oil and gas reserves in Atlantic Canada and oil and gas developments in northern parts of Canada has diversified the supply. Stocks of oil, natural gas and coal have meant relatively inexpensive energy inputs for fueling the economy of the past 50 years. Alberta’s oil sands have a reserve of at least 300 billion barrels (in excess of Saudi Arabia’s estimated 264 billion barrels).3 In Alberta, the reserve life (i.e., the years of production remaining from current stock of reserves) exceeds 1,200 years for subituminous coal that is used for electricity production, while the life of synthetic and bitumen crude oil from the oil sands would last hundreds of years.4 Unfortunately, the picture for natural gas, the cleaner-fossil fuel option, is not as healthy. Canadian Association of Petroleum Producers statistics (2000) show that the natural gas reserve life for Alberta has declined to less than 10 years of remaining production.5 New reserves of oil and gas now being developed in Atlantic Canada are adding more non-renewable energy capacity to Alberta’s rich stores. Like most industrialized nations, Canada’s 30 million people6 rely heavily on non-renewable sources (oil, natural gas, coal, natural gas liquids) of energy to fuel the economy. The demand for different energy supplies is highlighted below. Also, a more detailed look at the of Canada’s non-renewable energy industry is given in the Appendix.
2.3 Energy Supply and Demand Energy demand can be categorized into two types:
1. Primary Energy Demand – the demand for energy natural resources such as coal, water power or nuclear fission, without any conversion to electricity or refined petroleum products; and
2. End-use Energy Demand – the demand for energy resources that provide useful “end-use” services such as running computers, grinding minerals or powering a motor vehicle. These include the consumption of electricity and refined petroleum products.
3 In The Alberta Energy and Utilities Board (AEUB) estimates that a further “yet to be established reserves” (reserves available through technological advances) total as much as 302.6 billion barrels or 48 billion cubic meters. The “ultimate volume of bitumen in place” (currently uneconomic to produce, however potentially available) is estimated by the AEUB at over 4,000 billion cubic metres or 2.5 trillion barrels of crude oil. In M. Anielski, 1999. Is Alberta Running Out of Nature’s Capital? Physical and Monetary Accounts for Alberta’s Timber, Oil and Natural Gas Reserves, Paper Presented at Institute for Public Economics Seminar University of Alberta. 4 Anielski, 1997. 5 Reserve life is derived by dividing the economic reserve stocks by current production to provide an estimate of years of production remaining from current reserves should production continue as in the past and should reserves remain constant. Of course, the next year may mean additions to reserves or increased production, thus the reserve life must be used with caution in estimating the longevity of non-renewables. 6 According to Statistics Canada there were 30,491,294 million Canadians in 1999.

Pembina Institute
Low-Impact Renewable Energy Policy in Canada: Strengths, Gaps and a Path Forward 4
The demand is synonymous with the “supply” of energy that is used for domestic consumption in Canada. The energy demand in Canada is outlined in the table below. The different fuels that are listed for “end-use demand” are:
• refined petroleum products (RPPs); • natural gas; • electricity, all of which is derived from other fuel sources; • coal; • liquefied petroleum gases (LPGs), including propane; • coke and coke oven gas which are used in industrial processes; • steam, all of which is derived from other energy sources; • other forms of energy for industrial processes such as “hog fuel” for pulp and paper, “still gas”
for petroleum refineries, ethanol for vehicles, among others; and • residential wood.
The figures in Table 2.1 do not include exports of energy to the US or other countries. The last two items in the “Primary Energy Demand” row outline the utilization of renewable energy. “Hydro” is the energy provided by moving water in Canada, which is used exclusively for generating electricity. This is equivalent to 10.9 per cent of the primary energy demand in the year 2000. “Other Renewables” includes the use of wood for heating and electricity production, and wind power. This is equivalent to 5.3 per cent of Canada’s primary energy demand. It does not include direct on-site use of renewable sources such as solar water heaters, ground source heat pumps, etc.

Pembina Institute
Low-Impact Renewable Energy Policy in Canada: Strengths, Gaps and a Path Forward 5
Table 2.1 – Canada’s End-Use Energy Demand (1990 to 2010)7
Table 2.2 outlines some of the characteristics of the electricity market in Canada including demand and supply. In the year 2000, Canada generated 63 per cent of its electricity supply from hydroelectric facilities, most of which came from large-scale hydroelectric facilities with storage. These facilities can have high environmental costs due to flooding of habitat and land. Most of the low-impact renewable energy supply comes from wind and bioenergy, which is produced by burning biomass (mostly sawmill waste) for producing steam and electricity. According to Natural Resources Canada (NRCan), a federal government department specializing in sustainable development and use of natural resources, Canada’s energy requirements forecast to 2020 suggest increasing levels of demand for oil, natural gas, coal and renewables, but declining demand for nuclear electricity. The contribution of renewable energy to Canada’s useful energy balances will likely continue to increase, particularly as concerns about global warming continue and as Canada attempts to achieve reductions in greenhouse gas emissions.
7 Canada’s Energy Outlook. 1999 Update.

Pembina Institute
Low-Impact Renewable Energy Policy in Canada: Strengths, Gaps and a Path Forward 6
Table 2.2 – Electricity Supply and Demand (GWh)
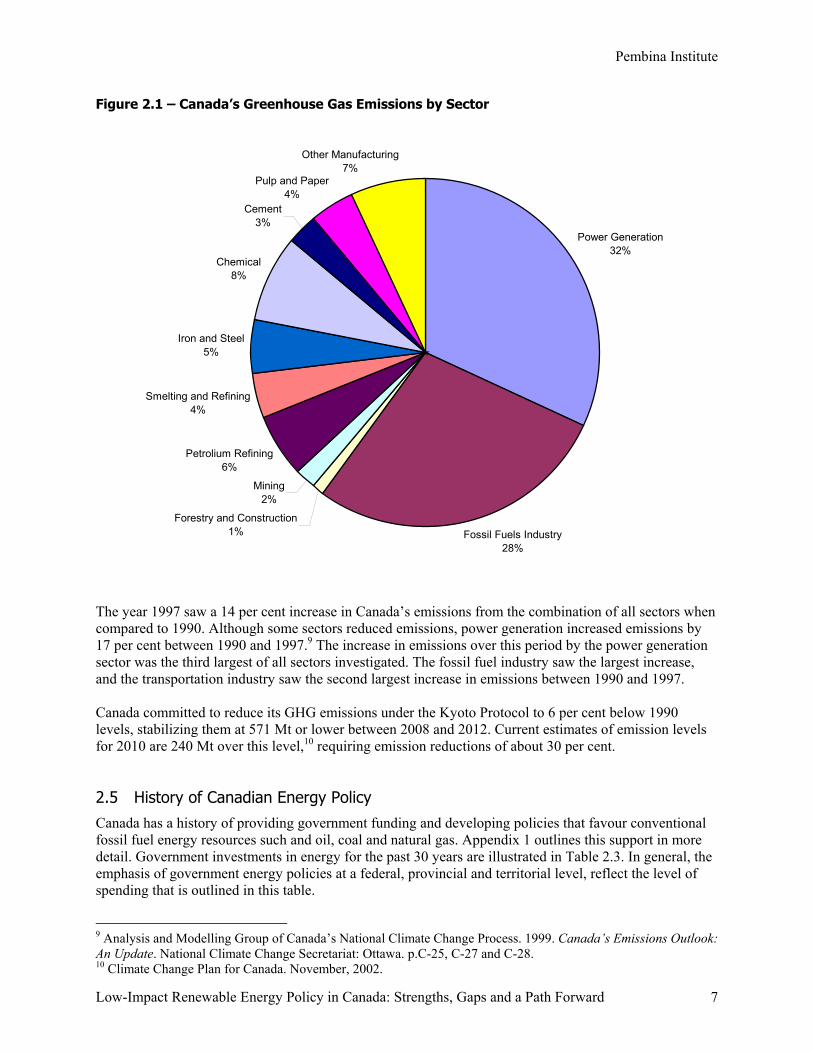
2.4 Greenhouse Gas Emissions Power generation in Canada is the largest contributor to greenhouse gas (GHG) emissions in the country. Emissions from industrial sources in Canada in 1997 was estimated at 336 million tonnes (Mt), half of Canada’s total emissions.8 The two largest contributors were electricity generation and oil and gas production, transmission and distribution, with 111 and 98 million tonnes of CO2 equivalent emissions (Mt) respectively. Figure 2.1 provides a percentage breakdown of greenhouse gas industry contributors.
8 Pembina Institute. Climate Change Solutions Web site. http://www.climatechangesolutions.com
Pembina Institute
Low-Impact Renewable Energy Policy in Canada: Strengths, Gaps and a Path Forward 7
Figure 2.1 – Canada’s Greenhouse Gas Emissions by Sector
Power Generation32%
Fossil Fuels Industry 28%
Forestry and Construction1%
Mining 2%
Petrolium Refining6%
Smelting and Refining4%
Iron and Steel5%
Chemical8%
Other Manufacturing7%
Cement3%
Pulp and Paper4%
The year 1997 saw a 14 per cent increase in Canada’s emissions from the combination of all sectors when compared to 1990. Although some sectors reduced emissions, power generation increased emissions by 17 per cent between 1990 and 1997.9 The increase in emissions over this period by the power generation sector was the third largest of all sectors investigated. The fossil fuel industry saw the largest increase, and the transportation industry saw the second largest increase in emissions between 1990 and 1997. Canada committed to reduce its GHG emissions under the Kyoto Protocol to 6 per cent below 1990 levels, stabilizing them at 571 Mt or lower between 2008 and 2012. Current estimates of emission levels for 2010 are 240 Mt over this level,10 requiring emission reductions of about 30 per cent.
2.5 History of Canadian Energy Policy Canada has a history of providing government funding and developing policies that favour conventional fossil fuel energy resources such and oil, coal and natural gas. Appendix 1 outlines this support in more detail. Government investments in energy for the past 30 years are illustrated in Table 2.3. In general, the emphasis of government energy policies at a federal, provincial and territorial level, reflect the level of spending that is outlined in this table.
9 Analysis and Modelling Group of Canada’s National Climate Change Process. 1999. Canada’s Emissions Outlook: An Update. National Climate Change Secretariat: Ottawa. p.C-25, C-27 and C-28. 10 Climate Change Plan for Canada. November, 2002.

Pembina Institute
Low-Impact Renewable Energy Policy in Canada: Strengths, Gaps and a Path Forward 8
Table 2.3 – Federal Government Spending on Energy
$40.4 billion Direct federal spending on fossil fuels between 1970 and 1999.11 $16.6 billion Total subsidies to the nuclear energy industry by the Government of Canada since
1953.12 $2.8 billion Loans to fossil fuel industry written off by the federal government since 1970, over and
above direct spending.13 $850 million Federal cost of cleaning up radioactive waste in Port Hope and decommissioning uranium
tailings sites.14 Historical waste practices in the refining and processing of uranium and radium resulted in contaminated sediment on the harbour of this Ontario municipality.
$156 million Federal subsidy to the Canadian nuclear industry in 2000.15 $12 million Total average yearly funding for renewable energy by the Canadian government.16 Outside of conventional energy, Canada has invested billions into nuclear power development, a unique heavy-water moderated fission technology called the CANDU reactor. Alternative and renewable sources of energy were a hot topic in 1970s when two OPEC oil shocks shook the fossil fuel-driven economy. Governments (including Canada’s) contributed large amounts of funding towards the development of alternative sources. Everything from coal gasification to wind turbines received some level of support for research and design. However, the 1980s brought about significant changes to the global energy picture. Unfortunately for North America, wind energy developments in the late 1970s and early 1980s took off faster than the industry could handle, resulting in poor designs that were installed prior to being commercially viable. At the same time, energy prices dropped substantially and new technologies began to enable the discovery and effective recovery of much-larger-than-expected deposits of fossil fuels. The Altamont Pass in California became the world’s testing ground for wind energy, but with turbine designs that had been thrown together by a young industry that was quickly running out of government funding and support. As a result the industry in North America has taken a hard hit financially and in how it is perceived. Public interest and government support for alternative energy quickly began to dry up and disappear. For solar power, which was also an expensive source of alternative energy, the lack of funding prevented it from achieving the technical improvements and manufacturing capabilities that were required for it to become more cost competitive. Canada has 2.3 per cent of the installed PV capacity in the world and one per cent of the global installed wind energy capacity. Europe however, did not experience the same boom and bust characteristics that had affected the North American renewable energy market. Europeans were more interested in, and receptive to, renewable energy and, as a result, took the initiative to make wind farms cost effective with production based on 11 Report of the Commissioner of the Environment and Sustainable Development – 2000. Chap. 3, Exhibit 3.3, p. 3–11. 12 Campaign for a Nuclear Phaseout. November 2000. Financial Meltdown: Federal Nuclear Subsidies to AECL. Nuclear Awareness Project. p.3. 13 Report of the Commissioner of the Environment and Sustainable Development – 2000. Chap. 3, para. 3.36, p. 3-12. 14 Report of the Commissioner of the Environment and Sustainable Development – 2000. Chap. 3, para. 3.37, p. 3–13. 15 According to Report of the Commission of the Environment and Sustainable Development, May 30, 2000. Chap. 3, para. 3.34. p.3–12. 16According to Report of the Commission of the Environment and Sustainable Development, May 30, 2000. Chap. 3, para. 3.34. p.3–12.

Pembina Institute
Low-Impact Renewable Energy Policy in Canada: Strengths, Gaps and a Path Forward 9
economies of scale.17 Europe has experienced support for renewable energy from all stakeholders, and politicians have influenced energy policy on behalf of renewable energy.18 Fortunately, the late 1990s introduced another market driver for alternative sources of energy in Canada and the US, one that European industry has benefited from for several years—environmental motives. Although the price of power will remain to be a primary driver for the development and implementation of new energy systems in Canada, now there are environmental consequences such as greenhouse gas emissions and global climate change concerns to assist in providing a more steady level of support to alternatives. Today, the federal, provincial and territorial governments have several programs in place, from funding for new renewable energy technology development to green-power procurement initiatives. Chapter 5 of this report outlines the various government programs. Since 1996, Natural Resources Canada has promoted the development and commercialization of emerging renewable energy technologies through their Renewable Energy Strategy.19 The principal objective of the program is to support the development of a more dynamic and self-sustaining renewable energy industry in Canada. This program is being implemented through partnerships with industry, provincial governments, communities and utilities.
17 Chapman, J.C. European Wind Technology – Research Project 1996-28 Final Report: March 1993, Palo Alto, California: Electric Power Research Institute. 18 Berger, John. Charging Ahead – The Business of Renewable Energy and What It Means for America: 1997. University of California Press. 19 Natural Resources Canada. Renewable Energy Strategy. http://www.nrcan.gc.ca/es/new/denis2.htm#renewable

Pembina Institute
Low-Impact Renewable Energy Policy in Canada: Strengths, Gaps and a Path Forward 10
3 Overview of Low-Impact Renewable Energy Technologies
3.1 Introduction and Definition Low-impact renewable energy (LIRE) sources are generally defined as including small-scale hydro, sustainably harvested biomass, wind, solar, earth and waste energy. Large-scale hydro with storage (i.e., which floods lands and degrades watersheds, at an ecological cost) and biomass fuels that are derived from unsustainable renewable resource use or land practices are normally excluded from this definition. Examples of LIRE technologies include:
• wind generated electricity; • solar heating or solar-generated electricity (e.g., photovoltaics); • biomass resources (if harvested and utilized in a sustainable manner); • water velocity energy (e.g., run-of-river, free stream, tidal or wave turbines); and • geothermal (earth) energy (including thermal energy in aquifers).
For more information on LIRE technologies, see the paper “Pembina Institute’s Green Power Guidelines for Canada”, available free of charge on the Internet.20
3.2 Resource Certification Standards Environment Canada developed the Environmental Choice EcoLogo program in 1998 to assist and encourage the supply and consumption of products and services that are more environmentally responsible. This program has made a commitment to assess and promote electrical energy sources that greatly reduce environmental impacts. The certification standard provides a market incentive to manufacturers and suppliers of environmentally preferable products and services, and thereby helps consumers identify products and services that are less harmful to the environment.21 The EcoLogo certification program is designed for a wide range of product categories. One category is “Alternative Source Electricity Generation.”22 This category recognizes electricity that has been generated from naturally occurring energy sources (such as the wind and the sun), and from power sources that, with the proper controls, add little in the way of environmental burdens (such as less intrusive hydro and certain biomass combustion).23 The EcoLogo program is about to release a set of guidelines for a new standard for “Renewable Low-Impact Electricity” that will replace the previous standard for “Alternative Source Electricity Generation.” This update reflects the maturation of the electricity marketplace and refines the power source eligibility requirements to reflect life-cycle environmental performance standards. The new guidelines include the following:24
• during project planning and development, appropriate consultation with communities and stakeholders must have occurred, and prior or conflicting land use, biodiversity losses and scenic, recreational and cultural values must have been addressed;
• the facility must be operating, reliable and non-temporary; • no adverse impacts can be created for any species recognized as endangered or threatened;
20 http://www.pembina.org 21 Environmental Choice Program Web site. http://www.environmentalchoice.com 22 Environmental Choice Program Guideline No. PRC-018 and PRC-029. 23 Environmental Choice Program Web site. http://www.environmentalchoice.com 24 Ibid.
Pembina Institute
Low-Impact Renewable Energy Policy in Canada: Strengths, Gaps and a Path Forward 11
• supplementary non-renewable fuels must not be used in more than 1.65 per cent of the fuel heat input required for generation;
• sales levels of ECP-certified electricity must not exceed production/supply levels; and • at least 50 per cent of the electricity supply must come from facilities constructed after 1991.
Specific sources which qualify under the EcoLogo include the following (including some information on specific eligibility criteria):
• solar (cadmium containing wastes must be properly disposed of or recycled); • wind (protection of concentrations of birds including endangered bird species); • water (compliance with regulatory licences; protection of indigenous species and habitat;
requirements for head pond water levels, water flows, water quality and water temperature; and measures to minimize fish mortality and to ensure fish migration patterns);
• biomass (use only wood wastes, agricultural wastes and/or dedicated energy crops; requirements for rates of harvest and environmental management systems/practices; and, maximum levels for emissions of air pollutants in areas with air quality problems);
• biogas, including landfill gas (maximum levels for emissions of air pollutants in areas with air quality problems; and leachate management);
• other technologies that use media such as hydrogen or compressed air to control, store and/or convert renewable energy; and
• geothermal technologies.
3.3 Canada’s Low-Impact Renewable Energy Resource Potential
The extent of the global low-impact renewable energy (LIRE) resource base is enormous. Solar radiation is absorbed on earth at an average rate of 120,000 TW,25 around four orders of magnitude (10,000 times) higher than the current global energy demand.26 Almost a third of the sun’s energy is converted to latent heat—and subsequently, potential energy—in the hydrological cycle. Smaller quantities are converted to kinetic energy in the form of the winds and waves. Around 30 TW is converted via photosynthesis into biomass energy. The ability to quantify the amount of the LIRE base that is recoverable is a difficult challenge, primarily for two reasons:
1. Geographical Constraints: Some areas where the resources are extremely strong are not developed due to their inaccessibility and the geographical differences between resource potential and energy demand.
2. Energy Conversion Efficiencies: The rate at which we are able to convert nature’s power into a useable form of energy is limited by the capabilities of the technologies that we use. Technologies are, however, improving at a dramatic rate and there are certainly some prospects of further increasing the recoverable resource base as these technologies continue to mature.
Canada’s large land and vast coastal areas puts it among the countries with the highest LIRE resource potential. Canada has over 300 remote communities where the high current cost of power enables the cost-effective integration of LIRE technologies immediately. In February 1999, Natural Resources Canada brought together several renewable energy experts from across the country to attempt to quantify the resource availability within the country for various technologies. This focus group took into account geographical distinctions as well as rural/urban and on-
25 1 TW = 1 terawatt = 1x10¹² watts. 26 Dr Tim Jackson and Dr Ragnar Löfstedt, Centre for Environmental Strategy, University of Surrey, Guildford.

Pembina Institute
Low-Impact Renewable Energy Policy in Canada: Strengths, Gaps and a Path Forward 12
grid/off-grid circumstances. The result was a mix of different renewable technologies in different niche areas—off-grid solar and wind in northern Canada, wind power on the coasts and an on-grid mix of renewables across the southern part of the country. The following sections provide a summary of locations and applications for various LIRE technologies in Canada.
3.3.1 Wind
Canada can boast a considerable wind resource due to its geographical location. Small wind turbines can be used for the remote small-scale applications, and large grid-connected wind farms can used for on-grid applications. Substantial potential exists in the northern remote regions, and along both coasts and in some site-specific locations in the prairie provinces. Some of these areas include regions that lack conventional energy resources.27
• northern Canada has a large, untapped wind resource, particularly in coastal areas; • British Columbia has a large untapped wind resource on the western coast, albeit transmission
line capacity in those areas is limited. In addition, vast resources exist in the northeastern and central parts of the province;
• southern Alberta has a large quantity of installed capacity and has the potential for significantly more development, particularly in the southwestern corner;
• the prairie provinces, particularly Manitoba, have some of the highest wind speeds in non-coastal areas. A new wind farm in southwestern Saskatchewan will demonstrate those resources;
• southern Ontario, on lake front areas, has a vast recorded wind resource, virtually untapped to date;
• Quebec is home to the largest amount of installed wind capacity in Canada. The two wind farms that exist there were installed in 1999 and have a combined installed capacity of 100 MW; and
• coastal Nova Scotia, Prince Edward Island and Newfoundland have some of the highest wind speeds in Canada, and yet have no installed wind power capacity to date.
3.3.2 Solar
The potential resource for solar heating and electricity is enormous even though northern countries have a poor solar resource relative to equatorial countries. The United Kingdom is located in a similar geographic region to Canada. A solar power assessment conducted in the UK showed that solar PV cells (electric) could produce an output equivalent to current UK electricity generation from 2 per cent of the land area. In fact, it has been calculated that this output could be achieved by integrating PV modules into roofs and walls, without any additional demand for land.28 Even in northern regions of the Yukon, solar power systems are being used to power telecommunication sites, highway maintenance camps and park facilities (see below for the economics of a specific PV installation in northern Canada).
3.3.3 Low-Impact Hydro
There is still significant potential for additional hydroelectricity production in Canada. There is an estimated potential of 182,832 megawatts (MW), including both high-impact (i.e., with reservoir flooding and watershed manipulation) and low-impact hydro. Of this potential 34,371 MW is considered practical for future development by electricity utilities after considering the technical, environmental and economic
27 Natural Resources Canada Renewable Energy Strategy. 28 Royal Commission on Environmental Pollution, Study on Energy and the Environment.

Pembina Institute
Low-Impact Renewable Energy Policy in Canada: Strengths, Gaps and a Path Forward 13
factors involved in developing a new project.29 Low-impact hydro is more difficult to estimate due to the very specific site characteristics required.
3.3.4 Sustainable Biomass
Wood is the most common type of biomass in Canada and is used extensively for space heating through wood stoves. Forestry waste, such as wood chips, hog fuel or sawdust, can be used for large-scale power and heat generation. In British Columbia and Alberta there are 2.9 million bone-dry tonnes of surplus wood residue annually, made up of wood shavings, sawdust and bark.30 In addition, biomass from wood, grains or other sources can be used for producing ethanol or biodiesel, both of which can be used as transportation fuels. Another source of biomass is municipal solid wastes or livestock wastes, all of which can be used to produce “biogas” for heat and power generation.
3.4 Economics of Low-Impact Renewable Energy The majority of the energy-generating costs for LIRE technologies are concentrated up front, primarily in capital expenditures. Operating and maintenance costs are low and there are no fuel costs. This is in contrast to some fossil fuel technologies such as natural gas power plants and boilers which have relatively low capital costs and high fuel costs. This section will highlight the costs of LIRE electricity technologies. The capital costs of LIRE technologies are decreasing due to improved manufacturing techniques, market development and larger technologies with improved economies of scale. Wind power costs have declined by more than 80 per cent. Similarly, the capital costs of solar power systems are decreasing. Recently published estimates by British Petroleum (BP) show solar PV installations prices per kW decreasing from US$4,000/kW to $3,200/kW between 2000 and 2005. Operating and maintenance costs include fixed annual costs and variable costs that increase in proportion to the amount of electricity produced. Due to improved economies of scale through larger LIRE developments, operating costs per unit of electricity generation are declining. A larger LIRE development will demonstrate lower operating costs when fixed costs such as labour and administration are covered by a larger electricity supply. Variable costs include many maintenance expenses and, in some cases, the cost of resource or land-use royalties to government or private landowners. An effective measure of the cost of energy supply is the levelled cost per unit of energy. For electricity supply, this is expressed in dollars per megawatt-hour (MWh) of electricity production or cents per kilowatt hour (kWh). The levelized cost is calculated based on the annualized capital, operating, fuel and maintenance costs. Capital costs are converted to a series of payments based on a “discount rate” that reflects the cost of capital to the investor in the project. In a graduate research project at Simon Fraser University in British Columbia, the cost of generation of LIRE technologies was assessed for application in British Columbia and Alberta using existing cost information and a forecast of pricing information for the year 2025.31 An estimate of the costs of LIRE supplies in 2025 from this study is summarized in Table 3.2. This project assumed a minimum market 29 Natural Resources Canada CanREN Web site. 30 McCoy, BW and DV O’Connor. Wood-Ethanol Opportunities and Barriers. Prepared for the Forest Sector Table, National Climate Change Process, Canada: February 1999. 31 Pape, Andrew. Implementing Sustainable Energy in Competitive Electricity Markets. Simon Fraser University. School of Resource and Environmental Management. December, 1997.

Pembina Institute
Low-Impact Renewable Energy Policy in Canada: Strengths, Gaps and a Path Forward 14
penetration of LIRE technologies in the marketplace equivalent to 10 per cent of the annual electricity supply and the achievement of significant “economies of manufacture”32 in the global LIRE marketplace. It should be noted that the wind power cost in this study reflected several small wind power facilities which have higher costs of electricity supply than several recent large-scale facilities (i.e., 100 MW or more) in Canada and the US An estimate of recent LIRE costs, also displayed in the table below, was completed by the Clean Air Renewable Energy Coalition.
Table 3.1 – Cost of Low-Impact Renewable Energy Supplies
Technology Type 200133 ¢/kWh
2025 ¢/kWh
Biomass co-generation 3.5 5.9
Low-impact Hydroelectricity
4–9 4.3
Wind 6.5–10 4.5
Solar PV 90 16.7
Tidal
10–25
8.1
Geothermal 5.5–9.5
Wave 4–9
Low-impact hydro supplies are generally the most cost-effective among LIRE technologies. However, many of the best sites have already been developed due to their cost-effectiveness, and these facilities are limited to regions of Canada with significant water and/or elevation change. Realistically, the largest untapped potential for hydro is in the mountainous west, in northern Ontario and Quebec, and in Newfoundland. Large-scale hydro systems have a greater chance of causing environmental repercussions and therefore are not considered to be “low impact” unless they do not have a storage reservoir. Biomass power plants based on wood-wastes from sawmills or pulp and paper plants offer a cost-effective source of LIRE but with an extremely limited development potential, which is limited mainly to areas with significant logging and where wood wastes are currently not used for other purposes. Wind power offers the largest potential for LIRE and for a reasonably cost-effective price. Wind power has recently proven to be cost competitive with conventional sources on a large energy production scale. Modern large wind turbines range in size from 600 kW to two MW standing on towers up to 90 metres in height. For wind farms that use multiple-unit arrays of large machines, the approximate installed cost is about CDN$1,500 per kW. The generation cost of a wind farm developed in 1999 in Quebec is $0.058/kWh. Since then, several wind farms in the US have achieved a similar or lower cost, indicating that prices are continuing to fall. Solar PV has a virtually unlimited capacity potential, but the cost of supply is the highest among LIRE options. This price is expected to fall dramatically, but only with significant public investments in installed capacity such as those already in place in Germany, Japan and the US. This will have the effect of driving the manufacturing cost down.
32 That production capacity in the renewable energy industry has achieved an improved level of efficiency due to the volume of sales in the marketplace. 33 Clean Air Renewable Energy Coalition Web site: http://www.cleanairrenewableenergycoalition.com

Pembina Institute
Low-Impact Renewable Energy Policy in Canada: Strengths, Gaps and a Path Forward 15
In remote areas that are off the main electrical grid in Canada, generating electricity with diesel generators can exceed $0.25 per kWh due to the high costs associated with diesel fuel transportation. For these applications LIRE is cost effective without accounting for the environmental and health benefits of using a non-polluting source of energy and the environmental risks of fuel transportation. A good example of the capability of solar power to offset diesel generation is the 1997 Northwestel34 1500-watt PV array at a remote microwave radio repeater at a site in the Nahanni Mountain Range of the Northwest Territories. This initiative was undertaken with the Canada Centre for Mineral and Energy Technology (CANMET), a network of energy and mining laboratories managed by Natural Resources Canada. Diesel generators previously powered the Nahanni radio repeater. The addition of the 1.5 kW PV array has considerably reduced fuel consumption at this site. The annual financial savings due to the decrease in fuel consumption totals approximately $8,250 and maintenance costs have decreased by $2,250 annually. These high savings are primarily a result of the need to use a helicopter to transport fuel to this location because there is no road access. The total capital cost of the installation in 1997 was $52,000. The PV retrofit will have paid for itself as of the end of 2001 and will continue to contribute similar annual savings for another 20 years. Northwestel has been pleased with the performance of this system and has considered similar retrofits to other high cost operating sites. Another component of electricity supply costs that is often ignored is the cost of environmental or social externalities such as air pollution, land or watershed degradation, toxic waste build-up, or greenhouse gas emissions. LIRE technologies have a zero or negative environmental and social cost because, by definition, they do not impact on the environment or communities adversely, and they can displace fossil fuel, large hydro and nuclear energy supplies which have a negative impact. This component is not normally included in the “economics” of energy supplies, making fossil fuel supplies appear cheaper than they actually are. By including such external costs in the assessment of energy system economics, LIRE technologies will be more competitive. This is addressed in Chapters 6 and 7.
34 Northwestel is a subsidiary of Bell Canada. Northwestel operates over 150 telecommunications sites that are not grid-connected, across the northern territories of Canada.

Pembina Institute
Low-Impact Renewable Energy Policy in Canada: Strengths, Gaps and a Path Forward 16
4 Overview of the Low-Impact Renewable Energy Market in Canada and Worldwide
4.1 Introduction
North America initiated the development and implementation of renewable energy in the early 1970s. Today, the new low-impact renewable energy industry (i.e., not including large hydroelectric power stations and the traditional use of biomass) has demonstrated a market size worldwide equivalent to US$6.78 billion.35 This industry is expected to grow to $82 billion by the year 2010. The European Union (EU) has been one of the most progressive entities in its support of LIRE. Globally, Europe is at the forefront of the majority of LIRE developments. Significant employment is associated with the LIRE industries in the EU, encompassing several hundred companies, mainly small and medium-sized enterprises in primary assembling/manufacturing. Canada and the US have not been able to bring the industry up to the European standard. The wind industry’s global statistics show that Canada has less then one per cent of the installed wind capacity in the world. In 1988, the US had 92 per cent of the wind energy capacity in the world, however, a complete reversal has taken place and North America has been left downwind of the new European leaders. Denmark has a remarkable success story and has led the way for the European domination over the wind power market. Denmark has 11 times the installed wind power capacity of Canada, equivalent to over 2,400 MW in 2001 as a consequence of supportive program and fiscal measures, producing 18 per cent of the domestic electricity supply. These included mandated percentages of renewable purchases, premium payments to wind project developers, shared costs of grid connection, favourable tax policies on the income generated from sale of wind electricity and reimbursement of the general carbon tax. Denmark has also benefited from significant industrial development and job creation. Danish turbines account for half of the global market share, worth US$1.5 billion in 1999. Wind turbine manufacturing, maintenance, installation and consultancy services account for some 12,000 jobs in Denmark, while component supplies and installation of Danish turbines currently creates another 6,000 jobs worldwide. Denmark has achieved significant environmental benefits worldwide from its new industry which produced 1,800 MW of wind turbines in 1999 alone, which is responsible for the displacement of fossil fuels where they are installed.36 North America is only going to fall further behind Europe in the renewable energy industry given the continual high level of support that the EU is investing. The EU recognizes that their dependence on energy imports is high. They see renewable energy as indigenous sources of energy that can play an important role in reducing the level of energy imports in order to create a balance of trade and of energy supply. The US and Canada are now largely out of the running when it comes to wind generation technologies. However, there is a large manufacturing capacity for solar PV technologies in the US, along with a significant capacity in fuel cell and other distributed generation and storage technologies, making certain North American companies the world leaders for those technologies.37
35 Makower and Pernick. Clean Tech: Profits and Potential. 2001. Downloadable at http://www.cleanedge.com 36 Clean Air and Renewable Energy Coalition. Backgrounder. 2002. http://www.cleanairrenewableenergycoalition.com 37 SolarAccess.com: San Francisco, California, US, 2001-05-02.

Pembina Institute
Low-Impact Renewable Energy Policy in Canada: Strengths, Gaps and a Path Forward 17
4.2 Solar Power The PV industry has recently seen similar success as wind power and is currently growing at a rate of 30 per cent a year.38 Recently published estimates by British Petroleum (BP), provided in Figure 4.1, show PV installations increasing from 200 MW in 2000 to 700 MW by 2005. One of the primary reasons for the rapid growth that has been predicted in the solar industry is the large price decreases that are expected to take place. BP predicts a 20 per cent decrease in price per kW of installed capacity (from US$4,000/kW to $3,200/kW).
Figure 4.1 – Predicted Worldwide PV Installed Capacity Growth39
0200400600800
100012001400
2001
2002
2003
2004
2005
2006
2007
2008
2009
2010
MW
Canada has only 2.3 per cent of the world installed PV capacity,40 well behind leaders such as Japan (26.6 per cent), Arab countries (12.4 per cent), the US (10.6 per cent), and Germany and India (each with 7.6 per cent).41 Japan’s installed capacity is extensive as a result of a government-supported rooftop PV program. Japan’s reasoning for putting such a large emphasis on PV is its lack of a domestic source of energy. Japan’s vast manufacturing industry has provided it with the capability to undertake the large rooftop initiative and has enabled it to dominate the solar industry for installed capacity. Arab countries have a large percentage of the world share due to the abundance of the resource enabling its cost-effective use. The applications of solar power in these countries are centred on the oil and gas industry. The majority of oil and gas operations are in remote locations lacking grid-connected power.
4.3 Solar Thermal
There are many applications of solar thermal energy that have been developed in Canada and, to a greater extent, in warmer countries.
38 John C. Dvorak, Forbes Global, May 14, 2001. 39 British Petroleum Solar. http://www.bpsolar.com 40 Maycock, Paul. The World Photovoltaic Market 1975–1998: PV Energy Systems Inc. Warrenton, VA. 41 Ibid.

Pembina Institute
Low-Impact Renewable Energy Policy in Canada: Strengths, Gaps and a Path Forward 18
Solar energy can be used to heat process water in various industries and commercial enterprises. Several cost-effective opportunities exist where warm/hot water consumption volumes are high. One of the best opportunities is in the fish farming or aquaculture industry. This includes both coastal areas for saltwater species as well as for land-based freshwater fish farming. Other opportunities exist in the agricultural sector, which uses extensive hot water for cleaning and feeding, and car washes and laundromats, which require large volumes of hot water. Solar energy can cost-effectively provide heating for swimming pools. Many residential pool owners use solar energy exclusively to heat their pools. On a larger scale, solar water heaters can help to reduce operating costs of municipal or private swimming pools that are currently using natural gas. Solar pool heating is cost-effective in numerous applications, but is particularly lucrative for pools which are currently heated with propane, oil or electricity. Solar energy can be integrated into industrial and institutional heating and cooling systems in a highly cost-effective manner. The integration of special building materials on the southern face of large industrial buildings can reduce heating and cooling costs, thus displacing natural gas (or other energy sources) used for those applications. Solar ventilation air heating has been cost-effectively applied in several large manufacturing facilities, community centres, schools, apartment buildings and other structures. The leading solar air heating product in Canada is the “SOLARWALL” technology. This dark-coloured cladding is attached to the side of a building serving a dual role of protecting the wall and heating and/or cooling the building. Fresh air enters the base of the south-facing SOLARWALL and is collected at the top to be ducted to a rooftop fan which circulates it throughout the building. Another application of solar air heating is for agricultural crop or wood drying. These types of systems incorporate a series of solar collectors that reduce the relative humidity of a large volume of air, creating an ideal indoor drying environment. Solar panels can be used to collect heat from the sun to preheat water before going into a conventional water heater that uses electricity or fossil fuels. This can be used for hot water in the commercial and industrial sectors. Examples include: restaurants, kitchens, apartments, residences, hotels, campgrounds and hospitals.
4.4 Wind Energy Wind energy is one of the fastest-growing sources of energy in the world. The worldwide wind energy capacity has grown by an average annual rate of 35 per cent over the past five years.42As shown in Figure 4.2, it is predicted that the growth of the industry will continue to remain strong. Today, wind energy is a US$7 billion per year industry worldwide.43
42 Clean Air and Renewable Energy Coalition. Backgrounder. 2002. 43 American Wind Energy Association Web site: http://www.awea.org

Pembina Institute
Low-Impact Renewable Energy Policy in Canada: Strengths, Gaps and a Path Forward 19
Figure 4.2 – Predicted Worldwide Wind Energy Market Growth44
$0$1,000$2,000$3,000$4,000$5,000$6,000$7,000$8,000$9,000
$10,000
2001 2002 2003 2004 2005
CD
N$
000,
000
Table 4.1 illustrates the installed wind capacity in several industrialized countries.
Table 4.1 – Comparison of Wind Power Capacity at the end of 2001 (MW)45
Germany 8,753
Denmark 2,417
USA 4,245
Spain 3,335
India 1,507
Canada 215
Europe Target: 20 per cent of electricity supplies from renewables by 2010.46
Canada’s installed capacity represents only 0.75 per cent of the installed capacity in the world.47 Canada’s wind power capacity grew from 140 MW to 206 MW in the year 2001,48 a 47 per cent growth rate, largely as a result of a federal government purchase of green power. Now the Canadian industry has several wind power developers and has recently begun to gain some momentum in its growth. The
44.Ibid. 45 Wind Power Monthly. December 2002. Web site: http://www.wpm.co.nz/ 46 In 1998, 9.8 per cent of the EU electricity supplies were from renewable energy. The majority of the growth to meet the proposed 2010 target will be from wind energy supplies. 47 Wind Power Monthly. October 2002. 48 Wind Power Monthly. April 2001.

Pembina Institute
Low-Impact Renewable Energy Policy in Canada: Strengths, Gaps and a Path Forward 20
Canadian Wind Energy Association tracks the installed capacity of wind power in Canada as per Table 4.2.
Table 4.2 – Installed Wind Power Capacity in Canada49
Site Date Installed Turbines
Total Nameplate Power (kW)
Status
Prince Edward Island
Prince Edward Island Energy Corporation North Cape
2001/11 8x Vestas V47-660 (660 kW) 5,280 Active
Quebec
Hydro-Québec Magdalen Islands
1977/05 1x custom VAWT (230 kW) 230 Removed
Eole (Hydro-Québec) Cap Chat
1988/03 1x custom VAWT – Experts Conseils Shawinigan (4 MW)
4,000 Inactive
Hydro-Québec Matane
1998/01 3x NEG-Micon 750/44 (750 kW)
2,250 Active
Le Nordais (Phase 1) Cap Chat
1999/03 76x NEG-Micon NM750/48 (750 kW)
57,000 Active
Le Nordais (Phase 2) Matane
1999/09 57x NEG-Micon NM750/48 (750 kW)
42,750 Active
Ontario
Ontario Hydro Tiverton
1995/10 1x Tacke TW-600 CWM (cold weather modified, 600 kW)
600 Active
Ontario Power Generation Pickering
2001/10 1x Vestas V80 (1,800 kW) 1,800 Active
Private Port Albert
2001/12 1x Vestas V47 (660 kW) 660 Active
49 Canadian Wind Energy Association Web site. http://www.canwea.ca

Pembina Institute
Low-Impact Renewable Energy Policy in Canada: Strengths, Gaps and a Path Forward 21
Table 4.2 – Installed Wind Power Capacity in Canada50 – Continued
Site Date Installed Turbines Total Nameplate
Power (kW) Status
Saskatchewan
Sunbridge (Suncor and Enbridge) Gull Lake
2001/09 17x Vestas V47-660 (660 kW) 11,200 Active
Alberta
Adecon Wind Farm Pincher Creek
1993/06 2x Adecon SL32 (100 kW) 8x Adecon SL32 (150 kW)
1,400 Inactive
Canadian Hydro Developers: Cowley Ridge Wind Farm Cowley
1993/12 2000/09
52x US Windpower (Kenetech) 33M-VS (360 kW) 5x US Windpower (Kenetech) 33M-VS (375 kW)
20,595 Active
Canadian Hydro Developers: Cowley Ridge North Wind Farm Cowley
2001/10 15x Nordex (1,300 kW) 19,500 Active
Canadian Hydro Developers: Sinnot Wind Farm Pincher Creek
2001/11 5x Nordex (1,300 kW) 6,500 Active
Dutch Valley Produce Wind Farm Pincher Creek
1992/06 3x Danish Windmatic 15 (65 kW)
195 Active
G&P Johnson 150 Site Pincher Creek
1993/05 1x Danish design (150 kW) 150 Active
Lundbreck Developments Joint Venture A Lundbreck
2001/12 1x Enercon E40 (600kW) 600 Active
50 Canadian Wind Energy Association Web site. http://www.canwea.ca

Pembina Institute
Low-Impact Renewable Energy Policy in Canada: Strengths, Gaps and a Path Forward 22
Table 4.2 – Installed Wind Power Capacity in Canada51 – Continued
Site Date Installed Turbines Total Nameplate Power (kW) Status
Vision Quest Windelectric: Pincher Creek (Castle River Wind Farm)
1997/10 2000/06 2000/11 2001/04 2001/11
1x Vestas V44-600 (600 kW) 1x Vestas V47-660 (660 kW) 14x Vestas V47-660 (660 kW)7x Vestas V47-660 (660 kW) 37x Vestas V47-660 (660 kW)
39,540 Active
Vision Quest Windelectric: Hill Spring
1997/11 1998/11 2000/06
1x Vestas V44-600 (600 kW) 2x Vestas V44-600 (600 kW) 1x Vestas V47-660 (660 kW)
2,460 Active
Weather Dancer I Peigan Nation Reserve (near Pincher Creek)
2001/09 1x NEG-Micon (900 kW) 900 Active
Yukon
Yukon Energy Corporation Haeckel Hill (Whitehorse)
1993/07 2000/11
1x Bonus 150 kW 1x Vestas V47-660 (660kW)
810 Active
Total (active only): 205,550 kW
Canada does not have any wind power technology of its own, and has been importing machines from the European industry leaders. Recently a blade manufacturing facility was constructed in Ontario, however, the majority of manufacturing taking place at this location is being sent to the US for installation.
4.5 Biomass Plants
There are several biomass energy generation projects in Canada. Some are used solely for district heating or to generate electricity while others provide both heat and power. A few examples are listed below:
• In Charlottetown, P.E.I., the wood-fired district heating system has been in operation since 1986. Using hot water as the heat transfer medium, it supplies heat to 15 buildings, including the provincial government buildings, city hall, two churches, three hotels and the fire hall. The system was designed to interconnect with a future, larger-scale district heating and co-generation system serving much of the downtown area. 52
• In Chapais, Quebec, the Chapais Generating Station uses wood fuel to generate 28 MW of power. The developer hopes to be able to use surplus heat to supply a district heating system for an industrial park in Becancour.53
• In Ouje-Bougoumou, Quebec, a Cree community has built a wood-fired district energy system that helps keep money in the community and improves local air quality.54
51 Canadian Wind Energy Association Web site. http://www.canwea.ca 52 Biomass District Energy Information Package. http://www.newenergy.org 53 Ibid.

Pembina Institute
Low-Impact Renewable Energy Policy in Canada: Strengths, Gaps and a Path Forward 23
• In Williams Lake, B.C., a pollution problem was turned into an energy solution with the construction of the Williams Lake power plant. This 60 MW facility burns wood waste from forestry operations in the area.55
• In the town of Ajax, Ontario, a central plant provides steam for a district energy system serving the community centre, Ajax Pickering Hospital, the Ajax Works Department and over a dozen industrial customers. The steam plant has been in operation since 1941. Biomass is the major source of fuel (mainly construction wood waste) and fossil fuels are used as a back-up. The steam is used for food processing, space heating, generating chilled water for space cooling and for humidification.56
• Located in Whitecourt, Alberta, is a 23 MW generating capacity biomass plant that uses fuel from nearby sawmills. The plant uses a fluidized bed technology. This plant was the first biomass power generating station in Canada to be recognized by Environment Canada’s Environmental Choice Program and receive EcoLogo certification.57
• In the spring of 1996, a co-generation project at Drayton Valley Power Ltd. was launched. With 10.5 MW of capacity, it operates by burning hog fuel produced in Drayton Valley, Alberta.
• Several other biomass plants are operating at pulp mills across Canada, although all of the heat and power is used by the industrial plant and not exported to the grid or for district heating systems.
• Two co-generation plants are under construction in British Columbia, a 25MW plant in Lytton and a smaller plant in Skookumchuk, each facilitated though a power purchase contract with BC Hydro.
• Two biomass plants are being proposed by BC Hydro in British Columbia, a 3.5 MW plant in Squamish and a 4.5 MW plant in Revelstoke.
• In Edmonton, Alberta, the local municipal waste landfill has been tapped for the extraction of biogas, which is used for power generation.
• A biogas co-generation plant using landfill gas is proposed for the Lower Mainland, British Columbia, with a capacity of 5.0 MW. 58
4.6 Low-Impact Hydroelectricity
Over the last decade, the small-scale hydroelectric industry has contributed about $100 million per year to the Canadian economy in manufacturing and services, and has added about 30 to 50 MW yearly to Canada’s power supply. Canada’s small hydroelectric manufacturers and service providers, such as consultants and financiers, also export to overseas customers. The following list provides an example of low-impact hydro sites that are registered and certified by Environment Canada’s Environmental Choice Program.59
• Regional Power Inc. is a Canadian independent power producer (IPP) that has been in the business of developing and operating electric generating plants for more than 17 years. During this period, Regional has developed five hydro-electric generating stations, which it currently owns and operates, and commissioned a sixth station that it operates for the owner. The total capacity of these facilities is 37 MW.
• IRRICAN Power is owned and operation by three irrigation districts located in southern Alberta: the St. Mary River Irrigation District, the Taber Irrigation District and the Raymond Irrigation
54 Ibid. 55 Ibid. 56 Ibid. 57 EPCOR Utilities Inc. Web site: http://www.epcor.ca 58 BC Hydro Web site: http://www.bchydro.com 59 Environmental Choice Program Web site – Alternative Source Electricity Generation section. http://www.environmentalchoice.com
Pembina Institute
Low-Impact Renewable Energy Policy in Canada: Strengths, Gaps and a Path Forward 24
District. Two hydroelectric plants are in operation on the irrigation canals—the Chin Chute Hydroelectric Project (11 MW) and the Raymond Reservoir Hydro Project (18 MW). Power is only produced when irrigation water is available, as irrigation demand takes precedence over power production. IRRICAN Power is presently investigating future hydroelectric sites on existing water conveyance infrastructures.
• CHI Canada Inc., under the Star Lake Hydro Partnership formed with Abitibi-Consolidated Inc., has developed and operates the 15 MW Star Lake Hydroelectric Generating Station in West Central Newfoundland. The remotely operated facility integrates environmentally friendly products and equipment such as biodegradable hydraulic oil for its intake gate system and an oil-less hydrostatic bearing for the turbine unit.
• A non-utility, private developer of hydroelectric power-generating facilities, Canadian Hydro owns and operates nine hydroelectric generating plants in three provinces totalling nearly 30 MW of capacity, including the 1.35 MW Moose Rapids Hydroelectric Plant in Ontario.
• Bracebridge Generation Ltd. operates two MW of waterpower generation from three plants located on the north branch of the Muskoka River in Bracebridge, Ontario. Construction plans and feasibility are being reviewed for an additional 1.5 MW of water power generation.
• BC Hydro has proposed the operation of 16 additional small hydro facilities, totalling 157.85 MW of water power generation.
BC Hydro, West Kootenay Power, Yukon Energy Corporation, NWT Power Corporation, Manitoba Hydro, Ontario Power Generation, Hydro Québec and Newfoundland Hydro operate or purchase power from many dozens of small hydro plants across Canada.
4.7 Ethanol
Ethanol is sold in Canada as a high-octane fuel that helps reduce air pollution while delivering improved vehicle performance. The Canadian ethanol industry is relatively new and growing. It was first blended and sold in Manitoba 20 years ago. Gasoline is now available with 5–10 per cent blended ethanol at approximately 1,000 locations in six provinces (the four western provinces, Ontario and Quebec). Canada’s annual ethanol production is approximately 225 million litres per year, some of which is exported to the US. Major initiatives are underway that will boost production significantly in the next few years. These include the development of new plants in Seaway Valley and Cornwall, Ontario, Varennes, Quebec; and Belle Plaine, Saskatchewan. As well, the federal government has committed to increase ethanol production by 750 million litres per year.60 Ethanol production facilities are listed in Table 4.3. While ethanol can be derived from a variety of sources, in Canada it has traditionally been made from starch contained in agricultural crops—corn, wheat and barley. The basic process involves the conversion of starch to sugars to ethanol via fermentation.61 New technology is providing opportunities to also produce ethanol from cellulosic feedstock, such as agricultural residues (including straw and grass hay) and forestry products (wood chips).62 The support of the federal and provincial governments has been crucial to the development of the ethanol industry. Tax incentives, research, procurement policies and political will are providing a kick-start to the efforts of farmers, manufacturers and environmentalists to make ethanol an excellent alternative to conventional fuel sources for Canadians.
60 Canadian Renewable Fuels Association (CRFA). http://www.ethanol-crfa.ca 61 Ibid. 62 Ibid.

Pembina Institute
Low-Impact Renewable Energy Policy in Canada: Strengths, Gaps and a Path Forward 25
Table 4.3 – Canadian Ethanol Production Facilities63
Firm Location Produce Ethanol From:
API Grain Processors Red Deer, Alberta Wheat feedstock
Broe Companies/Saskatchewan Government Partnership
Belle Plaine, Saskatchewan (to be completed in 2004) Tisdale, Saskatchewan (planning stage) Melville-Yorkton, Saskatchewan (planning stage)
Wheat, Straw, Wood by-products
Commercial Alcohols Inc. Tiverton, Ontario Chatham, Ontario Varennes, Quebec* (plant under construction)
Corn feedstock Corn feedstock Corn feedstock
Metalore Resources, Inc. Wheat feedstock
Mohawk Canada Inc. Minnedosa, Manitoba Wheat feedstock
Iogen Corporation Ottawa, Ontario Wood, Hay, Straw
Pound Maker Agventures Ltd. Lanigan, Saskatchewan Wheat feedstock
Seaway Grain Processors, Inc. Cornwall, Ontario (under construction)
Corn feedstock
Tembec Temiscaming, Quebec Wood waste
The following retailers sell ethanol-blended gasoline in Canada:64 Drummonds, Francis Fuels, GRA Ham Energy, Macewen Petroleum Inc., Mohawk Canada Ltd., Mr. Gas, Pioneer Petroleum, Sonic, Stinson Petroleum, Sunoco, Sunys, United Farmers of Alberta (UFA), UPI Inc. and W.O. Stinson.
4.8 Bio-oil Bio-oil is derived from the conversion of wood by-products such as sawdust, bark and shavings and is an alternative to fossil fuel oil. Bio-oil can replace fuel oil in slow and medium-speed diesel engines, small-scale gas turbines, and industrial and residential heating boilers. By-products are char and non-condensable gases. In Canada, total wood residue production is approximately 17.7 million tones per year from pulp and paper mills and sawmills.65 Seventy per cent of this is currently consumed by the industry, while the remaining 30 per cent (5.1 million bone-dry tonnes per year – BDts/yr) is currently incinerated or land
63 Ibid. 64 Ibid. 65 Hatton, T. Canada’s Wood Residues: A Profile of Current Surplus and Regional Concentrations, March 1999, completed for National Climate Change Process – Forest Sector Table.

Pembina Institute
Low-Impact Renewable Energy Policy in Canada: Strengths, Gaps and a Path Forward 26
filled.66 In western Canada, there are a number of mill locations with surplus wood residue supplies over 250,000 tonnes per year.67 It is possible to produce 950,000 bbl/year of bio-oil. DynaMotive, a Vancouver-based company, is currently operating a pilot scale plant of 10 tonnes of feedstock per day. Plans are in place for three additional plants in 2003: a 100-tonne-per-day plant in the UK for electricity generation, a 200-tonne-per-day plant in Canada to replace natural gas use in the forestry industry, and a 400-tonne-per-day plant in the US that will target the coal industry.68
4.9 Current Drivers for Low-Impact Renewable Energy Development69 The demand for LIRE is increasing as costs for products decrease and the technology improves, allowing for the cost effective implementation of systems on a broader scale. There are two main market drivers that have provided the investment and incentive to recognize these improvements—an urgent need for additional energy capacity (energy driven market), and environmental objectives such as the reduction of CO2 emissions. The following map shows the regions where each of these is the primary driver represented by the estimated growth in wind energy capacity from 1999 to 2003.
Figure 4.3 – Forecast of Wind Energy Development, 1999–2003
66 Hatton, T. Canada’s Wood Residues: A Profile of Current Surplus and Regional Concentrations, March 1999, completed for National Climate Change Process – Forest Sector Table. 67 Ibid. 68 DynaMotive Web site: http://www.dynamotive.com 69 Reference for this Section: BTM Consult: International Wind Energy Development, World Market Update 1998.

Pembina Institute
Low-Impact Renewable Energy Policy in Canada: Strengths, Gaps and a Path Forward 27
4.9.1 Energy-Driven Markets
Global demand for new electricity capacity is expected to reach 1,275,000 MW by 2015 as rural populations continue to grow and desire the benefits associated with electricity. Extending the national electricity grid into rural areas has always been a costly exercise, however it has been the conventional way of providing power without much thought as to the appropriateness. Today, grid extension must compete with alternative methods of electrification. Rural areas have the ability to “leap frog” to a new system of decentralized or distributed generation now that the technologies and expertise are available. This can provide significant cost savings. A similar scenario has occurred with other technologies in the developing world, such as telecommunications. The conventional grid system for telephones has been passed up in many areas for the more convenient and less expensive to implement cellular network. Although increased energy requirements are not the main driver for renewable energy implementation, this may soon become a more important incentive. In North America and Europe, capacity growth will severely strain many existing transmission and distribution systems. The renewable energy market on these continents is considered to be driven by environmental issues, however, in the very near future the North American market could also begin to feel energy-driven growth as electricity markets transform under a deregulated structure. Upgrades to the current electricity systems in this market can be cost prohibitive and the cost may not be recoverable in a deregulated industry. Under deregulation, utilities are being unbundled into generation, transmission and distribution components and new entrants have become significant participants in the generation of electricity as the industry moves toward deregulation. The construction of new power-generating plants and transmission lines to meet new demand has virtually halted as companies wait to understand the effects of deregulation of the electric utility industry. This imbalance becomes even more threatening amid projections that electricity demand will grow 17 per cent by 2007 as transmission capacity rises only four per cent. Electric utility expansion plans in 70 developing countries indicated that electricity demand was expected to grow at an average rate of 6.6 per cent per year in the 1989–1999 period, with total capacity additions of more than 380 GW, raising installed generating capacity by more than 80 per cent. Asia accounted for more than 60 per cent of these requirements; Africa accounted for less than two per cent. The US$745 billion (1989 dollars) of capital expenditure plans were dominated by coal thermal (44 per cent), hydro (36 per cent) and gas thermal (10 per cent). In terms of electricity supply, coal was planned to provide almost one half while hydro would provide a little less than one third. Coal use would nearly double in volume (bringing significant increases in domestic and global pollution). And, although funding difficulties experienced by electricity utilities in many developing countries mean that plans are not always fully realized, developing country electricity supplies and their associated environmental impacts are still likely to grow with striking rapidity over the next several decades.
4.9.2 Environmentally Driven Markets
Concern about the increasing level of greenhouse gases, such as carbon dioxide produced as a result of fossil fuel combustion, is intensifying global interest in renewable sources of energy. As the electricity market becomes more competitive, utilities and other power suppliers are looking for ways to differentiate their products. Canadian corporations and provincial and federal governments consider one of the best ways to create a unique product that appeals to the public is to offer “green power” (i.e., electricity from clean energy sources) at a premium price. Utilities are selling clean electricity as part of green-power programs, and consumer demand for green power (even though still very small) is beginning

Pembina Institute
Low-Impact Renewable Energy Policy in Canada: Strengths, Gaps and a Path Forward 28
to result in the building of new power projects.70 Canada’s current green-power procurement initiatives are detailed in Chapter 5 of this report. The European Union has recognized the urgent need to tackle the climate change issue, and as such has adopted a position through the Kyoto Protocol of an eight per cent greenhouse gas emissions reduction target from the 1990 level by the year 2012. In order to facilitate the Member States achieving this objective, the European Commission has identified a series of energy actions—including a prominent role for renewable energy. Although the use of renewable energy in developing countries is primarily being driven by increased energy demand, these areas could soon be faced with environmental drivers as well. For global pollution, given the projected role of fossil fuels, especially coal, in future electricity generation scenarios, and given the rapid growth in the transport sector, it is no surprise to find projections of rapid increases in future developing country greenhouse gas emissions. Numerous scenarios have shown the developing countries’ share in global emissions rising from less than 30 per cent in 1990 to well over 50 per cent by the second half of the 21st century, with the growth in fossil-fuel-generated electricity being a significant part of this.71
70 Gray, Tom, American Wind Energy Association. More New Wind Generating Capacity then Nuclear Installed Worldwide for the Second Year in a Row: May 10, 2001. 71 http://www.iaee.org/newsltr/96win2.htm
Pembina Institute
Low-Impact Renewable Energy Policy in Canada: Strengths, Gaps and a Path Forward 29
5 Current Low-Impact Renewable Energy Policy in Canada Although Canada is not a leader among industrialized countries in the promotion of low-impact renewable energy (LIRE) through government policy, there are several programs in place, which are highlighted in this chapter.
5.1 Federal Government Leadership
5.1.1 Wind Power Production Incentive
The Wind Power Production Incentive (WPPI), announced in the 2001 federal budget, is intended to support electric utilities, independent power producers and other stakeholders in gaining experience in wind energy. $260 million of financial support is provided for the installation of 1,000 MW of new capacity over the next five years. The incentive will cover approximately half of the current cost of the premium for wind energy in Canada compared to conventional sources. This incentive will be available to electricity producers from all regions for the first 10 years of a project. The WPPI is expected to leverage approximately $1.5 billion in capital investments across Canada. Wind power capacity installed under WPPI, and consequent displacement of other energy sources, is projected to reduce GHG emissions by three megatonnes annually by 2010.72
5.1.2 Market Incentive Program for Emerging Renewable Energy
The Market Incentive Program (MIP) for Distributors of Emerging Renewable Electricity Sources is part of the Government of Canada Action Plan 2000 on Climate Change as a new measure to reduce greenhouse gas emissions. The incentive program is intended to complement another government initiative, the Procurement of Electricity from Renewable Resources for Federal Facilities. MIP is meant to encourage electricity distributors to experiment with ways of stimulating electricity sales from emerging low-impact renewable energy sources. The program will provide $25 million of funding through to March 31, 2006.73
5.1.3 Climate Change Plan for Canada
The November 2002 plan includes targets for biofuels (ethanol and biodiesel) and renewable energy. Ethanol fuel use in vehicles is targeted to increase from the current level of 240 million litres per year to one billion litres in 2010, enough ethanol to blend into 25 per cent of Canada’s gasoline. To help meet the target, the Future Fuel Initiative will build on current federal and provincial excise tax exemptions on the ethanol portion of gasoline, as well as federal funding for research and development and the use of ethanol in the federal fleet. Biodiesel fuel use is targeted to increase to 500 million litres by 2010. The Climate Change Plan proposes that federal, provincial and territorial governments collaborate on how to reach the target using a variety of tools including incentives, standards and research and development. The plan also sets the target of at least 10 per cent (3.9 MT) of new electricity-generating capacity in Canada to come from emerging renewable sources. According to the Climate Change Plan, “This could be achieved in a number of ways, including expanded production incentives, renewable energy portfolio standards in provinces, increased efforts to develop market demand, as well as the stimulus provided by the proposed emissions trading system. A federal-provincial working group is examining how renewable portfolio standards could work in the Canadian context.” Consumers are also urged to purchase emerging renewable energy from their utilities. The development of an electricity labelling scheme indicating the relative environmental impact of different electricity-generating sources is also proposed. A review
72 Natural Resources Canada Web site: http://www.nrcan.gc.ca 73 Ibid.
Pembina Institute
Low-Impact Renewable Energy Policy in Canada: Strengths, Gaps and a Path Forward 30
process of low-impact, large-scale hydro projects for logo qualification will be included in the federal “green-power” guideline.74
5.1.4 Federal and Provincial Research and Development
The Renewable Energy Technologies Program (RETP) of the Office of Energy Research and Development (R&D) supports efforts by Canadian industry to develop and commercialize advanced renewable energy technologies that can serve as cost-effective and environmentally responsible alternatives to conventional energy generation. For example, Natural Resources Canada is contributing R&D funding to DynaMotive to scale up their prototype Bio-oil facility in Vancouver. The Federal Government has funded numerous information programs through the RETP and other channels, including funding RETP’s industry associations such as Canadian Wind Energy Association (CANWEA), the Canadian Solar Industries Association (CANSIA) and the Canadian District Energy Association (CDEA), among others. The Community Energy Technology Centre at Natural Resources Canada has completed feasibility studies for a number of district heating projects in B.C. Most recently, the City of North Vancouver, the Town of Revelstoke and the City of Kamloops have received funding for these initiatives. Funding is provided from a revolving fund whereby project proponents pay back the cost of the feasibility study, if the project moves ahead. The Renewable Energy in Remote Communities (RERC) Program aims to accelerate the deployment of renewable energy technologies in more than 300 remote Canadian communities that are not connected to the main electricity grid or to natural gas networks. RERC provides community decision-makers with the tools, information and knowledge needed to assess the feasibility of renewable energy systems, to select the most cost-effective technologies and to implement projects. RETScreen is a renewable energy awareness, decision-support and capacity-building tool developed by the CANMET Energy Diversification Research Laboratory (CEDRL) with the contribution of experts from industry, government and academia. The core of the tool consists of standardized and integrated renewable energy project analysis software that can be used to evaluate the energy production, life-cycle costs and greenhouse gas emission reductions for various types of renewable energy technologies. However, the dataset for energy resources in RETScreen is fairly limited, such that the tool may not be sufficient to replace individualized business case studies. The Foundation for Sustainable Development Technology in Canada (SDTC) works at arm’s length from the federal government to provide seed money for innovations that reduce greenhouse gases and improve air quality. Foundation members of this non-for-profit are drawn from the business community, academia and not-for-profit organizations. With an initial infusion of $100 million, the fund now has over $6 million to distribute on a project-by-project basis. Eight projects have been selected to receive funding, and are expected to reduce 11.2 megatonnes of greenhouse gases within the Kyoto timeframe of 2008–2012. The following is a description of projects related to renewable energy:75
Bio-Terre Systems – Sherbrooke, Quebec: This project is a complete process chain designed to produce energy from hog manure and to manage nutrients from intensive pig farming in a sustainable fashion. It is designed to capture and treat methane gas and then convert it into usable energy to meet site-specific energy demands.
74 Government of Canada Climate Change Web site: http://www.climatechange.gc.ca 75 Natural Resources Canada Web site: http://www.nrcan.gc.ca

Pembina Institute
Low-Impact Renewable Energy Policy in Canada: Strengths, Gaps and a Path Forward 31
Carmanah Technologies – Victoria, B.C.: This is an adaptation of solar-powered LED technology to edge-lit signage, which will lead to the development of a more diverse and robust solar industry, in which solar-powered lighting enters mainstream applications.
The Conserval Group – Toronto, Ontario: SOLARWALL panels have been installed in hundreds of locations around the world. The objective of this project is to enable greater utilization of building surfaces to capture solar energy and convert it to warm air. This will result in higher emission reductions from fossil-fuelled power-generation sources.
Technology Early Actions Measures (TEAM) supports cost effective technology projects that will lead to significant reductions in greenhouse gas emissions. The program is a component of the Climate Change Action Fund (CCAF), a $150-million fund established in the 1998 federal budget. CCAF supports projects that raise public awareness and understanding of climate change issues, research climate change and promote early actions by Canadians to reduce greenhouse gas emissions.
The eight projects funded by TEAM will receive approximately $1.4 million from NRCan and $6.1 million from TEAM. The total Government of Canada contribution is approximately $7.7 million, including $200,000 from other federal departments. Those related to renewable energy are listed below:
Biox Corporation: Improved Processing of Biodiesel Biox Corporation is building a process demonstration unit with a capacity of one million litres/year, the first of its size in Canada. The unit will produce biodiesel from vegetable oils, waste fats and greases, using a new process that cuts feedstock and processing costs related to biodiesel production by as much as 50 per cent. Construction is underway at Trimac Truck Lines in Oakville, Ontario. The project is expected to save 13 tonnes of CO2 per year and 15,000 tonnes per year within 10 years.
Polymarin-Bolwell Composites Inc.: Manufacturing of Wind Turbine Blades Polymarin-Bolwell Composites Inc. (PBC) is developing a blade-making technology for wind turbines for domestic and international markets. The technology can be applied to generic wind turbines and used on other glass-fibre products that PBC manufactures. The company has also applied their manufacturing process to aircraft flight simulators. The technology developed by this project has reduced the use of harmful solvents and waste air emissions at the Polymarin-Bolwell plant by 95 per cent.
Conserval Engineering: Solar Crop Drying Conserval Engineering is demonstrating cutting-edge solar air-heating technology at test sites throughout Central America and Asia. The three-year project is an important step in proving the viability of solar technology for agricultural and commercial drying applications worldwide. Conserval’s solar absorber technology is 40 per cent more efficient and 25 per cent cheaper than other solar heating technologies, allowing the technology to compete with traditional fossil-fuel energy sources. Testing at sites in Panama, China and India have begun and negotiations for additional locations continue. The initial test sites are expected to reduce CO2 emissions by 1,000 tonnes per year.
SCP Group: Small Hydro in Nepal SCP Group is implementing 3.4 MW of small hydropower at a demonstration site on the Khudi River in Nepal. The National Electricity Utility will distribute the electricity to remote towns and villages, where more than 85 per cent of the population have no access to electricity and depend on fuel-wood and residues as their primary source of energy. Excess energy generated could be distributed to other towns and villages. The project is estimated to reduce CO2 emissions by 20,000 tonnes per year.
Pembina Institute
Low-Impact Renewable Energy Policy in Canada: Strengths, Gaps and a Path Forward 32
5.1.5 Federal Taxation Measures
Canadian Renewable and Conservation Expenses (CRCE) The Canadian Government Department of Finance established a new class of expenditures for income tax write-offs in 1996—the Canadian Renewable and Conservation Expenses. Included in this class of expenses are several pre-development costs associated with the renewable energy projects. This applies to costs associated with equipment eligible for Class 43.1 (see below). The CRCE category of expenditures allows for full deductibility in the first year of operation and permits such expenses to be transferred to shareholders who have entered into a flow-through share agreement.76 Expenses included are:
• the cost of pre-feasibility and feasibility studies of suitable sites and potential markets; • costs related to determining the extent, location and quality of energy resources; • negotiation and site approval costs; • certain site preparation costs that are not directly related to the installation of equipment; • service connection costs incurred to transmit power from the project to the electric utility; • the cost of test equipment for wind energy, which is loosely defined as turbines that are 1,500
metres apart from another machine in a project. In addition to the turbine spacing requirement, the government requires separate monitoring of performance on each machine with data sent to the government for a two-year period; and
• cost of acquiring and installing more than one test turbine as part of a wind farm. This is a recent amendment as of 2002.
Class 43.1 Capital Cost Allowance Class 43.1, described in Schedule II of the Canadian Income Tax Act, provides an accelerated rate of write-off for certain capital expenditures on equipment that is designed to produce energy in a more efficient way or to produce energy from alternative renewable sources. Class 43.1 allows taxpayers to deduct the cost of eligible equipment at up to 30 per cent per year, on a declining balance basis.
5.1.6 Federal Government “Renewable Energy Deployment Initiative”
In December of 1997 Natural Resources Canada (NRCan) announced a “Renewable Energy Development Initiative” (REDI). REDI came into effect on April 1, 1998, and is a six-year, $24-million program designed to stimulate the demand for renewable energy systems for space and water heating and cooling. These systems include:
• active solar hot-water systems; • active solar air-heating systems; and • highly efficient and low-emitting biomass combustion systems.77
The program is designed to encourage the private sector to gain experience with active solar and large biomass combustion systems. Businesses are eligible for a refund of 25 per cent of the purchase and installation costs of a qualifying system, up to a maximum refund of $80,000. In remote communities, businesses, institutions and other organizations may be eligible for a refund of 40 per cent of the purchase and installation of a qualifying system, up to a maximum refund of $80,000. During 1999 and 2000, REDI received 51 applications for the incentive program, yielding $641,000 in REDI contributions. In 2000, nine businesses received funding for space and water heating, totalling $119,910.78
76 Canadian Government Department of Finance. Tax Expenditures 2000, Chapter 3 Description of Corporate Income Tax Expenditures. 77 Natural Resources Canada Web site: http://www.nrcan.gc.ca 78 Ibid.

Pembina Institute
Low-Impact Renewable Energy Policy in Canada: Strengths, Gaps and a Path Forward 33
5.1.7 Federal Government and Federation of Canadian Municipalities Funds
The $25-million Green Municipal Enabling Fund (GMEF) offers grants to eligible recipients for feasibility studies that assess the technical, engineering, environmental and/or economic viability of proposed municipal environmental projects. GMEF aims to support feasibility studies of projects that improve air, water and soil quality, protect the climate and encourage the sustainable use of renewable and non-renewable resources. Grants for feasibility studies will not exceed $100,000.79 In addition, the $100-million Green Municipal Investment Fund (GMIF) provides interest-bearing loans, loan guarantees and grants to eligible recipients carrying out municipal environmental projects that improve energy and process efficiency in municipal buildings, and water, wastewater, solid waste management and public transit systems. The fund works with municipal governments to target initiatives that improve the eco-efficiency of their operations. The fund is designed to operate in perpetuity as a revolving fund where repaid loans are recycled to invest in new projects. Loan participation by the fund is limited to 15 per cent of capital costs (up to 25 per cent in exceptional cases); grants and long-term loans for pilot projects can cover up to half of the capital costs. Loan guarantees will cover a portion (possibly the first 25 per cent) of a project’s revenue shortfall. It has not yet been determined whether a limit is required on the total loan or grant per project. Renewable energy projects funded by the Green Municipal Enabling Fund, April to October 2002:
• District of Kitimat: Geothermal Technology Feasibility Study; • Uniterre Resources Limited/Village of Masset: Wind Power Feasibility Study; • City of Prince George: (Biomass) Community Energy Systems-Enhanced Feasibility Study; • City of Dawson: Solar Water Heating for Municipal Works; • City of Regina: Feasibility Study for Landfill Gas Extraction; • City of Prince Albert: Wastewater Treatment Plant Heat Recovery; • Hearthmakers Energy Co-operative Inc./Municipality of Frontenac Islands: Wolfe Island Wind
Farm Feasibility Study; • Hearthmakers Energy Co-operative Inc./ City of Kingston: Community Trade Winds: Trading
Energy Losses for Energy Profits; • City of Timmins: Geothermal Energy Project; • City of Greater Sudbury: Feasibility Study for a Major Wind Farm; and • City of St. John’s: Methane Gas Study – Robin Hood Bay Landfill.
Renewable energy projects funded by the Green Municipal Investment Fund, April to October 2002:
• Regional District of Fraser-Fort George: Gas Capture and Flare, Hart Road Landfill Site; • Regional District of Nanaimo: Gas Capture and Flare, Cedar Road Landfill Site; • Maxim Power Corporation/City of Vancouver: Vancouver Landfill Gas Utilization; and • Toromont Energy Limited (ON) /City of Waterloo: Waterloo Landfill Gas Power Plan – Heat
Recovery Utilization, Organic Rankin Cycle.
5.1.8 Micropower Connect Guidelines
The federal government is supporting an initiative to address technical issues for the connection of small-scale, distributed, renewable energy technology to the grid. Electro-Federation Canada, Natural Resources Canada and Industry Canada have committed to support the manufacturers of alternate energy (i.e., photovoltaic, wind, fuel cells, micro turbines) with their objective to establish a renewable and distributed
79 For more information, see http://www.fcm.ca

Pembina Institute
Low-Impact Renewable Energy Policy in Canada: Strengths, Gaps and a Path Forward 34
generation industry. The project is centred in the development and implementation of a Canadian guideline for the interconnection of small, distributed power sources.80
5.2 Current Provincial and Territorial Government Policy Initiatives
5.2.1 Yukon
The Yukon Green Power Initiative was announced by the government in 1999 and is being developed by the Yukon Development Corporation. Various renewable energy initiatives, focused on electricity generation, are being considered within this $3-million project. This is in addition to a $2-million Wind Research and Development Initiative that was used to pay for a new 660 kW wind turbine for grid interconnection in Whitehorse. Elements include: an education and training component, funding for research and development, installation programs including a production incentive, and net metering for small-scale renewable energy supplies. The most significant initiative within the GPI is a production incentive of between two and five cents per kWh, which will apply to new green-power developments.81
5.2.2 British Columbia
The B.C. government’s former Climate Change Business Plan included a “Renewable Energy Technology Program.” The program, which has now been cancelled, involved the B.C. government working with stakeholders and other governments for the development of renewable energy in B.C. $850,000 of financial support, over three years, was allocated to the program in October 2000 with objectives to:
• promote cleaner, more benign renewable energy sources; • reduce emissions of greenhouse gases within the province; and • encourage industry and employment growth in B.C.’s renewable energy sector.82
In the year 2000, nearly $193,000 was allocated to the following six demonstration projects.83 The strong orientation toward thermal technologies is largely due to the fact that no electrical projects at an appropriate magnitude were on the table at the time and there was a strong need to commit the funding in a short period of time:
1. $99,000 to DynaMotive Technologies Corp. to extend the research program with its $1.6-million project focused on producing bio-oil fuel from wood residue;
2. $25,000 to Redfish Ranch Ltd. in Courtenay to buy and install solar panels on the roof of its tilapia fish hatchery building for heating water;
3. $20,000 for photovoltaic systems to replace propane use at park buildings at the Carp Lake campground north of Prince George and the Berg Lake patrol cabins in Mount Robson Provincial Park;
4. $19,500 to Cranberry Commons Co-housing to install solar hot water panels on the roof of its 22-unit, multi-family residential building under construction in Burnaby;
5. $18,500 to the campus sustainability office at the University of B.C. for the research and design of a building-integrated photovoltaic system for the Michael Smith Biotechnology Laboratory; and
6. $10,000 to the Hope and District Recreation Commission to buy and install solar heating for the Almer Carlson outdoor pool in North Bend.
80 http://www.micropower-connect.org/ 81 Canada-Yukon Energy Solutions Centre web site: http://www.nrgsc.yk.ca 82 BC Ministry of Employment and Investment. BC Renewable Energy Technology Program Backgrounder. October 2000. 83 Ministry of Employment and Investment Press Release. April 17, 2001.

Pembina Institute
Low-Impact Renewable Energy Policy in Canada: Strengths, Gaps and a Path Forward 35
A new B.C. Energy Policy was released in 2002 that includes an action plan to be implemented over the next two years. The purpose of the plan is to “ensure low electricity rates and public ownership of BC Hydro, secure and reliable energy supply; increased opportunities for the private sector in energy production; and environmentally responsible energy development and no nuclear power sources.” Among the 26 measures included in the plan, is a voluntary goals for electricity producers to acquire 50 per cent of new supply from “B.C. Clean Electricity” over the next 10 years. Included in a broad definition of B.C. Clean Electricity are efficiency improvements at existing facilities, co-generation of heat and power, as well as all low-impact renewable energy technologies. Possible rate increases of 0.1 to 0.2 per cent over the next decade are predicted to be a side effect of the voluntary goal. Policies such as net metering and interconnection standards will be developed to support the goal. Another program offered by the B.C. government is a tax exemption. The Social Services Tax Act provides exemptions for prescribed energy conservation materials, equipment that uses alternative energy sources, and for natural gas and propane conversions kits for internal combustion engines. The exemption is limited to the items specifically included in the regulations, including:
• wind-powered generating equipment; • solar photovoltaic systems; • solar thermal systems; and • micro-hydro turbines and systems generating less than 150 kW.
The B.C. government has been actively encouraging the phase-out of beehive burners used for incinerating wood waste at sawmills throughout the province. This has resulted in a number of biomass projects, including a 60 MW power plant in Williams Lake, a combined heat and power facility in Skookumchuk in the east Kootenays, a potential co-generation facility in Smithers and a bio-oil plant in Prince George. Through the “Green Economy Initiative,” an environmental tax shift pilot program has been established to provide rebates and investment into research and commercialization of new technologies for value-added uses of wood waste. Connected with that is a special program to promote the production of ethanol from wood waste as a transportation fuel. The Ethanol B.C. program is a partnership among universities, the forestry sector, the province, the petroleum industry and Natural Resources Canada to explore opportunities for utilizing wood waste to generate ethanol.
5.2.3 Alberta
Alberta’s Action Plan on Climate Change, released in fall of 2002, includes targets to reduce greenhouse gas emissions intensity and to increase investment in renewable energy. Greenhouse gas emissions intensity (emissions per dollar of economic production) is to be reduced by 50 per cent below 1990 levels by 2020 through investment in research, innovation technology, sectoral agreements, energy efficiency and consumer conservation. New renewable and alternative energy resources will make up 3.5 per cent of Alberta’s total energy capacity by 2008, equalling about 560 MW of new capacity. The Clean Air Strategic Alliance Electricity Project Team will develop a framework for meeting this target.84 The following is a list of efforts to enable the target to be reached:
• emissions intensity of electricity supplied to consumers will be reported by electricity retailers;
84 Government of Alberta Web site: http://www.gov.ab.ca
Pembina Institute
Low-Impact Renewable Energy Policy in Canada: Strengths, Gaps and a Path Forward 36
• at least 25 per cent of electricity consumed at government facilities will be generated from green-power sources in 2004;85 and
• the government will continue to support the development of green corridors, thus promoting increased use of alternative fuel vehicles.
5.2.4 Saskatchewan
The Saskatchewan climate change plan released in 2002, announced the establishment of an Office of Energy Conservation, to undertake energy conservation initiatives and to provide information to the public about alternative energy and energy conservation. Also part of the plan, are a number of feasibility projects to be conducted by SaskPower. These include distributed generation projects using renewable energy sources such as solar power, wood waste, livestock wastes and municipal wastes. Wind energy is purchased by government owned SaskPower, and provides energy to government operations and the SaskPower head office. The Government of Saskatchewan recently announced plans to build three ethanol plants in Saskatchewan as part of an initiative to grow the ethanol industry. The project is a joint venture between the Saskatchewan government and Denver-based Broe Companies (respectively, parties own 40 per cent and 60 per cent interest in the plant). The Belle Plaine plant is a $55-million project that will provide 80 million litres of ethanol. To ensure growth of the ethanol industry in Saskatchewan, the provincial government plans to:86
• eliminate the ethanol fuel tax; • develop a legal mandate that ethanol-blended fuels be purchased in the province (this would be
the first of its kind in Canada); and • work with other provinces towards the opening of new markets.
5.2.5 Ontario
In the development of a plan to lower hydro bills during the fall of 2002, the government of Ontario has called for actions to “promote conservation, encourage alternative fuels and support clean energy production.” Their proposal includes a number of the goals that support renewable energy initiatives. These goals are the following:
• a 10-year property tax holiday for renewable energy investments; • capital tax and sales tax exemptions for renewable energy investments; • a commitment to purchase green electricity, targeting of 20 per cent of the provincial
government’s electricity usage; • all newly constructed government buildings will also use energy efficient or clean sources of
energy; • the establishment of a Centre of Excellence of Alternative Energy, jointly located at Queen’s
University and The University of Toronto. Its mandate is to make Ontario a North American leader in research and development of clean energy technologies;
• a tax credit will be offered to cover the cost of solar panels, with a goal of converting 100,000 homes to solar power within five years;
• an electrical information system that will provide generators with a transferable electronic certificate showing the environmental characteristics of each MWh of generation. This initiative would help market green power;
85 Government of Alberta request for proposals, indicating a higher target than the 10 per cent originally sought through the Climate Change Action Plan. 86 Government of Saskatchewan Web site: http://www.gov.sask.ca

Pembina Institute
Low-Impact Renewable Energy Policy in Canada: Strengths, Gaps and a Path Forward 37
• the elimination of barriers to the development of green energy due to red tape by increasing the environmental assessment exemption threshold for clean generation to 100 MW;
• the provision of wind power for electricity to First Nations as an alternative to diesel generation in remote communities; and
• an emphasis on training in alternative fuels and energy conservation in schools. The Ontario government would work together with the Ministries of Energy, Education and Training, and Colleges and Universities.87
5.2.6 Quebec
As a province, Quebec is furthest along in wind development in terms of level of capacity, at 100 MW with two separate facilities on the Gaspé Peninsula. The existing 100 MW le Nordais project (implemented 1998–99) involved an investment of $160 million. The average electricity production cost is 5.8 cents/kWh, one of the lowest costs for wind power in Canada. Although not substantiated, the Regie de l’Energie, the provincial regulator, called for a wind resource commitment of 50 MW per year for seven years, making the total installed capacity 450 MW. In November 2000, the government announced a new economic development incentive program in the Gaspé region. It consists of a refundable tax credit of 40 per cent on the wages of new employees in emerging industrial sectors; manufacturers of wind equipment are among those sectors cited. Once projects have been assessed by Investissement Québec and deemed eligible, businesses will receive a refundable tax credit equivalent to 40 per cent of wages for the jobs created. The assistance applies to jobs created since January 1, 2000, and projects must be submitted before December 31, 2004. In November 2002, the government released a draft regulation requiring Hydro Québec Distribution to purchase 1,000 MW of wind power for the purpose of fixing the cost of electric power. One block of the power purchase requirement is tied to the establishment of facilities for the manufacturing and assembly of windmills and their components in Quebec, up to an installed capacity of 800 megawatts. Another block of 200 MW is not related to the establishment of manufacturing facilities. An additional regulation requires them to purchase 100 MW of power from forest biomass supplies. These requirements will be undertaken over the next 10 years.
5.2.7 Newfoundland
Newfoundland and Labrador Hydro88 evaluated proposals for a wind power demonstration project. Newfoundland has a strong and untapped wind resource. A request for proposals (RFP) was released in December of 2000. The RFP requires the successful applicant to undertake a feasibility study and, based on the results, proceed with negotiations for a five to 25 MW power purchase agreement.89 The selected company was CHI Hydroelectric Company Inc. However, no further action was taken following this initiative.
5.2.8 New Brunswick
The New Brunswick Energy Policy, released in 2001, lists the following principles with respect to adoption of alternative technology that the province will undertake:
87 Government of Ontario Web site: http://www.est.gov.on.ca 88 Electrical utility of Newfoundland and Labrador. 89 Canadian Wind Energy Association, Calgary Commuters Ride the Wind. Windsight. Volume 14, No. 1, March 2001.

Pembina Institute
Low-Impact Renewable Energy Policy in Canada: Strengths, Gaps and a Path Forward 38
• continue to promote research and development in renewable/alternative energy and related economic development opportunities;
• look for opportunities to undertake demonstration projects that showcase the benefits of renewable and alternative technologies and that help jump-start the market to manufacture, sell and maintain renewable and alternative technologies;
• work with the federal government to closely monitor progress in alcohol production technology and examine the potential for production and use of alcohol as a transportation fuel and/or fuel additive in New Brunswick;
• direct the market design committee to review and make recommendations on the role and treatment of small-scale, on-site electricity generation;
• require the Crown utility and other distribution utilities in the province to develop a green pricing option and market it to interested customers. Subsequently, the province will direct the Crown utility and other distribution utilities to use any funds derived from a green pricing option to promote the development of renewable technologies in New Brunswick; and
• monitor the development of Renewable Portfolio Standard programs in other jurisdictions and assess the benefits for New Brunswick.
Biomass currently supplies 15 per cent of energy demand in New Brunswick, thus there is already a significant amount of renewable energy usage in the province. In the November 2002 speech from the throne, the province committed to introducing Canada’s first renewable energy portfolio standard. Details are not yet released.
5.2.9 Nova Scotia
To stimulate increased renewable energy generation capacity in Nova Scotia, the province is developing a regulatory framework for a green-power program. Independent power producers (IPPs) generating power from renewable resources will be able to wield power for a fair transmission charge and to sell directly to retail customers instead of indirectly through an existing utility. Also, to insure fair rates for green-power producers, a green-power purchase rate covering all rate classes will be developed. Nova Scotia is also establishing a renewable portfolio standard as a means to diversify energy supply, promote green energy and create an initial demand to help ignite the development of an economic renewable energy industry. The province and NSPI plan to create a short-term voluntary renewable target for new IPP generation, totalling 2.5 per cent of NSPI’s current capacity. After monitoring the target for three years, a longer-term Renewable Portfolio Standard will be established. A small green-power premium will likely be applied to the electricity rates of all Nova Scotia electricity consumers. Current estimates indicate such an increase would likely occur in three to five years and be less than one-half of one per cent. The provincial government has already made voluntary green-power purchases for its consumption at a premium price, and will encourage municipal governments to do the same. The development of clear definitions of green power is emphasized in the policy. Net metering will be formalized and established under NSPI’s rates and regulations. This will allow farmers to interconnect micro-generation units (typically less than 50 kW) with NSPI’s system. Customers will then be able to offset their energy costs with energy banked from using their micro-generators. The maximum capacity for systems to be eligible to participate will be determined by the EMGC.

Pembina Institute
Low-Impact Renewable Energy Policy in Canada: Strengths, Gaps and a Path Forward 39
5.3 Canadian Utilities Offering Green-Power Programs Increasing environmental concerns from Canadian consumers is driving the creation of a new market for “green power.” Consumer preference in combination with the electricity industry restructuring has led to the development of green-power programs being offered to customers from utilities. See the Pembina Institute report, “Green Power Marketing in Canada: The State of the Industry” for additional details.90
5.3.1 BC Hydro
BC Hydro began marketing green power to commercial and industrial B.C. customers in September 2002. This initiative is intended to generate demand for green power in addition to that required under BC Hydro’s voluntary commitment to meet 10 per cent of new domestic electricity requirements through green-energy technologies (established in the year 2000). In order to meet this 10 per cent voluntary green “Portfolio Standard,” BC Hydro will be purchasing approximately 1,100 GWh of its annual new supply from independent power producers (IPPs) with projects that meet BC Hydro’s green criteria. This 10 per cent will become part of the mix of electricity supplied by BC Hydro to all its customers. Green power that BC Hydro secures above and beyond its voluntary commitment will be available for purchase by those institutions, businesses, governments and industry customers that are committed to demonstrating environmental leadership. BC Hydro is using a “green-certificate” mechanism (also known as green tags) to sell green energy. This method acknowledges that the actual path of electrical energy from the green-power facilities cannot be tracked, and separates the environmental and social attributes of green energy from the electrons. Each green certificate is valued at one MWh of electricity generated at qualified green-generation facilities. In addition, BC Hydro plans to export its certificates outside of the province to consumers in neighbouring jurisdictions. To date, BC Hydro has signed initial 20-year Electricity Purchase Agreements to purchase green power from 23 small, low-impact hydroelectricity installations, and biomass and biogas facilities, totalling 980 GWh per year. In 2003, it will complete a wind farm and a sustainable landfill gas to energy plant. An ocean wave power plant is expected to be completed in 2004. The outputs from these green-power supplies will be verified by an independent body to ensure that the consumers are getting the full product they are paying for, and that it is not being used for other purposes. The specifics of the BC Hydro program are still under development, therefore details pertaining to the supply sources and means of verification have not yet been established.
5.3.2 ENMAX
ENMAX, an Alberta-based utility, has been offering a program called Greenmax since 1998. The Greenmax program provides Alberta customers with the option of paying a premium of $5, $10 or $15 per month on their electrical bill. Participating customers are buying 75 kWh, 160 kWh and 250 kWh respectively.91 Greenmax is certified as an EcoLogo green-power source under Environment Canada’s Environmental Choice Program. All of the green power supplied for the program comes from wind turbines in southern Alberta, owned and operated by independent power producers. Greenmax currently has 3,000 residential customers and 200 commercial and industrial customers. Natural Resources Canada, Environment Canada and the Calgary transit authority are all examples of customers who purchase green power as a part of the Greenmax program.
90 http://www.pembina.org 91 Conversation with Theresa Howland, ENMAX, July 9, 2001.

Pembina Institute
Low-Impact Renewable Energy Policy in Canada: Strengths, Gaps and a Path Forward 40
5.3.3 EPCOR
EPCOR launched its green-power program in 1999 with the goal of giving customers an opportunity to contribute directly to the environment. EPCOR offers green-power “ECO-PACKS” that are described as “blocks of energy generated from low-impact/renewable sources, such as small hydro, wind, biomass and solar.”92 The power that customers are receiving is generated from a 23 MW wood waste biomass plant, a 12.75 MW “run of the river” hydro-power plant and a 13.4 kW solar-power installation. EPCOR offers the ECO-PACKS for an additional $5, $10, $20 and $40 per month, a contribution for which customers are receiving 10, 20, 50 and 100 per cent of their power use from these green sources respectively. 3,100 residential customers as of December 2001 subscribe to the program.93
5.3.4 SaskPower
SaskPower currently offers “SaskPower Green Power” to their customers. The green power is supplied by a 17 MW wind farm located in Saskatchewan, much of which is being used to supply the Government of Canada’s power needs in the province through their green-power commitment. SaskPower also installed a 5.9 MW wind farm in late 2002. Premium payments are based on 100 kWh blocks, each block costing $3.50, or 3.5 cents per kWh. As of early 2002, the program had 230 business and industrial participants out of the 86,000 that the utility serves.94
5.3.5 Ontario Power Generation (OPG)
OPG sells green power to businesses and distributors, though not directly to residential consumers. There are two types of packages offered to businesses through the EcoLogo-certified Evergreen Green Power. OPG has established an operating unit called “Evergreen Energy” to manage its green-power program, which will provide green power to customers in the Ontario electricity industry after restructuring. Evergreen’s pool consists of a broad spectrum of generation sources, including hydroelectric, commercial-scale wind turbines, biogas and solar energy. There are two types of packages offered to businesses through EcoLogo-certified (or equivalent) Evergreen Energy Green Power, Evergreen Clean Green Power, a 50/50 blend of energy generated from facilities built prior to and after 1991, and Evergreen Pure Green Power, generated from facilities built after 1991. Similar packages are offered to power retailers, with the addition of EverGreen Friendly Power, consisting entirely of energy from facilities built before 1991.95
5.3.6 Toronto Hydro Energy Services Inc.
Toronto Hydro Energy Services Inc. (THESI), a new retail electricity company based in Ontario, will soon be offering a green-power program to residential customers. The program constitutes two power projects. The first, a 1,800 MWh wind farm at Exhibition Place in Toronto with plans for completion in fall 2002, is a collaboration with the Toronto Renewable Energy Co-operative (TREC). The second is a former landfill site where methane could be used as an alternative supply source and is expected to power 900 homes by producing 8500 MWh per year (the wind farm will light 250 homes). Monthly rates have not yet been released.
5.3.7 Nova Scotia Power
Nova Scotia Power initiated their green-power program in the fall of 2002 with the construction of two 600 kW and 660 kW wind turbines. A lengthy and extensive community consultation process culminated in selecting the location of the turbines, both EcoLogo-certified. Nova Scotia Power is not currently planning to offer this to commercial customers, however, they are in discussions with the federal 92 EPCOR Web site: http://www.EPCOR.ca 93 Conversation with Tannis Tupper – EPCOR, Sustainable Development. July 11, 2001. 94 Monica Curtis, SaskPower. Green Power Marketing Survey Response (02/02/22). 95 Ibid.

Pembina Institute
Low-Impact Renewable Energy Policy in Canada: Strengths, Gaps and a Path Forward 41
government regarding the sale of green power for use by the federal facilities located in the province. The utility is evaluating more than 20 independent power producer applications competing for the installation of 30 MW of wind capacity (two per cent of the provincial generating capacity). Residential customers, totalling 400,650, may purchase blocks of power equivalent to 125 kWh of energy for $5.00 each, with the option of purchasing more than one block.96
5.3.8 Maritime Electric
Maritime Electric has been offering the “Maritime Electric Green Power Program” to customers since December 2001. A 5.2 MW wind farm, installed in November 2001 and owned and operated by the PEI Energy Corporation, supplies the electricity for the program. Green power is also sold to the governments of Canada and P.E.I. through their renewable energy commitments. The retail sale of power takes place in 50 kWh blocks for a price of $1.75 per block. The program services 55,000 residential and 11,000 industrial customers.97
5.4 Green-Power Procurement
5.4.1 Canadian Federal Government
In October 2000 the federal government released its “Action Plan 2000 on Climate Change” which outlines a plan for the investment of $500 million over five years to reduce greenhouse gas emissions. One objective of the action plan is to expand the use of renewable energy sources by four times use as of 2000. The federal government will be providing financial assistance by purchasing 20 per cent of the power used by federal facilities through a green-procurement initiative. The quantity of funding allocated towards this goal totals $30 million per year for a number of years.98 The federal government has previous experience with green-power procurement and has been actively involved in implementing it for federal facilities since 1997. Natural Resources Canada originally spearheaded the green-procurement initiative in 1997 in collaboration with Environment Canada when both signed an agreement with Enmax99 for the purchase of green power. Enmax has an agreement with a local independent power producer for the purchase of wind energy from operations in southern Alberta. Enmax sells the green power to the Natural Resources Canada and Environment Canada buildings in Alberta. The utility was able to build upon the success of the green purchase and now provides four times the quantity of the government purchase to other customers through its Greenmax program. In the February 2000 federal budget (prior to the Action Plan on Climate Change), the government dedicated $12.4 million investment over the next 10 years to SaskPower100 for wind power. Under this agreement, SaskPower will provide a minimum of 25,000 MWh of wind energy annually. This amounts to a green-power premium price per kWh of 4.96 cents.101 Suncor Energy102 and Enbridge Inc.103 of
96 Nova Scotia Power Web site: http://www.nspower.com 97 Angus Orford, Maritime Electric Company Ltd. Green Power Marketing Survey Response (02/02/12). 98 Canada’s National Climate Change Process http://www.nccp.ca/NCCP/pdf/media/GofCdaPlan-en.pdf 99 Enmax delivers electricity to customers in and around Calgary, Alberta.. They own, operate and manage the electricity transmission and distribution system. 100 SaskPower is the electrical utility for the province of Saskatchewan. 101 Conversation with Dierdre Heatherington – Natural Resources Canada, Renewable Energy and Electrical Division. 102 Suncor Energy’s primary business is mining and extracting crude oil from the oil sands deposits of northern Canada and Queensland, Australia. 103 Enbridge is an energy transportation, distribution and retail service company, active in North America and internationally.

Pembina Institute
Low-Impact Renewable Energy Policy in Canada: Strengths, Gaps and a Path Forward 42
Calgary will be supplying the electricity from an 11 MW wind farm in Gull Lake, using Vestas 660 kW turbines. In the province of Prince Edward Island, a similar agreement has been made which amounts to a $4.5 million investment over 10 years from the federal government for the purchase of a minimum of 13,000 MW of wind energy. This amounts to a green-power premium price of 3.46 cents per kWh.
5.4.2 Provincial Governments
Several provincial and territorial governments have followed the example set by the Canadian federal government and have initiated similar green-power procurement initiatives. Some examples include the following:
• Alberta: 25 per cent of their electricity supply; • Saskatchewan: proportion of electricity supply; • Ontario: 20 per cent of electricity supply; • Nova Scotia: proportion of electricity supply; and • Prince Edward Island: proportion of electricity supply.
5.4.3 Municipal Governments
The City of Toronto is the leader in the promotion of green power through its participation in the Toronto Renewable Energy Cooperative and their electric utility, Toronto Hydro. Calgary, Alberta’s transit authority has recently signed a commitment to purchase 21,000 MWh of wind-generated electricity each year from a local independent power producer, Vision Quest Wind Electric, for the next 10 years. This purchase will reduce emissions by about 21,000 tonnes of CO2
per year based on the current emissions from the Alberta power generation mix. Although there is potential for some cost savings by the transit commission, the primary motivation is emission reduction and public perception. The Calgary transit authority is the first in North America to be able to offer users a wind-powered public transit system. The Greater Vancouver Regional District (GVRD) completed a corporate energy policy in 2001 that included methods for reducing energy consumption at their facilities. One aspect of this plan focuses on a green procurement strategy, including green power.104 In 2002, the GVRD, along with the following municipalities, agreed to purchase green power from BC Hydro under the pilot Green Power Certificates Program:
• Capital Regional District (Victoria) Building Services Group; • Corporation of the City of White Rock; and • Resort Municipality of Whistler.
The Alberta Urban Municipalities Association Commitment ensures that two per cent of power needs of municipalities participating in the electric aggregation initiative are obtained through green procurement.
5.4.4 Canadian Corporate Purchases of Low-Impact Renewable Energy
Table 5.1 provides a summary of Canadian corporations that are actively seeking, or have made purchases of emission credits since 1998 along with the quantity, generation source and the organization from which they are purchasing it.
104 Conversation with Jennie Moore – Greater Vancouver Regional District.

Pembina Institute
Low-Impact Renewable Energy Policy in Canada: Strengths, Gaps and a Path Forward 43
Table 5.1 – Corporate Investments in Low-Impact Renewable Energy105
Purchasing Company
Year of Purchase
Type of Energy Pursued
Amount of Energy Energy Supplier
Chateau Lake Louise 2000 Small hydro 1,680,000 kWh in 2000 Canadian Hydro Developers
Dupont International (65 countries)
1999 Renewable energy 10 per cent energy use by 2010
RFP
EPCOR Late 1990s Solar PV 13.4 kW array Generation at their head office
Mountain Equipment Co-op
1998 Solar PV One kW solar array Generation at their Toronto store
Interface Inc. 1998 Small hydro 20 per cent of total electricity consumption of Bellville plant.
Ontario Hydro Services Comp.
Royal Bank 2002 Small hydro, (and wind, biogass, solar)
1,000 MWH per year Ontario Power Generation (OPG)
Suncor Inc. 1998 Wind power 350,000 kWh per year Vision Quest Wind Electric
TransAlta Utilities 2001 Wind energy Eight million kWhs annually for 10 yrs
Vision Quest Wind Electric
TransGas (Saskatchewan)
2002 Wind energy N/A N/A
West Kootenay Power
1998 Wind power 25,000 kWh in 1998 Vision Quest Wind Electric
105 Pembina Institute Files.
Pembina Institute
Low-Impact Renewable Energy Policy in Canada: Strengths, Gaps and a Path Forward 44
6 Barriers to Renewable Energy in Canada This chapter highlights many barriers to the development of low-impact renewable energy (LIRE) in Canada, namely,
• information barriers; • institutional and policy barriers; • financial barriers; and • technical barriers.
6.1 Information Barriers These barriers relate to the lack of information about LIRE technologies or the existence of confusing or incorrect information on their performance. Stakeholders affected by these barriers include energy consumers, utilities and retailers, permitting agencies, investors, and the civil service. Information barriers affect stakeholder decision-making in the marketplace in such a way as to bias decisions against the installation of economically or socially efficient LIRE. For example, consumers may not be aware of the fact that solar thermal heating of a swimming pool is cost effective. Similarly, utilities may not be aware of the resource availability of wind energy and the financial performance of wind turbines.
6.1.1 Lack of Participation in Energy Market by Certain Consumers
Many residential and some commercial sector energy consumers are unaware of energy issues. Energy is invisible and has traditionally been very cheap relative to other expenses, thus little time is invested in understanding energy supply options. Also, many consumers rely on professionals such as electricians and gas technicians to provide services in their buildings and they are supplied by a monopoly electricity or natural gas company. Tenants do not make decisions about energy supplies, as that is a landlord’s responsibility, even though tenants usually pay for energy costs. A greater level of consumer participation in energy supplies could result in the greater deployment of LIRE, as they have inherent social values for which people may be willing to pay.
6.1.2 Lack of Awareness of LIRE Options
Even those consumers who are actively engaged in managing their energy supply and use (e.g., large commercial and industrial consumers), may not be aware of LIRE options. The fledgling LIRE market has few suppliers and does not engage in mainstream marketing efforts. Thus, consumers may not be aware of cost-effective options. Utilities or the government may need to play an active role in providing information on LIRE technologies in order to raise awareness.
6.1.3 Lack of Information on Suppliers
There is a lack of information on potential suppliers in Canada and companies that provide maintenance services. This barrier affects utilities and/or consumers, depending on the scale of the LIRE technology that is being considered. Although there are industry associations for wind power (CANWEA) and solar energy (CANSIA and SESCI), no associations are in place for biomass energy, small-scale hydro power or other LIRE technologies.
6.1.4 Lack of Information on LIRE Resource Availability
There is a lack of information on LIRE resources in Canada. This barrier is significant because the financial performance of LIRE technologies is highly correlated with resource availability. For example, a

Pembina Institute
Low-Impact Renewable Energy Policy in Canada: Strengths, Gaps and a Path Forward 45
wind turbine will produce energy at a capacity factor106 of over 40 per cent for average wind speeds of eight meters/second (m/s) or greater, and as little as 15 per cent for wind speeds under five m/s. The capacity factor affects the annual electricity generation and hence the financial performance of the wind turbine in providing electricity. In this example, an increase in average wind speed by 60 per cent results in almost a 30 per cent increase in energy production. Without information on where the optimal LIRE resources are, prospective developers face the risk of under-performance. This barrier is particularly severe for wind energy resources in Canada, as the geographic terrain makes it very complex to estimate wind speeds in many parts of Canada, and there is no comprehensive wind speed atlas in the country that is appropriate for the assessment of wind energy supplies.
6.2 Institutional and Policy Barriers Institutional and policy barriers relate to the market and regulatory structure, including energy regulations, utility culture, technical requirements and procedures for connecting LIRE to the electricity grid. Many of these barriers may exist because of an historical orientation of the electricity market toward large-scale, centralized power supplies such as storage-hydro or large coal projects. Thus, the policy and market structure reflect that history and may disadvantage smaller-scale, distributed, LIRE supplies.
6.2.1 Interconnection and Operational Barriers
Interconnection and operational barriers are often cited as being the most severe for LIRE technologies, particularly for small-scale, distributed technologies. These are related to technical, financial and operational requirements in order to connect to the grid. Interconnection standards and costs may include the following, depending on the jurisdiction where the RET is being connected:107
• requirement for the completion of technical interconnection studies (i.e., assessment of the impact of the LIRE technology on the grid and consumers);
• boiler code requirements (i.e., full-time operator required, even for small systems); • connection fees (e.g., insurance, disconnect relays, meters, costs of transformers or line
upgrades); • operations costs (e.g., transmission and distribution system connection charges); and • excessive application and processing time.
Interconnection barriers ultimately affect the cost of developing a new LIRE supply. This can affect overall project economics and is often particularly severe for small-scale technologies because many of the interconnection costs are fixed for all sizes of generators. Thus, smaller generators will have to cover those fixed costs with less power production revenue. A survey and study by the National Renewable Energy Lab in the US attempted to quantify the costs of interconnection and operational barriers on prospective developers of distributed technologies, including LIRE, co-generation systems and small-scale, fossil-fuel electricity supplies:108
106 The total energy production within a year divided by the maximum energy production at the rated power output. Reductions in capacity factor could be due to the limited availability of resources, maintenance shutdowns or other factors. 107 Details on these barriers are provided in “Making Connections: Case Studies of Interconnection Barriers and Their Impacts on Distributed Power Projects.” B. Alderfer, M. Eldridge, and T. Starrs, National Renewable Energy Laboratory, 2000 . 108 Alderfer et al., 2000.
Pembina Institute
Low-Impact Renewable Energy Policy in Canada: Strengths, Gaps and a Path Forward 46
[Each] customer or developer [interviewed for the survey] was asked in each case to estimate the “barrier-related costs of interconnection” [which] included the customer’s or developer’s estimate of the costs of the various barriers… not including extra time spent by project developers or customers, or lost [energy] savings because of utility delays, annual fees, or other tariffs (except exit fees). These estimates are thus strictly “out of pocket costs” that exceeded the project developer’s necessarily subjective determination of appropriate, anticipated, interconnection costs.
Table 6.1 illustrates the financial impacts of barriers on project developers, expressed in US dollars for each system installed.

Pembina Institute
Low-Impact Renewable Energy Policy in Canada: Strengths, Gaps and a Path Forward 47
Table 6.1 – Barrier-Related Interconnection Costs for Small-Scale Technologies109
The Canadian government has been doing some work to develop a national standard for the interconnection of small-scale PV solar systems through the Micropower Connect initiative (Section 5.1.8). In the US, new IEEE standards are providing technical requirements. However, significant gaps still exist for standards for the induction of micro-hydroelectric and wind-energy systems. Provincial governments and regulators should be involved in setting standards for interconnection costs.
109 Alderfer et al., 2000.
Pembina Institute
Low-Impact Renewable Energy Policy in Canada: Strengths, Gaps and a Path Forward 48
6.2.2 Market Barriers
One of the most significant barriers to LIRE is related to the monopoly that electric utilities have on the marketplace in most of Canada. Although many jurisdictions have opened up their “wholesale” marketplace to competition, in practice, the lack of wholesale buyers in many jurisdictions means that options are limited to private LIRE suppliers. Also, the costs of transmission and distribution on monopoly systems are largely aggregated and the rates that are paid by private power producers reflect system-wide tariffs rather than regional tariffs. The majority of the power supplies in many parts of Canada are far from the load centres, particularly in British Columbia, Manitoba, Quebec and Newfoundland. New supplies in the load centre provide support to the transmission system and have inherently lower transmission and distribution costs than new supplies in hinterland areas. However, rates do not reflect this. In some cases, this may disadvantage prospective LIRE projects located near load centres. In Alberta, the market restructuring effort will attempt to alleviate this barrier by providing financial “locational credits” for generation that is located near the load centres.
6.2.3 Regulation of the Energy Sector
The regulation of the electricity sector varies among provinces, but a universal characteristic is to require utilities to purchase the cheapest source of power with no consideration for environmental and social costs other than the private price of electricity generation. This is addressed below.
6.3 Financial Barriers
Financial barriers are related to taxation structures for energy suppliers, behaviour of investors and issues surrounding market externalities such as environmental impacts.
6.3.1 Lack of Access to Capital
Access to capital for investments in new LIRE supplies can be a barrier. Although a large part of total project costs can often be covered by “debt financing” from banks or insurance companies, a portion of the project must always be covered through an equity investment in the actual project (i.e., ownership). Small LIRE producers often do not have access to sufficient capital, even if their projects are cost-effective. Instead, they rely on external equity investors for part of the project costs. Investors will typically put their money into projects that offer the optimal return on equity investment, or that pay a regular dividend for the investment. LIRE must compete with other investments such as conventional oil and gas, technology companies, stocks and mutual funds, and real estate, among others.
6.3.2 Level Playing Field for Competing Energy Supplies
Fossil fuel investments in Canada receive superior federal taxation treatment to LIRE. Efforts in the late 1990s by the Department of Finance have alleviated some of these differences, but have not gone far enough to “level the playing field” whereby all energy supply options receive identical treatment. The first difference relates to so-called development expense write-offs. Oil and gas producers gain access to the Canadian Exploration Expense (CEE) and Canadian Development Expense (CDE) categories which allow 100 per cent of their pre-development expenses to be written off in the first year of operation and 30 per cent of their development expenses. They can transfer these write-offs to non-energy investments through a “flow-through share” arrangement. For LIRE, the Canadian Renewable Energy and Conservation Expense (CRCE) provides 100 per cent of pre-development expenses to be written off. However, no similar category for the CDE exists for RETs which allow for the flow-through share arrangement.

Pembina Institute
Low-Impact Renewable Energy Policy in Canada: Strengths, Gaps and a Path Forward 49
The second difference relates to depreciation of actual project assets. Oil and gas producers gain access to Capital Cost Allowance (CCA) Class 1, 8 and 41, ranging from four per cent per year write-off to 25 per cent per year. Oil and gas producers can also write off many asset costs through the CDE mentioned above. Oil sands producers and mining operations (i.e., coal) can write-off 100 per cent of their capital costs through CCA Class 41(a). Power plants can only write off four per cent per year under Class 1. LIRE has access to CCA Class 43.1 depreciation which is 30 per cent per year. On the surface, this appears to offer an advantage to LIRE over conventional energy. However, this write-off is limited in scope. It applies only to energy, manufacturing and mining companies—they can’t pass the benefit onto other types of investors such as small commercial businesses. Also, many LIRE companies are not profitable for many years after a project has been developed and thus, cannot gain access to tax write-offs until that time. This makes the flow-through arrangement more valuable.
6.3.3 Lack of Pricing for Environmental Externalities
The energy marketplace includes several environmental and social “externalities,” defined as those costs and benefits that do not have a direct financial value but have indirect financial and/or social costs or values. Externalities include environmental impacts of energy production and consumption such as greenhouse gas (GHG) emissions, toxic wastes, local air pollutants, watershed impacts and others. There are no well-established markets for GHG emissions, clean air or water as of yet and thus, no financial cost or value for their production. Human health impacts are also considered externalities because it is often difficult to pinpoint the primary and secondary causes of health issues. Health care costs are therefore borne by society as a whole, rather than targeted at the source. The impact of such “externalities” to the energy market is that purchasers of energy such as utilities and consumers do not apply a financial price to environmental impacts. This is despite the fact that society as a whole often pays for such impacts through government environmental clean-up programs, health care costs, or other expenses. Without price signals for such “externalities,” energy projects that impact on health, society and the environment, such as new coal or large hydro power plants, are subsidized by the public through a government liability to deal with the environmental impacts in the future. To add to that, the lack of price signals means that LIRE projects are not financially rewarded for their environmental benefits. For example, in 1990, Alberta’s greenhouse gas emissions from electricity were 40 million tonnes (Mt).110 They increased to 47 Mt in 2000 and are expected to be over 57 Mt in 2010 with the introduction of 1700 MW of new coal supplies proposed in the province.111 Future efforts to control greenhouse gas (GHG) emissions could include establishing market-based systems for reducing these emissions. Given a conservative price of $20/tonne for GHG emissions,112 Alberta’s electricity consumers will be on the hook for a minimum of $400 million every year, increasing in proportion to the rate of growth of electricity demand. This represents the minimum necessary to return emissions from the electricity sector back to six per cent below 1990 levels. Some potential market-based instruments under consideration would, however, cover all emissions from the sector, increasing the liability to over $1 billion per year.
110 Emission amounts are expressed in units of carbon dioxide equivalents. 111 Natural Resources Canada’s 1999 forecast for emissions in 2010 was 49 million tonnes, assuming natural gas supplies. We have added eight million tonnes to reflect the net increases of 1,700 MW of new coal above new natural gas supplies that were anticipated in the NRCan forecast. 112 This is a conservative estimate that includes the cost of mitigation and/or purchasing emission-reduction offsets, transaction costs of undertaking these measures and regulatory administration costs.

Pembina Institute
Low-Impact Renewable Energy Policy in Canada: Strengths, Gaps and a Path Forward 50
LIRE supplies would not be subject to this liability. Current plans for power plant expansion in Alberta do not attach any financial value to the environmental benefits of LIRE technologies or the environmental costs of coal. Those environmental costs include:
• greenhouse gas emissions, which impact on global climate; • mercury, nitrous-oxide and particulate matter which impact on human health through airborne
emissions which people breath; • urban smog; • sulphur dioxide, which causes acid rain; • land-use impacts from coal mining; and • impacts on watersheds through power plant cooling.
This is the single most important barrier to the implementation of low-impact renewable energy in Canada and needs to be addressed before LIRE will play a significant role in the Canadian economy.
6.4 Technical Barriers
The level of success of renewable energy technologies depends on their cost competitiveness and reliability relative to conventional technologies. Several LIRE technologies and resources are intermittent, meaning that they do not produce power at all times when it is needed. These include wind and solar technologies for daily variation in supply, and hydro technologies for seasonal variation. This intermittency can be moderated by integrating LIRE facilities into an electrical grid with biomass, storage hydro, nuclear or fossil fuel facilities, or by providing storage for off-grid applications. Despite these intermittent characteristics, it is technically possible to supply 100 per cent of Canada’s energy needs from low-impact renewable energy.113 A major academic report outlined a strategy for developing a 100 per cent renewable energy supply in the world through a portfolio of different technologies including non-intermittent biomass and hydro resources and intermittent wind and solar resources.114 Others envision a “hydrogen” economy which would store renewable energy in the form of hydrogen gas or solid compounds, and running hydrogen through fuel cells to power energy demands. Iceland has set about to establish a 100 per cent renewable energy system based on a hydrogen-distribution system and significant indigenous renewable energy resources. Costa Rica has adopted a policy of aiming for a 100 per cent renewable power supply based on wind and storage hydroelectricity. Although there have been some major achievements over the past five years in the manufacture of wind and solar power industries, additional technical challenges remain. Further technical achievements and value engineering techniques will lower large-scale production costs and assist with commercialization. Other renewable technologies such as wave energy and biomass gasification systems are still in the early stages of commercialization, and require continued research and development support as well as market demonstration. Many areas of Canada are also located in more harsh environments then many other countries, and as a result the technical requirements of LIRE systems are even more complex for successful operation. Cold climatic conditions create constraints that challenge small-scale hydroelectric, wind power and PV systems. Rime icing takes place on PV panels and turbine blades, thereby decreasing performance. Small hydroelectric design must provide for control of frazil ice and pipeline freezing. The resolution of this issue can considerably add to capital expenses and operating costs.
113 Authors’ assertion. 114 Kelly and Weinburg, Utility Strategies for Using Renewables. Island Press, 1993.

Pembina Institute
Low-Impact Renewable Energy Policy in Canada: Strengths, Gaps and a Path Forward 51
7 Regulatory and Market Incentives to Create the Right Fiscal Climate for Low-Impact Renewable Energy Expansion
This section identifies some of the policy options that are being used to remove the barriers that exist for the implementation of low-impact renewable energy (LIRE) in other countries, and analyzes how these options could be applied in Canada to mobilize the development of LIRE. Increased Government Funding Support for Research, Development, Demonstration and Commercialization Increased support for research, development and demonstration programs could be used to improve current, and develop next-generation LIRE technologies. This helps to reduce technical and information barriers. Canadian efforts should also specifically relate to the improved operation of the technologies in cold climates. Some examples of initiatives in other countries include:
• Japan: Multinational research on and demonstration of PV power systems in Nepal, Mongolia, Thailand and Malaysia; and
• United Kingdom: Developing and testing of wave energy devices in the sea and a research and development program that includes promotion of technologies and expertise of overseas markets.
Commercialization programs such as the Renewable Energy Deployment Initiative (REDI) described earlier are a critical component of building a robust and efficient LIRE marketplace. Strictly speaking, this program is a fiscal mechanism (highlighted below), but it also has a commercialization focus. Government procurement programs can prove LIRE reliability and improve consumer confidence in the technologies. The Canadian federal government procurement program is the strongest in North America. Other examples include:
• Denmark: Seven demonstration projects in biogas plants and one geothermal, and the provision of overseas development assistance funding to promote wind technologies;
• Germany: Solar water heating demonstration in public buildings; and a 50,000 solar roofs initiative to promote solar roof installations;
• Japan: Solar PV demonstration projects of 30 MW in 1997 with a 2000 year target of 400 MW; • US: Numerous demonstration projects through the National Renewable Energy Laboratory and
other government agencies, and a million solar roofs initiative to promote solar PV and water heating systems; and
• The Netherlands: Demonstration of 100 MW offshore wind station and solar water heater installations by 2000.
Canada’s programs in this category are targeted. This approach is optimal for a limited budget. However, some programs like REDI are not large enough, and do not focus on larger installations which could have a significant impact on reducing technology and market supply costs. In addition, few Canadian government programs have created an incentive for companies to manufacture LIRE technologies in Canada. An exception is the extensive support for the Canadian-made SOLARWALL technology115 through R&D programs, demonstration projects and direct support from the REDI program.
115 http://www.solarwall.com

Pembina Institute
Low-Impact Renewable Energy Policy in Canada: Strengths, Gaps and a Path Forward 52
7.1 Financing Options Utilities and manufacturers can alleviate the problematic issue of high capital costs by providing component leasing options and financing packages. This applies mainly to installations in the commercial and residential sectors, which have limited capital. The diesel generator market in Canada has been providing packages of this nature for a long time, however, the LIRE industry in Canada has no programs of this nature. Historically, Canadian utilities have supported energy efficiency initiatives through low-cost financing mechanisms. These facilitated investments in building insulation, improved lighting, new windows, high-efficiency heaters and other building improvements in the residential and commercial sectors. Currently, consumers are forced to borrow through chartered bank loan programs which charge an interest rate of two or three points above prime, higher than the cost of a household mortgage. Some LIRE technologies can be purchased through those mechanisms, although most cannot. Ironically, Canadians can purchase new automobiles through commercial loans which vary from zero per cent financing to five or six per cent, all below the prime interest rate at time of writing. The Pembina Institute has proposed a new mechanism for Alberta which would establish a “revolving loan” fund for energy efficiency investments.116 A similar program could be established for LIRE technologies. The Alberta Energy Efficiency Revolving Fund, which would be created through a one-time Alberta government contribution of $100 million, would act as an endowment for energy efficiency for the province. The primary function of this fund would be to provide zero-interest loans to end-use consumers to implement energy efficiency measures. These loans would be coordinated by an energy efficiency office. The fund would be replenished through loan payments equivalent to, or less than, the financial value of energy savings from energy efficiency measures. The revolving fund could be used to leverage financing from other sources. For example, a portion of the fund could be used as a guarantee for financing from banks or insurance companies. Thus, the value of the pool of funds could be at least doubled. The “revolving fund” approach to energy efficiency has been applied in several jurisdictions. For example, the City of Edmonton has established an energy management revolving fund for retrofits of city buildings. From 2000 to 2007, the city expects to spend $13.5 million to fund energy efficiency improvements; it expects to save $21.3 million between 2001 and 2012 due to improved energy efficiency.117 The City of Toronto established a Better Buildings Partnership, which has already led to greenhouse gas emissions reductions of 110,000 tonnes and saved $11.8 million in energy costs in city and private buildings. The City of Toronto initially provided $2 million of seed money to establish the loan fund, which has now expanded to more than $10 million of private and public financing for zero-interest loans to building owners. The city itself has achieved a 25- per cent return on its $2 million investment.118 The Green Municipal Infrastructure Fund, highlighted in Chapter 5, acts like a revolving fund for LIRE applications in municipal government facilities. Such a program could be expanded to other borrowers. This would allow small-business owners to establish LIRE technologies like solar thermal heaters, communities off the grid to install LIRE power supplies, or farmers and ranchers to establish wind or hydro power supplies at their facilities.
116 See the report, A Smart Electricity Policy for Alberta. 2001. Pembina Institute Web site. 117 Overview of Greenhouse Gas Emissions Reduction Plan for City Operations. September 23, 1999. Available at http://www.gov.edmonton.ab.ca/ 118 http://www.climatechangesolutions.com/english/municipal/stories/buildings/toronto-bbp.htm
Pembina Institute
Low-Impact Renewable Energy Policy in Canada: Strengths, Gaps and a Path Forward 53
7.2 Fiscal Mechanisms Fiscal mechanisms that involve direct government financial expenditures in LIRE facilities have been the most successful among all government policy actions toward implementing LIRE. Subsidies or special tax treatment reduce the capital costs associated with the construction and installation of LIRE technologies. Canadian fiscal mechanisms include the special tax treatment for LIRE in Canada and the Renewable Energy Deployment Initiative (REDI), albeit both have significant limitations. Other examples of such mechanisms include:
• Denmark has a 30–50 per cent subsidy for some renewable energy development (including combined heat and power) with 15–30 per cent subsidies available to consumers for the purchase of solar hot water heating systems;
• Germany has implemented a 100 million DM (US$1 = 1.734 DM in 1997) capital subsidy program for solar, heat pumps, small hydro, wind and biomass;
• Japan has incentives representing 10 per cent of the cost of small-hydro, 20 per cent for geothermal, 50 per cent for wind and up to 67 per cent for solar PV in buildings; also, low-interest loans for wind, hydro, biomass and solar installations; and
• The US has adopted a 1.7 cents per kWh credit/subsidy for renewable energy development. The most comprehensive state system is in Oregon with tax credits, while California has direct financial rebates for LIRE consumer purchases.
The Clean Air and Renewable Energy (CARE) Coalition and the Canadian Wind Energy Association through its “Wind Vision for Canada,” both outlined below, are promoting the need for a fiscal support mechanism for LIRE in Canada. Further information is provided below.
7.3 Provide Equitable Electricity Market Access Market access for LIRE electricity supplies is an important component of any government effort to increase its development in Canada. This includes physical access to the electrical grid as well as access to a fair price for electricity, including values attached for the environmental and social benefits of LIRE (covered in a separate section below). As mentioned in the previous chapter, institutional barriers related to interconnection are a major stumbling point for small-scale LIRE, imposing significant costs on prospective developments that render some financially attractive projects uneconomic. The following responses are required:
• standardized interconnection requirements that are appropriate for the scale and resource availability of the LIRE technology. These standards should be applied nationally;
• standardized interconnection contracts with utilities that do not require excessive legal input; and • standardized electricity prices paid for LIRE electricity supplies that reflect their social and
environmental values. In the US, Europe and Japan, governments have responded with “net metering” legislation which incorporates many of the aforementioned components. Net metering is typically limited to on-site LIRE technologies that are scaled according to the electricity demands of the user. Net metering programs allow consumers who generate their own power to receive credit for any excess generation by selling it back into the electricity grid. Excess electricity production is credited at the retail rate of electricity by reversing the conventional electricity meter, thus reducing the power bill. Net metering is established in Manitoba, parts of Ontario, over 30 states in the US and several other industrialized countries. Enabling legislation typically requires the establishment of reasonable interconnection standards that protect the reliability of the grid, the safety of powerline workers, and ensures that the costs to interconnect are fair. Net metering is established through legislation but is implemented by retail electricity companies. The

Pembina Institute
Low-Impact Renewable Energy Policy in Canada: Strengths, Gaps and a Path Forward 54
costs of the LIRE supply are borne entirely by the private consumer. Net metering programs are designed to protect electricity rates from increases and minimal government expenditures, yet they provide social and environmental benefits and create choice for customers who want the option to self-generate and remain connected to the grid. The Pembina Institute has proposed the introduction of net metering in Canada.119 For larger scale LIRE developments, one of the biggest issues is simple access to the electricity market. Utilities that dominate the majority of marketplaces in Canada may not be interested in purchasing LIRE supplies. In addition, many utilities do not have a “renewable energy portfolio standard” or do not offer a “greenpower” rate to their consumers, so it is impossible to gain financial value for the social and environmental benefits of LIRE. One approach for alleviating this barrier is to legislate a “renewable energy portfolio standard,” summarized below. Government can also support LIRE by opening the transmission lines for access to all power suppliers, permitting LIRE suppliers to export their power. Another option would be to establish retail competition markets which provide consumer choice, thereby allowing LIRE suppliers to market “green power” directly to consumers.
7.4 Regulatory Mechanisms Regulatory mechanisms are those where legislation requires that electricity or other energy markets purchase LIRE supplies. In Canada, there are currently no regulatory mechanisms established for the support of LIRE. However, BC Hydro, a government-owned utility, has made a commitment to purchase 10 per cent of it’s new electricity supplies from green power, although this is not protected through legislation from future changes in management philosophy and practice. Some examples of regulatory mechanisms from other countries include the following:
• The US has implemented renewable portfolio standards or set-asides in several states. The Government of Texas has required electricity retailers to produce a minimum of their supply from renewable energy sources such as wind, biomass, solar and hydro power. The law states that a minimum of 2,000 MW of new renewable energy capacity must be online by 2009. To maintain competitiveness, Texan electricity companies can trade “certificates” of renewable electricity production among themselves, thus ensuring that this requirement is met in the most cost-effective manner. Retailers who do not meet the requirement will face a financial penalty. Furthermore, Texas has required all retailers to disclose where their electricity comes from, and has also permitted net metering.
• Denmark requires utilities to use a certain amount of biomass (straw and woodchips) in coal-fired plants and also requires that a minimum proportion of all electricity supplies be derived from LIRE thorough a “Portfolio Standard.”. Previously, Denmark required utilities to purchase wind power supplies at a premium price (wind power feed-in tariff).
• Germany has the highest capacity of wind power in the world and significant developments of solar PV supplies due to a legislated requirement for utilities to purchase these supplies at 90 per cent of their retail electricity prices.
• The Netherlands has set a solar photovoltaic installation target of 7.7 MW in the year 2000 under legal agreement.
119 For more information, see the following Pembina Institute reports on the Web site:http://www.pembina.org. A Smart Electricity Policy for Alberta. Lost Opportunities: Canada and Renewable Energy. Canadian Solutions – Practical and Affordable Steps to Fight Climate Change.

Pembina Institute
Low-Impact Renewable Energy Policy in Canada: Strengths, Gaps and a Path Forward 55
• The United Kingdom previously established “renewable orders” requiring renewable energy purchases by electricity suppliers. Now they have adopted a portfolio standard approach.
• The Australian government has passed legislation calling for two per cent of all energy production to be from renewable sources by 2010 (portfolio standard).
The Pembina Institute has proposed the introduction of renewable energy portfolio standards in Canada.120
7.5 Increase Consumer Awareness and Choices Consumer choices are generally limited to electricity from coal, hydro or nuclear facilities. While some utilities are beginning to offer some renewable power choices, these come at a premium that only will be purchased by environmentally conscious, middle- and high-income consumers. In many provinces, solar water heaters and other LIRE technologies are also not readily available on the market alongside conventional products. This limits consumer knowledge and interest and increases costs because of special ordering. The federal government has made significant inroads recently in the area of consumer awareness through an excellent Web site,121 and through support for LIRE industry associations such as the Canadian Wind Energy Association,122 the Canadian Solar Industries Association,123 the Solar Energy Society of Canada124 and the Earth Energy Association of Canada.125 Further national promotions would be appropriate. In addition, regional education and awareness programs which are introduced in partnership with regional or sector specific organizations could enhance the profile for LIRE. The US is one of the leaders in this area with the following initiatives:
• Million Solar Roofs Program (MSRP). This initiative, launched in June 1997, aims to install one
million solar systems (including PV and solar DHW) in US homes by 2010. This program relies heavily on regional partners to facilitate dissemination and to act as intermediaries between the public and the federal government. The program’s “State and Community Partnerships” initiative promotes the establishment of associations (consisting of businesses, energy industries, governments, etc.) that commit themselves to a certain number of annual installations. In return, these partners receive technical and financial assistance from the federal government.
• Wind Powering America. This initiative, announced in June 1999, uses the same partnerships as the MSRP to facilitate installation of small wind turbines. The program includes technical and financial assistance to partners, as well as targeted studies (wind-resource mapping, feasibility studies) and training programs for practitioners. In addition, the US government has extended the wind production incentive to 2001 which is a $0.017/kWh tax credit for all generation from wind.
• Regional Biomass Energy Program (RBEP). This program was established in 1983 to advance the use of biomass feedstocks and technologies through research, technical assistance and demonstration projects. The program is delivered through five independent regional offices.
7.6 Accountability for Socio-Economic/Environmental Costs
As previously mentioned, the single largest barrier for LIRE in Canada is the lack of accounting for environmental and human health costs of fossil fuel energy use. This means that fossil fuel suppliers
120 Ibid. 121 http://www.nrcan.gc.ca/es/erb/reed/ 122 http://www.canwea.ca 123 http://www.cansia.ca 124 http://www.solarenergysociety.ca 125 http://www.earthenergy.ca

Pembina Institute
Low-Impact Renewable Energy Policy in Canada: Strengths, Gaps and a Path Forward 56
appear to be cheaper than they actually are given that government, private citizens and business have to pay for those environmental and social costs. The following two tables illustrate the environmental impacts of low-impact renewable energy supplies and conventional energy supplies.126 In the chapter on barriers above, an example for the Alberta context pegged the price of greenhouse gas emissions from the electricity supply at $400 million to $1 billion per year. The social and environmental costs of fossil fuel energy (and benefits of LIRE) could be included in the energy marketplace through a variety of legislated and/or fiscal mechanisms, including:
• environmental taxes that peg a price on emissions; • the legislation of an “allowance” or quota for emissions of large emitting entities such as electric
utilities and the ability to trade “allowances” among entities in a new marketplace that pegs a price for such transactions. This allows companies to implement LIRE developments, thus freeing up “allowances” which they can sell to firms that will exceed their quota. This system is envisioned as a response to the ratification of the Kyoto Protocol and is being implemented by several European countries for greenhouse gases. In Canada, the National Air Issues Coordinating Committee has established a Domestic Emissions Trading Working Group that is considering these issues. In the US, such a system has been established for emissions of sulphur dioxide and smog-causing pollutants in the northeast states and southern California areas; and
• establishing a “credit-trading” mechanism to work with the “allowance” mechanism described above, but to capture those projects that produce emissions reductions that are not subject to quotas. This allows smaller companies to implement LIRE facilities and sell “credits” to larger firms with quotas.
126 Source: Pembina Institute Green Power Guidelines for Canada. July 2000.

Pembina Institute
Low-Impact Renewable Energy Policy in Canada: Strengths, Gaps and a Path Forward 57
Table 7.1 – Life-Cycle Performance of Wind Power, Solar Power and Run-of-River Hydro
Environmental / Social Stressor
Wind Power127 Solar Power128 Run-of-River Hydro129
Greenhouse Gas Emissions – CO2 Equiv. (grams/kWh)
12 10 – 200130 Greenhouse gas emissions from flooding terrain are limited due to the minimal size of the facility head pond.
Acid Deposition Precursors – SO2, NOx (grams/kWh)
0.03 for each N/A Small – from construction fuels only.
Hazardous Air Pollutants – Hydrocarbons, CO, NOx (grams/kWh)
0.09 for CO, 0.01 for Non-methane hydrocarbons
N/A Small – from construction fuels only.
Particulate Matter (grams/kWh)
0.025 N/A Small – from construction fuels only.
Ground Level Ozone Precursors – NOx, VOCs (grams/kWh)
0.03 for each N/A Small – from construction fuels only.
Potential Impacts on Water Quality
Minimal impacts, if any.
Minimal impacts, if any.
No chemical or physical alteration of water.
Direct Impacts on Watersheds
Minimal impacts, if any.
Minimal impacts, if any.
No diversion or significant impoundment of water. The residence time of water in the head pond of the facility does not exceed six hours.131
127 Wind Power Assumptions: lifetime of wind system is 20 years, based on evaluation of a Vestas 600 kW wind turbine such as those in southwest Alberta connected with the ENMAX Green Power program; emissions are the result of acquiring and processing raw materials, transportation, and maintenance. Production of different turbines may result in different amounts of emissions. Data sources: McCulloch et al., 1999; OECD, 1993. 128 Solar Power Assumptions: Life time of solar photovoltaic system is 20 years; Solar Grade Silicon system with 15 per cent conversion efficiency and 13 per cent utilization factor; Emissions are the result of acquiring and processing raw materials, manufacture, and maintenance. Data source: OECD, 1993. 129 Developed by the Pembina Institute based on site visits of hydroelectricity facilities developed and/or operated by Appropriate Energy Systems (tel: 250-679-8589) and Canadian Hydro Developers (http://www.canhydro.com). Specific facilities that were toured include: (AES) Sechart Whaling Station, Brakendale, Gambier Island, Purcell Lodge, (CHD) Taylor, Waterton, Belly River, Akokylex. 130 Dependent on production scale and technology applied. 131 This is consistent with mid-size head ponds in existing run-of-river plants in western Canada.

Pembina Institute
Low-Impact Renewable Energy Policy in Canada: Strengths, Gaps and a Path Forward 58
Table 7.1 – Life-Cycle Performance of Wind Power, Solar Power and Run-of-River Hydro, Continued
132 Examples include the European cities of Hamburg and Bremen, Germany and Copenhagen, Denmark. The level of public acceptance may be linked to the economic benefits of the wind power industry in those countries. The German criteria for siting turbines include: 35 dB(A) noise level in residential areas, 40 dB(A) in commercial areas, and a rule that ensures that no blade shadows appear on windows of adjacent buildings. (American Wind Energy Association email list discussion).
Environmental / Social Stressor
Wind Power Solar Power Run-of-River Hydro
Direct Impacts on Landscape
With minimal road construction and appropriate tower siting, wind farms have very low impacts on the productive characteristics of the land.
If integrated into existing building architecture, there will be no impacts on the landscapes.
The head pond does not extend beyond natural high-water conditions (i.e., approximately 10-year average levels).
Potential Impact on Flora and Fauna
No impact, except potentially on birds. Locating turbines away from feeding grounds can mitigate this.
Minimal impacts, if any.
Provided there is no watershed diversion or impoundment, and no alteration of water quality, the impact on aquatic organisms will be minimal.
Noise and Visual Impacts
Potential visual and noise impacts, particularly if located in urban areas. Several have been successfully established in urban areas.132
Minimal visual impact, if any, depending on the integration of panels with building features.
Minimal impacts, if any, provided that the powerhouse is located away from homes.
Hazardous and other Solid Waste
Minimal if any. Depends on the technology, but materials are recoverable/ recyclable. Particular concern with cadmium compounds in thin films.
Minimal impacts, if any.
Sustainability of Feedstock
Renewable energy resource. Construction may require non-renewable fuels.
Renewable energy resource. Construction may require non-renewable fuels.
Renewable energy resource. Construction may require non-renewable fuels.

Pembina Institute
Low-Impact Renewable Energy Policy in Canada: Strengths, Gaps and a Path Forward 59
Table 7.2 – Life-Cycle Performance of Coal, Large-Scale Hydro and Nuclear Power
Environmental / Social Stressor
Coal Power133 Large-Scale Hydro134 Nuclear Power135
Greenhouse Gas Emissions – CO2 Equiv. (grams/kWh)
900 – 1200 25 – 167 35 – 70
Acid Deposition Precursors – SO2, NOx (grams/kWh)
4.0 – 6.0 From construction only. From mining and construction only.
Hazardous Air Pollutants – Hydrocarbons, CO, NOx (grams/kWh)
3.0 – 5.0 From construction only. From mining and construction only.
Particulate Matter (grams/kWh)
0.25 From construction only. From mining and construction only.
Ground Level Ozone Precursors – NOx, VOCs (grams/kWh)
2.0 – 3.0 From construction only. From mining and construction only.
Potential Impacts on Water Quality
Dependent on location but typically adverse due to acid mine drainage and cooling ponds. Also, water temperature increase from Rankine Cycle.
Potentially large impact due to altered flow of watershed (e.g., dissolved nitrogen, sedimentation, mercury contamination in some regions).
Potentially significant – will raise water temperature for power generating cycle. In the event of an accident, potential radioactive releases. Surface and ground water contamination from mining.
Direct Impacts on Watersheds
Dependent on location and type of mine. Major impact if open pit mining.
Large impact due to altered flow of watershed (e.g., impoundment and diversion).
From mining and construction only.
Direct Impacts on Landscape
Potentially large due to mining.
Large impact due to flooding through water diversion and impoundment.
From mining and construction only.
Potential Impact on Flora and Fauna
Potentially large due to mining.
Large impact, especially on fish. Potential recreational benefit for people.
Potentially catastrophic in accident case.
Noise and Visual Impacts Visual impact large (e.g., air emissions from generators and loss of land from mining).
Location dependent. Potentially catastrophic in accident case.
Hazardous and other Solid Waste
Ash disposal (approx. 37 g/kWh).
Minimal. Radioactive waste and tailings from mining and transport. Potentially catastrophic in accident case.
Sustainability of Long-term depletion of None. Water is renewable. Long-term depletion of uranium
133 Data sources: Deluchi, 1991; OECD, 1993; TransAlta Utilities. Does not include technology production and facility construction. 134 Data sources: OECD, 1993; Yundt. Does not include the lost opportunity for carbon sequestration when forested areas are flooded. 135 Data sources: OECD, 1993; Deluchi, 1991. Does not include construction.
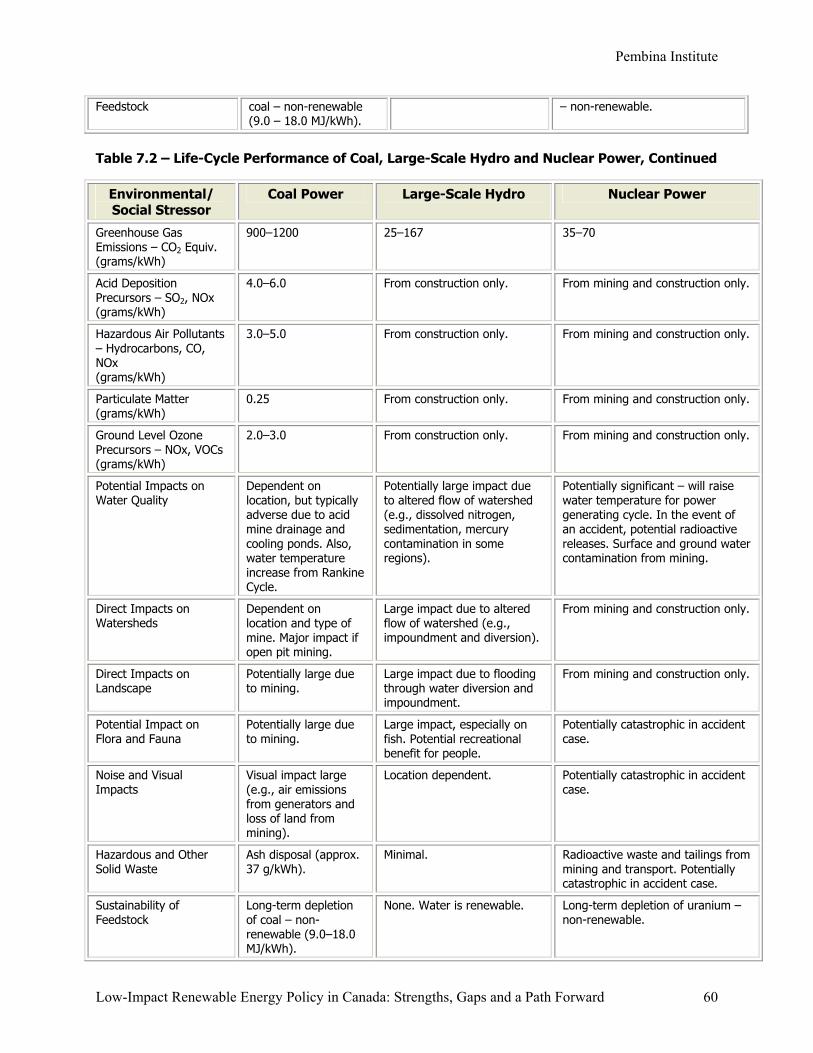
Pembina Institute
Low-Impact Renewable Energy Policy in Canada: Strengths, Gaps and a Path Forward 60
Feedstock coal – non-renewable (9.0 – 18.0 MJ/kWh).
– non-renewable.
Table 7.2 – Life-Cycle Performance of Coal, Large-Scale Hydro and Nuclear Power, Continued
Environmental/ Social Stressor
Coal Power Large-Scale Hydro Nuclear Power
Greenhouse Gas Emissions – CO2 Equiv. (grams/kWh)
900–1200 25–167 35–70
Acid Deposition Precursors – SO2, NOx (grams/kWh)
4.0–6.0 From construction only. From mining and construction only.
Hazardous Air Pollutants – Hydrocarbons, CO, NOx (grams/kWh)
3.0–5.0 From construction only. From mining and construction only.
Particulate Matter (grams/kWh)
0.25 From construction only. From mining and construction only.
Ground Level Ozone Precursors – NOx, VOCs (grams/kWh)
2.0–3.0 From construction only. From mining and construction only.
Potential Impacts on Water Quality
Dependent on location, but typically adverse due to acid mine drainage and cooling ponds. Also, water temperature increase from Rankine Cycle.
Potentially large impact due to altered flow of watershed (e.g., dissolved nitrogen, sedimentation, mercury contamination in some regions).
Potentially significant – will raise water temperature for power generating cycle. In the event of an accident, potential radioactive releases. Surface and ground water contamination from mining.
Direct Impacts on Watersheds
Dependent on location and type of mine. Major impact if open pit mining.
Large impact due to altered flow of watershed (e.g., impoundment and diversion).
From mining and construction only.
Direct Impacts on Landscape
Potentially large due to mining.
Large impact due to flooding through water diversion and impoundment.
From mining and construction only.
Potential Impact on Flora and Fauna
Potentially large due to mining.
Large impact, especially on fish. Potential recreational benefit for people.
Potentially catastrophic in accident case.
Noise and Visual Impacts
Visual impact large (e.g., air emissions from generators and loss of land from mining).
Location dependent. Potentially catastrophic in accident case.
Hazardous and Other Solid Waste
Ash disposal (approx. 37 g/kWh).
Minimal. Radioactive waste and tailings from mining and transport. Potentially catastrophic in accident case.
Sustainability of Feedstock
Long-term depletion of coal – non-renewable (9.0–18.0 MJ/kWh).
None. Water is renewable. Long-term depletion of uranium – non-renewable.

Pembina Institute
Low-Impact Renewable Energy Policy in Canada: Strengths, Gaps and a Path Forward 61
An additional consideration that is not often factored into economic analysis is the employment creation and economic development benefits of LIRE supplies relative to conventional energy. In a paper prepared for Environment Canada,136 the Pembina Institute summarized the employment-creation benefits of various energy supplies, highlighted in the following table. In summary, the average employment creation benefits of LIRE options is 12.2 permanent jobs per million dollar capital investment, compared to 7.3 for conventional energy options. Employment creation has a social benefit with a financial value in reduced employment insurance payments, re-investment benefits in the community and other factors.
Table 7.3 – Employment Creation Benefits of Competing Energy Investments
Energy Efficiency Applications Jobs per $M Rational Energy Program for Canada 47.4
Saskatchewan Residential Energy Efficiency/Cons. 15.9 Saskatchewan Commercial Energy Efficiency/Cons. 20.7
Saskatchewan Industrial Energy Efficiency/Cons. 137 79.8 Toronto Energy and Water Efficiency 42.9
Ontario Demand Side Management 38.5 B.C. Demand Side Management 30.6
Canadian Municipal Energy Initiative 65.8 US Conservation 23.5
US Energy Efficiency 32.5 US Energy Efficiency 27.1
US Energy Efficiency and Renewable Energy 35.5 US Demand Side Management 19.7
Washington State Demand Side Management 31.8 Average 36.6
LIRE Applications Jobs per $M Saskatchewan Biomass Electricity Generation 13.5
Saskatchewan Wind Electricity Generation 8.0 Saskatchewan Small Hydro Electricity Generation 7.6
Saskatchewan Co-generation 9.5 Canadian Solar Thermal 27.9
Canadian Photovoltaics 8.2
Canadian District Energy 8.6 Ontario Biofuels 7.2
Iowa Biomass Electricity Generation138 29.7 Iowa Wind Electricity Generation 1.8
Average 12.2
136 Pembina Institute. Comparative Analysis of Employment from Air Emission Reduction Measures. 1997. 137 The original figure provided in the source study was divided in half in order to be conservative about the dollar value of energy savings and the resultant re-spending effect. 138 The original figure provided in the source study was for operating costs only, and so was divided in half to reflect the lower overall JPM when capital costs and person years are taken into account.

Pembina Institute
Low-Impact Renewable Energy Policy in Canada: Strengths, Gaps and a Path Forward 62
Conventional Energy Applications Jobs per $M
Alberta Oil 6.5
Alberta Oil Sands 14.6 Alberta Gas 4.0
Saskatchewan Oil Combined Cycle 4.1
Saskatchewan Natural Gas Electricity Generation 5.8 Alberta Large Hydro-Electric 1.4
Saskatchewan Large Hydro-Electric 8.2 B.C. Large Hydro-Electric 2.6
Saskatchewan Coal 9.3 Saskatchewan Nuclear 9.7
US Oil Refining 6.1 US Natural Gas 7.8
US Coal Mining 14.9 Average 7.3
Alberta Oil Sands Applications Jobs per $M Oil Sands Task Force 36.6
Oil Sands Projects – Workforce Requirements 7.6 Suncor – Fixed Plant Expansion 13.4
Suncor – Steepbank 3.8 Suncor – Aurora (Train 1) 11.5
Average 14.6
7.7 Level the Playing Field
As mentioned previously, the energy market in Canada provides favourable treatment to oil sands, conventional oil, natural gas exploration, coal mining and nuclear energy through the tax system. From a taxation perspective, the energy “playing field” is not “level.” In a study by Natural Resources Canada and the Department of Finance (1996) entitled The Level Playing Field: The Tax Treatment of Competing Energy Investments, the researchers found that while the playing field is not level, there were few variations in the tax treatment of energy projects, except for ethanol and certain energy efficiency projects.139 For example, for energy supply investments in oil, gas and renewables, the variation in tax support ranges narrowly from five to 20 per cent of capital costs. The study did find that tax incentives for investing in non-renewables were more generous in the past than they are today. It concluded that the federal income tax treatment given to renewable and non-renewable energy investments is reasonably similar except for certain investments. The exceptions include:
1. the tax system does not give any preferential treatment to investments in energy efficiency;
139 The Level Playing Field The Tax Treatment of Competing Energy Investments. Web site: http://www.nrcan.gc.ca/es/ep/efd/lpf-toc.html

Pembina Institute
Low-Impact Renewable Energy Policy in Canada: Strengths, Gaps and a Path Forward 63
2. investments in oil sands mining receive a significant tax concession through accelerated capital write-off. The majority of capital costs can be written off before federal taxes on profits and provincial royalties on resource rents are paid; and
3. alternative fuels like ethanol produced from renewable sources are exempted from federal excise tax, but blended fuels (the most common) have only partial tax exemption.
One of the problems with LIRE options is that producers cannot write off capital costs if they have no taxable energy income in early years of a project, whereas for oil and gas, industry and investors can exercise what is called a “flow-through share” passing the tax advantages to other investors who are taxable.
7.8 Clean Air and Renewable Energy Coalition (CARE)
As an initiative to generate more support for LIRE in Canada from the government, the Pembina Institute, along with Suncor Energy and several other progressive energy companies and environmental organizations, established the Clean Air and Renewable Energy (CARE) Coalition. The following is a list of recommendations from CARE to the government, published in Backgrounder for Government Policy Recommendation, fall 2002.140
1. the federal government establish a national low-impact renewable energy target for Canada; 2. the federal government increase the Wind Power Production Incentive (WPPI) to 2.7¢/kWh
to ensure appropriate investment in wind energy and harmonization with the US 3. the federal government extend incentive programs similar to the WPPI to other renewable
energy technologies; 4. the federal government work with the provincial and territorial governments to implement
policy mechanisms to meet the recommended national renewable energy target. A range of policy options, which may include Renewable Portfolio Standards (RPS) or System Benefits Charges (SBC) should be explored. A broad-based SBC could permit provinces to match the federal WPPI and MIP commitments;
5. the federal government expand the Market Incentive Program (MIP) funding to $30 million per year, extend it to 2012 and consult with the provinces and territories to develop a broader-based consumer green energy rebate and education program;
6. the federal government explicitly identify mechanisms to ensure a meaningful role for renewable energy to contribute toward Canada’s climate change strategy in the short and long term;
7. the specific nature of these mechanisms will depend on the overall design of that strategy and components of it such as domestic emissions trading; and
8. the federal government develop a Wind Energy Mapping and Wind Measurement Initiative. While the members of the Clean Air Renewable Energy Coalition acknowledge initial efforts taken by the federal government to advance investment in renewable energy, the Coalition believes that complementary policy development at provincial, territorial and federal government levels is needed if the intended objectives are to be met. At the same time, the magnitude of government support is small relative to that of other jurisdictions with whom Canada competes for investment capital.
7.9 CANWEA Wind Vision for Canada141 The Canadian Wind Energy Association has proposed a strategy for Canada to significantly increase the capacity of wind power in the country from its current levels of about 140 MW. The “Wind Vision for 140 Available for download at http://www.cleanairrenweableenergycoalition.com 141 Available for download at http://www.canwea.ca

Pembina Institute
Low-Impact Renewable Energy Policy in Canada: Strengths, Gaps and a Path Forward 64
Canada” aims to facilitate the development of 10,000 MW of wind power by the year 2010, equivalent to about five per cent of annual electricity demand, or about 30,000 gigawatt hours of electricity. They argue that the following benefits will accrue to Canada with such a program:
• $10 to $20 billion of economic activity for Canadians; • 80,000 to 160,000 high-quality jobs; • contribution to clean air and human health benefits; • reductions of 15 to 25 million tonnes of greenhouse gas emissions; and • 30,000 GWh of renewable energy supplies at predictable stable price.
This strategy was developed in response to the poor investment climate for wind power development in Canada. This is mostly attributed to a lack of public policy support for wind power relative to other industrialized countries. CANWEA proposed the following government actions to help improve the investment climate and open the way for achieving the 10,000 MW target for wind power capacity. Early Stage Financial Support Mechanisms (Largely Federal Government):
1. Implement market wide production-based revenue incentives for wind energy. This means that all wind power suppliers—large or small, profitable or emerging—public or private—can take advantage of federal government financial incentives.
2. Remove tax barriers for wind energy development allowing all players, regardless of size or earnings, to benefit from the existing accelerated depreciation in Canadian tax laws.
Electricity Supply Policies (Provincial and Territorial):
3. Implement renewable energy portfolio standards in the provinces and territories. Provincial and territorial government legislation would require all retailers of electricity to meet a minimum proportion of their sales from cost-effective renewable energy sources, including wind. Trading of renewable energy credits between retailers would allow this commitment to be met at the least possible cost. Trading between jurisdictions with portfolio standards in place would ensure that the most cost-effective renewables in Canada would be developed. The cost of such a system would be shared equally among electricity consumers.
4. Establish net metering or net billing in all provinces and territories, allowing electricity users to generate a portion of their own electricity and receive a credit on their electricity bill when they produce more than they can use.
Foundation Measures (Government and Industry):
5. Develop a comprehensive wind energy atlas for Canada. This requires an extensive wind-speed prospecting process in many parts of the country, similar to what has already been completed in southwestern Alberta, Saskatchewan and parts of Ontario and Quebec, and which is currently underway in British Columbia and the Yukon.
6. Introduce electricity product labelling for all electricity sales in Canada. These labels, similar to consumer food labels, would indicate the sources of electricity and the environmental impacts of those sources, facilitating consumer choice in environmentally friendly sources of energy such as wind.
7. Continue to provide education and marketing materials to the Canadian public and business on the benefits and costs of wind energy.
8. Establish a Greenhouse Gas (GHG) Emission Reduction trading system incorporating renewable energy as a cornerstone to long term emissions reduction.

Pembina Institute
Low-Impact Renewable Energy Policy in Canada: Strengths, Gaps and a Path Forward 65
9. Continue to provide financial support for wind energy technology research and development that adapts technology for the Canadian environment or builds on Canadian skills and core competencies.
Government Purchases of Wind Power:
10. The federal government recently announced its plan to purchase green power to meet 20 per cent of its total electricity needs. Provincial and municipal governments should set a similar positive example of environmental stewardship.

Pembina Institute
Low-Impact Renewable Energy Policy in Canada: Strengths, Gaps and a Path Forward 66
8 Summary Low-impact renewable energy (LIRE) can meet much of Canada’s energy needs in an economically and environmentally responsible way. Canada is an ideal for the expansion of LIRE due to vast natural resources. While some progress has been made towards the increased use of LIRE technologies in Canada, accelerated growth could be possible with support from new Canadian policies and programs, and supporting market economies. The low-impact renewable energy industry has expanded significantly since the 1970’s, with an annual turnover of about USD$7 billion. This industry is expected to grow to USD$82 billion by the year 2010. At the forefront of this expansion, the European Union (EU) encompasses several hundred companies, who are primarily small and medium sized enterprises. The opportunity and challenge remains for other countries, including Canada, to takes it’s place as a leader in low-impact renewable energy. Leadership for promoting low impact renewable energy in Canada has come from the Canadian federal government, in the areas of research, development, and commercialization. A handful of programs, including the CDN$260 million Wind Power Production Incentive, launched in 2002 and the $50 million Market Incentive Program for renewable energy marketing programs are aimed directly at creating incentives for LIRE production. The Canadian government has also shown initiative through it’s green power procurement program, one of the largest in North America. The program, which has the intention of purchasing 20 per cent of its electricity from LIRE sources, directly supported a 47 per cent growth rate for wind power in 2001. Previous federal government initiatives, including the Renewable Energy Deployment Initiative, have had limited impact because of small budgets or limited scope. Federal government partnerships with other governments are paving the way toward substantial policy development. For example, the partnership with the Federation of Canadian Municipalities through the Green Municipal Enabling and Investment Fund is resulting in multiple investments in renewable energy. In some provinces and territories, notably the Yukon, British Columbia, Alberta, Quebec and Nova Scotia, provinces and regulated utilities are also providing significant support for “green energy.” Of the barriers to the implementation of LIRE in Canada highlighted in this report, the lack of pricing for environmental and human health “externalities” is considered the most significant. The energy marketplace includes several environmental and social externalities, defined as those costs and benefits that do not have a direct financial value but which have indirect financial and/or social costs. Externalities include environmental impacts of energy production and consumption such as greenhouse gas (GHG) emissions, toxic wastes, local air pollutants, watershed impacts and human health impacts, among others. There are no well-established markets for GHG emissions, clean air or water as of yet and thus no financial cost for their production. Without such price signals, energy projects which produce environmental impacts such as new coal or large hydro power plants may be subsidized by the public through public funds into environmental clean-up, healthcare or other programs. To add to that, the lack of price signals means that LIRE projects are not financially rewarded for their environmental benefits. A series of response mechanisms were proposed in this paper to address the barriers. These include the following:
• increased government funding support for research, development, demonstration and commercial programs for LIRE, with an emphasis on expanding the technology and market scope of existing programs;

Pembina Institute
Low-Impact Renewable Energy Policy in Canada: Strengths, Gaps and a Path Forward 67
• establishing low-interest financing mechanisms for LIRE developers who do not have access to capital similar to “revolving loan” programs established for municipalities in Canada. This is particularly important for thermal LIRE technologies such as solar water heaters;
• providing a financial incentive for LIRE producers that reflects their environmental and human health benefits, such as the proposal of the Clean Air and Renewable Energy (CARE) Coalition, which attempts to mimic mechanisms already established in the US;
• providing equitable market access for LIRE suppliers through net metering for small-scale suppliers and transmission or retail access for larger suppliers;
• regulatory mechanisms such as a “portfolio standard” that would require electricity companies to generate or purchase a minimum proportion of their electricity supply from LIRE sources;
• increasing consumer awareness programs; and • establishing a mechanism to provide financial values for environmental and social externalities
such as pollution, land and watershed deterioration, and impacts on global climate.
Any combination of these proposed mechanisms can help to achieve a balance in the Canadian energy economy such that low-impact renewable energy supplies can expand in this country in a similar fashion as they are among our industrialized trading partners in the US, Japan and Europe.

Pembina Institute
Low-Impact Renewable Energy Policy in Canada: Strengths, Gaps and a Path Forward 68
9 Major References Anielski, M. Is Alberta Running Out of Nature’s Capital? Physical and Monetary Accounts for Alberta’s Timber, Oil and Natural Gas Reserves, Paper Presented at Institute for Public Economics Seminar University of Alberta Mark Anielski, Alberta Treasury, March 5, 1997. Canadian Association of Petroleum Producers. Statistical Handbook 1999. November 2000. Crookall-Fallon, Chris and Tim Crozier-Cole. 2000. Green Certificates Market: “Europe Plans Trading in Greenness – Six European States have plans for a market of Green Certificates that could help EU States met their renewable targets”, Environmental Finance, Volume 2, Number 1, October 2000. Alderfer, B., M. Eldridge, and T. Starrs. Making Connections: Case Studies of Interconnection Barriers and Their Impacts on Distributed Power Projects. National Renewable Energy Laboratory, 2000. Kushler, M. and P. Witte2000. “A Review and Early Assessment of Public Benefits Policies under Electricity Restructuring”. American Council for an Energy Efficient Economy (ACEEE), Washington, DC, USA, Volume 1 May and Volume 2 September 2000. National Energy Board. Statistics and forecasts. 2000. National Renewable Energy Laboratories.1999.Grid-Connected Renewable-Electric Policies in the European Union, May 1999. Natural Resources Canada, Canada’s Energy Outlook 1996-2020. Published in November, 1999. Pape, Andrew. 1999. The Role of Sustainable Electricity for Reducing GHG Emissions: Analysis of Policy Support Mechanisms for Sustainable Energy in the Context of the Alberta and British Columbia Electricity Markets. July 1999. The Parkland Institute. Wasting Alberta’s Advantage. 1999. Pembina Institute. A Smart Electricity Policy for Alberta. 2001. Pembina Institute. Pembina Institute Green Power Guidelines for Canada. 2000. Pembina Institute. Lost Opportunities: Canada and Renewable Energy – A Cross-Country Comparison of Government Support for Renewable Energy. September, 1999. Pembina Institute. Comparative Analysis of Employment from Air Emission Reduction Measures. Prepared for Environment Canada. 1997. Renewable Energy Policy Project. Renewable Energy Policy Outside the US. Issue Brief No. 14, October 1999. Smith, R. Income Growth, Government Spending, and Wasting Assets – Alberta’s Oil and Gas. In Canadian Public Policy, XVIII:4:387–412. 1992.

Pembina Institute
Low-Impact Renewable Energy Policy in Canada: Strengths, Gaps and a Path Forward 69
10 Appendix 1: History of Energy Policy in Canada Given that oil, gas and coal have been encouraged by government policies in Canada that have made investments attractive to industry, it is little surprise that fossil fuels have been developed to their full potential to fuel Canada’s economic growth. From the very beginning of energy development in Canada, governments have intervened in energy markets through direct spending, tax incentives and regulations to ensure a secure energy supply for Canada and develop regional economies. Regulatory bodies such as the National Energy Board emerged in 1980 to achieve the government’s objective a “made-in-Canada” oil price that was set below world levels. Incentives for non-renewable resource development have come from both federal and provincial levels of government. While the federal government regulates corporate and personal income taxes, the provincial governments, as owners of natural resources, regulate land-use policy and royalty policies. At the federal level, spending and tax incentives have been used to encourage exploration and development of non-renewable resources. These include accelerated write-offs of expenses for tax purposes.142 This infers a taxable income incentive (benefit) for investors conscious of the time value of money and providing faster pay-back period. A study of these tax incentives found that incentives for non-renewable energy investment in Canada has been more generous in the past than they are today, though accelerated write-offs still exist.143 Investments in mega-projects, such as the oil sands in the province of Alberta, have received significant tax concessions to encourage development in what was once a risky investment. Generous capital cost write-offs have been the norm. The federal government also supported the energy sector through grants, loans, tax rebates, export charges and assuming contingent liabilities. In fact, since 1970 the federal government has written off $2.8 billion of its investment and loans for energy projects in non-renewables.144 The development of Alberta’s vast oil sands reserves is a good example of government support for research into making the development of this unique non-renewable resource viable. Generous government funding of research in the earliest days of development led eventually to solutions for extracting the oil from the viscous oil sands. This has led to the point today where the cost of production of oil from oil sands is competitive with conventional crude oil production.145 Furthermore, support has also included generous royalty structures, a history of royalty tax credits and generous capital cost allowances (most recently for oil sands infrastructure write-offs). The development of these resources has been overseen by government regulatory agencies including the Alberta Energy Utilities Board, to ensure prudent resource development and management in Alberta, and by the National Energy Board, to ensure long-term energy security for Canada. Regulations have been established for operating standards, emissions to air, water and land, and reclamation of areas impacted by development. The province of Alberta is Canada’s most endowed province with non-renewable energy resources, and serves as a good benchmark for assessing Canada’s energy development policies and history. Alberta’s history involves over 50 years of oil and gas development that has included royalties and land-use development policies that encouraged oil, gas and coal development. Much of this resource is developed
142 Source: Government Support for Energy Investment. http://www.oag-bvg.gc.ca/domino/reports.nsf/html/c003ce.html 143 Ibid. 144 Ibid. 145 Parkland Institute, 1999.

Pembina Institute
Low-Impact Renewable Energy Policy in Canada: Strengths, Gaps and a Path Forward 70
primarily for export markets within Canada and, in particular, the US market. Exports of non-renewable energy contribute a significant share of Alberta’s gross domestic product (GDP). Royalty policies have been established, particularly led by Alberta, that have attempted to balance capturing a fair share of the economic rent derived from non-renewable energy extraction to the people of Alberta as owners of the natural capital, yet allowing industry to retain some of the rents to ensure long-term investment in future energy development. Some might argue that resource rent collection has been inadequate, allowing industry or corporate shareholders to retain too much of the available economic rent generated from production.146 Others have questioned whether the investment of these non-renewable energy resource rents into a sustainable financial capital pool (savings funds) has been sufficient to secure a sustainable income stream when the oil and gas are fully depleted.147 Exploration policies and capital cost allowances for the oil patch have tended to work in encouraging investment in exploration and development of the oil and gas reserves considered economically viable. This development has, however, come at an ecological cost including massive fragmentation of Alberta’s vast Boreal forest (a major carbon storage sink). For the most part, economic development has been the motivating factor behind a massive development of Alberta’s fossil fuels, which is continuing at a re-invigorated pace with the expansion of the oil sands production and with increased capacity built to export natural gas to the US and other Canadian markets. Oil sands development, which is now more economically viable than in the early 1970s, has accelerated thanks to reduced production costs but also attractive royalty structures (a generic oil sands royalty regime) that allows for near full capitalization of development costs in the early days of development.148 This is happening despite growing concern about Canada’s ability to meet the Kyoto carbon emission reduction targets and global climate change concerns. While impact assessments of Canada’s oil and gas resource development have been part of resource development processes, we feel that a full cost and benefit accounting analysis is still absent in the current regulatory regime. Not accounting for the full environmental, social and health costs of fossil fuel use may confer an unfair advantage over entry by renewable energy alternatives (whose benefits are also not accounted for in balance with the costs of non-renewables). Internalizing these full costs (or benefits) into resource pricing or royalty and tax policy has not been a practice adopted by governments, thus entrenching the current energy structure. This requires full cost pricing of the resource in the ground to signal to other energy options their potential market viability. The failure of markets to adequately internalize externalities from pollution and ecological dis-integrity is no excuse for governments failing to take leadership in establishing alternative mechanisms of full cost pricing for the good of local communities and the global community. The continued development of Canada’s non-renewable energy sources would appear, on the surface, to be a logical approach given the significant amounts of the resource, were it not for real impacts on global climates and other environmental impacts that appear to be related to their development and consumption. Canada and Alberta, while large in their own right, are really minor players on the global energy scale as price-takers in a market Canada does not control with any significance.
146 Anielski, 1997. 147 Anielski, 1997; Smith, 1992. 148 Parkland Institute, 1999.