low cvp+infrastructure+roadmap hydrogen+report
TRANSCRIPT

Transport Energy InfrastructureRoadm
ap to 2050
HYDROGEN
ROADM
AP
Prepared for the LowCVP by Elem
ent Energy LtdCeline Cluzel &
Alastair Hope–Morley
JUN
E 2015

Project Steering Group
AutogasLimited
BOC Lim
itedBEAM
ACalorGas LtdEDF EnergyElectricity N
etworks Association
National Grid
Office for Low
Emission Vehicles
Renewable Energy Association
Transport for LondonTransport ScotlandU
K Petroleum Association
LowCVP
Project Manager
Jonathan Murray,
Policy and Operations Director
ContractorPrepared by Elem
ent Energy Ltd
AuthorsCeline CluzelAlastair Hope-M
orley
Reviewers
Alex Stewart
Mike Dolm
anBen M
adden
Transport Energy InfrastructureRoadm
ap to 2050
HYDROGEN
ROADM
AP
JUN
E 2015
Disclaimer
While
theauthorsconsiderthatthe
dataand
opinionscontainedin
thisreportare
sound,allpartiesm
ustrely
upontheir
own
skilland
judgement
when
usingit.
Theauthors
donot
make
anyrepresentation
orwarranty,expressed
orimplied,asto
theaccuracy
orcompletenessofthe
report.

3
Acknowledgem
ents
The LowCVP aim
s to:�
Develop initiatives to promote the sale and supply of low
carbon vehicles and fuels
�Provide input and advice on Governm
ent policy
�Provide a forum
for stakeholders to share knowledge and inform
ation
�Ensure that U
K motor, fuel and related businesses are best placed to capitalise on the opportunities in the low
carbon m
arkets of the future
�Contribute to the achievem
ent of UK Governm
ent targets for road transport carbon reduction
AutogasLimited
BOC Lim
itedBEAM
ACalorGas LtdEDF EnergyElectricity N
etworks Association
National Grid
Office for Low
Emission Vehicles
Renewable Energy Association
Transport for LondonTransport ScotlandU
K Petroleum Association
The LowCVP, established in 2003, is a public-private partnership that
exists to accelerate a sustainable shift to lower carbon vehicles and
fuels and create opportunities for UK business.
Aberdeen City CouncilAir ProductsBRCBYDCalorgasCN
G FuelsCN
G ServicesDearm
an Engine Company Ltd
Downstream
Fuel AssociationDrivelectricLtd.EN
N Group Europe
Gas Bus AllianceGasrec
GTCIntelligent EnergyN
issanO
penenergiRiversim
pleScaniaSGNSM
MT
TfLThrievTow
er TransitU
KLPGU
KPNU
LEMCo
UPS
Wales &
West U
tilities
Project Steering Comm
itteeW
orkshop attendees

4
Contents
−Introduction and context
−Background and status quo
−Future refuelling
infrastructure requirements and
barriers to deployment
−Sum
mary roadm
ap and recomm
endations
−Appendix

5
Background -a ‘Transport Infrastructure roadmap’ is needed to
complem
ent existing vehicle and fuel roadmaps
Source: Auto Council and LowCVP
Vehicle roadmaps
Transport fuel roadmaps
Source: Auto Council and Element Energy for the Low
CVP
�In the context of the expected transition to low
er carbon powertrains
and fuels, the Auto Council vehicle roadmaps have proven to be a
useful toolto focus research, funding and policy, bringing into one place the industry’s view
s on future technology options, deployment
steps and corresponding policy drivers.
�To com
plement these pow
ertrain technologies roadmaps, the
LowCVP com
missioned a Road Transport Fuels Roadm
ap in 2013-14, w
hich also proved successful in bringing clarity to the fuel options available and m
apping the enabling milestones.
�This Infrastructure roadm
ap is the ‘missing piece’ that w
ill support new
powertrains and new
fuels. This roadmap is all the m
ore necessary as the
needs and barriers for deployment of electric,
hydrogen and gas refuelling stations differ significantly and refuelling/recharging infrastructure is a key enabler for low
emission
vehicles.
�The objectives of the Infrastructure Roadm
ap are to:
−Assess the infrastructure needs and barriers for deploym
ent of electric, hydrogen and gas refuelling stations to 2050, including im
pact on upstream distribution, as w
ell as to consider ‘conventional’ liquid fuels
−M
ake recomm
endations for delivery of infrastructure deploym
ent, both at national and local government level.
Source: Element Energy

6
The Infrastructure Roadmap covers private and public infrastructure,
for all main road vehicles and both current and future fuels
�Depot based refuelling for fleet operators and return to base operators
�Hom
e recharging for private and (some) com
mercial vehicles
�Public forecourt refuelling/recharging
Refuelling infrastructure types
Fuels / energy vectors considered
�Zero tailpipe em
ission fuels: electricity and hydrogen�
‘Conventional’ liquid fuels: gasoline (E5 to E20, in line with
the Transport Fuels Roadmap), diesel, LPG/bio-propane
�M
ethane: Compressed N
atural Gas (CNG), Liquefied N
G (LNG)
and biomethane
�N
iche/future fuels: methanol, liquid air and a high bioethanol
blend (E85)
�The U
K’s legally binding target to reduce total GHG
emissions by at least 80%
(relative to 1990 levels) by 2050, and transport contributes to c. 25%
of UK total GHG em
issions; �
EU level regulations (gCO
2 /km, Air Q
uality targets and EURO
spec), Directives (Renewable Energy, Fuel Q
uality, Clean Pow
er for Transport) and Transport White Paper
Drivers for change in the transport energy system
Vehicle types
Source: Element Energy

7
The development of the Infrastructure Roadm
ap benefitted from input
from a w
ide range of stakeholders, many consulted through w
orkshops
Developuptake scenarios
for % sales of electric and
ICE vehicles
Inputinto Element Energy
fleet model
Outputnum
bers of vehicles in the fleet and
MJ used per energy vector
ICE vehicles: diesel, petrol, LPG, gas vehicles Electric vehicles: Battery (BEV), Plug-in Hybrid (PHEV), Range-Extended (RE-EV) and hydrogen fuel cell (FCEV)N
iche/future fuels considered: E85, methanol, liquid air
PrepareInfrastructure
Roadmap
Reviewexisting literature
on refuelling and upstream
infrastructure
Industry consultation w
ith LowCVP Fuels
working group
Review by Steering
Comm
ittee Prepare
draft report
Complete final report
Hoststakeholder w
orkshops
Four dedicated fuel workshops w
ere conducted�
Workshop them
es: electricity, liquid fuels, methane, hydrogen
�38 attendees included: Infrastructure m
anufacturers, installers, operators, DN
Os, energy com
panies, fuel suppliers, OEM
/ vehicle suppliers, end users, local governm
ent / regulator
Report preparation
External input
Source: Element Energy
vkt: vehicle km travelled
See full reports for further details of fuel uptake scenarios
Scrappage rate, stock and mileage inputs based on DfT
data/projections: c. 40% increase in stock and
vkt by 2050 (39 million vehicles, 740 billion vkt); Vehicle efficiency based on Com
mittee on Clim
ate Change m
odelling

8
Four separate reports have been developed –this report is dedicated
to the case of methane as a transport fuel
Final report sum
marising
findings from each
energy vectors
Four separate reports were produced to capture the differences
between the energy vectors / fuels under consideration
This
repo
rt

9
Structure of the report
�Background and status quo
−Sum
mary of current production and distribution system
, and energy vector usage
−Current supply pathw
ays
−Current dispensing technologies, geographical spread and key stakeholders
�Future infrastructure requirem
ents and barriers to deployment
−Future hydrogen transport dem
and and production pathways; the role of electrolysers
−Q
uantification of refuelling station needs, by location and/or vehicle segment -based on projected
demand, derived from
validated uptake scenarios
−Barriers to deploym
ent of infrastructure -barriers to deployment of corresponding pow
ertrains are not discussed–
uptake of new pow
ertrains/fuels is the starting assumption
�Sum
mary roadm
ap and recomm
endations−
Roadmap schem
atic summ
arising the above findings
−Recom
mendations for delivery (national, local, RD&
D needs, funding shortfall)

10
Contents
−Introduction and context
−Background and status quo
−Future refuelling
infrastructure requirements and
barriers to deployment
−Sum
mary roadm
ap and recomm
endations
−Appendix

11
H2 refuelling
station with
electrolyser
Until now
, the UK hydrogen industry has been overw
helmingly geared
towards m
eeting demand in refinery and industrial processes
Sources: All figures refer to the UK and are from
DUKES (2014), DECC (2014), Roads2Hycom
Deliverable 2.1 and 2.1a (2007)N
ote: Some hydrogen is also im
ported to the UK
SMR
plant
Natural gas
H2 m
erchant com
pressed gas loading stations
Transport dem
and
UpstreamMidstreamDownstream
Oil
Oil
refineriesFossil fuel
power plant
Low carbon
power source
Natural gas, coal, oil
Transmission
grid
Renewable and
nuclear installed capacity: 23.1 G
WInstalled capacity: 61.8 GW
Distribution grid
Total cabling:
>10,000 km
Total cabling:
>700,000 kmTube
trailers: > 100 in U
K
Large-scale industrial productionSm
all-scale on-site productionH2 production
unit
Small
distributed dem
and
<1 ktpac.6%
PurificationLarge
industrial dem
and
c.94%
Produced and consum
ed on-site, or
delivered via pipeline
c.690 ktpa
Chloro-alkaliBy-
product

12
�Several non-O
EM m
anufacturers are developing hydrogen (fuel cell or ICE)-based m
obility concepts across a range of segm
ents,many already available:
�W
hilst some of these vehicles w
ill rely on stand-alone depot-based refuelling infrastructure, m
any will also
rely on the availability of public refuelling networks
�The non-O
EM vehicles often have different refuelling
requirements versus O
EM cars (e.g. different refuelling
pressures, refuelling frequency, tank size, etc.)�
There is therefore a need to ensure H2 infrastructure is
compatible w
ith all vehicle types from O
EMs and
other suppliers
�Hydrogen-pow
ered vehicles will start to be deployed in the 2015-
2020 period, with an expected ram
p-up beyond 2020�
Depending on the deployment rate of passenger cars, other vehicle
types may play an im
portant role in increasing the utilisation of the early refuelling station netw
ork�
Consideration should be given to making refuelling stations
compatible w
ith a wide range of vehicles
�This docum
ent summ
arises the likely infrastructure needs for hydrogen-fuelled vehicles in the 2015-2050 period
�A range of O
EMs have announced plans to bring FCEVs to m
arket in the 2015-2018 period, aim
ing to have 1,000’s deployed by 2020:
�These vehicles w
ill require extensive refuelling infrastructure in their target m
arkets, to offer an attractive consumer proposition
�They w
ill be launched in markets w
here the best conditions exist in term
s of customer dem
and and incentives, regulatory push and availability of infrastructure
Several manufacturers plan to com
mercialise hydrogen vehicles in the
coming years, w
ith associated refuelling infrastructure requirements
Major vehicle O
EMs
Small m
anufacturers
Implications for refuelling infrastructure
Hyundai ix35 FCEV –
launched 2014Toyota M
irai–launched 2014/5
Honda FCV –launch 2016
Daimler next gen.
FC –launch 2017
Symbio
FC range extended Kangoo–
launched 2014
Van HoolFC bus –launched 2013
ULEM
CoH
2 -ICE Van –
launched 2012HyPulsion
FC forklift –
soft launch 2014Riversim
plecar –
launch c. 2018
Symbio
FC range-extended truck –
launch c. 2017
FC = Fuel Cell, FCEV = Fuel Cell Electric VehicleSource: Elem
ent Energy
Expected
to a
lwa
ys requ
ire stan
d-a
lon
e refuellin
g fa
cilities
13
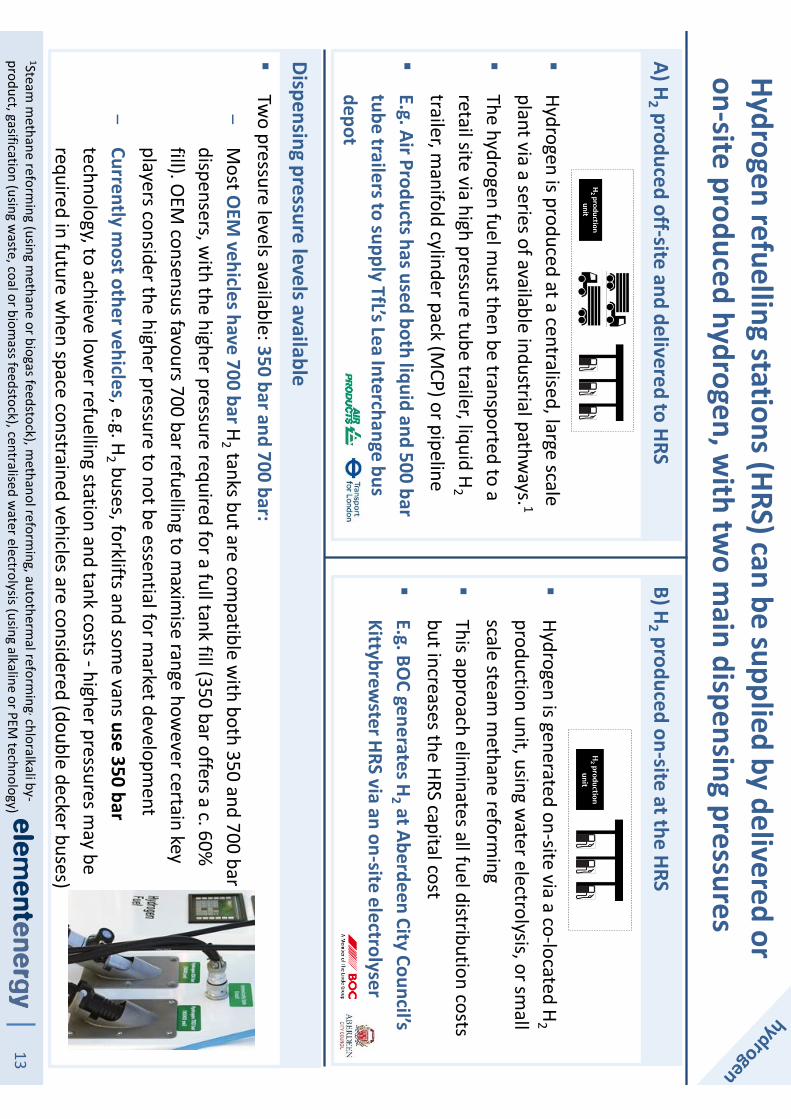
�Hydrogen is produced at a centralised, large scale plant via a series of available industrial pathw
ays. 1
�The hydrogen fuel m
ust then be transported to a retail site via high pressure tube trailer, liquid H
2
trailer, manifold cylinder pack (M
CP) or pipeline�
E.g. Air Products has used both liquid and 500 bar tube trailers to supply TfL’sLea Interchange bus depot
Hydrogen refuelling stations (HRS) can be supplied by delivered or on-site produced hydrogen, w
ith two m
ain dispensing pressures
1Steam m
ethane reforming (using m
ethane or biogas feedstock), methanol reform
ing, autothermalreform
ing,chloralkali by-
product, gasification (using waste, coal or biom
ass feedstock), centralised water electrolysis (using alkaline or PEM
technology)
A) H2 produced off-site and delivered to HRS
B) H2 produced on-site at the HRS
�Hydrogen is generated on-site via a co-located H
2
production unit, using water electrolysis, or sm
all scale steam
methane reform
ing�
This approach eliminates all fuel distribution costs
but increases the HRS capital cost�
E.g. BOC generates H
2 at Aberdeen City Council’s Kittybrew
ster HRS via an on-site electrolyser
Dispensing pressure levels available�
Two pressure levels available: 350 bar and 700 bar:‒
Most O
EM vehicles have 700 bar H
2 tanks but are compatible w
ith both 350 and 700 bar dispensers, w
ith the higher pressure required for a full tank fill (350 bar offers a c. 60%
fill). OEM
consensus favours 700 bar refuelling to maxim
ise range however certain key
players consider the higher pressure to not be essential for market developm
ent‒
Currently most other vehicles, e.g. H
2 buses, forklifts and some vans use 350 bar
technology, to achieve lower refuelling station and tank costs -higher pressures m
ay be required in future w
hen space constrained vehicles are considered (double decker buses)

14
Today’s early public HRS are generally based on containerised solutions; future HRS w
ill be more fully integrated w
ith existing forecourts
Source: Air Products, ww
w.hydrogen.energy.gov
Current HRS layoutsCharacteristics of today’s HRS
Future HRS will be integrated w
ith existing forecourts�
It is envisaged that future HRS (e.g. beyond 2020) will increasingly be integrated
within conventional existing petrol stations. Furtherm
ore, the coexistence of EV and FCEV infrastructure should be considered
�Generally based on containerised solutions –
typically standard ISO shipping
containers�
They are often stand-alone stations on dedicated land�
HRS equipment is often in ISO
(20 ft) shipping containers. Overall footprint of
~150m2depending on m
anoeuvring space etc.�
A local H2 store in the form
of compressed gas is generally present
�Refuelling nozzle is industry standard, safe, reliable and user friendly
�Refuelling takes a sim
ilar time to conventional fuel (3–4 m
inutes)
�This is likely to be the long-term
solution once FCEVs reach com
mercialisation but w
ill require w
ell designed and fully integrated H
2 storage, distribution and safety system
s, as w
ell as developments in
national regulations
�A num
ber of fuel retailers have already trialled these solutions, and integrated stations are already present in Germ
any and California
�U
K HRS are currently stand-alone or ‘hosted’ sites i.e. not fully integrated w
ith conventional forecourts�
Dispenser is accessible to vehicle users, w
hile hydrogen storage, compressors
etc. are secured from public access
�Som
e sites use ‘trailer swapping’, w
here a hydrogen trailer acts as an on-site hydrogen store rather than offloading to other storage tanks
15
�Early HRS are likely to be in the ‘sm
all’ range�
As vehicle numbers and dem
and grow, larger stations with superior
economics w
ill increasingly be deployed
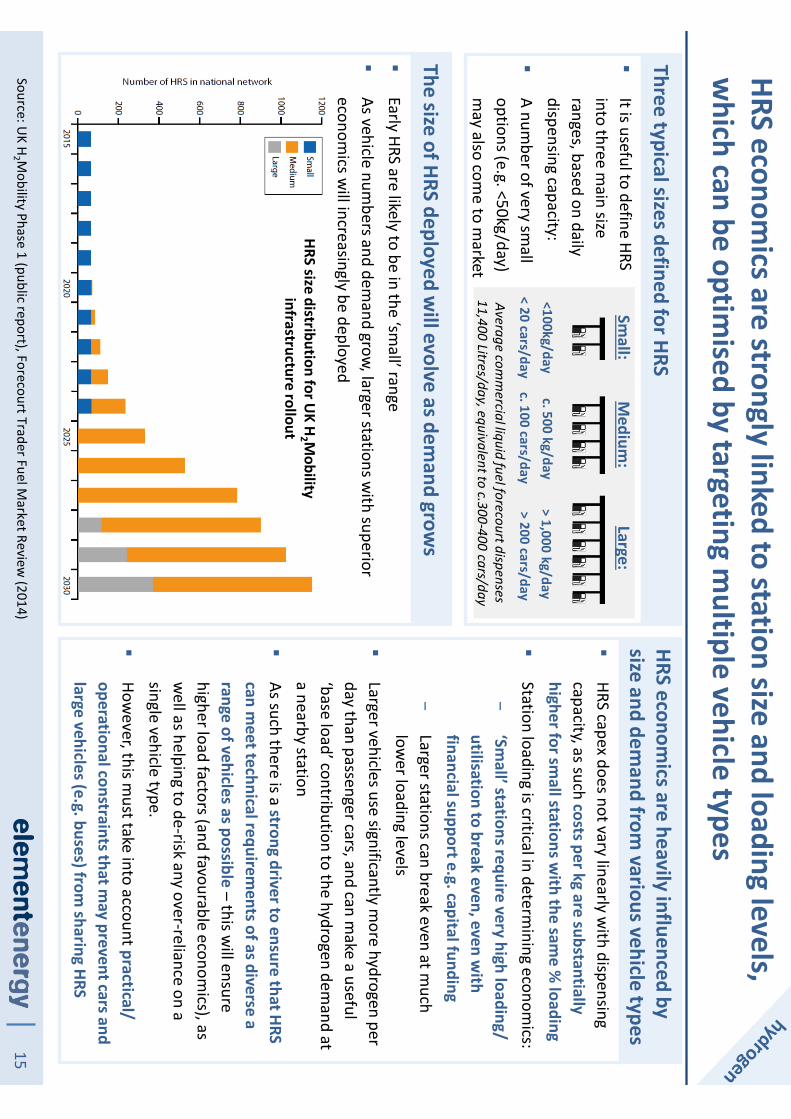
HRS economics are strongly linked to station size and loading levels,
which can be optim
ised by targeting multiple vehicle types
Three typical sizes defined for HRSHRS econom
ics are heavily influenced by size and dem
and from various vehicle types
�HRS capex does not vary linearly w
ith dispensing capacity, as such costs per kg are substantially higher for sm
all stations with the sam
e % loading
�Station loading is critical in determ
ining economics:
‒‘Sm
all’ stations require very high loading/ utilisation to break even, even w
ith financial support e.g. capital funding
‒Larger stations can break even at m
uch low
er loading levels�
Larger vehicles use significantly more hydrogen per
day than passenger cars, and can make a useful
‘base load’ contribution to the hydrogen demand at
a nearby station�
As such there is a strong driver to ensure that HRS can m
eet technical requirements of as diverse a
range of vehicles as possible –this w
ill ensure higher load factors (and favourable econom
ics), as w
ell as helping to de-risk any over-reliance on a single vehicle type.
�How
ever, this must take into account practical/
operational constraints that may prevent cars and
large vehicles (e.g. buses) from sharing HRS
The size of HRS deployed will evolve as dem
and grows
> 1,000 kg/dayc. 500 kg/day
<100kg/day
Small:
Medium
:Large:
�It is useful to define HRS into three m
ain size ranges, based on daily dispensing capacity:
�A num
ber of very small
options (e.g. <50kg/day) m
ay also come to m
arket
HRS size distribution for UK H
2 Mobility
infrastructure rollout
Source: UK H
2 Mobility Phase 1 (public report), Forecourt Trader Fuel M
arket Review (2014)
< 20 cars/day c. 100 cars/day
> 200 cars/day
Average comm
ercial liquid fuel forecourt dispenses 11,400 Litres/day, equivalent to c.300-400 cars/day

16
UK activities exclusively based in London:
There are five operational HRS in the UK w
ith a combined capacity of
c. 1 tonne-H2 /day, w
ith seven more planned by the end 2015
†: Note this does not include sm
all-scale HRS in Birmingham
, Coventry, Glamorgan, Isle of Lew
is, Loughborough, Nottingham
, U
niversity of South Wales. It does not include HRS funded under the 2015 O
LEV scheme (2 new
HRS and 2 mobile refuellers)
Hydrogen infrastructure in the UK today†
Key players active in hydrogen transport in the UK
Retailers, manufacturers, suppliers,
installers, associated energy companies
OEM
s, vehicle suppliers, end users, local authorities
Evolution of hydrogen vehicle/HRS deployments in the U
K
Eight fully operational FC buses and one HRS
deployedThree new
public HRS and c.50 new
FCEVs to be deployed in London
over three yearsO
ne publicly accessible HRS, five FC taxis, and a fleet of FC passenger cars
One publicly accessible
HRS installed alongside a superm
arket forecourt, a fleet of H
2vans and FCEVs
First publicly accessible HRS w
ith on-site production of ‘green’ H
2 in Swindon
Development of national rollout
plans begun for H2 infrastructure
and passenger vehicles
Ten FC buses and one HRS deployed in Aberdeen
Key milestones
HRS completed and
currently operational
HRS to be comm
issioned in 2015LondonIllustrative
locations of 3 additional stations to be installed
in 2015 under HyFIVE

17
Many H
2 production pathways exist w
ith varying costs and CO2 em
ission rates –
most options are available to the U
K today or in the future
Biogas, CCS & novel routes
�H
2 can be produced from various
alternative sources, including waste
gasification, from anaerobic digestion,
or as an industrial or CCS by-product�
Some technologies w
ould produce large quantities of cheap, ‘green’ H
2 if developed, e.g. CCS
�Industry w
ill only consider developing novel pathw
ays when a strong, reliable
energy sector demand is established
Hydrocarbon-based production�
The most com
mon form
of industrial H
2 production today�
Involves reforming m
ethane or other hydrocarbons to produce syngas and subsequently using the w
ater-gas-shift reaction to extract hydrogen
�Highly m
ature technology allowing
low-cost, large-scale production
�Pathw
ay can potentially be decarbon-ised
with carbon capture and storage
Water electrolysis
�M
ature technology but further developm
ents needed for widespread
transport use �
Allows on-site production at HRS
�Requires access to low
cost electricity to achieve affordable H
2 costs�
Using renew
able electricity produces ‘green’ hydrogen
�Potential for use in refinery processes if sufficiently low
cost
Technology type1
1.Distributed w
ater electrolysis2.
Conventional water electrolysis
3.Coal gasification + CCS
4.Centralised SM
R + CCS5.
IGCC + CCS6.
Distributed SMR
7.Conventional SM
R8.
IGCC9.
Coal gasification
Large production capacity in the UK
Several suppliers based in the UK
Techs. at various development stages
Source of graph: A portfolio of power-trains for Europe: a fact-based analysis, M
cKinsey & Co, 2011
CCS = carbon capture and storage, SMR = steam
methane reform
ing 1 Assumes access to green electricity for electrolysers
(Technical targets to reduce carbon footprint of hydrogen
as a transport fuel)

18
A lack of well-developed
distribution systems for high-
purity hydrogen will lead to
the initial dominance of W
E using on-site production
Beyond 2030, ‘green’ H2
will increasingly
dominate due to clim
ate change/CO
2 targets.
‘Green’ hydrogen transition trajectory
Likely production mix w
ill be of methane-based and electrolytic ‘green’
H2 in the m
edium-term
, with m
ore ‘green’ sources in the longer term
1: UK H
2 Mobility Phase 1,
public report
Various sources are likely to be relevant to H2 production going forw
ard
Target CO2 trajectory for fuel cell vehicles 1
Likely production mix trajectory through tim
e
100%80%60%40%20%0%
20302025
20202015
Share of total production mix
2050
New
’green’ production*Existing capacities
WE
New
SMR
*: New
‘green’ production could include waste gasification, CCS, etc. The developm
ent pathw
ay for these technologies will strongly influence the 2050 production m
ix
From 2015 to 2030, a m
ix of methane-based and ‘green’ w
ater electrolysis hydrogen production w
ill dominate:
�U
K H2 M
obility presents a plan to achieve a low carbon
trajectory for the fuel (implying use of renew
able electricity for electrolysers), w
hilst ensuring the fuel is affordable (leading to the use of fossil hydrocarbons)
�The strategy m
atches the CO2 perform
ance of plug-in hybrids as the grid decarbonises, w
hilst identifying a least cost production m
ix–leading to a roughly equal m
ix of m
ethane and electrolysis options�
Similar W
ell to Wheel perform
ance expected beyond 2030
In the 2020-2030 period, overall demand w
ill exceed existing spare capacity and a m
ixture of new on-site/centralised W
E and centralised SMR w
ill be developed, with
associated distribution infrastructure. Clear policy will be needed to deliver green H
2
12
3123
A wider variety of sources are likely to becom
e available, e.g. w
aste gasification, CCS with the choice
of source being specific to the costs in specific locations, rather than a single technology dom
inating
As guaranteed purity becomes m
ore prevalent from
existing centralised sources and demand
can justify investment in high-capacity
distribution, the dominance of W
E is reduced from
2020, as existing H2 sources are tapped

19
�Hydrogen refuelling points shall em
ploy compliant
fuelling algorithms and equipm
ent
�Hydrogen purity dispensed by hydrogen refuelling points
�Connectors for m
otor vehicles for the refuelling of gaseous hydrogen
In 2014, the European Comm
ission issued a directive to help harm
onise technical specifications for hydrogen refuelling equipment
Source: European Comm
ission Press Release Database
From N
ov 2017, all public HRS in the EU m
ust be compliant w
ith the technical specification
�The
Clean Power for Transport program
me, initiated in 2013, aim
s to facilitate the developm
ent of a single market for alternative fuels for transport in Europe
�The resulting 2014/94/EU
directive on ‘the deployment of alternative fuels infrastructure’
aims to:
1)Harm
onise technical specifications for recharging and refuelling stations 2)
Develop clear, transparent fuel price comparison m
ethodologies 3)
Ensure Mem
ber States develop national policy framew
orks to support the deploym
ent of alternative fuel technologies and infrastructure�
Clarity on use of 700/350 bar or dual-pressure refuelling remains not fully addressed by
the Directive, as conformity is possible at 700 bar or 350 bar pressures
ISO/TS 20100
Gaseous Hydrogen Fuelling specification
ISO 14687-2
Hydrogen Purity Standard
ISO 17268
Gaseous Hydrogen M
otor Vehicle Refuelling Connection Devices Standard

21
Contents
−Introduction and context
−Background and status quo
−Future refuelling
infrastructure requirements and
barriers to deployment
−Future hydrogen transport dem
and scenarios
−Hydrogen production and the role of electrolysers
−Future refuelling
infrastructure requirements and barriers to
deployment
−Vehicle-specific infrastructure deploym
ents
−Sum
mary roadm
ap and recomm
endations
−Appendix

22
FCEV uptake has been projected to quantify the hydrogen demand in
transport and corresponding requirements for HRS
�Tw
o scenarios for cars & vans,
�‘CCC targets’: FCEVs reach 10%
market share by
2030 and Zero Emission vehicles reach 100%
of m
arket share before 2050
�‘M
oderate ambition’: the 2030 CCC targets are
not met, FCEV uptake represents 5%
of new
sales; by 2050 FCEVs represent 15% of new
sales but the w
ider category of EVs represent 100% of
sales
�An increase of sales of fuel cell HGVs (m
ostly under 7t GVW
) to <1% in 2020, 1%
in 2030 and 20% in 2050
�An increase of sales of fuel cell buses1-2%
in 2020, 5%
in 2030 and 50% in 2050
�Vehicle stock num
bers were calculated using Elem
ent Energy’s U
K vehicle fleet model. H
2 consumption w
as based on m
anufacturer data and observations from
UK and EU
vehicle trials
2015
10%
2030
15%
2020
5%
50%
2050
CCC targetsM
oderate ambition
<1%
20502050
15%
75%
10%
50%
50%100%
PH/RE EVFCEV
BEV
Share of FCEV light vehicles relative to other ultra-low
em
ission powertrains
Market share of FCEV cars and vans (new
sales)
Uptake of FCEVs is m
ainly in the light vehicle segments
<1%
See Appendix for more detail on scenarios and sources
In consultation with the Low
CVPFuels W
orking Group, w
e derived uptake scenarios for new pow
ertrains/fuels, they are policy led, typically based on CCC targets. Scenarios are used to forecast infrastructure required to m
atch transport policy am
bition and estimate the corresponding upfront costs of this infrastructure

23
Contents
−Introduction and context
−Background and status quo
−Future refuelling
infrastructure requirements and
barriers to deployment
−Future hydrogen transport dem
and scenarios
−Hydrogen production and the role of electrolysers
−Future refuelling
infrastructure requirements and barriers to
deployment
−Vehicle-specific infrastructure deploym
ents
−Sum
mary roadm
ap and recomm
endations
−Appendix

24
Growth in hydrogen dem
and to 2050 from transport w
ill require significant capacity, particularly in low
carbon production routes
Source: UK H
2 Mobility Phase 1 public report, Roads2Hycom
Deliverable 2.1 and 2.1a, Element Energy
1: Based on 100ktpa (largest current UK SM
R plant)2: Based on 70%
efficiency and 80% load factor
Hydrogen demand today and in 2050
�U
nder the high uptake case hydrogen demand for transport w
ill exceed existing production capacity in the 2030s‒
Existing production capacity stands at c. 690 kt/year of which 650 kt/year is dedicated to use by heavy
industry, leaving 41 kt/year that is distributed by tube trailer‒
Total demand from
transport by 2050 equates to c. 2,300 kt/year under the high uptake scenario�
This additional demand presents a significant challenge in term
s of both production and distribution capacity:‒
A quadrupling of existing production capacity would be required: additional production is equivalent to c. 23
large SMR plants 1, or c. 15 GW
of grid-connected electrolysers 2
‒If this hydrogen w
as all produced centrally, this would likely require around 2,000 tube trailers, based on
existing technology (1.1 t per trailer, 500 bar) and two trips per day, com
pared to <100 trailers today. ‒
Alternatively, higher demand could attract large gas com
panies to deploy centralised liquefaction facilities and develop liquid hydrogen logistics netw
orks benefitting from greater vehicle capacity (c.3t per trailer)
‒The case of electrolysis production (w
hich can be centralised or on-site) is detailed on the next slide
Projected growth in hydrogen dem
and for use in transport (High uptake case reaching a parcof c. 10 m
illion vehicles by 2050)
0
1,000
2,000
3,000
3
Hydrogen demand (ktpa)
2015
2,300
194
2025
56
20502030
2020
690
Demand from
light vehiclesDem
and from heavy vehicles
Existing merchant distribution capacity
Existing production capacity

25
Expected development of electrolyser applications through tim
e�
It is expected that growth in electrolyser
numbers w
ill be led by a number of
applications:‒
The comm
ercialisation of FCEVs in the 2015-2025 period, leading to a dem
and for high-purity, low
carbon H2
‒O
ther markets for electrolysis m
ay open in the pow
er to gas and chemicals
sectors in parallel to transport
Grow
th in electrolysis is expected assuming the right conditions are m
et
�O
n-site electrolysis (as opposed to centralised production) is likely to dominate in short term
as there is a better match w
ith the scale of dem
and at refuelling stations. Groups of on-site electrolysers can provide grid services through pooling/aggregation�
In the medium
term, choice of on-site versus centralised production w
ill depend on economies of scale, access to low
electricity prices versus distribution costs and possible colocation w
ith other demands (e.g. pow
er to gas, pre-combustion carbon capture and
storage)�
Green H2 could also displace conventional H
2 in refinery processesif available at sufficiently low cost
Source: Development of W
ater Electrolysis in the European Union, FCH JU
, 2014
�Access to low
-cost electricity�
Ability to access payments from
energy network
operators from provision of grid services
Optim
ised economics are key
�Im
provements in capex, system
size, efficiency andlifetim
e will be
required to improve overall econom
ics�
These incremental changes w
ill be key to the widespread rollout of W
E
Improvem
ents in performance and capex also required
12 Once com
mercially proven, H
2 from w
ater electrolysis (WE) is expected
to see significant growth to 2030, driven initially by the transport sector

26
Variable operating costs, i.e. electricity input costs make up the largest portion of the levelised
cost of H2 production
The main com
ponent of the cost of hydrogen production from
electrolysis is the variable electricity input costs
The cost of hydrogen production is made up of a num
ber of components, dom
inated by variable costs
Capital costs (capex)All capital costs (including finance costs) spread over each kg of H
2 delivered
Fixed operating costs (fixed opex)Includes servicing, m
aintenance, insurance, land rent etc.
Variable operating costs (variable opex)Dom
inated by electricity cost, but also includes w
ater feedstock
Cost structure is dominated by variable
costs 2. Low electricity prices are required
to be competitive w
ith petrol/diesel on a per km
basis, which is approxim
ately £7/kg equivalent including the HRS
1 MW
alkaline WE system
2015 costs from FCH JU
electrolyser study (2014): capex = £760/kW, opex
= £27/kW (excludes stack replacem
ent), electricity price range = £0.05-0.11/kW
h (lower-bound corresponds to electrolyser providing e.g. grid balancing services, etc. or private w
ire connection to a renewables generator, upper-bound
corresponds to using retail electricity prices), interest rate = 7%, lifetim
e = 15 years, WE consum
ption = 55 kWh/kgH
2, utilisation = 80%, excludes redundancy costs
�O
nly 4% of existing global H
2 production (mainly for industrial use) is based on W
E, 1due to the higher costs of WE in m
ost markets
compared to alternatives e.g. SM
R, or industrial by-products�
More recently, increasing dem
and for lower carbon content and higher purity H
2 for transport applications is leading to increased dem
and for H2 from
WE (w
hich produces very pure H2 , can be deployed on-site, and can be pow
ered by renewable electricity)
�This new
demand ties in w
ell with the em
ergence of WE as a solution for energy storage and grid balancing applications
New
applications for electrolytic H2 are em
erging
Source: Element Energy analysis
1IEA (2007), 2This assumed a w
ell-utilised electrolyser. As utilisation decreases, capex and fixed operating costs becom
e a larger proportion of the overall cost of H2 produced
1
2.80
6.10
0.20
0.20
0.703.70
7.000.70
Low electricity cost (5p/kW
h)
High electricity cost (11p/kWh)
Fixed opexCapex
Variable opexIllustrative H
2 production cost from w
ater electrolysis, £/kg

27
The economics of H
2 from electrolysis are heavily dependent on the
ability to access affordable electricity and to provide services to the grid
Source: Development of W
ater Electrolysis in the European Union, FCH JU
, 2014
2030 H2 cost at the nozzle for transport applications in the U
K
In the UK, tw
o main w
ays to lower variable costs can be envisaged:
�Reducing the cost of electricity purchased, through e.g. avoiding distribution netw
ork charges –this can be achieved
through connecting the electrolyser directly to a renewable
generator, without going via the distribution/transm
ission grid�
Accessing payments from
the grid operator to help balance the grid by storing energy at tim
es of high production/low
demand, or providing frequency response services –
the H2
produced from energy storage can be used for transport, re-
electrified via a fuel cell, or injected into the gas grid
Options for m
inimising dom
inant variable costsG
rid services impact
2030 H2 production cost in G
ermany under full-and part-
load operating strategies, offering balancing services
Impact of off-grid connection for electrolyser
�Savings from
using a private wire
connection can lead to attractive econom
ics vs. SMR in 2030
�Additional savings (e.g. c €1/kg) can be m
ade from offering grid
balancing services –provided the
right balancing payments regim
e is in place
Resulting H2 econom
ics
2

28
Contents
−Introduction and context
−Background and status quo
−Future refuelling
infrastructure requirements and
barriers to deployment
−Future hydrogen transport dem
and scenarios
−Hydrogen production and the role of electrolysers
−Future refuelling
infrastructure requirements and barriers to
deployment
−Vehicle-specific infrastructure deploym
ents
−Sum
mary roadm
ap and recomm
endations
−Appendix

29
Early publicly accessible HRS are likely to require public funding, beyond 2020 HRS w
ill offer increasingly attractive investment propositions
�FCEV costs are likely to be higher than diesel and plug-in vehicles until 2
ndgen. in ~2020 or beyond�
FCEV car sales of 100s-1000s expected before 2020�
Based on current uptake, pre-2020 deployments are
likely to be concentrated in major urban centres
�HRS deploym
ents likely to be 10s of relatively small
stations, with low
utilisation in early years�
Vans/captive fleet vehicles could help provide a base load dem
and for HRS. Locations of these vehicles will
be driven by local customer dem
and
FCEV passenger car rollout will occur slow
ly pre-2020
Pre-2020 HRS are likely to require public funding
�HRS investm
ents will be required early in order to
ensure early FCEVs have access to hydrogen, despite challenging econom
ics of small, under-utilised HRS
�In m
ost cases (except e.g. heavily-loaded captive fleet HRS)European, national or regional governm
ent interventionw
ill be required to bridge the funding gap
�A range of funding sources is available –
next slide
Post-2020, HRS will offer im
proving economics
�As FCEV num
bers ramp up post-2020, larger, m
ore profitable HRS can be built
�W
ith more vehicles providing higher load factors,
these HRS will offer m
ore favourable economics
�At this point, a com
mercially sustainable rollout is
possible, with increasing interest from
existing petrol station operators or new
entrants. �
Funding no longer needed on a per station basis
AB
Source: UK H
2 Mobility Phase 1 report

30
A range of public funding sources will support hydrogen refuelling
infrastructure deployments in the pre-2020 period
Funding bodyDescription
Fundingrate
Timescales
FCH JU
(FCH 2 JU)
Public-privatepartnership betw
een EC and industry, to advance the com
mercialisation of
hydrogen and fuel cells
Up to 70%
of project value under Horizon 2020
Annual calls for proposals 2014-20
EU
Structural Funds
EU funds for encouraging developm
ent across a range of them
atic objectives (total ~€10.7bn 2014-2020 for the U
K)U
p to 60% of project value
Annual calls for proposals 2014-20
EU TEN
-T/CEFFunding
Funding to improve key transport corridors in
Europe, across a range of modes (total
€26.3bn 2014-2020 across Europe)
Variesup to 50%
depending on type of project
Annualwork program
mes
2014-2020
UK
Governm
ent
UK Governm
ent Ultra-Low
Emissions Strategy
(£500m) includes funding to support H
2infrastructure in the U
K (announced October
2014)
Initial funding: £11m inc.
new HRS (£7m
), upgrades (£2m
) and vehicles (£2m)
•First £5.5m
call:closed 6
thMarch 2015
•Future calls uncertain
InnovateU
KU
K Government-run body to help fund
innovation in a range of technologyareas
Up to 50%
of project value (60%
for SMEs)
Regularcalls for proposals
Some uncertainty rem
ains around the end of public support beyond 2020�
Multiple funding sources are available to support new
refuelling infrastructure in the early years of FCEV com
mercialisation, up to 2020, how
ever beyond 2020 it is unclear which sources of funding w
ill be renewed
�There m
ay be a need to review public funding around 2018, to evaluate the need for funding/policies/other
support mechanism
s beyond 2020 and ensure that adequate support is in place for hydrogen transport com
mercialisation to continue beyond 2020
Source: Element Energy

31AD = Anaerobic digestion
BarrierDescription
Example solution
Cost and reliability of HRS
Today’s HRS are produced in low volum
es, w
ith bespoke, low volum
e components.
Reliability not yetequal to petrol forecourts
�Introduction of series production and standardiseddesigns
�Reduced cost and standardisation of com
pression/pre-cooling components
�M
obile back-up stationsto give netw
ork redundancy
Customer
experience
Consistent customer experience e.g. ‘look
and feel’ of stations, ease of paym
ent, pricing etc. not yet established
�Industry-agreed guidance for custom
er experience�
Appsto help navigate sparse early netw
ork
Regulatory and approvals process
Regulatory regimes often differ betw
een sites, w
ith no standardised approvals process yet defined
�Introduction of EU
-wide regulations for safe design
of HRS�
Standardised and streamlined approvals processes
Safety restrictionsStatic
hydrogen storage regulations restrict sizing of refuelling stations
�Am
end COM
AH (and other) regulations to reflectthe needs of the hydrogen transport sector
Stationsiting
Challengingto find suitable sites in space-
constrained urban areas�
Development w
ork to reduce station footprints�
Involvementof fuel retailers/site hosts required
H2 quality
assurance and m
etering
Quality assurance procedures to m
eet ISO-
defined purity limits not yet finalised
Accurate H2 fuel m
etering technology is im
mature
�Developm
ent of standardised, low-cost, in-line fuel
quality measurem
ent techniques�
Simplified H
2 purity regulations from O
EMs
�Volum
e-produced H2 m
etering technology
The hydrogen sector is working to address several barriers to allow
the transition from
demonstration activities to a com
mercial rollout
32
Contents
−Introduction and context
−Background and status quo
−Future refuelling
infrastructure requirements and
barriers to deployment
−Future hydrogen transport dem
and scenarios
−Hydrogen production and the role of electrolysers
−Future refuelling
infrastructure requirements and barriers to
deployment
−Vehicle-specific infrastructure deploym
ents
−Sum
mary roadm
ap and recomm
endations
−Appendix

33
H2 dem
and (ktpa):
Passenger cars -full national coverage for hydrogen refuelling for cars is expected by 2030, to support increasing FCEV num
bers
Total FCEVs in the vehicle parcbeyond 2020
Source: UK H
2 Mobility Phase 1 public report, DECC 2050 pathw
ays analysis
Thousand FCEVs
218-34
65-130340-1300
�First 10-15 HRS deployed in 2015
�Gradual ram
p-up to 65 by 2020 before further deploym
ents Likely m
ostly ‘small’
(< 100kg / day) –HRS supported by public funding
�Dom
inated by stand-alone HRS, som
e forecourt integration
2015-2020�
Ramp-up post-2020
with 2nd gen. FCEVs
�>300 HRS deployed by 2025
�Shift to larger, profitable stations
�Shift to forecourt stations and m
arket entry by m
ajor retailers
2020-2025�
Further mass-m
arket vehicle grow
th�
Rapid rollout of large, forecourt-integrated HRS
�Full national coverage achieved by 2030, w
ith >1,000 HRS deployed
�Intervention to ensure sufficient green H
2 in production m
ix
2025-2030�
Continued growth in
line with FCEV sales,
which are expected
to make up 20-50%
of the vehicle parcby 2050
�Hydrogen a ‘standard’ offer at m
ajority of refuelling stations during this phase
2030-2050
4,300180
680
16,800
3501,400
20502025
2030
Moderate scenario
CCC target scenario
2
2020

34
First 65 HRS for passenger cars deployed by 2020�
Initially, OEM
vehicles will not be available in all show
rooms. Instead, vehicles w
ill only be made available from
a few
strategically chosen areas predominantly in South East England
�Geographic strategy for first stations not yet finalised, though focus on South East is expected given current HRS deploym
enttrends and high costs of supporting sm
all numbers of vehicles across national dealer netw
ork�
Some coverage of m
ajor roads and secondary urban clusters as HRS numbers grow
–‘prim
itive’ national driving by 2020
> 300 HRS across the UK by 2025
�All m
ajor roads and major cities covered by 2025
�Coverage to enable ‘close-to-hom
e’ refuelling for 50% of
the population, as well as long-distance travel
> 1,000 HRS across the UK by 2030
�Full U
K coverage, defined as ‘close-to-home’ refuelling
for the whole U
K population, including less-populated regions
Source: UK H
2 Mobility Phase 1, public report, industry input at w
orkshop in March 2015
2025 illustrative
2015-2020
Areas covered by HRS deployed in:
2021-2025
2026-2030
2015-2020
Areas covered by HRS deployed in:
2021-2025
2026-2030
~ 330~ 1,150
2030 illustrative
The initial focus for the passenger car-led HRS rollout is likely to be dense urban centres, w
ith rapid expansion beyond 2020 to the rest of UK

35
Vans -use of passenger car stations, with a sm
all number of
dedicated HRS at depots by 2030
Grow
th in hydrogen vans expected beyond 2025 as more vehicles becom
e available and prices drop
Most H
2 vans deployed in relatively sm
all numbers,
reliant on fully public infrastructure
Additional H2 van options
likely available, e.g. from
OEM
s Ægreater penetration
amongst fleet operators
As costs approach diesel parity, rapid grow
th in adoption of H
2 vans in applications that cannot be m
et by battery electric vans
2015-20202020-2025
2025-2050
�U
se of public HRS preferable to provide ‘base load’ H
2 demand
�Som
e vans currently require 350 bar refuelling –
dual-pressure HRS m
ay be needed w
here this is justified by local vehicle dem
and �
Avoid depot-based refuelling w
here possible, deploying vehicles in fleets able to use the em
erging public infrastructure
�M
aximise public availability
2015-2020�
Increased deployments of
vans, particularly driven by urban air quality restrictions
�Continued use of public refuelling w
here possible�
Emergence of depot-based
refuelling where needed for
operational reasons and for large fleets
�Potential shift to 700bar tanks reducing the need for dual-pressure stations
2020-2025�
Widespread deploym
ent of hydrogen vans
�Strong utilisation of HRS by cars reduces im
portance of non-depot refuelling for vans (i.e. base load dem
and is already present)
�U
se of depot-based fuelling w
herever more convenient
for fleet operators
2025-2030

36
H2 dem
and (ktpa):
Buses (+ trucks) -significant numbers of depot-based HRS are
expected by 2030, likely focused in major urban centres
Total FCEV buses and HGVs in the UK fleet
Num
ber of HGVs and buses
310
23440
�U
p to c. 5 depot-based 350 bar HRS w
ith up to c. 1tpd �
Unlikely to be
publicly accessible�
Locations driven by local political am
bition and air quality targets
�Lim
ited dem
onstrations of H
2 light trucks
2015-2020�
Further deployments
of e.g. 20 buses (1-2 routes) in leading cities. 1 depot HRS per city (~1tpd)
�Reduced public funding for refuelling infrastructure
�Increasing use of H
2in light trucks to com
plement EVs for
longer duty cycles
2020-2025�
Multiple routes
using fuel cell buses in leading cities
�Larger ~2-5tpd HRS in depots
�N
ovel engineering solutions required for these larger depots
�Grow
ing role for H2
in larger trucks, likely using depot based refuelling
2025-2030�
Hydrogen becomes
one of the dominant
fuels for buses alongside other U
LEV powertrains
�W
idespread availability of high-capacity 350 bar HRS developed in depots across the country
�W
idespread use of H
2 in trucks
2030-2050
130,000
8,0003,000
Low 100s
20202025
20302050

37
Forklifts -the forklift HRS market is likely to grow
rapidly beyond 2020, provided the technology can com
pete on economic term
s in the UK
Grow
th in hydrogen forklifts expected beyond 2025 as more vehicles becom
e available and prices drop
Small num
ber of deployment
projects to 2020 to test the cost-effectiveness of fuel cell
forklifts in the UK m
arket
If fuel cell forklifts can prove their cost-effectiveness
relative to electric/hybrid in the U
K market, deploym
ents in larger num
bers will occur
Continued rollout of hydrogen forklifts to existing
customers, until all their
major logistic centres have
been covered
2015-20202020-2025
2025-2050
�Trial fleets using 350 bar indoor HRS, capacities up to 50kg/day (c. 25 vehicles per site)
�Likely focused on m
ajor logistical operators in strategic locations w
here battery technology currently in use –up to c. 10 sites
�U
S deployments suggest focus
is on largest sites initially, w
here economics are m
ost favourable
2015-2020�
Indoor refuelling with
capacities up to c. 100-200kg/day (up to c. 100 vehicles per site)
�Focused on m
ajor logistical operations in strategic locations (e.g. ports, large retailer distribution centres, airports, etc.) –
likely starting w
ith expanded fleets at initial trial sites, w
ith 10’s of additional deploym
ents beyond that
2020-2025�
Likely low 100’s of sites
suitable in the UK w
ith similar
specs (i.e. 100-200kg/day) by 2030
�Beyond 2030, as costs start to com
pete with incum
bent technologies, e.g. gas or diesel, custom
ers in locations w
ith lower operating hours
and fewer vehicles –
may be
indoors or outdoors and cover range of capacities
2025-2030

38Source: H
2 TINA (2015). Costs = HRS costs 80kg/day: £0.8m
(2012), £0.4m (2025). 500kg/day: £1.4m
(2012), £0.7m (2025).
1000kg/day: £2.4m (2012), £1.3m
(2025). No cost reduction for 2030 &
2050.
20302025
£400m-£700m
1
£6,750m
2050
£50m£180m
2020
Approximate cum
ulative public infrastructure investment
required (station capital and civils costs only)
Production and distribution capacity has not been considered when estim
ating overall station numbers.
Investment needs in hydrogen stations are expected to be up to £700m
by 2030, rising significantly to 2050 to serve a large U
K vehicle fleet
1Lower bound based on U
K H2 M
obility Phase 1 report, assuming 1,150 stations by 2030. U
pper bound based on HRS cost data from H
2 TINA
65 HRSc.250 HRS
c.700 HRSc.6,000 HRS
Market driven / private
investment
Early market –
some support to
investment likely to be needed

39
Contents
−Introduction and context
−Background and status quo
−Future refuelling
infrastructure requirements and
barriers to deployment
−Sum
mary roadm
ap and recomm
endations
−Appendix

40
Basic national coverage
Public access
HRS #’sFirst 65 ‘sm
all’ HRS
HDV depots
Pressure
350 bar
Van/small truck depots
Indoor forklifts350 bar
Next c. 250 ‘m
edium’
and ‘large HRSN
ext c. 700 ‘medium
’ and ‘large’ HRS
Continued growth
based on demand
700 bar SAE-compliant fuelling for cars. HRS
investors encouraged to make 350 bar H
2 available to support other vehicle types w
here needed
Up to 5 additional c.
1t/day depot-based HRSEm
ergence of multi-tonne/day depots in m
ajor urban areas, covering m
ultiple routes eachN
ationwide deploym
ent of large bus depots
Gradual growth in indoor HRS as m
arket develops, m
oving from sm
all (<50kg/day) to large (>100kg/day)Conversion of m
ultiple large logistics centres from
batteries to fuel cells with indoor large HRS
The H2 infrastructure roadm
ap reflects the diverse refuelling needs of different vehicle types and the uncertainty about the speed of the rollout
Location
20152050
20202030
2025
Full national coverage
Dashed lines represent high uncertainty
Major m
ilestone /enabler
Production capacity largely for industry application
Provide base load to underutilised network in early years
H2 supply and
logisticsc. 3 ktpa
Production capacity
Transport dem
and
Provision of new centralised capacity
to support on-site deployments2015 production
capacity exceeded
c. 190 ktpac. 2.3 M
tpa
Increasing forecourt integration/decreasing stand-alone HRS
Limited use of depot-based refuelling
where cost-effective/convenient
HRS: hydrogen refuelling station
Cars
Vans
HDVs
Thousand vehicles
Projections are based on policy-led uptake scenarios presented on page 22
Data supported quantification of infrastructure requirem
ents
Hydrogen vehicle stock
4,200-16,800
750-3,000
130
680-1,400100-2008
180-350
30-60
3
2<1<1
Infrastructure roadmap
20502020
20302025
c.£40mc.£180m
£400-700mc.£6,800m

41
Industry and government w
ill need to work closely to secure the
deployment of the early public HRS netw
ork and hydrogen vehicles
Securing deployment of the early public HRS netw
ork1�
A certain number of HRS (e.g. 65 set out by the
H2 M
obility strategy) is likely to be needed to meet the
needs of the earliest customers and to continue to
attract OEM
s to the UK
�Low
utilisation means that these early HRS w
ill need public funding to attract private investm
ent
�HRS investors w
ill also require confidence from vehicle
suppliers on the timing and am
bition of vehicle deploym
ents
�Custom
er incentives are likely to be needed to encourage early vehicle sales as O
EMs transition to
lower cost second generation vehicles
�The netw
ork will also need to offer a consistent and high
quality customer experience, in term
s of the station ‘look and feel’, ease of use, paym
ent methods etc.
Source: Element Energy
Recomm
endationsCentral G
overnment: Provide financial support
to early HRS, using funding conditions to ensure high quality user experience and coherent geographic strategy. Provide support to vehicles through existing U
LEV incentives
Local Governm
ent: Help provide ‘base load’ dem
and to public HRS (e.g. FCEV procurement
for public fleets) and make sites available for
refuelling stations where possible
OEM
s: Provide transparency on numbers and
locations of vehicle deployments (as far as
possible) to maxim
ise confidence of HRS investors
HRS operators/suppliers: Work closely w
ith vehicle suppliers and their custom
ers to ensure that HRS siting and specifications m
eet their needs

42
Ensuring infrastructure is compatible w
ith all vehicle types and publicly accessible w
ill maxim
ise station utilisation
Maxim
ising utilisation of early stationsCoordination
23�
As the network grow
s, coordination of HRS siting is likely to be needed to optim
ise coverage and custom
er convenience
�Coordination is also likely to be needed on cross-cutting topics e.g. securing deploym
ents of ‘green hydrogen’ production capacity, m
etering and billing, progress tow
ards fully forecourt-integrated stations
�If use of standalone HRS continues, HRS operators should w
ork closely to define a consistent approach to siting and ‘look and feel’ to allow
drivers to find and use the infrastructure
Recomm
endationsAll H
2 stakeholders: Identify an appropriate forum to
allow discussion of these coordination activities, and to
present an aligned UK strategy in outreach to
international OEM
s to maxim
ise appetite to bring vehicles to the U
K
�Early netw
ork is likely to use 700 bar refuelling, based on requirem
ents of OEM
passenger cars
�O
ther vehicle types (e.g. vans, small trucks)
currently use 350 bar tanks which are not
compatible w
ith higher pressure dispensers
�The use of dual-pressure stations (700/350bar) allow
s public HRS to meet refuelling dem
ands of these vehicles, increasing early usage w
here dem
and exists
�Fleet vehicle users should also be encouraged to use public HRS rather than depot solutions w
here feasible to further increase utilisation
Recomm
endationsHRS investors: W
ork with vehicle suppliers to
identify needs for dual-pressure HRS sites
Local government: Encourage fleet stations to be
publicly accessible for private customers w
here feasible (e.g. through planning system
)
Source: Element Energy

43
Existing regulations should be amended to harm
onise the planning approval process, thereby stream
lining infrastructure installation
Siting and planning process4�
Lack of guidance on HRS safety requirem
ents can lead to planning delays and inconsistent user experience
�Transition from
standalone to forecourt-integrated sites likely tow
ards 2020
�W
ork to include hydrogen in the Blue Book
1 is underway to represent hydrogen,
in particular addressing electrical hazardous zones and safety distances, giving clear guidance for use by developers and petroleum
officers in designing and approving HRS on forecourts
Recomm
endationsLocal Authority planning team
s and regulatory authorities: Support the approval of integrating hydrogen infrastructure into existing forecourts; produce guidance docum
ents for standalone HRS
1National Guidance docum
ent jointly published by the Energy Institute and Association for Petroleum and
Explosives (APEA) used to assess and sign off the safety of new forecourt installations and upgrades
Innovation opportunities5�
Reducing the cost of HRS, H2 production
and distribution and vehicles will be
required to allow m
ass-market
deployments
�Q
uality assurance of H2 (low
er cost analysis, continuous m
onitoring etc.) needs to be further developed and standardised
�Engineering solutions are required for large scale depot refuelling beyond current fleet sizes (e.g. c.100 bus depot requiring c.2 tonnes/day)
�Full integration of w
ater electrolysers into the grid w
ill require further trials of technical and com
mercial arrangem
ents
Recomm
endationsInnovation funding bodies: W
ork with industry
to define clear innovation needs that can be delivered through R&
D funding and trials

44
New
policy may be required in the m
edium term
to ensure that the future hydrogen production m
ix delivers CO2 em
issions savings
Hydrogen production pathways
6�Current U
K hydrogen production capacity is insufficient to m
eet transport demand from
the m
id 2030s
�Therefore new
production capacity will need to
be introduced concurrently with vehicle dem
and grow
th, taking into account GHG emission
reduction targets
�A strategy w
ill be needed on how this capacity
will be delivered (based on the expected
volumes of hydrogen vehicles) w
hile ensuring that the overall production m
ix delivers very low
well-to-w
heel emissions
Recomm
endationsCentral G
overnment: Consider policy m
echanisms
to ensure sufficient volumes of low
carbon hydrogen sources
R&D bodies: Investigate low
cost green hydrogen production technologies
Technology type1.
Distributed water electrolysis
2.Conventional w
ater electrolysis3.
Coal gasification + carbon capture and storage4.
Centralised SMR + carbon capture and storage
5.IGCC + carbon capture and storage
6.Distributed steam
methane reform
ing 7.
Conventional steam m
ethane reforming
8.Internal gasification com
bined cycle9.
Coal gasification
Source: A portfolio of power-trains for Europe: a fact-based analysis, M
cKinsey & Co, 2011
Targets: technical targets to reduce carbon footprint of hydrogen as a transport fuel

45
Contents
−Introduction and context
−Background and status quo
−Future refuelling
infrastructure requirements and
barriers to deployment
−Sum
mary roadm
ap and recomm
endations
−Appendix

46
References
−A portfolio of pow
er-trains for Europe: a fact-based analysis, 2011
−BP Statistical Energy Review, 2014
−Data from
industry, including: Shell, Air Products
−DECC, Energy consum
ption in the UK, 2014
−DECC, 2050 energy pathw
ays analysis, 2013
−DfT, Road lengths in Great Britain, 2013
−DU
KES Chapter 3/4/5, 2015
−Elem
ent Energy and E4Tech for the FCH JU, Development of W
ater Electrolysis in the European Union, 2014
−Elem
ent Energy for Birmingham
City Council, A City Blue Print for Low Carbon Fuel Refuelling Infrastructure, 2015
−Elem
ent Energy for DfT, Ultra low
emission van study, 2012
−Elem
ent Energy, Options and recom
mendations to m
eet the RED transport target, 2014
−ETI, An affordable transition to sustainable and secure energy for light vehicles in the U
K, 2013
−European Parliam
ent and Council, Directive 2009/30/EC, 2009
−IEA, Hydrogen Production and Distribution, 2007
−Forecourt Trader, Fuel M
arket Review, 2014
−JRC, W
TT analysis of future automotive fuels and pow
ertrains in the European context, 2014
−Roads2Hycom
Deliverable 2.1 and 2.1a, 2007
−U
K H2Mobility Phase 1, public report, 2013

47
Acronyms
AFVAlternative Fuel Vehicle
CCCCom
mittee on Clim
ate ChangeCCS
Carbon Capture and StorageCHP
Combined Heat and Pow
erCO
MAH
Control of Major Accident Hazard
DECCDepartm
ent of Energy & Clim
ate ChangeDfT
Department for Transport
DUKES
Digest of United Kingdom
Energy StatisticsEC
European Comm
issionEE
Element Energy
ETIEnergy Technologies Institute
EUEuropean U
nionFC
Fuel CellFCEV
Fuel Cell Electric VehicleFCH JU
Fuel Cell Hydrogen Joint Undertaking
FLTFork Lift Truck
H2
HydrogenHDV
Heavy Duty vehicleHGV
Heavy Goods VehicleHRS
Hydrogen Refuelling StationHSE
Health and Safety ExecutiveICE
Internal Combustion Engine
ktpathousands tonnes per annum
LCN
Low Carbon N
etwork
Mt
Million tonnes
NG
National Grid
NPPF
National Planning Policy Fram
ework
OEM
Original Equipm
ent Manufacturer
OLEV
Office for Low
Emission Vehicles
PMParticulate M
atterR&
DResearch and Developm
ent RED
Renewable Energy Directive
SMR
Steam M
ethane Reforming
TEN-T
Trans-European Transport Netw
orksTSB
Technology Strategy BoardTTW
Tank-to-Wheel
ULEV
Ultra-Low
Emissions Vehicle
WE
Water Electrolysis
WTT
Well-to-Tank
WTW
Well-to-W
heel
48
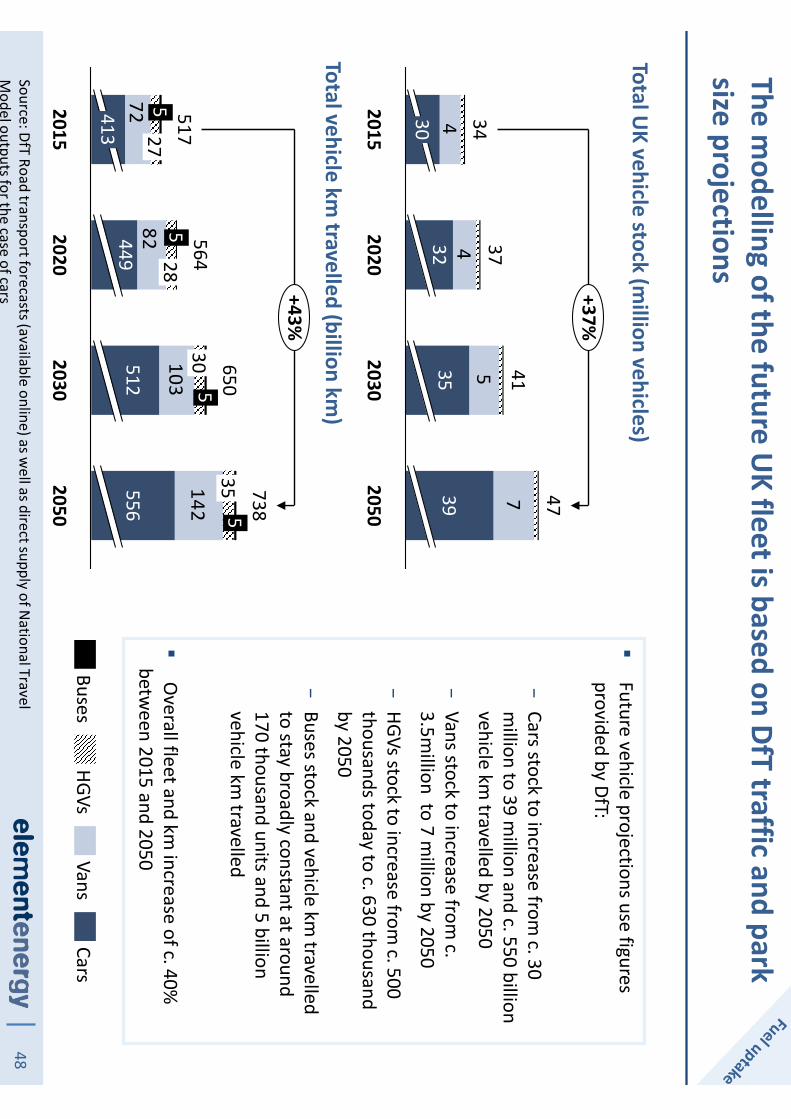
Total UK vehicle stock (m
illion vehicles)�
Future vehicle projections use figures provided by DfT:
−Cars stock to increase from
c. 30 m
illion to 39 million and c. 550 billion
vehicle km travelled by 2050
−Vans stock to increase from
c. 3.5m
illion to 7 million by 2050
−HGVs stock to increase from
c. 500 thousands today to c. 630 thousand by 2050
−Buses stock and vehicle km
travelled to stay broadly constant at around 170 thousand units and 5 billion vehicle km
travelled
�O
verall fleet and km increase of c. 40%
betw
een 2015 and 2050
The modelling of the future U
K fleet is based on DfTtraffic and park
size projections
75
44
3039
20302020
3732
2015
34
+37%
2050
47
4135
CarsVans
HGVsBuses
103142
8272413
449
+43%
2015
517
5
512556
27
2050
738
2030
305
55
28
650
2020
35564
Total vehicle km travelled (billion km
)
Source: DfTRoad transport forecasts (available online) as w
ell as direct supply of National Travel
Model outputs for the case of cars
49
The powertrain/fuel uptake scenarios underpinning the
Infrastructure Roadmap are policy led
Uptake scenarios focus on alternative fuels
�The scenarios used are not intended to cover all possible outcom
es but instead focus on cases w
ith ambitious uptake of alternative fuels
�Scenarios are policy led,typically based on targets set by the Com
mittee on Clim
ate Change (sources show
n next); they are illustrative rather than based on detailed of new m
odelling technology costs and custom
er decision making behaviour
�Therefore the uptake scenarios represent possible futures w
here low and ultra low
emission
powertrains are successfully deployed
�Focus is intended to provide the m
ost interesting inputs for the analysis of the Infrastructure Roadm
ap –e.g. a ‘business as usual’ case w
here petrol and diesel continue to provide over 98%
of road transport energy would not require new
refuelling/recharging infrastructure
�In accordance w
ith the Fuel Roadmap, blends higher than B7 are not considered for the
mainstream
fuels and E20 is considered only from the 2030s
�Scenarios have enabled future infrastructure requirem
ents to be quantified and upfront costs capital costs for public infrastructure have been estim
ated. Cost of setting new fuel
production assets, distribution/logistics costs and general infrastructure operating costs have not been considered. Costs of other incentives that m
ight be required to achieve the uptake scenarios (e.g. vehicle grants) haven not been estim
ated in this study

50
Overview
of the powertrain options considered and key sources
Cars and vansBuses
HGVsN
RMM
HGV = Heavy Goods Vehicles, NRM
M = N
on Road Mobile M
achinery
�ICE: petrol, diesel, LPG, (gas), (H
2 in early years)
�EVs: Battery EVs, plug-in hybrid EVs, fuel cell (FCEVs)
�The Carbon Plan and the Com
mittee on
Climate Change’s
recomm
endations
�H
2 Mobility Phase
1 report, 2013
�Historic trends for petrol/diesel split
�ICE: diesel, (bio)m
ethane
�EVs: BEV, PH/RE, FCEV
�(Liquid air for cooling/hybrid pow
er)
�Current and announced com
mercial
availability, policy drivers
�Alternative Pow
ertrain for Urban buses, 2012
�CCC –
4th
Carbon Budget Review
�ICE: diesel, (bio)m
ethane, (m
ethanol)
�EVs -in lighter segm
ents only
�Current and announced com
mercial
availability
�DfT
HGV Task Force
�TSB-DfT
Low
Carbon Truck Trial
�CCC –
4th Carbon Budget Review
�ICE: diesel, LPG, (gas), Liquid air for refrigeration units
�(Batteries and Fuel Cells –
in som
e applications)
�Data on fuel usage of N
RMM
is sparse
�M
ore qualitative approach suggested
Parentheses indicates the powertrain/fuel option is expected to stay niche in the 2050 horizon
RELEVANT POWERTRAINS /FUELSKEY SOURCES / INDICATORS

51
Cars and vans are expected to transition to zero emission pow
ertrains for the U
K to meet its G
HG reduction targets
Source: Element Energy
�Cars and light com
mercial vehicles (‘vans’) are treated together as they have the
same technology options and fall under the sam
e electrification targets in the Carbon Plan.
�Sales of vans running on m
ethaneare not considered in the m
odelling on the basis of the low
comm
ercial availability (only 2 models on the m
arket), lack of policy drivers for grow
th and aforementioned electrification targets. Any gas dem
and resulting from
vans would be sm
all enough to be considered negligible, in com
parison to the potential gas demand from
trucks.
�Dual fuel vans running on diesel and hydrogen and Range Extender Fuel Cell electric vans (being deployed currently in the U
K and in continental Europe) are not m
odelled explicitly. Instead, their hydrogen demand is accounted for in the ‘FCEV’
heading. The specific requirements for dual fuel and range-extender H
2 vans are how
ever considered in the Infrastructure Roadmap (e.g. dispensing pressure).

52Sources: Elem
ent Energy, UK H
2 Mobility report Phase 1 (2013), Pathw
ays to high penetration of EVs, EE for the CCC (2013), O
ptions and recomm
endations to meet the RED transport target, EE for Low
CVP(2014)
2030 60%
30%
2020
100%2050 100%
3%
2015
9%
Moderate am
bitionCCC targets
<1%
Market share of EVs (new
sales)
50%60%
50%75%
50%39%
35%50%0%
20302050
10%
15%
2020
15%0%
100%
2050
50%
2015
1%
BEVFCEV
PH/RE EV
Breakdown of m
arket share of EVs
�Tw
o EV uptake scenarios have been used:
−‘CCC targets’: EVs reach 60%
m
arket share by 2030 and Zero Em
ission vehicles reach 100%
of market share before 2050
−‘M
oderate ambition’: the
2030 CCC targets are not met
but EV uptake is nonetheless high (30%
new sales); by 2050
EVs represent 100% of sales
but are mainly PHEVs or RE-
EVs, i.e. still reliant on liquid fuels
Scenarios
We studied infrastructure requirem
ents set by the Comm
ittee on Climate
Change targets as well as a case w
ith a slower EV uptake

53Sources: Elem
ent Energy, SMM
T data for 2000-2013 sales, UKLPG for LPG 2013 figures
Sales of new cars w
ith Internal Combustion Engine vehicles -split
between spark-ignition (‘petrol’ type) and com
pression ignition engines (‘diesel’ type)
37%46%
51%50%
50%
86%63%
54%49%
50%50%
20052000
14%
2020-502013
100%
20102012 Com
pression ignitionSpark-ignition
PROPO
SED SCEN
ARIORise of diesel
Stabilisation
2013
5.0%
2030
0.6%
Share of spark-ignition cars (ICE and HEV) stock that run on LPG
c. 112,000 units
c. 800,000 units
�W
e assumed that the current split of
petrol/diesel engines for new cars (50/50)
is maintained going forw
ard
�In line w
ith the Fuels Roadmap, diesel w
ill be B7 (EN
590) with an increasing am
ount of drop-in renew
able diesel –i.e. no
compatibility issue to be considered for the
distribution infrastructure
�For petrol engines, w
e will evaluate the
amount of:
−Ethanol needed if the E10 becom
es the m
ain grade by 2020 and E20 by 2032
−LPG needed for a case w
here the rate of conversion (or sales if O
EM supply
is put in place) accelerates to reach 5%
of the petrol car stock (equivalent to c. 40,000 conversions per year until 2030)
�All new
vans are assumed to run on diesel
Scenarios
We assum
ed continuation of the observed petrol /diesel share for cars and m
odelled an ambitious LPG uptake
Decreasing stock post-2030 as no new
conversion/sales are assum
ed
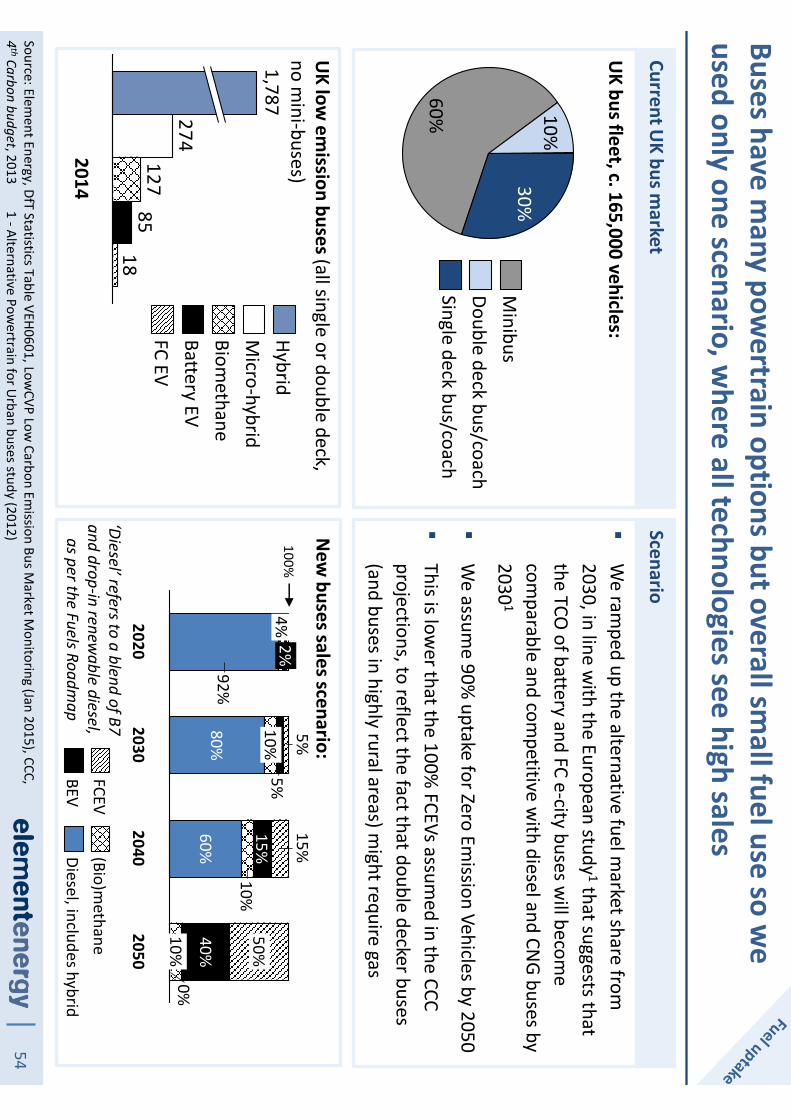
54Source: Elem
ent Energy, DfTStatistics Table VEH0601, Low
CVPLow
Carbon Emission Bus M
arket Monitoring (Jan 2015), CCC,
4thCarbon budget, 2013 1 -Alternative Pow
ertrain for Urban buses study (2012)
30%10%
60%Single deck bus/coachDouble deck bus/coachM
inibus
UK bus fleet, c. 165,000 vehicles:
UK low
emission buses (all single or double deck,
no mini-buses)
274127
8518
2014
1,787
FC EVBattery EVBiom
ethaneM
icro-hybridHybrid
ScenarioCurrent U
K bus market
�W
e ramped up the alternative fuel m
arket share from
2030, in line with the European study
1that suggests that the TCO
of battery and FC e-city buses will becom
e com
parable and competitive w
ith diesel and CNG buses by
20301
�W
e assume 90%
uptake for Zero Emission Vehicles by 2050
�This is low
er that the 100% FCEVs assum
ed in the CCC projections, to reflect the fact that double decker buses (and buses in highly rural areas) m
ight require gas
0%
92%60%
80%
10%
40%
5%15%
15%5%
2020
100%
2050
50%
20402030
2%
10%
10%4%
New
buses sales scenario:
‘Diesel’ refers to a blend of B7 and drop-in renew
able diesel, as per the Fuels Roadm
ap Diesel, includes hybrid
BEVFCEV
(Bio)methane
Buses have many pow
ertrain options but overall small fuel use so w
e used only one scenario, w
here all technologies see high sales

55Source: Elem
ent Energy, DfTStatistics, Birm
ingham City Blueprint for low
carbon fuels refuelling infrastructure, EE for Birm
ingham City Council (2015), Low
Emission HGV Task Force (2014), HM
RC (2014), CCC, 4thCarbon budget, 2013
29%32%
39%
>31t GVW -articulated
> 8t to 31t GVW -m
ostly rigid> 3.5t to 8t GVW
-rigid
UK HGV fleet, c. 460,000 vehicles:
UK low
emission trucks -estim
ates
<100
c. 1,000
2014
Methane
Battery EV
94%79%
0%45%
20%
5%5%
20%
10%1%
2050
0%1%
10%
40%
20%15%
2020
1%
2040
100%10%25%
2030
New
truck sales scenario:
�Gas trucks all over 18t GVW
, mostly
dual fuel (diesel and methane)
�Electric trucks all under 18t GVW
�FCEV light trucks at early dem
o stage
‘Diesel’ refers to a blend of B7 and drop-in
renewable diesel, as per
the Fuels Roadmap
Diesel, includes hybrid
Methane
BEVFCEV
Diesel LPG dual fuel
ScenarioCurrent U
K Heavy Goods Vehicle m
arket
�W
e to modelled a High Alternative Fuel U
ptake case where
both pure electric and gas trucks reach a significant sales levels in their respective m
arkets (light and heavy trucks)�
FCEVs also capture a large share of the market, as per the
CCC’s vision of the role of hydrogen
For Heavy Goods Vehicles, we tested a high uptake of both electric
(battery and fuel cell) and gas trucks

56
Non-Road M
obile Machinery typically refuels in private depots/prem
ises but the case of LPG, liquid air and hydrogen w
ere considered
Source: Element Energy analysis based, on DfT
statistics requested in Jan 2015 and Non-Road M
obile Machinery Usage,
Life and Correction FactorsAEA for Dt (2004) , industry input for LPG use in forklift
10%7%23%
17%
42%
Forklifts
Other off-roads
Agricultural tractors
Refrigeration units on HGVs
Portable generator sets
Other off-roads: Telescopic Handlers, Backhoe Loaders, Excavators, Cranes, Bulldozers, Com
pressors etc.
UK N
RMM
fleet for industry, construction and agriculture, c. 700,000 units in 2014:
(Could transition to LPG, Battery and Fuel Cell packs for some uses)
LPG, could transition to Liquid Air
Use of LPG (already used by c. 30%
of forklifts ) and batteries could increase, could transition to hydrogen
(Limited options, possibly (bio)m
ethane or high blend biodiesel)
Scenario
(LPG, limited alternative fuel options)
Beyond the blending of renewable drop-in diesel in diesel,
options for cleaner fuels are:
�W
e to considered (qualitatively, considering the lack of disaggregated data on fuel use) the infrastructure im
pacts of:
−A transition to Liquid Air for HGV refrigeration units
−An increase in LPG, battery and hydrogen use for forklifts

57
Appendix –There are broadly tw
o types of refuelling infrastructure for liquid fuels in the U
K
Source: Element Energy, DfT M
odes 3 study (2011)
�Large fleet operators including public transport operators, hauliers, logistics com
panies, forklift operators tend to operate designated refuelling depots suited to their ‘return to base’ operations
�Such facilities tend to be private and exclusively service a single vehicle type
�M
ost buses and heavy good vehicles refuel in depots –
share of diesel supplied through depot:�
90% for buses, 40%
for coaches�
80% articulated trucks, 45%
rigid trucks
Refuelling at private depots: c.25% fuel sales
Refuelling at public forecourts: c.75% fuel sales
�Generally, public vehicle refuelling (passenger cars, vans, m
otorbikes, scooters) is facilitated by one of the U
K’s c.8,600 forecourts
�Refuelling forecourts are publicly accessible and are generally ow
ned and operated by large oil com
panies (e.g. Shell, BP, Esso, etc.), independent retailers and superm
arket chains

58
Appendix –N
ational Grid “Future energy scenarios”
SOU
RCE: National Grid “Future Energy Scenarios” (2014)
National Grid has developed four scenarios for future electricity generation and gas
supply sources to 2050

59
Appendix –TEN
-T Core Netw
ork
200km
Source: Element Energy, based on European Com
mission data