low-cost carriers and low fares: competition and ... · low-cost carriers and low fares:...
TRANSCRIPT
Low-Cost Carriers and Low Fares: Competition and Concentration in the U.S. Airline Industry
May 2003
Charles Najda
Abstract
This analysis will examine the current structure of the domestic airline market to determine the amount of market power incumbent carriers wield, the market dynamics that exist in short haul and long haul routes, and the impact of a new breed of air carrier, the low-cost carrier, on the distribution of airfares. The analysis seeks to determine if a low-cost carrier’s presence on a route significantly impacts airfares. This paper argues that previous analyses may overestimate the effect of route concentration, hubs, and other route specific characteristics on the distribution of market prices. The emerging significance of the low-cost carrier may indicate a shift in the structure of the airline market away from hub-and-spoke networks and towards point-to-point networks. The significance of low-cost carriers suggests that government policies that enforce antitrust laws at hub airports may be ineffective; moreover, encouraging low-cost entry, through equal access to infrastructure, compacts the fare distribution and lowers the median fare.
1. Introduction
This paper analyzes the current state of the airline market to determine the impact of a
new breed of air carrier, the low-cost carrier, on airfares, the market dynamics that exist in
short haul and long haul routes, and by what degree previous analyses overstate the
importance of hubs and concentration. Although, financial turmoil surrounds the airline
industry today, the evolution of the domestic airline market, in the United States, continues.
Since deregulation in 1978, the cost of air travel has fallen and the size of the airline industry
has grown rapidly. The early predictions of economists that airline deregulation would
improve consumer welfare have been proven to be correct (Borenstein 1992). Over ten years
after deregulation, Borenstein (1989) finds that high levels of route and hub concentration are
correlated with higher airfares. Hubs impact the entire distribution of fares for all flights
originating or terminating at those hub airports. Moreover, potential competition has little if
any disciplining affect on market prices.
The conclusions that Borenstein (1989) derives from an analysis of the airline market
are still valid today; moreover, without controlling for the presence of low-cost carriers, hubs
and high levels of concentration skew the price distribution and shift it rightwards. Even after
controlling for route specific characteristics such as distance, load factor, and aircraft
equipment route and airport concentration are estimated to raise prices at each point of a
route’s price distribution. Today’s airline market has evolved markedly since the late 1980s.
While low-cost carriers only carry 15% of the domestic traffic in the United States, their
impact on prices is significant and broadly distributed over the marketplace (Parker Oct 17,
2002).This paper argues that most of the hub effect is due to the lack of a low-cost carrier
serving that hub and not associated with the hub itself. More generally, the measurable change
in price distributions associated with high levels of route and airport concentration is
overstated. Much of the concentration effect is directly attributable to the presence of a low-
cost airline or in this case the lack thereof.
The disciplining force of the low-cost carrier is apparent in the regional airline market,
where Richards (1996) finds that the potential presence of Southwest measurably lowers
airfares. Yet, Richards postulates that Southwest (a low-cost carrier) does not have the same
impact in the long haul market as it does in the regional market. This analysis argues that low-
cost carriers, such as Southwest and JetBlue, continue to discipline prices in the regional
market but also discipline prices in the long haul market. A significant change in the
distribution of prices is no longer a direct consequence of levels of route and airport
concentration when low-cost carriers are represented in the estimated equations.
The impact of a low-cost carrier is independent of market distinctions and
subdivisions. On each route, regardless of its characteristics, a low-cost presence alters the
distribution of airfares to produce a distribution with a tighter range and lower median fare.
Borenstein shows that high levels of route and airport concentration, characteristic of airline
hubs, raise fares at the high-end of the market’s price distribution; however, low-end fares are
not untouched, these factors raise low-end fares as well. Thus measures of route and airport
concentration affect the range and height of each and every route price distribution. Although,
concentration levels may alter each fare in a distribution, Borenstein argues that these
measures impact the highest percentile fares to the greatest extent. This paper determines that
the largest shift in the expected price paid is consistently at the upper tail of the price
distribution. To this day, route and hub concentration continue to primarily alter the shape of
the composition of airfares to a greater degree at higher price percentiles. This paper’s
baseline estimates would imply that the concentration effect is as much of a factor today as in
the Borenstein (1989) analysis; however, important interactions, not limited to concentration
measures, call into question the validity of this paper’s baseline equations. The level of
concentration, along with other often used route characteristics, no longer provides as
accurate an account of the airline market as possible.
A low-cost presence lowers prices at the low end, median, and high-end of ticket
prices in all market segments. In other words, this new breed of air carrier disciplines market
prices at any price point within a given market. The broadening impact of the low-cost carrier
across price points suggests that the airline market is evolving; moreover, the level of many of
the effects economists have attributed to concentration levels, hubs, and slot constraints may
in fact be overstated. Instead of measuring the relationship between concentration levels,
hubs, slot constraints and prices this paper argues that previous econometric analyses may
have actually been measuring the impact on a route or airport of not having a low-cost carrier.
An understanding of the significance of the low-cost carrier requires insight into what
constitutes a low-cost carrier. The ability of the low-cost carrier to compete with established
hub-and-spoke carriers on price represents an evolution of the airline market in the United
States.
This thesis argues that a change in the conventional method of analysis is necessary to
build an accurate dynamic model for estimating prices. That critical change involves altering
standard models of analysis in order to measure the impact of low-cost carriers. Measures of
concentration may have never been as key to understanding the dynamics of the airline
market as previously suggested. Not controlling for low-cost carriers, today’s airline market
resembles the market of the late 1980s even though a variety of structural changes have taken
place since then. The measurable impact of the low-cost carriers has two implications. First,
the presence of a low-cost carrier causes the distribution of prices to flatten and shift left. The
median fare is lower and price volatility is lower. Second, the lack of a low-cost presence
raises prices. Borenstein is not only measuring the impact of concentration with controls for
route and airport dominance, but also is measuring the lack of a low-cost presence through
those variables.
Low-cost carriers cause price distributions to compact and shift lower across all
market segments. Hence, a large fraction of the concentration effect is directly due to the lack
of a low-cost presence. An examination of previous literature written on the airline markets
and the principle market participants provides a solid superstructure within which a model can
be built to determine the range of the low-cost carriers’ impact on the marketplace. The low-
cost carriers’ growing market share brings to light the consequence of competitive entry in the
airline industry. Moreover, a low-cost presence is correlated with a flatter price distribution, a
higher degree of competitiveness, and a decline in the relevance of concentration, frequency,
hubs, and capacity constraints in predicting market prices. This result suggests any future
analysis of the competitive structure of the airline industry should take into account the low-
cost effect.
2. Low-Cost Carrier: A Definition This paper defines the low-cost carrier to be an airline that operates a point-to-point
network, pays employees below the industry average wage, and offers no frills service. The
two most prominent low-cost carriers, JetBlue and Southwest, both have labor costs 30% to
40% lower than the mainline carriers. A traditional major carrier often has a number of tools
at its disposal, which it can use to deter entry or lessen the competitiveness of recent entrants.
These tools include predatory pricing, loyalty programs, and congestion at the nation’s most
popular airports. Yet, these tools are not effective against low-cost carriers with point-to-point
networks. A low-cost airline can engage in Bertrand competition, with a high-cost competitor,
without pricing at its own marginal cost. The low-cost carrier can successfully neutralize the
dominance of its competitors, by competing on price.
The lower cost structure can be quantified by aggregating the cost savings of point-to-
point networks, wage savings, and savings from not providing numerous add-on services.
While labor costs are the largest single cost item for airlines, there are many other costs. The
pie chart in Figure 1 illustrates the composition of costs for the aggregate airline industry in
2000. The cost differential between the low-cost and major carriers is not only attributable to
the wage differential. Although, the primary cost for any carrier is labor related. Controlling
labor costs can improve the bottom line. The operating cost distribution below suggests that
lowering labor costs by 10% can lower the average airline’s total cost by 3.68%.
The lower cost structure of a point-to-point network is a consequence of a number of
factors. They include: Airport congestion, which causes costly delays at hubs and is not as
prevalent at airports used by point-to-point carriers. For every major metropolitan airport
there are often two to three secondary airports. Low-cost carriers can achieve fast turnarounds
and pay less for leasing airport facilities at secondary airports like TF Green airport outside
Providence, Rhode Island.
In comparison, hubs require a large number of gates and personnel per flight, due to
the banks of arriving and departing flights. The banks of flights result in the majority of
flights arriving and departing within 20-30 minutes of each other. These peak periods result in
a high demand for facilities and personnel for. For example, at its Dallas Fort Worth hub
American operates banks of flights to make connections convenient. While at neighboring
Dallas Love Field Southwest spaces its flights out due to the lower emphasis it places on
connecting traffic. The close proximity of flights at peak times provides customers a high
level of convenience but creates operating inefficiencies. Employees stand around between
peaks, while planes wait in line to take off. The higher number of personal required per flight
to effectively operate a traditional hub may be an important factor in the different cost
structures of traditional and low-cost carriers. “Spreading out peak travel times at hub airports
by several more hours each day, a concept known as rolling hubs, may be one way to make
operations more efficient” (Business Week Oct 23, 2002). Major carrier American Airlines is
experimenting with a rolling hub in Chicago in an attempt to achieve lower operating costs.
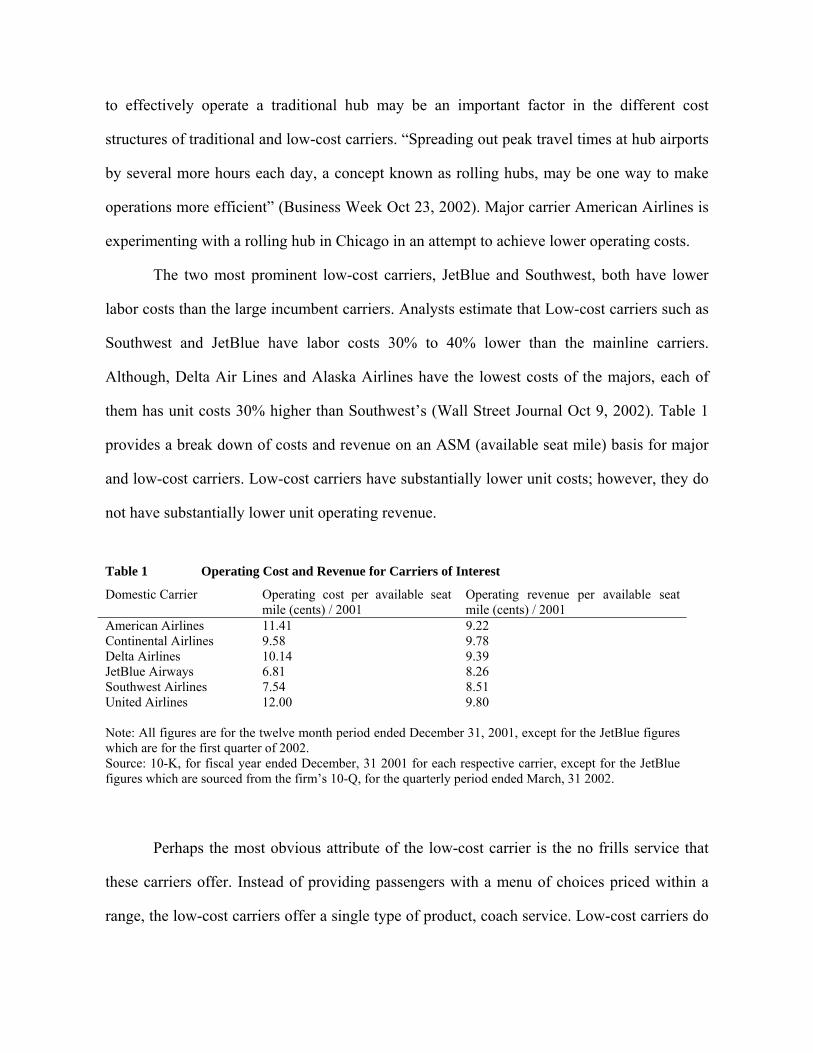
The two most prominent low-cost carriers, JetBlue and Southwest, both have lower
labor costs than the large incumbent carriers. Analysts estimate that Low-cost carriers such as
Southwest and JetBlue have labor costs 30% to 40% lower than the mainline carriers.
Although, Delta Air Lines and Alaska Airlines have the lowest costs of the majors, each of
them has unit costs 30% higher than Southwest’s (Wall Street Journal Oct 9, 2002). Table 1
provides a break down of costs and revenue on an ASM (available seat mile) basis for major
and low-cost carriers. Low-cost carriers have substantially lower unit costs; however, they do
not have substantially lower unit operating revenue.
Table 1 Operating Cost and Revenue for Carriers of Interest
Domestic Carrier Operating cost per available seat mile (cents) / 2001
Operating revenue per available seat mile (cents) / 2001
American Airlines 11.41 9.22 Continental Airlines 9.58 9.78 Delta Airlines 10.14 9.39 JetBlue Airways 6.81 8.26 Southwest Airlines 7.54 8.51 United Airlines 12.00 9.80 Note: All figures are for the twelve month period ended December 31, 2001, except for the JetBlue figures which are for the first quarter of 2002. Source: 10-K, for fiscal year ended December, 31 2001 for each respective carrier, except for the JetBlue figures which are sourced from the firm’s 10-Q, for the quarterly period ended March, 31 2002.
Perhaps the most obvious attribute of the low-cost carrier is the no frills service that
these carriers offer. Instead of providing passengers with a menu of choices priced within a
range, the low-cost carriers offer a single type of product, coach service. Low-cost carriers do
not provide meals on flights, which results in a savings of 5 to 10 dollars per coach passenger
or up to 3.2% of the average carrier’s operating cost (see Figure 1). These airlines lack
elaborate loyalty programs, which necessitate extra employees, to provide more personalized
service, and expensive facilities, like airport clubs. Low-cost airlines do not provide costly
services, which are only profit enhancing for a hub-and-spoke carrier able to extract a high
level of rents from customers with a high willingness to pay, business travelers. The main
advantage of the low-cost carrier is that it can compete on price. Indeed, this characteristic of
the low-cost carrier is perceptible; moreover, this paper argues that the impact of this unique
structure on the airline market is just as evident.
3. Importance of Concentration & Low-Cost Carriers
The academic work of economists was a significant force in the movement towards
the deregulation of the domestic airline industry in the early 1970s (Borenstein 1992). Post
deregulation, most analysis of the airline markets focuses on the lack of competition among
the airlines; however, the early predictions of economists that airline deregulation would
improve consumer welfare have in fact been proven to be correct (Borenstein 1992).
Moreover, Borenstein (1992) argues that the most important lessons that have been learned
from the deregulation of the airline industry are not with regard how to deregulate, but are a
better understanding of the strategies and results of competition in a complex and innovative
service industry.
As the airline industry matures, in a parallel fashion the analysis and understanding of
the airline industry matures as well. During the 1980s, journal articles, which argued that the
airline industry would exhibit perfect contestability, accompanied the recent deregulation of
the airline industry (Beesley 1986). The analysis of Beesley (1986) in the United States and
Joy (1986) in Australia suggested that airlines could not sustain ticket prices far in excess of
marginal cost, because new entry could easily take place due to the low barriers to entry of the
airline industry.
However, “It has now been well established that airline pricing does not closely reflect
the perfect contestability ideal” (Borenstein 1989, P. 344). The airline market is not perfectly
contestable, because barriers to entry make it difficult for new entrants to break into the
airline market. Price discrimination is the norm not the exception, on routes with high barriers
to entry. As a result, much of the recent analysis of the airline industry has focused on trying
to explain what factors prevent entry, which would increase competition and result in lower
fares.
Borenstein (1989) chooses to focus on the importance of route and airport dominance
in determining the degree of market power exercised by an airline. The results of the paper
indicate that an airline’s share of passengers on a route and at the endpoint airports
significantly influences its ability to mark up price above cost. The two primary factors that
determine the difficulty of entry into an airport are slot and gate constraints (Borenstein
1989). Capacity restrictions, or more formally control of a dominant share of slots or gates,
“…can allow an airline to inhibit profitable entry” (Borenstein 1989, P. 348). Capacity
restrictions can benefit incumbent carriers and “have a positive effect on yields” along with
computer reservation systems and loyalty programs (Richards 1996, P. 44). In contrast,
raising fares at an airport with no capacity constraints attracts entrants, which in turn forces
airfares back down.
Besides taking advantage of capacity restrictions, the major airlines use a number of
programs in an attempt to raise prices. Marketing devices give an advantage to a dominant
carrier and amplify the market power of that incumbent airline (Borenstein 1989). In
particular, frequent flier programs encourage airline loyalty, especially among customers who
primarily fly from an airport that is a major hub of an airline (Levine 1987).
Both airline ownership of computer reservation systems (CRS) and scarce airport
facilities increase an airline’s localized market power (Evans 1993). American and United
were early entrants into the computer reservation service industry. The American and United
reservation systems (Sabre and Apollo respectively) create a bias in travel agent booking,
called the “halo effect” (Borenstein 1992). The “halo effect” is when a travel agent using an
Apollo system books on average a disproportionate share of his or her tickets on United
Airlines (Borenstein 1992). An airline’s CRS system enhances its market power; however, the
growth in internet bookings calls into question the influence of the “halo effect” on airfares.
The results of the Borenstein (1989) analysis support the observation that an airline
charges higher prices when it has a dominant position at an airport. Moreover, at hub airports
the dominant carrier charges higher prices than it does in the remainder of its system. Cost
factors do not explain the discrepancy in prices (Borenstein 1989). The primary conclusion is
that an individual airline’s share of traffic on the route and at the endpoint seems to be a
principle determinant of a carrier’s ability to raise the price of its product (Borenstein 1989).
Evans (1993) refines Borenstein’s (1989) earlier article by distinguishing between the impact
of route dominance versus airport dominance on an airline’s level of market power. Evans
tests whether the observed dominance of most intercity-pair markets and airports in the
United States airline industry by single carriers confers pricing power on the dominant firm.
Evans concludes that airport dominance by a carrier does confer significant pricing power,
whereas dominance at the route level seems to confer no such pricing power.
Whinston and Collins (1992) conduct an event study analysis of People Express, in
order to measure the competitive structure of the airline markets. Instead of examining
measures of concentration, Whinston and Collins (1992) use the reactions of incumbent
airlines’ stock prices to announcements of entry by People Express to determine the
competitive structure of the airline markets. The stock reactions reveal significant route-
specific profits. A decline in an incumbent airline’s equity value suggests that equity market
participants recognize that entry will reduce an incumbent’s profits. While the analysis of
Whinston and Collins is unique, the use of an airline’s equity price as a proxy for
competitiveness may not be the most direct way to measure competitiveness.
While many factors can influence the movement of an airline’s stock price, Richards
(1996) chooses to examine the airline markets in an innovative manner, focusing on
competition not concentration. Richards estimates a series of fare equations to ascertain the
effects of actual and potential competition by Southwest on markets for air travel. The results
of the analysis suggest that pricing strategies of competitors differ depending on Southwest’s
presence on a route (Richards 1996). The presence of a low fare carrier may be a more
important determinant of the ticket pricing on a particular route than the extent of route and
hub concentration on that route. The analysis and conclusion of Richards (1996) parallels the
analysis and forthcoming conclusion of this paper.
The major carriers successfully use dominance enhancing strategies to raise
concentration levels that in turn raise the market price for air travel. Moreover, low-cost entry
disciplines prices on short haul routes. The rapid expansion of the low-cost presence in the
airline markets over the last half decade and the continued dominance of the major carriers
together raise the following question. Are concentration levels or a low-cost presence the
more important predictor of market fares? The juxtaposition of these opposing factors in this
paper provides an answer to the question of which factor is critical to understanding the
dynamics of pricing in the airline markets.
4. The Data
In order to determine whether or not low-cost carriers significantly impact the pricing
of tickets in airline markets this paper will conduct an econometric analysis using the
Department of Transportation’s Databank 1B database. The database is a 10% random sample
of all domestic tickets sold in the United States. This analysis employs the second quarter
2002 dataset. This dataset includes over 4,600,000 individual ticket observations. The dataset
includes 31 carriers, 415 airports, and 9150 different routes. Hence, the dataset for the
regressions contains a total of 16,746 route carrier pairs.
The Origin and Destination survey includes data on the length and number of
passengers of routes. The Herfindahl-Hirschman Indices are derived from this dataset. Low-
cost market share measures are constructed from the dataset by segregating the market share
measures based on whether or not the carrier is deemed to be a low-cost carrier. For the
purposes of this analysis, there are 10 low-cost carriers. A comprehensive list of all the
represented airlines is included in Table 5. To compute cost per available seat mile (CASM)
figures for all 31 airlines, subsections of Department of Transportation’s Schedule T-1 and
Schedule P-12 datasets are utilized to construct the CASM figures. The schedule T-1 dataset
summarizes the T-100 by providing monthly compilations, by carrier of such items as
available seat miles, available ton miles, revenue passenger miles, revenue miles flown, and
revenue departures performed. The Schedule P-12 provides quarterly profit and loss
statements for carriers with annual operating revenues of $20 million or more. Since Airtran
Airways, Northwest Airlines, Horizon Air, and TCI Skyking were not in the P-12, these
carriers are excluded from this paper’s dataset. However, a regression run with these carriers
and proxy cost per available seat mile (CASM) figures reveals that excluding these carriers
does not alter the sign or significance of this paper’s results. The CASM figures are calculated
for the year 2002.
Frequency, load factor, and equipment variables are constructed using data aggregated
from the Department of Transportation T-100 Domestic Segment dataset for the months of
April, May, and June 2002. Thus the union of the three datasets corresponds to the second
quarter of 2002. The T-100 Domestic Segment dataset contains information by aircraft type
and service class for departures performed, available capacity and seats, passengers enplaned,
scheduled departures, and aircraft hours ramp-to-ramp and airborne. The Department of
Transportation Databank 1B, Schedule T-1, Schedule P-12, and T-100 Domestic Segment
databases are all publicly available through the recently constructed Bureau of Transportation
Statistics (BTS) TransStats website.1
5. Methodology
Having outlined the progression of academic thought on the factors that influence
ticket prices and having argued that low-cost carriers have a fundamentally different cost
structure than their competitors, an analysis examining the impact of the low-cost carrier is
warranted. The 3 econometric models developed in this section of the thesis estimate the
marginal benefit of low-cost entry by quantifying the impact of several measures of
concentration on the market price for air travel. The three models include a baseline model
that closely resembles Borenstein’s (1989) equation, a 6-segment distance model that includes
the baseline variables plus dummy variables measuring the change in price over discrete 500
mile segments, and a short/long haul segment model that includes the baseline variables plus
2 indicators that classify a route as either regional market or long haul.
The price equation is estimated as a function of costs, product quality, market demand
characteristics, and other factors such as route concentration, route characteristics, hub
concentration, and low-cost carrier route and hub concentration. Roundtrip tickets are treated
1 The BTS TransStats website can be found at the following web address: http://www.transtats.bts.gov.
as two one way tickets and roundtrip fares are adjusted accordingly. The equations that follow
will be used in conjunction with the constructed dataset to show the low-cost carriers’ impact
on prices and other route characteristics.
Following Borenstein (1989), each of the three models is regressed on the sample 20th,
50th, and 80th percentile fare for each route-carrier pair. As Borenstein notes, the segmentation
of each equation into three regressions provides insight into the impact of concentration levels
and low-cost participation on different strata of the ticket price spectrum. This paper includes
three basic models, regressed with and without a set of low-cost carriers. These 18 equations
converge to three hybrid models that seek to determine the significance of two primary
variables, which can affect the supply curve for air travel, the level of competition and
concentration in the airline markets.
The baseline equation, based on a Borenstein (1989) pricing equation, is a logical
starting point from which to begin an analysis exploring the impact of low-cost carriers. The
baseline equation, regressed on second quarter 2002 Department of Transportation data,
brings Borenstein’s (1989) analysis to the present day and brings to light any changes that
have occurred in the structure of the airline market over the last 15 years.
The baseline equation is also estimated with a set of variables that measure the
significance of the low-cost carriers. These variables include low-cost market share and a
dummy variable that indicates whether or not an endpoint airport is a hub of a low-cost
airline. The low-cost variables are analogous to the POTCOMP (potential competition)
variable that Borenstein (1989) includes in his second set of regressions. However, the
POTCOMP measure does not distinguished between mainline and low-cost carriers. Thus the
measure only quantifies the effect of potential competition and not actual competition (from
low-cost carriers). It is important to note that, “(the) inclusion of the potential competition
variable does not change the results (of the regression) substantially, though it may have a
significant effect itself at least on lower fares” (Borenstein 1989, P. 359). Borenstein’s results
suggest that low-cost carriers may only be an important factor acting on prices at the 20th
percentile. The juxtaposition of these two sets of regressions should reveal the impact of the
low-cost carrier on pricing in the airline market and whether Borenstein’s (1989) initial
conclusion still holds.
Baseline Equation ln Pij = άi + β1 ln MKTDISTj + γ1 ln LOADFACij + γ2 COUPONij + γ3 ln EQUIPij + γ4 ln
FREQij + δ1 ln ORGSHAREij + δ2 ln ORGHERFj + δ3 RUTSHAREij + δ4 RUTHERFj + δ5 ln COMPCOSTij + δ6 TOURISTj + δ7 HUBj + δ8 LWCSHUBj + δ9 SLOTj
Baseline Equation with Low-Cost Variables ln Pij = άi + β1 ln MKTDISTj + γ1 ln LOADFACij + γ2 COUPONij + γ3 ln EQUIPij + γ4 ln
FREQij + δ1 ln ORGSHAREij + δ2 ln ORGHERFj + δ3 RUTSHAREij + δ4 RUTHERFj + δ5 ln ORGLWCSHAREj + δ6 LWCSTSHAREj + δ7 LWCSTHERFj + δ8 ln COMPCOSTij + δ9 TOURISTj + δ10 HUBj + δ11 LWCSHUBj + δ12 SLOTj
Market distance can impact the price of a ticket due to the change in cost structure
over different route lengths. Takeoffs and landings are highly inefficient and require up to
50% of a flight’s fuel. As a result, longer routes, on which the fixed cost of the takeoff and
landing is spread out, are less expensive to operate per mile. However, different market
distances are not just associated with direct costs to the airlines. Using a continuous variable
such as MKTDIS establishes a linear relationship between route distance and price. This
linear relationship may indicate a general trend as route length increases; however, a
significant coefficient on MKTDIS does not answer the question of whether or not distance is
linearly related to price. In order to determine if the relationship between distance and price
varies over length it is necessary to test discrete segments of length.
This paper categorizes different route lengths as separate markets in order to test the
hypothesis that each of these market segments has a unique competitive structure. High
prices may categorize certain route lengths due to the variability of concentration levels over
several types of routes. To quantify the impact of route distance on ticket prices this analysis
employs a second set of equations that employ 6 dummy variables representing 6 consecutive
500 mile increments in route length. The baseline and excluded variable is MKTDIS_1, the 1-
500 mile market segment. With these 6 dummy variables it is possible to construct a segment
by segment relationship between price and distance. As with the baseline equation, the six
segment equation is constructed in its base form and with 4 low-cost variables to measure the
impact of the low-cost carriers on pricing over the 6 distance segments. In particular, these
equations may identify the relative importance of low-cost carriers over distance. Do low-cost
carriers only impact pricing on short haul routes as Richards (1996) postulates?
Six Segment Distance Equation ln Pij = άi + β1 ln MKTDISTj + γ1 ln LOADFACij + γ2 COUPONij + γ3 ln EQUIPij + γ4 ln
FREQij + δ1 ln ORGSHAREij + δ2 ln ORGHERFj + δ3 RUTSHAREij + δ4 RUTHERFj + δ5 ln COMPCOSTij + δ6 TOURISTj + δ7 HUBj + δ8 SLOTj + δ9 MKTDIS_1j + δ10 MKTDIS_2j + δ11 MKTDIS_3j + δ12 MKTDIS_4j + δ13 MKTDIS_5j + δ14 MKTDIS_6j
Six Segment Distance Equation with Low-Cost Variables ln Pij = άi + β1 ln MKTDISTj + γ1 ln LOADFACij + γ2 COUPONij + γ3 ln EQUIPij + γ4 ln
FREQij + δ1 ln ORGSHAREij + δ2 ln ORGHERFj + δ3 RUTSHAREij + δ4 RUTHERFj + δ5 ln ORGLWCSHAREj + δ6 LWCSTSHAREj + δ7 LWCSTHERFj + δ8 ln COMPCOSTij + δ9 TOURISTj + δ10 HUBj + δ11 LWCSHUBj + δ12 SLOTj + δ13 MKTDIS_1j + δ14 MKTDIS_2j + δ15 MKTDIS_3j + δ16 MKTDIS_4j + δ17 MKTDIS_5j + δ18 MKTDIS_6j
The impact of low-cost carriers may vary over market distance; moreover, there are
two primary market segments in the United States, short haul (regional) routes and long haul
routes. This paper categorizes regional routes as being 0-1500 miles in length. Long haul
routes are defined to be 1501-3000 miles in length. Traditionally low-cost carriers, such as
Southwest, serve regional routes and avoid competing on higher profile long haul routes;
however, recently, Southwest is adding longer routes. Moreover, JetBlue with hubs at John F.
Kennedy Airport (JFK) and Long Beach Airport (LGB) is directly targeting long haul
transcontinental routes, which lacked a low-cost presence. Although, the low-cost presence on
long haul routes (1500 miles in length or more) is still small this paper seeks to determine if
that presence significantly disciplines the pricing behavior of the incumbent nationwide
carriers.
The two additional indicator variables (MKTDISREG and MKTDISLNG) provide a
direct means with which to measure the growing importance of the low-cost carrier. Richards
(1996) articulates the importance of Southwest in routes less than 1000 miles in length. In a
similar vein, Borenstein (1989) suggests that the impact of potential competition on prices is
rather small. He observes that these potential competitors are not materially important for the
50th and above percentile airfares. The airline market has evolved since the mid 1990s and
because low-cost carriers no longer only fly routes under 1000 miles in length it is important
to determine the extent of the presence of low-cost carriers in the regional and long haul
markets.
Short/Long Haul Market Segment Equation ln Pij = άi + β1 ln MKTDISTj + γ1 ln LOADFACij + γ2 COUPONij + γ3 ln EQUIPij + γ4 ln
FREQij + δ1 ln ORGSHAREij + δ2 ln ORGHERFj + δ3 RUTSHAREij + δ4 RUTHERFj + δ5 ln COMPCOSTij + δ6 TOURISTj + δ7 HUBj + δ8 SLOTj + δ9 MKTDISREGj + δ10 MKTDISLNGj
Short/Long Haul Market Segment Equation with Low-Cost Variables ln Pij = άi + β1 ln MKTDISTj + γ1 ln LOADFACij + γ2 COUPONij + γ3 ln EQUIPij + γ4 ln
FREQij + δ1 ln ORGSHAREij + δ2 ln ORGHERFj + δ3 RUTSHAREij + δ4 RUTHERFj + δ5 ln ORGLWCSHAREj + δ6 LWCSTSHAREj + δ7 LWCSTHERFj + δ8 ln COMPCOSTij + δ9 TOURISTj + δ10 HUBj + δ11 LWCSHUBj + δ12 SLOTj + δ13 MKTDISREGj + δ14 MKTDISLNGj
MKTDIST (market distance) is the nonstop distance measured in miles from one
endpoint of a route to another. Longer routes should have higher prices; however, time spent
cruising at altitude is proportionally higher on longer routes, which suggests that longer routes
have a lower per mile cost. The higher per mile cost of short routes is due to the large amount
of fuel that is burned during takeoff and landing. DISTANCE should be positive, but costs
increase proportionately more slowly as the route distance lengthens. The average flight
distance on a major carrier is less than a low-cost airline. The median flight segment for the
major carriers is 821.0 miles and is 866.0 miles for the low-cost carriers. However, the
difference is small suggesting that neither the major nor low-cost carriers have a cost
advantage from flying a much longer set of routes than other carrier group. Low-cost carriers
may lower prices in markets and fly a high proportion of short haul flights. DISTANCE may
not be significant when controlling for the presence of low-cost carriers, depending on
whether the low-cost carrier or operating cost factor has a greater impact on price. At the time
of the Borenstein (1989) article low-cost carriers had a diminutive presence in the United
States.
Ceteris paribus a longer route should have a higher market price than a shorter route
with the same characteristics. Longer routes require more fuel and are more costly to operate
(on an absolute basis) compared to shorter routes. However, most of the fuel for a flight is
burned during takeoff and landing. When the plane is at cruising altitude the fuel efficiency of
the plane is higher. Hence longer transcontinental flights have a lower cost per mile than
flights of 500 miles or less. As a result, an increased distance may not result in as large of an
increase in price as initially thought. It is important to note that the dominant low-cost carrier,
Southwest, primarily operates short haul routes, yet still charges lower fares than its
competitors. Distance should explain a large percentage of the price level in a market, but in
no way does distance explain the disparity in prices between carriers.
The transcontinental market illustrates this disparity suitably. JetBlue provides its
product at a price that undercuts its competition by up to 75%. An unrestricted coach ticket
from JFK to LAX on American or United costs approximately $2500. In comparison, a
comparable ticket on JetBlue costs $598. This example also raises the possibility that past
analyses have overestimated the impact of distance, because low-cost competition did not
exist on long haul routes until recently. Prior to low-cost competition, long haul prices may
have had proportionally higher prices because airlines had more market power on the longer
routes. The possible discrepancy in past analyses bolsters the importance of including
variables in the price equation to control for the presence of low-cost carriers.
LOADFAC (load factor) is the mean load factor of all flights of an airline that serves
the observed route. The per passenger cost of a flights decreases as the load factor rises,
which suggests that LOADFAC has a negative coefficient. However, flights with high load
factors tend to operate during peak travel times. Congestion during peak travel times raises
the cost of a flight, both in terms of delays and increased personal needed to handle the banks
of flights that arrive and depart within a small window of time. Congestion impacts low-cost
carriers to a lesser degree, since these firms operate out of less crowded airports. The
weakening correlation between congestion and load factor over the last decade would suggest
that a higher load factor would lower prices. Due to the growing presence of low-cost carriers
and the lower operating cost of full flights (on a per capita basis) the effect of LOADFAC is
uncertain.
COUPON (mean market coupon) is the average number of connections (both on-plane
and change-of-plane) of the observed carrier on the observed route. Thus a coupon of 0 would
indicate a non-stop itinerary. Connections are undesirable, but raise the cost of the product.
Thus the impact of COUPON on price is uncertain.
EQUIP (equipment) is the mean size of the planes on flights that carry passengers on
the observed route and airline. Larger equipment tends to have lower operating costs on per
passenger basis and operate more efficiently on longer routes. On the other hand, larger
planes may be preferred by travelers. A preference for higher capacity aircraft may increase
demand on routes with larger aircraft, which would in turn raise prices. Likewise, the major
carriers tend to operate a higher proportion of larger aircraft than the low-cost rivals. For this
reason, a larger mean aircraft size may indicate higher prices.
FREQ (frequency) is the average frequency of flights available to passengers on the
observed airline and route. Controlling for other factors, a higher frequency of flights raises
the value of the product to the passenger. One would expect that this increased value leads to
higher demand and finally higher prices. Higher frequency also allows airlines to operate
aircraft more efficiently and lowers an airline’s cost and ticket prices. Many carriers,
including low-cost carriers, operate routes with a high frequency of service to achieve cost
savings. Thus the estimated effect of FREQ on price is uncertain.
ORGSHARE (origin & dest. market share) is the weighted average of the observed
airline’s share of passenger originations at the two endpoints of a route. ORGSHARE is
weighted by the ratio of passengers on the route who start their trips at the two endpoints
divided by the total number of passengers, who originate travel at all endpoints. An increase
in ORGSHARE may allow airlines to exercise greater market power and raise prices. Because
the vast majority of flights still take place on hub-and-spoke carriers the coefficient of
ORGSHARE may diverge from ORGLWCSHARE.
ORGHERF (origin & dest. Herfindahl) is the weighted average of the Herfindahl
indexes of passengers’ originations at the two endpoints of the observed route (measured from
zero to one). The weighting of ORGHERF is the same as ORGSHARE. The competitive
factors that provide an airline with increased market power correspond to a dominant carrier
having many small competitors. However, an airline may prefer having a single larger
competitor in order to facilitate illegal, but profitable collusion. Case in point, when American
Airlines CEO Robert Crandall called Braniff International Airlines CEO Howard Putnam to
collude, he suggested doing so would be easy due to their large shares of the market in
question.2 Both competitive models can result in higher prices and as a result the effect of
ORGHERF on fares is uncertain.
RUTSHARE (route market share) is the observed airline’s share of passengers on the
observed route (origin to destination traffic). Elementary economic theory would suggest that
increased route share corresponds to increased market power, which results in higher prices
for the consumer. One can expect that increased route share results in higher prices.
RUTHERF (route Herfindahl) is the Herfindahl index for passengers on the observed
route (measured from zero to one). If the observed route has a small number of large
participants, collusion may raise prices. However, if there is a dominant firm with a
competitive advantage and many smaller participants, the dominant firm’s pricing power may
not extend to its competitors. The change in the percentile price on the observed route
depends not only on the value of the Herfindahl index, but also on the competitive state of the
dominant firm.
ORGLWCSHARE (low-cost origin & dest. market share) is a weighted average of
low-cost carriers’ share of the daily passengers at the endpoints of the route in question. The
weighting is the same as ORGSHARE. Assuming increases in ORGSHARE will lead to
increases in market power; increases in ORGLWCSHARE indicate that low-cost carriers
transport a larger percentage of the passengers at the endpoint airports. Higher
ORGLWCSHARE may lead to reduced levels of market power and lower prices.
LWCSTSHARE (low-cost route market share) is the share of all origin and destination
passengers on that route transported by low-cost carriers. The larger the percentage of people
transported by low-cost carriers the lower the airfare will likely be. Since RUTSHARE, which
measures the importance of concentration levels, is also measured it may be the case that
2 This scenario is less likely to be viable now due to the extensive presence of price aggressive competitors. In particular low-cost carriers are unlikely to engage in collusion and may instead prefer to compete on price with higher cost incumbents.
RUTSHARE is no longer significant when LWCSTSHARE is included. This would indicate
that low-cost route share, not general levels of route concentration, explain the movements in
ticket prices.
LWCSTHREF (low-cost route Herfindahl) is the Herfindahl index (measured from
zero to one) for the origin and destination passengers carried on low-cost carriers on a
particular route. The measure is included to show the likely discrepancy between the normal
Herfindahl index (RUTHREF) and this variable, which only measures the market share of
low-cost carriers.
COMPCOST (comparable cost) is the weighted average of the cost per seat mile of
every airline on the observed route other than the observed firm. Each carrier’s share of
passengers on the observed route determines its corresponding weighting. Clearly, each
airline’s system wide cost per seat mile only approximates the actual cost per seat mile on the
observed route. If the marginal cost of its competitors rises, the observed carrier can raise
prices without lowering its market share. However, the elasticity of COMPCOST (for a
specific route) may be dependent on whether or not the observed airline is a low-cost carrier.
As the market share of low-cost carriers has grown the elasticity of COMPCOST is likely to
have fallen. As a result, COMPCOST may play a less significant role in the pricing equation
than in the Borenstein (1989) analysis.
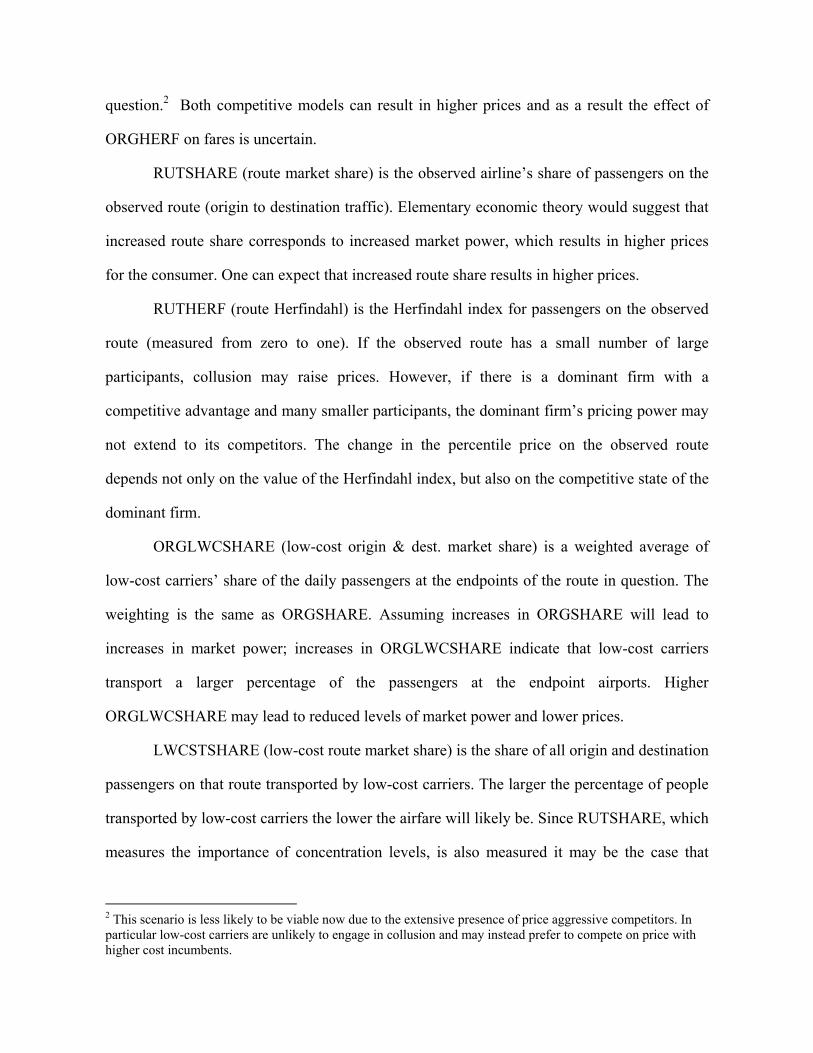
TOURIST (tourist route) measures the degree to which the observed route is a tourist
or leisure route. TOURIST is a dummy variable set to 1 if one of the endpoints of the route is
vacation oriented and 0 otherwise. This variable is critical to exposing the misconception that
low-cost carriers only serve tourist oriented airports. Controlling for tourist oriented routes in
the regression equation removes an important factor that might otherwise obscure the
significance of the variables testing the significance of a low-cost carrier’s presence. The
highly elastic demand curve on tourist routes suggests that TOURIST should have a negative
coefficient.
Table 2 Tourist Oriented Airports
Airport Airport Code Aspen, Colorado ASE Fort Lauderdale International, Florida FLL Hilo International, Hawaii ITO Honolulu International, Hawaii HNL Palm Springs Metropolitan Area, California PSP Jacksonville International, Florida JAX Kahului Airport, Hawaii OGG Kona, Hawaii KOA Las Vegas Mccarran Intl, Nevada LAS Melbourne Intl, Florida MLB New Orleans International, Louisiana MSY Orlando International, Florida MCO Reno/Tahoe Int'l, Nevada RNO Tampa International, Florida TPA West Palm Beach International, Florida PBI Note: The compiled list of tourist airports is derived from Richards (1996).
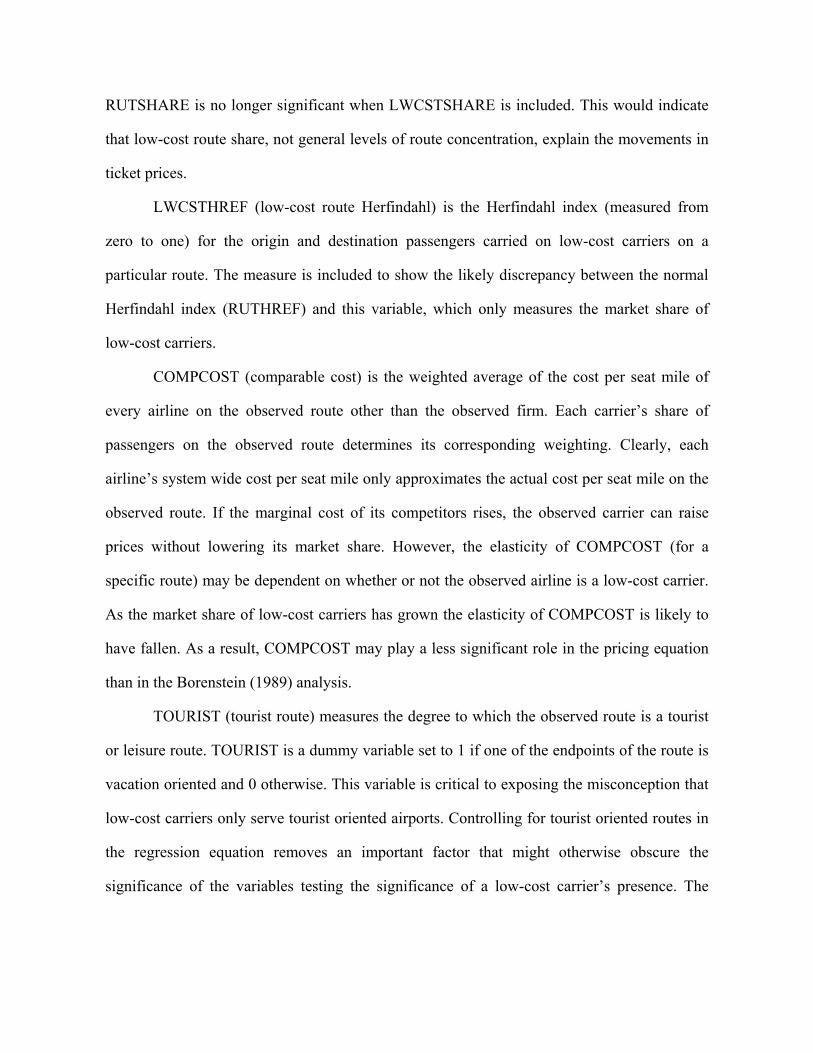
HUB is a dummy variable equal to 1 if one of the endpoints of the observed route is a
hub of a major carrier, and 0 otherwise. Note that the major carriers are limited in this analysis
to American Airlines, United Airlines, Delta Airlines, and Continental Airlines. See below for
a list of hub cities, segregated by major carrier. The analysis of Borenstein (1989) and others
suggests that airlines wield higher levels of market power at hub airports. As a result
consumers face higher prices for travel, if their route includes a hub airport at one of the
endpoints. One expects that the sign of HUB will be positive.
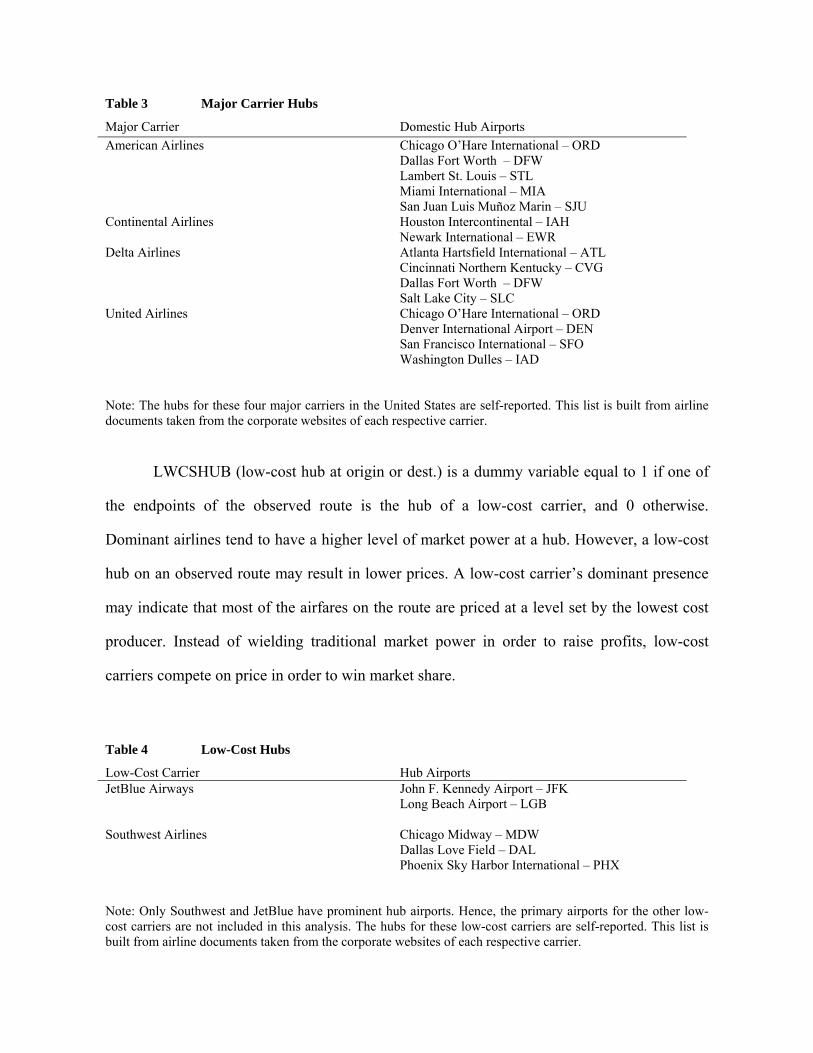
Table 3 Major Carrier Hubs
Major Carrier Domestic Hub Airports American Airlines Chicago O’Hare International – ORD
Dallas Fort Worth – DFW Lambert St. Louis – STL Miami International – MIA San Juan Luis Muñoz Marin – SJU
Continental Airlines Houston Intercontinental – IAH Newark International – EWR
Delta Airlines Atlanta Hartsfield International – ATL Cincinnati Northern Kentucky – CVG Dallas Fort Worth – DFW Salt Lake City – SLC
United Airlines Chicago O’Hare International – ORD Denver International Airport – DEN San Francisco International – SFO Washington Dulles – IAD
Note: The hubs for these four major carriers in the United States are self-reported. This list is built from airline documents taken from the corporate websites of each respective carrier.
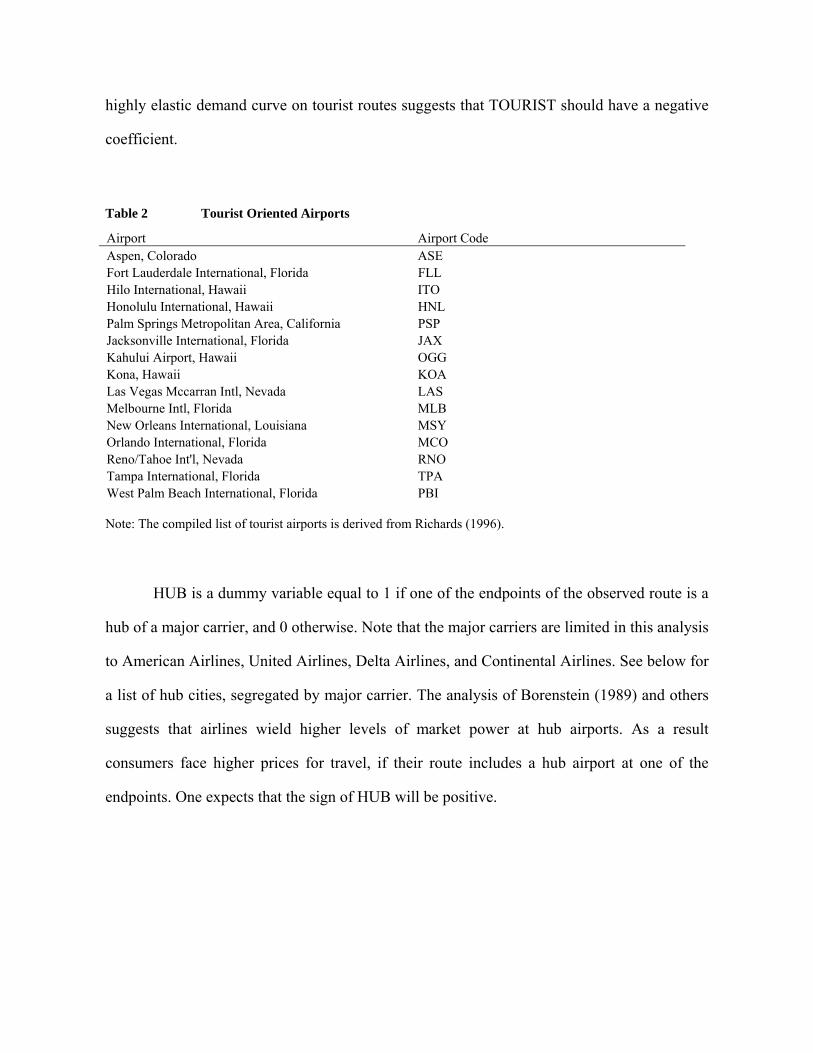
LWCSHUB (low-cost hub at origin or dest.) is a dummy variable equal to 1 if one of
the endpoints of the observed route is the hub of a low-cost carrier, and 0 otherwise.
Dominant airlines tend to have a higher level of market power at a hub. However, a low-cost
hub on an observed route may result in lower prices. A low-cost carrier’s dominant presence
may indicate that most of the airfares on the route are priced at a level set by the lowest cost
producer. Instead of wielding traditional market power in order to raise profits, low-cost
carriers compete on price in order to win market share.
Table 4 Low-Cost Hubs
Low-Cost Carrier Hub Airports JetBlue Airways John F. Kennedy Airport – JFK
Long Beach Airport – LGB
Southwest Airlines Chicago Midway – MDW Dallas Love Field – DAL Phoenix Sky Harbor International – PHX
Note: Only Southwest and JetBlue have prominent hub airports. Hence, the primary airports for the other low-cost carriers are not included in this analysis. The hubs for these low-cost carriers are self-reported. This list is built from airline documents taken from the corporate websites of each respective carrier.
SLOT is a dummy variable equal to 1 if one of the endpoint airports of the observed
route is a slot restricted airport and 0 otherwise. It should be noted that slot restrictions have
been lifted at Chicago O’Hare, New York LaGuardia, and New York JFK. Slot restrictions
are currently only in place at Reagan National Airport, which serves Washington D.C.
MKTDIS_1j, MKTDIS_2j, MKTDIS_3j, MKTDIS_4j, MKTDIS_5j, MKTDIS_6j
(market distance). The MKTDIS variables control for the distance of a route with finer
granularity than MKTDIST. Each of the six variables is a dummy variable that takes on the
value 1 if the route length falls within the given MKTDIS variable’s range and 0 otherwise.
MKTDIS_1 refers to routes from 1 to 500 miles in length, MKTDIS_2 refers to routes from
501 to 1000 miles in length, MKTDIS_3 refers to routes from 1001 to 1500 miles in length,
MKTDIS_4 refers to routes from 1501 to 2000 miles in length, MKTDIS_5 refers to routes
from 2001 to 2500 miles in length, MKTDIS_6 refers to routes from 2501 to 3000 miles in
length.
MKTDISREG (regional market distance group) variable is an indicator variable which
takes on the value 1 when the observed route is between 1 and 1500 miles in length and 0
when the observed route is 1501 to 3000 miles in length. This variable along with
MKTDISLNG may indicate the extent of low-cost carrier penetration. Low-cost carriers are a
dominant force in the short haul market, but their impact may no longer be confined to this
market segment. Since MKTDISREG and MKTDISLNG are perfectly collinear,
MKTDISREG is excluded from the regression and serves as a baseline.
MKTDISLNG (long haul market distance group) variable is an indicator variable
which takes on the value 1 when the observed route is between 1501 and 3000 miles in length
and 0 when the observed route is 1 to 1500 miles in length. This variable along with
MKTDISREG may point out the scope of low-cost carrier penetration. The MKTDISLNG
variable may serve as a proxy for the impact of low-cost carriers on long haul routes. Since
MKTDISREG and MKTDISLNG are perfectly collinear, only MKTDISLNG is included in
the regression.
Table 5 includes a comprehensive list of the airlines included in the dataset
constructed for this analysis. Since the Databank 1B dataset is a 10% random sample of all
ticket travel, the airlines included in Table 5 are randomly selected, with a weighting
proportional to the market share of each carrier. The low-cost carrier designation is based on
the definition of a low-cost carrier described in section 2 of this paper. That definition is not
an industry standard, because there is no standard system for determining if an airline is a
low-cost carrier. The definition included in this paper selects the major low-cost carriers,
Frontier, Southwest, and JetBlue. Moreover, the other low-cost carriers are small in
comparison and should not impact the estimated results in a significant manner.
The equations and methodology described in this section are used to determine
whether low-cost carriers impact the distribution of prices in different segments of the airline
market. The equations include a comprehensive set of parameters to estimate which factors
influence the distribution of market prices. Controls for route specific characteristics are
included to maximize the accuracy of the estimated equations. Moreover, these estimated
equations will also establish whether including the low-cost parameters was warranted. If the
low-cost variables are not significant the low-cost equations will resemble the baseline
equations; otherwise, any differences between the two sets of equations may characterize
what the effect of a low-cost presence is on fare distributions.
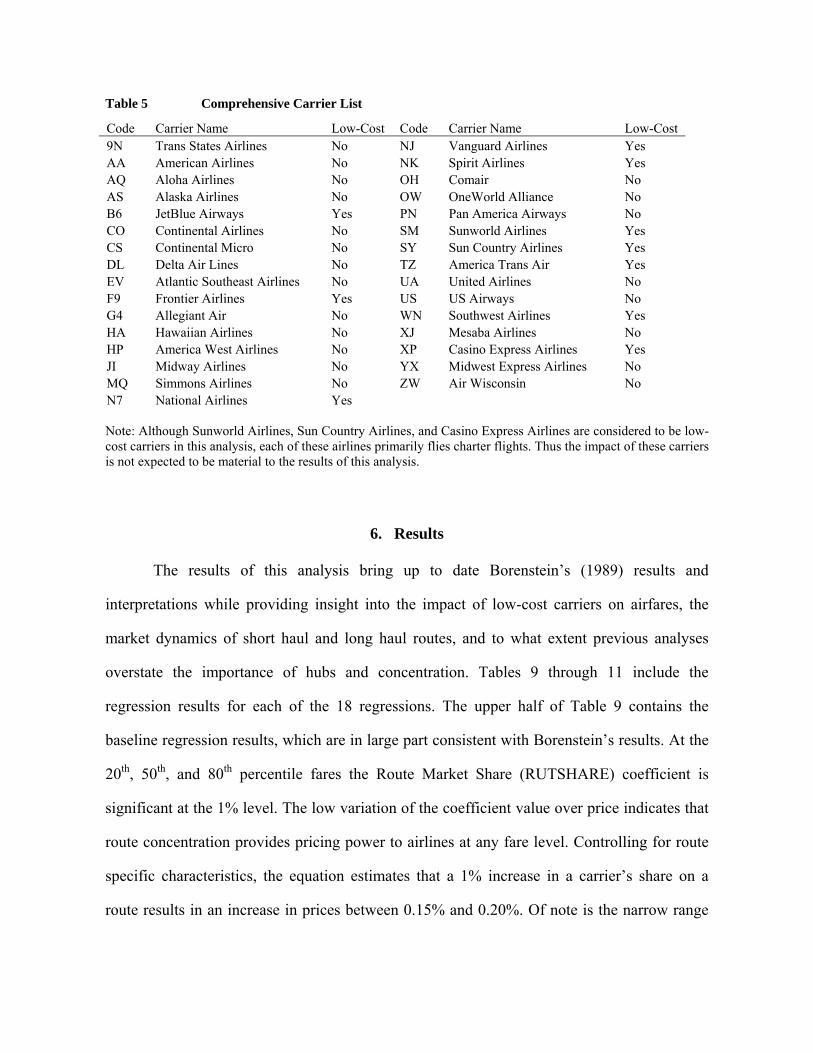
Table 5 Comprehensive Carrier List
Code Carrier Name Low-Cost Code Carrier Name Low-Cost 9N Trans States Airlines No NJ Vanguard Airlines Yes AA American Airlines No NK Spirit Airlines Yes AQ Aloha Airlines No OH Comair No AS Alaska Airlines No OW OneWorld Alliance No B6 JetBlue Airways Yes PN Pan America Airways No CO Continental Airlines No SM Sunworld Airlines Yes CS Continental Micro No SY Sun Country Airlines Yes DL Delta Air Lines No TZ America Trans Air Yes EV Atlantic Southeast Airlines No UA United Airlines No F9 Frontier Airlines Yes US US Airways No G4 Allegiant Air No WN Southwest Airlines Yes HA Hawaiian Airlines No XJ Mesaba Airlines No HP America West Airlines No XP Casino Express Airlines Yes JI Midway Airlines No YX Midwest Express Airlines No MQ Simmons Airlines No ZW Air Wisconsin No N7 National Airlines Yes Note: Although Sunworld Airlines, Sun Country Airlines, and Casino Express Airlines are considered to be low-cost carriers in this analysis, each of these airlines primarily flies charter flights. Thus the impact of these carriers is not expected to be material to the results of this analysis.
6. Results The results of this analysis bring up to date Borenstein’s (1989) results and
interpretations while providing insight into the impact of low-cost carriers on airfares, the
market dynamics of short haul and long haul routes, and to what extent previous analyses
overstate the importance of hubs and concentration. Tables 9 through 11 include the
regression results for each of the 18 regressions. The upper half of Table 9 contains the
baseline regression results, which are in large part consistent with Borenstein’s results. At the
20th, 50th, and 80th percentile fares the Route Market Share (RUTSHARE) coefficient is
significant at the 1% level. The low variation of the coefficient value over price indicates that
route concentration provides pricing power to airlines at any fare level. Controlling for route
specific characteristics, the equation estimates that a 1% increase in a carrier’s share on a
route results in an increase in prices between 0.15% and 0.20%. Of note is the narrow range
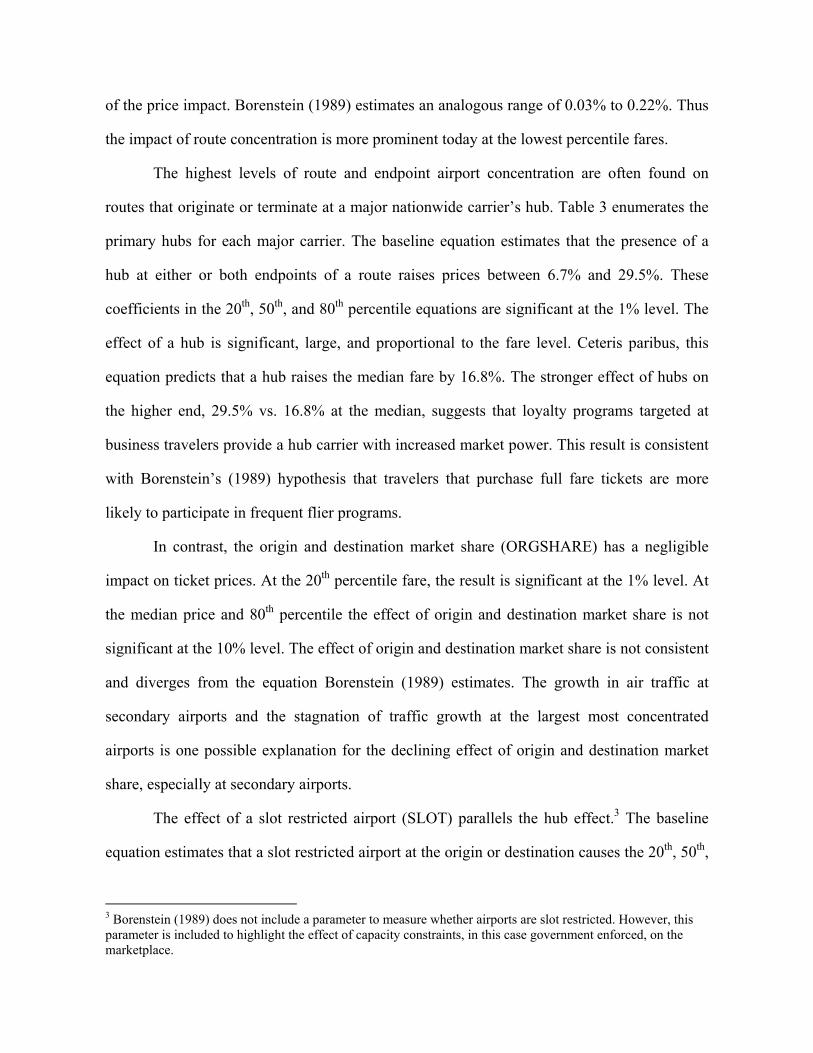
of the price impact. Borenstein (1989) estimates an analogous range of 0.03% to 0.22%. Thus
the impact of route concentration is more prominent today at the lowest percentile fares.
The highest levels of route and endpoint airport concentration are often found on
routes that originate or terminate at a major nationwide carrier’s hub. Table 3 enumerates the
primary hubs for each major carrier. The baseline equation estimates that the presence of a
hub at either or both endpoints of a route raises prices between 6.7% and 29.5%. These
coefficients in the 20th, 50th, and 80th percentile equations are significant at the 1% level. The
effect of a hub is significant, large, and proportional to the fare level. Ceteris paribus, this
equation predicts that a hub raises the median fare by 16.8%. The stronger effect of hubs on
the higher end, 29.5% vs. 16.8% at the median, suggests that loyalty programs targeted at
business travelers provide a hub carrier with increased market power. This result is consistent
with Borenstein’s (1989) hypothesis that travelers that purchase full fare tickets are more
likely to participate in frequent flier programs.
In contrast, the origin and destination market share (ORGSHARE) has a negligible
impact on ticket prices. At the 20th percentile fare, the result is significant at the 1% level. At
the median price and 80th percentile the effect of origin and destination market share is not
significant at the 10% level. The effect of origin and destination market share is not consistent
and diverges from the equation Borenstein (1989) estimates. The growth in air traffic at
secondary airports and the stagnation of traffic growth at the largest most concentrated
airports is one possible explanation for the declining effect of origin and destination market
share, especially at secondary airports.
The effect of a slot restricted airport (SLOT) parallels the hub effect.3 The baseline
equation estimates that a slot restricted airport at the origin or destination causes the 20th, 50th,
3 Borenstein (1989) does not include a parameter to measure whether airports are slot restricted. However, this parameter is included to highlight the effect of capacity constraints, in this case government enforced, on the marketplace.
and 80th percentile fares to rise 7.5%, 10.3%, and 22.2% respectively. The 80th percentile
estimate is significant at the 1% level, while the median and 20th percentile estimates are
statistically significant at the 5% and 10% levels respectively. The uniformly positive and
increasing effect of slot constraints across airfares suggests that capacity constraints, whether
imposed by the government or the market, reduce the ability of competitors to enter a market
and discipline prices. More generally, this analysis proposes that capacity constraints hinder
competitive entry and raise airfares.
The remaining set of estimated parameters is, with the exception of one parameter,
consistent with expectations when significant. Tourist oriented routes (TOURIST) are
expected to have airfares 11.3% lower than non-tourist routes at the median fare. While the
signed relationship between TOURIST and HUB is reverse, the increases in magnitudes are
parallel across types of fares. Tourist oriented routes differ from the baseline route the least at
the lowest fare and the most at the highest fare. This estimated outcome agrees with the
premise that tourist oriented routes carry a higher percentage of price sensitive tourists.
Moreover, on these routes frequent flier programs do not markedly enhance the market
dominance of the observed carrier.
The market distance parameter (MKTDIST) is positive and significant at the 1% level
in each regressed equation. This estimated result is as expected; although longer routes are
more efficient to operate on a per mile basis, a longer route is still more costly and as such
necessitates a higher airfare. In the baseline equation load factor (LOADFAC) is negative and
significant at the 1% level at the 80th percentile, negative and significant at the 10% level at
the median, and is not significant at the 20th percentile fare. This relationship differs from
Borenstein’s results, in which LOADFAC is negative and only significant at the 20th
percentile. However, the result of this analysis is consistent with the argument that higher load
factors indicate efficient aircraft utilization, which lowers a carrier’s cost and in turn prices.
Equipment (EQUIP) is estimated to effect each price percentile in a negative and significant
(at the 1% level) manner. Larger equipment is more efficient to operate and allows an airline
to lower fares.
The effect of the frequency of flights on a route (FREQ), served by a particular carrier,
is positive and significant at the 1% level over each fare percentile. This estimate corroborates
the argument that travelers with a high value of time (business travelers) will pay a premium
for convenience. COMPCOST is not significant at any fare level, which suggests that the
aggregate cost structure of the competition is similar to the observed carrier. The result of the
3 baseline estimates upholds the conclusion that ceteris paribus, routes with a single dominant
carrier have higher prices. Moreover, market dominance of an airline is enhanced when that
observed carrier controls a large percentage of a route’s traffic and has a number of small
competitors.
While Borenstein (1989) finds that potential competition has little if any disciplining
affect on market prices, this analysis argues that low-cost carriers have a significant and far-
reaching impact on the airline market.4 The estimated baseline equations with low-cost
variables, presented in the lower half of Table 9, reveal that the effect of a low-cost carrier is
present at each percentile. The low-cost route market share (LWCSTSHARE) parameter is
significant at the 1% level in the median and 80th percentile equations. A 1% rise in low-cost
route market share lowers the median fare by 0.33% and the 80th percentile fare by 0.86%.
The lack of significance at the lowest percentile suggests that this market segment is already
competitive. Thus a low cost presence disciplines prices to the greatest extent on the least
competitive city-route pairs.
4 It is important to note that Borenstein (1989) does not control for low-cost carriers. Instead, the paper controls for potential competition, which is not an accurate proxy for measuring the magnitude of low-cost presence. If the Borenstein had controlled for low-cost carriers the paper may have estimated lower magnitudes for the concentration and hub effects. Hence, the negligible effect of potential competition does not imply that low-cost carriers had little if any impact on the airline market in the late 1980s.
Both low-cost route and endpoint airport market share (estimated with the parameter
ORGLWCSHARE) impact market prices. If low-cost carriers control 50% of the originating
passengers at the two endpoints of a route this analysis estimates that the observed carrier’s
price would fall by 0.006%, 0.031%, and 0.033% for the 20th, median, and 80th percentiles
respectively. Thus controlling for the observed carrier’s share on the route, increases in low-
cost market share, either on the route or at the endpoint airports, lower the median and highest
prices by 5 times the magnitude of the low-end effect.
Controlling for low-cost route market share reveals a downward force on prices;
however, the effect of a low-cost hub is not significant at any of the 3 fare levels. The lack of
a negative and significant low-cost hub effect is not consistent with the other low-cost
parameters. However, low-cost hubs are not exclusively served by low-cost carriers. For
example, JetBlue’s primary hub is at New York John F. Kennedy (JFK) airport. Since this is a
major airport, with a large base of business travelers, the low-cost hub does not significantly
affect the fares of flights terminating and originating the JFK.
The effect on price of the presence of a low-cost carrier, as explained above, is
negative and significant. Moreover, having one large low-cost carrier or many smaller players
on a route does not affect prices. The low-cost route Herfindahl is only significant at the 80th
percentile, where a lower Herfindahl index (HHI) reduces the magnitude of the estimated
effect of the low-cost route Herfindahl (LWCSTHERF) parameter. Thus a low-cost presence,
not the structure of that presence is an important predictor of price.
The estimated baseline equation with low-cost variables also reveals that the low-cost
effect extends to the concentration and route characteristic parameters as well. In fact, this
analysis argues that the concentration effect and hub effect that Borenstein (1989) and others
suggest are critical to understanding airline pricing are significantly less important than
previously suggested. Case in point, the baseline equation estimates that the presence of a hub
at either or both endpoints of a route raises prices between 6.7% and 29.5%. Controlling for
the presence of low-cost carriers, with the 4 low-cost variables, the estimated effect of a hub
ranges from 0.9% to 10.0%. Thus at the low-end the hub effect fell by 87% and at the high-
end the hub effect declined by 66%.
The sharp decline of the hub effect suggests that much of this effect is actually due to
the lack of a low-cost presence. Low-cost carriers carry 11.3% of all domestic traffic
originating and terminating at a major carrier’s hub airport. In comparison, these airlines carry
52.4% of traffic that does not originate or terminate at a hub. The small hub market share
results in a comparatively large decline in both the hub effect and the level of localized
market dominance. In the estimated baseline equations with low-cost variables, the HUB
variable is no longer significant in the 20th percentile equation; the HUB variable is significant
at the 1% level in the median and 80th percentile equations. The low-cost impact on hubs is
noteworthy, because 46.2% of all airline traffic originates and or terminates at a major
carrier’s hub. Thus understanding how low-cost carriers affect the hub effect provides some
intuition for their impact on the larger airline market.
The estimated change in price associated with hubs is overstated; moreover, the effect
of frequency and slot constraints on the market price is also over estimated. The estimated
effect of the frequency of flights on a route (FREQ) is positive and significant at the 1% in
every baseline and low-cost baseline equation. The coefficients of FREQ in the low-cost
baseline equation are 0.07, 0.05, and 0.14 for the 20th, 50th, and 80th percentiles respectively.
The addition on the 4 low-cost variables lowers the baseline equation’s FREQ parameters by
25% at the 20th percentile, 55% at the median, and 42% at the 80th percentile. Thus the
additional market power that carriers may derive from offering a high frequency of flights is
significantly lower when a low-cost carrier is present on a route.
The effect of slot constraints on prices is over estimated. The estimated effect of the
slot constraints on a route (SLOT) is not significant at the 10% level for each fare percentile
in low-cost baseline equations. The baseline equation estimates that a slot restricted airport at
the origin or destination causes the 20th, 50th, and 80th percentile fares to rise 6.8%, 11.2%,
and 22.3% respectively. However, none of the SLOT coefficients are significant in low-cost
baseline equations. Thus the additional market power that carriers may derive from barriers to
entry, like slot constraints, are not material with the presence of a low-cost carrier. Moreover,
the entire slot effect can be ascribed to the lack of a low-cost presence. STOPED HERE
Including low-cost parameters in the baseline equation similarly lowers the magnitude
of the EQUIP coefficients. Without a low-cost presence the downward effect of larger aircraft
is overestimated. Thus the cost savings implied in EQUIP are lower than the baseline equation
suggests. The effect of TOURIST is also overestimated in the baseline equation. The
inclusion of low-cost controls lowers the absolute value of the TOURIST effect to between
11.3% and 25.2%. Thus a large percentage of the TOURIST effect is dependent upon a low-
cost presence or lack thereof. Furthermore, this low-cost presence effect is of note because
29.4% of all traffic travels on tourist oriented routes. A comparatively higher low-cost market
share is needed to induce a low-cost effect on a price sensitive market segment, whereas on
relatively price insensitive routes, such as those originating and or terminating at a hub, a
much lower market share is necessary. This hypothesis is consistent with the 40.6% market
share low-cost carriers enjoy on tourist routes and 11.3% market share on (major carrier) hub
routes.
The low-cost parameters have no material impact on the market distance (MKTDIS),
route Herfindahl (RUTHERF), or the cost parameter (COMPCOST). Likewise, there is no
significant change in the route market share (RUTSHARE) variable. Thus this paper’s
baseline equation does not overestimate the impact of route concentration on prices. The route
concentration effect continues to be strong and an important factor in estimating market
prices. The stability of the route concentration effect contrasts sharply with the overestimated
effects associated with hubs, airport concentration, slot constraints, etc.
The three estimated six segment distance equations quantify the change in market
prices over 500 mile market segments. The inclusion of the 500 mile market distance dummy
variables does not change the estimated coefficients for the variables described thus far. The
baseline six segment distance equation, which does not contain low-cost variables, brings to
light a rising price premium that is tightly coupled to a flight’s length. A flight 501 to 1000
miles in length is estimated to have a price 1.3% higher than a flight of 1 to 500 miles in
length, for the median fare. This analysis estimates effect of a 2501 to 3000 mile route over
the baseline distance is a 40.7% increase in price, for the median fare. This positive
relationship between price and distance also holds for the 20th and 80th percentile equations. It
is important to note that this graduated increase appears to take a log linear form, which is at
odds with the linear increase in route length that the indicator variables measure. The price of
tickets on longer routes rises more quickly than the route length. Cost does not explain this
relationship, longer flights operate more efficiently. However, the higher levels of major
carrier concentration on longer routes may play an important role in this relationship.
The six segment distance equations with low-cost parameters quantify the low-cost
effect within distinct 500 mile market segments. Across each fare type and each fare
percentile the effect of the market distance on price is lower when controlling for the presence
of low-cost carriers. The 501-1000 mile segment parameter is not significant at any fare
percentile in the six segment equation with low-cost variables. The 1501-2000 mile
parameter’s level of significance falls as well. Likewise, the magnitude of the coefficients
decline. At the median fare, in the 1201-2000 mile segment, the distance effect falls 39.7%.
The baseline equation overstates the premium associated distance.
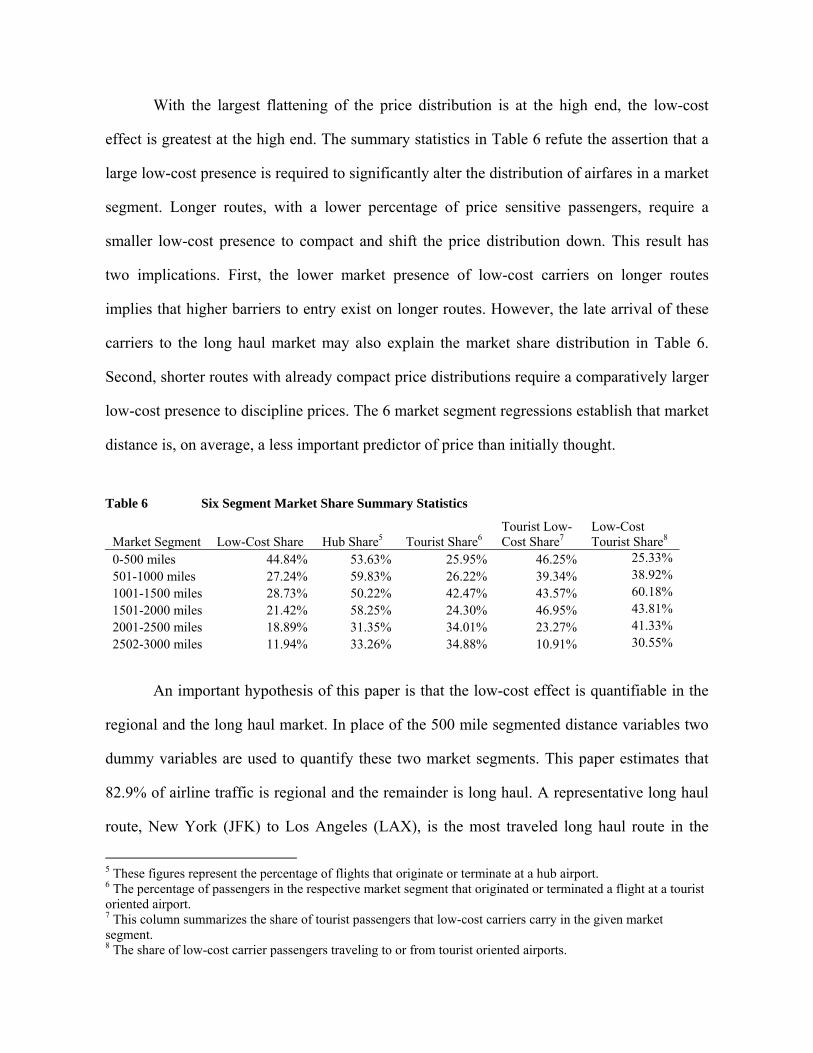
With the largest flattening of the price distribution is at the high end, the low-cost
effect is greatest at the high end. The summary statistics in Table 6 refute the assertion that a
large low-cost presence is required to significantly alter the distribution of airfares in a market
segment. Longer routes, with a lower percentage of price sensitive passengers, require a
smaller low-cost presence to compact and shift the price distribution down. This result has
two implications. First, the lower market presence of low-cost carriers on longer routes
implies that higher barriers to entry exist on longer routes. However, the late arrival of these
carriers to the long haul market may also explain the market share distribution in Table 6.
Second, shorter routes with already compact price distributions require a comparatively larger
low-cost presence to discipline prices. The 6 market segment regressions establish that market
distance is, on average, a less important predictor of price than initially thought.
Table 6 Six Segment Market Share Summary Statistics
Market Segment Low-Cost Share Hub Share5 Tourist Share6Tourist Low-Cost Share7
Low-Cost Tourist Share8
0-500 miles 44.84% 53.63% 25.95% 46.25% 25.33% 501-1000 miles 27.24% 59.83% 26.22% 39.34% 38.92% 1001-1500 miles 28.73% 50.22% 42.47% 43.57% 60.18% 1501-2000 miles 21.42% 58.25% 24.30% 46.95% 43.81% 2001-2500 miles 18.89% 31.35% 34.01% 23.27% 41.33% 2502-3000 miles 11.94% 33.26% 34.88% 10.91% 30.55%
An important hypothesis of this paper is that the low-cost effect is quantifiable in the
regional and the long haul market. In place of the 500 mile segmented distance variables two
dummy variables are used to quantify these two market segments. This paper estimates that
82.9% of airline traffic is regional and the remainder is long haul. A representative long haul
route, New York (JFK) to Los Angeles (LAX), is the most traveled long haul route in the
5 These figures represent the percentage of flights that originate or terminate at a hub airport. 6 The percentage of passengers in the respective market segment that originated or terminated a flight at a tourist oriented airport. 7 This column summarizes the share of tourist passengers that low-cost carriers carry in the given market segment. 8 The share of low-cost carrier passengers traveling to or from tourist oriented airports.
United States with a low-cost market share of 0.06%. American Airlines is the dominant
carrier on the route with a market share of 46.3%. The most traveled regional route is
Washington National (DCA) to New York LaGuardia (LGA). Delta Airlines has the highest
market share on the route at 53.5%. Also, there is no low-cost presence on DCA to LGA.
Although, the most prominent regional and long haul routes lack a nontrivial low-cost
presence, the low-cost effect is significant in both the regional and long haul markets.
The long haul route with the highest number of low-cost passengers is Chicago
Midway (MDW) to Las Vegas (LAS). The dominant carriers on this route include American
Trans Air with 43.1%, National Airlines with 31.0%, and Southwest with a 25.8% market
share. In fact, low-cost carriers transport 100% of the traffic on this tourist oriented route. In
the regional market, the most traveled route with a low-cost presence is Los Angeles (LAX)
to Oakland (OAK). Southwest dominates this regional route with a market share of 92.6%;
Southwest is the only low-cost carrier on the route. Even though the market structure for these
example routes is vastly different, the low-cost impact is just as great. The low-cost presence
itself not the structure of that presence, on long haul and regional routes, lowers prices.
The short/long haul market segment equations indicate that the low-cost effect extends
across the entire airline market; moreover this effect is significant at each measured fare
percentile. Note that the effects of the other parameters discussed previously remain the same
unless otherwise noted. The estimated results of the three baseline short/long haul equations
demonstrate the monetary premium associated with long haul routes. Case in point, the effect
of the long haul market distance group variable on price is estimated to be 0.06, 0.16, and
0.14 at the 20th, 50th, and 80th percentiles respectively. Thus, at the median airfare, a long haul
route is estimated to have a price 16% higher than a regional route controlling for route
specific characteristics.
The result at the median mirrors the results at the 20th and 80th percentiles; moreover,
each of the long haul market distance group (MKTDISLNG) parameters is significant at the
1% level. Thus there is a considerable price premium associated with the long haul market
that cannot be explained by the higher total (though lower per mile) cost of long haul routes.
A possible explanation for the price premium is that low-cost carriers have a much smaller
exposure to the long haul market than the regional market. This lower market penetration rate
triggers a lower level of competitive pressure on the incumbent major carriers, which in turn
raises prices.
The price difference between regional and long haul routes at each of the three
measured fare percentiles is overstated in the baseline equations. At the 20th, 50th, and 80th
percentiles the long haul distance effect (the price premium over a comparable regional route)
is estimated to be 4.8%, 9.7%, and 4.3% in the low-cost equations. The 20th and 80th
percentile coefficients are significant at the 10% level and the median coefficient is significant
at the 1% level. Not only has the estimated magnitude of each MKTDISLNG variable fallen,
but the level of significance has fallen as well. The declining level of significance indicates
that the difference in regional and long haul prices are of a lesser degree than the baseline
equations imply.
An implication of the short/long haul equation results is that there is a difference in
pricing between regional and short haul routes regardless of a low-cost presence; however, the
more important observation is that low-cost carriers significantly lower the difference in
prices between regional and long haul routes. Thus the low-cost carrier is no longer pigeon
holed to the regional market; however, the regional market still accounts for 83.2% of all
airline traffic. The three largest long haul low-cost carriers Southwest, America Trans Air,
and JetBlue account for 75.4% of all long haul low-cost traffic. Table 8 summarizes the low-
cost carriers that serve the long haul market and provides each carrier’s market share.
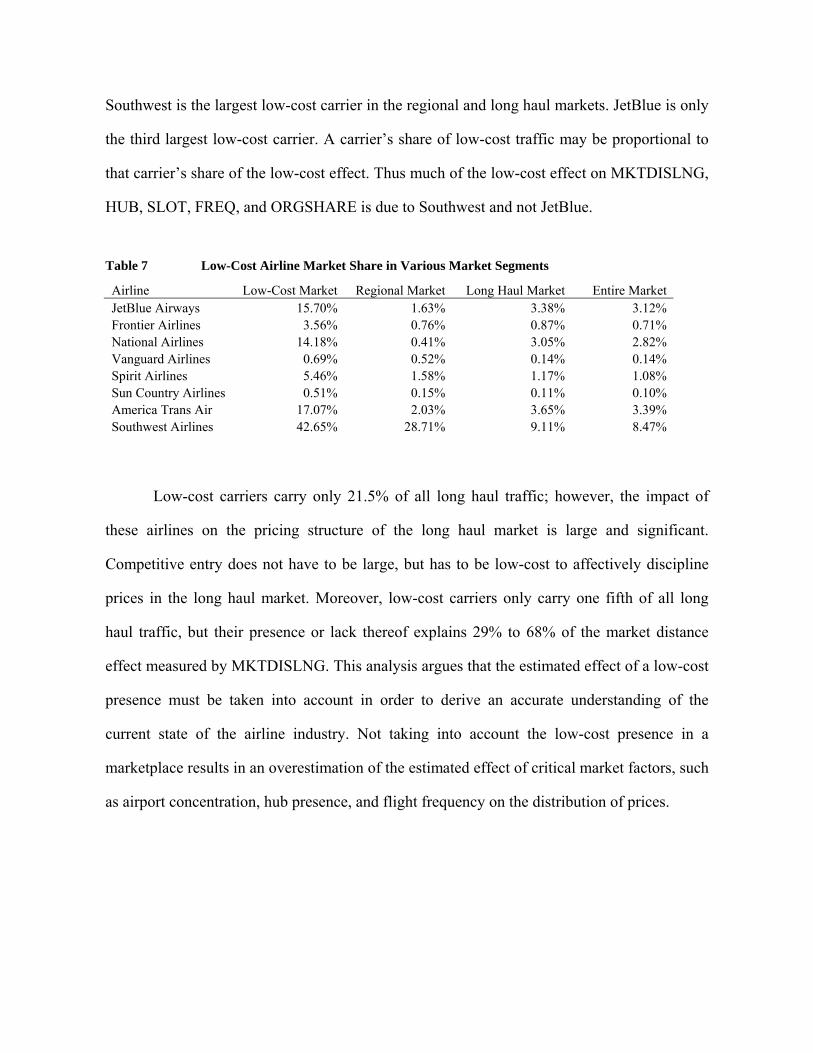
Southwest is the largest low-cost carrier in the regional and long haul markets. JetBlue is only
the third largest low-cost carrier. A carrier’s share of low-cost traffic may be proportional to
that carrier’s share of the low-cost effect. Thus much of the low-cost effect on MKTDISLNG,
HUB, SLOT, FREQ, and ORGSHARE is due to Southwest and not JetBlue.
Table 7 Low-Cost Airline Market Share in Various Market Segments
Airline Low-Cost Market Regional Market Long Haul Market Entire Market JetBlue Airways 15.70% 1.63% 3.38% 3.12% Frontier Airlines 3.56% 0.76% 0.87% 0.71% National Airlines 14.18% 0.41% 3.05% 2.82% Vanguard Airlines 0.69% 0.52% 0.14% 0.14% Spirit Airlines 5.46% 1.58% 1.17% 1.08% Sun Country Airlines 0.51% 0.15% 0.11% 0.10% America Trans Air 17.07% 2.03% 3.65% 3.39% Southwest Airlines 42.65% 28.71% 9.11% 8.47%
Low-cost carriers carry only 21.5% of all long haul traffic; however, the impact of
these airlines on the pricing structure of the long haul market is large and significant.
Competitive entry does not have to be large, but has to be low-cost to affectively discipline
prices in the long haul market. Moreover, low-cost carriers only carry one fifth of all long
haul traffic, but their presence or lack thereof explains 29% to 68% of the market distance
effect measured by MKTDISLNG. This analysis argues that the estimated effect of a low-cost
presence must be taken into account in order to derive an accurate understanding of the
current state of the airline industry. Not taking into account the low-cost presence in a
marketplace results in an overestimation of the estimated effect of critical market factors, such
as airport concentration, hub presence, and flight frequency on the distribution of prices.
7. Conclusion
In the current airline market, the impact of a new breed of air carrier, the low-cost
carrier, on airfares, is significant and broadly distributed. Previous industrial organization
literature argues that concentration measures are critical to understanding the dynamics of
pricing in the airline markets. The previous analyses of Borenstein (1989) and others lacked a
key insight: the low-cost carrier is an important market participant. However, the Borenstein
paper lays a solid groundwork that forms the base of this thesis. Without the low-cost
parameters in the 3 sets of equations, the estimated results of this paper closely resemble
Borenstein’s results. The inclusion of the low-cost parameters in the baseline equation results
in a set of estimated results that provide a more accurate accounting of what factors really
impact airline industry price distributions and more specifically the prices that each consumer
pays.
The low-cost effect results in the compaction of price distributions and the lowering of
the associated central tendency of those distributions across all market segments. Moreover, a
low-cost presence is correlated with a higher degree of competitiveness and a decline in the
relevance of concentration, frequency, hubs, and capacity constraints in predicting market
prices. The low-cost effect is statistically significant and measurable across the entire
distribution of airfares. The effect is also significant and measurable for a route of variable
length. A low-cost presence lowers prices at the low end, median, and high-end of the price
distribution on regional and long haul routes. In fact, the largest degree of flattening occurs at
the high end of the price distribution. Thus routes with the highest levels of market dominance
would experience the largest change in their distribution of prices, with the entry of a low-cost
carrier.
Moreover, a low-cost presence is estimated to cause a flatter price distribution, a
higher degree of competitiveness, and a decline in the relevance of concentration, frequency,
hubs, and capacity constraints in predicting market prices. This new breed of air carrier
disciplines the incumbent major carriers that rely on market dominance to extract higher rents
to support the higher cost basis of the hub-and-spoke networks these airlines use. The
disciplining effect of low-cost carriers on the premium major airlines derives from hub
airports may indicate that the higher cost basis of a traditional hub is no longer justified.
Moreover, the low-cost airline model, which is built around using a point-to-point network,
should continue to be a successful model for new entrants. While it is unlikely that any major
carriers will completely abandon their hub-and-spoke networks, the partial dismantling of
those hubs, in the form of de-peaking, will continue. Market forces have and will continue to
cause these structural changes. Furthermore, there are policies can accelerate this shift and the
magnitude of the low-cost presence in the airline markets.
This paper argues that a shift in critical thought is necessary to analyze today’s airline
industry; moreover, policies to encourage competition and a flatter price distribution will only
bring about change if these policies are designed to encourage a larger low-cost presence in
the marketplace. Policies that try to reduce concentration levels or dismantle hub airports will
face stiff political opposition. The estimated baseline results suggest that regulations targeting
these factors would change the distribution of airfares. In reality, the concentration and hub
effects are significantly smaller than this paper first proposes. Targeting these factors would
not result in a dramatic change in the competitiveness of airline routes as measured by the
shape and location of the fare distribution curve. Moreover, this kind of targeted policy would
incite fierce lobbying by the major nationwide carriers. The recent success of these carriers to
obtain multi-billion dollar subsidies from the federal government points to the strength of the
corporate airline lobby and airline union lobby.
Given that traditional policies, which encourage lower levels of concentration, are
relatively ineffectual and politically infeasible, is there a viable alternative? Instead of
attempting to reduce the impact of factors with a negative effect on the market, a successful
policy must try to raise the impact of factors with a positive effect on the market. A viable
policy must provide ample opportunity for low-cost entry in order to compact the fare
distribution and return rents to the American consumer. The primary barrier to low-cost entry
is the lack of airport infrastructure at many of America’s largest metropolitan airports. In
order to achieve the disciplining effect of a low-cost presence, the government should
implement policies that encourage capacity constrained airports to build new infrastructure.
Moreover, regulatory barriers to airport expansion should be loosened. A lower level of
airport expansion regulation would encourage airports to undertake needed infrastructure
improvements to increase capacity.
A build out of airport infrastructure, targeted at the most congested airports, would
encourage low-cost carriers to enter a greater number of non-secondary markets. The newly
constructed airport resources need to be allocated so that incumbent carriers do not receive a
preferential claim to those resources. New resources alone do not discipline markets and
compact the price distribution. Low-cost carriers must have access to those resources;
otherwise, the infrastructure projects are nothing more than a subsidy to the major carriers.
With greater access to once congested markets, the low-cost effect, on the market price
distribution in these congested markets, should continue to increase in magnitude. Although,
hubs still have higher fares than other airports, even when controlling for low-cost carriers,
the significant role of the low-cost carrier in today’s airline market indicates that dominance
and market power do not go unchecked in the U.S. airline industry; moreover, this paper
estimates that the entry of a low-cost carrier lowers fares while at the same time it lessens the
effect of concentration and increases competition in the U.S. airline industry.
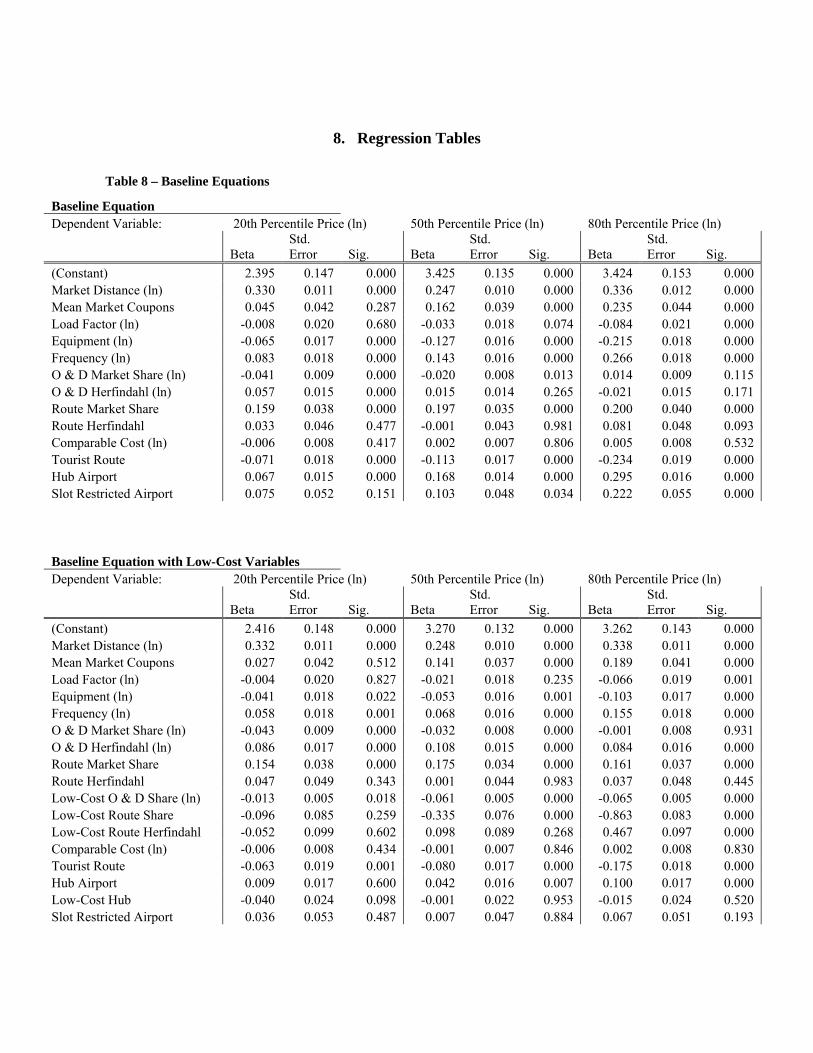
8. Regression Tables
Table 8 – Baseline Equations
Baseline Equation Dependent Variable: 20th Percentile Price (ln) 50th Percentile Price (ln) 80th Percentile Price (ln)
Beta Std. Error Sig. Beta
Std. Error Sig. Beta
Std. Error Sig.
(Constant) 2.395 0.147 0.000 3.425 0.135 0.000 3.424 0.153 0.000 Market Distance (ln) 0.330 0.011 0.000 0.247 0.010 0.000 0.336 0.012 0.000 Mean Market Coupons 0.045 0.042 0.287 0.162 0.039 0.000 0.235 0.044 0.000 Load Factor (ln) -0.008 0.020 0.680 -0.033 0.018 0.074 -0.084 0.021 0.000 Equipment (ln) -0.065 0.017 0.000 -0.127 0.016 0.000 -0.215 0.018 0.000 Frequency (ln) 0.083 0.018 0.000 0.143 0.016 0.000 0.266 0.018 0.000 O & D Market Share (ln) -0.041 0.009 0.000 -0.020 0.008 0.013 0.014 0.009 0.115 O & D Herfindahl (ln) 0.057 0.015 0.000 0.015 0.014 0.265 -0.021 0.015 0.171 Route Market Share 0.159 0.038 0.000 0.197 0.035 0.000 0.200 0.040 0.000 Route Herfindahl 0.033 0.046 0.477 -0.001 0.043 0.981 0.081 0.048 0.093 Comparable Cost (ln) -0.006 0.008 0.417 0.002 0.007 0.806 0.005 0.008 0.532 Tourist Route -0.071 0.018 0.000 -0.113 0.017 0.000 -0.234 0.019 0.000 Hub Airport 0.067 0.015 0.000 0.168 0.014 0.000 0.295 0.016 0.000 Slot Restricted Airport 0.075 0.052 0.151 0.103 0.048 0.034 0.222 0.055 0.000 Baseline Equation with Low-Cost Variables Dependent Variable: 20th Percentile Price (ln) 50th Percentile Price (ln) 80th Percentile Price (ln)
Beta Std. Error Sig. Beta
Std. Error Sig. Beta
Std. Error Sig.
(Constant) 2.416 0.148 0.000 3.270 0.132 0.000 3.262 0.143 0.000 Market Distance (ln) 0.332 0.011 0.000 0.248 0.010 0.000 0.338 0.011 0.000 Mean Market Coupons 0.027 0.042 0.512 0.141 0.037 0.000 0.189 0.041 0.000 Load Factor (ln) -0.004 0.020 0.827 -0.021 0.018 0.235 -0.066 0.019 0.001 Equipment (ln) -0.041 0.018 0.022 -0.053 0.016 0.001 -0.103 0.017 0.000 Frequency (ln) 0.058 0.018 0.001 0.068 0.016 0.000 0.155 0.018 0.000 O & D Market Share (ln) -0.043 0.009 0.000 -0.032 0.008 0.000 -0.001 0.008 0.931 O & D Herfindahl (ln) 0.086 0.017 0.000 0.108 0.015 0.000 0.084 0.016 0.000 Route Market Share 0.154 0.038 0.000 0.175 0.034 0.000 0.161 0.037 0.000 Route Herfindahl 0.047 0.049 0.343 0.001 0.044 0.983 0.037 0.048 0.445 Low-Cost O & D Share (ln) -0.013 0.005 0.018 -0.061 0.005 0.000 -0.065 0.005 0.000 Low-Cost Route Share -0.096 0.085 0.259 -0.335 0.076 0.000 -0.863 0.083 0.000 Low-Cost Route Herfindahl -0.052 0.099 0.602 0.098 0.089 0.268 0.467 0.097 0.000 Comparable Cost (ln) -0.006 0.008 0.434 -0.001 0.007 0.846 0.002 0.008 0.830 Tourist Route -0.063 0.019 0.001 -0.080 0.017 0.000 -0.175 0.018 0.000 Hub Airport 0.009 0.017 0.600 0.042 0.016 0.007 0.100 0.017 0.000 Low-Cost Hub -0.040 0.024 0.098 -0.001 0.022 0.953 -0.015 0.024 0.520 Slot Restricted Airport 0.036 0.053 0.487 0.007 0.047 0.884 0.067 0.051 0.193
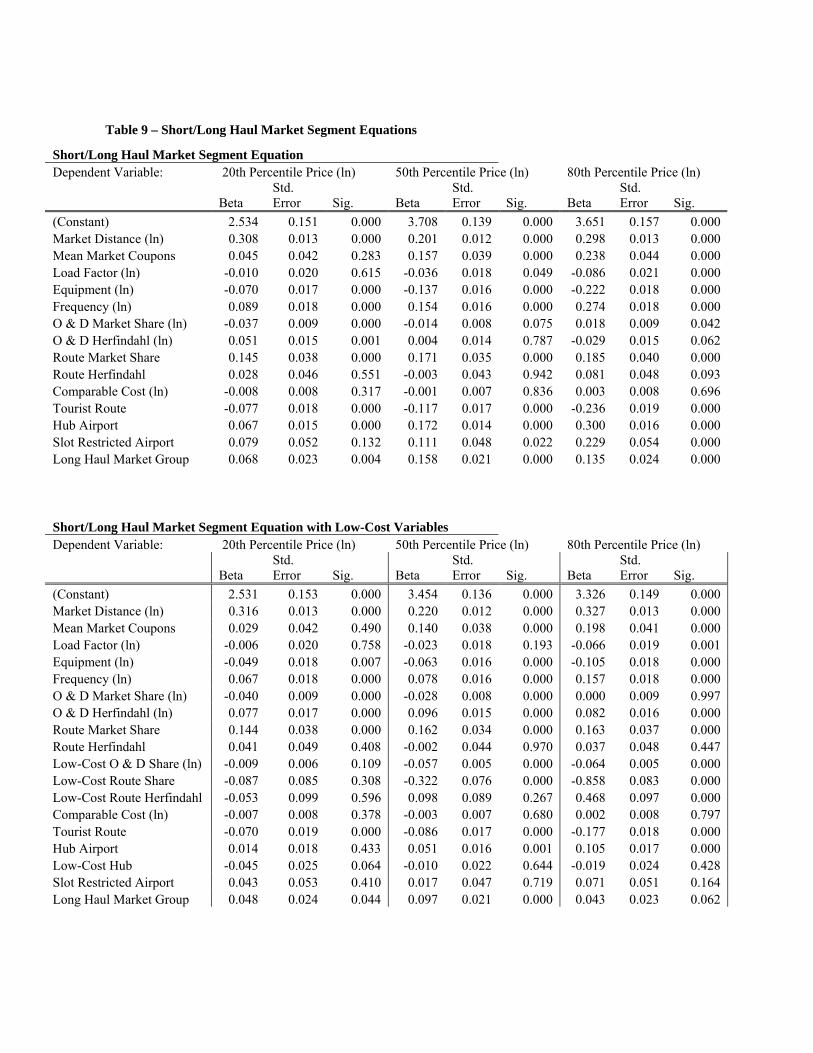
Table 9 – Short/Long Haul Market Segment Equations
Short/Long Haul Market Segment Equation Dependent Variable: 20th Percentile Price (ln) 50th Percentile Price (ln) 80th Percentile Price (ln)
Beta Std. Error Sig. Beta
Std. Error Sig. Beta
Std. Error Sig.
(Constant) 2.534 0.151 0.000 3.708 0.139 0.000 3.651 0.157 0.000 Market Distance (ln) 0.308 0.013 0.000 0.201 0.012 0.000 0.298 0.013 0.000 Mean Market Coupons 0.045 0.042 0.283 0.157 0.039 0.000 0.238 0.044 0.000 Load Factor (ln) -0.010 0.020 0.615 -0.036 0.018 0.049 -0.086 0.021 0.000 Equipment (ln) -0.070 0.017 0.000 -0.137 0.016 0.000 -0.222 0.018 0.000 Frequency (ln) 0.089 0.018 0.000 0.154 0.016 0.000 0.274 0.018 0.000 O & D Market Share (ln) -0.037 0.009 0.000 -0.014 0.008 0.075 0.018 0.009 0.042 O & D Herfindahl (ln) 0.051 0.015 0.001 0.004 0.014 0.787 -0.029 0.015 0.062 Route Market Share 0.145 0.038 0.000 0.171 0.035 0.000 0.185 0.040 0.000 Route Herfindahl 0.028 0.046 0.551 -0.003 0.043 0.942 0.081 0.048 0.093 Comparable Cost (ln) -0.008 0.008 0.317 -0.001 0.007 0.836 0.003 0.008 0.696 Tourist Route -0.077 0.018 0.000 -0.117 0.017 0.000 -0.236 0.019 0.000 Hub Airport 0.067 0.015 0.000 0.172 0.014 0.000 0.300 0.016 0.000 Slot Restricted Airport 0.079 0.052 0.132 0.111 0.048 0.022 0.229 0.054 0.000 Long Haul Market Group 0.068 0.023 0.004 0.158 0.021 0.000 0.135 0.024 0.000 Short/Long Haul Market Segment Equation with Low-Cost Variables Dependent Variable: 20th Percentile Price (ln) 50th Percentile Price (ln) 80th Percentile Price (ln)
Beta Std. Error Sig. Beta
Std. Error Sig. Beta
Std. Error Sig.
(Constant) 2.531 0.153 0.000 3.454 0.136 0.000 3.326 0.149 0.000 Market Distance (ln) 0.316 0.013 0.000 0.220 0.012 0.000 0.327 0.013 0.000 Mean Market Coupons 0.029 0.042 0.490 0.140 0.038 0.000 0.198 0.041 0.000 Load Factor (ln) -0.006 0.020 0.758 -0.023 0.018 0.193 -0.066 0.019 0.001 Equipment (ln) -0.049 0.018 0.007 -0.063 0.016 0.000 -0.105 0.018 0.000 Frequency (ln) 0.067 0.018 0.000 0.078 0.016 0.000 0.157 0.018 0.000 O & D Market Share (ln) -0.040 0.009 0.000 -0.028 0.008 0.000 0.000 0.009 0.997 O & D Herfindahl (ln) 0.077 0.017 0.000 0.096 0.015 0.000 0.082 0.016 0.000 Route Market Share 0.144 0.038 0.000 0.162 0.034 0.000 0.163 0.037 0.000 Route Herfindahl 0.041 0.049 0.408 -0.002 0.044 0.970 0.037 0.048 0.447 Low-Cost O & D Share (ln) -0.009 0.006 0.109 -0.057 0.005 0.000 -0.064 0.005 0.000 Low-Cost Route Share -0.087 0.085 0.308 -0.322 0.076 0.000 -0.858 0.083 0.000 Low-Cost Route Herfindahl -0.053 0.099 0.596 0.098 0.089 0.267 0.468 0.097 0.000 Comparable Cost (ln) -0.007 0.008 0.378 -0.003 0.007 0.680 0.002 0.008 0.797 Tourist Route -0.070 0.019 0.000 -0.086 0.017 0.000 -0.177 0.018 0.000 Hub Airport 0.014 0.018 0.433 0.051 0.016 0.001 0.105 0.017 0.000 Low-Cost Hub -0.045 0.025 0.064 -0.010 0.022 0.644 -0.019 0.024 0.428 Slot Restricted Airport 0.043 0.053 0.410 0.017 0.047 0.719 0.071 0.051 0.164 Long Haul Market Group 0.048 0.024 0.044 0.097 0.021 0.000 0.043 0.023 0.062
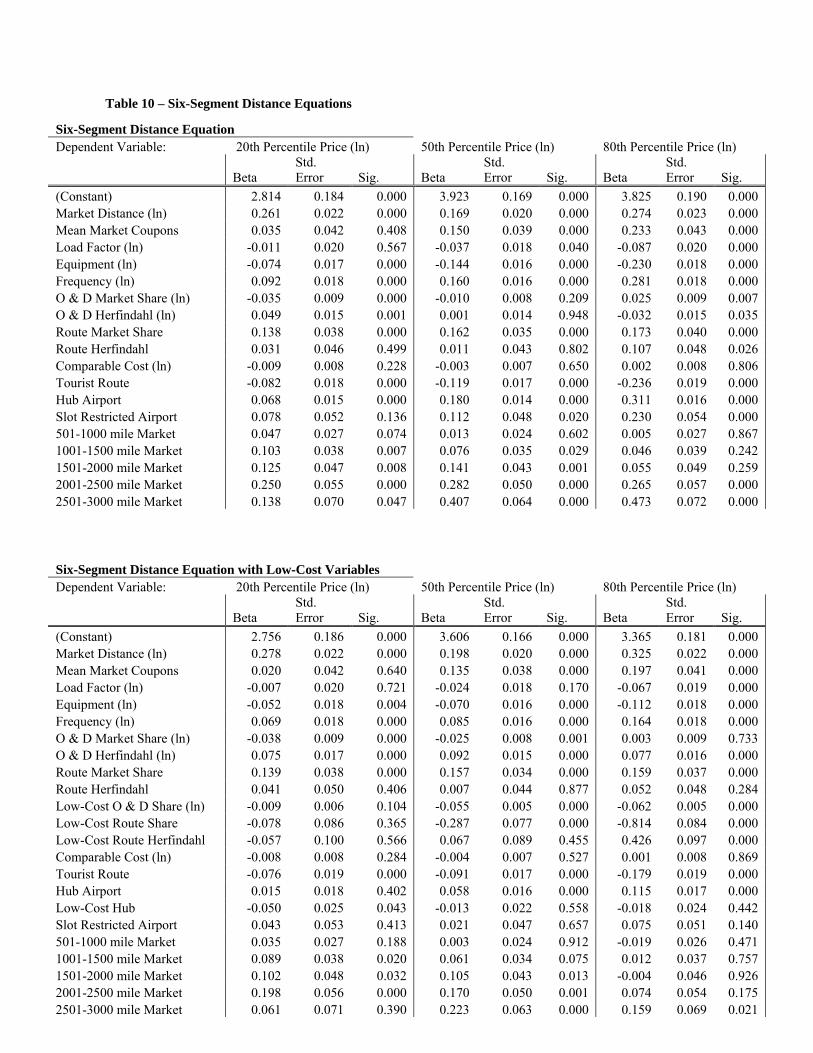
Table 10 – Six-Segment Distance Equations
Six-Segment Distance Equation Dependent Variable: 20th Percentile Price (ln) 50th Percentile Price (ln) 80th Percentile Price (ln)
Beta Std. Error Sig. Beta
Std. Error Sig. Beta
Std. Error Sig.
(Constant) 2.814 0.184 0.000 3.923 0.169 0.000 3.825 0.190 0.000 Market Distance (ln) 0.261 0.022 0.000 0.169 0.020 0.000 0.274 0.023 0.000 Mean Market Coupons 0.035 0.042 0.408 0.150 0.039 0.000 0.233 0.043 0.000 Load Factor (ln) -0.011 0.020 0.567 -0.037 0.018 0.040 -0.087 0.020 0.000 Equipment (ln) -0.074 0.017 0.000 -0.144 0.016 0.000 -0.230 0.018 0.000 Frequency (ln) 0.092 0.018 0.000 0.160 0.016 0.000 0.281 0.018 0.000 O & D Market Share (ln) -0.035 0.009 0.000 -0.010 0.008 0.209 0.025 0.009 0.007 O & D Herfindahl (ln) 0.049 0.015 0.001 0.001 0.014 0.948 -0.032 0.015 0.035 Route Market Share 0.138 0.038 0.000 0.162 0.035 0.000 0.173 0.040 0.000 Route Herfindahl 0.031 0.046 0.499 0.011 0.043 0.802 0.107 0.048 0.026 Comparable Cost (ln) -0.009 0.008 0.228 -0.003 0.007 0.650 0.002 0.008 0.806 Tourist Route -0.082 0.018 0.000 -0.119 0.017 0.000 -0.236 0.019 0.000 Hub Airport 0.068 0.015 0.000 0.180 0.014 0.000 0.311 0.016 0.000 Slot Restricted Airport 0.078 0.052 0.136 0.112 0.048 0.020 0.230 0.054 0.000 501-1000 mile Market 0.047 0.027 0.074 0.013 0.024 0.602 0.005 0.027 0.867 1001-1500 mile Market 0.103 0.038 0.007 0.076 0.035 0.029 0.046 0.039 0.242 1501-2000 mile Market 0.125 0.047 0.008 0.141 0.043 0.001 0.055 0.049 0.259 2001-2500 mile Market 0.250 0.055 0.000 0.282 0.050 0.000 0.265 0.057 0.000 2501-3000 mile Market 0.138 0.070 0.047 0.407 0.064 0.000 0.473 0.072 0.000 Six-Segment Distance Equation with Low-Cost Variables Dependent Variable: 20th Percentile Price (ln) 50th Percentile Price (ln) 80th Percentile Price (ln)
Beta Std. Error Sig. Beta
Std. Error Sig. Beta
Std. Error Sig.
(Constant) 2.756 0.186 0.000 3.606 0.166 0.000 3.365 0.181 0.000 Market Distance (ln) 0.278 0.022 0.000 0.198 0.020 0.000 0.325 0.022 0.000 Mean Market Coupons 0.020 0.042 0.640 0.135 0.038 0.000 0.197 0.041 0.000 Load Factor (ln) -0.007 0.020 0.721 -0.024 0.018 0.170 -0.067 0.019 0.000 Equipment (ln) -0.052 0.018 0.004 -0.070 0.016 0.000 -0.112 0.018 0.000 Frequency (ln) 0.069 0.018 0.000 0.085 0.016 0.000 0.164 0.018 0.000 O & D Market Share (ln) -0.038 0.009 0.000 -0.025 0.008 0.001 0.003 0.009 0.733 O & D Herfindahl (ln) 0.075 0.017 0.000 0.092 0.015 0.000 0.077 0.016 0.000 Route Market Share 0.139 0.038 0.000 0.157 0.034 0.000 0.159 0.037 0.000 Route Herfindahl 0.041 0.050 0.406 0.007 0.044 0.877 0.052 0.048 0.284 Low-Cost O & D Share (ln) -0.009 0.006 0.104 -0.055 0.005 0.000 -0.062 0.005 0.000 Low-Cost Route Share -0.078 0.086 0.365 -0.287 0.077 0.000 -0.814 0.084 0.000 Low-Cost Route Herfindahl -0.057 0.100 0.566 0.067 0.089 0.455 0.426 0.097 0.000 Comparable Cost (ln) -0.008 0.008 0.284 -0.004 0.007 0.527 0.001 0.008 0.869 Tourist Route -0.076 0.019 0.000 -0.091 0.017 0.000 -0.179 0.019 0.000 Hub Airport 0.015 0.018 0.402 0.058 0.016 0.000 0.115 0.017 0.000 Low-Cost Hub -0.050 0.025 0.043 -0.013 0.022 0.558 -0.018 0.024 0.442 Slot Restricted Airport 0.043 0.053 0.413 0.021 0.047 0.657 0.075 0.051 0.140 501-1000 mile Market 0.035 0.027 0.188 0.003 0.024 0.912 -0.019 0.026 0.471 1001-1500 mile Market 0.089 0.038 0.020 0.061 0.034 0.075 0.012 0.037 0.757 1501-2000 mile Market 0.102 0.048 0.032 0.105 0.043 0.013 -0.004 0.046 0.926 2001-2500 mile Market 0.198 0.056 0.000 0.170 0.050 0.001 0.074 0.054 0.175 2501-3000 mile Market 0.061 0.071 0.390 0.223 0.063 0.000 0.159 0.069 0.021
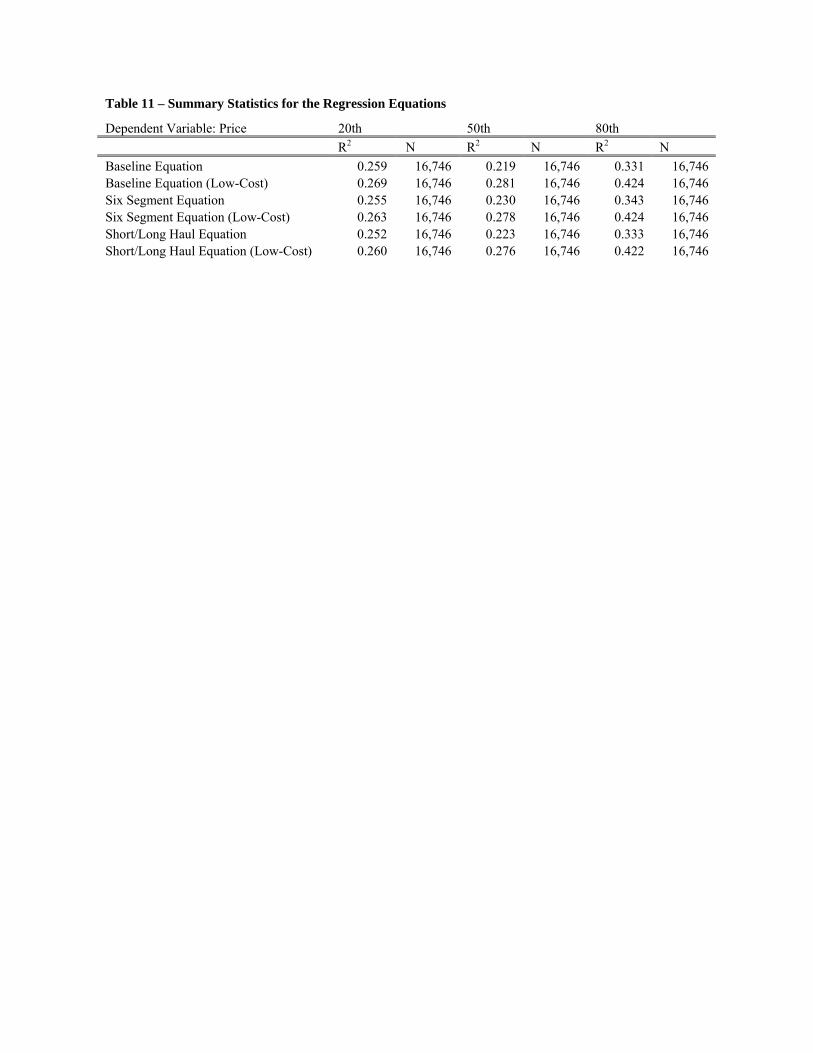
Table 11 – Summary Statistics for the Regression Equations
Dependent Variable: Price 20th 50th 80th R2 N R2 N R2 N Baseline Equation 0.259 16,746 0.219 16,746 0.331 16,746 Baseline Equation (Low-Cost) 0.269 16,746 0.281 16,746 0.424 16,746 Six Segment Equation 0.255 16,746 0.230 16,746 0.343 16,746 Six Segment Equation (Low-Cost) 0.263 16,746 0.278 16,746 0.424 16,746 Short/Long Haul Equation 0.252 16,746 0.223 16,746 0.333 16,746 Short/Long Haul Equation (Low-Cost) 0.260 16,746 0.276 16,746 0.422 16,746
9. Bibliography Air Transport Association. 2001. “Statement of Carol B. Hallett, President & Chief Executive Officer Air
Transport Association of America Before the United States Senate Science, Transportation and Commerce Committee Hearing on Airline Labor Relations.” Online: January 25, 2003. http://www.airtransport.org/public/testimony/display2.asp?nid=889
AMR Corporation. 2002 “American Hub Profiles.” Online: January 25 2003. http://www.amrcorp.com AMR Corporation. 2002 “Form 10-K, For Fiscal Year Ended December, 31 2001.” Online: January 26 2003.
http://www.edgar-online.com/bin/edgardoc/finSys_main.asp?dcn=0000950134-02-001661&nad= Beesley, Michael E. 1986. “Commitment, Sunk Costs, and Entry to the Airline Industry.” Journal of Transport
Economics and Policy, v20, n2 (September): 173-190. Borenstein, Severin. 1989. “Hubs and High Fares: Dominance and Market Power in the U.S. Airline Industry.”
The RAND Journal of Economics, v20, Issue 3: 415-436. Borenstein, Severin. 1990. “Airline Mergers, Airport Dominance, and Market Power.” American Economic
Review, v80, n2 (May): 400-404. Borenstein, Severin. 1992. “The Evolution of U.S. Airline Competition.” Journal of Economic Perspectives, v6,
n2: 45-73. Brander, James A. and Zhang, Anming. 1993. “Dynamic Oligopoly Behavior in the Airline Industry.”
International Journal of Industrial Organization, v11, n3 (September): 407-435. Brueckner, Jan K., Dyer, Nichola J., and Spiller, Pablo T. 1992. “Fare Determination in Airline Hub-and-Spoke
Networks.” The RAND Journal of Economics, v23, n3 (Autumn): 309-333. Continental Airlines. 2002. “Form 10-K, For Fiscal Year Ended December, 31 2001.” Online: January 26, 2003.
http://www.edgar-online.com/bin/edgardoc/finSys_main.asp?dcn=0000319687-02-000006&nad= Delta Airlines. 2002. “Form 10-K, For Fiscal Year Ended December, 31 2001.” Online: January 26, 2003.
http://investor.delta.com/edgar.cfm?Page=2 DiCarlo, Lisa. 2002. “JetBlue IPO Will Fly Right For Investors.” Forbes.com. February 12th. Donnelly, Sally. 2001. “Blue Skies for JetBlue.” Time Magazine. July 13th. Donnelly, Sally. 2001. “Blue Skies.” Time Magazine. August 27th. Reprinted version taken from JetBlue.com. Dresner, Martin E., Lin, Jiun-Sheng Chris, and Windle, Robert. 1996. “The Impact of Low-Cost Carriers on
Airport and Route Competition.” Journal of Transport Economics and Policy, v30, n3 (September): 309-328.
Evans, William. 1993. “Localized Market Power in the U.S. Airline Industry.” The Review of Economics and
Statistics, v75, Issue 1: 66-75. Joesch, Jutta and Zick, Cathleen. 1994. “Evidence of Changing Contestability in Commercial Airline Markets
during the 1980s.” Journal of Consumer Affairs, v28, n1: 1-24. JetBlue Airways. 2002 “Form 10-Q, For the Quarterly Period Ended March, 31 2002.” Online: January 26 2003.
http://investor.jetblue.com/ireye/ir_site.zhtml?ticker=jblu&script=1901
Joy, Stewart. 1986. “Contestable Market Analysis in the Australian Domestic Airline Industry.” Journal of Transport Economics and Policy, v20, n2: 245-54.
Leahy, A. S. 1994. “Concentration in the U.S. Airline Industry.” International Journal of Transport Economics
v21, n2 (June): 209-215. Levine, M.E. 1987. “Airline Competition in Deregulated Markets: Theory, Firm Strategy, and Public Policy.”
Yale Journal on Regulation, v4: 393-494. Meyer, John R. and Menzies, Thomas R. 2000. “The Continuing Vigil: Maintaining Competition in Deregulated
Airline Markets.” Journal of Transport Economics and Policy, v34, n1 (January): 1-20. Morrison, Steven A. and Winston, Clifford. 1990. “The Dynamics of Airline Pricing and Competition.”
American Economic Review, v80, n2 (May): 389-393. Northwest Airlines. 2002. “Form 10-K, For Fiscal Year Ended December, 31 2001.” Online: January 26, 2003.
http://ir.nwa.com/ireye/ir_site.zhtml?ticker=NWAC&script=800&layout=8 Reynolds-Feighan, A. 2001. “Traffic Distribution in Low-Cost and Full-Service Carrier Networks in the US Air
Transportation Market.” Journal of Air Transport Management, v7, n5 (September): 265-275. Richards, Krista. 1996. “The Effect of Southwest Airlines on U.S. Airline Markets.” Research in Transportation
Economics, v4: 33-47. Sanchez, Felix. 2002. “Airline Wants JetBlue Slots.” Reuters. March 12th. Southwest Airlines. 2002 “Form 10-K, For Fiscal Year Ended December, 31 2001.” Online: January 26 2003.
http://www.southwest.com/investor_relations/fs_sec_filings.html UAL Corporation. 2002 “Form 10-K, For Fiscal Year Ended December, 31 2001.” Online: January 26 2003.
http://www.ual.com/page/framedpage/0,1449,1381,00.html Vowles, Timothy M. 2001. “The Southwest Effect in Multi-Airport Regions.” Journal of Air Transport
Management, v7, n4 (July): 251-258. Whinston, Michael D. and Collins, Scott C. 1992. “Entry and Competitive Structure in Deregulated Airline
Markets: An Event Study Analysis of People Express.” The RAND Journal of Economics, v23, n4: 445-462.
Winston, Clifford. 1993. “Economic Deregulation: Days of Reckoning for Microeconomists.” Journal of
Economic Literature, v31, n3 (September): 1263-1289. Windle, Robert and Dresner, Martin. 1999. “Competitive Responses to Low-cost Carrier Entry.” Transportation
Research: Part E: Logistics and Transportation Review, v35, n1 (March): 59-75.