low carbon economies in latin america - wilson center · low carbon economies in latin america....
TRANSCRIPT

Low Carbon Economies in Latin America
Walter Vergara, Senior fellow, WRI
Wilson Center
November 1st 2017
Abengoa, Conceptualization of Cerro Dominador CSP plant in Chile
ContextWhat drives the transition:resources, policies, economicsInter-sector linksBarriers and agenda

• 10% of global emissions (4.6 GtCO2e); 7.7 tCO2e per capita;
• 22% decrease in carbon intensity per GDP-PPP since 2000;
• 48% renewable power = 0.21 tCO2e /MWh;
• Urban public-transport share of passenger trips even higher than in
Northern Europe;
• Nearly 50% of emissions come from land use and land use change.
LAC’s carbon footprint

Projected demand and emissions of the power sector
0
5
10
15
20
25
2000 2010 2020 2030 2040 2050 2060 2070
EJ/y
ear
GEA-MIX GEA-BAU
0
500
1000
1500
2000
2500
1990 2012 2030 2050 2070
MtC
O2e
CAIT | GEA-BAU
(CAIT, 2015; IIASA, 2015)

Area: 102,000 sq kmIrradiance 265 W/m2 (highest worldwide)Power received 27.4 TW or 80 PWh per year
Proven oil reserves of Saudia Arabia268 billion barrels of oilIf all converted to power: 26 PWh
If the average efficiency of PV systems is 15% ,in 16 years, 4% of the area of Atacamagenerates same power as all the provenoil reserves of Saudi Arabia.
Atacama Desert Energy field

T
Wind field covers 91,500 km2 (classes 5 to 7)Potential: 33 GW (ITM, 2013)Current installed power capacity in Mexico: 63.7 GW (IEA, 2016)(wind: 2.5 GW)Demand: 248 TWh
Isthm of Teuhantepec, Mexico
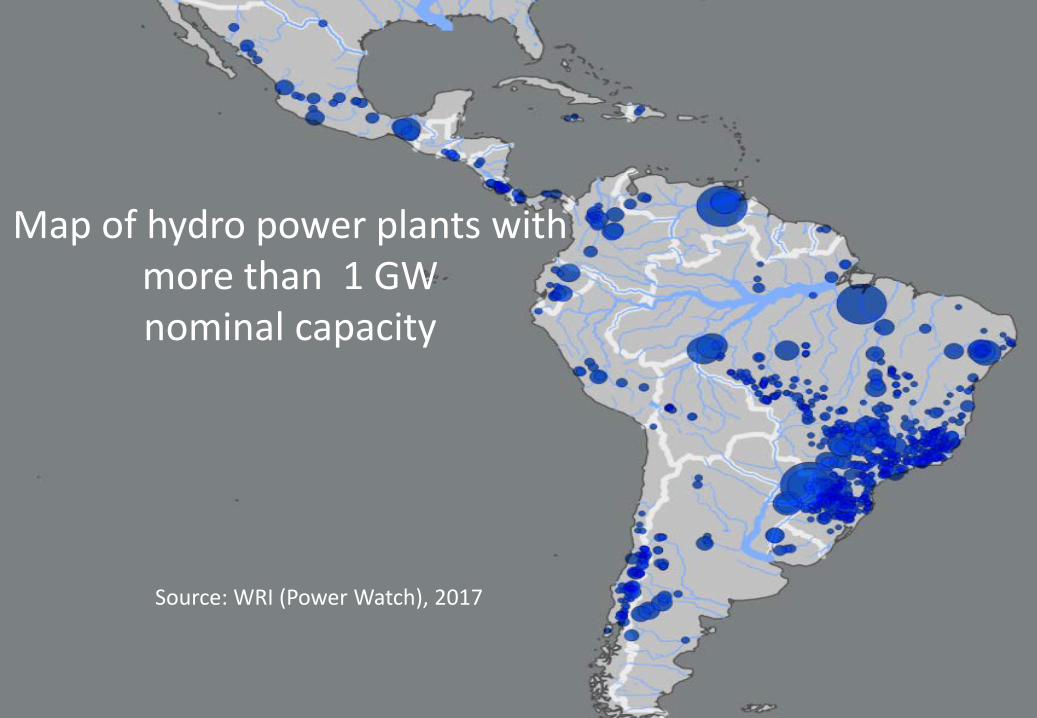
Map of hydro power plants withmore than 1 GWnominal capacity
Source: WRI (Power Watch), 2017

(Ecofys, 2009)
Resource endowment Renewable energy sources in Latin America
0 20 40 60PWh/year
Geothermal
OCEAN
Hydro-Power
Wind-offshore
Wind-onshore
Solar PV
Solar CSP
Biomass-Residues
• The region’s endowment estimated to be at about 93 PWh (Ecofys 2009)
• The global power demand sits at 19.7 PWh (EIA,2015).

Policy Framework has evolved
• Most countries:o RE targetso RE programs &
policies
• Many countries:o Fiscal
incentives/provisions
• Some countrieso Carbon taxo Preferential dispatcho Regs on distributive
power

Generation costs continue to fall (LCOEs in USD/MWh)
(IRENA, 2017)

Power generation through renewables: cheaper than fossil alternatives. (LCOEs in USD/kWh)
renewables
Source: Vergara et al, 2016)

0
0.05
0.1
0.15
0.2
0.25
0.3
0.35
0.4
Solar PV Solar CSP Wind onshore
US$
/kW
h
2012 20252050 2075
0.000
0.050
0.100
0.150
0.200
0.250
0.300
0.350
0.400
0.450
0.500
2012 2025 2050 2075
US$
/kW
h
Hydro Wind
Solar utility PV Solar CSP without storage
Solar Tower with 7 h storage Wave power
Tidal power Geothermal
Coal Natural gas
Diesel (1.71 US$/gallon) Diesel (5 US$/gallon)
Learning curves for renewables (in LCOEs, US$/kWh)
Source: Vergara et al, 2016

Pathway to zero carbon power in LAC, if…
• All new demand is met by renewables by 2020
• Fossil plants other than gas are mothballed by 2030
• All gas plants are mothballed by 2050
• Grid integrated by 2030 (regional storage in hydro)
• Widespread distributed power by 2030
• Can be done but will not be easy!
80 GW
240 GW
540 GW960 GW

Chile: Recent evolution of the Power Matrix
Source: Chile’s Ministry of Energy, Monthly report. July 2017
MW installed

Key barriers facing decarbonisationof power in the region
San Jacinto-Tecate Geothermal Plant
Fossil-fuel subsidies: important obstacle to entry;
Lack of CO2 market/carbon tax delays transition;
Grid integration and distributed power face entrenched interests;
Lack of regional market integration limits supply/demand balance

Modal share in urban transport
Sources: (Berlin, 2013), (Bogotá, 2013), (Curitiba, 2011), (Copenhagen, 2013), (USA, 2012) recalculated
26%
31%
30%
13%
Berlin
Public Transport
Private Transport
Walk
Cycle
44.7%
17.5%
27.5%
5.1%3.8%1.5%
BogotaPublic Transport
Private Transport
Walk
Taxi
Cycle
Other
28%
29%7%
36%
Copenhagen
Public Transport
Private Transport
Walk
Cycle
45%
28%
21%
5% 1% Curitiba
Public Transport
Private Transport
Walk
Cycle
Other
5.2%
79.8%
10.1%
2.9%1.3%0.6% USAPublic Transport
Private Transport
Carpool
Walk
Taxi
Cycle


A market disruption over the horizon
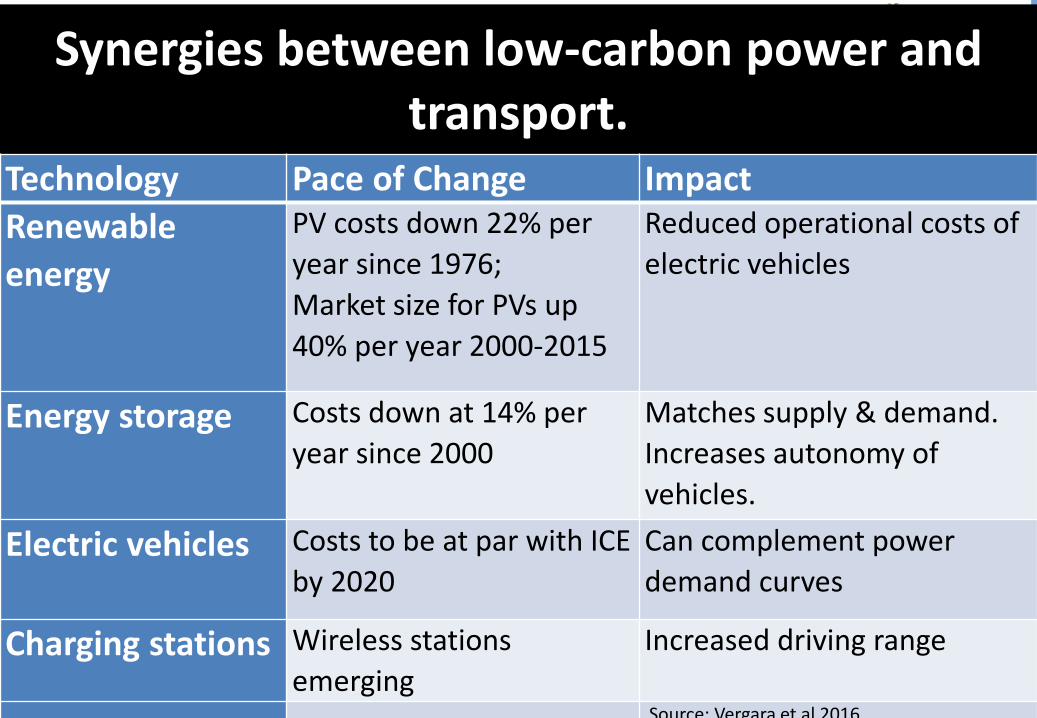
Synergies between low-carbon power and transport.
Technology Pace of Change ImpactRenewable energy
PV costs down 22% per year since 1976;Market size for PVs up 40% per year 2000-2015
Reduced operational costs of electric vehicles
Energy storage Costs down at 14% per year since 2000
Matches supply & demand. Increases autonomy of vehicles.
Electric vehicles Costs to be at par with ICE by 2020
Can complement power demand curves
Charging stations Wireless stations emerging
Increased driving range
Source: Vergara et al 2016

Projected learning curves for EV options with credit for avoided cost of air pollution (LCOE,
US$/km)
0.0
0.2
0.4
0.6
0.8
1.0
1.2
1.4
1.6
1.8
Electric Cars Electric Buses (18m) Electric Trucks
US$
/km
2012 2025 2050 2075
current LCOE for Gasoline Cars
current LCOE for Diesel Buses
current LCOE for Diesel Trucks

Pathway to zero carbon transport if….
Doable, feasible, difficult

Key barriers for electrification of transport systems
Limited policies for use of public space for public transportFossil fuel subsidiesPoor internalization of health costsLimited carbon markets/taxes

Energy savings from full transport electrification: 3.5 PWh/year by 2050
0
1
2
3
4
5
6
2005 2010 2020 2030 2040 2050 2060 2070
PWh/
year
Equivalent energy demand of transport sector if fossil fuels were used
Actual energy demand of electricity by transport sector
Vergara et al 2016

Complementarity of electricity and transport demand
Nominal capacity for hydro is 10GW.
System requires expansion to handle peak demand.
Daily eq. energy demand of diesel is 60 GWh electric.
Without expansion, system could accommodate half of additional demand
Typical load curve of power demandIn Colombia.
Area: 30 GWh


Deforestation in the Brazilian Amazon


Restoration approaches
Planned Sustainable Grazing
Silvopasture
Agroforestry and low Carbon sustainableagriculture
Avoided deforestation and degradation Reforestation
Methods that can sustainably bring back land
functionality to the landscape (carbon, topsoil,
water, vegetation, and biodiversity)
Planned Sustainable Grazing
Silvopasture
Agroforestry and low Carbon sustainableagriculture
Avoided deforestation and degradation Reforestation
Source: Initiative 20x20, 2017

CARBON SINKS Size of effort(million ha by
2050)
Potential carbon storage
rates(tC/ha-year)
Accumulated Carbon sinks
(GtCO2 e/year)
Reforestation 50 3.5 0.6
Restoration through agroforestry and
silvopastures
200 2 1.3
Avoided deforestation 0.8 260 0.7
Management of fertilizers in
cropland for abatement of N2O
n.a. 0.15 - 0.4 0.2
Management of nutrients for
livestock for abatement of CH4
n.a. n.a. 0.2
Total 250 3 0
Land use can become a major carbon sink, again if…

INITIATIVE 20X20A country-led effort to initiate restoration of 20 Mha of degraded land in Latin America and the Caribbean by 2020
$1.7b
2mha52.7mha

Sample investments under 20x20
• 100,000 ha of silvopastures. Althelia Climate Fund. Brasil
• 100,000 ha of grasslands restoration. SLM Partners. Chile
• 28,000 ha of agroforestry. CARANA. Perú
• 5,000 ha of agroforestry. Moringa Partnership. Nicaragua
• 24,300 ha of agroforestry and conservation. Ecotierra. Peru
• 1.4 M ha of protected rainforest. Amazon/Andes Fund. Peru
• 28,400 ha of sustainable use and protection of grasslands. ABC. Mexico
• Total: More than 40 projects with 10 million Ha under active restoration/conservation


Sector 2012GtCO2e
2050 GEA-BAU GtCO2e
2050 Zero GHG
pathway (GtCO2e)
Transformation drives
Total 4.6 5.3 -0.1Power generation
0.5 1.1 0 Renewables increase their margins overtime; grid integration and distributed power aid the transition.
Industry, manufacturing & construction
0.5 0.5 0.4 Industry/manufacturing implements energy savings and technology improvement measures.
Transportation 0.7 1.4 0.2 Evolving EV technologies and air-quality policies assist in transformation, overtaking internal combustion options.
Land use & forestry, agriculture and waste
2.6 1.9 -1.1 Zero deforestation and large-scale restoration and reforestation efforts are implemented.
Other Sectors 0.3 0.4 0.4 Fugitive emissions and other fuel consumption kept constant as per GEA-BAU

Interconnected regional grid
• Allow large reservoirs of renewable energy to access regional market;
• Dampen the intermittencies of local renewable resources;
• Allow regional multi-annual reservoirs to operate as a large energy storage facility;
• Reduce power costs.
• Continue support for grid integration

Fuel Subsidies
Estimated $200 billion/year (Di Bella, 2014)Drives deficitsDrags down long-term competitivenessDistorts market
Assess impacts and transfer resources to assist in transition

Carbon taxes, carbon markets
Carbon markets/taxes already in some countries
Support regional pacific carbon market initiative
Assess net impact on the economy

Framework for reforestation/restoration
• Carbon markets/taxes: cheapest mitigation measure
• Eliminate fossil fuel subsidies
• Fiscal/regulatory mechanisms

Added value of a Zero GHG development path• Energy security (inexhaustible renewable resources); • Improvements in terms of trade (energy, food, fiber);• Improved air quality in urban areas (electrification of transport); • Regional cooperation (integrated grid and means of transport); and,
• Places the region on a path more consistent with the sustainable development goals just adopted by the UN (climate, cities, energy, forests)
• It would support the deployment of new means of production and better use of natural resources with improvements in quality of life. And not just signal a leadership role for the region in the climate arena.

Data sources• CAIT (emissions today, www.cait.wri.org), • IIASA (emissions under BAU projections, (www.iiasa.ac.at/web-
apps/ene/geadb/dsd)• ENERDATA (energy use in transport and energy, www.enerdata.net)• GACMO (LCOE and LCOT, www.cdmpipeline.org)• Contact: [email protected]• The report can be downloaded with the following links:• - English:
http://orbit.dtu.dk/files/123115955/Zero_Carbon_Latin_America_rev.pdf
• - Spanish: http://orbit.dtu.dk/files/123116630/Carbono_Cero.pdf