louisiana transportation research center · this report documents the performance of louisiana...
TRANSCRIPT

Final Report 410
Performance Evaluation of Louisiana Superpave Mixtures
by
Louay N. Mohammad, Ph.D.Zhong Wu, Ph.D., P.E. Amar Raghavendra
LTRC
4101 Gourrier Avenue | Baton Rouge, Louisiana 70808 (225) 767-9131 | (225) 767-9108 fax | www.ltrc.lsu.edu
Louisiana Transportation Research Center

TECHNICAL REPORT STANDARD PAGE
1. Report No. FHWA/LA.06/410
2. Government Accession No.
3. Recipient's Catalog No.
4. Title and Subtitle
Performance Evaluation of Louisiana Superpave Mixtures
5. Report Date
December 2008 6. Performing Organization Code
7. Author(s)
Louay N. Mohammad, Ph.D. Zhong Wu, Ph.D., P.E., and Amar Raghavendra
8. Performing Organization Report No.
410
9. Performing Organization Name and Address
Louisiana Transportation Research Center 4101 Gourrier Avenue Baton Rouge, LA 70808
10. Work Unit No.
736-99-0537 11. Contract or Grant No.
98-1B 12. Sponsoring Agency Name and Address
Louisiana Transportation Research Center 4101 Gourrier Avenue Baton Rouge, LA 70808
13. Type of Report and Period Covered
Final Report; March 1998-December 2002 14. Sponsoring Agency Code
15. Supplementary Notes Conducted in Cooperation with the U.S. Department of Transportation, Federal Highway Administration 16. Abstract This report documents the performance of Louisiana Superpave mixtures through laboratory mechanistic tests, mixture volumetric properties, gradation analysis, and early field performance. Thirty Superpave mixtures were evaluated in this study. Fourteen of them were designed for high volume traffic (> 30 million ESALs), twelve for intermediate-volume traffic (between 3 and 30 million ESALs), and four for low volume traffic (< 3 million ESALs). Four aggregate types: limestone, sandstone, novaculite, and granite and five binder types: AC-30, PAC-30, PAC-40, PG 70-22M, and PG 76-22M were included in the mixtures. Four MTS tests: the indirect tensile (IT) strength, IT resilient modulus, IT creep, and axial creep, three Superpave Shear Tester (SST) tests: frequency sweep at constant height (FSCH), repeated shear at constant height (RSCH), and simple shear at constant height (SSCH), and the Asphalt Pavement Analyzer (APA) rut test were included in the testing program of this study.
The test results showed that high volume mixtures appeared to have higher IT strengths, lower IT and axial creep slopes, and higher shear stiffnesses when compared to those of low volume mixtures. This indicates that high volume mixtures generally possessed better rut resistance than the low volume mixtures considered. The compaction efforts (the N-design levels), dust/AC ratio, film thickness, and the percent of aggregate passing the 0.075 mm sieve were observed to have certain relations with the rut susceptibility of Superpave mixtures. The Power-law gradation analysis indicated that all four Power-law gradation parameters (aCA, nCA, aFA, and nFA) were sensitive to the mixture mechanistic properties evaluated. This implies that the proposed Power-law gradation analysis could be used as the bridge between aggregate gradation design and mixture performance evaluation. Finally, the early field performance of those Superpave mixtures was studied and compared to their laboratory performance test results. 17. Key Words Superpave mix design, asphalt, mixtures, performance, rutting susceptibility, SST, MTS, APA, gradation
18. Distribution Statement Unrestricted. This document is available through the National Technical Information Service, Springfield, VA 21161.
19. Security Classif. (of this report)
Unclassified
20. Security Classif. (of this page) Unclassified
21. No. of Pages
166
22. Price N/A


Project Review Committee
Each research project has an advisory committee appointed by the LTRC director. The
Project Review Committee (PRC) is responsible for assisting the LTRC administrator or
manager in the development of acceptable research problem statements, requests for
proposals, review of research proposals, oversight of approved research projects, and
implementation of findings.
LTRC appreciates the dedication of the following Project Review Committee members in
guiding this research study to fruition.
LTRC Administrator
Chris Abadie
Members
Phillip Arena, FHWA
Luanna Cambas, Material Engineer
Mike Boudreaux, District Lab Engineer
David Hodnett, District Lab Engineer
Don Weathers, LAPA
Directorate Implementation Sponsor
William Temple


Performance Evaluation of Louisiana
Superpave Mixtures
by
Louay N. Mohammad, Ph.D.
Professor of Civil and Environmental Engineering
Director, Engineering Materials Characterization Research Facility
Zhong Wu, Ph.D., P.E.
Research Assistant Professor
Amar Raghavendra
Materials Research Associate
LTRC Project No. 98-1B
SP 736-99-0537
LTRC Report No. 410
conducted for
Louisiana Transportation Research Center
The contents of this report reflect the views of the authors, who are responsible for the facts
and the accuracy of the data presented herein. The contents do not necessarily reflect the
official views or policies of the Louisiana Department of Transportation and Development or
the Louisiana Transportation Research Center. This report does not constitute a standard,
specification, or regulation.
December 2008


iii
ABSTRACT
This report documents the performance of Louisiana Superpave mixtures through laboratory
mechanistic tests, mixture volumetric properties, gradation analysis, and early field performance.
Thirty Superpave mixtures were evaluated in this study. Fourteen of them were designed for
high volume traffic (> 30 million ESALs), twelve for intermediate volume traffic (between 3 and
30 million ESALs), and four for low volume traffic (< 3 million ESALs). Four aggregate types:
limestone, sandstone, novaculite, and granite and five binder types: AC-30, PAC-30, PAC-40,
PG 70-22M, and PG 76-22M were included in the mixtures. Four MTS tests: the indirect tensile
(IT) strength, IT resilient modulus, IT creep, and axial creep, three Superpave Shear Tester (SST)
tests: frequency sweep at constant height (FSCH), repeated shear at constant height (RSCH),
simple shear at constant height (SSCH), and the Asphalt Pavement Analyzer (APA) rut test were
included in the testing program of this study.
The test results showed that high volume mixtures appeared to have higher IT strengths, lower
IT and axial creep slopes, and higher shear stiffnesses when compared to those of low volume
mixtures. This indicates that high volume mixtures generally possessed better rut resistance than
the low volume mixtures considered. The compaction efforts (the N-design levels), dust/AC
ratio, film thickness, and the percent of aggregate passing the 0.075 mm sieve were observed to
have certain relations with the rut susceptibility of Superpave mixtures. The Power-law gradation
analysis indicated that all four Power-law gradation parameters (aCA, nCA, aFA, and nFA) were
sensitive to the mixture mechanistic properties evaluated. This implies that the proposed Power-
law gradation analysis could be used as the bridge between aggregate gradation design and
mixture performance evaluation. Finally, the early field performance of those Superpave
mixtures was studied and compared to their laboratory performance test results.


v
ACKNOWLEDGEMENTS
This research project was funded by the Louisiana Transportation Research Center (LTRC) and
the Louisiana Department of Transportation and Development (LADOTD) under LTRC project
no. 98-1B. The authors would like to thank Oscar Porras Ortiz, Keith Beard, and all others who
provided valuable help in this study.


vii
IMPLEMENTATION STATEMENT
This study was conducted to assist LADOTD in developing performance data for Superpave
mixtures. The results of this study demonstrated that the rutting susceptibility of Superpave
mixtures can be reasonably predicted from laboratory fundamental engineering tests, especially
the Superpave Shear Tester (SST) tests and the APA rutting simulative test. This study provides
a general guideline for asphalt pavement engineers and researchers on how to evaluate the
performance of Superpave mixtures and which fundamental mixture properties can be
determined from laboratory tests. Specifically, the following recommendations are made for
direct implementation in Superpave mix design:
For QA/QC in plant production of Superpave mixtures, the indirect tensile strength test at
25o C is recommended. The indirect tensile strength value for a Superpave mixture with
seven percent air voids shall be at least 150 psi (1.03 MPa).
For durability/strength proof checking in laboratory Superpave mix design, the Asphalt
Pavement Analyzer (APA) test, at 60oC, is recommended. The average rut depths of three
beams or six cylindrical SGC samples shall be less than 6.1, 4.2, and 3.5 mm,
respectively for Level-I (Ndesign = 75), Level-II (Ndesign = 100), and Level-III (Ndesign =
125) Superpave mixtures.
For permanent deformation properties of Superpave mixtures, the indirect tensile creep,
frequency sweep at constant height, and repetitive shear at constant height tests are also
recommended.


ix
TABLE OF CONTENTS
ABSTRACT ................................................................................................................................... iii ACKNOWLEDGEMENTS ............................................................................................................ v IMPLEMENTATION STATEMENT .......................................................................................... vii TABLE OF CONTENTS ............................................................................................................... ix LIST OF TABLES ......................................................................................................................... xi LIST OF FIGURES ..................................................................................................................... xiii INTRODUCTION .......................................................................................................................... 1
Background ............................................................................................................................... 1 Superpave Mix Design – Research and Implementation .......................................................... 2
OBJECTIVES ................................................................................................................................. 9 SCOPE .......................................................................................................................................... 11 METHODOLOGY ....................................................................................................................... 13
Projects Identification ............................................................................................................. 13 Phase I Projects ..................................................................................................................15 Phase II Projects .................................................................................................................15
Asphalt Mixtures ..................................................................................................................... 15 Job Mix Formula ................................................................................................................15 Asphalt Binder Information ...............................................................................................24 Mixture Volumetric Properties ..........................................................................................26
Experimental Design ............................................................................................................... 28 Specimen Preparation ........................................................................................................29 Test Description .................................................................................................................29
DISCUSSION OF RESULTS....................................................................................................... 33 Part I – Phase I Superpave Mixtures ....................................................................................... 34
Indirect Tensile Resilient Modulus Test ............................................................................34 Indirect Tensile Strength Test ............................................................................................36 Axial Creep Test ................................................................................................................37 Indirect Tensile Creep Test ................................................................................................41 Frequency Sweep Test at Constant Height ........................................................................42 Repetitive Shear at Constant Height ..................................................................................44 Simple Shear at Constant Height .......................................................................................44 APA Rutting Test ...............................................................................................................46 Overall Ranking of Rut Susceptibility ...............................................................................48
Influence of Mix Variables on Test Results ........................................................................... 51 Multiple Regression Analysis ............................................................................................51 Classified Comparison of Mixtures ...................................................................................55
Summary of the Findings of Phase I Study ............................................................................ 59 Part II – Phase II Superpave Mixtures .................................................................................... 60
Aggregate Gradation Analysis ...........................................................................................60 Indirect Tensile Strength (ITS) Test ..................................................................................65 Indirect Tensile Resilient Modulus (Mr) Test ...................................................................67 Indirect Tensile (IT) Creep Test ........................................................................................70 Axial Creep Test ................................................................................................................72 Frequency Sweep at Constant Height Test ........................................................................74
x
Repetitive Shear at Constant Height (RSCH) Test ............................................................76 Simple Shear at Constant Height (SSCH) Test ..................................................................77 APA Rut Test .....................................................................................................................79 Variations of Volumetric Properties on Laboratory Test Results ......................................81 Overall Ranking of Rutting Susceptibility .........................................................................84
Summary of Findings of Phase II Study ................................................................................. 86 Part III – Grouping and Correlation Analyses of Fundamental Engineering Properties of
Superpave Mixtures ................................................................................................................ 87 Grouping Analysis .............................................................................................................87 Indirect Tensile Strength (ITS) Test ..................................................................................92 APA Rut Test .....................................................................................................................94
Correlations among Laboratory Test Results ......................................................................... 99 Field Rutting Measurements ................................................................................................. 107
CONCLUSIONS......................................................................................................................... 109 RECOMMENDATIONS ............................................................................................................ 113 REFERENCES ........................................................................................................................... 115 APPENDIX A ............................................................................................................................. 117
Fundamental Engineering Test Results ................................................................................ 117 APPENDIX B ............................................................................................................................. 125
Grouping Analysis on Fundamental Engineering Properties of Superpave Mixture ........... 125 Indirect Tensile Strength (ITS) Test ................................................................................125 Indirect Tensile (IT) Creep Test ......................................................................................127 Axial Creep Test ..............................................................................................................129 Indirect Tensile (IT) Resilient Modulus (Mr) Test ..........................................................133 Frequency Sweep at Constant Height Test ......................................................................135 Repetitive Shear at Constant Height (RSCH) Test ..........................................................138 Simple Shear at Constant Height (SSCH) Test ................................................................140 APA Rut Test ...................................................................................................................142

xi
LIST OF TABLES
Table 1 Project information and mixture designation................................................................... 14
Table 2 Job mix formula of Phase-I Superpave mixtures ............................................................. 17
Table 3 Job mix formula of Phase-II Superpave mixtures (level I & level II) ........................... 149
Table 4 Asphalt binder specifications ........................................................................................... 24
Table 5 Superpave binder specification test results (Phase-I) ...................................................... 25
Table 6 Mixture binder type and RAP percentage ........................................................................ 26
Table 7 Design volumetric data of Superpave mixtures ............................................................... 27
Table 8 Engineering property tests and protocols ......................................................................... 28
Table 9 Resilient modulus test results – statistical grouping for all Phase I mixes ...................... 34
Table 10 Resilient modulus test results – statistical grouping for classified Phase-I mixes ......... 35
Table 11 Indirect tensile strength test results - statistical grouping of all Phase-I mixes ............. 36
Table 12 Indirect tensile strength results - statistical grouping of classified Phase-I mixes ........ 37
Table 13 Axial creep test results - statistical grouping of all Phase-I mixtures ............................ 37
Table 14 Axial creep test results - statistical grouping of classified Phase-I mixes ..................... 40
Table 15 Creep slope from the indirect tensile creep test-statistical grouping of all Phase-I
mixes .............................................................................................................................. 41
Table 16 Creep slope from the indirect tensile creep test-statistical grouping of classified Phase I
mixes .............................................................................................................................. 42
Table 17 APA rutting test results at 60ºC- statistical grouping of all Phase I mixes. ................... 46
Table 18 Rank of rutting susceptibility from MTS test results ..................................................... 49
Table 19 Rank of rutting susceptibility from SST test results ...................................................... 49
Table 20 Variables significant on MTS test results at the 0.05 Level- stepwise multiple
regression analysis ......................................................................................................... 53
Table 21 Variables significant on SST test results at the 0.05 level- stepwise multiple regression
analysis ........................................................................................................................... 54
Table 22 Frequency of significant contributions of each mix variable at 0.05 level .................... 54
Table 23 Coefficients of determination, R2, between rut ranking and mix variables values ....... 56
Table 24 Comparison of rut ranking of HMAs with different NMAS (from MTS test results) ... 57
Table 25 Comparison of rut ranking of HMAs with different compaction levels (from MTS test
results) ............................................................................................................................ 57
Table 26 Comparison of rut ranking of HMAs with different NMAS (from SST test results) .... 58
Table 27 Comparison of rut ranking of HMAs with different compaction levels (from SST test
results) ............................................................................................................................ 58
Table 28 Results of Power-law regression analyses for the Phase-II Superpave mixtures .......... 62
Table 29 Ranking of rutting susceptibility from MTS test results—Phase II ............................... 85

xii
Table 30 Ranking of rutting susceptibility from SST test results—Phase II ................................ 85
Table 31 Groupings of Superpave mixtures ................................................................................. 87
Table 32 Overall test results (by MTS)......................................................................................... 88
Table 33 Overall test results (by SST and APA) .......................................................................... 90
Table 34 The statistics of ITS test results on mixtures by level ................................................... 93
Table 35 The statistics of APA test results on mixtures by level ................................................. 95
Table 36 Sensitivity of fundamental engineering test properties on Superpave mixture design
variables ......................................................................................................................... 97
Table 37 Correlation coefficients for all test results in this study………………………………100
Table 38 Field rutting performance ............................................................................................ 108

xiii
LIST OF FIGURES
Figure 1 Project locations ............................................................................................................. 13
Figure 2 Aggregate gradations of Superpave Level I mixtures with 19 mm NMAS ................... 21
Figure 3 Aggregate gradations of Superpave Level II mixtures with 19 mm NMAS .................. 21
Figure 4 Aggregate gradations of Superpave Level III mixtures with 19 mm NMAS ................. 22
Figure 5 Aggregate gradations of Superpave Level II mixtures with 25 mm NMAS .................. 22
Figure 6 Aggregate gradations of Superpave Level III mixtures with 25 mm NMAS ................. 23
Figure 7 IT resilient modulus versus temperature (Phase-I) ......................................................... 35
Figure 8 Creep stiffness from axial creep test at 40ºC .................................................................. 38
Figure 9 Slope from axial creep test at 40ºC ................................................................................ 39
Figure 10 Permanent strain from axial creep test at 40ºC ............................................................. 40
Figure 11 Slopes from the FSCH test at 48ºC .............................................................................. 43
Figure 12 Complex Shear Modulus of FSCH test at 0.01 Hz and 48ºC ....................................... 43
Figure 13 Permanent shear strain of repeated shear at constant height test at 48ºC ..................... 44
Figure 14 Permanent shear strain of simple shear at constant height test at 48ºC ........................ 45
Figure 15 APA rut depths at 60ºC (Phase-I) ................................................................................. 47
Figure 16 Rutting susceptibility ranking from MTS tests results ................................................. 50
Figure 17 Rutting susceptibility ranking from SST tests results .................................................. 50
Figure 18 Conceptual differences between fine and coarse gradation [12] .................................. 61
Figure 19 (a) and (b) Power-law predicted gradation parameters ................................................ 63
Figure 20 Relationships between gradation parameters and sieve percent passing ...................... 64
Figure 21 Results of the IT strength test ....................................................................................... 65
Figure 22 Gradation analysis on ITS test results for 19 mm high-volume mixtures .................... 67
Figure 23 IT Mr test results at 5oC ................................................................................................ 68
Figure 24 IT Mr test results at 25oC .............................................................................................. 69
Figure 25 IT Mr test results at 40oC .............................................................................................. 69
Figure 26 Gradation analysis on IT Mr test results at 40oC .......................................................... 70
Figure 27 Indirect tensile creep test results................................................................................... 71
Figure 28 Gradation analysis on IDT creep slopes of 19 mm high-volume mixtures .................. 72
Figure 29 Axial creep test results.................................................................................................. 73
Figure 30 Gradation analysis on axial creep slopes of high-volume mixtures ............................. 74
Figure 31 Complex shear modulus test results at 60ºC ................................................................ 75
Figure 32 Gradation analysis on G*10Hz /sin () of high-volume mixtures at 60ºC ...................... 76
Figure 33 RSCH permanent shear strain test results at 60ºC ........................................................ 76
Figure 34 Gradation analysis on RSCH test results of high-volume mixtures at 60ºC ................ 77
Figure 35 SSCH permanent shear strain test results at 60ºC ........................................................ 78

xiv
Figure 36 Gradation analysis on SSCH test results at 60ºC of 19 mm high-volume mixtures .... 78
Figure 37 APA test results at 60ºC ............................................................................................... 79
Figure 38 Gradation analysis on APA test results at 60ºC of high-volume mixtures ................... 80
Figure 39 Variation of VMA and ar voids with RSCH Permanent Shear Strain at 60ºC ............. 81
Figure 40 Variation of VMA and air voids with FSCH tests at 60ºC properties .......................... 81
Figure 41 Variation of VMA and air voids with ITS at 25ºC, IT and axial creep at 40ºC test
properties..................................................................................................................... 83
Figure 42 Mean IT strength test results of mixtures at different compaction levels .................... 92
Figure 43 Mean IT strength test results of mixtures at different groups ...................................... 93
Figure 44 Mean APA rut depths of mixtures at different compaction levels ............................... 95
Figure 45 Mean APA rut depths of mixtures at different groupings ............................................ 96
Figure 46 Relationship between APA and RSCH tests at 60ºC ................................................... 99
Figure 47 Relationship between RSCH and FSCH tests at 60ºC ............................................... 101
Figure 48 Relationship between SSCH and FSCH tests at 60ºC ................................................ 102
Figure 49 Relationship between SSCH and RSCH tests at 60ºC ............................................... 103
Figure 50 Relationship between ITS and IT creep tests ............................................................. 104
Figure 51 Relationship between ITS and IT Mr tests ................................................................. 106
Figure 52 Field rutting measurements ........................................................................................ 107

INTRODUCTION
Background
Asphalt concrete mixtures have been used on pavements for more than a century. Asphalt
mixtures combine bituminous binder and aggregate to produce a pavement structure that is
flexible over a wide range of climatic conditions. Since the discovery of the petroleum
asphalt refining process and the growth of the interstate system, asphalt mixtures have seen
widespread use in pavement applications in the United States (i.e., asphalt binder usage
increased from less than 3 million tons in 1920 to more than 30 million tons in 2000 [1]).
Currently, more than 93 percent of all the road surfaces in the U.S. are paved with asphalt
mixtures.
The design of asphalt mixtures evolved with its increased use. In the early 1900s, engineers
designed asphalt mixtures based totally on their personal experiences. Three major asphalt
mixture design methods were developed in the United States in the first half of the twentieth
century: the Hubbard-Field method, the Marshall mix design method, and the Hveem mix
design method [1]. The Hubbard-Field method was originally developed in the 1920s for
sheet asphalt mixtures with 100 percent passing the 4.75 mm sieve and later modified to
cover the design of coarser asphalt mixtures. The Hubbard-Field Stability test is a laboratory
test that measures the strength of the asphalt mixture with a punching-type shear load. The
Hveem mix design method was developed by the California Department of Highways
materials and design engineer in the 1930s. The Hveem stabilometer measures an asphalt
mixture’s ability to resist lateral movement under a vertical load. The Hveem mix design is
still used in California and other western states. The Marshall mix design was originally
developed by a Mississippi State Highway Department engineer and refined in the 1940s by
the Corps of Engineers for designing asphalt mixtures for airfield pavements. The primary
features of the Marshall mix design are a density/voids analysis and the stability test. The
optimum asphalt content is determined by the ability of a mix to satisfy stability, flow, and
volumetric properties. According to a survey done in 1984, approximately 75 percent of the
state highway departments used some variation of the Marshall method, while the remaining
25 percent used some variation of the Hveem method [2].
The Marshall and Hveem mix design methods have played important roles in the traditional
asphalt mix design; however, both of them are based on empirical relationships and do not
produce fundamental engineering properties of the compacted asphalt mixture that are related
to pavement design and performance. Establishing uniform specifications for different areas
is also difficult. Despite the best efforts put into those existing mix design methods, severe
rutting and cracking are common in asphalt pavements, due to abruptly increased traffic

2
loads in terms of increased vehicle-miles, higher tire pressure, and varying environmental
conditions (from very cold to hot regions). Against this background of declining performance
and durability in pavements (including both asphalt and Portland concrete), the Strategic
Highway Research Program (SHRP) was approved by Congress in 1987 to improve the
performance and durability of United States roads and make those roads safer for both
motorists and highway workers [1].
Superpave Mix Design – Research and Implementation
SHRP was established by Congress in 1987 as a five year, $150 million research program to
improve the performance and durability of highways in the United States. One third of the
$150 million research fund of SHRP was spent on asphalt cement and concrete research to
develop a system that would relate the material characteristics of hot mix asphalt to pavement
performance. The final product was a new system called Superpave, short for Superior
Performing Asphalt Pavements. Superpave represents an improved system for specifying
asphalt binders and mineral aggregates, developing asphalt mixture design, and analyzing
and establishing pavement performance prediction. It incorporates performance-based
asphalt material characterization according to the design environmental conditions to
improve performance by controlling rutting, low temperature cracking, and fatigue cracking.
The Superpave mix design method can be divided into two stages: Superpave mix design
(Level 1) and Superpave abbreviated and complete mix analysis (Levels 2 and 3). Superpave
Level 1 mix design is an improved material selection and volumetric mix design process.
Level 2 mix design procedures use the volumetric mix design as a starting point and include
a battery of performance tests to arrive at a series of performance predictions. Level 3 mix
design includes a more comprehensive array of tests and results to achieve a more reliable
level of performance prediction [1]. Currently, only Level 1 (renamed as volumetric) mix
design is a mature procedure.
In the first stage of Superpave mix design (Level 1), asphalt mixes are designed by a method
similar to the traditional volumetric proportioning but with a different type of compaction
device— the Superpave Gyratory Compactor (SGC). The mixtures are ultimately evaluated
in terms of a desired level of performance. In the second stage of Superpave (Levels 2 and 3)
abbreviated and complete mix analysis, different material tests are performed with the
Superpave Shear Tester (SST) and the Indirect Tensile Tester (IDT). Fundamental
engineering properties are obtained through these tests. The material parameters are applied
to sophisticated Superpave performance prediction models. These models consider not only
the materials characteristics but also the pavement structure and seasonal environmental
changes. Performance testing utilizes new equipment and procedures to ensure that
Superpave mixtures exhibit acceptable amounts of the distress types that were considered by
3
SHRP researchers: permanent deformation, fatigue cracking, and low temperature cracking
[3]. However, this second stage of Superpave abbreviated and complete mix analysis has not
been fully implemented and is currently under evaluation. The Federal Highway
Administration (FHWA) made a significant decision related to this Superpave process
element. Basically, more research is necessary to perfect this prediction process. Substantial
corrections and enhancements are considered mandatory to make the performance prediction
models and analysis software reliable and suitable for general use by the industry [4].
Highway agencies across the country are gaining experience as the Superpave system
continues to progress from research to implementation. A multitude of new developments
helps to continuously refine the system, providing guidance in construction practices and
encouraging continued implementation. By 2002, the Performance Graded binder
specifications had been fully implemented in 47 states and the District of Columbia. At least
30 states have adopted the consensus aggregate properties outlined in the Superpave system.
At least 33 states have implemented Superpave mix design. And 13 states report
implementation is on the way. Only four states (California, Idaho, Nevada, and Rhode
Island) do not currently have firm implementation plans [5].
Implementation activities for the Superpave binder specification and mix design are likely to
continue for the next several years. The Superpave mix analysis, however, has not been
implemented and is currently under evaluation because further research is needed in the
performance prediction models. While the Superpave software is available, some research
has been done and is currently underway seeking to correlate test parameters and
performance.
A major investigation that involved Superpave mixes was ALF/WesTrack Accelerated
Performance Testing. WesTrack is the FHWA’s test facility in Nevada for developing
performance related specifications for hot-mix asphalt pavement construction. When coarse-
graded Superpave sections placed at the track in June of 1997 had very rapid rutting failures,
a forensic team composed of academicians, asphalt industry representatives, and state
highway agency engineers was assembled to study the early failures and, if appropriate,
make recommendations for revising the Superpave procedures [6]. Roadway samples were
taken from 11 sections (out of the original 26 sections placed) to evaluate the properties of
the in-place mixtures and compare these data to initial production test results. Another set of
cores was examined on four rut testers (French, Hamburg, Asphalt Pavement Analyzer, and
PurWheel) and the Superpave Shear Tester to determine if test results from these devices
correlated well with actual track performance. All of the mixes were 19 mm nominal
maximum aggregate size. Nine sections were coarse-graded Superpave mixes containing an

4
unmodified performance grade PG 64-22 binder. The other two sections were Nevada DOT
mixes that contained a very different aggregate gradation and an AC-20P SBS modified
binder. The Nevada mixes were designed using Hveem mixture design criteria.
Among the forensic team’s conclusions was that the principal cause of rutting at WesTrack
was a relatively high design binder content, which resulted from high VMA values in
conjunction with relatively low mastic stiffness. Of the 11 mixes evaluated, the mixture with
the least rutting had a low binder content, high dust to binder ratio, and relatively low VMA.
The Nevada DOT mixtures, which had low binder contents and low design VMA, performed
better than the replacement coarse-graded mixtures. The forensic team also found that
resistance of the coarse-graded Superpave mixes to rutting was significantly affected by in-
place density. Therefore, they recommended, among other things, that for coarse-graded
mixes (below the restricted zone), the dust to binder ratio should be set at 0.8 to 1.6, in
contrast to the current setting at 0.6 to 1.2 in AASHTO provisional specification MP2-97.
For coarse-graded Superpave mixtures, the VMA should be restricted to two percent above
the minimum value. AASHTO MP2-97 currently sets minimum VMA requirements for
mixes but does not set maximums.
Mogawer and Stuart performed a study by using the Federal Highway Administration's
Accelerated Loading Facility (ALF) to validate the Superpave binder parameter for rutting
and several mixture tests that have been developed to predict rutting susceptibility [7]. Five
binders with Superpave Performance Grades of 58-34, 58-28, 64-22, 76-22, and 82-22 were
used. All five binders were used with a gradation having a nominal maximum aggregate size
of 19.0 mm. In addition to the ALF, the French Pavement Rutting Tester, Georgia Loaded-
Wheel Tester, Hamburg Wheel-Tracking Device, and the cumulative permanent strains from
a repeated load test were used in the investigation. Results from all tests ranked the five
surface mixtures similarly based on the average data. Rankings based on statistics were
different, and no laboratory mixture test was clearly the best test based on ALF. In this study,
binders with higher rutting factors, as measured by G*/sin delta, generally provided mixtures
with lower rutting susceptibilities for a given nominal maximum aggregate size. They also
observed that the increase in nominal maximum aggregate size significantly decreased
rutting susceptibility based on ALF. None of the laboratory mixture tests they utilized
adequately predicted this effect.
An article by Kuennen reports that, after the first years of in-field experience with Superpave
pavements, Superpave mixes in certain regions of the country are performing well, even
though they include aggregate fines that fall within the restricted zone. However, there have
5
been cases where compacting Superpave pavements lifts can be more complicated than
conventional pavements [8].
In an investigation aimed to evaluate and compare three methods for classifying aggregate
particle shape and texture —AASHTO TP33 (ASTM C1252), ASTM D3398 (Index of
Particle Shape and Texture), and the flow rate method— Khosla et al. found that, within the
range of mineral filler content and type used in their study (four natural river sands and a
crushed granite), increasing the amount of mineral filler had a beneficial effect on the rutting
performance. They recognized that, although the rutting performance is enhanced, it should
be noted that the asphalt content is reduced at a higher mineral filler content, which may have
a detrimental effect on other mixture properties such as fatigue, thermal cracking, and
ravelling [9].
Lancaster and Shatnawi conducted a field and laboratory evaluation of the volumetric (Level
I) Superpave mix design procedure. The evaluation consisted of constructing field test
sections in January 1996 and conducting various laboratory performance tests. The
performance testing included repetitive simple shear tests at a constant height, frequency
sweep tests at a constant height, repetitive direct tension, and Laboratoire Central des Ponts
et Chausses wheel tracking testing [10]. Lancaster and Shatnawi concluded that all mixes
placed on their project would be anticipated to perform adequately. Field performance has
supported the laboratory findings.
At present, Superpave mixture design is still based solely on volumetric design
specifications. One of the major control parameters in the Superpave volumetric design is the
percentage of voids in the mineral aggregate (VMA). Several researchers and highway
agencies have reported that difficulties exist in meeting the minimum VMA requirements
[11-13]. Recent studies [13, 14] showed that the VMA requirement based on nominal
maximum aggregate size does not take into account the gradation of the mixture, ignores the
film thickness of the asphalt binder, and is thus insufficient to correctly differentiate good
performing mixtures from poor performing ones. Meanwhile, higher VMA mixtures cannot
guarantee to provide better Superpave mixtures that are durable and more fatigue and rut
resistant than the lower ones [15]. Further, Kandhal et al. [11] suggested a minimum average
asphalt film thickness be used instead of minimum VMA to ensure mix durability.
The importance of aggregate characteristics has been emphasized in the Superpave mixture
design procedure. Certain gradation limits, including the restricted zone, for different
nominal maximum size aggregates have been put into Superpave gradation guidelines. The
restricted zone was meant to be a guide for establishing the gradation of a mixture, but many

6
states have found that the restricted zone has rejected many mixes that had been used
successfully in the past [16]. Based on the recommendations from the NCHRP Project 9-14,
“Investigation of the Restricted Zone in the Superpave Aggregate Gradation Specification,”
the restricted zone has been eliminated entirely from the Superpave mixture design system by
the Superpave Expert Task Group (ETG).
Most states currently accept both coarse-graded (gradation below the restricted zone) and
fine-graded (gradation above the restricted zone) Superpave mixtures [17-19]. A rutting
susceptibility study [19] indicated that no significant differences in rut potential occurred
between two coarse-graded and fine-graded asphalt mixtures. In his study, Anderson [10]
showed that (1) at 13 percent VMA, the coarse mixture has higher shear stiffness, higher
critical temperature, and lower estimated rut depth than the fine mixture. At 15 percent
VMA, the coarse mixture still has a lower estimated rut depth than the fine mixture but has a
substantially lower shear stiffness and critical temperature; (2) in repeated shear tests, the
coarse mixture indicated no significant difference in rutting characteristics between 13
percent and 15 percent VMA. However, there is significant difference between the rutting
characteristics of a fine mixture with 13 percent VMA and a fine mixture with 15 percent
VMA; (3) in shear frequency sweep test, the stiffness and critical temperature of the coarse
mixture decreased substantially as the VMA increased. The coarse mixture appeared much
more sensitive to VMA than did the fine mixture. As reported by Nukunya et al. [20], VMA
did not appear to be related to age-hardening rate (durability), fracture resistance, or rutting
resistance for coarse-graded mixtures. Factors such as gradation void structure, and perhaps
film thickness, appeared to have a stronger effect on these characteristics. Therefore, the need
for definitive guidelines for the selection of suitable aggregate gradation, either coarse-
graded or fine-graded, becomes apparent, especially when premature pavement failures such
as early rutting occur shortly after construction [21].
Superpave is a totally new system, which requires new equipment and test procedures. Little
experience has been accumulated in Louisiana. In an effort to implement the Superpave
system in Louisiana, the Louisiana Department of Transportation and Development’s
(LADOTD) Asphalt Concrete Hot Mix Specification Committee established seven
subcommittees to develop an implementation plan. The first phase of the implementation
plan included nine field projects throughout the state, which were designed and constructed
between August 1997 and December 1998 utilizing the Superpave specification. In the
advent of the modified Superpave specification (modified gyration design table [Ndesign]),
another twelve projects were chosen and constructed between 1999 and 2000 as the second
phase of Superpave implementation in Louisiana. The goal of this project is to provide a
clearer understanding of the fundamental engineering properties of those Superpave mixtures

7
implemented through a suite of comprehensive material tests. This report documents those
fundamental engineering properties in detail and analyzes the performance of Superpave
mixtures based on volumetric and engineering properties. This data will aid in the overall
knowledge of the critical performance components of HMA mixtures. The knowledge and
experience obtained from this project will facilitate the future complete implementation of
the Superpave mixture design method in the state of Louisiana.

9
OBJECTIVES
The primary objective of this research was to evaluate the fundamental engineering
properties and mixture performance of Superpave HMA mixtures in Louisiana through
laboratory mechanistic tests, aggregate gradation analysis, and field performance. A
secondary objective of this investigation was to ascertain mix design variables on mixture
performance. The following were the specific objectives of the proposed study:
Conduct Superpave Shear Tester (SST) tests on the selected asphalt mixtures to
evaluate rutting performance in terms of mixture resistance to shear flow (complex
shear modulus/phase angle, permanent shear strain, etc.).
Conduct Indirect Tension (IT) tests to characterize the fundamental engineering
properties of the selected asphalt mixtures in terms of tensile strength, resilient
modulus, and axial and indirect tensile creep compliance.
Conduct simulative rut tests using the Asphalt Pavement Analyzer (APA), and
compare the results to other fundamental engineering tests.
Study aggregate gradation curves on the selected asphalt mixtures, and correlate the
characteristics of gradation curves of the selected asphalt mixtures to their
fundamental engineering properties.
Correlate volumetric variables (e.g., air void, VMA, and VFA) of the selected asphalt
mixtures to their fundamental engineering properties.
Compare early field performance to laboratory engineering test results.


11
SCOPE
This project included 30 Superpave mixtures selected from 21 field implementation projects
in Louisiana. Fourteen of these projects were designed for high volume traffic (greater than
30 million ESALs), 12 for intermediate volume traffic (3 to 30 million ESALs), and the rest
for low volume traffic (less than 3 million ESALs). Seven fundamental engineering tests
were performed on those mixtures in order to obtain their fundamental engineering
properties; those tests included four MTS tests: axial creep, indirect tensile creep, indirect
tensile strength and strain, and resilient modulus, and three Superpave Shear Tester (SST)
tests: frequency sweep at constant height (FSCH), simple shear at constant height (SSCH),
and repeated shear at constant height (RSCH). In addition, a rut simulative test, the Asphalt
Pavement Analyzer (APA) wheel load test, was also employed to directly evaluate the rut
susceptibility of those Superpave mixtures.


13
METHODOLOGY
Projects Identification
Figure 1 presents the locations of 21 Superpave implementation projects considered for this
study; a total of 30 Superpave mixtures, from either wearing course or binder course, were
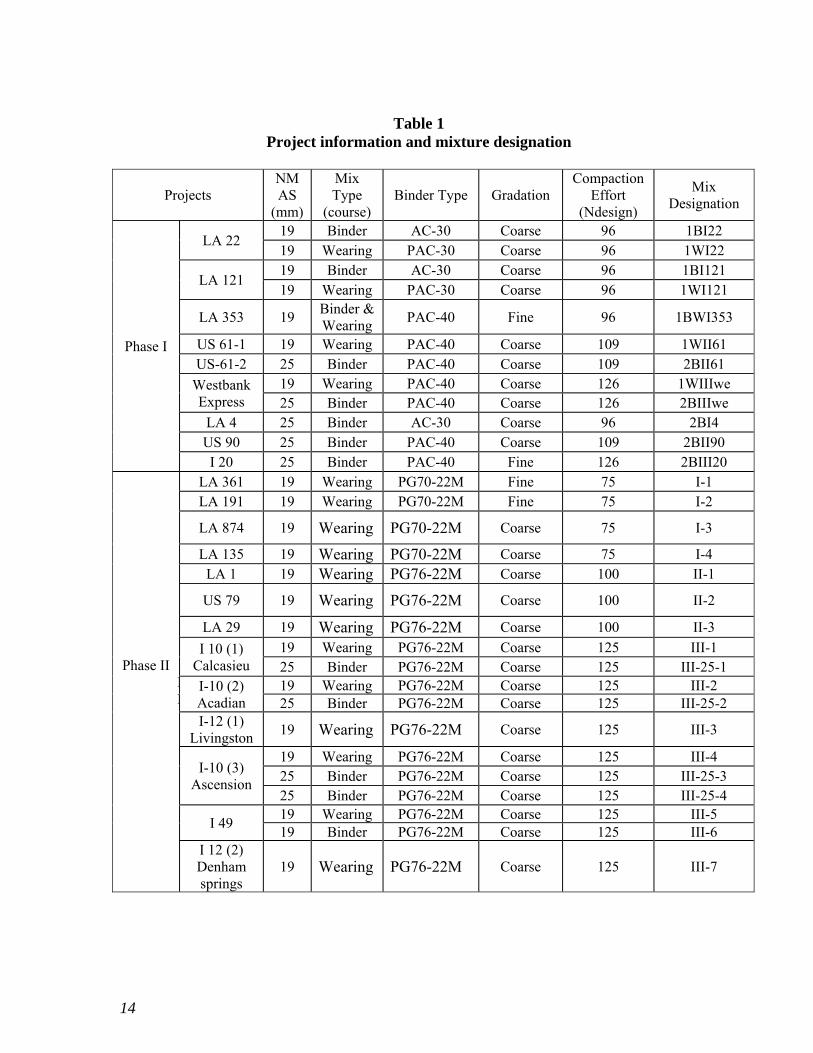
selected. Table 1 presents the general information about these projects as well as the
corresponding mixture designations. According to different design and implementation time
histories, these projects can be further categorized into two groups: Phase I—eight projects
constructed between 1997 and 1998, and Phase II—thirteen projects constructed between
1999 and 2001.
Figure 1 Project locations
I-10 (1) I-10 (2)
I-12 (1) & (2)
I-10 (3)
LA 1
LA 191
LA 29
Westbank Express
LA 353
LA 4 LA 135
I-20
US 61 I-49
LA 121
US 79
LA 361
LA 874
US 90
LA 22
14
Table 1
Project information and mixture designation
Projects NMAS
(mm)
Mix Type
(course) Binder Type Gradation
Compaction Effort
(Ndesign)
Mix Designation
Phase I
LA 22 19 Binder AC-30 Coarse 96 1BI22 19 Wearing PAC-30 Coarse 96 1WI22
LA 121 19 Binder AC-30 Coarse 96 1BI121 19 Wearing PAC-30 Coarse 96 1WI121
LA 353 19 Binder & Wearing
PAC-40 Fine 96 1BWI353
US 61-1 19 Wearing PAC-40 Coarse 109 1WII61 US-61-2 25 Binder PAC-40 Coarse 109 2BII61
Westbank Express
19 Wearing PAC-40 Coarse 126 1WIIIwe 25 Binder PAC-40 Coarse 126 2BIIIwe
LA 4 25 Binder AC-30 Coarse 96 2BI4 US 90 25 Binder PAC-40 Coarse 109 2BII90 I 20 25 Binder PAC-40 Fine 126 2BIII20
Phase II II
LA 361 19 Wearing PG70-22M Fine 75 I-1 LA 191 19 Wearing PG70-22M Fine 75 I-2
LA 874 19 Wearing PG70-22M Coarse 75 I-3
LA 135 19 Wearing PG70-22M Coarse 75 I-4 LA 1 19 Wearing PG76-22M Coarse 100 II-1
US 79 19 Wearing PG76-22M Coarse 100 II-2
LA 29 19 Wearing PG76-22M Coarse 100 II-3
I 10 (1) Calcasieu
19 Wearing PG76-22M Coarse 125 III-1 25 Binder PG76-22M Coarse 125 III-25-1
I-10 (2) Acadian
19 Wearing PG76-22M Coarse 125 III-2 25 Binder PG76-22M Coarse 125 III-25-2
I-12 (1) Livingston
19 Wearing PG76-22M Coarse 125 III-3
I-10 (3) Ascension
19 Wearing PG76-22M Coarse 125 III-4 25 Binder PG76-22M Coarse 125 III-25-3 25 Binder PG76-22M Coarse 125 III-25-4
I 49 19 Wearing PG76-22M Coarse 125 III-5 19 Binder PG76-22M Coarse 125 III-6
I 12 (2) Denham springs
19 Wearing PG76-22M Coarse 125 III-7

15
Phase I Projects
Phase I includes 12 Superpave mixtures. As shown in Table 1, the nominal maximum
aggregate size (NMAS) of those mixtures was either 19 or 25 mm. Three types of asphalt
binders, one conventional viscosity graded AC-30, and two polymer-modified asphalt
binders meeting LADOTD specifications for PAC-30 and PAC-40 were used in those
mixtures. The Superpave mix design was followed by the AASHTO PP-28 (1994) “Standard
Practice for Designing Superpave HMA.” It is important to note that Phase I Superpave
mixtures in this study were designed according to the original Superpave gyratory
compaction table in the Superpave mix design system. It included three design traffic levels:
low, medium, and high volumes. The Ninitial, Ndesign, and Nmax were 7, 96, and 152 gyrations;
8, 109, and 174 gyrations; and 9, 126, and 204 gyrations for the low, medium, and high
volume mixtures, respectively.
Phase II Projects
Phase II consists of 18 Superpave mixtures selected from 12 field implementation projects.
Similar to those in Phase I, two types of NMAS mixtures were selected in Phase II. The 19-
mm mixture is designed for wearing course, and the 25-mm mixture for binder course. The
Superpave mixture design still followed the AASHTO PP-28 but used the updated Superpave
design gyration table [22]. It included three design traffic levels: low (less than 3 million
ESALs), intermediate (3-30 million ESALs), and high volume (greater than 30 million
ESALs). The Ninitial, Ndesign, and Nmax for the three traffic level mixtures were 7, 75, and 115
gyrations; 8, 100, and 160 gyrations; and 9, 125, and 205 gyrations, respectively. Two
elastometric polymer-modified asphalt binders meeting the Louisiana PG Specifications [13]
of 70-22M and 76-22M were used. The PG 70-22M binder was used for low volume
mixtures, whereas, PG 76-22M was specified for intermediate volume and high volume
mixtures.
Asphalt Mixtures
Superpave mixtures evaluated in this study were plant produced mixtures. Contractors, upon
the approval of the LADOTD, designed and supplied the plant mixed mixtures for use in this
study. As stated earlier, all Superpave mixtures were designed according to the AASHTO
PP-28 specification.
Job Mix Formula
Tables 2 and 3 present the job mix formulas (JMFs) for the 12 Phase I and 18 Phase II
Superpave mixtures, respectively. As shown in Tables 2 and 3, most of those mixtures used
16
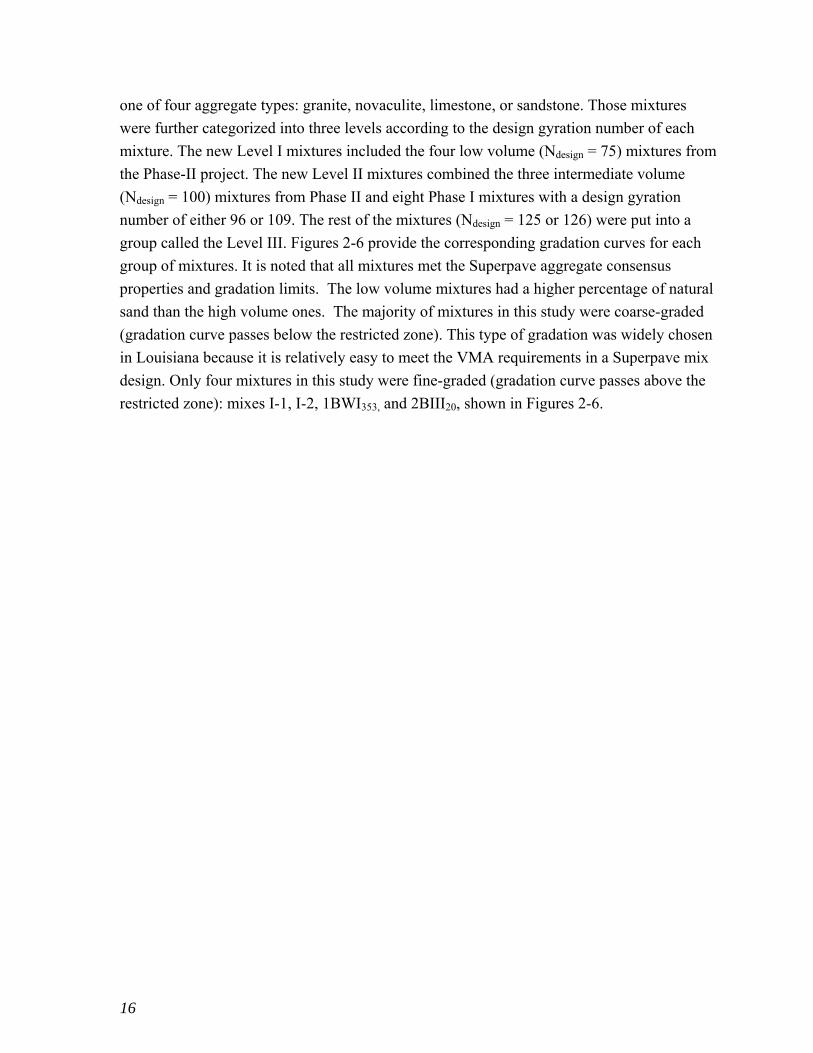
one of four aggregate types: granite, novaculite, limestone, or sandstone. Those mixtures
were further categorized into three levels according to the design gyration number of each
mixture. The new Level I mixtures included the four low volume (Ndesign = 75) mixtures from
the Phase-II project. The new Level II mixtures combined the three intermediate volume
(Ndesign = 100) mixtures from Phase II and eight Phase I mixtures with a design gyration
number of either 96 or 109. The rest of the mixtures (Ndesign = 125 or 126) were put into a
group called the Level III. Figures 2-6 provide the corresponding gradation curves for each
group of mixtures. It is noted that all mixtures met the Superpave aggregate consensus
properties and gradation limits. The low volume mixtures had a higher percentage of natural
sand than the high volume ones. The majority of mixtures in this study were coarse-graded
(gradation curve passes below the restricted zone). This type of gradation was widely chosen
in Louisiana because it is relatively easy to meet the VMA requirements in a Superpave mix
design. Only four mixtures in this study were fine-graded (gradation curve passes above the
restricted zone): mixes I-1, I-2, 1BWI353, and 2BIII20, shown in Figures 2-6.

17
Table 2
Job mix formula of Phase-I Superpave mixtures
Mix Designation I20-B US90-B US61-B WE-B LA4-B US61-W LA22-B LA121-W WE-W LA121-B LA22-W LA353
Job Mix Formula
Asphalt 3.3%PAC40 4.1%PAC40 3.5%PAC40 3.1%PAC40 4.0%AC30 4.2%PAC40 4.2%AC30 4.7%PAC30 4.6%PAC40 3.7% AC30 4.6%PAC30 4.7%PAC40
Aggregate
30%1.5”BR 41%#5LS 38%#5LS 50%#5LS 46%1/2”+ 30%#11LS 55%#78LS 45%#78LS 48%#67SS 37%#78LS 50%#78LS 32%NV
20%5/8”BR 19%#68LS 32%#8LS 19%#RAP 20%1/2”- 29%#67LS 15%RAP 24%#67LS 34%#11LS 22%#67LS 30%#11LS 28%GR
19%RAP 11%#57LS 14%RAP 17%#78LS 19%RAP 19%#8SS 12%#67LS 22%#11LS 18%#78LS 19%RAP 15%#67LS 10%CS
7%FS 14%RAP 9%#11LS 14%#11LS 15% screen 12%#78LS 8%#11LS 9%Sand 17%#11LS 5%CS 5%FS
24% screens 15%#11LS 7%CS 10%CS 10%Sand 5%CS
Gradation
Sieve Size (mm)
% Passing
37.5 100 100 100 100 100 100 100 100 100 100 100 100 25 98 96 97 96 98 100 100 100 100 100 100 100 19 84 84 86 84 81 98 98 98 93 98 98 97
12.5 72 61 73 60 68 84 87 83 76 84 86 86 9.5 61 47 66 46 54 71 66 62 61 64 66 72 4.75 42 28 40 29 36 43 31 32 35 35 36 51 2.36 35 19 22 21 22 29 23 23 22 25 25 40 1.18 26 15 16 15 18 20 19 18 15 17 32 0.6 21 12 13 12 12 16 16 14 10 15 13 25 0.3 16 8 10 9 8 10 9 8 8 9 8 16
0.075 4.6 4.4 5 4.7 4.4 5 3.8 3.8 5 4.3 4.6 5.1

18
Table 2 (cont.) Job mix formula of Phase-I Superpave mixtures
Mix Designation I20-B US90-B US61-B WE-B LA4-B US61-W LA22-B LA121-W WE-W LA121-B LA22-W LA353
Job Mix Formula
Asphalt 3.3%PAC40 4.1%PAC40 3.5%PAC40 3.1%PAC40 4.0%AC30 4.2%PAC40 4.2%AC30 4.7%PAC30 4.6%PAC40 3.7% AC30 4.6%PAC30 4.7%PAC40
Aggregate
30%1.5”BR 41%#5LS 38%#5LS 50%#5LS 46%1/2”+ 30%#11LS 55%#78LS 45%#78LS 48%#67SS 37%#78LS 50%#78LS 32%NV 20%5/8”BR 19%#68LS 32%#8LS 19%#RAP 20%1/2”- 29%#67LS 15%RAP 24%#67LS 34%#11LS 22%#67LS 30%#11LS 28%GR
19%RAP 11%#57LS 14%RAP 17%#78LS 19%RAP 19%#8SS 12%#67LS 22%#11LS 18%#78LS 19%RAP 15%#67LS 10%CS 7%FS 14%RAP 9%#11LS 14%#11LS 15% screen 12%#78LS 8%#11LS 9%Sand 17%#11LS 5%CS 5%FS
24% screens 15%#11LS 7%CS 10%CS 10%Sand 5%CS
Design air void, % 4.3 4.0 3.9 3.9 4.0 4.3 3.7 4.3 3.8 4.2 3.9
VMA,% 13.4 13.9 13.1 13.7 14.0 13.4 14.3 14.1 13.5 14.1 14.1
VFA,% 67.9 71.2 70.2 71.6 71.7 67.9 74.5 69.8 71.9 70.7 72.4
CAA,% 100 100 99 100 97 100 100 100 100 100
FAA,% 48 45 46 48 44 49 48 42 Flat & Elongated,
%(5:1) 1 1 1 0 0 0 0 0 0 1
Natural Sand,% 7 6.9 10 10 9 0 5 5 15
Gradation
Sieve Size (mm) %Passing 37.5 100 100 100 100 100 100 100 100 100 100 100 100 25 98 96 97 96 98 100 100 100 100 100 100 100 19 84 84 86 84 81 98 98 98 93 98 98 97
12.5 72 61 73 60 68 84 87 83 76 84 86 86 9.5 61 47 66 46 54 71 66 62 61 64 66 72 4.75 42 28 40 29 36 43 31 32 35 35 36 51 2.36 35 19 22 21 22 29 23 23 22 25 25 40 1.18 26 15 16 15 18 20 19 18 15 17 32 0.6 21 12 13 12 12 16 16 14 10 15 13 25 0.3 16 8 10 9 8 10 9 8 8 9 8 16
0.075 4.6 4.4 5 4.7 4.4 5 3.8 3.8 5 4.3 4.6 5.1

19
Table 3 Job mix formula of Phase-II Superpave mixtures (level I & level II)
Mix Designation I-1 I-2 I-3 I-4 II-1 II-2 II-3
Job Mix Formula
Asphalt 4.6%BM1* 4.7%BM1* 4.5%BM1* 5%BM1* 4.8%BM2* 5.1%BM2* 4.4%BM2*
Aggregate
30%#67Gr 25%Rh 25%#67LS 16%LS 32% -1”Nova 26% -1”Nova 27%#67LS 35%#78Gr 40%Rh 10%#8LS 34%LS 21% -3/4”Nova 14%-3/4”Nova 40%#78LS 20%#11Gr 10%C/S 14%C/S 40%LS 37%Screening 14%12.5mm 25%#11LS
11%C/S 5%F/S 51%#11LS 10%C/S 10%C/S 36%Screening 8%C/S 4%F/S 20%Rh 10%C/S
Design air void, % 4.0 4.0 4.5 4.1 4.0 4.0 4.3 VMA,% 13.8 13.5 14.6 13.9 13.9 15.0 13.9 VFA,% 71.3 70.7 69.2 70.4 71.5 73.6 69.0 CAA,% 100 100 100 100 100 100 100 FAA,% 46 45 46 45 45 45 45
Flat & Elongated, %(5:1)
0 1 1 1 0 1 0
Natural Sand,% 15 15 14 10 10 10 8
Gradation
Sieve Size (mm) % Passing 25 100 100 100 100 100 100 100 19 97 98 99 97 97 96 98
12.5 84 86 88 85 82 84 83 9.5 72 73 82 68 69 73 63 4.75 52 54 53 45 44 50 35 2.36 44 42 32 31 31 35 25 1.18 37 36 23 22 22 22 19 0.6 29 29 14 17 16 17 15 0.3 17 17 8 11 10 12 8
0.075 4.8 4.8 3.8 4 4 5.2 3.8 *BM1 is PG70-22M, BM2 is PG 76-22M

20
Table 3 (Cont.)
Job mix formula of Phase-II Superpave mixtures (level III)
Mix Designation III-1 III-2 III-3 III-4 III-5 III-6 III-7 III-25-1 III-25-2 III-25-3 III-25-4
Job Mix Formula
Asphalt 4.5%BM2 4.6%BM2 5%BM2 4.5%BM2 4.5%BM2 4.5%BM2 4.9%BM2 4.2%BM2 4.3%BM2 3.8%BM2 4.0%BM2
Aggregate
42%#67SS 20%#67LS 24.3%W.C 25%LS 25%#67LS 30.4%#67L
S 26%#67 52%LS 37%#5LS 44.1%#5 LS 36%#5LS
35%#78LS 14%#78LS 12.2%#67S
LS 25%LM 18%#78LS 24%#78LS 44%#78 28%#78LS 36%#78LS
15.2%#78LS
21%#78LS
8%C/S 45%#78SS 18.6#11SLS 45%LS 47%#1-1 LS 20%RAP 15%SmCr 11%#11LS 12%RAP 21.2%#11L
S 28%#11LS
15%BS 16%LS 39.8%#67 5%CO 10%C/S 20%#1-1 LS 6%C/S 9%C/S 11%LS 4.2%CO 15%RAP
5%C/S 5.1%CO 5.6%C/S 9%SS 4%C/S 15.3%RAP
Design air void, % 4.5 4.1 4.0 4.0 4.2 4.1 4.1 4.1 4.4 4.1 4.0
VMA,% 13.7 13.7 14.9 13.5 14.1 13.9 14.2 12.9 13.3 12.8 13.0
VFA,% 67.4 70.1 73.1 70.4 70.5 70.8 71.2 68.5 66.9 68.3 69.2
CAA,% 100 100 100 100 100 97 97 100 100 100 100
FAA,% 50 45 38 48 45 45 45 45 44 47 49
Flat & Elongated, %(5:1)
0 0 1 1 0 0 0 0 0 1 2
Natural Sand,% 23 5 5.1 5 10 5.6 6 9 4 4.2 0
Gradation
Sieve Size (mm) % Passing
37.5 100 100 100 100 100 100 100 100 100 100 100 25 100 100 100 100 100 100 100 93 96 97 97
19 93 97 98 96 99 98 98 74 86 84 86
12.5 77 86 80 82 86 85 84 48 66 61 66
9.5 64 67 69 65 75 70 64 36 46 50 51
4.75 32 29 47 45 47 40 31 21 25 36 37
2.36 20 21 31 32 26 25 22 16 19 23 24
1.18 15 15 20 23 19 18 17 14 14 15 16
0.6 10 14 15 15 15 14 14 11 12 12 12
0.3 5 10 9 9 9 8 10 7 8 8 9
0.075 3 5.3 4.5 5.2 4.4 4.2 4 3.4 3.8 4.8 5.35

21
0
Sieve Sizes
0
10
20
30
40
50
60
70
80
90
100
Pe
rce
nt
Pa
ssin
g
1999 Superpave level I 19 mmI-1
I-2
I-3
I-4
.075(200)
4.75(4)
9.5(3/8)
12.5(1/2)
19.0(3/4)
25.0(1.0)
mm(inches)
.300(50)
.600(30)
1.18(16)
2.36(8)
Figure 2
Aggregate gradations of Superpave Level I mixtures with 19 mm NMAS
0
Sieve Sizes
0
10
20
30
40
50
60
70
80
90
100
Pe
rce
nt
Pa
ssin
g
Superpave level II 19mm
II-1
II-2
II-3
LA22-W
LA121-W
LA121-B
LA22-B
LA353
US61-W
.075(200)
4.75(4)
9.5(3/8)
12.5(1/2)
19.0(3/4)
25.0(1.0)
mm(inches)
.300(50)
.600(30)
1.18(16)
2.36(8)
Figure 3
Aggregate gradations of Superpave Level II mixtures with 19 mm NMAS
22
0
Sieve Sizes
0
10
20
30
40
50
60
70
80
90
100
Pe
rce
nt
Pa
ssin
g
Superpave level III 19mmIII-1
III-2
III-3
III-4
III-5
III-5
III-6
III-7
WE-W
.075(200)
4.75(4)
9.5(3/8)
12.5(1/2)
19.0(3/4)
25.0(1.0)
mm(inches)
.300(50)
.600(30)
1.18(16)
2.36(8)
Figure 4
Aggregate gradations of Superpave Level III mixtures with 19 mm NMAS
0
Sieve Sizes
0
10
20
30
40
50
60
70
80
90
100
Pe
rcen
t P
as
sin
g
Superpave level II 25mm
LA4-B
US61-B
US90-B
.075(200)
4.75(4)
9.5(3/8)
12.5(1/2)
19.0(3/4)
25.0(1.0)
mm(inches)
37.5(1.50)
.300(50)
.600(30)
1.18(16)
2.36(8)
Figure 5
Aggregate gradations of Superpave Level II mixtures with 25 mm NMAS

23
0
Sieve Sizes
0
10
20
30
40
50
60
70
80
90
100
Pe
rcen
t P
as
sin
g
Superpave level III 25mmIII-1
III-2
III-3
III-4
I20-B
WE-B
.075(200)
4.75(4)
9.5(3/8)
12.5(1/2)
19.0(3/4)
25.0(1.0)
mm(inches)
37.5(1.50)
.300(50)
.600(30)
1.18(16)
2.36(8)
Figure 6
Aggregate gradations of Superpave Level III mixtures with 25 mm NMAS
24
Asphalt Binder Information
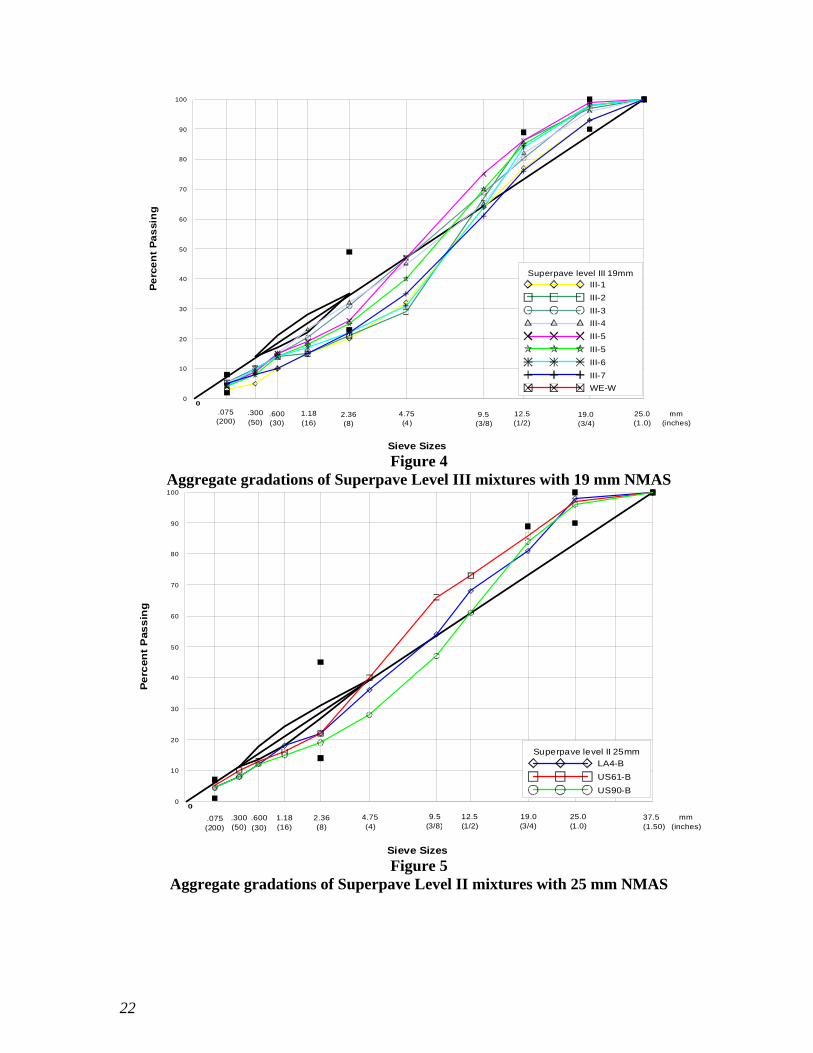
Three types of asphalt cement, a conventional viscosity graded AC-30 and two polymer-
modified asphalt binders meeting LADOTD specifications for PAC-30 and PAC-40, were
included in Phase I Superpave mix design. Table 4 presents the related asphalt binder
specifications. These binders were also classified using the Superpave PG system, as shown
in Table 5. It is noted that both AC-30 and PAC-30 binders met Superpave PG-64-22
specification, while PAC-40 met PG-70-22 specification.
Table 4 Asphalt binder specifications
SPECIFICATIONS
Original Properties
AASHTO Test
Method AC-30 PAC-30 PAC-40
Viscosity, 60 o C (140 o F), Pa.s T 202 300 60
Viscosity, 135 o C (275 o F), Pa.s TP 48 0.35 min. 3.0 max. 3.0 max.
Penetration, 25 o C (77 o F), 100 g, 5 s T 49 55 min. 50-75 50
Flash Point, Cleveland open cup, o C T 48 232 min. 232 min. 232 min. Solubility in trichloroethylene, % T 44 99 min. 99 min. 99 min. Separation of Polymer, 163 o C (325 o F), 48 hr Difference in softening point from top and bottom Sample o C
2 max. 2 max.
Force Ductility Ratio, (F2/F1, 4oC (39oF),5 cm/min, @ 30 cm elongation)
F2 = F @ 30 cm, F1 = Peak Force
0.3 min.
Test on residue from thin-film oven test
Viscosity, 60 o C (140 o F), Pa.s max. T 202 1200 max.
Ductility, 25 o C (77 o F), 50 mm/min, mm T 51 1000 min.
Penetration, 25 o C (77 o F), 100 g, 5 s T 49 30 min. 25 min. Mass Loss % T 240 0.5 max.
Spot Test (Standard Naphtha Solvent) T 102 Neg.
Elastic Recovery, 25 o C, 10 cm elongation, %
40 min. 60 min.
For Phase II Superpave projects, two elastometric polymer-modified asphalt binders, PG70-
22M and PG76-22M, were used and conformed to the specifications of Superpave PG-70-22

25
and PG 76-22. The related specifications and test results can be found elsewhere [22]. Table
6 presents the binder type and the percentage of binder from recycled asphalt pavement
(RAP) used on each mixture considered in this study. RAP was used on all binder course
asphalt mixtures.
Table 5 Superpave binder specification test results (Phase-I)
AC-30 PAC-30 PAC-40
Original Binder
Rotational Viscosity at 135 oC, Pa-s 0.52 0.63 0.92 Dynamic Shear Rheometer, G*/sin , kPa 76 oC 0.87 70 oC 0.78 0.8 1.02 64 oC 1.63 1.8 RTFO Dynamic Shear Rheometer, G*/sin , kPa 76 oC 0.97 1.58 70 oC 1.66 1.35 2.47 64 oC 3.54 1.26 PAV Dynamic Shear Rheometer, G*/sin , kPa 3725 3300 3403 Bending Beam Creep Stiffness S, MPa 238 100 99 Bending Beam Creep Stiffness m, MPa 0.310 0.350 0.380 PG Grade 64-22 64-22 70-22

26
Table 6 Mixture binder type and RAP percentage
Mixture Binder AC % from
RAP Mixture Binder
AC % from RAP
1BI22 AC 30 0.9 I-4 PG70-22M - 1WI22 PAC 30 - II-1 PG76-22M - 1BI121 AC 30 1.0 II-2 PG76-22M - 1WI121 PAC 30 - II-3 PG76-22M -
1BWI353 PAC 40 - III-1 PG76-22M - 1WII61 PAC 40 - III-2 PG76-22M - 1WIIwe PAC 40 - III-3 PG76-22M 0.6
2BI4 AC 30 1.0 III-4 PG76-22M - 2BII90 PAC 40 0.7 III-5 PG76-22M - 2BII61 PAC 40 0.8 III-6 PG76-22M 1.0
2BIIIWE PAC 40 1.0 III-7 PG76-22M - 2BIII20 PAC 40 1.0 III-25-1 PG76-22M -
I-1 PG70-22M - III-25-2 PG76-22M - I-2 PG70-22M - III-25-3 PG76-22M 0.7 I-3 PG70-22M - III-25-4 PG76-22M 0.6
Mixture Volumetric Properties
Table 7 presents the specification requirements and the design volumetric properties of the
mixtures in this study.

27
Table 7 Design volumetric data of Superpave mixtures
Mixture
Ndesign VTM (%) VMA (%) VFA (%) AC % Dust/Pbeff Film
Thickness (microns)
I-1
75
4.0 13.8 71.3 4.6 1.12 7.0 I-2 4.0 13.5 70.7 4.7 1.17 6.7 I-3 4.5 14.6 69.2 4.5 0.86 10.9 I-4 4.1 13.9 70.4 5.0 0.94 9.6 II-1
100 4.0 13.9 71.5 4.8 0.93 9.9
II-2 4.0 15.0 73.6 5.1 1.08 9.4 II-3 4.3 13.9 69.0 4.4 0.93 10.7
1WI22
96
3.9 14.1 72.4 4.6 1.05 10.6 1WI121 4.3 14.1 69.8 4.7 0.9 11.1 1BI121 4.2 14.1 70.5 4.4 1.02 9.5 1BI22 3.7 14.3 74.5 5.1 0.83 11.5
1BWI353 4.1 13.5 69.9 4.7 1.24 6.8 2BI4 4.0 14.0 71.7 5.0 0.99 11.1
1WII61 109
4.3 13.4 67.9 4.2 1.28 8.2 2BII61 3.9 13.1 70.2 4.3 1.28 8.7 2BII90 4.0 13.9 71.2 4.8 1.05 10.9 III-1
125
4.5 13.7 67.4 4.5 0.77 13.5 III-2 4.1 13.7 70.1 4.6 1.29 9.2 III-3 4.0 14.9 73.1 5.0 0.94 11.1 III-4 4.0 13.5 70.4 4.5 1.27 8.7 III-5 4.2 14.1 70.5 4.5 1.02 10.0 III-6 4.1 13.9 70.8 4.5 1.00 10.6 III-7 4.1 14.2 71.2 4.9 0.88 11.2
III-25-1 4.1 12.9 68.5 4.2 0.92 11.5 III-25-2 4.4 13.3 66.9 4.3 0.99 10.7 III-25-3 4.1 12.8 68.3 3.8 1.30 9.0 III-25-4 4.0 13.0 69.2 4.0 1.41 8.6
1WIIIWE 126
3.8 13.5 71.9 4.6 1.19 10.1 2BIII20 4.3 13.4 67.9 4.3 1.18 7.0 2BIIIWE 3.9 13.5 71.1 4.1 1.15 9.9
Spec. 3-5
>13.0 for 19mm
>12.0 for 25mm
65-78 N/A 0.6-1.6 N/A
28
In general, all mixtures met the Superpave volumetric requirements. The last column of
Table 7 contains the values of film thickness. The thickness of the asphalt cement film
around a particular aggregate is a function of the surface area of the aggregate mass and the
percentage of asphalt cement in the mixture. The computation of the film thickness in this
study is followed by the method provided in the literature [23].
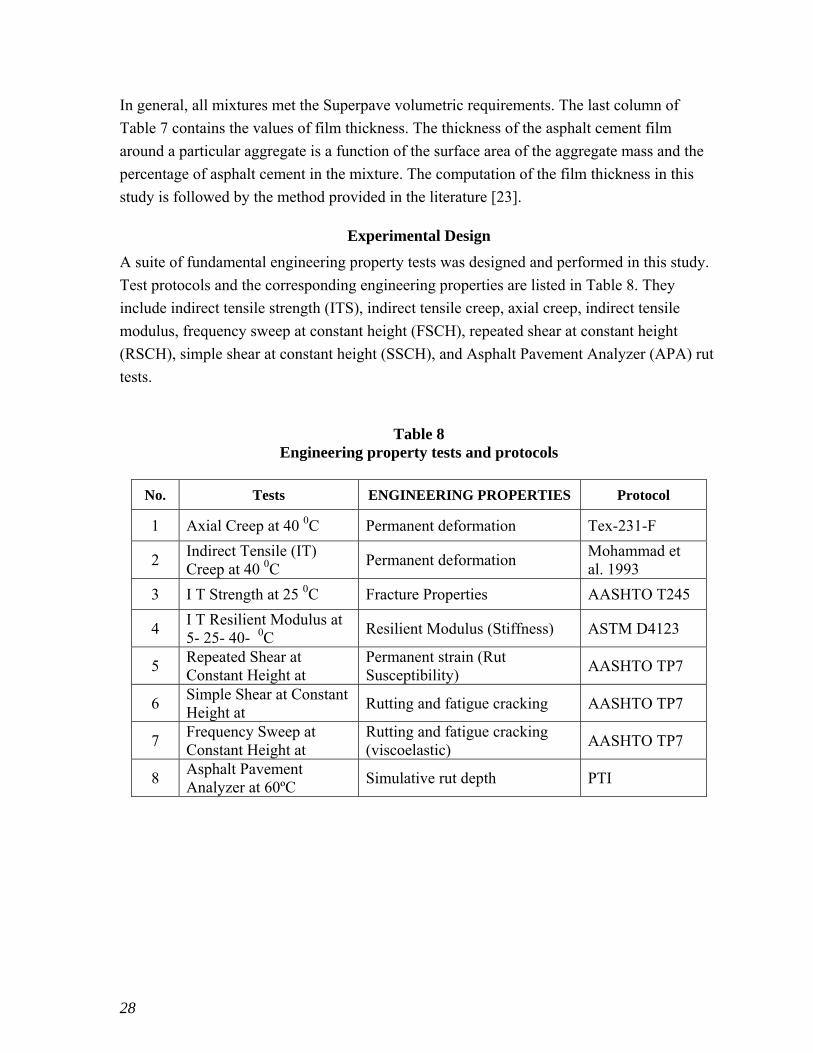
Experimental Design
A suite of fundamental engineering property tests was designed and performed in this study.
Test protocols and the corresponding engineering properties are listed in Table 8. They
include indirect tensile strength (ITS), indirect tensile creep, axial creep, indirect tensile
modulus, frequency sweep at constant height (FSCH), repeated shear at constant height
(RSCH), simple shear at constant height (SSCH), and Asphalt Pavement Analyzer (APA) rut
tests.
Table 8
Engineering property tests and protocols
No. Tests ENGINEERING PROPERTIES Protocol
1 Axial Creep at 40 0C Permanent deformation Tex-231-F
2 Indirect Tensile (IT) Creep at 40 0C
Permanent deformation Mohammad et al. 1993
3 I T Strength at 25 0C Fracture Properties AASHTO T245
4 I T Resilient Modulus at 5- 25- 40- 0C
Resilient Modulus (Stiffness) ASTM D4123
5 Repeated Shear at Constant Height at
Permanent strain (Rut Susceptibility)
AASHTO TP7
6 Simple Shear at Constant Height at
Rutting and fatigue cracking AASHTO TP7
7 Frequency Sweep at Constant Height at
Rutting and fatigue cracking (viscoelastic)
AASHTO TP7
8 Asphalt Pavement Analyzer at 60ºC
Simulative rut depth PTI

29
Specimen Preparation
Cylindrical specimens were fabricated for fundamental engineering property tests in this
study. Sufficient materials were secured from the HMA plant production facility and
compacted in the Superpave Gyratory Compactor (SGC) to a diameter of either 101.6 mm or
150 mm and heights of between 120 mm to 150 mm. Specimens for ITS, IT, and axial creep
tests were cut to a height of 63.5 mm from the 101.6 mm diameter SGC samples. The FSCH,
RSCH, and SSCH test specimens were obtained from a 150 mm SGC sample and cut to a
height of 50 mm. The specimen air voids for the 101.6 mm diameter and 150 mm diameter
were 4 1 percent and 7.0 1.0 percent, respectively. Triplicate samples were used for each
test.
Test Description
Indirect Tensile Strength (ITS) Test. This test was conducted at 25° C according to
AASHTO T245. A cylindrical specimen is loaded to failure at a deformation rate of 50.8
mm/min using an MTS machine. The IDT strength was used in the analysis.
Indirect Tensile Creep (IT Creep) Test. At testing temperatures of 40°C (104°F), a
compressive load of 1112.5 N (250 lbf) was applied on the sample, using the stress
controlled mode of the MTS test system. The load was applied for 60 minutes or until sample
failure. The deformations acquired during this time were used to compute the creep modulus
as follows:
)(59.3)(
TVtPTS
(1)
where,
S(T) = creep modulus at time T, MPa;
P = applied vertical load, N;
t = sample thickness, mm; and
V(T) = vertical deformation at time T, mm.
The creep modulus versus time (termed as the creep slope) is plotted on a log-log scale and used in the analysis.
30
Indirect Tensile Resilient Modulus Test. The specimens will be tested at 5, 25, and
40°C (40, 77, and 104°F) according to a modified ASTM D4123. At these temperatures, 15,
10, and 5 percent of the ITS test failure load were used as the peak value of the cyclic load,
respectively.
Axial Creep Test. This test mainly reflects the mixture aggregate skeleton’s
resistance to permanent deformation under a sustained load. The test was conducted in
accordance with the Test Method Tex-231-F. The test temperature was 40º C. A static load
of 0.787 kN (176.7 lbf) was applied for one hour along the longitudinal axis of the specimen.
The axial deformation of the specimen was continuously measured and subsequently used to
calculate creep properties, such as stiffness and permanent strain. These data were used to
evaluate the permanent deformation characteristics of asphalt mixtures.
Frequency Sweep at Constant Height Test. The FSCH test is conducted according
to AASHTO TP7 Procedure E. It is a strain controlled test that applies a shear stress to a
cylindrical test specimen to produce a shear strain with a peak amplitude of 0.0005 mm/mm.
Sinusoidal shear loading is applied at a sequence of 10 frequencies (10, 5, 2, 1, 0.5, 0.2, 0.1,
0.05, 0.02, and 0.01 Hz) to produce a sinusoidal shear strain. The properties obtained from
this test were dynamic shear modulus and phase angle.
Repetitive Shear at Constant Height Test. This test was conducted according to
AASHTO TP7 Procedure F. It is a controlled stress test that applies haversine shear stress
pulses to a cylindrical specimen. The shear stress amplitude is applied with a maximum shear
stress of 68 kPa for a loading time of 0.1 seconds and a rest period of 0.6 seconds. A varying
axial load is applied automatically during each cycle to maintain the specimen at constant
thickness or height. Repetitive loading is applied for a total of 5,000 repetitions or until 5
percent permanent shear strain is reached by the sample. The primary response variable from
this test is the cumulative permanent shear strain at the end of testing.
Simple Shear at Constant Height Test. As described in test procedure G of the
AASHTO TP7, the simple shear at constant height (SSCH) test is a controlled stress test that
applies an increasing shear stress to a cylindrical test specimen until a specified shear stress
level (35 kPa) is achieved. The specified shear stress is held constant for 10 seconds and then
released (unloading) at a specific rate. The unloading period will last for 15 seconds to let the
shear strain relax. During the test, a varying axial stress is applied automatically to maintain a
constant height for the specimen. The primary response variable from this test is the
maximum permanent shear strain at the end of testing.

31
Asphalt Pavement Analyzer Rut Test. Asphalt Pavement Analyzer (APA) is the
new generation of the Georgia Loaded Wheel Tester. It simulates actual road conditions by
rolling a concave-shaped metal wheel at a speed of approximately 60 cm/sec over a rubber
hose pressurized at 0.7 MPa (100 psi) to 0.8 MPa (120 psi) to generate the effect of high tire
pressure. The hose stays in contact with the sample’s surface while the metal wheel rolls
back and forth along the length of the hose for 8,000 cycles. The APA can test three beam
samples (300 x 125 x 75 mm) or six cylindrical samples (150 mm x 75 mm) simultaneously.


33
DISCUSSION OF RESULTS
This discussion is divided into three parts. In Part I, the mechanistic test results for the Phase
I Superpave mixtures were statistically analyzed based on different air void levels and the
nominal maximum aggregate sizes (NMAS). In Part II, the aggregate gradations of the Phase
II Superpave mixtures were first characterized using a Power-law regression analysis. Those
obtained gradation parameters were then used to correlate with mixture mechanistic
properties. The influences of volumetric properties (e.g. VMA, air voids, etc.) on
fundamental engineering properties of Phase II Superpave mixtures were also addressed in
this part of discussion. In Part III, Superpave mixtures from both Phase I and Phase II
projects were analyzed in groups based on compaction effort (design gyratory compaction
level), gradation type (fine or coarse graded), NMAS, binder type, and RAP usage.
Correlation analyses were also performed in this section on engineering properties of
Superpave mixtures obtained from different fundamental engineering tests. Finally, the
laboratory fundamental engineering test results were compared with the early field
performance of those mixtures considered.
The SAS software was used in the statistical analysis in the discussion. A multiple
comparison procedure, Fisher’s least significant difference (LSD), was selected with a 95
percent confidence interval. This multiple comparison procedure ranks the mean test result
values and places them in groups designated A, B, C, A/B, and so forth. The letter A is used
to rank the group with the most desired mixture properties (e.g., the highest stiffness or
lowest permanent strain, etc.) followed by other letter grades in the appropriate order. A
double-letter designation, such as A/B, indicates that the mean test result of that group is not
significantly different from either A or B.

34
Part I – Phase I Superpave Mixtures
Indirect Tensile Resilient Modulus Test
Elastic properties of the asphalt mixes were examined by the indirect tensile resilient
modulus (Mr) test. Table 9 presents the measured Mr results for the 12 Phase I Superpave
mixtures at three temperatures. As expected, the Mr values for all 12 mixtures decreased as
the testing temperatures increased. From Table 9 and Figure 7, two clusters of mixes can be
identified at low and intermediate temperatures. The cluster of mixtures with higher Mr
values at low and intermediate temperatures includes mixtures 2BIII20, 2BII61, 1WII61, and
1BI22. No significant difference was found between the average Mr values of these mixes at
low and intermediate temperatures, as evidenced in Table 9 by the A group. This cluster
includes mixtures from the three levels of compaction effort used on binder and wearing
courses with 19 and 25 mm NMAS. Therefore, no statement about the influence of these
three variables could be made. Instead, it should be noted that three of these mixes were in
the lowest specimen air void group (4±1 percent). In general, mixtures with lower air voids
exhibited higher Mr values. At a high temperature, only the 1BI22 mixture remained in the
statistical group ‘A’ with the highest resilient modulus value. This mixture also had the
highest binder film thickness and the lowest dust to asphalt ratio values among the twelve
Phase I mixtures (Table 9), which is indicative of the influence of mastic on resilience
properties.
Table 9 Resilient modulus test results – statistical grouping for all Phase I mixes
Mix VTM
%
Resilient Modulus (MPa) 4ºC 25ºC 40ºC
Mean Group Mean Group Mean Group 1BI22
4±1 4713 A 3109 A 2461 A
1WII61 4693 A 3060 A 2075 B 2BIII20 4680 A 3270 A 1842 C 1WI121
6±1
3883 B 2660 B 1696 C/D 2BII90 3265 C/D 2068 D 1295 E/F 2BII61 4493 A 3109 A 1885 B/C 2BI4 2943 D 2242 C/D 1232 F
2BIIIWE 3629 B/C 2531 B/C 1752 C 1WIIIWE
8±1
3288 C/D 2578 B/C 1487 D/E 1BI121 3803 B/C 2691 B 1802 C 1WI22 4068 B/C 2423 B/C/D 1429 E/F
1BWI353 3873 B 2402 B/C/D 1343 E/F

35
0 5 10 15 20 25 30 35 40 451000
1500
2000
2500
3000
3500
4000
4500
5000
Re
silie
nt M
od
ulu
s (M
Pa
)
Temperature 0C
2BIIIWE m=-48 1WIIIWE m=-43 2BII
61 m=-67
1WII61
m=-65 1WI
22 m=-69
2BIII20
m=-65 2BII
90 m=-52
1BI121
m=-49 1WI121 m=-58 2BI
4 m=-35
1BI22
m=-52 1BWI
353 m=-61
Figure 7 IT resilient modulus versus temperature (Phase-I)
In Table 10, the mean of the resilient modulus of all mixtures with 19 mm NMAS is
compared to the mean of all mixtures with NMAS of 25 mm. Similarly, using the results of
all mixtures, means for every level of compaction were computed and compared. Table 10
shows that neither the level of compaction nor the nominal maximum aggregate size
influenced the results of this test. In other words, the resilient modulus of mixtures with
different compaction levels was statistically similar at every temperature and NMAS.
Table 10 Resilient modulus test results – statistical grouping for classified Phase-I mixes
Variable Resilient Modulus (MPa)
4ºC 25ºC 40ºC Mean Group Mean Group Mean Group
NMAS 19 mm 3975 A 2696 A 1756 A 25 mm 3802 A 2644 A 1604 A
Compaction Level
I 3798 A 2580 A 1662 A II 4150 A 2746 A 1752 A III 3865 A 2793 A 1694 A
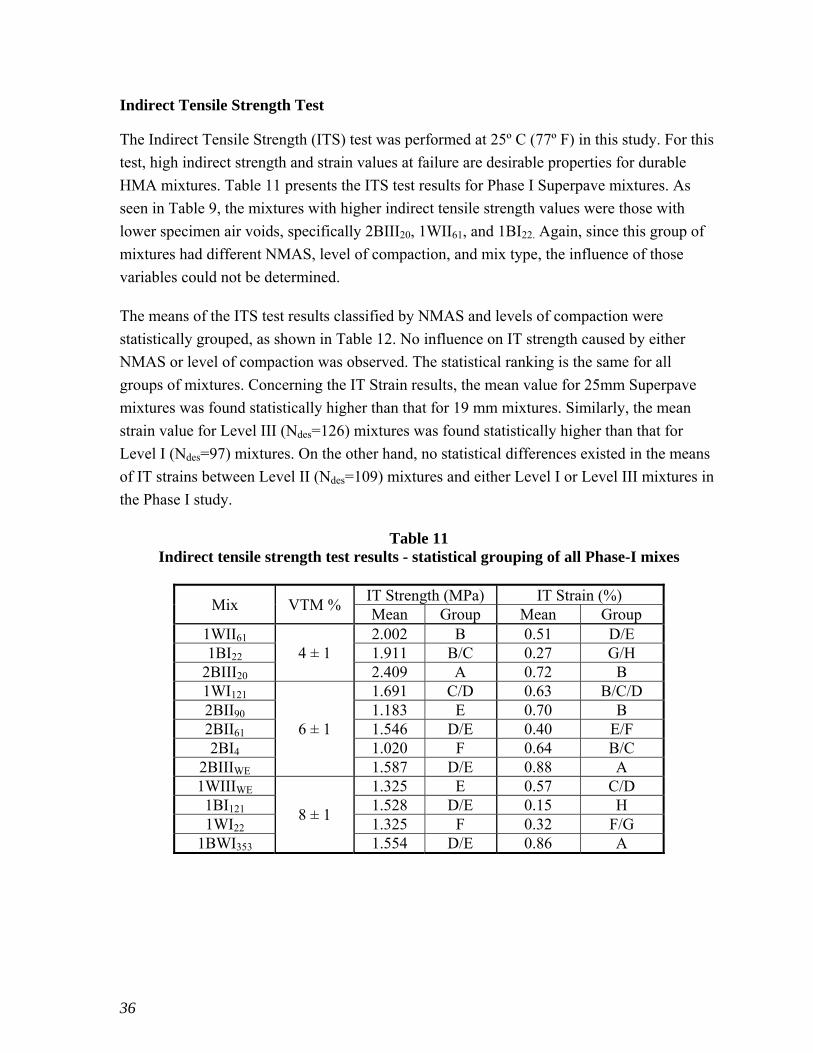
36
Indirect Tensile Strength Test
The Indirect Tensile Strength (ITS) test was performed at 25º C (77º F) in this study. For this
test, high indirect strength and strain values at failure are desirable properties for durable
HMA mixtures. Table 11 presents the ITS test results for Phase I Superpave mixtures. As
seen in Table 9, the mixtures with higher indirect tensile strength values were those with
lower specimen air voids, specifically 2BIII20, 1WII61, and 1BI22. Again, since this group of
mixtures had different NMAS, level of compaction, and mix type, the influence of those
variables could not be determined.
The means of the ITS test results classified by NMAS and levels of compaction were
statistically grouped, as shown in Table 12. No influence on IT strength caused by either
NMAS or level of compaction was observed. The statistical ranking is the same for all
groups of mixtures. Concerning the IT Strain results, the mean value for 25mm Superpave
mixtures was found statistically higher than that for 19 mm mixtures. Similarly, the mean
strain value for Level III (Ndes=126) mixtures was found statistically higher than that for
Level I (Ndes=97) mixtures. On the other hand, no statistical differences existed in the means
of IT strains between Level II (Ndes=109) mixtures and either Level I or Level III mixtures in
the Phase I study.
Table 11 Indirect tensile strength test results - statistical grouping of all Phase-I mixes
Mix VTM % IT Strength (MPa) IT Strain (%) Mean Group Mean Group
1WII61 4 ± 1
2.002 B 0.51 D/E 1BI22 1.911 B/C 0.27 G/H
2BIII20 2.409 A 0.72 B 1WI121
6 ± 1
1.691 C/D 0.63 B/C/D 2BII90 1.183 E 0.70 B 2BII61 1.546 D/E 0.40 E/F 2BI4 1.020 F 0.64 B/C
2BIIIWE 1.587 D/E 0.88 A 1WIIIWE
8 ± 1
1.325 E 0.57 C/D 1BI121 1.528 D/E 0.15 H 1WI22 1.325 F 0.32 F/G
1BWI353 1.554 D/E 0.86 A

37
Table 12 Indirect tensile strength results - statistical grouping of classified Phase-I mixes
Variable IT Strength IT Strain
Mean Group Mean Group
NMAS 19 mm 1.62 A 0.47 B 25 mm 1.55 A 0.67 A
Compaction Level
I 1.5 A 0.48 B II 1.6 A 0.54 A/B III 1.8 A 0.72 A
Axial Creep Test
This test was performed according to the Texas DOT axial creep test procedure [23]. Three
test parameters can be derived from this test, namely, the creep stiffness, creep slope, and
permanent strain at the end of the test. In general, a rut-resistant HMA mixture should have
high creep stiffness, low creep slope, and low permanent strain values. Table 13 presents the
average axial creep test results at 40º C (104º F) for Phase I Superpave mixtures grouped by
different air voids. Figures 8 to 10 graphically represent the test results of creep stiffness,
creep slope, and permanent strain, respectively. The Texas specification limits for all test
parameters were also plotted on the corresponding figures.
Table 13 Axial creep test results - statistical grouping of all Phase-I mixtures
Mix Air void
(%) Stiffness (MPa)
Slope (E-08 mm/mm/sec)
Permanent Strain (mm/mm)
Mean Group Mean Group Mean Group 1BI22
4 ± 1 66.3 B 7.6 A/B/C 5.3 B/C/D
1WII61 82.2 A 4.3 A 2.77 B 1WI121 49.1 C/D 10.1 C/D 5.7 C/D 2BIII20
6 ± 1
86.7 A 4.5 A 2.55 B 2BII61 78.6 A 7.5 A/B/C 4.5 B/C 2BII90 52.4 C 6.2 A/B 4.1 B/C 2BI4 38.4 E 22.9 F 9.93 E/F
1WIIIWE
8 ± 1
50.3 C/D 9.5 C/D 7.35 D/E 2BIIIWE 50.1 C/D 9.4 B/C/D 4.55 B/C 1BI121 54.0 C 12.1 D 6.67 C/D 1WI22 36.7 E 16.5 E 10.32 F
1BWI353 41.8 D/E 7.4 A/B/C 6.32 C/D

38
In Figure 8, the axial creep test results are separated in groups according to the specimen air
void percent. Results show that the group of mixtures with air voids in the range 8 1
percent have stiffness values significantly lower than the values of the other two groups.
Only two mixes, 2BI4 and 1WI22, did not meet the minimum TXDOT requirement for creep
stiffness of 41.4 MPa (6000 psi), and both of these mixes were prepared at level I compactive
effort. On the other hand, the mixes with the highest creep stiffness, 2BIII20, 1WII61, and
2BII61, were compacted at levels II or III. That is, the compactive effort shows an effect on
the results.
1BI_
22
1WII_
61
1WI_
121
2BIII
_20
2BII_
61
2BII_
90
2BI_
4
1WIII
_WE
2BIII
_WE
1BI_
121
1WI_
22
1BW
I_35
3
0
10
20
30
40
50
60
70
80
90
0
10
20
30
40
50
60
70
80
90
Texas DOT Spec=41.4 MPa (6000 psi)
Cre
ep
Stif
fne
ss (
MP
a)
Mixture
4±1 VTM 6±1 VTM 8±1 VTM
Figure 8
Creep stiffness from axial creep test at 40ºC
The slope from the axial creep test, as seen in Figure 9, gives an indication of how
susceptible a mixture is to creep strain under static loading. Therefore, a low slope is required
if a mix is to resist rutting. The mixes with the highest slopes, an indication of higher rutting
susceptibility, were 2BI4, 1WI22, and 1BI121. All three of these mixes were compacted at level
I, which corresponds to the axial creep stiffness results. Mixtures 2BI4 and 1WI22 also had
the lowest creep stiffness, and this combination of high creep slope and low creep stiffness
should show rapid rutting in the field. Similarly, the mixtures with the lowest slopes, 2BIII20,
1WII61, and 2BII90, should exhibit better rutting resistance. Again, none of these three mixes
with low slopes was compacted at level I. However, it is interesting to note that all 12
mixtures exceeded the Texas DOT requirement of a maximum of 3.5x10⁻⁸ on creep slope.
This does not necessarily mean that all of these mixtures are bad. It may mean that criteria
established under one set of local conditions are not always transferable to other locations
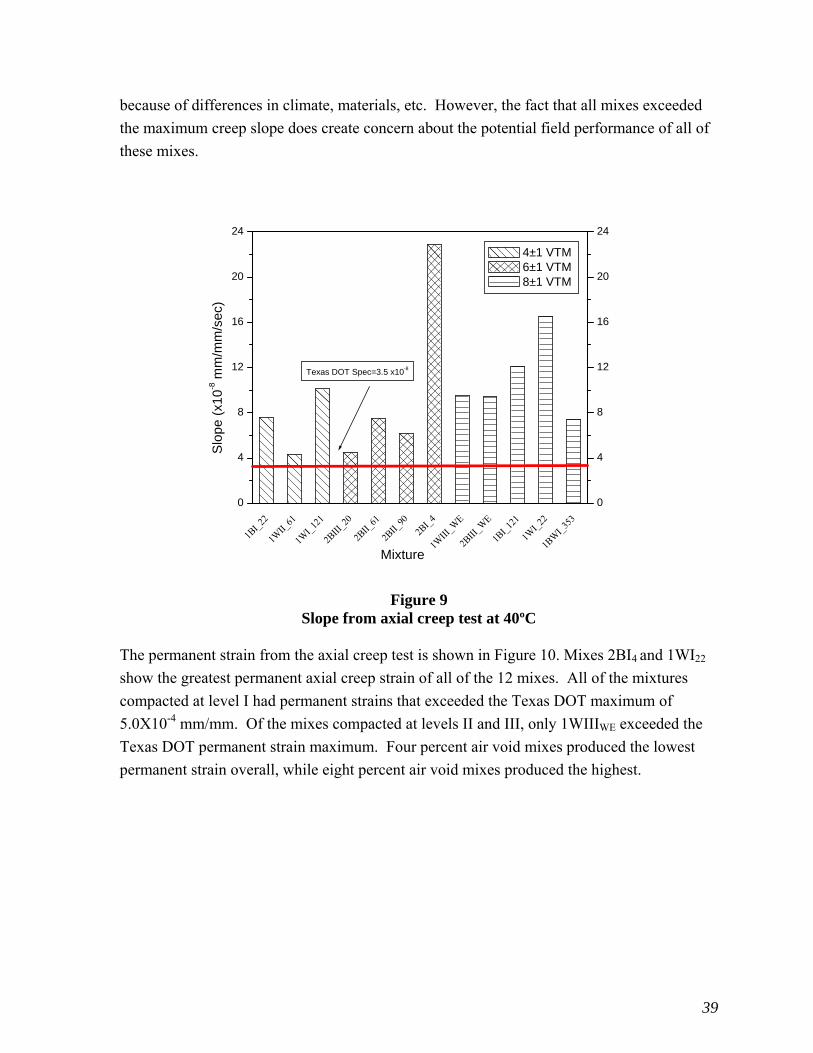
39
because of differences in climate, materials, etc. However, the fact that all mixes exceeded
the maximum creep slope does create concern about the potential field performance of all of
these mixes.
1BI_
22
1WII_
61
1WI_
121
2BIII
_20
2BII_
61
2BII_
902B
I_4
1WIII
_WE
2BIII
_WE
1BI_
121
1WI_
22
1BW
I_35
3
0
4
8
12
16
20
24
0
4
8
12
16
20
24
Texas DOT Spec=3.5 x10⁻⁸
Slo
pe
(x1
0-8 m
m/m
m/s
ec)
Mixture
4±1 VTM 6±1 VTM 8±1 VTM
Figure 9
Slope from axial creep test at 40ºC The permanent strain from the axial creep test is shown in Figure 10. Mixes 2BI4 and 1WI22
show the greatest permanent axial creep strain of all of the 12 mixes. All of the mixtures
compacted at level I had permanent strains that exceeded the Texas DOT maximum of
5.0X10⁻⁴ mm/mm. Of the mixes compacted at levels II and III, only 1WIIIWE exceeded the
Texas DOT permanent strain maximum. Four percent air void mixes produced the lowest
permanent strain overall, while eight percent air void mixes produced the highest.

40
1BI_
22
1WII_
61
1WI_
121
2BIII
_20
2BII_
61
2BII_
90
2BI_
4
1WIII
_WE
2BIII
_WE
1BI_
121
1WI_
22
1BW
I_35
3
0
2
4
6
8
10
12
0
2
4
6
8
10
12
Texas DOT Spec=5.0 x 10⁻⁴ mm/mm
Pe
rma
ne
nt S
tra
in (
mm
/mm
)
Mixture
4±1 VTM 6±1 VTM 8±1 VTM
Figure 10 Permanent strain from axial creep test at 40ºC
The statistical grouping of mixtures classified by NMAS and compaction level is presented
in Table 14.
Table 14 Axial creep test results - statistical grouping of classified Phase-I mixes
Variable Stiffness Slope Perm. Strain
Mean Group Mean Group Mean Group
NMAS 19 mm 54.3 A 9.7 A 6.5 A 25 mm 61.2 A 10.1 A 5.1 A
Compaction Level
I 47.7 B 12.8 B 7.5 B II 71.1 A 6.0 A 3.8 A III 62.3 A 7.8 A 4.8 A

41
While the NMAS variable does not show influence on this test (the means of the fundamental
properties are statistically similar), the influence of the level of compaction effort is evident.
In every case, the results of mixes with level I compaction were statistically different and
inferior to those from mixes compacted at levels II or III. In other words, the stiffness was
lower and the creep slope and permanent strain were higher for mixes at compaction level I
than for mixes at compaction levels II or III. Additionally, no statistical difference was
detected between the means of fundamental properties of mixes compacted at levels II or III.
Indirect Tensile Creep Test
Similar to the axial creep test, the indirect tensile creep (ITC) test performed at 40o C also
provides an indication of the rutting susceptibility for the HMA mixtures. Low ITC slope
values are desired properties for rut resistant HMA mixtures. Table 15 summarizes the ITC
slope results for all Phase I mixtures considered. It shows that mixtures with the lowest creep
slope were 2BIII20 (Group A/B) and 1WII61 (Group A), and those with the highest creep slope
included 1BI22 (Group D/E), 2BII90 (Group E/F), and 2BI4 (Group F). These three mixtures
all contained high film thickness and low Dust/asphalt ratio.
Table 15 Creep slope from the indirect tensile creep test-statistical grouping of all Phase-I mixes
Mix Air Void % Slope (KPa/sec)
Mean Group 1WII61
4 ± 1 1.86 A
2BIII20 2.09 A/B 1BI22 3.13 D/E
1WI121
6 ± 1
3.04 D 2BII61 2.97 D 2BII90 3.50 E/F
2BIIIWE 2.81 C/D 2BI4
8 ± 1
3.70 F 1WIIIWE 3.04 D 1BI121 3.01 D 1WI22 2.44 B/C
1BWI353 2.99 D
Table 16 presents the statistical grouping of mixtures classified by NMAS and levels of
compaction effort. As shown in Table 16, neither NMAS nor compaction effort had an
influence on creep test results. The mean values of the slopes of all mixes were statistically
similar in the analysis with respect to these two variables.

42
Table 16 Creep slope from the indirect tensile creep test-statistical grouping of classified
Phase I mixes
Variable Slope
Mean Group
NMAS 19 mm 2.8 A 25 mm 3.0 A
Compaction Level I 3.1 A II 2.8 A III 2.6 A
Frequency Sweep Test at Constant Height
Viscoelastic properties of asphalt mixtures were examined by performing a frequency sweep
test. The material property obtained from this test was a dynamic shear modulus, also called
a complex shear modulus. Dynamic shear modulus (G*) is defined as the ratio of the peak
shear stress amplitude to the peak shear strain amplitude; it is a measure of total stiffness of
asphalt mixtures, and it is composed of elastic and viscous components of asphalt shear
modulus. Thus far, the correlation between the dynamic shear modulus and pavement rutting
has not been well established, although the fact that the strain generated in stiff asphalt
mixtures under traffic loading is relatively small, minimizing pavement rutting is well
known. The relationship between the complex shear modulus and the loading frequency,
shown in Figure 11, indicates that, as the speed of loading on the specimen increases, the
shear modulus increases.
The slope m of the relationship between complex shear modulus and loading frequency on
logarithmic scales is used to indicate the susceptibility of the mixture to both rutting and
fatigue cracking. HMAs with higher slopes are more susceptible to permanent deformation.
The slopes recorded in Figure 11 indicate that, on average, the mixtures with level III
compaction effort had the lowest slopes, and the level I mixtures had the highest slopes. The
mean values of slope for each level of compaction effort were: 0.370, 0.380, and 0.388 for
levels III, II, and I, respectively. The dynamic shear modulus results at 0.01 Hz, shown in
Figure 12, indicate that the air void level had an effect on the shear modulus even for
mixtures within a particular air void group. Within each air void group (e.g., 5 1 or 7 1
percent), the complex shear modulus decreased as the air voids increased. However, there
was no consistent trend across all mixtures between complex shear modulus and air voids.

43
0.1 1 10
1
10
100
1
10
100
Co
mp
lex
Mod
ulu
s (M
Pa
)
Frequency (Hz)
2BIIIWE
m=0.36 2BII90
m=0.41 1WIII
WE m=0.37 1BI
121 m=0.41
2BII61
m=0.43 1WI121
m=0.37 1WII
61 m=0.30 2BI
4 m=0.44
1WI22
m=0.35 1BI22
m=0.38 2BIII
20 m=0.38 1BWI
353 m=0.38
Figure 11
Slopes from the FSCH test at 48ºC
2BIII
_WE
1WIII
_WE
2BII_
61
1WII_
61
1WI_
22
2BIII
_20
2BII_
90
1BI_
121
1WI_
121
2BI_
4
1BI_
22
1BW
I_35
3
0
10
20
30
40
50
0
10
20
30
40
50
Co
mp
lex
Mo
du
lus
(MP
a)
Mixture
5±1 VTM 7±1 VTM 9±1 VTM
Figure 12
Complex Shear Modulus of FSCH test at 0.01 Hz and 48ºC

44
Repetitive Shear at Constant Height
Low permanent shear strain after 5,000 load repetitions is desirable for rut resistant mixtures.
Figure 13 presents the relationship between permanent shear strain and load repetitions for
all Phase I mixtures considered. It shows that a high percentage of the total permanent strain
occurs during the first 500 repetitions. The mixtures with the best and worst responses to the
shear loads are easily recognizable. Mixtures 1BI22 and 1WI121 showed the highest
permanent shear strain. Both of these mixes were compacted at level I, have the lowest
values of dust/asphalt ratio, and have the highest film thicknesses. On the other hand, the
lowest permanent shear strain occurred for 2BIIIWE and 2BIII20. Both were compacted at
level III, with the latter having a low film thickness.
0 1000 2000 3000 4000 5000
0.000
0.002
0.004
0.006
0.008
0.010
0.012
2BIII20
1WI22
2BI4 1BI
121
2BIIIWE
1WI121
2BII90
1BWI353
2BII61
1WIIIWE
1BI22
1WII61
Shea
r St
rain
Number of Load Repetitions
Figure 13 Permanent shear strain of repeated shear at constant height test at 48ºC
Simple Shear at Constant Height
The simple shear at constant height (SSCH) test is a shear-loading creep test. Theoretically, a
mixture that resists rutting should exhibit low permanent shear strain at the end of SSCH
tests. Figure 14 presents the SSCH permanent shear strain results for all Phase I mixtures.
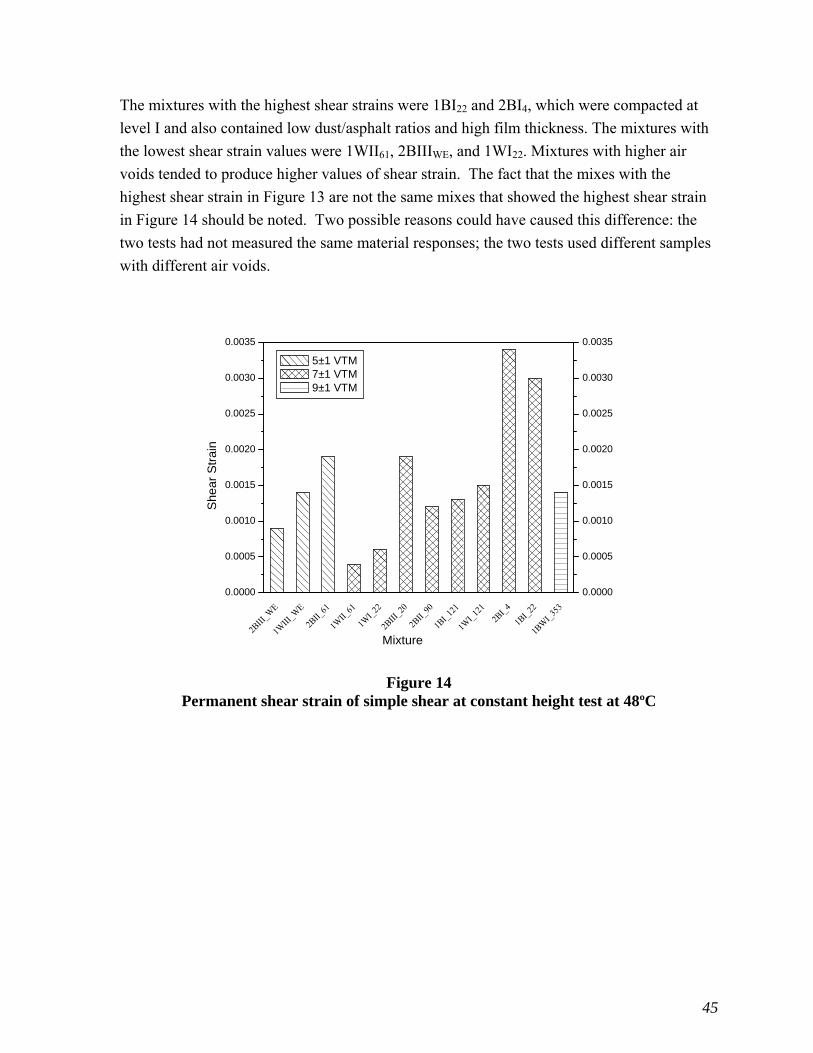
45
The mixtures with the highest shear strains were 1BI22 and 2BI4, which were compacted at
level I and also contained low dust/asphalt ratios and high film thickness. The mixtures with
the lowest shear strain values were 1WII61, 2BIIIWE, and 1WI22. Mixtures with higher air
voids tended to produce higher values of shear strain. The fact that the mixes with the
highest shear strain in Figure 13 are not the same mixes that showed the highest shear strain
in Figure 14 should be noted. Two possible reasons could have caused this difference: the
two tests had not measured the same material responses; the two tests used different samples
with different air voids.
2BIII
_WE
1WIII
_WE
2BII_
61
1WII_
61
1WI_
22
2BIII
_20
2BII_
90
1BI_
121
1WI_
121
2BI_
4
1BI_
22
1BW
I_35
3
0.0000
0.0005
0.0010
0.0015
0.0020
0.0025
0.0030
0.0035
0.0000
0.0005
0.0010
0.0015
0.0020
0.0025
0.0030
0.0035
Sh
ea
r S
tra
in
Mixture
5±1 VTM 7±1 VTM 9±1 VTM
Figure 14
Permanent shear strain of simple shear at constant height test at 48ºC

46
APA Rutting Test
Table 17 and Figure 15 present the APA test results of all Phase I mixtures expressed as the
measured rut depth after 8,000 cycles. The specification value for a mix with acceptable
performance should have a rut depth of 6 mm or less after 8,000 cycles. Most of the
mixtures tested, with the exception of 2BI4 and 1BI121, met this criterion. The two mixtures
that did not meet the specification contained high air voids and were designed at compaction
level I.
On the other hand, the two mixtures with the lowest rut depth, 1BWI353 and 2BIII20, have the
lowest air voids and the lowest film thickness and are the only two mixes with gradations
above the restricted zone. Four of the five mixes with the highest rut depths in Figure 12
match the four mixes in Figure 13 with the highest shear strain in the repeated shear at
constant height test.
Table 17 APA rutting test results at 60ºC- statistical grouping of all Phase I mixes.
Mix Air Void % Rutting (mm)
Mean Group 2BIII20 5 ± 1
2.70 B 1BWI353 1.54 A
1BI22
7 ± 1
4.80 C 2BII61 4.20 B/C 2BI4 7.80 D
1WIIIWE 3.80 B/C 2BII90 4.10 B/C 1WI121 4.60 C 2BIIIWE 4.20 B/C 1WII61
9 ± 1 5.90 C/D
1BI121 7.10 D 1WI22 3.60 B/C

47
2BIII_20
1BWI_
353
1BI_22
2BII_61
2BI_4
1WIII
_WE
2BII_90
1WI_
121
2BIII_W
E
1WII_
61
1BI_121
1WI_
220
1
2
3
4
5
6
7
8
0
1
2
3
4
5
6
7
8
Rut
Dep
th (
mm
)
M i x t u r e s
A i r V o id % 5 ± 1 7 ± 1 9 ± 1
Figure 15
APA rut depths at 60ºC (Phase I)
48
Overall Ranking of Rut Susceptibility
Based on the engineering properties from these tests, an overall ranking of the HMAs was
calculated to identify their susceptibility to permanent deformation. Table 18 shows the
overall ranking results for the tests performed in the MTS apparatus, while the results of the
overall ranking for tests conducted in the SST machine are presented in Table 19. Equal
weight was given to each test in the calculation. The numbers assigned for the ranking are
one through four: one was assigned to the mix with the most desirable results on each
particular engineering property of the test, and four was assigned to the mix with the least
desirable results. For instance, from the slope results in the Axial Creep Test (Table 16), the
ranking one was given to the mix with the lowest slope, which is an indication of good
performance on this property. Following the same logic, the number four was assigned to the
mixture with the highest value on creep slope. A normalization procedure through
interpolation was then adopted to rank the rest of the mixtures. After each engineering
property was treated in a similar way, the ranks were averaged and then normalized from
range one through four again. At the end of this process, mixes that resulted with smaller
ranking numbers were, in general, considered less susceptible to rutting. Figures 16 and 17
present the normalized ranking of rut susceptibility. The results were grouped according to
the specimens’ air void content. Regarding the variables used in the code designation
(NMAS, layer, and compaction effort), only the level of compaction effort shows some effect
on the ranking of mixes. One should observe that, in most cases, the mixes with a level I
compaction effort (i.e., for traffic 1 million ESAL’s) had higher rankings; that is, they can
be considered more susceptible to rutting than mixes compacted at levels II or III.

49
Table 18 Rank of rutting susceptibility from MTS test results
Air Void % 4 ± 1 6 ± 1 8 ± 1
Mix 1WII61 2BIII20 1BI22 2BII61 2BIIIWE 1WI121 2BII90 2BI4 1BWI353 1BI121 1WIIIWE 1WI22 IT Creep 1.00 1.33 3.0 2.78 2.56 2.89 3.67 4.0 2.78 2.89 2.89 1.89
Axial Creep 1.11 1.0 1.96 1.59 2.30 2.51 2.01 4.0 2.59 2.64 2.67 3.73 Average 1.06 1.17 2.48 2.18 2.43 2.70 2.84 4.0 2.68 2.77 2.78 2.81
Normalized 1.0 1.11 2.45 2.15 2.40 2.67 2.81 4.0 2.66 2.74 2.76 2.79
Table 19 Rank of rutting susceptibility from SST test results
Air Void % 5 ± 1 7 ± 1 9 ± 1
Mix 2BIIIWE 1WIIIWE 2BII61 1WII61 1WI22 2BIII20 2BII90 1BI121 1WI121 2BI4 1BI22 1BWI353 FSCH 1.89 2.89 3.55 1.00 2.46 2.90 3.61 3.21 3.36 4.00 3.50 3.22 RSCH 1.82 2.90 2.21 1.28 1.64 1.00 1.78 3.70 4.00 2.19 3.63 2.48 SSCH 1.50 2.00 2.50 1.00 1.20 2.50 1.80 1.90 2.10 4.00 3.60 2.00
Average 1.74 2.595 2.75 1.094 1.77 2.13 2.40 2.94 3.15 3.40 3.58 2.57 Normalized 1.78 2.81 3.01 1.00 1.81 2.26 2.57 3.23 3.49 3.78 4.00 2.78
Rutting Susceptibility Ranking: 1 represents the lowest rutting susceptibility; 4 represents the highest. Therefore, the following scale was used to rank the mixtures: 1 = Excellent resistance to rutting 2 = Good resistance to rutting 3 = Fair resistance to rutting 4 = Marginal resistance to rutting

50
1WII_
61
2BIII
_20
1BI_
22
2BII_
61
2BIII
_WE
1WI_
121
2BII_
90
2BI_
4
1BW
I_35
3
1BI_
121
1WIII
_WE
1WI_
22
0.0
0.5
1.0
1.5
2.0
2.5
3.0
3.5
4.0
0.0
0.5
1.0
1.5
2.0
2.5
3.0
3.5
4.0
Ru
t S
usc
ep
tibili
ty R
an
kin
g
Mixtures
VTM 4±1 6±1 8±1
Figure 16
Rutting susceptibility ranking from MTS tests results
2BIII
_WE
1WIII
_WE
2BII_
61
1WII_
61
1WI_
22
2BIII
_20
2BII_
90
1BI_
121
1WI_
121
2BI_
4
1BI_
22
1BW
I_35
3
0.0
0.5
1.0
1.5
2.0
2.5
3.0
3.5
4.0
0.0
0.5
1.0
1.5
2.0
2.5
3.0
3.5
4.0
Rut
ting
Susc
eptib
ility
Ran
king
Mixture
VTM % 5±1 7±1 9±1
Figure 17 Rutting susceptibility ranking from SST tests results
51
Influence of Mix Variables on Test Results
A multiple regression analysis and a comparison of test results were performed in this
section to determine the effect of mix design variables on the performance of the
evaluated mixes. Explanation of each procedure follows.
Multiple Regression Analysis
A statistical analysis was conducted to determine the contribution of several mix
variables to the test results. The statistical procedure used was a stepwise multiple
regression analysis that correlated the mix variables to the fundamental engineering
properties obtained from each test. The stepwise regression procedure is preferred when
two or more of the independent variables are highly correlated with each other, which is
the case here. At each step, the stepwise regression method adds an independent variable
to the regression model only if the variable’s inclusion significantly reduces the sum of
squares for error below the value achieved before the variable was included.
The variables considered for the analysis were NMAS, percent of aggregate passing
sieves 2.36 and 0.075 mm, film thickness, dust/asphalt ratio, voids in the mineral
aggregate, level of compaction effort, and voids in total mix (within groups). In order to
minimize the observed effect that air voids had on the test results, the program was run
separately for each air void group.
Table 20 contains the results from the regression analysis for the tests conducted on the
MTS machine. For example, on the axial creep test, the variable making the greatest
contribution to stiffness was percent aggregate passing sieve 0.075 mm. In an analogous
way, the variable contributing the most to creep slope was the film thickness. Table 21
presents the results of the stepwise multiple regression analysis for the tests performed on
the SST apparatus. Table 22 shows the frequency of significant contributions of each
variable on the results. The variables are approximately ordered from highest to lowest
contribution. According to this analysis, the fact that the film thickness stands out as the
most critical mix variable followed by VMA may be observed. The rest of the variables
had moderate contributions.
It is important to mention that the contribution of VTM encountered on this analysis
corresponds to air voids within each air void group. The analysis was done this way in
order to avoid the strong effect that high air void content between different mixtures had
on test results in the previous section. Recalling the cause of this situation and explaining
how it was faced is also necessary.

52
During the Phase I specimen preparation, due to lack of quality control, the result was
high dispersion in densities achieved between mixtures, which made it difficult to
compare them. For instance, while the mixtures were designed to have approximately 4
percent air voids, the 4-inch testing samples contained air voids fluctuating from 3.9
percent up to 9.2 percent. The fluctuations on the specimen air voids caused variations on
the rest of the volumetric properties because they are interrelated. A change in air void
content, for instance, modifies the VMA and consequently the VFA values. It became
obvious that a major cause of the high dispersion obtained in the test results was this
large variation in the air void values of the specimens. The approach used to solve this
situation was to classify the HMA mixtures according to the air void content encountered
in the test specimens.

53
Table 20 Variables significant on MTS test results at the 0.05 Level- stepwise multiple regression analysis
% Air
Void
MTS Test
Fundamental Property
1st Step 2nd Step 3rd Step
Variable Prob>F R2 Variable Prob>F R2 Variable Prob>F R2
4 1
Axial Creep
Stiffness Pass 0.075
0.0018 0.996
Slope Film T 0.0043 0.991 Per. Strain Film T 0.01 0.98
IT Creep
Slope Film T 0.0042 0.992
6 1
Axial Creep
Stiffness Dust/A
C 0.001 0.982
Pass 0.075
0.002 0.986
Slope Pass 2.36
0.0012 0.98
Per. Strain Pass 2.36
0.0002 0.994 Dust/AC 0.007 0.999 VTM 0.01 1.0
IT Creep
Slope VMA 0.0001 0.981
8 1
Axial Creep
Stiffness NMAS 0.001 0.978 VMA 0.004 0.99 Film T 0.04 1.0 Slope Film T 0.003 0.962
Per. Strain Film T 0.001 0.98 IT
Creep Slope NMAS 0.0003 0.99
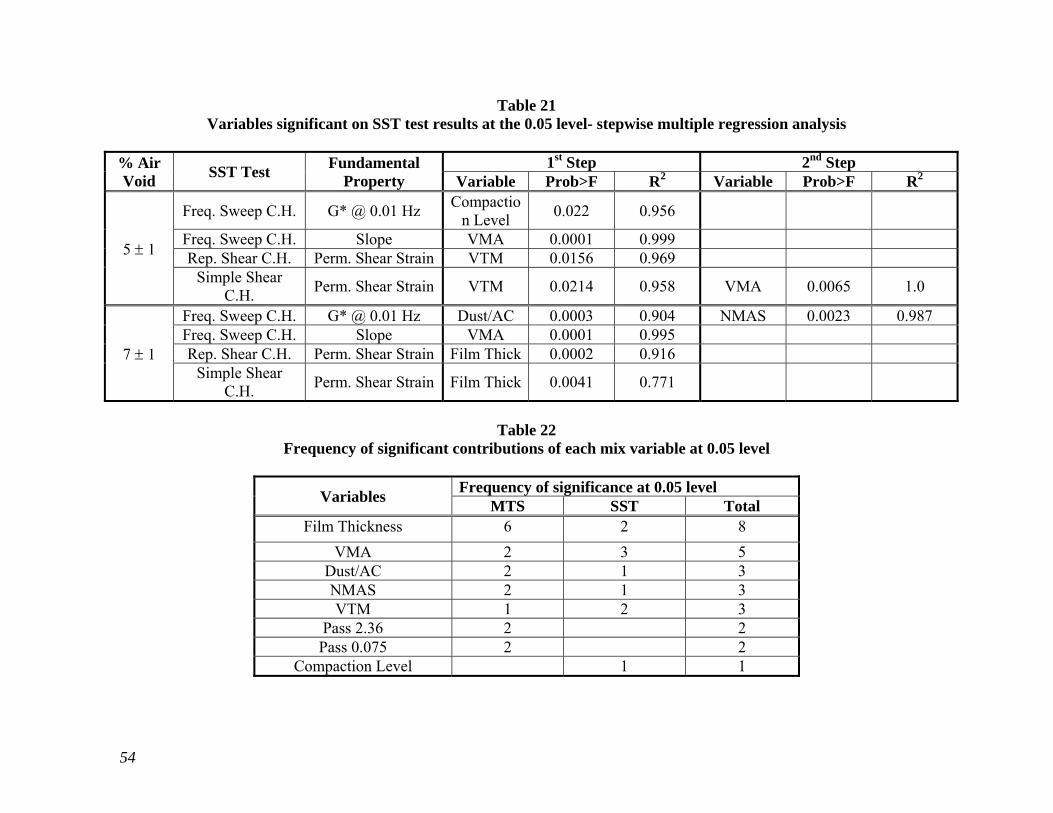
54
Table 21 Variables significant on SST test results at the 0.05 level- stepwise multiple regression analysis
% Air Void
SST Test Fundamental
Property 1st Step 2nd Step
Variable Prob>F R2 Variable Prob>F R2
5 1
Freq. Sweep C.H. G* @ 0.01 Hz Compactio
n Level 0.022 0.956
Freq. Sweep C.H. Slope VMA 0.0001 0.999 Rep. Shear C.H. Perm. Shear Strain VTM 0.0156 0.969
Simple Shear C.H.
Perm. Shear Strain VTM 0.0214 0.958 VMA 0.0065 1.0
7 1
Freq. Sweep C.H. G* @ 0.01 Hz Dust/AC 0.0003 0.904 NMAS 0.0023 0.987 Freq. Sweep C.H. Slope VMA 0.0001 0.995 Rep. Shear C.H. Perm. Shear Strain Film Thick 0.0002 0.916
Simple Shear C.H.
Perm. Shear Strain Film Thick 0.0041 0.771
Table 22
Frequency of significant contributions of each mix variable at 0.05 level
Variables Frequency of significance at 0.05 level
MTS SST Total Film Thickness 6 2 8
VMA 2 3 5 Dust/AC 2 1 3 NMAS 2 1 3 VTM 1 2 3
Pass 2.36 2 2 Pass 0.075 2 2
Compaction Level 1 1

55
Classified Comparison of Mixtures
According to the test results, asphalt mixtures did not show similar responses. Significant
differences in responses existed although all mixtures met Superpave mix design specifications.
Contrasts were found in mixtures belonging to different air void groups (between groups) and in
mixes within a specific air void range (within groups). The apparent reason for such variation in
responses can be attributed, in the first case, to the high dispersion of the specimen air voids.
While these mixtures were designed to have approximately 4 percent air voids, the test
specimens contained air voids fluctuating from 3.9 percent up to 9.2 percent. To determine the
reason for the variation in the second case (within an air void range) and to confirm the results
from the multiple regression analysis, the following comparison of the mixtures was made.
Tables 23 through 27 present a comparison of the mixtures classified in different groups of
NMAS and compaction level. Five variables were included in the comparison to observe the
influence of each on the test results. Again, the air void in the specimens was taken into
consideration in this analysis. Therefore, only the mixes within an air void range could be
compared with each other. Table 23 contains the coefficients of determination R2 obtained from
linear fits between the rut susceptibility ranking and the values of the mix variables included in
Tables 24 to 27.
The variable consistently showing good correlation with the rut susceptibility ranking was binder
film thickness. Higher values of binder film thickness corresponded to higher rutting
susceptibility rankings. A possible explanation for this behavior is that most Superpave mixtures
are coarser than traditional dense-graded pre-Superpave mixes. In other words, Superpave
mixtures have lower surface areas to be coated with binder. However, the minimum VMA
requirement is the same for both types of mixtures. This has resulted in binder film thicknesses
in Superpave mixes that are significantly higher than those generally obtained in pre-Superpave
mixtures, which can lower the stability of the mixtures.
Two other variables, percent of aggregate passing sieve 0.075 and dust/asphalt ratio, also showed
some correlation with rutting susceptibility although, in this case, the relationships were inverse.
Higher values of these interrelated mix variables corresponded to lower susceptibilities to
rutting. Perhaps adding small amounts of fine dust to the binder may have the effect of making
the asphalt cement/dust mixture behave as a more viscous binder, thus increasing the stability.

56
Table 23 Coefficients of determination, R2, between rut ranking and mix variables values
Testing Apparatus
Mix Variable
VMA Pass 2.36 Pass 0.075 Dust/AC Film Thick
MTS 6 ± 1% AV 0.014 0.58 0.07 0.23 0.85
MTS 8 ± 1% AV 0.72 0.03 0.88 0.97 0.94
SST 7 ± 1% AV 0.004 0.94 0.81 0.92 0.69
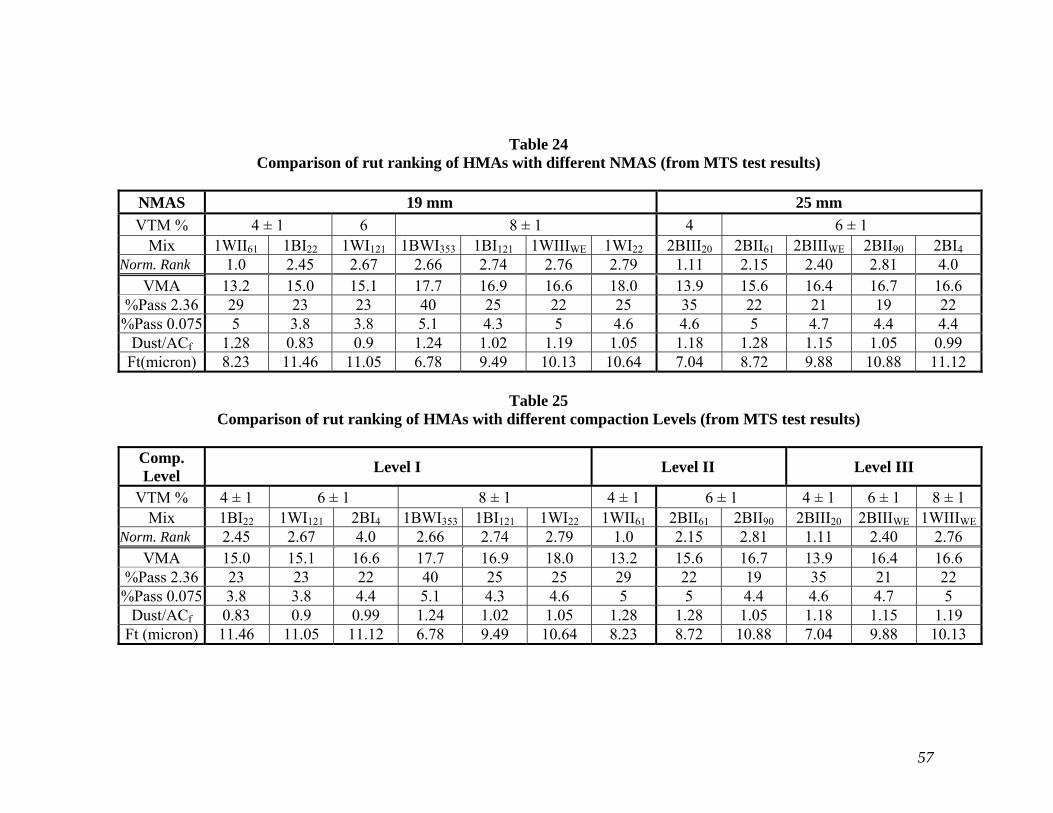
57
Table 24 Comparison of rut ranking of HMAs with different NMAS (from MTS test results)
NMAS 19 mm 25 mm
VTM % 4 ± 1 6 8 ± 1 4 6 ± 1 Mix 1WII61 1BI22 1WI121 1BWI353 1BI121 1WIIIWE 1WI22 2BIII20 2BII61 2BIIIWE 2BII90 2BI4
Norm. Rank 1.0 2.45 2.67 2.66 2.74 2.76 2.79 1.11 2.15 2.40 2.81 4.0 VMA 13.2 15.0 15.1 17.7 16.9 16.6 18.0 13.9 15.6 16.4 16.7 16.6
%Pass 2.36 29 23 23 40 25 22 25 35 22 21 19 22 %Pass 0.075 5 3.8 3.8 5.1 4.3 5 4.6 4.6 5 4.7 4.4 4.4
Dust/ACf 1.28 0.83 0.9 1.24 1.02 1.19 1.05 1.18 1.28 1.15 1.05 0.99 Ft(micron) 8.23 11.46 11.05 6.78 9.49 10.13 10.64 7.04 8.72 9.88 10.88 11.12
Table 25
Comparison of rut ranking of HMAs with different compaction Levels (from MTS test results)
Comp. Level
Level I Level II Level III
VTM % 4 ± 1 6 ± 1 8 ± 1 4 ± 1 6 ± 1 4 ± 1 6 ± 1 8 ± 1 Mix 1BI22 1WI121 2BI4 1BWI353 1BI121 1WI22 1WII61 2BII61 2BII90 2BIII20 2BIIIWE 1WIIIWE
Norm. Rank 2.45 2.67 4.0 2.66 2.74 2.79 1.0 2.15 2.81 1.11 2.40 2.76 VMA 15.0 15.1 16.6 17.7 16.9 18.0 13.2 15.6 16.7 13.9 16.4 16.6
%Pass 2.36 23 23 22 40 25 25 29 22 19 35 21 22 %Pass 0.075 3.8 3.8 4.4 5.1 4.3 4.6 5 5 4.4 4.6 4.7 5
Dust/ACf 0.83 0.9 0.99 1.24 1.02 1.05 1.28 1.28 1.05 1.18 1.15 1.19 Ft (micron) 11.46 11.05 11.12 6.78 9.49 10.64 8.23 8.72 10.88 7.04 9.88 10.13

58
Table 26 Comparison of rut ranking of HMAs with different NMAS (from SST test results)
NMAS 19 mm 25 mm
% Air Void 5 ± 1 7 ± 1 9 ± 1 5 ± 1 7 ± 1 Mix 1WIIIWE 1WII61 1WI22 1BI121 1WI121 1BI22 1BWI353 2BIIIWE 2BII61 2BIII20 2BII90 2BI4
Norm. Rank 2.81 1.00 1.81 3.23 3.49 4.00 2.78 1.78 3.01 2.26 2.57 3.78 VMA % 16.6 13.2 18.0 16.9 15.1 15.0 17.7 16.4 15.6 13.9 16.7 17.2
%Pass 2.36 22 29 25 25 23 23 40 21 22 35 19 22 %Pass 0.075 5 5 4.6 4.3 3.8 3.8 5.1 4.7 5 4.6 4.4 4.4
Dust/ACf 1.19 1.28 1.05 1.02 0.9 0.83 1.24 1.15 1.28 1.18 1.05 0.99 Ft (micron) 10.13 8.23 10.64 9.49 11.05 11.46 6.78 9.88 8.72 7.04 10.88 11.12
Table 27
Comparison of rut ranking of HMAs with different compaction levels (from SST test results) Comp. Level Level I Level II Level III
%Air Void 7 ± 1 9 ± 1 5 ± 1 7 ± 1 5 ± 1 7 ± 1 Mix 1WI22 1BI121 1WI121 2BI4 1BI22 1BWI353 2BII61 1WII61 2BII90 2BIIIWE 1WIIIWE 2BIII20
Norm. Rank 1.81 3.23 3.49 3.78 4.00 2.78 3.01 1.00 2.57 1.78 2.81 2.26 VMA 18.0 16.9 15.1 17.2 15.0 17.7 15.6 13.2 16.7 16.4 16.6 13.9
%Pass 2.36 25 25 23 22 23 40 22 29 19 21 22 35 %Pass 0.075 4.6 4.3 3.8 4.4 3.8 5.1 5 5 4.4 4.7 5 4.6
Dust/ACf 1.05 1.02 0.9 0.99 0.83 1.24 1.28 1.28 1.05 1.15 1.19 1.18 Ft (micron) 10.64 9.49 11.05 11.12 11.46 6.78 8.72 8.23 10.88 9.88 10.13 7.04

59
Summary of the Findings of Phase I Study
The performance and fundamental engineering properties of the 12 Phase I Superpave
mixtures in this project were analyzed. The influence of nine mix variables was considered.
Those variables included: nominal maximum aggregate size (NMAS), mix type, level of
compaction effort, dust/AC ratio, binder film thickness, voids in the total mix, voids in the
mineral aggregate, percentage of aggregate passing the 0.075 mm sieve, and percentage of
aggregate passing the 2.36 mm sieve. The following observations may be made based on the
laboratory study of Phase I Superpave mixtures:
The design compaction level was observed to have certain influences on Superpave mixture
rut susceptibility. Level I compactive effort (Ndesign=96) showed a higher rut susceptibility
than levels II (Ndesign=109) and III (Ndesign=126). However, no significant difference could be
found between mixtures compacted at levels II and III.
Asphalt mixtures in different air void groupings performed differently, but for mixtures
within a certain air void group, the influence of the air void content was often minimal.
Concerning voids in the mineral aggregate VMA, no consistent trend was observed. Results
from the stratified comparison produced very low coefficients of determination, whereas
results from the multiple regression analysis identified this mix variable as one with a high
contribution to test results.
The nominal maximum aggregate size showed no discernable influence on rut susceptibility,
either from studying individual test results or from the multiple regression analysis.
The percentage of aggregate passing the 0.075 mm sieve exhibited an inverse relationship
with the rut susceptibility ranking. Mixtures containing lower values of this variable
appeared to be more susceptible to rutting. This means that increasing the amount of fine
dust (up to a certain limit) by a small amount made the asphalt cement/dust mixture act as a
more viscous binder, thus increasing the stability. The percentage of aggregate passing the
2.36 mm sieve, on the other hand, did not have an effect on the susceptibility to rutting.
Film thickness presented a strong, direct relationship with rut susceptibility. Mixtures with
higher values of binder film thickness were more susceptible to permanent deformation. A
possible explanation of this behavior is that, as those Superpave mixtures considered are
usually coarser than pre-Superpave mixtures, they have lower aggregate surface areas to be
coated with binder. Without a reduction in asphalt cement content, thicker binder films are
caused and have a negative effect on the resistance to permanent deformation. The dust/AC

60
ratio showed an inverse relation with rut susceptibility; that is, mixtures with lower dust/AC
ratios appear to be more susceptible to rutting .
Part II – Phase II Superpave Mixtures
As described earlier, the Phase II projects included 18 Superpave mixtures, which were
designed based on the updated Superpave mix design gyratory compaction table.
Specifically, those mixtures can be categorized into three groups according to three traffic
design levels or gyratory compaction numbers: low volume (Ndes = 75), medium volume
(Ndes = 100), and high volume (Ndes = 125).
Aggregate Gradation Analysis
In order to evaluate the influence of the aggregate gradation on mixture performance, a
Power-law gradation analysis suggested by Ruth et al. [22] was used in this study. As shown
in Figure 18, the Power-law gradation analysis characterizes the slopes and intercepts of the
fine and coarse aggregate portions in an aggregate gradation curve. The Power-law
equations used in this study are expressed as follows:
CACACA
ndaP )( and FA
FAFA
ndaP )( (2)
where,
PCA or PFA = percent by weight passing a given sieve have opening of width d;
aCA = intercept constant for the coarse aggregate;
aFA = intercept constant for the fine aggregate;
d = sieve opening width, mm;
nCA = slope (exponent) for the coarse aggregate; and
nFA = slope (exponent) for the fine aggregate.
Equation (2) indicates that a gradation analysis can be divided into two portions: the coarse
aggregate (CA) and fine aggregate (FA) portions. In this study, a sieve size of 2.36 mm was
selected as a divider for the CA and the FA portions in the regression analysis. In general,
five sieves greater than or equal to 2.36mm were used for CA analysis, whereas four sieves
smaller than the 2.36 mm were used for the FA regression (refers to the JMFs of the Phase II
projects shown in Table 3).

61
Figure 18 Conceptual differences between fine and coarse gradation [12]
Table 28 presents the results of the power law regression gradation analyses for the 18
mixtures considered in the Phase II projects. The coefficients of determination R2 for the
power-law regression equations were greater than 0.90 for all mixtures, as shown in Table
28. For the coarse-graded mixtures, the CA portion should have an nCA > 0.45. The greater
the nCA is, the coarser the CA portion will be. For the FA portion, the nFA value can be either
greater or smaller than 0.45. The higher nFA value indicates that the FA portion of an
aggregate blend is finer.
Figures 19 (a) and (b), respectively, present the relationships between the CA portion
parameters (aCA and nCA) and the relationships between the FA portion parameters (aFA and
nFA) for all mixtures in the Phase II study. In general, both portions appear to have a good
linear correlation, although the linear relationship between aCA and nCA is stronger than that
between aFA and nFA. As the nCA increases, which means that the CA portion of a mixture
blend becomes coarser (e.g., further below the maximum density line), the aCA will decrease.
Similarly, as the nFA increases, the aFA will increase, which will cause the FA portion of a
mixture blend to become finer. Combining all four gradation parameters together will
provide a complete aggregate gradation information for a certain mixture blend. Among the
18 mixtures in this study, the majority of the medium volume and high volume mixtures are
coarser than low volume ones (e.g., higher nCA and lower nFA, Figure 19).
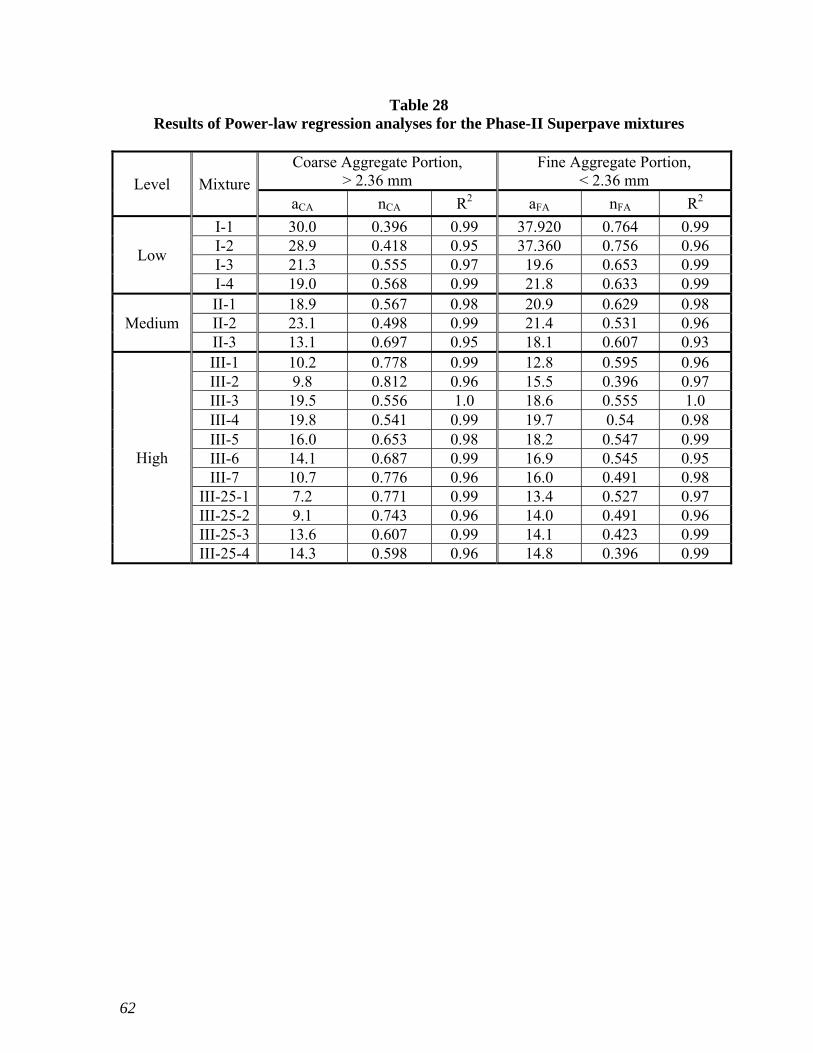
62
Table 28 Results of Power-law regression analyses for the Phase-II Superpave mixtures
Level Mixture
Coarse Aggregate Portion, > 2.36 mm
Fine Aggregate Portion, < 2.36 mm
aCA nCA R2 aFA nFA R2
Low
I-1 30.0 0.396 0.99 37.920 0.764 0.99 I-2 28.9 0.418 0.95 37.360 0.756 0.96 I-3 21.3 0.555 0.97 19.6 0.653 0.99 I-4 19.0 0.568 0.99 21.8 0.633 0.99
Medium II-1 18.9 0.567 0.98 20.9 0.629 0.98 II-2 23.1 0.498 0.99 21.4 0.531 0.96 II-3 13.1 0.697 0.95 18.1 0.607 0.93
High
III-1 10.2 0.778 0.99 12.8 0.595 0.96 III-2 9.8 0.812 0.96 15.5 0.396 0.97 III-3 19.5 0.556 1.0 18.6 0.555 1.0 III-4 19.8 0.541 0.99 19.7 0.54 0.98 III-5 16.0 0.653 0.98 18.2 0.547 0.99 III-6 14.1 0.687 0.99 16.9 0.545 0.95 III-7 10.7 0.776 0.96 16.0 0.491 0.98
III-25-1 7.2 0.771 0.99 13.4 0.527 0.97 III-25-2 9.1 0.743 0.96 14.0 0.491 0.96 III-25-3 13.6 0.607 0.99 14.1 0.423 0.99 III-25-4 14.3 0.598 0.96 14.8 0.396 0.99
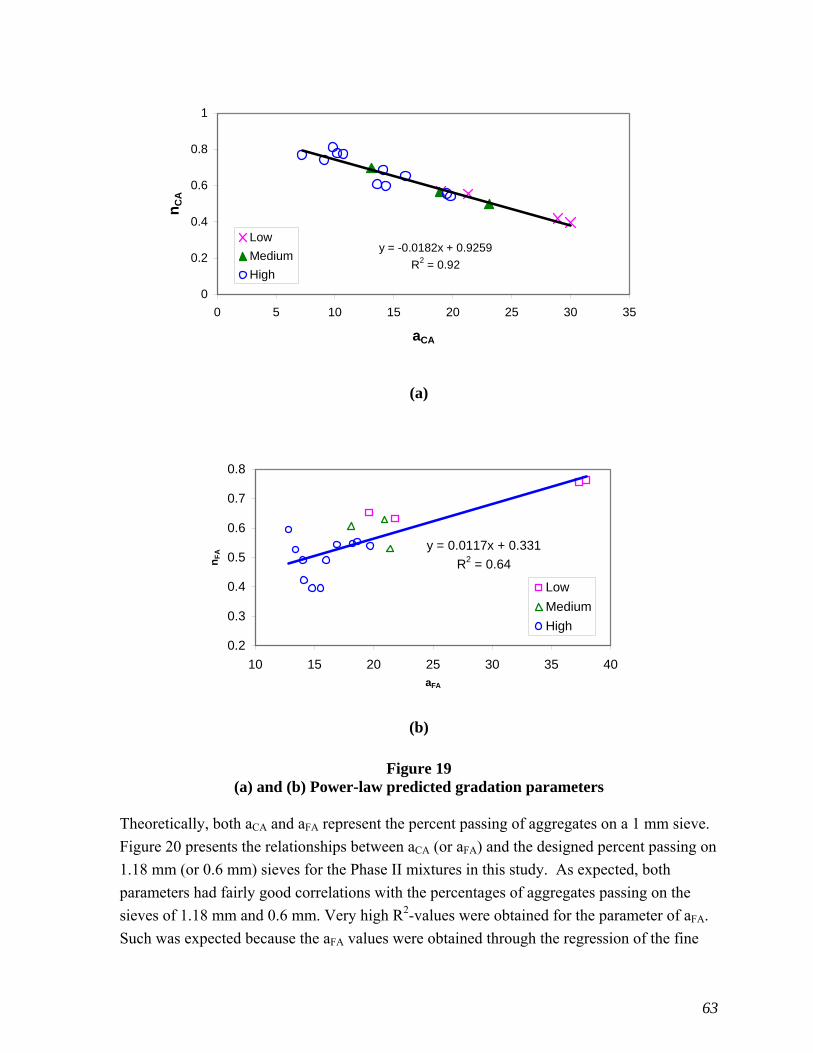
63
y = -0.0182x + 0.9259
R2 = 0.92
0
0.2
0.4
0.6
0.8
1
0 5 10 15 20 25 30 35
aCA
nC
A
Low
Medium
High
(a)
y = 0.0117x + 0.331
R2 = 0.64
0.2
0.3
0.4
0.5
0.6
0.7
0.8
10 15 20 25 30 35 40aFA
nF
A
Low
Medium
High
(b)
Figure 19
(a) and (b) Power-law predicted gradation parameters
Theoretically, both aCA and aFA represent the percent passing of aggregates on a 1 mm sieve.
Figure 20 presents the relationships between aCA (or aFA) and the designed percent passing on
1.18 mm (or 0.6 mm) sieves for the Phase II mixtures in this study. As expected, both
parameters had fairly good correlations with the percentages of aggregates passing on the
sieves of 1.18 mm and 0.6 mm. Very high R2-values were obtained for the parameter of aFA.
Such was expected because the aFA values were obtained through the regression of the fine

64
portion of a gradation curve, in which the percent passings on both 1.18 mm and 0.6 mm
sieves were directly included in the analysis.
In addition, the fact that the nCA and nFA parameters represent the curvature properties of the
coarse and fine portions of a gradation curve, respectively is noted. When the overall
gradation curves change, they will change accordingly. Therefore, the four Power Law
parameters (aCA, aFA, nCA, and nFA) presented in Table 28 can be used to describe a whole
gradation curve without knowing the detail gradation information (i.e., sieve percent
passing). Thus, those gradation parameters will be used in the following mixture performance
analysis.
R2 = 0.88
0
5
10
15
20
25
30
35
40
0.0 10.0 20.0 30.0 40.0
Percent passing of 1.18mm sieve
a CA
R2 = 0.73
0
5
10
15
20
25
30
35
0.0 10.0 20.0 30.0 40.0
Percent passing 0.6mm sieve
a CA
R2 = 0.97
0
5
10
15
20
25
30
35
40
0.0 10.0 20.0 30.0 40.0
Percnet passing 1.18mm sieve
a FA
R2 = 0.99
0
5
10
15
20
25
30
35
0.0 10.0 20.0 30.0 40.0
Percent passing 0.6mm sieve
a FA
Figure 20 Relationships between gradation parameters and sieve percent passing
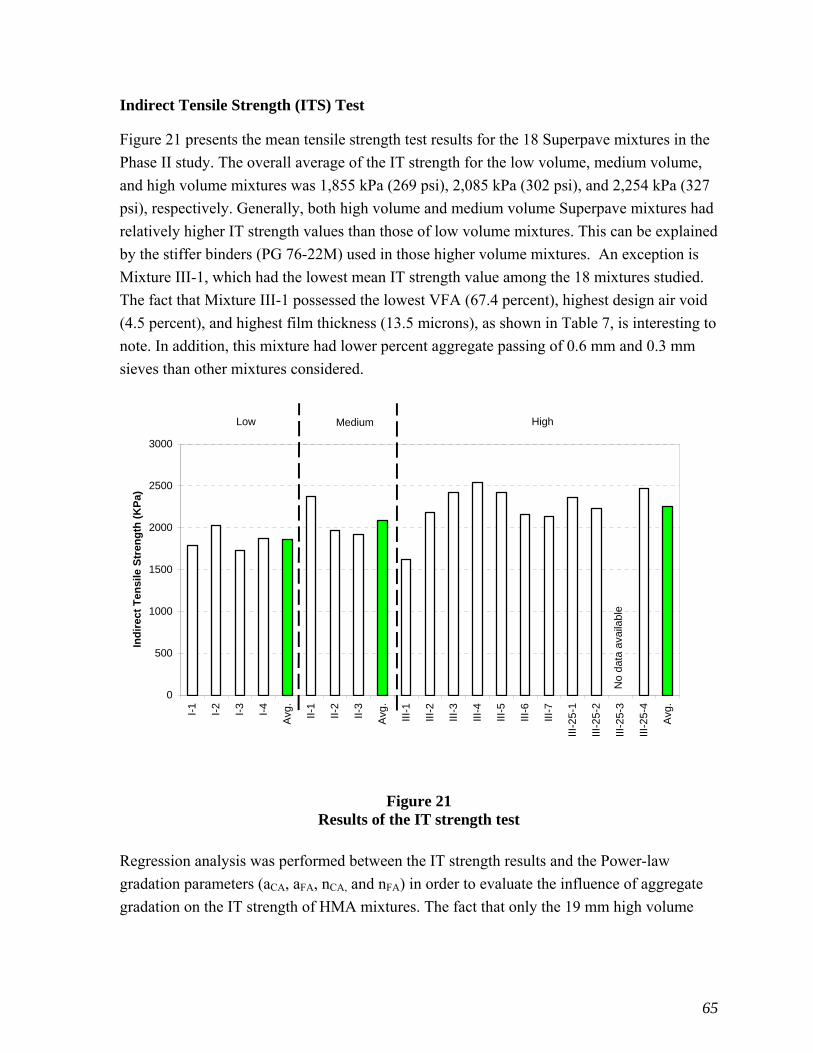
65
Indirect Tensile Strength (ITS) Test
Figure 21 presents the mean tensile strength test results for the 18 Superpave mixtures in the
Phase II study. The overall average of the IT strength for the low volume, medium volume,
and high volume mixtures was 1,855 kPa (269 psi), 2,085 kPa (302 psi), and 2,254 kPa (327
psi), respectively. Generally, both high volume and medium volume Superpave mixtures had
relatively higher IT strength values than those of low volume mixtures. This can be explained
by the stiffer binders (PG 76-22M) used in those higher volume mixtures. An exception is
Mixture III-1, which had the lowest mean IT strength value among the 18 mixtures studied.
The fact that Mixture III-1 possessed the lowest VFA (67.4 percent), highest design air void
(4.5 percent), and highest film thickness (13.5 microns), as shown in Table 7, is interesting to
note. In addition, this mixture had lower percent aggregate passing of 0.6 mm and 0.3 mm
sieves than other mixtures considered.
0
500
1000
1500
2000
2500
3000
I-1
I-2
I-3
I-4
Avg
.
II-1
II-2
II-3
Avg
.
III-1
III-2
III-3
III-4
III-5
III-6
III-7
III-2
5-1
III-2
5-2
III-2
5-3
III-2
5-4
Avg
.
Ind
irec
t T
ensi
le S
tren
gth
(K
Pa)
Low Medium High
No
data
ava
ilabl
e
Figure 21 Results of the IT strength test
Regression analysis was performed between the IT strength results and the Power-law
gradation parameters (aCA, aFA, nCA, and nFA) in order to evaluate the influence of aggregate
gradation on the IT strength of HMA mixtures. The fact that only the 19 mm high volume

66
mixtures were used in the regression analysis is noted. Other mixtures were not considered,
due to the following considerations:
Three different aggregate types (granite, rhyolite, and limestone) were used in the
four low volume mixtures; two of them were fine-graded, while the other two
were coarse-graded.
The medium volume mixture group consisted of only three mixtures but with two
types of aggregates (novaculite and limestone).
25 mm mixtures in the group of high volume, shown in Figure 21, contained
different percentages of RAP materials (Table 6).
In general, because of different binder type, aggregate type, and RAP percentage
among different mixture groups, gradation analysis was conducted separately.
Figure 22 presents the correlations between the four gradation parameters and the IT strength
test results for the 19 mm high volume mixtures considered. As shown in Figure 22, both
intercepts aCA and aFA had a strong linear correlation with the IT strengths, especially for the
intercept aFA (R2=0.92). The IT strengths increased with an increase in aCA or aFA. Similar
correlation analyses were performed between slopes nCA and nFA and the IT strengths. The
slope nCA showed a moderate correlation with IT strength, whereas the slope nFA possessed a
poor correlation, as shown in Figure 22.

67
Figure 22 Gradation analysis on ITS test results for 19 mm high volume mixtures
In summary, the IT strength was fairly sensitive to the gradation intercept aFA or aCA. As the
largest sieve size used in the fine aggregate portion regression was the 1.18mm sieve (smaller
than the 2.36mm sieve), the aFA intercept can be used as a parameter to approximate the total
percentage of fine aggregates in a mixture. Thus, the IT strength increases with an increase in
intercept aFA, or the total percentage of fine aggregates in a mixture, as shown in Figure 22.
Indirect Tensile Resilient Modulus (Mr) Test
Figures 23-25 present the resilient modulus test results of the 18 Phase II Superpave mixtures
at 5, 25, and 40o C, respectively. The overall average of the IT Mr values for the low volume,
medium volume, and high volume mixtures, respectively, were: 5,234 MPa (759.7 ksi),
4,742 MPa (688.3 ksi), and 4,395 MPa (637.9 ksi) at 5 o C; 4,187 MPa (607.7 ksi), 3,493
MPa (507.0 ksi), and 3,690 MPa (535.5 ksi) at 25 o C; and 2,744 MPa (398.3 ksi), 2,772 MPa
(402.3 ksi), and 2,660 MPa (386.1 ksi) at 40 o C. It is noted that the average Mr values for the
low volume Superpave mixtures appeared to be slightly greater than other traffic group
mixtures at temperatures of 5 and 25 o C. However, this observation was based only on three
R2 = 0.69
100
150
200
250
300
350
400
0 10 20 30 40aCA
IT S
tren
gth
(p
si)
R2 = 0.92
100
150
200
250
300
350
400
0 10 20 30 40
aFA
IT S
tren
gth
(p
si)
R2 = 0.54
100
150
200
250
300
350
400
0.2 0.4 0.6 0.8 1.0
nCA
IT S
tren
gth
(p
si)
R2 = 0.05
100
150
200
250
300
350
400
0.2 0.4 0.6 0.8nFA
IT S
tren
gth
(p
si)

68
mixtures (I-1, I-3, and I-4) in the low volume mixture group. In general, the indirect tensile
resilient modulus test results indicate that the Mr values for high volume, medium volume,
and low volume mixtures in this study essentially had similarly elastic characteristics at
different test temperatures. The fact that polymer-modified binders were used in all mixtures
may account for this similarity in elasticity.
0
1000
2000
3000
4000
5000
6000
7000
I-1
I-2
I-3
I-4
Avg
.
II-1
II-2
II-3
Avg
.
III-
1
III-
2
III-
3
III-
4
III-
5
III-
6
III-
7
III-
25
-1
III-
25
-2
III-
25
-3
III-
25
-4
Avg
.
Ind
irec
t T
ensi
le R
esil
ien
t M
od
ulu
s at
5°C
(M
Pa)
No
dat
a a
vaila
ble
Low Medium High
Figure 23
IT Mr test results at 5oC

69
0
1000
2000
3000
4000
5000
6000
I-1
I-2
I-3 I-4
Avg
.
II-1
II-2
II-3
Avg
.
III-1
III-2
III-3
III-4
III-5
III-6
III-7
III-2
5-1
III-2
5-2
III-2
5-3
III-2
5-4
Avg
.Ind
irec
t T
ensi
le R
esil
ien
t M
odu
lus
at 2
5°C
(MP
a)
No
data
ava
ilabl
e
Low Medium High
Figure 24 IT Mr test results at 25oC
0
500
1000
1500
2000
2500
3000
3500
4000
I-1
I-2
I-3
I-4
Avg
.
II-1
II-2
II-3
Avg
.
III-1
III-2
III-3
III-4
III-5
III-6
III-7
III-2
5-1
III-2
5-2
III-2
5-3
III-2
5-4
Avg
.
Indi
rect
Ten
sile
Res
ilien
t M
od
ulu
s at
40°
C (
MP
a)
No
dat
a av
aila
ble
Low Medium High
Figure 25
IT Mr test results at 40oC

70
Gradation analysis was performed on the resilient modulus test results at different test
temperatures. Regression results indicate that no significant correlations could be observed
between the gradation parameters (aCA, aFA, nCA, and nFA) and Mr values for any mixture
group at any test temperatures. Figure 26 shows the variations between the Mr values at 40o C
and the gradation parameters. A possible explanation is that, under the resilient modulus test
conditions, the elasticity of binder plays a more dominant role in the elastic characteristic of a
mixture than different aggregates and structures.
0
100
200
300
400
500
600
0.0 10.0 20.0 30.0 40.0
aCA
Mr
at
40
C(p
si)
LowMediumHigh-19mmHigh-25mm
0
100
200
300
400
500
600
0.0 10.0 20.0 30.0 40.0
aFA
Mr
at 4
0C(p
si)
Low
Medium
High-19mm
High-25mm
0
100
200
300
400
500
600
0.00 0.20 0.40 0.60 0.80 1.00
nCA
Mr
at 4
0C(p
si)
LowMediumHigh-19mmHigh-25mm
0
100
200
300
400
500
600
0.00 0.20 0.40 0.60 0.80 1.00
nFA
Mr
at 4
0C(p
si)
LowMediumHigh-19mmHigh-25mm
Figure 26 Gradation analysis on IT Mr test results at 40oC
Indirect Tensile (IT) Creep Test
Figure 27 presents the mean IT creep slope results of the 18 asphalt mixtures in the Phase II
project. In this test, a lower creep slope is desired for rut resistant mixtures. Among the
group, Mixture III-25-2 possessed the lowest IT creep slope, whereas Mixture I-3 had the
highest. The overall average of the IT creep slope for the low volume, medium volume, and
high volume mixtures was 0.37, 0.31, and 0.35 log-psi/log-sec, respectively. It is expected

71
that high volume mixtures have lower creep slopes than low volume mixtures, indicating
better rut resistance. However, no such observation can be made in this study, as shown in
Figure 27.
0.00
0.05
0.10
0.15
0.20
0.25
0.30
0.35
0.40
0.45
0.50
I-1
I-2
I-3
I-4
Avg
.
II-1
II-2
II-3
Avg
.
III-
1
III-
2
III-
3
III-
4
III-
5
III-
6
III-
7
III-
25-1
III-
25-2
III-
25-3
III-
25-4
Avg
.
IT C
reep
Slo
pe
(lo
g-p
si/l
og
-sec
)
Low Medium High
Figure 27 Indirect tensile creep test results
Figure 28 presents the variation of the slopes (nCA and nFA) and intercepts (aCA and aFA) of
the Power-law gradation parameters with the creep slope of the high-volume 19 mm
mixtures. A parabolic type of relationship was observed between creep slopes and all four
gradation parameters (aCA, nCA, aFA, and nFA). The minimum value in this curve corresponds
to the lowest creep slope, indicating an optimum value for each gradation parameter that
yields a rut resistant mixture. From the previous section, the fact that an increase in
intercepts aCA or aFA yielded an increase in the IT strength, as shown in Figure 26, may be
noted. Thus, a proper selection of these parameters, such as aFA or aCA, has the potential of
providing a balance between rut-resistant and durable mixtures. In summary, gradation
parameters were found to be sensitive to the IT creep slope.
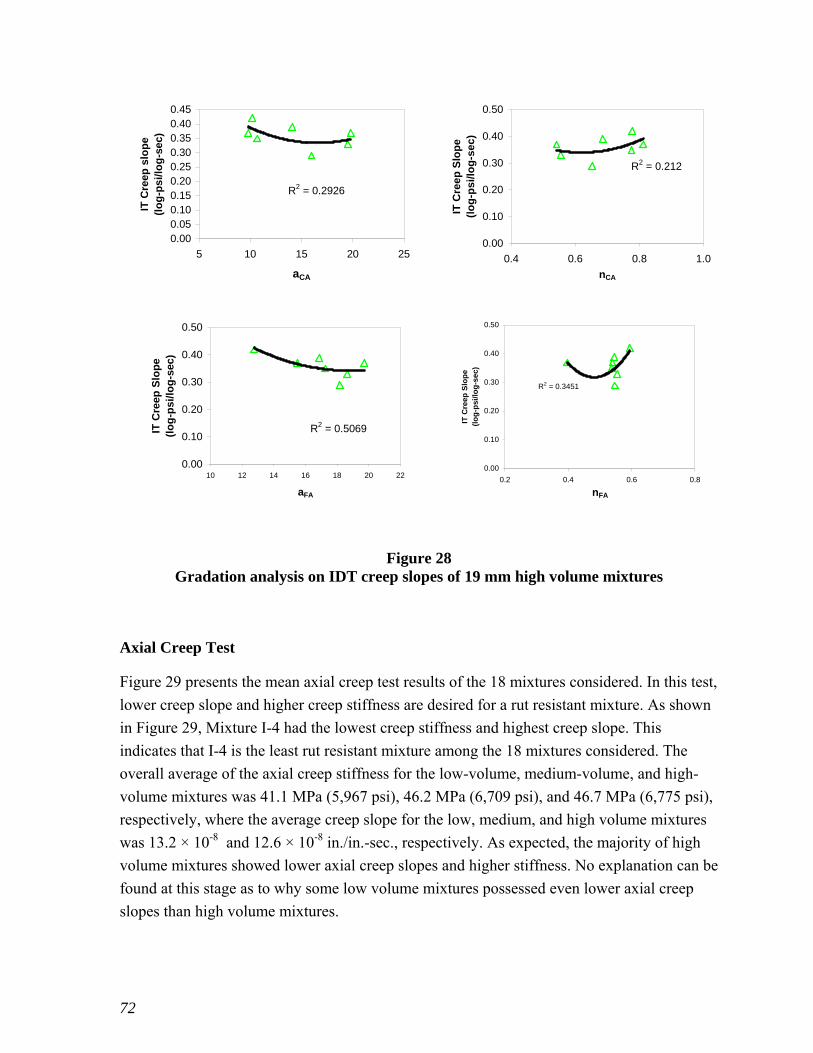
72
R2 = 0.2926
0.000.050.100.150.200.250.300.350.400.45
5 10 15 20 25
aCA
IT C
reep
slo
pe
(lo
g-p
si/
log
-sec
)
R2 = 0.212
0.00
0.10
0.20
0.30
0.40
0.50
0.4 0.6 0.8 1.0
nCA
IT C
ree
p S
lop
e(l
og
-ps
i/lo
g-s
ec
)
R2 = 0.5069
0.00
0.10
0.20
0.30
0.40
0.50
10 12 14 16 18 20 22
aFA
IT C
reep
Slo
pe
(lo
g-p
si/l
og
-sec
)
R2 = 0.3451
0.00
0.10
0.20
0.30
0.40
0.50
0.2 0.4 0.6 0.8
nFA
IT C
reep
Slo
pe
(lo
g-p
si/l
og
-sec
)
Figure 28
Gradation analysis on IDT creep slopes of 19 mm high volume mixtures
Axial Creep Test
Figure 29 presents the mean axial creep test results of the 18 mixtures considered. In this test,
lower creep slope and higher creep stiffness are desired for a rut resistant mixture. As shown
in Figure 29, Mixture I-4 had the lowest creep stiffness and highest creep slope. This
indicates that I-4 is the least rut resistant mixture among the 18 mixtures considered. The
overall average of the axial creep stiffness for the low-volume, medium-volume, and high-
volume mixtures was 41.1 MPa (5,967 psi), 46.2 MPa (6,709 psi), and 46.7 MPa (6,775 psi),
respectively, where the average creep slope for the low, medium, and high volume mixtures
was 13.2 × 10⁻⁸ and 12.6 × 10⁻⁸ in./in.-sec., respectively. As expected, the majority of high
volume mixtures showed lower axial creep slopes and higher stiffness. No explanation can be
found at this stage as to why some low volume mixtures possessed even lower axial creep
slopes than high volume mixtures.

73
0.0
10.0
20.0
30.0
40.0
50.0
60.0
70.0
I-1 I-2
I-3
I-4
Avg
.
II-1
II-2
II-3
Avg
.
III-1
III-2
III-3
III-4
III-5
III-6
III-7
III-
25-1
III-2
5-2
III-2
5-3
III-2
5-4
Avg
.
Axi
al C
reep
Sti
ffn
ess
(Mpa
)
No
data
ava
ilabl
e
Low Medium High
0.0
5.0
10.0
15.0
20.0
25.0
30.0
I-1 I-2
I-3
I-4
Avg
.
II-1
II-2
II-3
Avg
.
III-1
III-2
III-
3
III-4
III-5
III-6
III-7
III-2
5-1
III-2
5-2
III-2
5-3
III-2
5-4
Avg
.
Axi
al C
reep
Slo
pe
(E-8
inch
/inch
-sec
)
No
data
avai
labl
e
No
data
ava
ilabl
e
Low Medium High
Figure 29 Axial creep test results
Figure 30 presents the variation of the slopes (nCA and nFA) and intercepts (aCA and aFA) of
the Power-law gradation analysis with the axial creep slope for the high volume 19 mm
mixtures. Similar to the IT creep slope analysis, a parabolic relationship was observed
between creep slopes and all four gradation parameters (aCA, nCA, aFA, and nFA).
The best correlation was obtained between the axial creep slope and the intercept aFA (R2
=0.94). This observation confirms the parabolic correlations found in the IT creep tests and
further indicates the sensitivity of gradation parameters on the creep properties of asphalt
mixtures.

74
R2 = 0.21
0.0
4.0
8.0
12.0
0.0 5.0 10.0 15.0 20.0 25.0aCA
AX
C P
erm
anen
t S
trai
n
(mic
ro s
trai
n)
R2 = 0.16
0.0
4.0
8.0
12.0
0.4 0.6 0.8 1.0
nCA
AX
C P
erm
anen
t S
trai
n
(mic
ro s
trai
n)
R2 = 0.94
0.0
4.0
8.0
12.0
10.0 12.0 14.0 16.0 18.0 20.0 22.0
aFA
AX
C P
erm
an
en
t S
trai
n (
mic
ro
str
ain
)
R2 = 0.39
0.0
4.0
8.0
12.0
0.2 0.4 0.6 0.8
nFAA
XC
Per
man
ent
Str
ain
(m
icro
str
ain
)
Figure 30
Gradation analysis on axial creep slopes of high volume mixtures Frequency Sweep at Constant Height Test
Figure 31 presents the mean ratio of the complex shear modulus and phase angle G*/sin() at
10 and 1 Hz, respectively. The complex shear modulus (G*) is defined as the ratio of the
peak stress amplitude to the peak strain amplitude. It is a measure of the total stiffness of
asphalt mixtures and is composed of elastic and viscous components. Phase angle () is
defined as the time lag between the application of a stress and the resulting strain. The
property G*/sin() is considered as an indicator of mixtures’ susceptibility to permanent
deformation. A higher G*/sin() value is desired for rut resistant mixtures. As shown in
Figure 31, the overall averages of the G*/sin() values for the low volume, medium volume,
and high volume mixtures, respectively, were:115.6 MPa (16.8 ksi), 100.7 MPa (14.6 ksi),
and 126.0 MPa (18.3 ksi) at 10 Hz; and 50.6 MPa (7.3 ksi), 53.1 MPa (7.7 ksi), and 49.5
MPa (7.2 ksi) at 1 Hz. Although the rankings of G*10Hz/sin() and G*1Hz/sin() were slightly
different, both tended to indicate slightly higher average moduli for high volume mixtures.

75
0
5000
10000
15000
20000
25000
30000
35000
I-1
I-2
I-3
I-4
Avg
.
II-1
II-2
II-3
Avg
.
III-
1
III-
2
III-
3
III-
4
III-
5
III-
6
III-
7
III-
25
-1
III-
25
-2
III-
25
-3
III-
25
-4
Avg
.
G* 1
0Hz/
sin
(del
ta)
(psi
)
No
data
ava
ilabl
e
No
dat
a a
vaila
ble
Low Medium High
0
2000
4000
6000
8000
10000
12000
14000
16000
18000
I-1
I-2
I-3
I-4
Avg
.
II-1
II-2
II-3
Avg
.
III-
1
III-
2
III-
3
III-
4
III-
5
III-
6
III-
7
III-
25
-1
III-
25
-2
III-
25
-3
III-
25
-4
Avg
.
G*1
Hz/
sin
(del
ta)
(psi
)
No
da
ta a
vaila
ble
No
da
ta a
vaila
ble
Low Medium High
Figure 31 Complex shear modulus test results at 60ºC
Figure 32 shows the variation of the slopes (nCA and nFA) of the Power-law gradation analysis
with the property G*10Hz/sin() for the high volume 19 mm mixtures. The property
G*10Hz/sin() increased with an increase in nCA and a decrease in nFA, as shown in Figure
32. This trend is consistent with the gradation parameters reported in Table 28 for the high
volume mixture. As stated earlier, an increase in nCA indicates a coarser coarse aggregate
portion of the gradation curve, and a decrease in nFA results in a coarser fine aggregate
portion. Similar trends were obtained for G*/sin() at 1 Hz and other frequencies.

76
R2 = 0.51
0
5000
10000
15000
20000
25000
0.4 0.6 0.8 1.0
nCA
G*/
sin
(del
ta)
at 1
0 H
z (p
si)
R2 = 0.31
0
5000
10000
15000
20000
25000
0.2 0.4 0.6 0.8
nFA
G*/
sin
(del
ta)
at 1
0Hz,
(p
si)
Figure 32 Gradation analysis on G*10Hz /sin () of high-volume mixtures at 60ºC
Repetitive Shear at Constant Height (RSCH) Test
Figure 33 presents the mean permanent shear strain results of the 18 mixtures considered.
Lower permanent shear strain is desired for rut resistant mixtures. The permanent shear
strains of all the mixtures were below the 5 percent limit at 5,000 cycles. The overall
average of the permanent shear strains for the low volume, medium volume, and high volume
mixtures was 2.6, 1.3, and 2.0 percent, respectively. Two medium volume mixtures had a
relatively low permanent shear strain in this study. Significant variation of the measure
permanent shear strains can be observed among low volume and high volume mixtures.
Again, Mixture III-1 had the highest permanent shear strain in the high volume mixture
group.
0
5000
10000
15000
20000
25000
30000
35000
40000
45000
I-1
I-2 I-3
I-4
Avg
.
II-1
II-2
II-3
Avg
.
III-1
III-2
III-3
III-4
III-5
III-6
III-7
III-2
5-1
III-2
5-2
III-2
5-3
III-2
5-4
Avg
.
RS
CH
Per
man
ent S
trai
n(m
icro
str
ain
)
No
data
il
bl
No
dat
a
Low Mediu High
Figure 33
RSCH permanent shear strain test results at 60ºC

77
R2 = 0.45
0
10000
20000
30000
40000
0.2 0.4 0.6 0.8nFA
RS
CH
Per
man
ent
Str
ain
(m
icro
st
rain
)
Figure 34
Gradation analysis on RSCH test results of high volume mixtures at 60ºC Figure 34 shows the variation of the slope nFA of the Power-law gradation analysis with the
permanent shear strain for the high volume 19 mm mixtures considered. The permanent
strain increased with an increase in nFA. This trend is consistent in performance with the one
obtained from the FSCH results, i.e., lower G*/sinδ yields higher permanent shear strain as
nFA increases, as shown in Figure 32. Other gradation parameters did not provide good
correlations with the RSCH test results. The results from the RSCH test are sensitive to the
fine portion (FA) of the aggregate gradation. As the FA portion becomes coarser (increase in
nFA), more permanent shear strains are accumulated.
Simple Shear at Constant Height (SSCH) Test
Figure 35 presents the mean permanent shear strain of the SSCH test results for the 18
mixtures evaluated. Lower permanent shear strain is desired for rut resistant mixtures. The
overall average of the permanent shear strains for the low volume, medium volume, and high
volume mixtures was 2,938, 2,134, and 3,753 micro strains, respectively. As shown in Figure
35, significant variation of the measured permanent shear strains can be observed among low
volume and high volume mixtures. High-volume mixtures are expected to show higher
permanent shear strain in the SSCH tests than lower volume mixtures. As described earlier,
in an SSCH test, the specified shear stress of 35 kPa is held constant for 10 seconds and then
released (unloading 15 seconds) at a specific rate. Therefore, the significant test variation
found in this study could be explained by the high testing temperature (60º C) and a very
short unloading period. In other words, under a high temperature test condition, the
unloading (releasing) time of 15 seconds may not be long enough for some of the high
volume mixtures, as shown in Figure 35.
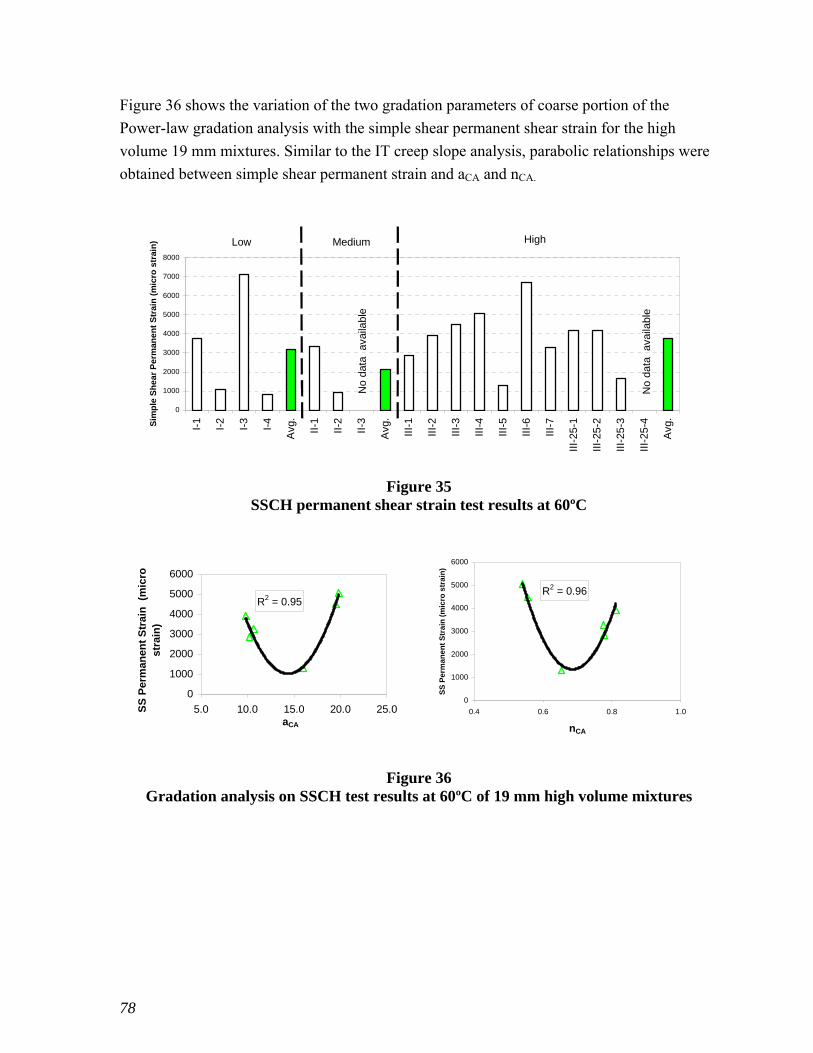
78
Figure 36 shows the variation of the two gradation parameters of coarse portion of the
Power-law gradation analysis with the simple shear permanent shear strain for the high
volume 19 mm mixtures. Similar to the IT creep slope analysis, parabolic relationships were
obtained between simple shear permanent strain and aCA and nCA.
0
1000
2000
3000
4000
5000
6000
7000
8000
I-1
I-2
I-3
I-4
Avg
.
II-1
II-2
II-3
Avg
.
III-
1
III-
2
III-
3
III-
4
III-
5
III-
6
III-
7
III-
25-1
III-
25-2
III-
25-3
III-
25-4
Avg
.
Sim
ple
Sh
ear
Per
man
ent
Str
ain
(m
icro
str
ain
) Medium HighLow
No
data
av
aila
ble
No
data
av
aila
ble
Figure 35
SSCH permanent shear strain test results at 60ºC
R2 = 0.95
0
1000
2000
3000
4000
5000
6000
5.0 10.0 15.0 20.0 25.0aCA
SS
Per
man
ent
Str
ain
(m
icro
st
rain
)
R2 = 0.96
0
1000
2000
3000
4000
5000
6000
0.4 0.6 0.8 1.0
nCA
SS
Pe
rma
ne
nt
Str
ain
(m
icro
str
ain
)
Figure 36 Gradation analysis on SSCH test results at 60ºC of 19 mm high volume mixtures

79
APA Rut Test
Figure 37 presents the mean rut depths of the APA test results for the 18 mixtures evaluated.
Lower APA rut depths are desired for rut resistant mixtures. The overall average of the APA
rut depths for the low volume, medium volume, and high volume mixtures was 5.8, 2.4, and
3.5 mm, respectively. The medium volume and high volume mixtures are expected to have
much lower mean rut depths than the low volume mixtures, which indicates better rut
resistance. The exception is Mixture III-6, which is a 19 mm binder course mixture
containing 20 percent RAP materials.
0.0
1.0
2.0
3.0
4.0
5.0
6.0
7.0
8.0
9.0
10.0
I-1 I-2
I-3
I-4
Avg
.
II-1
II-2
II-3
Avg
.
III-1
III-2
III-3
III-4
III-5
III-6
III-7
III-2
5-1
III-2
5-2
III-2
5-3
III-2
5-4
Avg
.
AP
A R
ut
Dep
th (
mm
)
No
dat
a av
aila
ble
Low Mediu High
Figure 37
APA test results at 60ºC
Figure 38 presents the variation of the four gradation parameters from the Power-law
gradation analysis with the APA rut depths for the 18 Superpave mixtures evaluated.
Regression results indicate that no strong correlations could be obtained between gradation
parameters (aCA, aFA, nCA, and nFA) and APA rut depths for any mixture groups in this study.
However, the influence trends of the gradation parameters to the rut susceptibility of asphalt
mixtures were found consistent with other performance test results in this study, that is,
parabolic trends for aCA and aFA to APA rut depths and linear trends for nCA and nFA to APA
rut depths, respectively.

80
0
2
4
6
8
10
0.0 10.0 20.0 30.0 40.0
aCA
AP
A R
ut
Dep
th (
mm
)
LowMediumHigh-19mmHigh-25mm
0
2
4
6
8
10
0.0 10.0 20.0 30.0 40.0
aFA
AP
A R
ut
Dep
th (
mm
)
LowMediumHigh-19mmHigh-25mm
0
2
4
6
8
10
0.00 0.20 0.40 0.60 0.80 1.00
nCA
AP
A R
ut
Dep
th (
mm
)
LowMediumHigh-19mmHigh-25mmLinear (Low)
0
2
4
6
8
10
0.00 0.20 0.40 0.60 0.80 1.00
nFA
AP
A R
ut
Dep
th (
mm
)
LowMediumHigh-19mmHigh-25mmLinear (Low)
Figure 38
Gradation analysis on APA test results at 60ºC of high volume mixtures

81
Variations of Volumetric Properties on Laboratory Test Results
Figures 39-40 present the variations of VMA and air voids with permanent shear strain of the
RSCH test and G*10Hz/sinδ of the FSCH test, respectively. These test properties do not
appear to have been sensitive to variations in VMA and air voids for the mixtures evaluated.
However, these properties were sensitive to parameters obtained from the gradation analysis
described in the preceding section.
0
10000
20000
30000
40000
15.0 16.0 17.0 18.0 19.0
VMA (%)
High-Volume
Low-Volume
0
10000
20000
30000
40000
4.0 5.0 6.0 7.0 8.0 9.0 10.0
Air voids (%)
High-Volume
Low-Volume
Figure 39 Variation of VMA and air voids with RSCH permanent shear strain at 60ºC
0
50
100
150
200
250
14.0 16.0 18.0 20.0
VMA (%)
G* 1
0Hz/
sin
(del
ta),
MP
a
High-Volume
Low-Volume
0
50
100
150
200
250
5.0 6.0 7.0 8.0 9.0 10.0 11.0
Air Voids (%)
High-Volume
Low-Volume
Figure 40
Variation of VMA and air voids with FSCH tests at 60ºC properties
82
Figure 41 presents the relation between volumetric properties (VMA and air voids) and
properties of IT strength and IT and axial creep tests. In general, these relationships were not
strong, as measured by the coefficient of determination, R2. A decrease in the IT strength was
observed with an increase in VMA and air voids, whereas the creep slope (IT and axial)
increased with an increase in VMA and air voids for the mixtures evaluated, as shown in
Figure 41. This observation indicates that increasing VMA or air voids worsen the mixture
quality as measured by those tests. The properties obtained from the IT and axial mode of
testing showed trends of correlations, but no trends were observed in properties obtained
from shear mode of testing, as shown in Figure 40.

83
1000
1500
2000
2500
3000
11.0 12.0 13.0 14.0 15.0 16.0 17.0VMA (%)
IT S
tren
gth
(K
Pa)
High-Volume
Low-Volume
1000
1500
2000
2500
3000
2.5 3.5 4.5 5.5Air Voids (%)
IT S
tren
gth
(K
Pa)
High-Volume
Low-Volume
0
0.1
0.2
0.3
0.4
0.5
0.6
11.0 12.0 13.0 14.0 15.0 16.0 17.0
VMA (%)
IT C
ree
p S
lop
e
(lo
g-K
Pa/
log
-sec
)
High-Volume
Low-Volume
0
0.1
0.2
0.3
0.4
0.5
0.6
2.5 3.5 4.5 5.5
Air Voids (%)
IT C
ree
p S
lop
e
(lo
g-K
Pa/
log
-sec
)
High-Volume
Low-Volume
0
10
20
30
11 12 13 14 15 16 17
VMA (%)
Axi
al C
reep
Slo
pe
(E-8
mm
/mm
/sec
)
High-Volume
Low-Volume
0
10
20
30
2.5 3.5 4.5 5.5
Air Voids (%)
High-Volume
Low-Volume
Figure 41
Variation of VMA and air voids with ITS at 25ºC, IT and axial creep at 40ºC test properties
R2 = 0.39 R2 = 0.15
R2 = 0.27 R2 = 0.19
R2 = 0.18 R2 = 0.05

84
Overall Ranking of Rutting Susceptibility
Similar to the overall ranking concept used among the Phase I mixtures (Tables 18-19),
Tables 27-28 present the overall ranking of the rutting susceptibility of the 18 Superpave
mixtures based on MTS and SST test results, respectively. Each mixture is ranked
numerically from one to four within a comparison group for each performance test. Ranks
that have smaller numbers tend to be less susceptible to rutting based on that particular item.
In other words, a mixture ranking of one indicates less susceptibility to rutting than a ranking
of two. Summing up all points of a mixture from all the tests, a total point is obtained.
Consequently, a mixture with a lower ranking number is anticipated to resist rutting better
than the ones that have higher ranking numbers.
As shown in Tables 29 and 20, the ranking of rutting susceptibility from the MTS test results
is different from that from the SST test results. In general, the majority of mixtures in the
Phase II study should be considered as rutting resistant mixtures, as indicated by the ranking
of less than 2.0. The average ranking numbers based on the MTS tests were 2.5, 1.9, and 2.2,
whereas, based on the SST tests, they were 2.4, 1.8, and 2.3 for low volume, medium
volume, and high volume mixtures, respectively. The overall ranking further confirmed that
higher volume mixtures generally had better rut resistance than low volume mixtures in this
Phase II study. In addition, all mixtures evaluated in this study met the aggregate consensus
properties, aggregate gradation, and mixture requirements. However, their laboratory
performance was not similar. This demonstrates that meeting aggregate and mixture
volumetric criteria does not ensure similar performances. Thus, the application of
mechanical tests is necessary in the evaluation of mixture designs. The approach presented
in this section provides a tool that correlates aggregate gradation analysis, based on Power-
law, to mixture mechanical test properties.
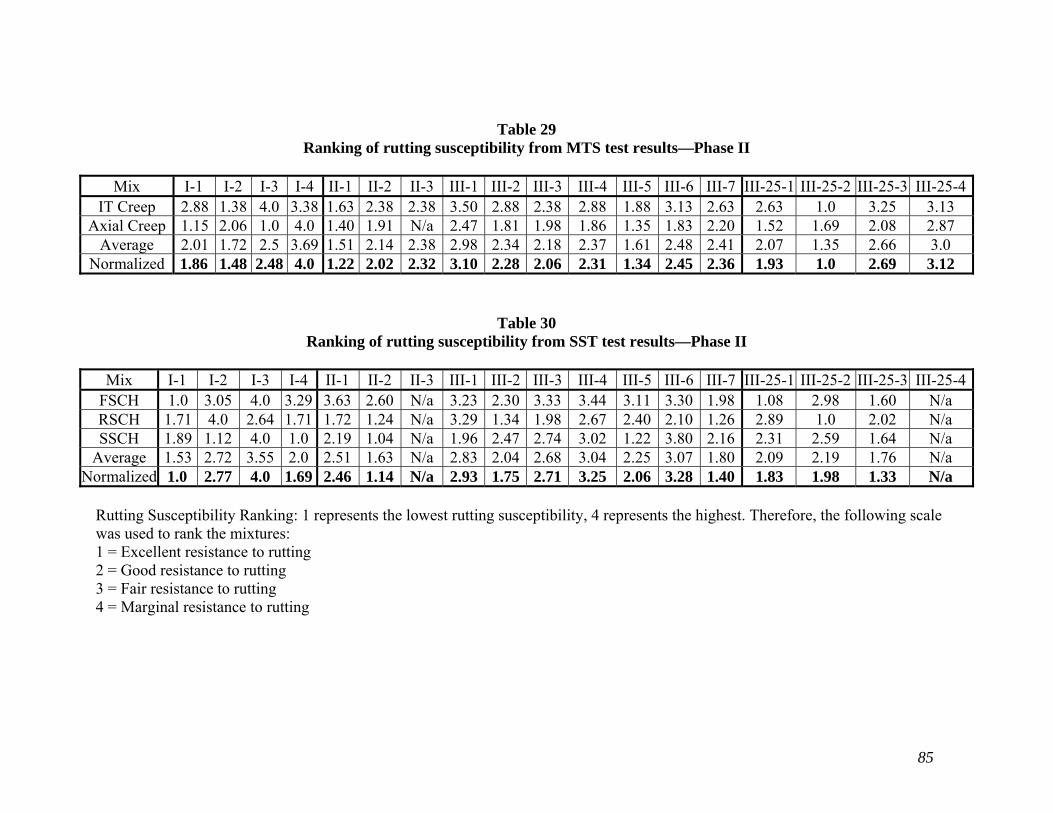
85
Table 29 Ranking of rutting susceptibility from MTS test results—Phase II
Mix I-1 I-2 I-3 I-4 II-1 II-2 II-3 III-1 III-2 III-3 III-4 III-5 III-6 III-7 III-25-1 III-25-2 III-25-3 III-25-4
IT Creep 2.88 1.38 4.0 3.38 1.63 2.38 2.38 3.50 2.88 2.38 2.88 1.88 3.13 2.63 2.63 1.0 3.25 3.13 Axial Creep 1.15 2.06 1.0 4.0 1.40 1.91 N/a 2.47 1.81 1.98 1.86 1.35 1.83 2.20 1.52 1.69 2.08 2.87
Average 2.01 1.72 2.5 3.69 1.51 2.14 2.38 2.98 2.34 2.18 2.37 1.61 2.48 2.41 2.07 1.35 2.66 3.0 Normalized 1.86 1.48 2.48 4.0 1.22 2.02 2.32 3.10 2.28 2.06 2.31 1.34 2.45 2.36 1.93 1.0 2.69 3.12
Table 30 Ranking of rutting susceptibility from SST test results—Phase II
Mix I-1 I-2 I-3 I-4 II-1 II-2 II-3 III-1 III-2 III-3 III-4 III-5 III-6 III-7 III-25-1 III-25-2 III-25-3 III-25-4
FSCH 1.0 3.05 4.0 3.29 3.63 2.60 N/a 3.23 2.30 3.33 3.44 3.11 3.30 1.98 1.08 2.98 1.60 N/a RSCH 1.71 4.0 2.64 1.71 1.72 1.24 N/a 3.29 1.34 1.98 2.67 2.40 2.10 1.26 2.89 1.0 2.02 N/a SSCH 1.89 1.12 4.0 1.0 2.19 1.04 N/a 1.96 2.47 2.74 3.02 1.22 3.80 2.16 2.31 2.59 1.64 N/a
Average 1.53 2.72 3.55 2.0 2.51 1.63 N/a 2.83 2.04 2.68 3.04 2.25 3.07 1.80 2.09 2.19 1.76 N/a Normalized 1.0 2.77 4.0 1.69 2.46 1.14 N/a 2.93 1.75 2.71 3.25 2.06 3.28 1.40 1.83 1.98 1.33 N/a
Rutting Susceptibility Ranking: 1 represents the lowest rutting susceptibility, 4 represents the highest. Therefore, the following scale was used to rank the mixtures: 1 = Excellent resistance to rutting 2 = Good resistance to rutting 3 = Fair resistance to rutting 4 = Marginal resistance to rutting
86
Summary of Findings of Phase II Study
The performance of the 18 Phase II Superpave mixtures was evaluated through laboratory
mechanistic tests, aggregate gradation analysis, and field performance. The findings are
summarized below:
The results of the Power-law regression analyses showed that high volume
mixtures were coarser than low volume mixtures considered in this study.
High volume mixtures appeared to have higher IT strengths when compared to
those of low volume mixtures. The IT strength was fairly sensitive to the
gradation intercept aFA or aCA. Furthermore, the IT strength increases with an
increase in intercept aFA, or the total percentage of fine aggregates in a mixture.
High volume mixtures exhibited lower creep slopes than low volume mixtures.
Gradation parameters were found quite sensitive to the IT creep slope.
Parabolic correlations were observed between the IT and axial creep tests and
gradation analysis slopes and intercept. This indicates that gradation parameters
are sensitive to the creep properties of asphalt mixtures.
The property G*10Hz/sin() increased with an increase in nCA and a decrease in nFA
slopes.
The results from RSCH tests are sensitive to the fine portion (FA) of the
aggregate gradation. More permanent shear strain was accumulated with an
increase in the FA portion of the aggregate gradation (an increase in nFA).
G*10Hz/sin() and RSCH permanent shear strain were not sensitive to variations in
VMA and air voids for the mixtures evaluated.
A trend in decreasing IT strength and increasing IT and axial creep slope with an
increase in VMA and air voids was observed.

87
Part III – Grouping and Correlation Analyses of Fundamental Engineering Properties of Superpave Mixtures
Grouping Analysis
Phase I and Phase II, altogether, included 30 Superpave mixtures. Those mixtures can be
further grouped by three compaction design levels. Table 31 presents the grouping of those
mixtures. The overall test results for those mixtures are summarized in Table 32 and Table
33. Specifically, Table 32 presents the average test results using MTS machine, while Table
33 provides the average test results using SST and APA devices.
Table 31 Groupings of Superpave mixtures
Superpave Mixtures
Level-I Level-II Level-III
Ndes=75 Ndes=96 Ndes=100 Ndes=109 Ndes=125 Ndes=126
NMAS=19 NMAS=19 NMAS=25 NMAS=19 NMAS=19 NMAS=25 NMAS=19 NMAS=25 NMAS=19 NMAS=25
I-1 I-2 I-3 I-4
IBI22 IWI22 IBI121 IWI121
IBWI353
2BI4 II-1 II-2 II-3
1WII61 2BII61 2BII90
III-1 III-2 III-3 III-4 III-5 III-6 III-7
III-25-1 III-25-2 III-25-3 III-25-4
1WIIIwe 2BIIIwe 2BIII20
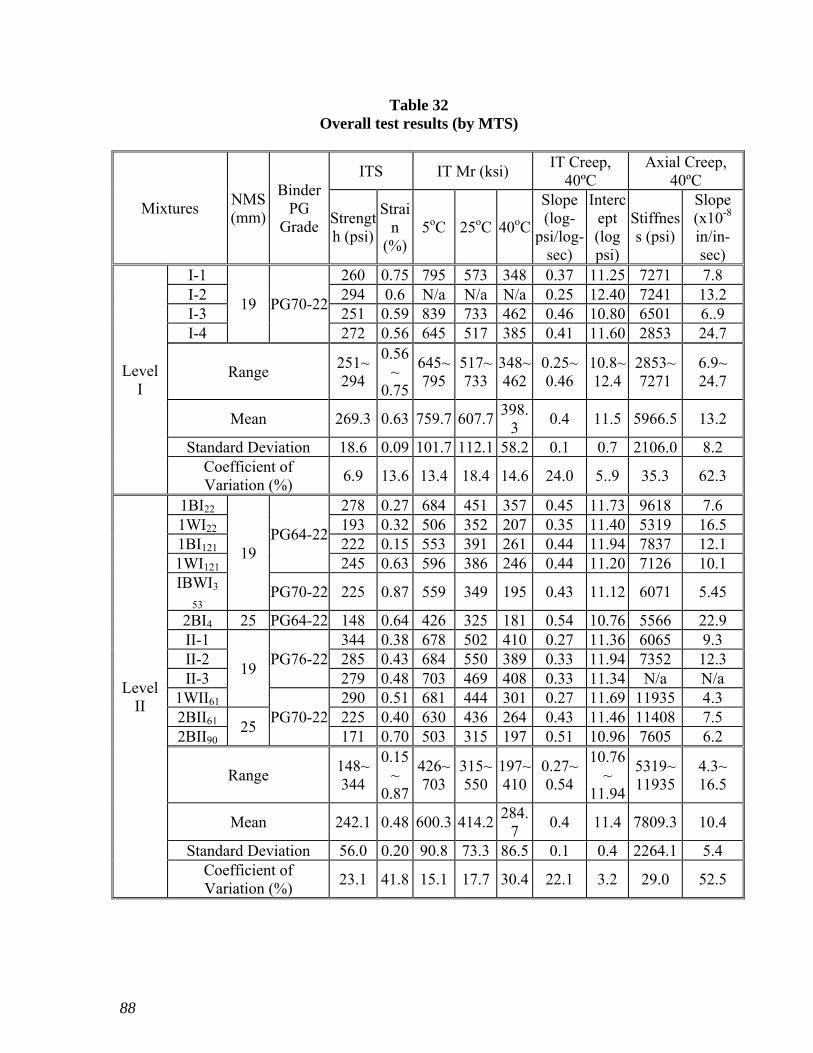
88
Table 32 Overall test results (by MTS)
Mixtures NMS (mm)
Binder PG
Grade
ITS IT Mr (ksi) IT Creep,
40ºC Axial Creep,
40ºC
Strength (psi)
Strain
(%) 5oC 25oC 40oC
Slope (log-
psi/log-sec)
Intercept (log psi)
Stiffness (psi)
Slope (x10-8 in/in-sec)
Level I
I-1
19 PG70-22
260 0.75 795 573 348 0.37 11.25 7271 7.8 I-2 294 0.6 N/a N/a N/a 0.25 12.40 7241 13.2 I-3 251 0.59 839 733 462 0.46 10.80 6501 6..9 I-4 272 0.56 645 517 385 0.41 11.60 2853 24.7
Range 251~ 294
0.56~
0.75
645~ 795
517~ 733
348~ 462
0.25~ 0.46
10.8~ 12.4
2853~ 7271
6.9~ 24.7
Mean 269.3 0.63 759.7 607.7 398.
3 0.4 11.5 5966.5 13.2
Standard Deviation 18.6 0.09 101.7 112.1 58.2 0.1 0.7 2106.0 8.2 Coefficient of Variation (%)
6.9 13.6 13.4 18.4 14.6 24.0 5..9 35.3 62.3
Level II
1BI22
19 PG64-22
278 0.27 684 451 357 0.45 11.73 9618 7.6 1WI22 193 0.32 506 352 207 0.35 11.40 5319 16.5 1BI121 222 0.15 553 391 261 0.44 11.94 7837 12.1 1WI121 245 0.63 596 386 246 0.44 11.20 7126 10.1 IBWI3
53 PG70-22 225 0.87 559 349 195 0.43 11.12 6071 5.45
2BI4 25 PG64-22 148 0.64 426 325 181 0.54 10.76 5566 22.9 II-1
19 PG76-22
344 0.38 678 502 410 0.27 11.36 6065 9.3 II-2 285 0.43 684 550 389 0.33 11.94 7352 12.3 II-3 279 0.48 703 469 408 0.33 11.34 N/a N/a
1WII61 PG70-22
290 0.51 681 444 301 0.27 11.69 11935 4.3 2BII61 25
225 0.40 630 436 264 0.43 11.46 11408 7.5 2BII90 171 0.70 503 315 197 0.51 10.96 7605 6.2
Range 148~ 344
0.15~
0.87
426~ 703
315~ 550
197~ 410
0.27~ 0.54
10.76~
11.94
5319~ 11935
4.3~ 16.5
Mean 242.1 0.48 600.3 414.2 284.
7 0.4 11.4 7809.3 10.4
Standard Deviation 56.0 0.20 90.8 73.3 86.5 0.1 0.4 2264.1 5.4 Coefficient of Variation (%)
23.1 41.8 15.1 17.7 30.4 22.1 3.2 29.0 52.5

89
Table 32 Overall test results (by MTS) (continued)
Mixtures NMS (mm)
Binder PG
Grade
ITS IT Mr (ksi) IT Creep,
40oC Axial Creep,
40oC
Strength (psi)
Strain
(%) 5oC 25oC 40oC
Slope (log-
psi/log-sec)
Intercept (log psi)
Stiffness (psi)
Slope (x10-8 in/in-sec)
Level III
III-1
19
PG76-22
235 0.37 621 513 346 0.42 10.85 5539 14.9 III-2 317 0.41 622 537 356 0.37 11.70 8026 10.5 III-3 351 0.47 627 557 383 0.33 11.83 6444 13.9 III-4 369 0.43 679 523 368 0.37 11.27 5254 14.9 III-5 351 0.35 694 652 465 0.29 12.07 7406 11.0 III-6 313 0.46 652 643 494 0.39 11.80 6157 N/a III-7 310 0.69 495 446 348 0.35 11.18 7128 10.3
III-25-1
25
342 0.26 634 444 402 0.35 11.27 7092 10.0
III-25-2
324 0.36 681 529 385 0.22 11.27 8845 11.0
III-25-3
N/a N/a 660 479 323 0.40 11.12 6048 13.3
III-25-4
359 0.32 652 524 314 0.39 11.42 6238 14.9
1WIIIwe
19 PG70-
22
192 0.57 477 374 215 0.44 11.27 7300 11.25
2BIIIw
e 25 230 0.88 652 454 315 0.41 11.50 7264 9.42
2BIII20 350 0.72 678 472 267 0.30 11.32 12583 4.46
Range 192~ 369
0.26~
0.88
477~ 694
374~ 652
215~ 494
0.22~ 0.44
10.85~
12.07
5254~ 12583
4.46~ 14.9
Mean 311.0 0.48 630.3 510.5 355.
8 0.4 11.4 7237.4 11.5
Standard Deviation 56.3 0.18 65.4 75.5 71.9 0.1 0.3 1816.1 2.9 Coefficient of Variation (%)
18.1 37.5 10.4 14.8 20.2 16.4 2.9 25.1 25.3

90
Table 33 Overall test results (by SST and APA)
Mixtures NMS (mm)
Binder PG
Grade
FSCH G*/sinδ (psi) RSCH* SSCH* APA*
10Hz 1Hz 0.1Hz 0.01Hz Perm. Strain (10-6)
Perm. Strain (10-6)
Rut Depth (mm)
Level I
I-1
19 PG70-22
30762 17003 11490 9741 15831 3768 6.1 I-2 15146 4341 3113 2462 42435 1095 9.3 I-3 7874 4340 3856 3989 26537 7105 5.0 I-4 13312 3683 2511 9693 15866 842 4.0
Range 7874~ 30762
3683~ 17003
2511~ 11490
2462~ 9741
15831~ 42435
842~ 7105
4.0~9.3
Mean 16773.
5 7341.7 5242.4 6471.3 25167.3 3202.5 6.1
Standard Deviation 9823 6448 4201 3799 12566 2919.1 2.3 Coefficient of Variation (%)
58.6 87.8 80.1 58.7 49.9 91.1 37.7
Level II
1BI22
19 PG64-22
14984 6515 5495 5908 26756 3076 4.8 1WI22 21064 8067 4663 3774 14805 2947 2.9 1BI121 22782 7215 3912 3135 15347 1967 7.1 1WI121 16662 6671 4455 4127 11867 3771 4.6 IBWI3
53 PG70-22 47368 17533 9241 7463 5728 1088 2.1
2BI4 25 PG64-22 14841 5636 4542 4689 22210 3258 7.8 II-1
19 PG76-22
10663 5842 4919 4386 16082 3334 2.1 II-2 18565 9587 7702 7860 10510 934 1.2 II-3 N/a N/a N/a N/a N/a N/a 3.2
1WII61 PG70-22
13899 4562 3213 4205 15900 3857 5.9 2BII61 25
31298 10365 5173 4856 5939 1185 4.2 2BII90 23702 8800 5347 4090 14702 1305 4.1
Range 10663
~ 47368
4562~ 17533
3213~ 9241
3135~ 7463
5728~ 26756
934~ 3857
1.2~7.8
Mean 21438.
5 8253.9 5332.9 4953.9 14531.3 2429.3 4.2
Standard Deviation 10323.
9 3543.6 1716.5 1508.1 6229.4 1144.1 2.0
Coefficient of Variation (%)
48.2 42.9 32.2 30.4 42.9 47.1 48.8

91
Table 33 Overall test results (by SST and APA) (continued)
Mixtures NMS (mm)
Binder PG
Grade
FSCH G*/sinδ (psi) RSCH* SSCH* APA*
10Hz 1Hz 0.1Hz 0.01Hz Perm. Strain (10-6)
Perm. Strain (10-6
Rut Depth (mm)
Level III
III-1
19
PG76-22
13760 5600 4135 4439 34664 2852 3.1 III-2 20863 6246 4065 3890 11638 3917 2.5 III-3 12995 7216 6295 6684 19145 4473 3.0 III-4 12154 5224 3736 3360 27269 5068 N/a III-5 14630 9117 7744 8025 24095 1311 2.1 III-6 13224 3344 2010 3708 20568 6696 7.5 III-7 23286 10763 7249 6451 10755 3273 4.1
III-25-1
25
30168 10699 5914 4150 7634 4202 3.2
III-25-2
15646 4141 2803 2103 24682 4170 4.0
III-25-3
26172 9530 5232 4198 2991 1643 3.3
III-25-4
N/a N/a N/a N/a N/a N/a 2.0
1WIIIwe
19 PG70-
22
33799 12510 6594 5105 8632 1031 3.8
2BIIIw
e 25 36197 13449 7619 5124 6165 1226 4.2
2BIII20 19009 7971 5889 5794 6390 1220 2.7
Range 12154
~ 36197
3344~ 13449
2010~ 7744
2103~ 8025
2991~ 34664
1031~ 6696
2.0~7.5
Mean 20915.
6 8139.3 5329.6 4848.4 17810.8 3160.1 3.5
Standard Deviation 8362.3 3188.9 1846.6 1584.1 9821.8 1789.2 1.4 Coefficient of Variation (%)
40.0 39.2 34.6 32.7 55.1 56.6 40.2
* 60º C To examine the sensitivity of fundamental engineering properties, Superpave mixtures in this
study were further grouped by nominal maximum aggregate size (NMAS), binder PG level,
with/without RAP materials, and coarse or fine graded gradations. The effects of those
grouping variables, including compaction levels on fundamental engineering properties, were
studied, and details can be found in Appendix B. Examples of such sensitivity analyses were
given in the following section for the Indirect Tensile Strength and Asphalt Pavement
Analyzer (APA) tests.

92
Indirect Tensile Strength (ITS) Test
The IT strengths for the 30 Superpave mixtures tested in this study varied from 1,020 kPa
(148 psi) to 2,545 kPa (369 psi), while the IT strains had a range from 0.15 to 0.88 percent,
as shown in Table 34.
Figure 42 presents the mean IT strength test results for Superpave mixtures grouped at
different compaction levels. The average IT strength for the Level I, Level II, and Level III
mixtures was 1,857 kPa (269 psi), 1,670 kPa (242 psi), and 2,145 (311 psi), respectively. The
statistical ranking presented in Table 34 indicates that the mean IT strength for Level III
mixtures (ranked as an “A”) is significantly higher than those for Level I and Level II
mixtures (both ranked as a “B”). This could be attributed partly to both the stiffer binders
(PG 76-22M) and the higher design gyratory compaction efforts used in the Level III mixture
design. However, there was no statistically significant difference in the mean IT strains
among mixtures compacted at different compaction levels, as shown in Table 35.
311
242269
0
50
100
150
200
250
300
350
400
Level I Level II Level III
Superpave Mixtures
IT S
tren
gth
, p
si
Figure 42
Mean IT strength test results of mixtures at different compaction levels

93
Table 34 The statistics of ITS test results on mixtures by level
Mix Type Mean IT Strength,
(psi)
STD (psi)
CV% Max (psi)
Min (psi)
Statistic Grouping
Level-I 269.3 18.6 6.9 294.0 251.0 B
Level-II 242.1 56.0 23.1 344.0 148.0 B
Level-III 311.0 56.3 18.1 369.0 192.0 A
Mean IT
Strain, (%) STD (%)
CV% Max (%)
Min (%)
Level-I 0.63 0.09 13.6 0.8 0.6 A
Level-II 0.48 0.20 41.8 0.9 0.2 A
Level-III 0.48 0.18 37.5 0.9 0.3 A
Figure 43 presents the mean IT strength results of those Superpave mixtures grouped at
different NMAS, binder PGs, RAP/No-Rap, and coarse/fine graded, respectively.
217
251
321
280269
281269
260
286
0
50
100
150
200
250
300
350
400
PG 64-22 PG 70-22 PG 76-22 NM AS=19 NM AS=25 No-Rap Rap Fine Coarse
Superpave Mixture Groups
IT S
tren
gth
, p
si
Figure 43 Mean IT strength test results of mixtures at different groups
94
Figure 43 shows that:
Mixtures with higher PG binders tended to have higher IT strength values; in other
words, ITS (PG 76-22) > ITS (PG 70-22) > ITS (PG 64-22). This indicates that the IT strength
values for Superpave mixtures are sensitive to the binder PG types.
As the NMAS increased from 19 mm to 25 mm, the IT strength tended to decrease,
i.e., ITS (19mm) > ITS (25mm). However, the difference in ITS between 19 mm and 25
mm Superpave mixtures was not statistically significant.
Mixtures with no RAP appeared to have higher IT strengths than mixtures containing
RAP, i.e., ITS (no-RAP) > ITS (RAP). This is expected, as RAP materials contain aged
binders that are less flexible in tension. However, the difference was not statistically
significant.
The mean IT strength for the coarse-graded Superpave mixtures appeared to be higher
than that for the fine-graded, i.e., ITS (coarse) > ITS (fine). This may be attributed to the
difference in aggregate structure (interlocking) between coarse-graded and fine-
graded mixtures. However, this difference in the mean ITS results was not
statistically significant.
APA Rut Test
The APA rut depths for the 30 Superpave mixtures tested varied from 1.2 to 9.3 mm. The
individual APA test results of the mixtures can be found in Table 35.
Figure 44 presents the mean APA test results for Superpave mixtures grouped at different
compaction levels. The average APA rut depth for the Level I, Level II, and Level III
mixtures was 6.1, 4.2, and 3.5 mm, respectively. The statistical ranking presented in Table 35
indicates that the mean APA rut depths for both Level II and Level III mixtures (both ranked
as an “A”) are significantly smaller than that for Level I mixtures (ranked as a “B”),
indicating that Level II and Level III mixtures have better rut resistance than Level I
mixtures. This implies that the APA rut test is fairly sensitive to Superpave gyratory
compaction levels.

95
3.54.2
6.1
0
2
4
6
8
10
Level I Level II Level III
Mixture Type
AP
A R
ut
Dep
th (
mm
)
Figure 44 Mean APA rut depths of mixtures at different compaction levels
Table 35 The statistics of APA test results on mixtures by level
Mix by Level
Mean APA rut depth, (mm)
STD (mm)
CV% Max (mm)
Min (mm)
Statistic Grouping
Level-I 6.1 2.3 37.7 9.3 4.0 B Level-II 4.2 2.0 48.8 7.8 1.2 A Level-III 3.5 1.4 40.2 7.5 2.0 A
Figure 45 presents the mean APA test results of those Superpave mixtures grouped at
different NMAS, binder PGs, RAP/No-Rap, and coarse/fine graded, respectively.

96
3.4
5.8
4.6
3.83.94.2
3.2
4.75.4
0.0
1.0
2.0
3.0
4.0
5.0
6.0
7.0
8.0
9.0
10.0
PG 64-22 PG 70-22 PG 76-22 NM AS=19 NM AS=25 No-Rap Rap Fine Coarse
Superpave Mixture Groups
AP
A R
ut
De
pth
(m
m)
Figure 45 Mean APA rut depths of mixtures at different groupings
From Figure 45, the following observations can be made:
Mixtures produced with higher PG binders tended to have lower APA rut depths than
mixtures with lower PG binders, indicating that the APA test is very sensitive to the
mixture binder types.
There is no statistically significant difference in terms of APA rut depths among
mixtures with two different NMAS of 19 and 25mm.
Mixtures with RAP contents tended to have more APA rut depths than those without
RAP contents.
Coarse-graded mixtures seemed to be more rut resistant than fine-graded ones by
having lower APA rut depths in this study.
In general, the APA rut test was found to be fairly sensitive in capturing the rutting
performance of Superpave mixtures considered in this study.
Based on the grouping analysis, the sensitivity of fundamental engineering properties on mixture grouping variables can be summarized and is presented in Table 36.

97
Table 36 Sensitivity of fundamental engineering test properties on Superpave mixture design variables
Mixture Grouping Variable
Fundamental Engineering Properties
ITS IT Mr IT Creep Axial Creep
FSCH (G*/sinδ) RSCH SSCH APA
Strength5C 25C 40C Slope Slope 10Hz 1Hz 0.1Hz Perm Strain Perm Strain Rut Depth Ndesign
Level
Binder PG
NMAS (19 or 25mm)
RAP Usage
Gradation (Coarse or
Fine)
Note: means “sensitive”; means “not sensitive”

98
The following observations can be made from Table 36:
The IT strength test was sensitive to all five mixture grouping variables, which
includes the design compaction effort, binder performance grade, nominal maximum
aggregate size, RAP usage, and gradation curve shape.
The IT Mr at 5o C, IT creep slope, G*/sin(), and APA rut depth were observed to be
sensitive to three of the five mixture grouping variables.
The permanent deformations obtained from RSCH and SSCH tests were only
sensitive to two grouping variables.
Other fundamental engineering properties were not sensitive to any mixture grouping
variables.

99
Correlations among Laboratory Test Results
A correlation study was performed to investigate any potential relationships among those
mechanistic properties obtained from fundamental engineering tests in this study. Test results
from all 30 Superpave mixtures were considered. Table 37 presents the correlation
coefficient matrix for the selected mechanistic properties. In general, mixture properties
obtained from different testing modes (SST or MTS) and testing temperatures generally did
not correlate very well with each other. This is not unexpected because asphalt mixture
consists of non-homogeneous, rate-temperature dependent materials. On the other hand,
results from a single testing device tended to have stronger correlations with each other than
those from different testing devices (MTS or SST). Furthermore, APA rut depth
measurements in this study seemed to have no direct relationships with any of the other test
results considered in Table 37, other than a poor correlation with the permanent strains
measured from the RSCH tests.
Figure 46 presents the relationship between the APA rut depths and the permanent shear
strain measured from the RSCH tests. As shown in Figure 46, a linear trend with R2= 0.18
was observed between the two test results.
y = 0.8851x + 2.7207
R2 = 0.18
0.0
2.0
4.0
6.0
8.0
10.0
0.0 1.0 2.0 3.0 4.0 5.0
RSCH Permanent Shear Strain (%)
AP
A R
ut
Dep
th (
mm
)
Figure 46 Relationship between APA and RSCH tests at 60ºC

100
Table 37 Correlation coefficients for all test results in this study
RUT RCH SCH M1 M2 M3 ITCS ITCI ITS ITSN AXCS AXCP FCH1 FCH2 FCH3 FCH4
RUT 1.000 0.412 0.262 -0.118 -0.090 -0.115 0.175 0.176 -0.196 0.145 0.047 0.125 -0.200 -0.325 -0.365 -0.337 RCH 0.412 1.000 0.261 0.281 0.417 0.392 -0.136 0.122 -0.078 -0.356 -0.282 0.315 -0.590 0.545 -0.424 -0.312 SCH 0.262 0.261 1.000 0.379 0.502 0.489 -0.016 -0.212 0.270 -0.143 -0.138 -0.055 -0.468 -0.427 - 0.343 -0.325 M1 -0.118 0.281 0.379 1.000 0.782 0.700 -0.411 0.167 0.361 -0.090 0.163 -0.321 -0.297 -0.136 0.066 0.193 M2 -0.090 0.417 0.502 0.782 1.000 0.877 -0.365 0.279 0.449 -0.152 -0.098 -0.035 -0.489 -0.330 -0.0 73 0.187 M3 -0.115 0.392 0.489 0.700 0.877 1.000 -0.480 0.364 0.526 -0.264 -0.154 -0.001 -0.504 -0.376 -0.152 0.125
ITCS 0.175 -0.136 -0.016 -0.411 -0.365 -0.480 1.000 -0.509 -0.556 0.154 -0.261 0.173 0.246 0.188 0.056 0.061 ITCI 0.176 0.122 -0.212 0.167 0.279 0.364 -0.509 1.000 0.394 -0.213 0.182 0.012 -0.168 -0.203 -0.095 0.075 ITS -0.196 -0.078 0.270 0.361 0.449 0.526 -0.556 0.394 1.000 0.093 0.166 -0.144 -0.355 -0.255 -0.042 0.105
ITSN 0.145 -0.356 -0.143 -0.090 -0.152 -0.264 0.154 -0.213 0.093 1.000 0.052 -0.230 0.308 0.360 0.380 0.332 AXCS 0.047 -0.282 -0.138 0.163 -0.098 -0.154 -0.261 0.182 0.166 0.052 1.000 -0.719 0.107 0.057 0.073 -0.157 AXCP 0.125 0.315 -0.055 -0.321 -0.035 -0.001 0.173 0.012 -0.144 -0.230 -0.719 1.000 -0.321 -0.356 -0.354 0.093 FCH1 -0.200 -0.590 -0.468 -0.297 -0.489 -0.504 0.246 -0.168 -0.355 0.308 0.107 -0.321 1.000 0.888 0.636 0.220 FCH2 -0.325 -0.545 -0.427 -0.136 -0.330 -0.376 0.188 -0.203 -0.255 0.360 0.057 -0.356 0.888 1.000 0.907 0.503 FCH3 -0.365 -0.426 -0.343 0.066 -0.073 -0.152 0.056 -0.095 -0.042 0.380 0.073 -0.354 0.636 0.907 1.000 0.655 FCH4 -0.337 -0.312 -0.325 0.193 0.187 0.125 0.061 0.075 0.105 0.332 -0.157 0.093 0.220 0.503 0.655 1.000
Note: RUT-APA Rut Depth(mm); RCH-RSCH permanent shear strain; SCH-SSCH permanent shear strain; M1-IT Mr at 5C; M2-ITMr at 25C; M3-IT Mr at 40C; ITCS-IT creep slope; ITCI-IT creep intercept; ITS-IT strength; ITSN-IT strain at failure; AXCS-axial creep stiffness; AXCP-axial creep slope; FCH1-G*/sin(δ) at 10 Hz; FCH2-G*/sin(δ) at 1 Hz; FCH3-G*/sin(δ) at 0.1 Hz; FCH4-G*/sin(δ) at 0.01 Hz;

101
Figures 47 (a) and (b) presents the relationship between the RSCH permanent shear strain
and the G*/sin(δ) at 10 Hz and 1 Hz, respectively. A power relationship was observed for
both RSCH permanent shear strains vs. G*/sin(δ) at 10 Hz and RSCH permanent shear
strains vs. G*/sin(δ) at 1 Hz.
y = 13543x-0.9238
R2 = 0.47
0.0
1.0
2.0
3.0
4.0
5.0
0 10000 20000 30000 40000 50000
G*/sin(delta) at 10 Hz, psi
RS
CH
Per
man
ent
Sh
ear
Str
ain
(%
)
(a)
y = 1778.2x-0.7935
R2 = 0.39
0.0
1.0
2.0
3.0
4.0
5.0
0 5000 10000 15000 20000
G*/sin(delta) at 1 Hz, psi
RS
CH
Per
man
ent
Sh
ear
Str
ain
(%
)
(b)
Figure 47 Relationships between RSCH and FSCH tests at 60ºC

102
As presented in Figures 48 (a) and (b), a power relationship was also observed between test
results of SSCH and FSCH. However, the data are more scattered than those in Figure 48.
y = 383.83x-0.7503
R2 = 0.23
0
0.1
0.2
0.3
0.4
0.5
0.6
0.7
0.8
0 5000 10000 15000 20000 25000 30000 35000 40000 45000 50000
G*/sin(delta) at 10 Hz
SS
CH
Per
man
ent
Sh
ear
Str
ain
(%
)
(a)
R2 = 0.16
0
0.1
0.2
0.3
0.4
0.5
0.6
0.7
0.8
0 5000 10000 15000 20000
G*/sin(delta) at 1 Hz
SS
CH
Per
man
ent
Sh
ear
Str
ain
(%
)
(b)
Figure 48 Relationships between SSCH and FSCH tests at 60ºC
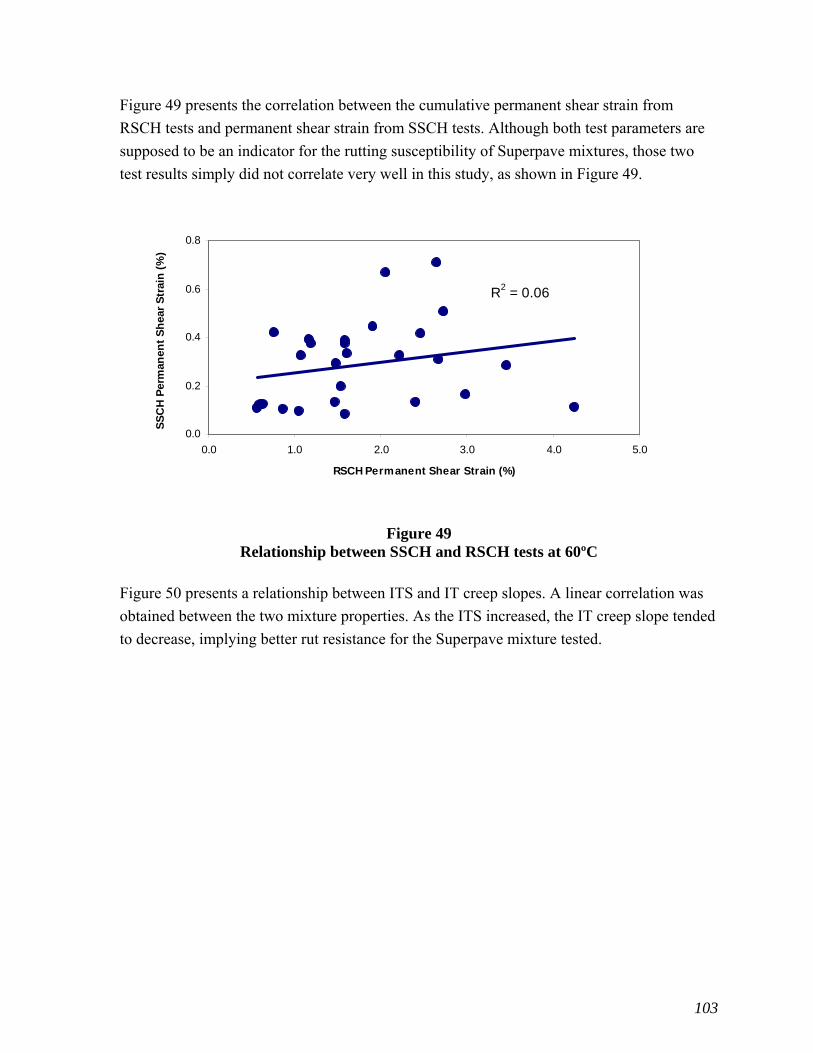
103
Figure 49 presents the correlation between the cumulative permanent shear strain from
RSCH tests and permanent shear strain from SSCH tests. Although both test parameters are
supposed to be an indicator for the rutting susceptibility of Superpave mixtures, those two
test results simply did not correlate very well in this study, as shown in Figure 49.
R2 = 0.06
0.0
0.2
0.4
0.6
0.8
0.0 1.0 2.0 3.0 4.0 5.0
RSCH Permanent Shear Strain (%)
SS
CH
Per
man
ent
Sh
ear
Str
ain
(%
)
Figure 49 Relationship between SSCH and RSCH tests at 60ºC
Figure 50 presents a relationship between ITS and IT creep slopes. A linear correlation was
obtained between the two mixture properties. As the ITS increased, the IT creep slope tended
to decrease, implying better rut resistance for the Superpave mixture tested.
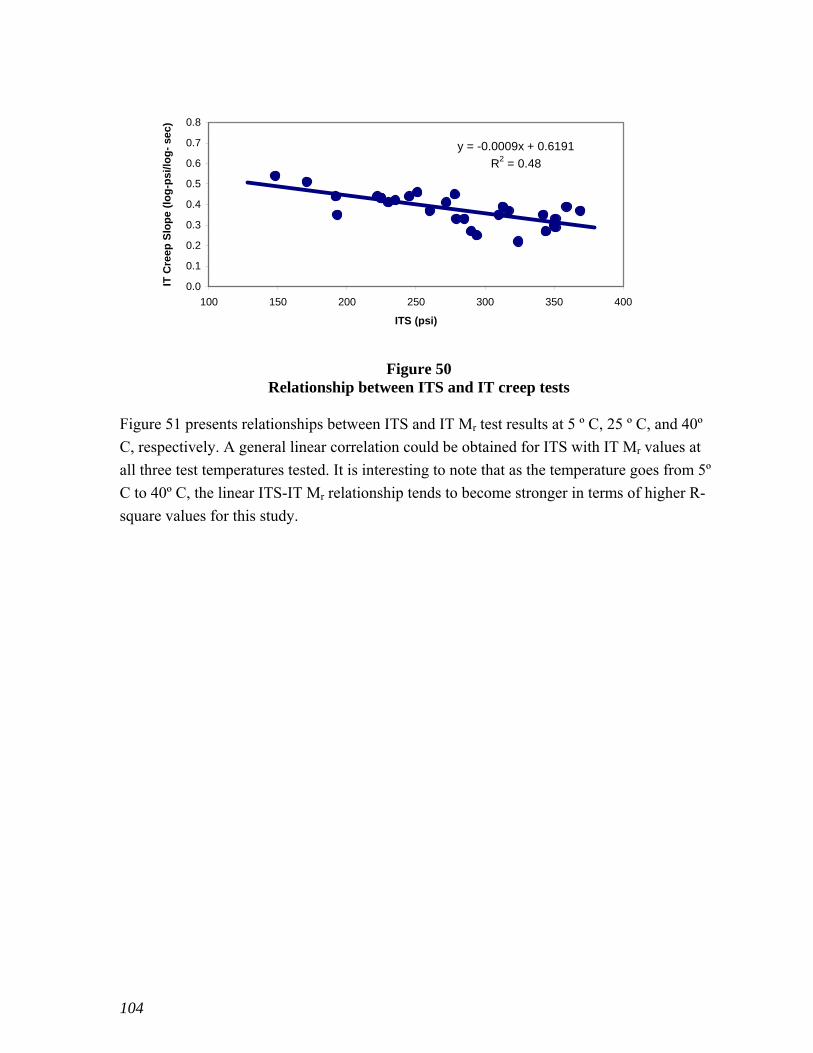
104
y = -0.0009x + 0.6191
R2 = 0.48
0.0
0.1
0.2
0.3
0.4
0.5
0.6
0.7
0.8
100 150 200 250 300 350 400
ITS (psi)
IT C
reep
Slo
pe
(lo
g-p
si/l
og
- se
c)
Figure 50
Relationship between ITS and IT creep tests Figure 51 presents relationships between ITS and IT Mr test results at 5 º C, 25 º C, and 40º
C, respectively. A general linear correlation could be obtained for ITS with IT Mr values at
all three test temperatures tested. It is interesting to note that as the temperature goes from 5º
C to 40º C, the linear ITS-IT Mr relationship tends to become stronger in terms of higher R-
square values for this study.
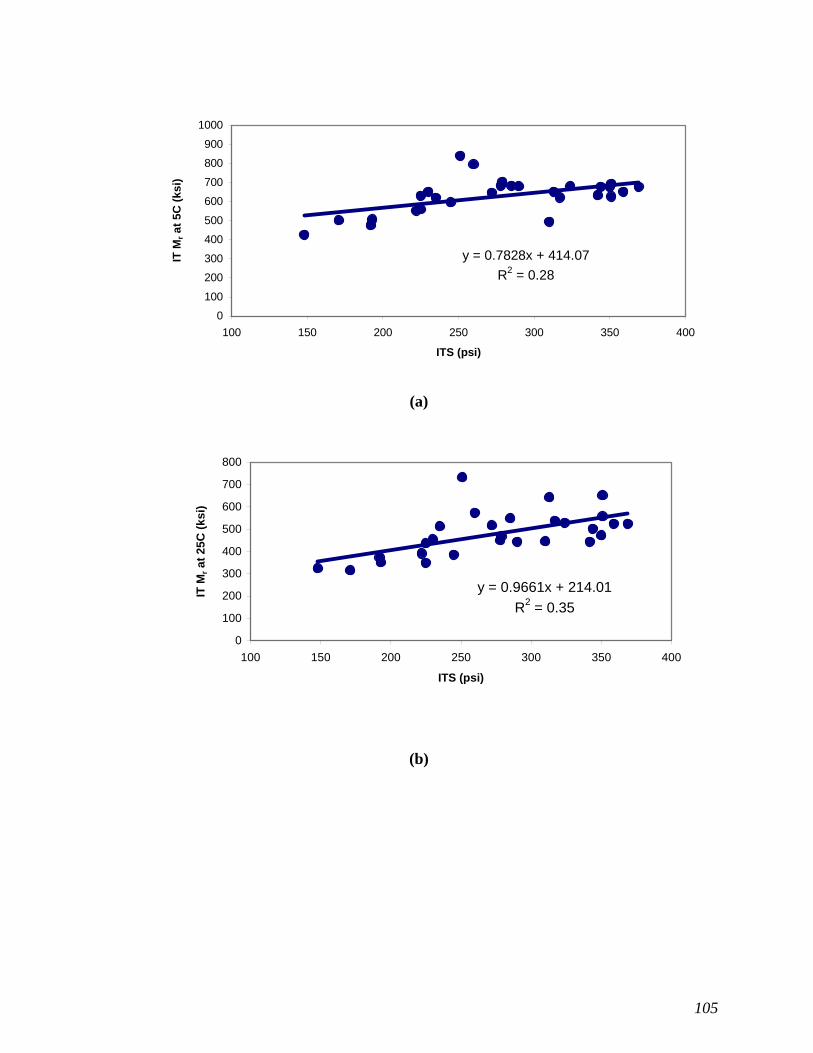
105
y = 0.7828x + 414.07
R2 = 0.28
0
100
200
300
400
500
600
700
800
900
1000
100 150 200 250 300 350 400
ITS (psi)
IT M
r at
5C
(k
si)
(a)
y = 0.9661x + 214.01
R2 = 0.35
0
100
200
300
400
500
600
700
800
100 150 200 250 300 350 400
ITS (psi)
IT M
r at
25
C (
ks
i)
(b)
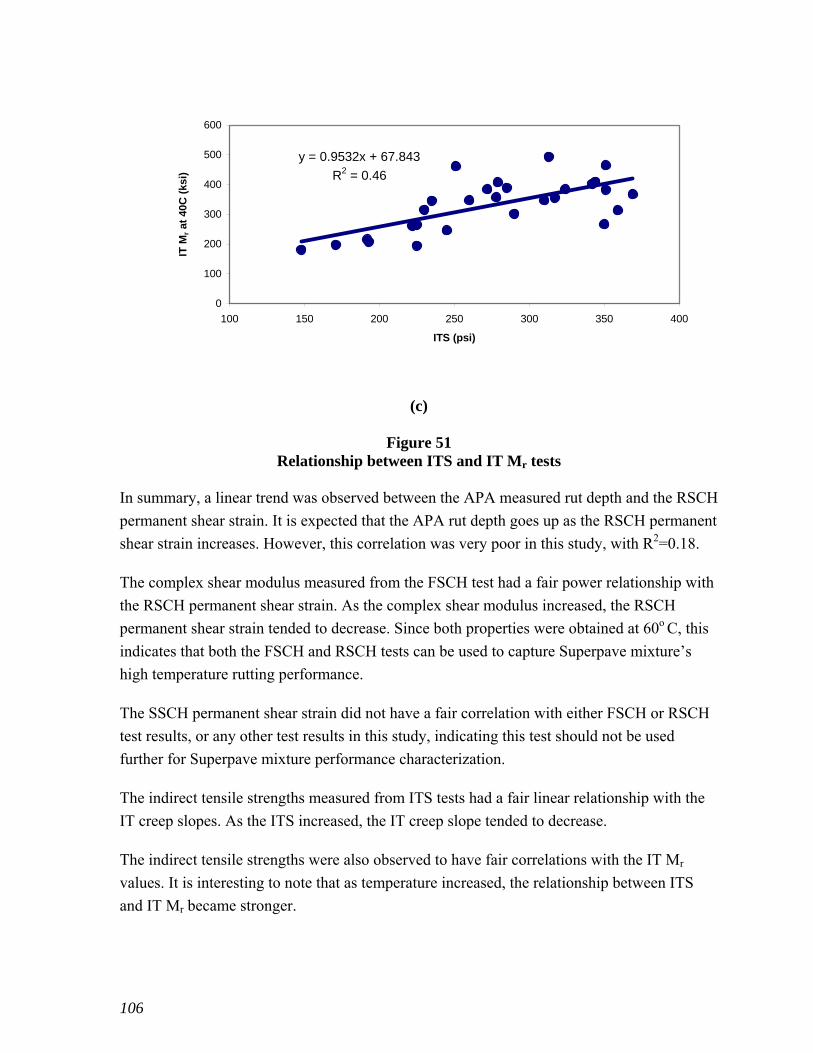
106
y = 0.9532x + 67.843
R2 = 0.46
0
100
200
300
400
500
600
100 150 200 250 300 350 400
ITS (psi)
IT M
r at
40C
(ks
i)
(c)
Figure 51 Relationship between ITS and IT Mr tests
In summary, a linear trend was observed between the APA measured rut depth and the RSCH
permanent shear strain. It is expected that the APA rut depth goes up as the RSCH permanent
shear strain increases. However, this correlation was very poor in this study, with R2=0.18.
The complex shear modulus measured from the FSCH test had a fair power relationship with
the RSCH permanent shear strain. As the complex shear modulus increased, the RSCH
permanent shear strain tended to decrease. Since both properties were obtained at 60o C, this
indicates that both the FSCH and RSCH tests can be used to capture Superpave mixture’s
high temperature rutting performance.
The SSCH permanent shear strain did not have a fair correlation with either FSCH or RSCH
test results, or any other test results in this study, indicating this test should not be used
further for Superpave mixture performance characterization.
The indirect tensile strengths measured from ITS tests had a fair linear relationship with the
IT creep slopes. As the ITS increased, the IT creep slope tended to decrease.
The indirect tensile strengths were also observed to have fair correlations with the IT Mr
values. It is interesting to note that as temperature increased, the relationship between ITS
and IT Mr became stronger.

107
Field Rutting Measurements
As stated earlier, the Superpave mixtures considered in this study (Phase I and Phase II) were
obtained from 21 field implementation projects. At present, all project pavements have
performed well and have less than 5.0 mm rut depths without any recordable cracking failure.
Table 38 presents the early rutting data measurements of those field projects. The rut
measurements reflect a trafficking of about two to five years. Based on an average 20 year
design EASL number, a rut ratio (mm/million ESAL) was calculated for each pavement. The
average rut ratio for each design level was then computed and presented in Figure 52. It is
interesting to note that the Level III mixture has the lowest rut ratio, followed by the Level II
and the Level I mixtures.
0.5
1.4
2.0
0.0
0.5
1.0
1.5
2.0
2.5
3.0
Level-I Level-II Level-III
Pavement Type
Ru
t R
atio
(m
m/m
illi
on
ES
AL
)
Figure 52 Field rutting measurements
It is interesting to note that the grouping analysis presented in Appendix A indicated that the
APA rut depth ranking matched exactly with the field rutting ratio ranking. In addition,
several fundamental test results considered in this study also provided similar rankings for
Level I and Level III mixtures but with a different order for Level II mixtures. Those tests are
ITS, IT Mr, Axial Creep, FSCH, and RSCH.

108
Table 38 Field rutting performance
Project LA 361
LA 191
LA 874
LA 22
LA 121
LA 353
LA 4
LA 1
US 79
LA 29
US 61-1
US 61-2
US 90
I-10 (1)
I-10 (2)
I-12 (1)
I-10 (3)
I-49 I-12 (2)
West bank
I-20
Level Level-I Level-II Level-III Ndesign 75 96 100 109 125 126
Corresponding Mix
I-1 I-2 I-3 1WI2
2 1WI1
21 1WI3
53 2BI4
II-1
II-2 II-3 1WII6
1 2BII6
1 2BII
90 III-1 III-2 III-3 III-4 III-5 III-7
2BIIIwe
2BIII2
0
20 years ESALs (million)
3 3 3 6 6 6 6 10 10 10 10 10 10 30 30 30 30 30 30 30 30
Years on Service 3.5 3.3 3.6 5.1 4.8 4.7 4.7 3.8 2.8 3.6 4.8 4.7 4.5 2.5 2.0 2.0 3.0 2.0 3.0 5.0 5.0
Average Rut Depth (mm)
1.0 1.3 0.8 1.0 2.0 2.0 2.8 3.8 2.0 1.8 1.8 5.0 3.3 4.6 1.3 2.0 1.5 2.0 1.5 3.3 1.8
Rut ratio (mm/106 ESAL)
1.9 2.63 1.48 0.65 1.39 1.42 1.99 2.0 1.43 1.01 0.75 2.13 1.47 1.23 0.43 0.67 0.33 0.67 0.33 0.44 0.24
Average Rut ratio (mm/106 ESAL)
2.0 1.4 0.5
109
CONCLUSIONS
Thirty Louisiana Superpave mixtures from twenty-one field implementation projects
constructed between 1998 and 2000 were selected in the present study. After being open to
traffic for two to five years, all project pavements were found to perform well and had less
than 5.0mm rut depths, without any recordable cracking failure. The performance of those
Superpave mixtures has been evaluated using a suite of laboratory fundamental engineering
performance tests based on the ability of the mixture to resist tensile cracking and permanent
deformation distresses. The fundamental engineering tests were conducted using three
laboratory performance testers: Simple Shear Tester, Material Testing Machine, and Asphalt
Pavement Analyzer. Based on the fundamental engineering test results, the following
observations and conclusions were made:
Compaction Efforts (Design Gyratory Compaction Number)
The design compaction efforts were observed to have a certain influence on
Superpave mixture rut susceptibility. In Phase-I study, mixtures with Level I
compaction effort (Ndesign=96) showed a higher rut susceptibility than Level II
(Ndesign=109) and Level-III (Ndesign=126) mixtures. Similarly, high and medium
Superpave mixtures in Phase-II study, which were designed at Ndesign of 125 and
100 gyrations, respectively, had better overall rut resistance than low volume
mixtures at an Ndesign of 75 gyrations. This is evidenced by all fundamental
engineering test results.
No significant difference was found in rut resistance between Phase-I mixtures
compacted at Ndesign of 109 gyrations (Level II) and Ndesign of 126 gyrations (Level-
III) or between Phase-II mixtures compacted at Ndesignof 100 gyrations (medium
volume) and Ndesign of 125 gyrations (high volume).
Binder Performance Grade
The effect of binder performance grade on mixture performance was not explicitly
evaluated in this study because the usage of binder PG grade was generally
associated with the design compaction effort in a Superpave mixture design; that is,
the higher the compaction effort, the higher the performance grade of binder used.
Based on five Level-I mixtures in the Phase-I study, the overall laboratory
performance of Mixture LA353 with PG 70-22 (PAC40) binder was found
significantly superior to four other mixtures with PG 64-22 (PAC30 or AC 30)
binders, including LA 22 binder/wearing and LA121 binder/wearing mixtures.

110
Design Volumetric Properties
Asphalt mixtures in different air void groupings performed differently, but for
mixtures within a certain air void group, the influence of the air void content was
often minimal.
Concerning voids in the mineral aggregate VMA, no consistent trend was observed.
Results from the stratified comparison produced very low coefficients of
determination, whereas results from the multiple regression analysis identified this
mix variable as one with high contribution on test results.
G*10Hz/sin() and RSCH permanent shear strain were not sensitive to variations in
VMA and air voids for the mixtures evaluated.
A trend in decreasing IT strength and increasing IT and axial creep slope with an
increase in the VMA and air voids was observed.
The nominal maximum aggregate size showed no discernable influence on rut
susceptibility either from studying individual test results or from the multiple
regression analysis.
The percent of aggregate passing the 0.075 mm sieve exhibited an inverse
relationship with the rut susceptibility ranking. Mixtures containing lower values of
this variable appeared to be more susceptible to rutting. This means that increasing
the amount of fine dust (up to a certain limit) by a small amount made the asphalt
cement/dust mixture act as a more viscous binder, thus increasing the stability. The
percent of aggregate passing the 2.36 mm sieve, on the other hand, did not have an
effect on the susceptibility to rutting.
Film thickness presented a strong, direct relationship with rut susceptibility.
Mixtures with higher values of binder film thickness were more susceptible to
permanent deformation. A possible explanation to this behavior is that, as those
Superpave mixtures considered are usually coarser than pre-Superpave mixtures,
they have lower aggregate surface areas to be coated with binder. Without a
reduction in asphalt cement content, this causes thicker binder films, which have a
negative effect on the resistance to permanent deformation.
Dust/AC ratio showed an inverse relation with rut susceptibility; that is, mixtures
with lower dust/AC ratios appear to be more susceptible to rutting.

111
Gradation Analysis
The results of the power law gradation analyses showed that high and medium
volume mixtures were coarser (containing less finer aggregates) than low volume
ones. This indicates that Superpave mixtures designed at a higher gyration level
have to become coarser in order to achieve a certain VMA requirement.
The IT strength was fairly sensitive to the gradation intercept aFA or aCA. The IT
strength increases with an increase in intercept aFA, or the total percentage of fine
aggregates in a mixture.
Gradation parameters were found to be quite sensitive to the IT and axial creep
slopes. Parabolic correlations were observed between the IT and axial creep tests
and gradation analysis slopes and intercept. This indicates that gradation
parameters are sensitive to the creep properties of asphalt mixtures.
The property G*10Hz/sin() increased with an increase in nCA and a decrease in nFA
slopes.
The results from the RSCH test are sensitive to the fine portion (FA) of the
aggregate gradation. More permanent shear strain was accumulated with an
increase in the FA portion of the aggregate gradation (an increase in nFA).
Sensitivity Analysis of Fundamental Engineering Properties
The IT strength test was sensitive to all five mixture grouping variables, which
include the design compaction effort, binder performance grade, nominal maximum
aggregate size, RAP usage, and gradation curve shape.
The IT Mr at 5oC, IT creep slope, G*/sin(), and APA rut depth were observed to
be sensitive to three of five mixture grouping variables.
The permanent deformations obtained from RSCH and SSCH tests were only
sensitive to two grouping variables.
Other fundamental engineering properties were not sensitive to any mixture
grouping variables or were sensitive to only one of them.
Correlation among Fundamental Engineering Properties
A linear trend was observed between the APA measured rut depth and the RSCH
permanent shear strain. As expected, the APA rut depth goes up as the RSCH
permanent shear strain increases. However, this correlation was found to be very
poor in this study with R2 = 0.18.
The complex shear modulus measured from the FSCH test had a fair power
relationship with the RSCH permanent shear strain. As the complex shear modulus

112
increases, the RSCH permanent shear strain tends to decrease. As both properties
were obtained at 60oC, this indicates that both the FSCH and RSCH tests can be
used to capture Superpave mixture’s high temperature rutting performance.
The SSCH permanent shear strain did not have fair correlation with either FSCH or
RSCH test results or any other test results in this study, indicating that this test
should not be further used for Superpave mixture performance characterization.
The indirect tensile strengths measured from ITS tests had a fair linear relationship
with the IT creep slopes. As the ITS increases, the IT creep slope tends to decrease.
The indirect tensile strengths were also observed to have fair correlations with the
IT Mr values. It is interesting to note that as temperature is increased, the
relationship between ITS and IT Mr becomes stronger.

113
RECOMMENDATIONS
For QA/QC in plant production of Superpave mixtures, the indirect tensile strength test at
25 oC is recommended. The indirect tensile strength value for a Superpave mixture with 7
percent air voids shall be at least 150 psi (1.03 Mpa).
For durability/strength proof checking in laboratory Superpave mix design, the Asphalt
Pavement Analyzer (APA) test at 64 oC is recommended. The average rut depths of three
beams or six cylindrical SGC samples shall be less than 6.1, 4.2, and 3.5 mm,
respectively, for Level-I (Ndesign = 75), Level-II (Ndesign = 100), and Level-III (Ndesign =
125) Superpave mixtures.
For permanent deformation properties of Superpave mixtures, the indirect tensile creep,
frequency sweep at constant height, and repetitive shear at constant height tests are
recommended.

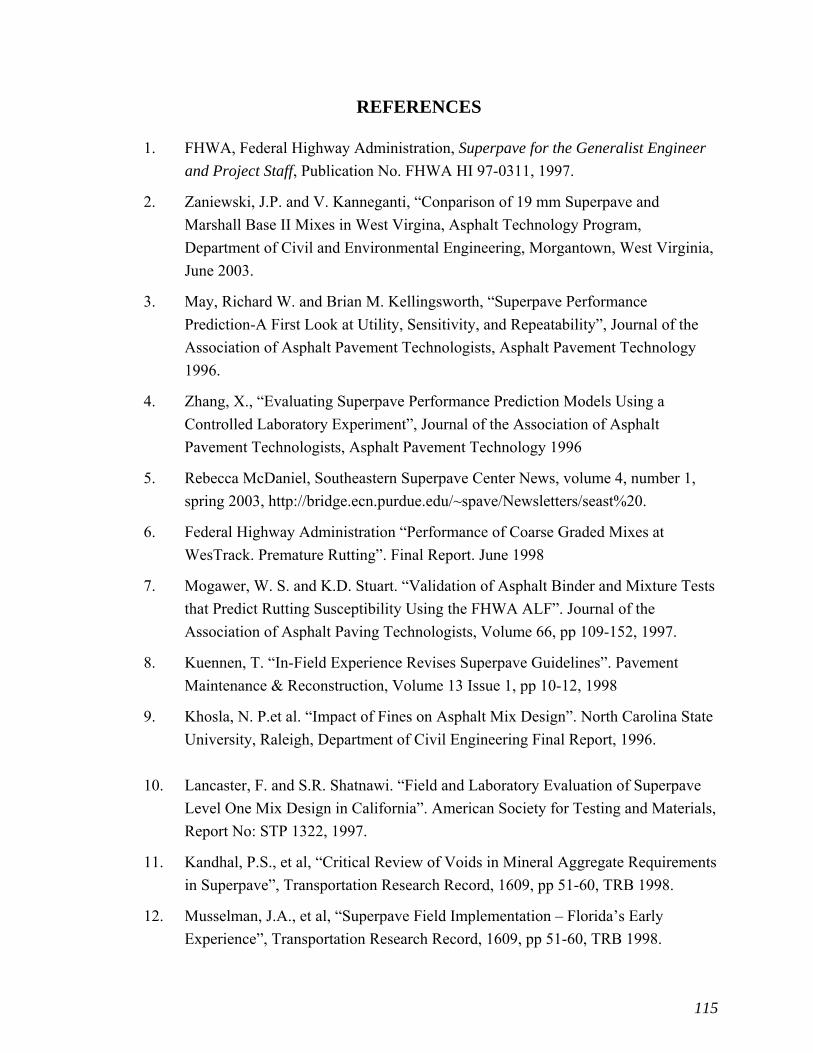
115
REFERENCES
1. FHWA, Federal Highway Administration, Superpave for the Generalist Engineer
and Project Staff, Publication No. FHWA HI 97-0311, 1997.
2. Zaniewski, J.P. and V. Kanneganti, “Conparison of 19 mm Superpave and
Marshall Base II Mixes in West Virgina, Asphalt Technology Program,
Department of Civil and Environmental Engineering, Morgantown, West Virginia,
June 2003.
3. May, Richard W. and Brian M. Kellingsworth, “Superpave Performance
Prediction-A First Look at Utility, Sensitivity, and Repeatability”, Journal of the
Association of Asphalt Pavement Technologists, Asphalt Pavement Technology
1996.
4. Zhang, X., “Evaluating Superpave Performance Prediction Models Using a
Controlled Laboratory Experiment”, Journal of the Association of Asphalt
Pavement Technologists, Asphalt Pavement Technology 1996
5. Rebecca McDaniel, Southeastern Superpave Center News, volume 4, number 1,
spring 2003, http://bridge.ecn.purdue.edu/~spave/Newsletters/seast%20.
6. Federal Highway Administration “Performance of Coarse Graded Mixes at
WesTrack. Premature Rutting”. Final Report. June 1998
7. Mogawer, W. S. and K.D. Stuart. “Validation of Asphalt Binder and Mixture Tests
that Predict Rutting Susceptibility Using the FHWA ALF”. Journal of the
Association of Asphalt Paving Technologists, Volume 66, pp 109-152, 1997.
8. Kuennen, T. “In-Field Experience Revises Superpave Guidelines”. Pavement
Maintenance & Reconstruction, Volume 13 Issue 1, pp 10-12, 1998
9. Khosla, N. P.et al. “Impact of Fines on Asphalt Mix Design”. North Carolina State
University, Raleigh, Department of Civil Engineering Final Report, 1996.
10. Lancaster, F. and S.R. Shatnawi. “Field and Laboratory Evaluation of Superpave
Level One Mix Design in California”. American Society for Testing and Materials,
Report No: STP 1322, 1997.
11. Kandhal, P.S., et al, “Critical Review of Voids in Mineral Aggregate Requirements
in Superpave”, Transportation Research Record, 1609, pp 51-60, TRB 1998.
12. Musselman, J.A., et al, “Superpave Field Implementation – Florida’s Early
Experience”, Transportation Research Record, 1609, pp 51-60, TRB 1998.

116
13. Musselman, J.A., et al, “Field Condition of Superpave Asphalt Mixes”, Paper
presented at the 2001 TRB Meeting in Washington, D.C.
14. Brian J. C., et al, “A Laboratory Investigation Into the Effects of Aggregate-
Related factors on Critical VMA in Asphalt Paving Mixtures”, Annual Meeting of
the Association of Asphalt Paving Technologists, Clearwater, Florida, March,
2001.
15. Anderson, R.M. and Bentsen, R.A., “Voids in the Mineral Aggregate (VMA) on
the Mechanical of Coarse and Fine Asphalt Mixtures”, Annual Meeting of the
Association of Asphalt Paving Technologists, Clearwater, Florida, March, 2001.
16. Brown, R., “Superpave – Where We’ve Been and Where We’re Going”, National
Superpave News, Springs 2001.
17. Prithvi S. Kandhal and L. Allen Cooley, Coarse - Verse Fine -Graded Superpave
Mixtures: Comparative Evaluation of Resistance to Rutting Transportation
Research Record 1789, pp 216-224, TRB 2002.
18. Chih-Jen Lee, Changlin Pan and Thomas White, Review of fine aggregate
angularity requirements in superpave, Journal of the Association of Asphalt Paving
Technologists, Vol. 68, 1999, pp. 305-318.
19. R. Michael Anderson, and Ross Bentsen, Influence of Voids in the Mineral
Aggregate (VMA) on the Mechanical properties of Coarse and Fine Asphalt
Mixtures, Journal of the Association of Asphalt Paving Technologists, Vol. 70,
2001, pp. 1-37.
20. Bensa Nukunya, Reynaldo Roque, Mang Tia and Bjorn Birgisson, Evaluation of
VMA and Other Volumetric Properties as Criteria for the Design and Acceptance
of Superpave Mixture, Journal of the Association of Asphalt Paving Technologists,
Vol. 70, 2001, pp. 38-69.
21. Byron E. Ruth, Reynaldo Roque and Bensa Nukunya, Aggregate Gradation
Characterization Factors and Their Relationships to Fracture Energy and Failure
Strain of Asphalt Mixtures, Journal of the Association of Asphalt Paving
Technologists, Vol. 71, 2002, pp. 310-344.
22. “Louisiana Standard Specifications for Roads and Bridges,” State of Louisiana,
Department of Transportation and Development, Baton Rouge, 2000 Edition.
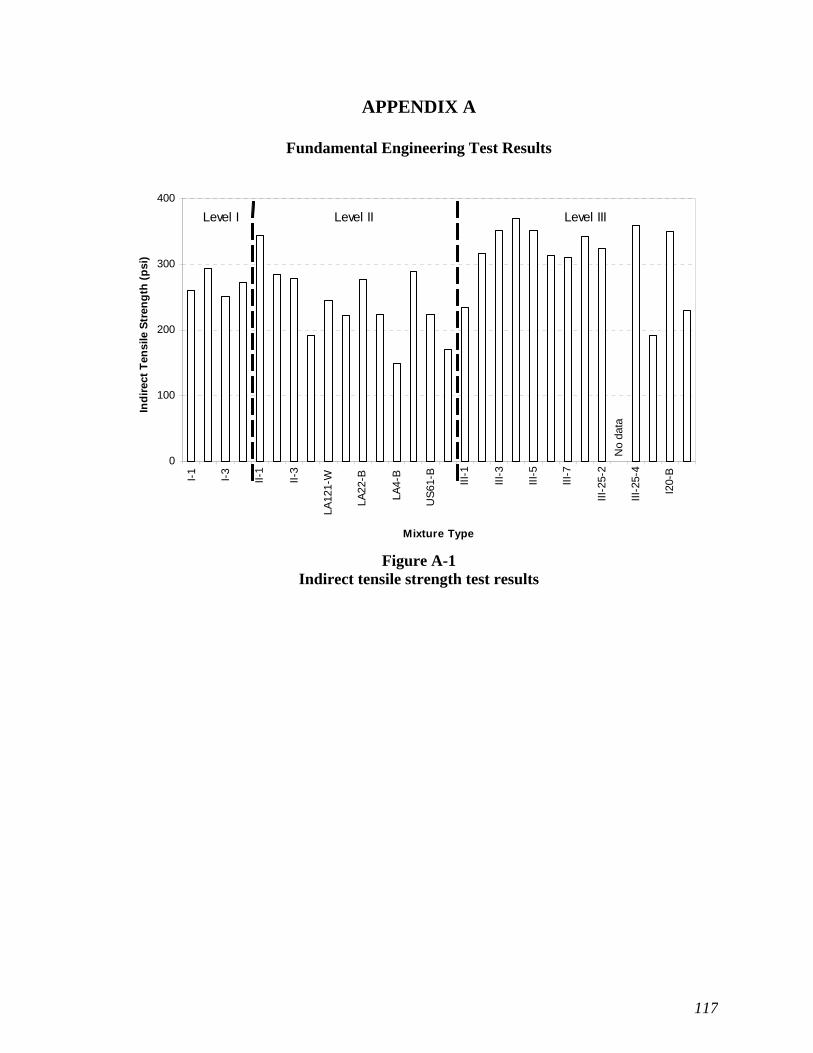
117
APPENDIX A
Fundamental Engineering Test Results
0
100
200
300
400I-
1
I-3
II-1
II-3
LA12
1-W
LA22
-B
LA4-
B
US
61-B III-1
III-3
III-5
III-7
III-2
5-2
III-2
5-4
I20-
B
Mixture Type
Ind
irec
t T
ensi
le S
tren
gth
(p
si)
Level I Level II Level III
No
data
Figure A-1
Indirect tensile strength test results
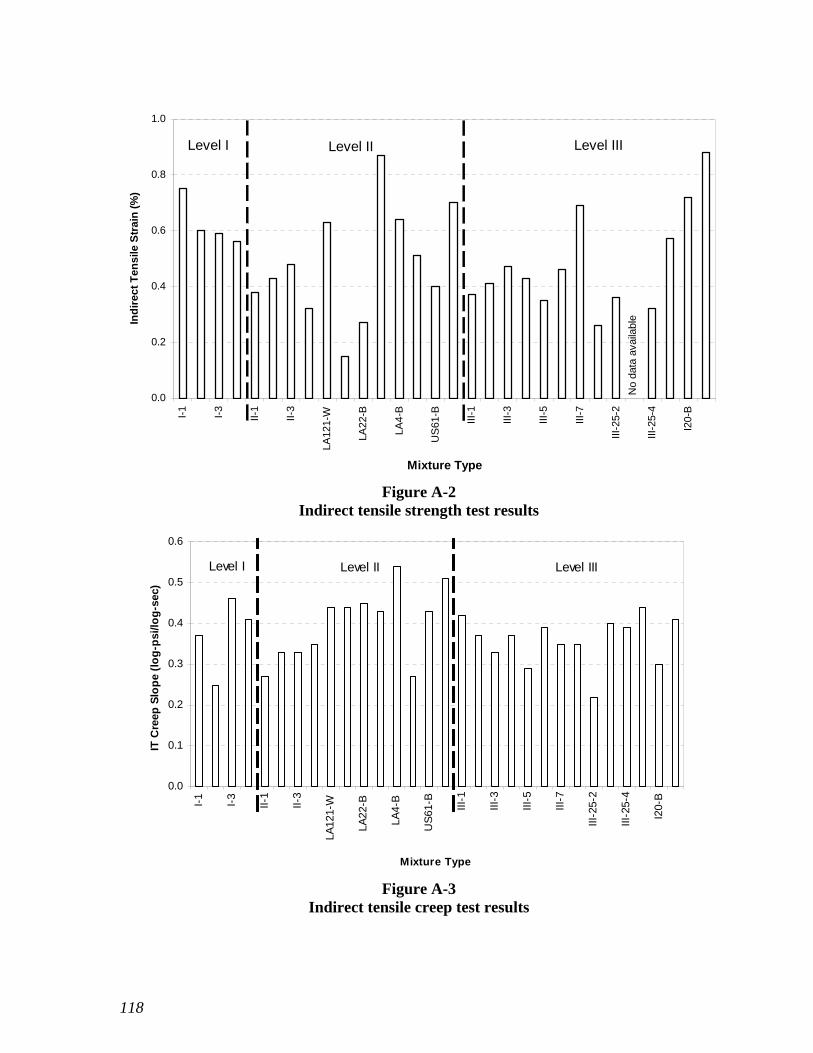
118
0.0
0.2
0.4
0.6
0.8
1.0
I-1
I-3
II-1
II-3
LA12
1-W
LA22
-B
LA4-
B
US
61-B
III-1
III-3
III-5
III-7
III-2
5-2
III-2
5-4
I20-
B
Mixture Type
Ind
ire
ct
Te
ns
ile S
tra
in (
%)
No
data
ava
ilabl
e
Level I Level II Level III
Figure A-2 Indirect tensile strength test results
0.0
0.1
0.2
0.3
0.4
0.5
0.6
I-1
I-3
II-1
II-3
LA12
1-W
LA22
-B
LA4-
B
US
61-B III-1
III-3
III-5
III-7
III-2
5-2
III-2
5-4
I20-
B
Mixture Type
IT C
reep
Slo
pe
(lo
g-p
si/lo
g-s
ec)
Level I Level II Level III
Figure A-3
Indirect tensile creep test results

119
9.5
10.0
10.5
11.0
11.5
12.0
12.5
13.0
I-1
I-3
II-1
II-3
LA12
1-W
LA22
-B
LA4-
B
US
61-B III-1
III-3
III-5
III-7
III-2
5-2
III-2
5-4
I20-
B
Mixture Type
IT C
reep
Inte
rcep
t (l
og
psi
)Level I Level II Level III
Figure A-4
Indirect tensile creep test results
0
2000
4000
6000
8000
10000
12000
14000
I-1
I-3
II-1
II-3
LA12
1-W
LA22
-B
LA4-
B
US
61-B III-1
III-3
III-5
III-7
III-2
5-2
III-2
5-4
I20-
B
Mixture Type
Axi
al C
reep
Sti
ffn
ess
(psi
)
No
data
Level I Level II Level III
Figure A-4
Axial creep test results

120
0.0
5.0
10.0
15.0
20.0
25.0
30.0
I-1
I-3
II-1
II-3
LA12
1-W
LA22
-B
LA4-
B
US
61-B III-1
III-3
III-5
III-7
III-2
5-2
III-2
5-4
I20-
B
Mixture Type
Axi
al C
reep
Slo
pe
(E-8
inch
/inch
-sec
)
No
data
No
data
ava
ilabl
e
Level I Level II Level III
Figure A-5
Axial creep test results
0
200
400
600
800
1000
I-1
I-3
II-1
II-3
LA12
1-W
LA22
-B
LA4-
B
US
61-B
III-
1
III-
3
III-
5
III-
7
III-
25-2
III-
25-4
I20-
B
Mixture Type
Ind
irec
t T
ensi
le R
esil
ien
t M
od
ulu
s at
5°C
(ks
i)
No
data
Level I Level II Level III
Figure A-6 1
Indirect tensile resilient modulus (5°C) test results

121
0
100
200
300
400
500
600
700
800
900
I-1
I-3
II-1
II-3
LA12
1-W
LA22
-B
LA4-
B
US
61-B III-1
III-3
III-5
III-7
III-2
5-2
III-2
5-4
I20-
B
Mixture Type
Ind
irec
t T
ensi
le R
esili
ent
Mo
du
lus
at 2
5°C
(ks
i)
No
data
Level I Level II Level III
Figure A-7-0-1
Indirect tensile resilient modulus (25°C) test results
0
100
200
300
400
500
600
I-1
I-3
II-1
II-3
LA12
1-W
LA22
-B
LA4-
B
US
61-B III-1
III-3
III-5
III-7
III-2
5-2
III-2
5-4
I20-
B
Mixture Type
Ind
irec
t T
ensi
le R
esili
ent
Mo
du
lus
at 4
0°C
(ks
i)
No
data
Level I Level II Level III
Figure A-8
Indirect tensile resilient modulus (40°C) test results

122
0
10000
20000
30000
40000
50000
I-1
I-3
II-1
II-3
LA12
1-W
LA22
-B
LA4-
B
US
61-B
III-1
III-3
III-5
III-7
III-2
5-2
III-2
5-4
I20-
B
Mixture Type
Co
mp
lex
Sh
ear
Mo
du
lus
(10H
z)(p
si)
No
data
ava
ilabl
e
No
data
ava
ilabl
e
Level I Level II Level III
Figure A-9 Complex shear modulus test results
0
4000
8000
12000
16000
20000
I-1
I-3
II-1
II-3
LA12
1-W
LA22
-B
LA4-
B
US
61-B III-1
III-3
III-5
III-7
III-2
5-2
III-2
5-4
I20-
B
Mixture Type
Co
mp
lex
Sh
ear
Mo
du
lus
(1 H
z) (
psi
)
No
data
No
data
Level I Level II Level III
Figure A-10
Complex shear modulus test results
123
0
10000
20000
30000
40000
50000
I-1
I-3
II-1
II-3
LA12
1-W
LA22
-B
LA4-
B
US
61-B
III-1
III-3
III-5
III-7
III-2
5-2
III-2
5-4
I20-
B
Mixture Type
RS
CH
Per
man
ent
Str
ain
(mic
ro s
trai
n)
No
data
ava
ilabl
e
No
data
ava
ilabl
e
Level I Level II Level III
Figure A-11
RSCH permanent strain test results
0
1000
2000
3000
4000
5000
6000
7000
8000
I-1
I-3
II-1
II-3
LA12
1-W
LA22
-B
LA4-
B
US
61-B III-1
III-3
III-5
III-7
III-2
5-2
III-2
5-4
I20-
B
Mixture Type
Sim
ple
Sh
ear
Per
man
ent
Str
ain
(m
icro
str
ain
) Level II Level IIILevel I
No
data
ava
ilabl
e
No
data
ava
ilabl
e
Figure A-12
Simple shear permanent strain test results
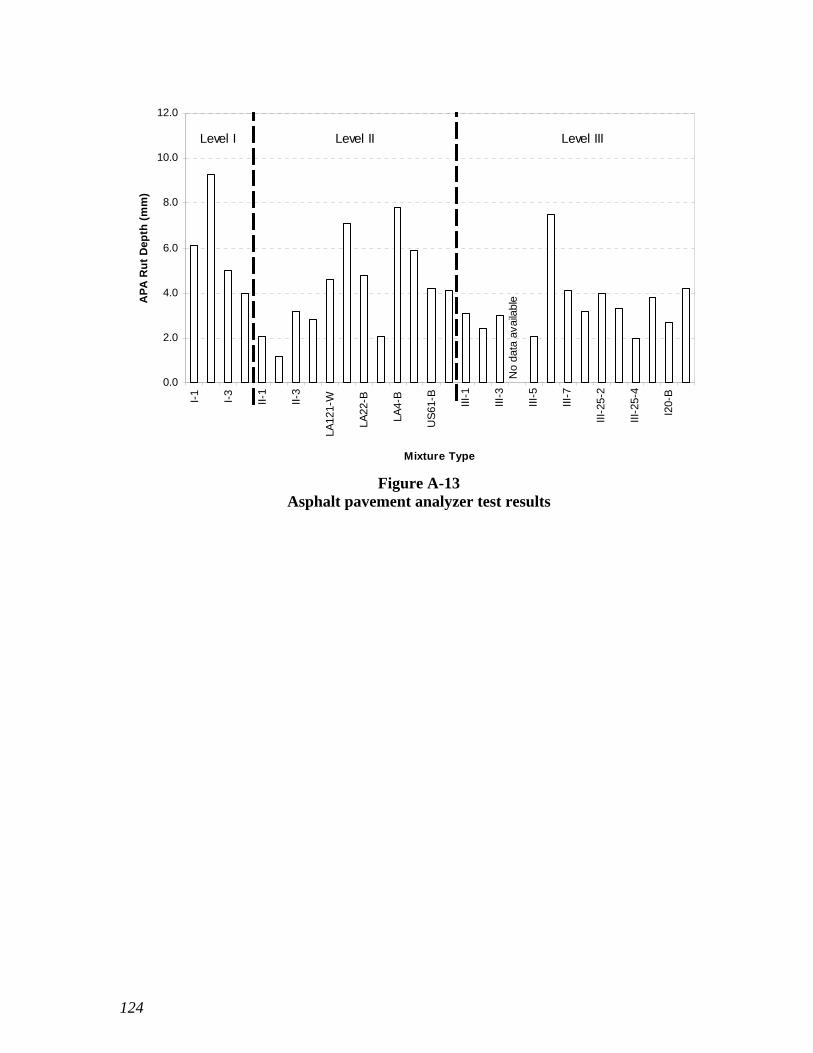
124
0.0
2.0
4.0
6.0
8.0
10.0
12.0
I-1
I-3
II-1
II-3
LA12
1-W
LA22
-B
LA4-
B
US
61-B III-1
III-3
III-5
III-7
III-2
5-2
III-2
5-4
I20-
B
Mixture Type
AP
A R
ut
Dep
th (
mm
)
No
data
ava
ilabl
e
Level I Level II Level III
Figure A-13
Asphalt pavement analyzer test results
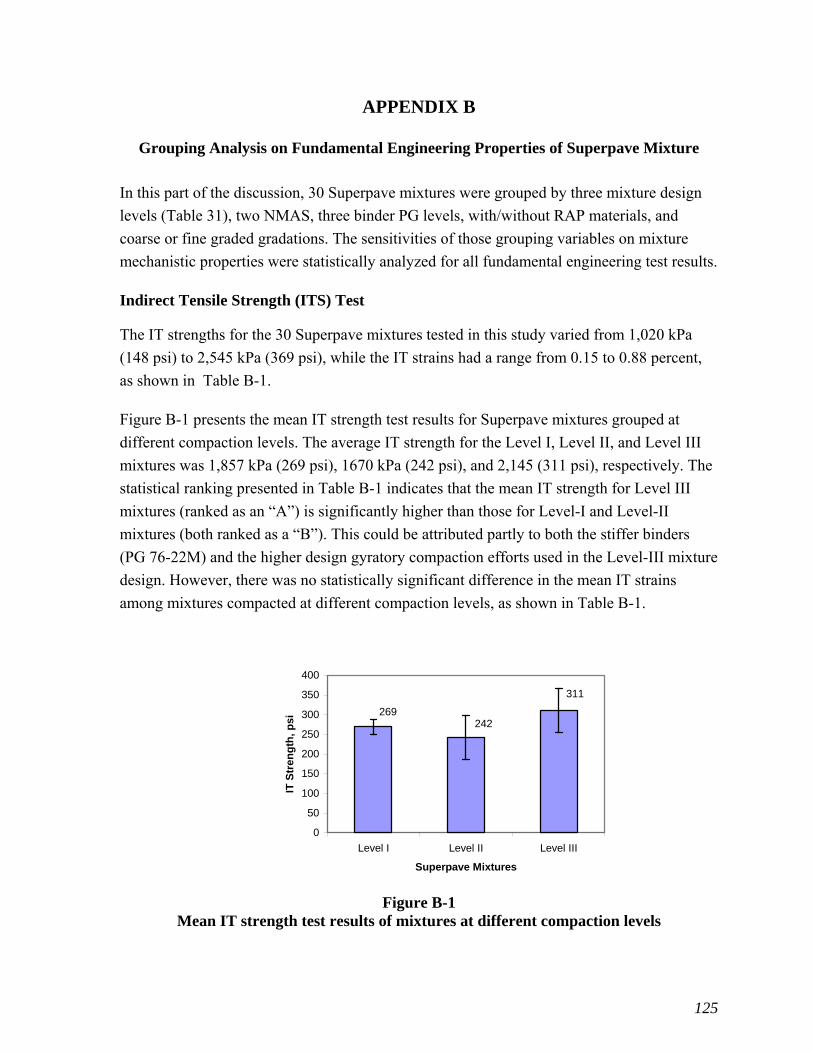
125
APPENDIX B
Grouping Analysis on Fundamental Engineering Properties of Superpave Mixture
In this part of the discussion, 30 Superpave mixtures were grouped by three mixture design
levels (Table 31), two NMAS, three binder PG levels, with/without RAP materials, and
coarse or fine graded gradations. The sensitivities of those grouping variables on mixture
mechanistic properties were statistically analyzed for all fundamental engineering test results.
Indirect Tensile Strength (ITS) Test
The IT strengths for the 30 Superpave mixtures tested in this study varied from 1,020 kPa
(148 psi) to 2,545 kPa (369 psi), while the IT strains had a range from 0.15 to 0.88 percent,
as shown in Table B-1.
Figure B-1 presents the mean IT strength test results for Superpave mixtures grouped at
different compaction levels. The average IT strength for the Level I, Level II, and Level III
mixtures was 1,857 kPa (269 psi), 1670 kPa (242 psi), and 2,145 (311 psi), respectively. The
statistical ranking presented in Table B-1 indicates that the mean IT strength for Level III
mixtures (ranked as an “A”) is significantly higher than those for Level-I and Level-II
mixtures (both ranked as a “B”). This could be attributed partly to both the stiffer binders
(PG 76-22M) and the higher design gyratory compaction efforts used in the Level-III mixture
design. However, there was no statistically significant difference in the mean IT strains
among mixtures compacted at different compaction levels, as shown in Table B-1.
311
242269
0
50
100
150
200
250
300
350
400
Level I Level II Level III
Superpave Mixtures
IT S
tren
gth
, p
si
Figure B-1
Mean IT strength test results of mixtures at different compaction levels
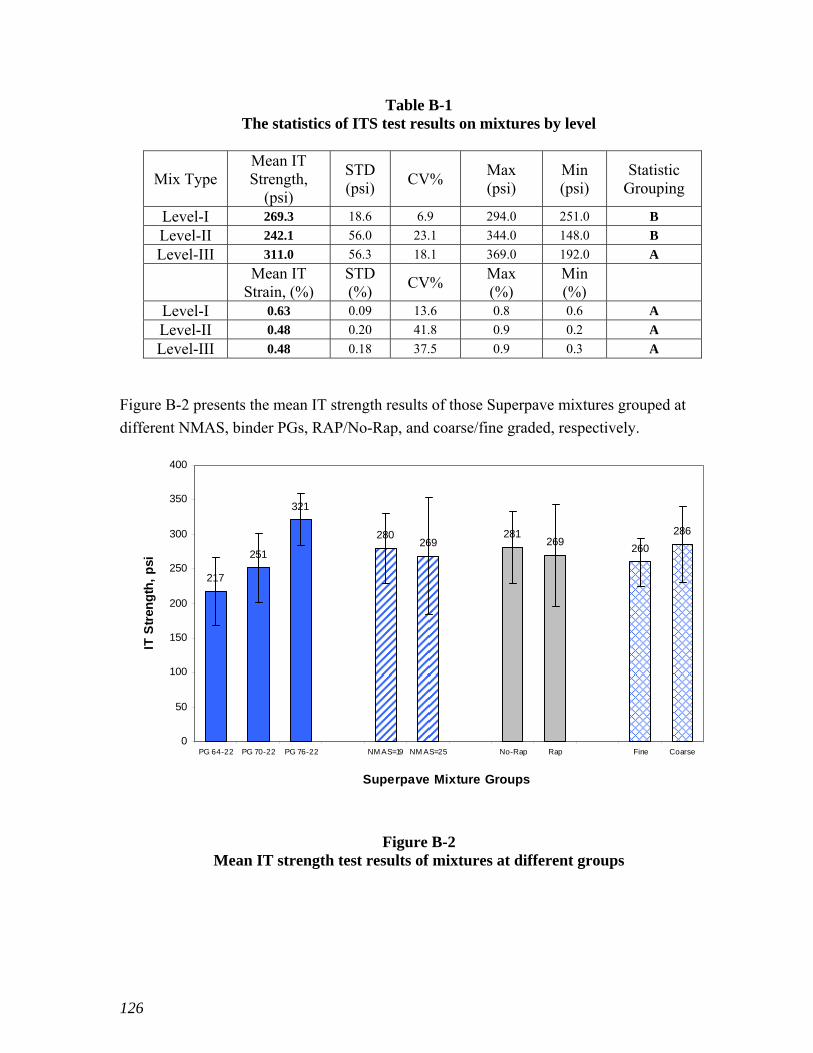
126
Table B-1 The statistics of ITS test results on mixtures by level
Mix Type Mean IT Strength,
(psi)
STD (psi)
CV% Max (psi)
Min (psi)
Statistic Grouping
Level-I 269.3 18.6 6.9 294.0 251.0 B
Level-II 242.1 56.0 23.1 344.0 148.0 B
Level-III 311.0 56.3 18.1 369.0 192.0 A
Mean IT
Strain, (%) STD (%)
CV% Max (%)
Min (%)
Level-I 0.63 0.09 13.6 0.8 0.6 A
Level-II 0.48 0.20 41.8 0.9 0.2 A
Level-III 0.48 0.18 37.5 0.9 0.3 A
Figure B-2 presents the mean IT strength results of those Superpave mixtures grouped at
different NMAS, binder PGs, RAP/No-Rap, and coarse/fine graded, respectively.
217
251
321
280269
281269
260
286
0
50
100
150
200
250
300
350
400
PG 64-22 PG 70-22 PG 76-22 NM AS=19 NM AS=25 No-Rap Rap Fine Coarse
Superpave Mixture Groups
IT S
tren
gth
, p
si
Figure B-2 Mean IT strength test results of mixtures at different groups

127
It can be observed from Figure B-2 that:
Mixtures with higher PG binders tended to have higher IT strength values; in other
words, ITS (PG 76-22) > ITS (PG 70-22) > ITS (PG 64-22). This indicates that the IT strength
values for Superpave mixtures are sensitive to the binder PG types.
As the NMAS increased from 19 mm to 25 mm, the IT strength tended to decrease;
i.e., ITS (19mm) > ITS (25mm). However, the difference in ITS between 19 mm and 25
mm Superpave mixtures was not statistically significant.
Mixtures with no RAP appeared to have higher IT strengths than mixtures containing
RAP; i.e., ITS (no-RAP) > ITS (RAP). This is expected, as RAP materials contain aged
binders that are less flexible in tension. However, the difference was not statistically
significant.
The mean IT strength for the coarse-graded Superpave mixtures appeared to be higher
than that for the fine-graded; i.e., ITS (coarse) > ITS (fine). This may be attributed to the
difference in aggregate structure (interlocking) between coarse-graded or fine-graded
mixtures. However, this difference in the mean ITS results was not statistically
significant.
Indirect Tensile (IT) Creep Test
In an IT creep test, a lower creep slope and a higher creep intercept are desired for rut
resistant mixtures. In this study, test results ranged from 0.22 to 0.54 log psi/log sec for IT
creep slopes and from 10.76 to 12.40 log psi for IT intercepts.
Figure B-3 presents the mean IT creep slope results for Superpave mixtures grouped at
different compaction levels. The average IT creep slope for the Level I, Level II, and Level
III mixtures was 0.37, 0.40, and 0.36, respectively. The statistical ranking analysis presented
in Table B-2 indicated that there was no significant difference in ranking for either IT creep
slope results or IT strain results among different compaction levels. This indicates that
Superpave mixtures classified at different compaction levels were not sensitive to an IT creep
test condition.
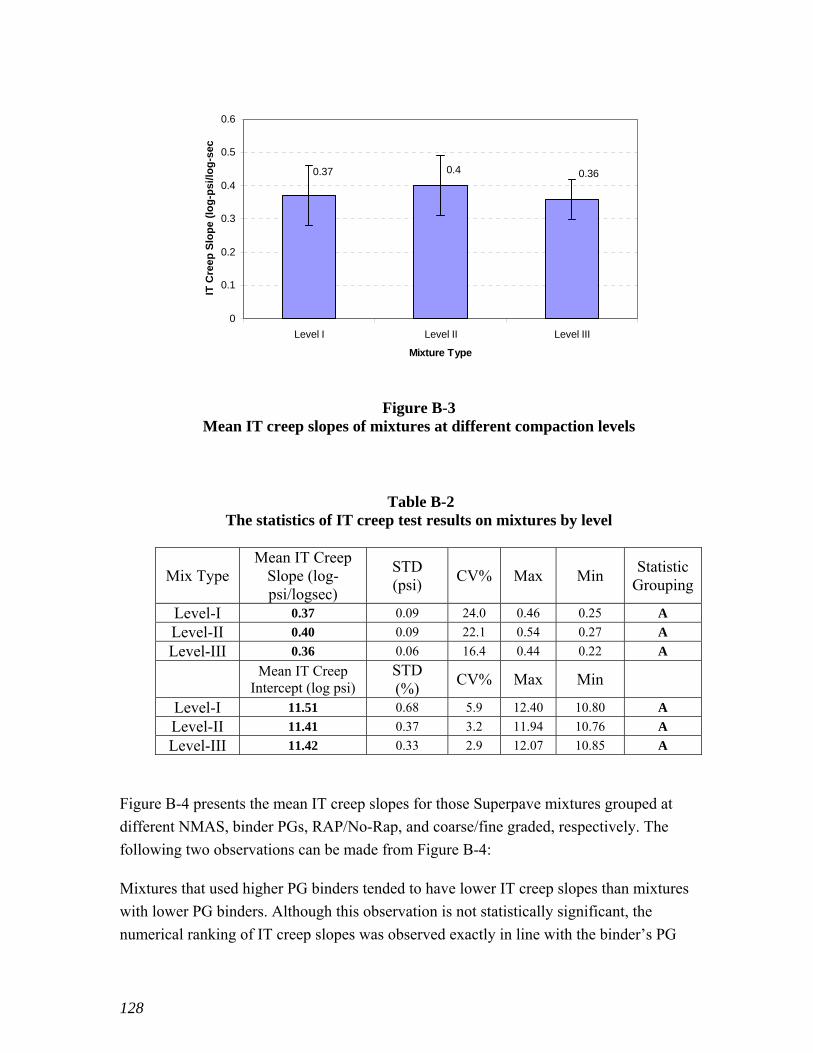
128
0.360.40.37
0
0.1
0.2
0.3
0.4
0.5
0.6
Level I Level II Level III
Mixture Type
IT C
reep
Slo
pe
(lo
g-p
si/l
og
-sec
Figure B-3 Mean IT creep slopes of mixtures at different compaction levels
Table B-2
The statistics of IT creep test results on mixtures by level
Mix Type Mean IT Creep
Slope (log-psi/logsec)
STD (psi)
CV% Max Min Statistic
Grouping
Level-I 0.37 0.09 24.0 0.46 0.25 A
Level-II 0.40 0.09 22.1 0.54 0.27 A
Level-III 0.36 0.06 16.4 0.44 0.22 A
Mean IT Creep
Intercept (log psi) STD (%)
CV% Max Min
Level-I 11.51 0.68 5.9 12.40 10.80 A
Level-II 11.41 0.37 3.2 11.94 10.76 A
Level-III 11.42 0.33 2.9 12.07 10.85 A
Figure B-4 presents the mean IT creep slopes for those Superpave mixtures grouped at
different NMAS, binder PGs, RAP/No-Rap, and coarse/fine graded, respectively. The
following two observations can be made from Figure B-4:
Mixtures that used higher PG binders tended to have lower IT creep slopes than mixtures
with lower PG binders. Although this observation is not statistically significant, the
numerical ranking of IT creep slopes was observed exactly in line with the binder’s PG
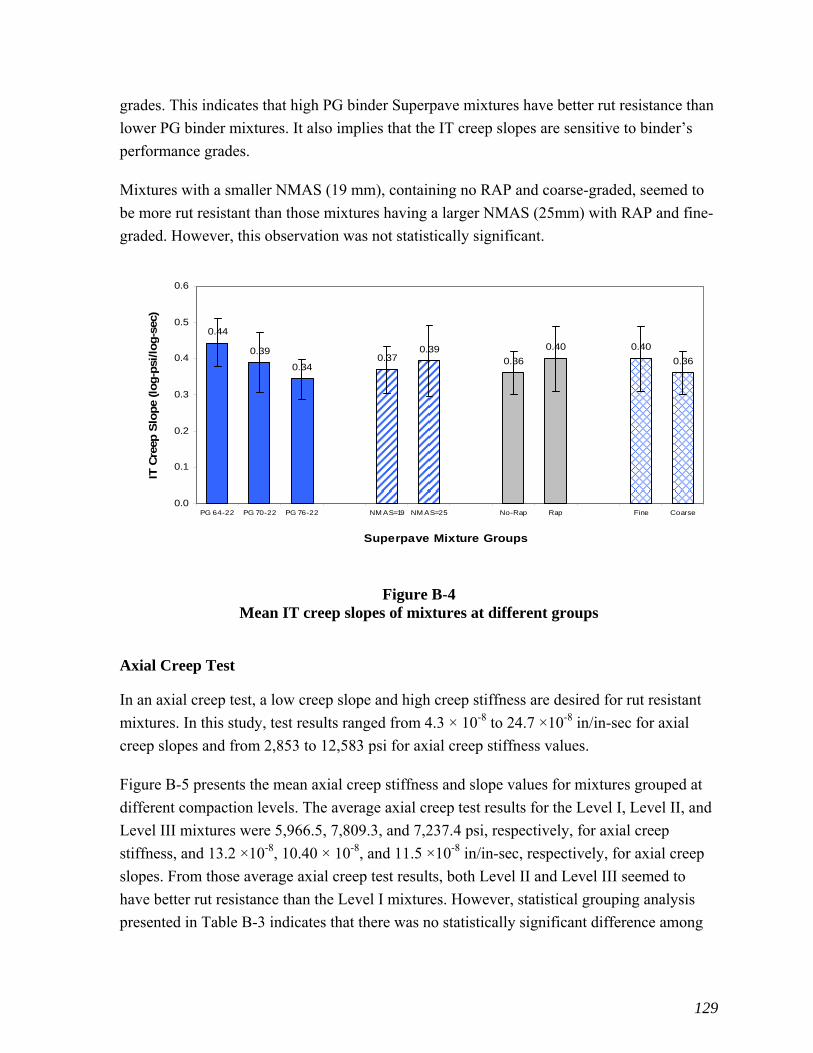
129
grades. This indicates that high PG binder Superpave mixtures have better rut resistance than
lower PG binder mixtures. It also implies that the IT creep slopes are sensitive to binder’s
performance grades.
Mixtures with a smaller NMAS (19 mm), containing no RAP and coarse-graded, seemed to
be more rut resistant than those mixtures having a larger NMAS (25mm) with RAP and fine-
graded. However, this observation was not statistically significant.
0.44
0.39
0.340.37
0.390.36
0.40 0.40
0.36
0.0
0.1
0.2
0.3
0.4
0.5
0.6
PG 64-22 PG 70-22 PG 76-22 NM AS=19 NM AS=25 No-Rap Rap Fine Coarse
Superpave Mixture Groups
IT C
reep
Slo
pe
(log-p
si/log-s
ec)
Figure B-4 Mean IT creep slopes of mixtures at different groups
Axial Creep Test
In an axial creep test, a low creep slope and high creep stiffness are desired for rut resistant
mixtures. In this study, test results ranged from 4.3 × 10⁻⁸ to 24.7 ×10⁻⁸ in/in-sec for axial
creep slopes and from 2,853 to 12,583 psi for axial creep stiffness values.
Figure B-5 presents the mean axial creep stiffness and slope values for mixtures grouped at
different compaction levels. The average axial creep test results for the Level I, Level II, and
Level III mixtures were 5,966.5, 7,809.3, and 7,237.4 psi, respectively, for axial creep
stiffness, and 13.2 ×10⁻⁸, 10.40 × 10⁻⁸, and 11.5 ×10⁻⁸ in/in-sec, respectively, for axial creep
slopes. From those average axial creep test results, both Level II and Level III seemed to
have better rut resistance than the Level I mixtures. However, statistical grouping analysis
presented in Table B-3 indicates that there was no statistically significant difference among
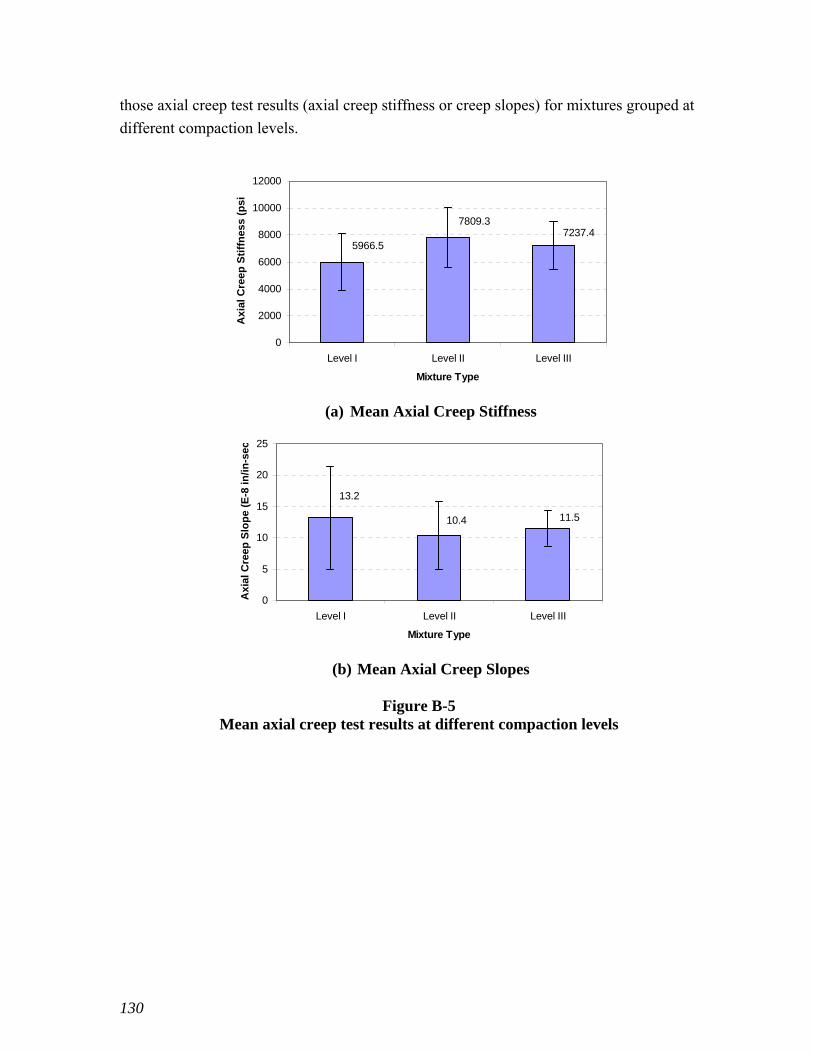
130
those axial creep test results (axial creep stiffness or creep slopes) for mixtures grouped at
different compaction levels.
7237.47809.3
5966.5
0
2000
4000
6000
8000
10000
12000
Level I Level II Level III
Mixture Type
Ax
ial
Cre
ep
Sti
ffn
es
s (
ps
i
(a) Mean Axial Creep Stiffness
11.510.4
13.2
0
5
10
15
20
25
Level I Level II Level III
Mixture Type
Axi
al C
reep
Slo
pe
(E-8
in
/in
-sec
(b) Mean Axial Creep Slopes
Figure B-5 Mean axial creep test results at different compaction levels

131
Table B-3 The statistics of axial creep test results on mixtures by compaction level
Mix Type Mean Axial Creep
Stiffness (log-psi/log-sec)
STD CV% Max Min Statistic
Grouping
Level-I 5967 2106 35.3 7271 2853 A
Level-II 7809 2264 29.0 11935 5319 A
Level-III 7237 1816 25.1 12583 5254 A
Mean Axial Creep Slope (E-8 in/in-sec)
STD (%)
CV% Max Min
Level-I 13.2 8.2 62.3 24.7 6.9 A
Level-II 10.4 5.5 52.5 22.9 4.3 A
Level-III 11.5 2.9 25.3 14.9 4.5 A
Figure B-6 presents the mean axial creep slopes and stiffness results for those Superpave
mixtures grouped at different NMAS, binder PGs, RAP/No-Rap, and coarse/fine graded,
respectively.
From Figure B-6, the following observations can be made:
Mixtures produced with PG 70-22 binders seemed to have lower axial creep slopes
and higher axial creep stiffness than mixtures with other PG binders. However, there
is no statistically significant difference among those values.
There is no statistically significant difference in terms of axial creep slope and creep
stiffness among mixtures with two different NMAS of 19 and 25 mm.
Similarly, there is no statistically significant difference in terms of axial creep slope
and creep stiffness among mixtures with or without RAP contents.
However, fine-graded mixtures appeared to have lower creep slopes than coarse-
graded ones, although both had similar creep stiffness values. This indicates that fine-
graded Superpave mixtures seemed to have better rut resistance than coarse-graded
mixtures. Obviously, this contradicts the IT creep test results.
In general, axial creep test results were found not to be very sensitive in capturing the
rutting performance of Superpave mixtures considered in this study.
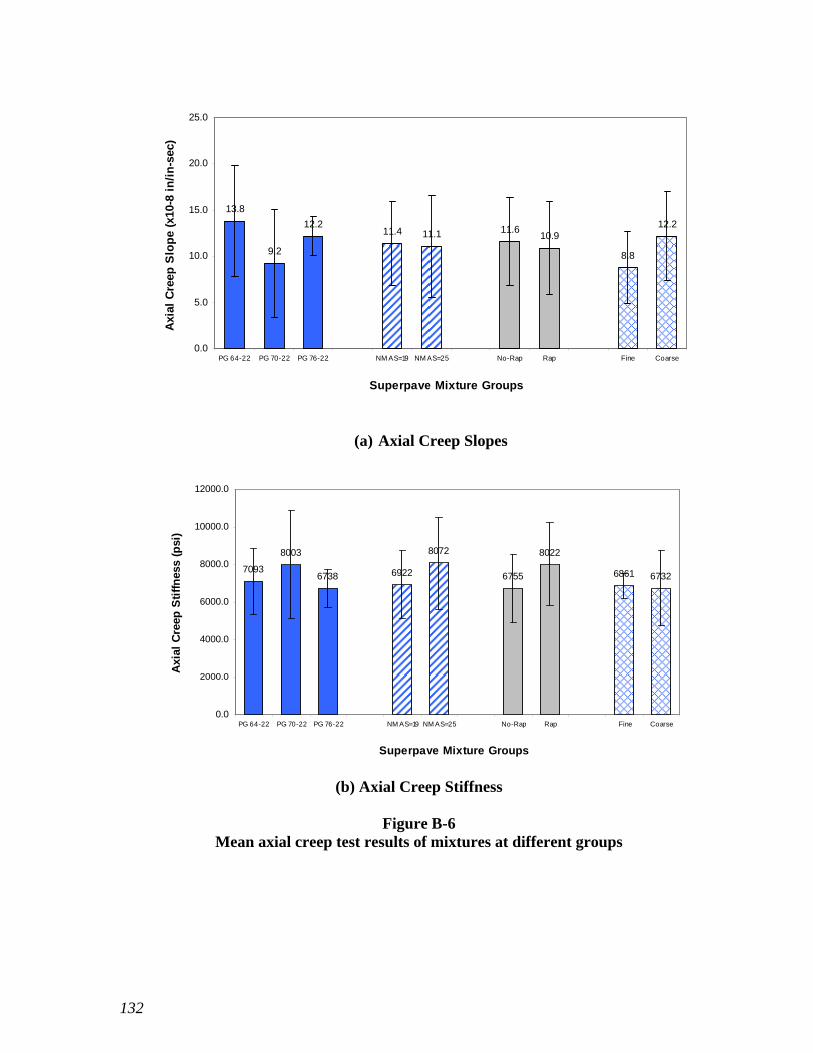
132
13.8
9.2
12.211.4 11.1 11.6
10.9
8.8
12.2
0.0
5.0
10.0
15.0
20.0
25.0
PG 64-22 PG 70-22 PG 76-22 NM AS=19 NM AS=25 No-Rap Rap Fine Coarse
Superpave Mixture Groups
Axi
al C
reep
Slo
pe
(x10
-8 i
n/i
n-s
ec)
(a) Axial Creep Slopes
7093
8003
6738 6922
8072
6755
8022
6861 6732
0.0
2000.0
4000.0
6000.0
8000.0
10000.0
12000.0
PG 64-22 PG 70-22 PG 76-22 NM AS=19 NM AS=25 No-Rap Rap Fine Coarse
Superpave Mixture Groups
Axi
al C
reep
Sti
ffn
ess
(psi
)
(b) Axial Creep Stiffness
Figure B-6 Mean axial creep test results of mixtures at different groups
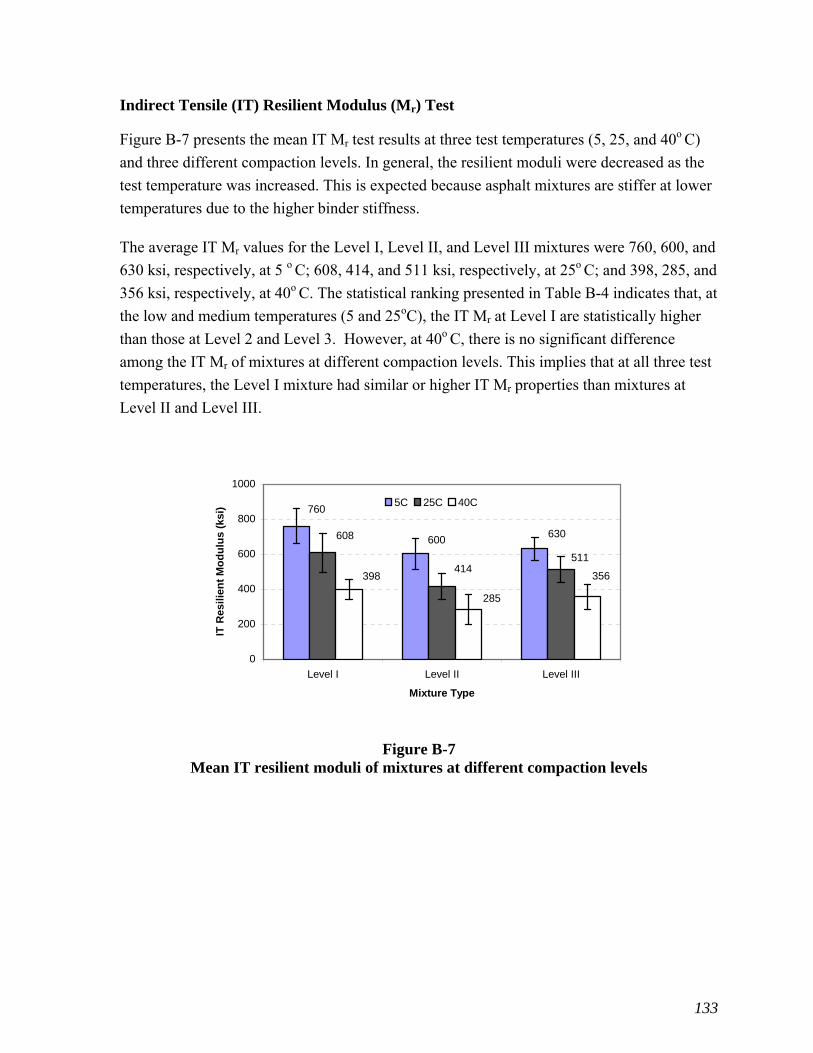
133
Indirect Tensile (IT) Resilient Modulus (Mr) Test
Figure B-7 presents the mean IT Mr test results at three test temperatures (5, 25, and 40o C)
and three different compaction levels. In general, the resilient moduli were decreased as the
test temperature was increased. This is expected because asphalt mixtures are stiffer at lower
temperatures due to the higher binder stiffness.
The average IT Mr values for the Level I, Level II, and Level III mixtures were 760, 600, and
630 ksi, respectively, at 5 o C; 608, 414, and 511 ksi, respectively, at 25o C; and 398, 285, and
356 ksi, respectively, at 40o C. The statistical ranking presented in Table B-4 indicates that, at
the low and medium temperatures (5 and 25oC), the IT Mr at Level I are statistically higher
than those at Level 2 and Level 3. However, at 40o C, there is no significant difference
among the IT Mr of mixtures at different compaction levels. This implies that at all three test
temperatures, the Level I mixture had similar or higher IT Mr properties than mixtures at
Level II and Level III.
630600
760
511414
608
356
285
398
0
200
400
600
800
1000
Level I Level II Level III
Mixture Type
IT R
esil
ien
t M
od
ulu
s (k
si) 5C 25C 40C
Figure B-7 Mean IT resilient moduli of mixtures at different compaction levels
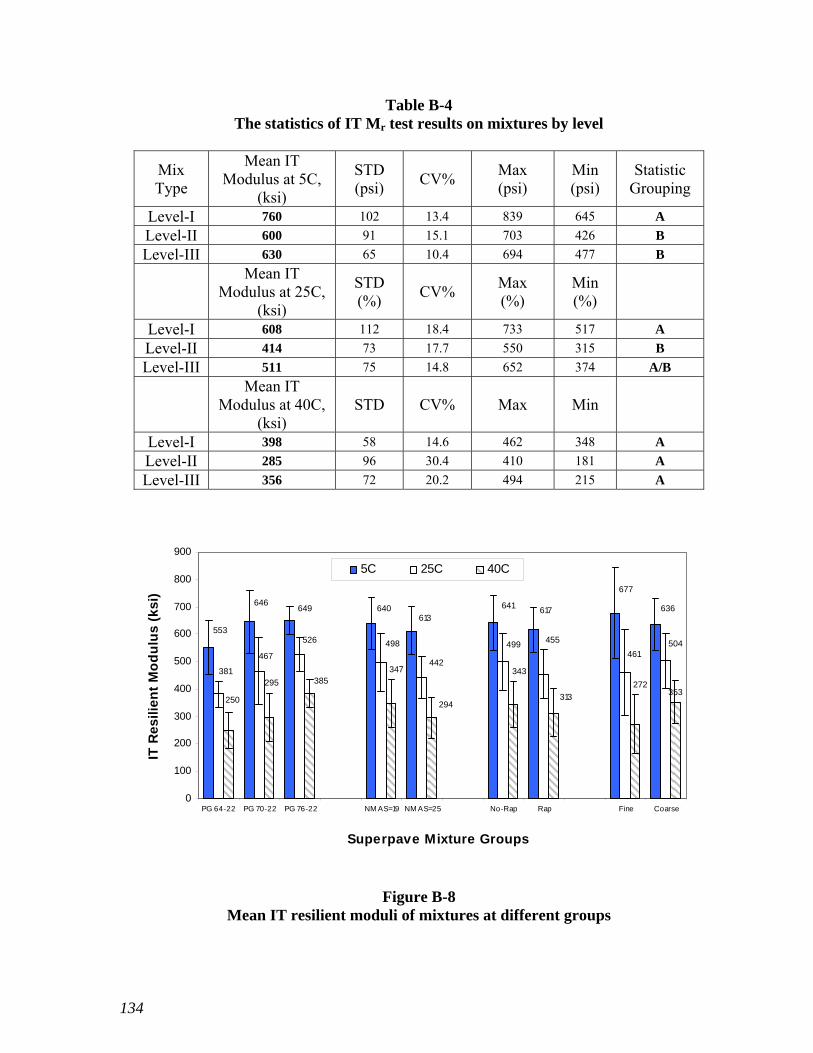
134
Table B-4 The statistics of IT Mr test results on mixtures by level
Mix Type
Mean IT Modulus at 5C,
(ksi)
STD (psi)
CV% Max (psi)
Min (psi)
Statistic Grouping
Level-I 760 102 13.4 839 645 A
Level-II 600 91 15.1 703 426 B
Level-III 630 65 10.4 694 477 B
Mean IT
Modulus at 25C, (ksi)
STD (%)
CV% Max (%)
Min (%)
Level-I 608 112 18.4 733 517 A
Level-II 414 73 17.7 550 315 B
Level-III 511 75 14.8 652 374 A/B
Mean IT
Modulus at 40C, (ksi)
STD CV% Max Min
Level-I 398 58 14.6 462 348 A
Level-II 285 96 30.4 410 181 A
Level-III 356 72 20.2 494 215 A
353
636
677
617641
613640649
646
553
461504455499
442
498526
467
381
272
313
343
294
347385295
250
0
100
200
300
400
500
600
700
800
900
PG 64-22 PG 70-22 PG 76-22 NM AS=19 NM AS=25 No-Rap Rap Fine Coarse
Superpave Mixture Groups
IT R
es
ilie
nt
Mo
du
lus
(k
si)
5C 25C 40C
Figure B-8 Mean IT resilient moduli of mixtures at different groups

135
Figure B-8 presents the mean IT Mr test results of Superpave mixtures grouped at different
NMAS, binder PGs, RAP/No-Rap, and coarse/fine graded, respectively. The following
observation can be made:
Mixtures produced with higher PG binders had a tendency to possess higher IT Mr values
than mixtures with lower PG binders at all three temperatures: 5, 25, and 40o C. In addition,
mixtures with PG 76-22 had statistically significant higher IT Mr values than those with PG
64-22, indicating that the IT Mr test is fairly sensitive to binder PG types used in a Superpave
mixture.
Mixtures with 19 mm NMAS and no RAP content tended to have higher IT Mr values at all
three test temperatures than those with 25 mm NMAS and RAP contents. However, the
differences were not statistically significant.
Fine-graded mixtures tended to have higher IT Mr values at 5 o C and lower IT Mr values at
both 25 and 40 o C than coarse-graded mixtures. Again, those differences were not
statistically significant.
Frequency Sweep at Constant Height Test
As stated earlier, the complex shear modulus (G*) is defined as the ratio of the peak stress
amplitude to the peak strain amplitude. It is a measure of the total stiffness of asphalt
mixtures and is composed of elastic and viscous components. Phase angle () is defined as
the time lag between the application of a stress and the resulting strain. The property
G*/sin() is considered as an indicator of mixtures’ susceptibility to permanent deformation.
Higher G*/sin() value is desired for rut resistant mixtures. In this study, the property of
G*/sin() at 60oC ranged from 7,874 to 47,368 psi at 10Hz, from 3,683 to 17,533 psi at 1Hz,
from 2,010 to 11,490 psi at 0.1Hz, and from 2,103 to 9,741 psi at 0.01 Hz, as shown in Table
33.
Figures B-9 and B-10 present the mean G*/sin() at 10 and 0.1 Hz, respectively, for mixtures
grouped at three compaction levels. The mean G*/sin() values for Level I, Level II, and
Level III mixtures are 16,774, 21,439, and 20,916 psi, respectively, at 10Hz and 5,242,
5,333, and 5,330 psi, respectively, at 0.1Hz. The statistical ranking presented in Table B-5
indicated that the G*/sin()10Hz for Level-II and Level-III are significantly higher than that
for Level-I. However, at 0.1 Hz, all three levels of mixtures possessed similar G*/sin()
values.
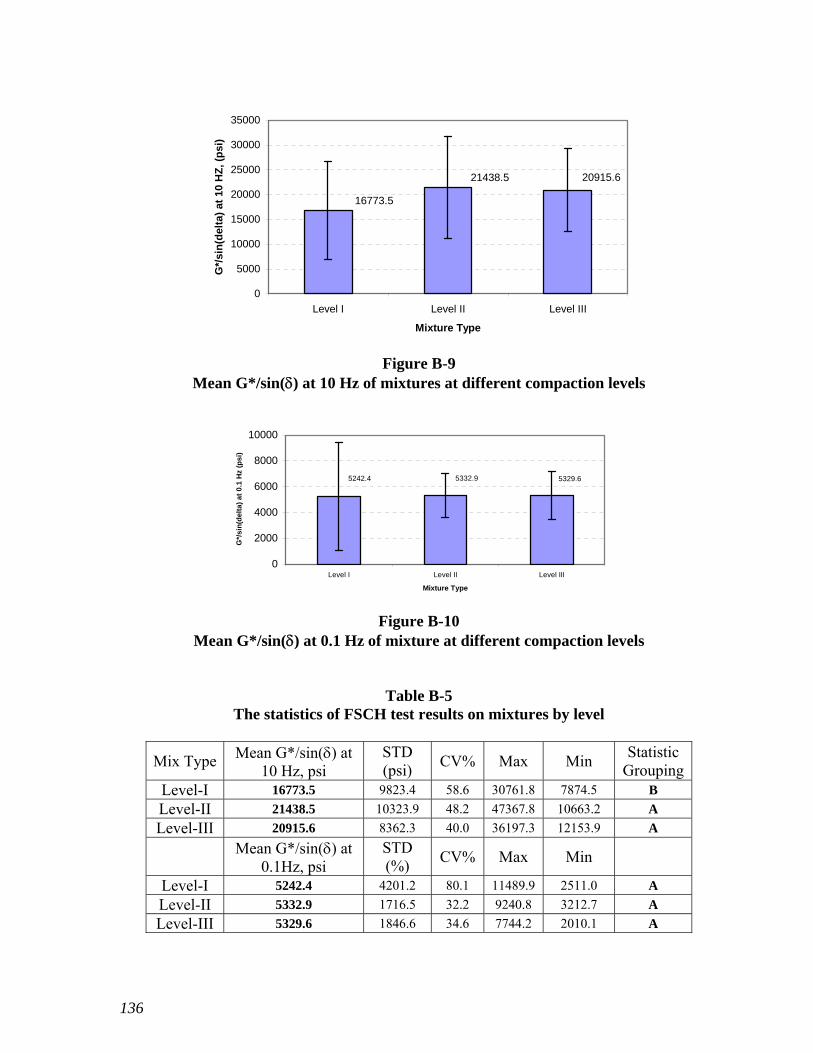
136
20915.621438.5
16773.5
0
5000
10000
15000
20000
25000
30000
35000
Level I Level II Level III
Mixture Type
G*/
sin
(del
ta)
at 1
0 H
Z,
(psi
)
Figure B-9
Mean G*/sin() at 10 Hz of mixtures at different compaction levels
5329.65332.95242.4
0
2000
4000
6000
8000
10000
Level I Level II Level III
Mixture Type
G*/
sin
(del
ta)
at
0.1
Hz
(ps
i)
Figure B-10
Mean G*/sin() at 0.1 Hz of mixture at different compaction levels
Table B-5 The statistics of FSCH test results on mixtures by level
Mix Type Mean G*/sin() at 10 Hz, psi
STD (psi)
CV% Max Min Statistic
Grouping Level-I 16773.5 9823.4 58.6 30761.8 7874.5 B
Level-II 21438.5 10323.9 48.2 47367.8 10663.2 A
Level-III 20915.6 8362.3 40.0 36197.3 12153.9 A
Mean G*/sin() at 0.1Hz, psi
STD (%)
CV% Max Min
Level-I 5242.4 4201.2 80.1 11489.9 2511.0 A
Level-II 5332.9 1716.5 32.2 9240.8 3212.7 A
Level-III 5329.6 1846.6 34.6 7744.2 2010.1 A

137
Figure B-11 presents the mean G*/sin() test results at 10, 1, and 0.1Hz for Superpave
mixtures grouped at different NMAS, binder PGs, RAP/No-Rap, and coarse/fine graded,
respectively. The following observations can be made from Figure B-11:
Fine-graded mixtures tended to have higher G*/sin() values at different frequencies than
coarse-graded ones. However, the differences might be not statistically significant.
Mixtures produced with higher PG binders had a tendency of having higher G*/sin() values
than mixtures with lower PG binders with an exception of mixtures with PG 76-22 at 10Hz.
However, those differences were not statistically significant.
Mixtures with 19 mm NMAS and without RAP content showed a tendency of having lower
G*/sin() values. Again, those differences were not statistically significant.
5081
18066
24761
1767718889
24629
19223
22547
31092
16680
68219505
72767769 8824
8136 7970
7102
12959
46135822
51505320 5315
55874903
7948
0
5000
10000
15000
20000
25000
30000
35000
40000
45000
50000
PG 64-22 PG 70-22 PG 76-22 NM AS=19 NM AS=25 No-Rap Rap Fine Coarse
Superpave Mixture Groups
G*/
sin
(de
lta
), p
si
10 Hz 1 Hz 0.1 Hz
Figure B-11 Mean G*/sin() of mixtures at different groupings
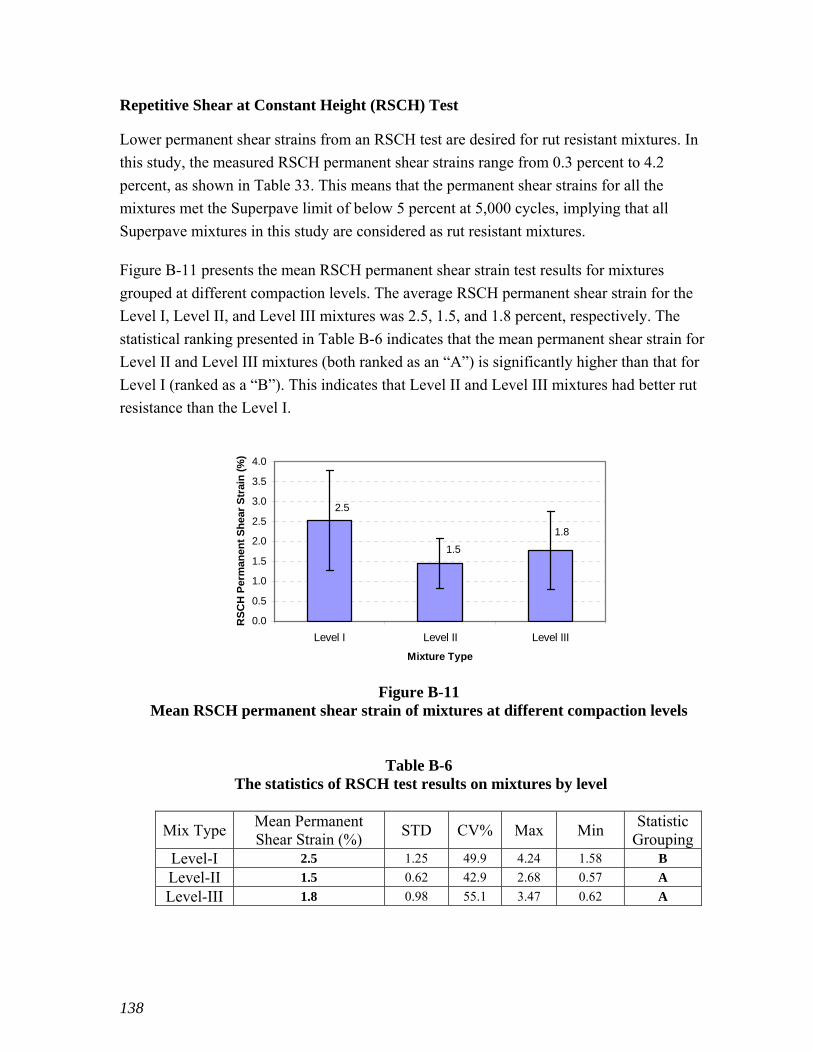
138
Repetitive Shear at Constant Height (RSCH) Test
Lower permanent shear strains from an RSCH test are desired for rut resistant mixtures. In
this study, the measured RSCH permanent shear strains range from 0.3 percent to 4.2
percent, as shown in Table 33. This means that the permanent shear strains for all the
mixtures met the Superpave limit of below 5 percent at 5,000 cycles, implying that all
Superpave mixtures in this study are considered as rut resistant mixtures.
Figure B-11 presents the mean RSCH permanent shear strain test results for mixtures
grouped at different compaction levels. The average RSCH permanent shear strain for the
Level I, Level II, and Level III mixtures was 2.5, 1.5, and 1.8 percent, respectively. The
statistical ranking presented in Table B-6 indicates that the mean permanent shear strain for
Level II and Level III mixtures (both ranked as an “A”) is significantly higher than that for
Level I (ranked as a “B”). This indicates that Level II and Level III mixtures had better rut
resistance than the Level I.
1.8
1.5
2.5
0.0
0.5
1.0
1.5
2.0
2.5
3.0
3.5
4.0
Level I Level II Level III
Mixture Type
RS
CH
Per
man
ent
Sh
ear
Str
ain
(%
)
Figure B-11
Mean RSCH permanent shear strain of mixtures at different compaction levels
Table B-6 The statistics of RSCH test results on mixtures by level
Mix Type Mean Permanent Shear Strain (%)
STD CV% Max Min Statistic
Grouping Level-I 2.5 1.25 49.9 4.24 1.58 B
Level-II 1.5 0.62 42.9 2.68 0.57 A
Level-III 1.8 0.98 55.1 3.47 0.62 A

139
1.821.49
1.97 1.87
1.47
1.831.64
2.13
1.77
0.0
0.5
1.0
1.5
2.0
2.5
3.0
3.5
4.0
4.5
PG 64-22 PG 70-22 PG 76-22 NM AS=19 NM AS=25 No-Rap Rap Fine Coarse
Superpave Mixture Groups
RS
CH
Per
man
ent
Sh
ear
Str
ain
(%)
Figure B-13
Mean RSCH permanent shear strain of mixtures at different groupings
Figure B-13 presents the mean RSCH results of those Superpave mixtures grouped at
different NMAS, binder PGs, RAP/No-Rap, and coarse-/fine-graded, respectively. The
following observations can be made from Figure B-13:
Mixtures produced with different PG binders seemed to have similar permanent shear strains.
This indicates that the RSCH test is not very sensitive to the binder PG types.
As the NMAS increases from 19 mm to 25 mm, the permanent shear strain tended to
decrease, indicating that 25mm Superpave mixtures may have better rut resistance than 19
mm ones.
Both mixtures with no RAP content and mixtures with fine-graded gradations appeared to
have higher permanent shear strain or be more rut susceptible than mixtures with some RAP
contents or coarse-graded gradations. However, those differences in RSCH permanent shear
strain values were not statistically different.
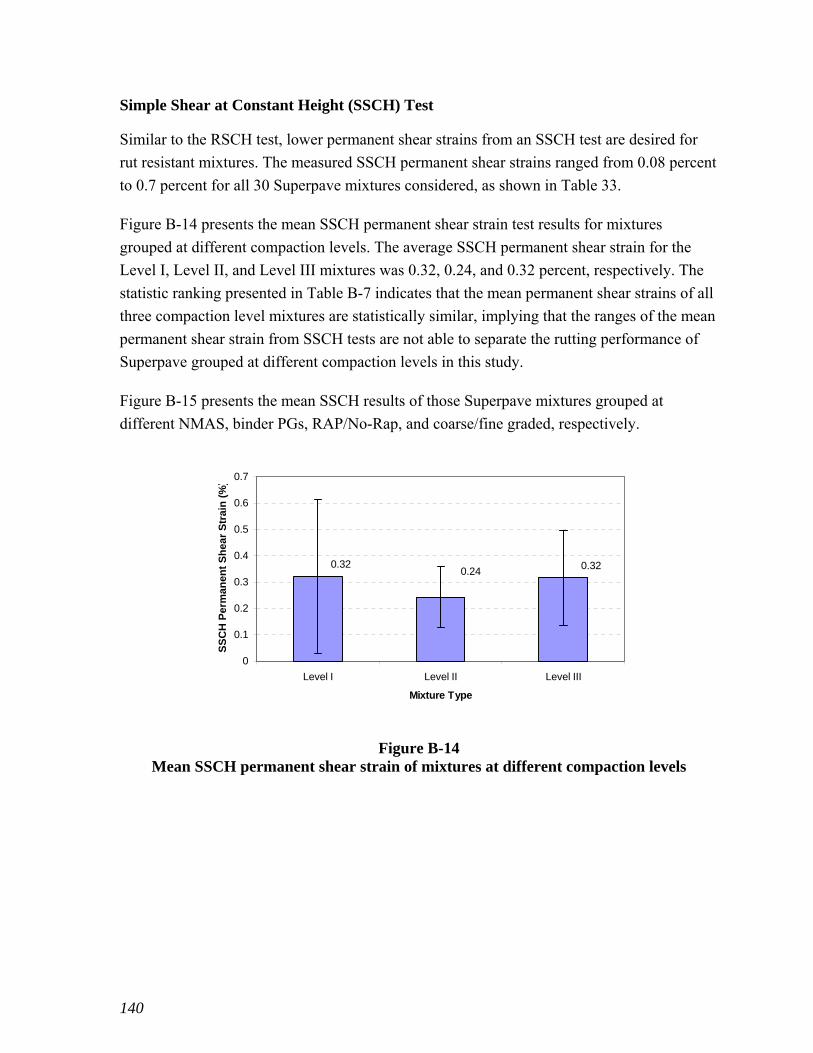
140
Simple Shear at Constant Height (SSCH) Test
Similar to the RSCH test, lower permanent shear strains from an SSCH test are desired for
rut resistant mixtures. The measured SSCH permanent shear strains ranged from 0.08 percent
to 0.7 percent for all 30 Superpave mixtures considered, as shown in Table 33.
Figure B-14 presents the mean SSCH permanent shear strain test results for mixtures
grouped at different compaction levels. The average SSCH permanent shear strain for the
Level I, Level II, and Level III mixtures was 0.32, 0.24, and 0.32 percent, respectively. The
statistic ranking presented in Table B-7 indicates that the mean permanent shear strains of all
three compaction level mixtures are statistically similar, implying that the ranges of the mean
permanent shear strain from SSCH tests are not able to separate the rutting performance of
Superpave grouped at different compaction levels in this study.
Figure B-15 presents the mean SSCH results of those Superpave mixtures grouped at
different NMAS, binder PGs, RAP/No-Rap, and coarse/fine graded, respectively.
0.320.240.32
0
0.1
0.2
0.3
0.4
0.5
0.6
0.7
Level I Level II Level III
Mixture Type
SS
CH
Per
man
ent
Sh
ear
Str
ain
(%
)
Figure B-14 Mean SSCH permanent shear strain of mixtures at different compaction levels

141
Table B-7 The statistics of SSCH test results on mixtures by level
Mix by Level
Mean SSCH Permanent
Shear Strain, (%)
STD CV% Max Min Statistic
Grouping
Level-I 0.32 0.29 91.1 0.71 0.08 A Level-II 0.24 0.11 47.1 0.39 0.09 A Level-III 0.32 0.18 56.6 0.67 0.10 A
0.32
0.20
0.270.30
0.23
0.310.35
0.22
0.30
0.0
0.1
0.2
0.3
0.4
0.5
0.6
PG 64-22 PG 70-22 PG 76-22 NM AS=19 NM AS=25 No-Rap Rap Fine Coarse
Superpave Mixture Groups
SS
CH
Per
man
ent
Sh
ear
Str
ain
(%)
Figure B-15
Mean SSCH permanent shear strain of mixtures at different groupings
The following observations can be made from Figure B-15:
Similar to RSCH permanent shear strain results, mixtures produced with different PG
binders seemed to have similar SSCH permanent shear strains. This indicates that the
SSCH test is not very sensitive to the binder PG types.
As the NMAS increased from 19 mm to 25 mm, the permanent shear strain tended to
decrease, indicating that 25mm Superpave mixtures may have better rut resistance
than 19 mm ones. This is consistent with the RSCH test results.
Mixtures with no RAP contents appeared to have higher SSCH permanent shear
strain or be more rut susceptible than mixtures with some RAP contents. Again, this
is consistent to the RSCH test results.
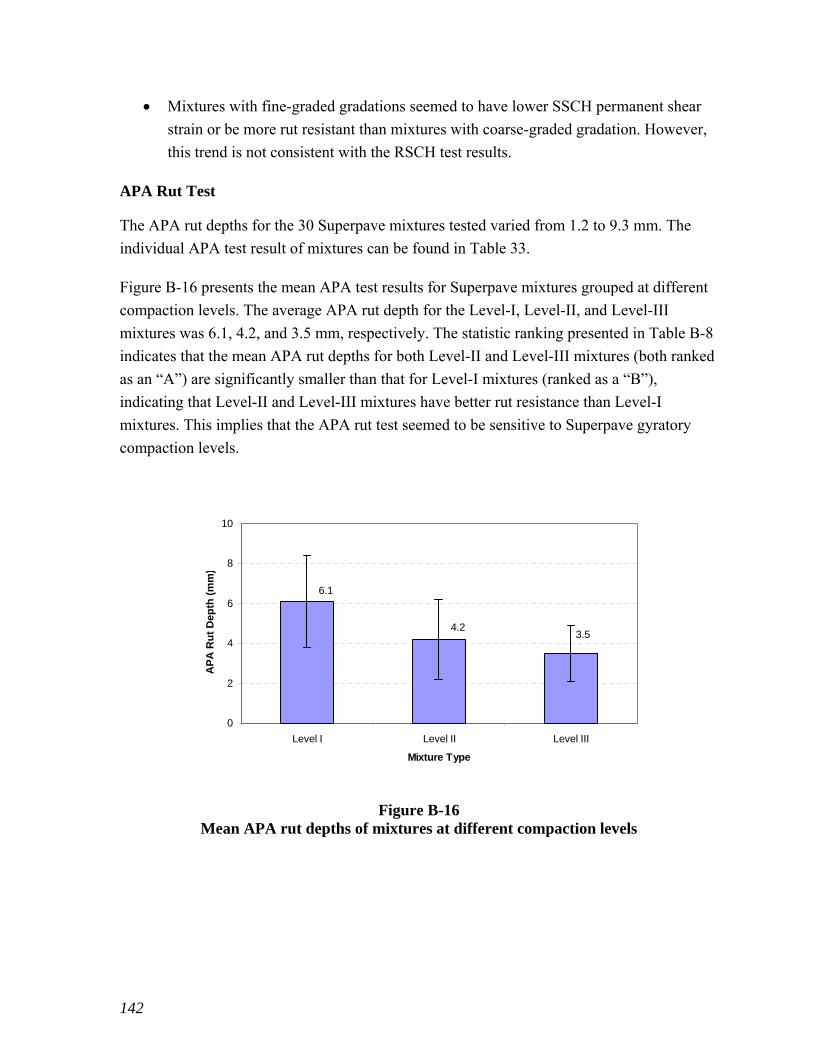
142
Mixtures with fine-graded gradations seemed to have lower SSCH permanent shear
strain or be more rut resistant than mixtures with coarse-graded gradation. However,
this trend is not consistent with the RSCH test results.
APA Rut Test
The APA rut depths for the 30 Superpave mixtures tested varied from 1.2 to 9.3 mm. The
individual APA test result of mixtures can be found in Table 33.
Figure B-16 presents the mean APA test results for Superpave mixtures grouped at different
compaction levels. The average APA rut depth for the Level-I, Level-II, and Level-III
mixtures was 6.1, 4.2, and 3.5 mm, respectively. The statistic ranking presented in Table B-8
indicates that the mean APA rut depths for both Level-II and Level-III mixtures (both ranked
as an “A”) are significantly smaller than that for Level-I mixtures (ranked as a “B”),
indicating that Level-II and Level-III mixtures have better rut resistance than Level-I
mixtures. This implies that the APA rut test seemed to be sensitive to Superpave gyratory
compaction levels.
3.54.2
6.1
0
2
4
6
8
10
Level I Level II Level III
Mixture Type
AP
A R
ut
Dep
th (
mm
)
Figure B-16 Mean APA rut depths of mixtures at different compaction levels

143
Table B-8 The statistics of APA test results on mixtures by level
Mix by Level
Mean APA rut depth, (mm)
STD (mm)
CV% Max (mm)
Min (mm)
Statistic Grouping
Level-I 6.1 2.3 37.7 9.3 4.0 B Level-II 4.2 2.0 48.8 7.8 1.2 A Level-III 3.5 1.4 40.2 7.5 2.0 A
Figure B-17 presents the mean APA test results of those Superpave mixtures grouped at
different NMAS, binder PGs, RAP/No-RAP, and coarse/fine graded, respectively.
3.4
5.8
4.6
3.83.94.2
3.2
4.75.4
0.0
1.0
2.0
3.0
4.0
5.0
6.0
7.0
8.0
9.0
10.0
PG 64-22 PG 70-22 PG 76-22 NM AS=19 NM AS=25 No-Rap Rap Fine Coarse
Superpave Mixture Groups
AP
A R
ut
De
pth
(m
m)
Figure B-17 Mean APA rut depths of mixtures at different groupings
From Figure B-17, the following observations can be made:
Mixtures produced with higher PG binders tended to have lower APA rut depths than
mixtures with lower PG binders, indicating that the APA test is very sensitive to the
mixture binder types.
144
There is no statistically significant difference in terms of APA rut depths among
mixtures with two different NMAS of 19 and 25mm.
Mixtures with RAP content tended to have more APA rut depths than those without
RAP content.
Coarse-graded mixtures seemed to be more rut resistant than fine-graded ones, as
they were found to have lower APA rut depths in this study.
In general, the APA rut test was found to be fairly sensitive in capturing the rutting
performance of Superpave mixtures considered in this study.

This public document is published at a total cost of $250
42 copies of this public document were published in this fi rst
printing at a cost of $250. The total cost of all printings of
this document including reprints is $250. This document was
published by Louisiana Transportation Research Center to
report and publish research fi ndings as required in R.S. 48:105.
This material was duplicated in accordance with standards for
printing by state agencies established pursuant to R.S. 43:31.
Printing of this material was purchased in accordance with the
provisions of Title 43 of the Louisiana Revised Statutes.