loss reduction intitiatives in punjabforumofregulators.gov.in/data/whatsnew/pserc.pdf · loss...
TRANSCRIPT

LOSS REDUCTION INTITIATIVES IN PUNJAB
Presentation by:
Punjab State Electricity Regulatory Commission1

Electricity Sector of Punjab After unbundling of PSEB in April 2010, two companies have been carved out, one for Transmission (PSTCL) and other for Distribution & Generation business (PSPCL).
• PSTCL is managing the 132 kV & above transmission assets
Grid Sub-Station
– Voltage number Capacity400 kV: 4 1630 MVA
220 kV 88 20970 MVA
132 kV 79 6144 MVA
Transmission Lines
- Voltage CKT.KMs
400 kV 1517
220 kV 6372
132 kV 3196 2

PSPCL AT A GLANCEPSPCL is looking after 33/66 kV sub-transmission and distribution network in the state. PSPCL is also operating all Generating stations
• Total consumer base of Punjab: 78.85 lac
• Total capacity(no.)of 66 kV sub-stations: 16281MVA(647)
• Total capacity(no.)of 33 kV sub-stations: 512 MVA (29)
• Total capacity of 6.68 lac DTs: 24301MVA
• Total number of 11 kV feeders: 9373
• Length of 11 kV lines (CKT. KM): 209759
• Length of LT lines (CKT. KM): 152497
• LT/HT ratio: 0.73
• Per capita consumption: 1356 3

4
Hydro
own thermal
Central Sector share
PSPCL share in IPPs
NRSE & other projects
INSTALLED CAPACITY (MW)
HydroOwn
Thermal
Central Sector Share
PSPCL share in
IPPs
NRSE & others
Total
2161 2630 3071 700 297 8859
24.39% 29.69% 34.66% 7.91% 3.35% 100%

5
domestic
Commercial
Industrial
Agriculture
others
ENERGY SOLD WITHIN THE STATE (MU) vis-a-vis REVENUE
SHARE FROM DIFFERENT CATEGORIES (PSPCL Claim)
CategoryDomesti
cCommercial Industrial Agriculture others Total
Energy 10907 2941 12348 10223 927 37346
%age sale 29% 8% 33% 27% 2% 100%
Revenue share 29% 13% 52% 0% 6% 100%

6
0.00%
10.00%
20.00%
30.00%
40.00%
50.00%
60.00%
2003-04` 2004-05 2005-06 2006-07 2007-08
%age metered sale
%age AP sale
%age AT&C losses
parameter 2003-04` 2004-05 2005-06 2006-07 2007-08
%age metered sale
53.77% 53.09% 52.26% 52.22% 51.99%
%age AP sale 19.23% 21.42% 22.36% 23.53% 22.89%
%age AT&C losses
27.00% 24.59% 25.38% 24.25% 25.12%
AT&C losses vis-a-vis Metered & AP sale (from 2003-04 to 2007-08)
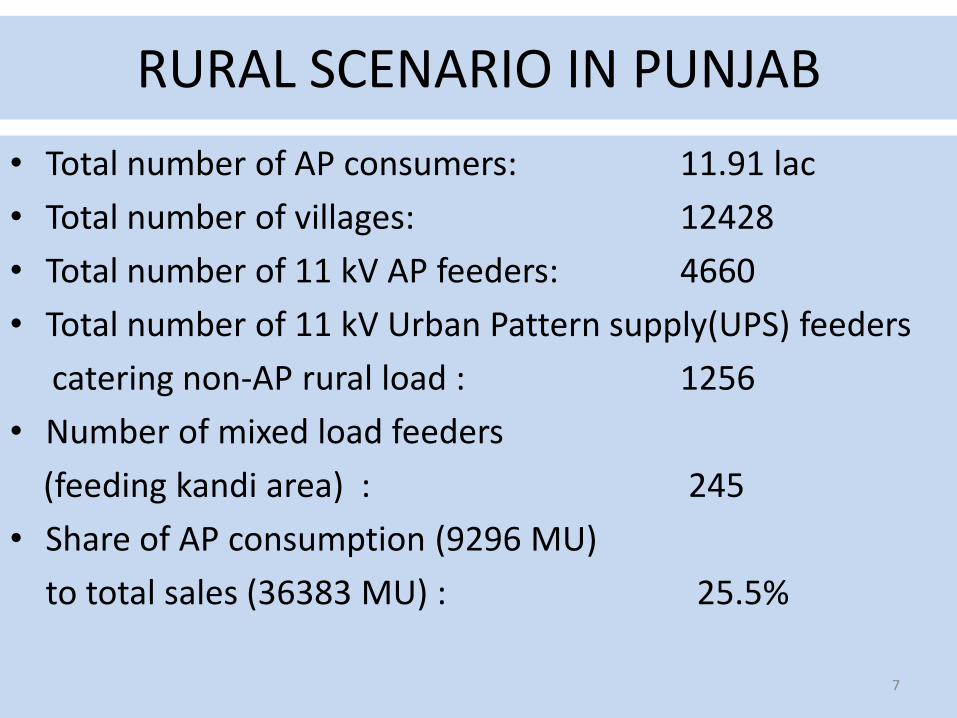
RURAL SCENARIO IN PUNJAB
• Total number of AP consumers: 11.91 lac
• Total number of villages: 12428
• Total number of 11 kV AP feeders: 4660
• Total number of 11 kV Urban Pattern supply(UPS) feeders
catering non-AP rural load : 1256
• Number of mixed load feeders
(feeding kandi area) : 245
• Share of AP consumption (9296 MU)
to total sales (36383 MU) : 25.5%
7

Punjab Experience of feeder segregation
• Work of segregating about 2000 mixed feeders was startedin 1996-97 & completed in 2003-04. 50% job of the projectlaunched to segregate 11 kV feeders was carried outdepartmentally and remaining through turnkey basis
• Simultaneously work for segregating AP load from othermixed rural loads (virtual segregation) started in 1996-97 byerecting 4th wire on mixed rural feeders
• After restricted three phase supply on mixed rural feeders,two phase supply was provided to non-AP loads in villagesthrough 4th wire
• About 900 mixed feeders were covered under this schemewhich was discontinued due to high accident rate & alsofailure to record pumped energy to AP sector 8

Punjab Experience of feeder segregation -Contd.
• All 12428 villages provided with Urban Pattern Supply (UPS)
• In addition, the work of providing single phase supply throughsingle phase transformers by extending one phase of UPS feederto about 695 deras/dhanis & over 5700 clusters of 5 houseswithin a radius of 300 Meter started in 2007-08 and completedin 2009-10
• The work of physical segregation of 900 three phase four wirefeeders by erecting separate 11 kV UPS line was started in 2008-09 and has been completed during 2013-14
• Now all rural feeders except 245 kandi (sub-mountaineous area)feeders have been segregated
• The DPRs for these kandi area feeders are also under sanctionwith REC
9

Segregation of rural feeders-Benefits
• Facilitated 24x7 quality power supply to nonagricultural rural sectors
• Improved standard of living in villages
• Gave greater flexibility in grid operations
• Enabled correct assessment of AP consumption
• Facilitated identification of high T&D loss areas
• Helped in growth of rural economy through agro basedindustry
• Helped in crop diversification by encouraginghorticulture/floriculture & AP high tech farming
10

Challenges post Feeder Segregation
• After segregation, it was observed that AT&C losses of UPS feeders were in the range of 50-70%
• With increased supply hours to UPS feeders, the AT&C losses mounted after segregation
• Although supply hours have increased but quality and reliability of supply on UPS feeders was very poor
11

Steps take to tackle high AT&C losses-before 2007
• Greater stress on checking by DS & enforcementteams
•Since 1990, the energy of large industrial consumers isbeing recorded at both consumer & feeding grid sub-stationend.
• Mobile Meter Testing Squads (MMTS) under ExecutiveEngineers made operational in early 1990
• The 33 kV system replaced by 66 kV & 132kV systemreplaced with 220 kV largely
• 11 kV bus bar losses calculated at each grid sub-station
• Replacement of electro-mechanical meters with electronicmeters 12

Converting the Challenges to Opportunities -after 2007
To reduce AT&C losses on UPS feeders, pilot projects by shifting
consumer meters to pillar boxes was started in 2007-2008
comprising:
• Shifting of meters outside consumer premises to pillarboxes
• Replacing bare LT conductor and main/sub mains in thevillages with four core XLPE cable to prevent direct hookingof lines
• Upgrading/Replacing 11 kV conductor, adding distributiontransformers, load balancing on all distribution transformers
• Robust earthing carried out across the system
• Bringing down LT/HT ratio from 1.55 in 2003-04 to 1.04 in2009-10 & further to 0.73 ending March 2014 13

Converting the Challenges to Opportunities: AP Feeders
• To cut technical losses on AP feeders, 2.21 lac APconnections were converted from LVDS to HVDS
• Under the HVDS scheme, all the new APconnections are being released w.e.f year 2008 withdedicated transformers with Zero LT
• Due to high incidents of theft of small ratingdistribution transformers, PSPCL has now adoptedless-LT system(Max LT 200 Mts) instead of zero LTsystem for old connections (about 7 lac): PSERCrecommended use of Aerial bunched Conductor.
14

PILOT PROJECT BRIEF
1) Urban Area: 11KV Hospital feeder (work completed during Jan. 2008)
Total material cost: ₹ 5 lac
Saving in Losses: 22 LU
Annual Saving @ 4/kWh : ₹88 lac
PAY BACK PERIOD: Less than month
Sr. No. Description Before Implementation (Jan 07 to Dec. 07)
After Implementation (Jan 08 to Dec. 08)
1 No. of consumers 970 970
2 Energy input(LU) 111.81 93.09
3 Billed energy(LU) 79.97 84.97
4 Losses % 28.43 % 8.72 %
5 No. of D.T. installed 21 21
6 Damage rate of T/F's 5% Nil
7 No. of Complaints substantial Minimal
8 Max. Demand in Amp. 145 130

2) Urban Basti Area: 11KV Badungar Feeder Patiala (Work completed Sept. 2008)
Total material cost: ₹ 25 lac
Saving in Losses: 2.06 LU
Annual Saving @ 4/kWh : ₹8.24 lac
PAY BACK PERIOD: 3 years
Sr. No. Description Before Implementation(Nov. 07to Dec. 07)
After Implementation (Nov. 08 to Dec. 08)
1 No. of consumers 1058 1102
2 Energy input (LU) 4.44 2.63
3 Billed energy(LU) 2.01 2.41
4 Losses % 54.72% 8.36 %
5 No. of DT installed 8 10
6 Damaged rate 25% Nil
7 No. of Complaints Substantial Minimal
8 No. of new connections applied NIL 44
9 Max. Demand in Amp. 35 20

3) Rural Area:
a) 11KV Ablowal UPS Feeder, Patiala (work completed during April 2008)
This feeder supplies electricity to 10 villages of DS/NRS category besides few Atta Chakkis.
Total material cost: ₹ 50 lac
Saving in Losses: 15.43 LU
Annual Saving @ 4/kWh : ₹ 61.72 lac
PAY BACK PERIOD: Less than one years
Sr. No. Description Before Implementation(July 07 to Feb.08)
After Implementation(July 08 to Feb.09)
1 No. of consumers 2241 2389
2 Energy input (LU) 48.31 37.26
3 Billed energy(LU) 24.16 30.53
4 Losses % 49.98 18.06
5 No. of T/F's installed 31 39
6 Damage rate transformers 15.3% Nil
7 No. of Complaints substantial Minimal
8 No. of new connections applied NIL 148
9 Max. Demand in Amp. 110 80

b) 11KV Dakala UPS feeder, Patiala(Work completed during October, 2008)
This feeder supplies electricity to single village of Dakala comprising around 850 DS/NRS consumers.
Total material cost: ₹ 18 lac
Saving in Losses: 5.85 LU
Annual Saving @ 4/kWh : ₹ 23.4 lac
PAY BACK PERIOD: Less than one years
Sr. No. Description Before Implementation (Nov. 07 to Dec. 07)
After Implementation (Nov. 08 to Dec. 08)
1 No. of consumers 812 857
2 Energy input(LU) 10.41 4.41
3 Billed energy(LU) 2.48 3.53
4 Losses % 76.17 19.95
5 No. of DT installed 12 12
6 Damaged rate 40% Nil
7 Complaints substantial Minimal
8 No. of new connections applied NIL 45
9 Max. Demand in Amp. 85 40

Name of Feeder Before (in %) After (LT is minimised) (in %)
11 KV Hospital Feeder
28.43 8.72
11 KV BadungarFeeder
54.72 8.36
11 KV Ablowal UPS Feeder
49.98 18.06
11 KV Dakala UPS Feeder
76.17 19.95
PILOT STUDIES:REDUCTION OF LOSSES DUE TO SHIFTING OF METERS (2007-08)
19
20

21

22

23

Impact
Sr.no. Circle Division Name of
11 KV feeder
Benefits (%)
Reduction in Load/Max. demand (A)
Reduction in pumped in energy
Increase in Revenue Collection
Reduction in losses
Reduction in DT’s damage rate
Reduction in no supply consumer complaint
1 FerozepurCityFerozepur
Mana Singh Wala
(-) 2.17 (-) 0.87 (+) 56.31 (-) 54.48 (-) 66.00 (-) 80
2 FerozepurCityFerozepur
Sodhe Wala (-) 8.82 (-) 26.02 (+) 12.13 (-) 48.81 (-) 75.00 (-) 79
3Ferozepur Jalalabad
Mohar Singh Wala UPS
(-) 21.53 (-) 16.36 (+) 15.96 (-) 52.00 (-) 75.00 (-) 72
4 Ferozepur JalalabadSunderpura UPS
(-) 10.34 (-) 15.55 (+) 9.40 (-) 48.60 (-) 66.00 (-) 78
5 Ferozepur Zira UPS-2 (-) 16.67 (-) 6.06 (+) 56.60 (-) 60.00 (-) 66.67 (-) 59
6Ferozepur Zira
UPS Meshari + Lalle
(-) 27.27 (-) 12.04 (+) 44.01 (-) 54.00 (-) 75.00 (-) 61
7 Ferozepur ZiraUPS Dhanna Sahib
(-) 25.00 (-) 8.57(+) 116.75
(-) 34.15 (-) 66.67 (-) 69
8 FerozepurS/UFerozepur
UPS Madhre
(-) 14.70 (-) 34.95 (+) 21.04 (-) 163.93 (-) 50.00 (-) 237
9 Gurdaspur S/U BatalaQilla Lal Singh
(-) 9.33 (-) 19.73 (+) 12.64 (-) 10.00 (-) 100.00 (-) 95
10 Gurdaspur Gurdaspur Babehali (-) 37.5 (-) 35.60 (+) 61.87 (-) 45.83 (-) 66.66 (-) 8224
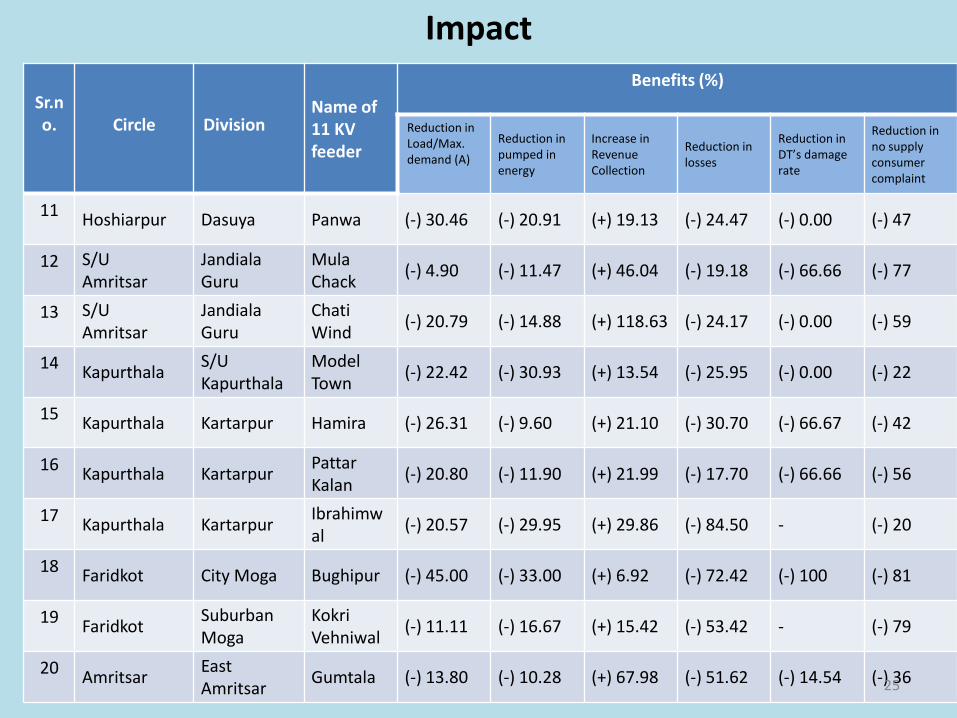
Impact
Sr.no. Circle Division
Name of 11 KV feeder
Benefits (%)
Reduction in Load/Max. demand (A)
Reduction in pumped in energy
Increase in Revenue Collection
Reduction in losses
Reduction in DT’s damage rate
Reduction in no supply consumer complaint
11Hoshiarpur Dasuya Panwa (-) 30.46 (-) 20.91 (+) 19.13 (-) 24.47 (-) 0.00 (-) 47
12 S/UAmritsar
Jandiala Guru
Mula Chack
(-) 4.90 (-) 11.47 (+) 46.04 (-) 19.18 (-) 66.66 (-) 77
13 S/UAmritsar
Jandiala Guru
Chati Wind
(-) 20.79 (-) 14.88 (+) 118.63 (-) 24.17 (-) 0.00 (-) 59
14Kapurthala
S/U Kapurthala
Model Town
(-) 22.42 (-) 30.93 (+) 13.54 (-) 25.95 (-) 0.00 (-) 22
15Kapurthala Kartarpur Hamira (-) 26.31 (-) 9.60 (+) 21.10 (-) 30.70 (-) 66.67 (-) 42
16Kapurthala Kartarpur
Pattar Kalan
(-) 20.80 (-) 11.90 (+) 21.99 (-) 17.70 (-) 66.66 (-) 56
17Kapurthala Kartarpur
Ibrahimwal
(-) 20.57 (-) 29.95 (+) 29.86 (-) 84.50 - (-) 20
18Faridkot City Moga Bughipur (-) 45.00 (-) 33.00 (+) 6.92 (-) 72.42 (-) 100 (-) 81
19Faridkot
Suburban Moga
Kokri Vehniwal
(-) 11.11 (-) 16.67 (+) 15.42 (-) 53.42 - (-) 79
20Amritsar
East Amritsar
Gumtala (-) 13.80 (-) 10.28 (+) 67.98 (-) 51.62 (-) 14.54 (-) 3625

Year AT&C loss
2010-11 21.90%
2011-12 15.77%
2012-13 12.31%
2013-14 8%
Urban ResurgencePATIALA CITY
26

Improvement in tail end voltage
27

Assessment of AP Consumption-before segregation (on basis of sample meters)
• Till 2000-01, AP consumption was assessed on the basis ofAP factor worked out through recording of consumption ofjust 3220 sample meters which was 0.38% of the total APconnections
• The sample size was increased to about 1 lac meters whichwas about 10% of AP connections by 2011-12 but thereading data was not reliable
• Field staff was not taking actual readings of these meters &many meters were reported defective. Also there wasresistance from farmers
• The AP factor was manipulated to show less T&D losses28

Assessment of AP Consumption-after segregation (on Pumped Energy basis w.e.f 2010-11)
• All 11 kV feeders (including AP) are now meteredin PSPCL
• The pumped energy data of all AP feedersrecorded at grid sub-stations are being collectedmonthly at PSPCL headquarters through webbased application. Same data is then transmittedto the Commission every month and agriculturalconsumption is worked out.
• The pumped energy data is also cross verifiedfrom AMR data of about 2200 feeders availableon real time basis
29

AMR OF AP FEEDERS The project to cover AP feeders under AMRwas started in 2008-09. About 3500 AP feedersare covered under AMR project
AMR compatible meters have been installedon all AP feeders but due to some problemswith communication hardware, data for about2200 AP feeders are available
All AP feeders shall be covered under AMRproject
30

ASSESSMENT OF AP CONSUMPTION AS PER PUMPED ENERGY
YEAR AP CONSUMPTION CLAIMED BY PSPCL ON BASIS OF SAMPLE METERS (MU)
AP CONSUMPTION WORKED OUT ON THE BASIS OF PUMPED ENERGY (MU)
% AGE REDUCTION IN ESTIMATION OF AP CONSUMPTION
2010-11 10152 9656 -5.14
2011-12 10256 9455 -8.47
2012-13 10687 9877 -8.20
2013-14 11034 9726 -13.45
31

32
10.00%
20.00%
30.00%
40.00%
50.00%
60.00%
70.00%
2007-08 2008-09 2009-10 2010-11 2011-12 2012-13 2013-14
%age metered sale
%age AP sale
%age AT&C losses
parameter 2007-08 2008-09 2009-10 2010-11 2011-12 2012-13 2013-14
%age metered sale
51.99% 55.16% 53.90% 56.65% 58.07% 58.46% 60.42%
%age AP sale 22.89% 22.63% 24.34% 24.22% 22.83% 22.68% 20.73%
%age AT&C losses
25.12% 22.21% 21.76% 19.13% 19.10% 18.86% 18.85%
AT&C losses vis-a-vis Metered & AP sale-after 2007-08
AT&C losses include 2.5% transmission losses of 132/220 kV levels also
AT&C loss target for 2014-15 ---16.00%

33
parameter 2003-04` 2004-05 2005-06 2006-07 2007-08 2008-09 2009-10 2010-11 2011-12 2012-13 2013-14
input energy 29878 30209 32720 34993 38883 37095 39760 39875 41407 43555 44834
metered sale 16065 16038 17099 18272 20214 20461 21430 22590 24044 25462 27087
%age metered sale
53.77% 53.09% 52.26% 52.22% 51.99% 55.16% 53.90% 56.65% 58.07% 58.46% 60.42%
AP sale 5745 6472 7317 8235 8902 8395 9678 9656 9455 9877 9296
%age AP sale 19.23% 21.42% 22.36% 23.53% 22.89% 22.63% 24.34% 24.22% 22.83% 22.68% 20.73%
%age AT&C losses
27.00% 24.59% 25.38% 24.25% 25.12% 22.21% 21.76% 19.13% 19.10% 18.86% 18.85%
AP load (MW)
3481 4309 4474 5094 5606 6096 7378 7728 7925 8116 8389
AP factor (kWh/kW/
year)1650.39 1501.97 1635.45 1616.61 1587.94 1377.13 1311.74 1249.48 1193.06 1216.98 1108.12
DETAILED PARAMETERS REGADING ENERGY SALES

Status of implementation of project-(Non-RAPDRP Areas)
• There are around 38 lac meters in rural and sub-urbanareas
• Under Phase-I of the scheme, 20.57 lac meters havebeen shifted out at a cost of around ₹700 Cr on turnkeybasis
• The Phase-II of the scheme at a cost of around ₹1000Cr is under implementation and 0.44 lac meters havebeen shifted out till date
• A total of 21.01 lac out of 38 lac meters in Non-RAPDRP(Rural) areas have been shifted in pillar boxes
• Balance 17.14 lac meters are expected to be shifted by31.3.2015
34

Present Status in Urban (R-APDRP areas)
• There are around 30 lac connections in urban areas
• Under the Part-B of R-APDRP scheme covering 46 towns, 13.50 lac meters are to be shifted & till date around 4 lac meters have been shifted out
• Balance 16.5 lac meters shall be shifted through PSPCL resources
35

Consumer benefits achieved in Rural & City Areas by shifting of meters
1) Reliability of supply for rural consumers at parwith urban consumers
2) Reduced outages and number of complaints
3) Timely restoration of supply
4) Voltage Improvement at tail-end
5) Damage rate of Transformers drasticallyreduced in rural areas
36

Payback PeriodRural Area
• Target investment in low cost maintenance project under non RAPDRP scheme- ₹1700 cr.
• Number of consumers to be covered-38 lac
• Investment per consumer < ₹4500
• Average loss on UPS feeders reduced from 50-70% to 18-20%.
• Payback period- 3 to 4 year (Calculated feeder wise at launch of pilot scheme).
37

Payback Period
City Area(Patiala)
• Investment in low cost maintenance project under RAPDRP scheme- ₹ 38 cr.
• Number of consumers covered-1.3 lac
• Investment per consumer < ₹ 3000
• Average loss of Patiala city reduced from 21.9 to 8%.
• Payback period- 2 years.
38

Pillar Box –
The Game Changer
39