loss reduction and cdm at gubbi substation energy economy & environmental consultants bangalore...
TRANSCRIPT
Loss Reduction and CDM at Gubbi Substation
Energy Economy & Environmental Consultants
BangaloreINDIA

Power Scenario -India
Agriculture30%
Industrial34%
Commercial 6%
Domestic18%
Others12%
Total Energy Generated - 500 BU
Losses - 150 BU

The Need for the Project
High Technical losses (25 - 30%) especially in
Distribution systems
Annual generation in India 500 BU and Losses
estimated 125 Billion Units amounting to Rs. 375
Billion annually
International standard for technical losses - 8 to
10%

Power Scenario - Karnatakadomestic
14.0%
commercial2.8%
public lighting1.5%
largeIndustry13.4%
public waterworks1.4%
state tubewells25.7%
railways0.5%
bulk supply0.1%
InterstateSales0.0%
Losses35.8%
Industry4.7%
Total Power purchase - 29050 MU
Avg. cost of supply - Rs. 3.52/kWh

Agricultural sector - Karnataka
Number of Pumpsets - 11 Lakhs Energy Consumption - 35 % Revenue Realized - 4% T & D Loss - 25 to 30% Energy Theft - 20 to 25% Average Pumpset efficiency - 20 to 25%

Gubbi
Gubbi Substation 110/11 kV
Capacity - 30 MVA Feeder - 13 Nos Consumption - 90 MU Pumpsets - 8400 Nos Crops grown -
Arecanut, Palm, Vegetables, cash crops
Metered energy - 4%

Farmer’s problems
Poor Voltage Conditions
Low power factor
Low reliability
Frequent motor burn outs Restricted availability of power immaterial of field
requirements

Utility’s perspective
Unplanned Development
High T & D Losses
Improper Load Distribution
Overloading of Feeders & DTCs
Poor Voltage Conditions
Power Pilferage
Low Revenue Generation

The solution
Implement loss reduction measures
High voltage distribution system
Efficient small capacity transformers
Load management system
Energy efficient pumpsets

Action Implement loss reduction measures through
commercial projects Advantages
Improved power quality (Voltage, PF)
Low losses
High reliability
Prolonged equipment life
Benefits Financial Indicators
IRR of 35% on equity
IRR of 18 - 20% on project costs
Reduced GHG emissions due reduction in overall demand - Carbon trading
Huge potential for replication

Statistics for G.Hosahalli feeder
I Total Number DTC 58
25-kVA 7
63-kVA 21
100-kVA 27
250-kVA 3
II Number of DTC Catering to
IP-Sets 16
Domestic + IP-Sets 40
Village water supply 2
III Consumer List
Total Number of IP-Sets 709
Lighting Connections 1166
Commercial Connections 6
BJ Connections 140
Consumption per Annum - 7.6 MU

HT network - Present
INDEX
250 kVA
63 kVA
25 kVA
100 kVA
070
250 kVA : 3 Nos
NETWORK DETAILS
Total DTC : 58 Nos25 kVA : 8 Nos63 kVA : 21 Nos100 kVA : 26 Nos
065
064
063
062
038
071
072 073
074
075
097
098
086
091
088
087
089
092
051
095
094
099
081
079
077
080
082
060
101
058 059
056
083
039
054
047
040
036
035
46A
042
044
045 046
050
048
110
030
028
029
DPS
103 105
180
106
109
SUB-STATION4-PS
DPS DPS
115
033
031
032
121
141
142
144
145
146
119
107 DPS
117
123
DPS124
DPS108
130
128
126
134
129
136
137
166
164
149
176
155
151
150
154
178
156
159
158
113
163
162
160 168
171
169
170
173
DPS175
156.1 kW
96.1 kW
130.6 kW
136 kW
25 kW22 kW
41 kW
20 kW
Demand : 4680 kWLine Losses : 680 kW
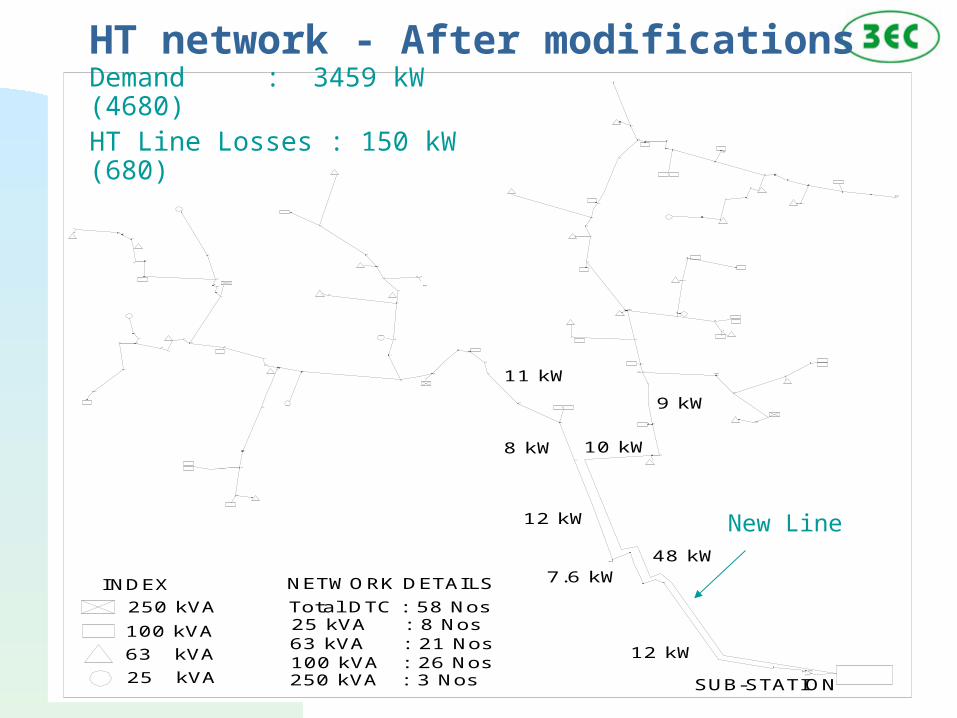
HT network - After modifications
110
Total DTC : 58 Nos
NETWORK DETAILS
25 kVA : 8 Nos
250 kVA : 3 Nos100 kVA : 26 Nos63 kVA : 21 Nos
INDEX
250 kVA
25 kVA
63 kVA
100 kVA
065
070
064
063
062
038
SUB-STATION4-PS
DPSDPS
12 kW
12 kW
DPS
7.6 kW
028
030
029
105 103
180
106
115
109
071
097
098
073 072
074
075
095
094
101
059 058
060
056
099
039
040
080
079
077
082
081
042
054
044
047
045
086
091
092
083
088
089
087
050
048
051
124
036
033
031
032
035
121
46A
046
117
DPS107
108
DPS
119
130
113
128
123
DPS
126
129
134
141
142
144
145
146
136
137
164
166
163
171
162
160 168
170
169
175
DPS
173
149
178
159
156 155
158
151
150 154
176
48 kW
8 kW 10 kW
11 kW
9 kW
New Line
Demand : 3459 kW (4680)HT Line Losses : 150 kW (680)

P
P
Cons. No.- 36045 HP
S/M
P
P S/MCons. No.- 60575 HP
P
Cons. No.- 6055 HP
P
Cons. No.- 52897.5 HP
Cons. No.- 54205 HP
P
S/M S/M
Incoming 11 kV Line
100 kVA
Cons. No.- 595Pumpset removed
GL GL
P
Cons. No.- 27856 HP
GL
P
P
P
Cons. No.- 517Room locked
P
Cons. No.- 59155 HP
P
P
PCons. No.- 31975 HP
P
Cons. No.- 12975 HP
P
GL
GLP
0.0
0.0
0.1
0.50.00.1
0.0
0.3 0.5
9.9
3.20.1
0.00.0
0.1
0.1
4.9
0.1
2.1
1.6
0.00.1
4.7
0.6
0.6
0.0
0.40.6
0.2
0.10.0
0.60.0
0.0
0.5
0.4
0.5
0.1
0.1
0.00.0
0.10.1
0.1
Existing Rural LT
Transformer Rating
: 100 kVA
Total Consumers : 18 nos
Analysis Results
Demand
: 102 kW
Agricultural : 64 kW
Domestic
: 8 kW
Technical losses : 30 kW
PCons. No.- 60575 HP
S/M
P
Cons. No.- 36045 HP
PP
P S/M
Cons. No.- 6055 HP
P
P Cons. No.- 54205 HP
Cons. No.- 595Pumpset removed
S/MS/M 100 kVA
Incoming 11 kV Line
GL GL
Cons. No.- 27856 HP
P
GL
P
P
Cons. No.- 517Room locked
P
0.1
Cons. No.- 59155 HP
Cons. No.- 52897.5 HP
P
P
P
Cons. No.- 12975 HP
Cons. No.- 31975 HP
P
P
P
GL
P GL
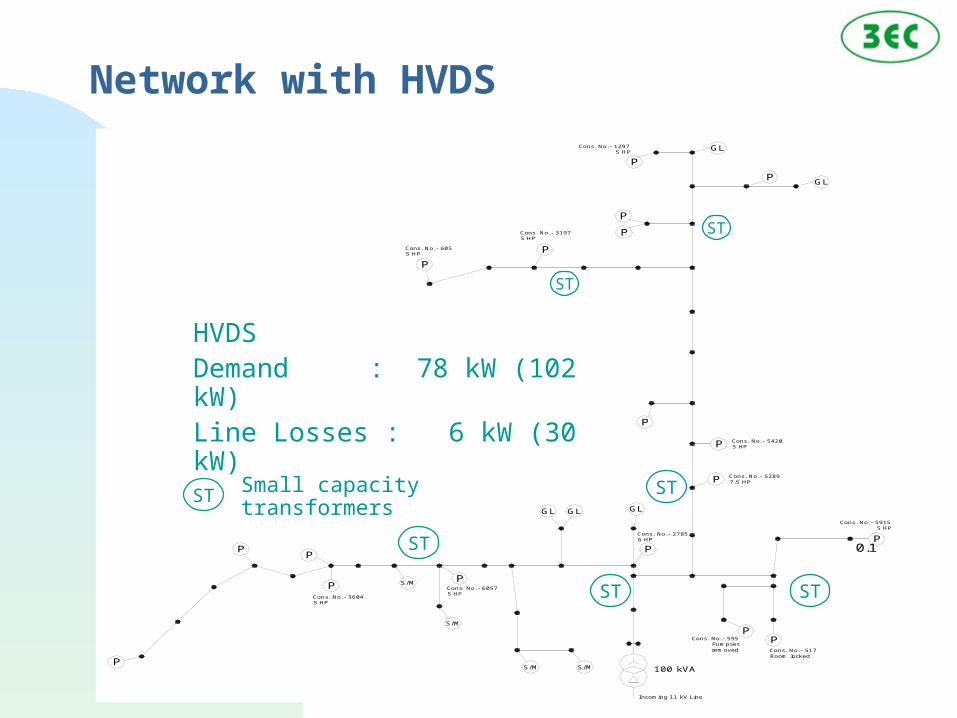
Network with HVDS
ST
ST
ST
HVDSDemand : 78 kW (102 kW)Line Losses : 6 kW (30 kW)
ST
STST Small capacity transformers
ST

PCons. No.- 60575 HP
S/M
P
Cons. No.- 36045 HP
PP
P S/M
Cons. No.- 6055 HP
P
P Cons. No.- 54205 HP
Cons. No.- 595Pumpset removed
S/MS/M 100 kVA
Incoming 11 kV Line
GL GL
Cons. No.- 27856 HP
P
GL
P
P
Cons. No.- 517Room locked
P
0.1
Cons. No.- 59155 HP
Cons. No.- 52897.5 HP
P
P
P
Cons. No.- 12975 HP
Cons. No.- 31975 HP
P
P
P
GL
P GL
DSM - HVDS & EE pumpsets
ST
ST
ST
HVDS & EE pumpsetsDemand : 59 kW (102 kW)Line Losses : 4 kW (30 kW)
ST
STST Small capacity transformers
ST
EE pumpsets

Metering Arrangement
25 kVA
Flour Mill
10 kVA
9.7 kw
5
5.5 kw4
2L
25 kVA
3L3L2L
1
Off
2L 16 kVA
HT/LT
2L
2L2L
2L
2L
Off
3
KEY for Meters
Supply always ON - Domestic (Single phase)Supply always ON - LT industrial/commercial
Controlled Supply ON/OFF - Agriculture
Domestic Consumers
Domestic Consumers
Commercial Consumers
Agricultural Consumers

Metering System
Installing a system of grouped metering and a switch which can be remotely operated through Power Line Carrier Communication equipment. The necessary signals will be injected through an injecting transformer installed on the 11 kV busbar at the substation.
The loads will be grouped into 3 - 4 divisions to enable selective switching. The lines will be energised for 24 hours and the pump loads provided power for limited period of 8 hours (or as per requirements from time to time)
Single phase transformers for lighting and commercial loads will be installed for a cluster of domestic services and power supply made available for 24 hours a day
The installed system of meters also records consumption of a group of pumpsets. This will enable monitoring change of status of capacities, additional unauthorised load additions etc.

Total Benefits - Power
kW % kW %
1 Load Delivered 4682 148.9 3459 110.2
2 HT losses 640 20.4
3 Transformation Losses 138 4.4
4 LT Line Losses 760 24.2
5 Load Consumed 3144 100.0 3140 100.0
DescriptionSl. No.
319 10.2
ModifiedExisting
Comparison of Losses
0
200
400
600
800
1000
1200
1400
1600
1800
2000
1000 1500 2000 2500 3000 3500
Useful load (kW)
kW Loss
Existing Loss
Modified Loss
kW Savings

Financial Analysis - Gubbi Substation
Indicators Network upgradation withpumpset replacement (25%)
Investment (Rs. Crores) 39.32Energy Savings (MU/annum) 28.00Savings (Rs. Crores/annum) 8.40Simple Payback (Years) 4.70IRR % 20.00DSCR - 1.69

Benefits - CDM - Gubbi substationPresent Energy Consumption 90 MUsavings from line loss reduction 20 Musavings from effciency improvement of pumps 20 MuTotal 40 Mu
Emision reduction from line loss savingsCO2 27524 t/annumCO2 equivalent of Nox 39928 t/annumSub-total 67452 t/annumEmision reduction from the use of energy efficient pumpsCO2 27524 t/annumCO2 equivalent of Nox 39928 t/annumSub-total 39928 t/annumTotal 0.11 Mt/annumCost of CO2 (At $5 per Ton) 0.54 $ Million per annum)
Project completion - 2004 (Up to and including 2012)Assuming that there are no reforms in the generation side and that the energy consumption is constant as at 2001Emission reduction up to 2012 0.86 Million tons of CO2 equvialentUp to a period of 10 years 1.07 Million tons of CO2 equvialentUp to a period of 7 years 0.75 Million tons of CO2 equvialentUp to a period of 14 years 1.50 Million tons of CO2 equvialent

Benefits - CDM (Extrapolated - India)Present Energy Consumption - Agricultural (30%) 150000 MUsavings from line loss reduction 33000 Musavings from effciency improvement of pumps 33000 MuTotal 66000 Mu
Emision reduction from line loss savingsCO2 45414600 t/annumCO2 equivalent of Nox 65881200 t/annumSub-total 111295800 t/annumEmision reduction from the use of energy efficient pumpsCO2 45414600 t/annumCO2 equivalent of Nox 65881200 t/annumSub-total 65881200 t/annumTotal 177.18 Mt/annumCost of CO2 (At $5 per Ton) 885.89 $ Million per annum)
Project completion - 2004 (Up to and including 2012)Assuming that there are no reforms in the generation side and that the energy consumption is constant as at 2001Emission reduction up to 2012 1417.42 Million tons of CO2 equvialentUp to a period of 10 years 1771.77 Million tons of CO2 equvialentUp to a period of 7 years 1240.24 Million tons of CO2 equvialentUp to a period of 14 years 2480.48 Million tons of CO2 equvialent

Thank You