los angeles southwest college mission statement change executive summary may 25, 2016 ·...
TRANSCRIPT

Los Angeles Southwest College Mission Statement Change
Executive Summary May 25, 2016
Rationale for Change Los Angeles Southwest College (LASC) last revised its Mission Statement in 2014; work on the revision was initiated late in 2013. The Los Angeles Community College District Board of Trustees approved the College’s Strategic Plan and Mission Statement on January 28, 2015. During that time the Accrediting Commission for Community and Junior College revised and adopted new Accreditation Standards. Standard I.A.1, now requires that “[t]he mission describes the institution’s broad educational purposes, its intended student population, the type of degrees and other credentials it offers, and its commitment to student learning and student achievement.” The current mission statement does not address the requirement of describing “types of degree and other credentials” the college offers. To be in compliance with Standard I.A.1 and Eligibility Requirement 6 the college must update its Mission Statement. Current Mission Statement In honor of its founding history, Los Angeles Southwest College empowers a diverse student population to achieve their academic and career goals, and to become critical thinkers and socially responsive leaders. Proposed New Mission Statement In honor of its founding history, Los Angeles Southwest College provides a student-centered learning environment committed to empowering students and the community to achieve their academic and career goals through the attainment of certificates and associate degrees leading to transfer and workforce preparation.
Mission Statement Review Process The Strategic Planning Committee (SPC) initiated review of the current Mission Statement by convening the Mission Review Taskforce (MRT) in April 2016. The MRT met on April 29, 2016 to review and revise the college’s Mission Statement. The MRT drafted a Mission Statement that addressed the need to describe the “types of degree and other credentials” offered at LASC. On May 5, 2016, SPC reviewed and unanimously approved the revised Mission Statement. On May 6, 2016, the Educational Planning Committee reviewed and provided input for the Mission Statement. On May 9, 2016, College Council and subsequently, Academic Senate, on May 10, 2016, reviewed and unanimously approved the revised Mission Statement. Collectively, the input received was representative of faculty, classified staff, administrative staff, and students. On May 11, 2016, a recommendation was sent to the President to adopt the new Mission Statement. The new Mission Statement addresses Accreditation Standard I.A.1 and Eligibility Requirement 6.

Los Angeles Southwest College Revision of the Mission Statement
Presentation to the Los Angeles Community College Board of Trustees Institutional Effectiveness & Student Success Committee Dr. Linda Rose, President Alfred Gallegos, Dean of Institutional Advancement
May 25, 2016

Rationale for Change
The current Mission Statement does not meet Accreditation Standard I.A.1 and Eligibility Requirement 6, after adoption of new accreditation standards.
The new Mission Statement describes LASC’s: broad educational purpose intended student population types of degrees and other credentials it offers commitment to student learning and student achievement

LASC Mission Statement
Current In honor of its founding history, Los Angeles Southwest College empowers a diverse student population to achieve their academic and career goals, and to become critical thinkers and socially responsive leaders. Proposed In honor of its founding history, Los Angeles Southwest College provides a student-centered learning environment committed to empowering students and the community to achieve their academic and career goals through the attainment of certificates and associate degrees leading to transfer and workforce preparation.

Mission Statement Review Process
Strategic Planning Committee Initiated review of Mission Statement and convened
Mission Review Taskforce (MRT), 4/13/16 MRT drafted new Mission Statement, 4/29/16 Reviewed and approved unanimously, 5/5/16 Sent recommendation for adoption to President, 5/11/16
Educational Planning Committee Reviewed and provided feedback, 5/6/16
College Council Reviewed and approved unanimously, 5/9/16
Academic Senate Reviewed and approved unanimously, 5/10/16

Institutional Effectiveness Report to the Board of Trustees May 25, 2016
Executive Summary
Los Angeles Mission College (LAMC) serves over 10,000 students each semester, 76% of whom are studying part-time. Serving Northeast San Fernando Valley, LAMC has a diverse campus that is 78% Hispanic, 11% White, 5% Asian, 3% African-American, and 3% other/unknown. Established in 1975, it is the youngest of the nine LACCD colleges. The College’s 2013-2018 LAMC Strategic Master Plan (SMP) is in full alignment with the 2012-2017 District Strategic Plan (DSP) and contains performance measures with targets/benchmarks for each goal, which constitute the ‘Expected Improvements’ noted in the College’s report.
Access and Preparation for Success For the most part, LAMC is on par with DSP Goal 1 performance measures. The College aims to increase its effectiveness in student access and preparation for success by hiring a Career Guidance Counselor Assistant to conduct financial aid inreach and by continuing to offer Saturday assessments and financial aid workshops during SSSP orientations and out in the community. In addition, four new counselors have been hired (EOP&S, STEM, Career, and Veterans/International Students), and there are plans to hire four more. The College has greatly expanded its concurrent enrollment in fall 2015 to 837 students, up from 362 students in fall 2013. As other pathways to access and success, the College is launching a new summer bridge/first year experience program (METAS – Mission’s Excellence Towards Advancement of Students) beginning in summer 2016 and is also growing its Adult Education offerings and support services. Teaching and Learning for Success LAMC excels in the area of student self-efficacy/self-directed learning but needs to improve in other aspects of providing a learner-centered environment. To this end, professional development opportunities in the areas of student learning outcomes assessment and improvement, development of innovative curriculum, and use of technology and alternate modes of delivery/pedagogy for teaching and learning are offered through a variety of venues, such as at Flex Day and in the Eagle’s Nest (the faculty resource center). To increase student engagement, students now have access to online tutoring (NetTutor), library research guides (‘Libguides’), and student ambassadors/mentors. A women’s cross country team has been added for fall 2016 and a women’s soccer team for spring 2017. A major challenge for student engagement and student completion is the large proportion of part-time students. In order to accelerate students’ progress in attainment of units and ultimately their educational goals, the College’s new Integrated Planning Committee will be overseeing the integration of all of the College’s student success initiatives and master planning documents to streamline efforts and maximize College resources. Another challenge is the large number of students who are underprepared in English and Math - 78% of LAMC students place into courses below English 101 and 74% place below Math 125. The College’s Achieving the Dream (AtD) initiatives focused on facilitating English and Math completion will ultimately also improve degree and transfer rates. Additional strategies being used to increase completion are: online preparation materials for English and Math placement exams, online orientation, and a pre-assessment preparation video on the consequences of not preparing for the placement exam; increased concurrent enrollment to start students in the pipeline sooner; promotion of Pell Grants; and greatly expanded counseling availability due to the hiring of new counselors. LAMC has seen particularly large increases in the number of students transferring – the number of transfers to the UCs and CSUs increased to 407 in 2014-15, up from 332 in 2013-14 and 213 in 2012-13. LAMC’s 13 Associate Degrees for Transfer (ADTs) will also further increase degree and transfer rates. Institutional Efficiency LAMC has the highest average class size in the District and is on par with the other smaller LACCD colleges in annual cost per FTES. The lack of a central plant results in very high maintenance and facilities costs. The College anticipates breaking ground on its approved central plant within 90 days, with completion expected within a year.
2015 College Planning and Effectiveness Report
May 25, 2016
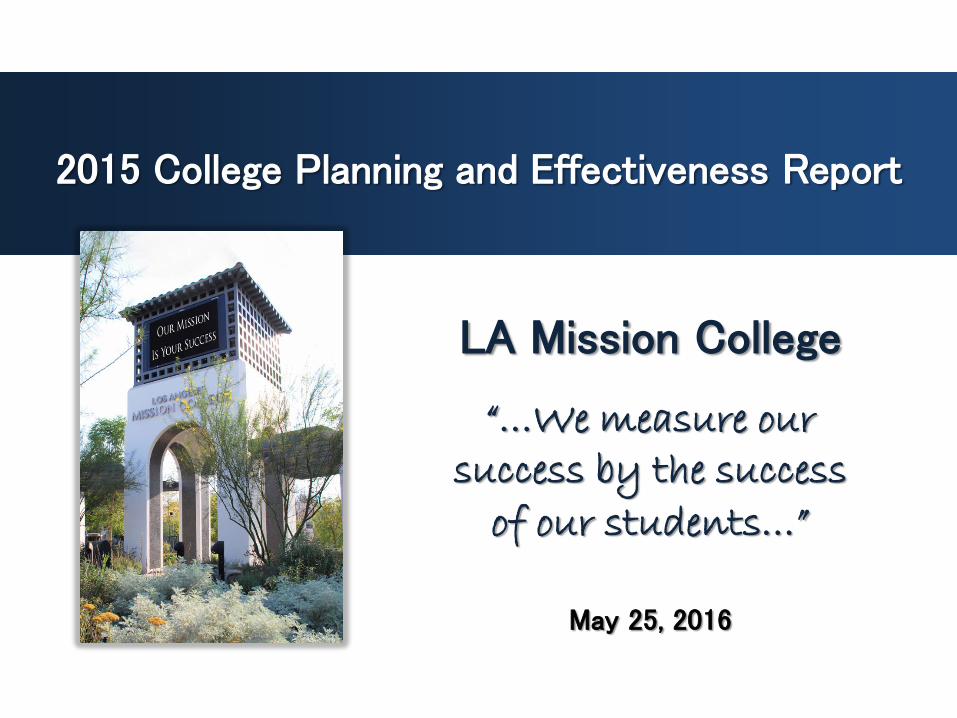
LA Mission College
“…We measure our success by the success
of our students…”

District-College Goal Alignment
District Strategic Plan Goal College Strategic Plan Goal Goal 1: Access and Preparation for Success – Improve equitable
access; help students attain important early educational momentum points.
Goal 1: Expand access to educational programs and services and prepare students for success.
Goal 2: Teaching and Learning for Success – Strengthen effective teaching and learning by providing a learner-centered educational environment; help students attain their goals of certificate and degree completion, transfer, and job training and career placement; increase equity in the achievement of these outcomes.
Goal 3: Improve quality of educational programs and services so as to increase students’ success in attaining their educational goals.
Goal 5: Sustain user-friendly and innovative technology to meet the needs of students, faculty, and staff.
Goal 3: Organizational Effectiveness – Improve organizational effectiveness through data-informed planning and decision-making, process assessment, and professional development.
Goal 2: Strengthen institutional effectiveness through a culture of evidence-based decision making, planning, and resource allocation, process assessment, and activities that promote professional development and collegiality.
Goal 5: Sustain user-friendly and innovative technology to meet the needs of students, faculty, and staff.
Goal 4: Resources and Collaboration – Increase and diversify sources of revenue in order to achieve and maintain fiscal stability and to support District initiatives. Enhance and maintain mutually beneficial external partnerships with business, labor, and industry and other community and civic organizations in the greater Los Angeles area.
Goal 4: Maintain fiscal stability through effective planning and evaluation, and encourage a greater focus on revenue enhancement.
Goal 6: Increase community engagement and expand business, community, and civic partnerships.

Performance Measures: Goal 1 Goal 1: Access and Preparation for Success 2014
LAMC 2014
District 2017-18 Target Plans for Improvement
Objective 1: Ensure equitable access to education
1.2. Percentage of eligible students receiving Pell Grant 67% 70% 75% • A CGCA is being hired with Student Equity funds to conduct financial aid inreach. • More financial aid workshops before the term starts (3SP orientations, Fall Kickoff, and out in the community).
Objective 2: Increase the percentage of new students who complete the matriculation process
2.1. Percentage of new students completing English assessment in the first term or before
77% 78% 100% • Increased off-campus placement assessments and Saturday assessments. • Early assessment for high school students. • Fall 2015 concurrently enrolled students = 837, up 131% over fall 2013 (362 students). • Four new counselors have been hired (EOP&S, STEM, Career, and Veterans/International Students) and four more are planned – this will help with AOC.
2.1. Percentage of new students completing Math assessment in the first term or before
77% 82% 100%
Objective 3: Increase the percentage of new students successfully completing at least one English and Math class in their first year and persisting to subsequent terms.
3.1. Percentage of new students successfully completing at least one English and Math class in their first year
17% 24% 18% • Launching new summer bridge/first year experience program (METAS) beginning in summer 2016 in which students will complete Math and English courses in their first year. • Counselors visit classes to encourage current students to enroll in the next semester. • Looking closely at sequencing as a part of enrollment management. • Growing Adult Education offerings and support services.
3.2. Persistence - Fall to Spring 88% 88% 88% 3.2. Persistence - Fall to Fall 75% 75% 78%

Performance Measures: Goal 2 Goal 2: Teaching and Learning for Success 2014
LAMC 2014
District 2017-18 Target Plans for Improvement
Objective 1: Provide a learner-centered learning environment
1.1. Measure of active learning/project learning 68% 69% 69% • Increase prof. development opportunities related to technology and innovative curriculum and pedagogy via Eagle’s Nest. • Add women’s cross country team (fall 2016) and women’s soccer team (spring 2017). • Offering online tutoring (NetTutor), “Libguides,” and student mentors. • Offering more courses on information literacy at local high schools. • Updating Tech Master & Replacement Plans
1.1. Measure of student engagement in and out of class 15% 19% 21%
1.1. Measure of self-efficacy/self-directed learning 79% 78% 74%
1.3. Measure of how technology is being used to improve student learning and engagement
66% 66% 75%
Objective 2: Improve student outcomes
2.1. Percentage of new student cohort completing 30 units in 3 years
57% 63% 62% • Integration of student success initiatives and College master planning documents to determine best use of resources by the College’s new Integrated Planning Committee. • Online student orientation and student-produced video stress the importance of proper placement and preparing for assessment. • Additional online courses in English and Math have been developed and are being offered. • Four new ADTs (for a total of 13) should increase graduation and transfers. • The number of transfers to the UCs and CSUs increased to 407 in 2014-15, up from 332 in 2013-14 and 213 in 2012-13.
2.1. Percentage of new student cohort completing 60 units in 3 years
24% 29% 30%
2.2. Percentage of new student cohort successfully completing English 101 and Math 125 (or above) in 3 years
24% 26% 28%
2.2. Percentage of new student cohort successfully completing English 101 and Math 125 (or above) in 6 years
32% 31% 34%
2.3. Completion rate (certificate, degree or transfer) in 3 years 8% 12% 13%
2.3. Completion rate (certificate, degree or transfer) in 6 years 28% 30% 31%

Institutional Efficiency
Institutional Efficiency 2014 LAMC
2014 District
2017-18 Target Plans for Improvement
Average class size in credit classes 39.3 36.5 41.1 • Continue to develop and offer DE courses strategically to efficiently meet FTES targets. • Offer professional development in online instruction via the Eagle’s Nest.
Cost/FTES (annual) $4,537 $4,358 Reduce M&O costs by
$63/FTES annually
• Building of a central energy plant was approved, with completion expected within a year. • New central plant will reduce maintenance and operations costs by ~$400,000 per year.
• Despite low instructional costs (LAMC has one of the lowest instructional costs per FTES in the District for the last 5 years), LAMC has very high maintenance and facilities costs.
• The construction of a central plant will substantially lower utility costs.

Long-Term Improvement Plans
LAMC’s Quality Focus Essay (QFE) outlined two main projects:
1. Establishment of an Integrated Planning Committee to oversee the integration of college planning efforts to maximize College resources, improve efficiency, and better enable the College to fulfill its Mission
2. Transformation of Student Services to achieve enhanced student success by increasing the quality and effectiveness of services provided (via leadership, training, outcomes assessment, etc.)
With the implementation of these projects… Student success at Mission is on the rise!

THANK YOU!
Our Mission is Your Success!

2015 College Planning and Effectiveness Report Los Angeles Mission College
May 25, 2016
I. Alignment of College and District Strategic Plans Los Angeles Mission College's revised Strategic Master Plan (SMP) was approved by the Board of Trustees on January 28, 2015. The 2013-2018 LAMC SMP contains strategic goals and objectives for the College that are in complete alignment with the 2012-2017 District Strategic Plan (DSP) as well as with the College’s other plans and initiatives. The 2013-2018 LAMC SMP also specifies the committees responsible for each objective, the planned activities to achieve each objective, and the performance measures and targets/benchmarks used to regularly assess the College’s progress in meeting its goals. The “Expected Improvements” noted in this report represent the targets/benchmarks established for each of the measures in the 2013-2018 LAMC SMP.
District Strategic Plan Goal College Strategic Plan Goal
Goal 1: Access and Preparation for Success – Improve equitable access; help students attain important early educational momentum points.
Goal 1: Expand access to educational programs and services and prepare students for success.
Goal 2: Teaching and Learning for Success – Strengthen effective teaching and learning by providing a learner-centered educational environment; help students attain their goals of certificate and degree completion, transfer, and job training and career placement; increase equity in the achievement of these outcomes.
Goal 3: Improve quality of educational programs and services so as to increase students’ success in attaining their educational goals.
Goal 5: Sustain user-friendly and innovative technology to meet the needs of students, faculty, and staff.
Goal 3: Organizational Effectiveness – Improve organizational effectiveness through data-informed planning and decision-making, process assessment, and professional development.
Goal 2: Strengthen institutional effectiveness through a culture of evidence-based decision making, planning and resource allocation, process assessment, and activities that promote professional development and collegiality.
Goal 5: Sustain user-friendly and innovative technology to meet the needs of students, faculty, and staff.
Goal 4: Resources and Collaboration – Increase and diversify sources of revenue in order to achieve and maintain fiscal stability and to support District initiatives. Enhance and maintain mutually beneficial external partnerships with business, labor, and industry and other community and civic organizations in the greater Los Angeles area.
Goal 4: Maintain fiscal stability through effective planning and evaluation, and encourage a greater focus on revenue enhancement.
Goal 6: Increase community engagement and expand business, community, and civic partnerships.
1

II. Goal #1- Comparison of College to District
Goal #1- Access and Preparation for Success 2012 2013 2014 2014 District
3-year change College
3-year change District
Objective 1. Ensure equitable access to education 1.1.2 Percentage of eligible students receiving Pell Grant 69% 70% 67% 70% -2% -1%
Objective 2. Increase the percentage of new students who complete the matriculation process
1.2.1 Percentage of new students completing English assessment in first term or before 78% 75% 77% 78% 0% 4%
1.2.1 Percentage of new students completing Math assessment in first term or before 77% 75% 77% 82% 0% 8%
Objective 3. Increase the percentage of new students successfully completing at least one English and Math class in their first year and persisting to subsequent terms.
1.3.1 Percentage of new students successfully completing at least one English and Math class in their first year
14% 13% 17% 24% 3% 7%
1.3.2 Persistence – Fall to Spring 84% 83% 88% 88% 4% 1%
1.3.2 Persistence – Fall to Fall 75% 73% 75% 75% 0% 0%
2

Goal #1- College Analysis and Response
District Measure Strength or Weakness College Response Plans for Improvement Expected
Improvement(s) Measure 1.1.2: Percentage of eligible students receiving Pell Grants
On par with District – College rates are similar to District average although the rate dropped in the most recent year
• An additional 4,152 students received a BOG fee waiver without a Pell Grant in 2014-15 (an additional 28.5% of the student body).
• More Financial Aid workshops before the start of the semester (e.g., as part of 3SP orientations, at Fall Kickoff, and out in the community).
• A CGCA is being hired with Student Equity funds to conduct Financial Aid inreach.
• Increase awareness of the Pell Grant through outreach and recruitment activities, including High School Senior Days.
• Inform students FAFSA form is easier to complete than in the past.
• Encourage students to complete their programs in a timely manner so their eligibility does not run out.
Increase from 67% to 75% by 2017-18
Measure 1.2.1: Percentage of new students completing English assessment and Math assessment in the first term or before
On par with District – College rates are similar to District averages, although District math assessment rates increased dramatically over the past 3 years
• English and Math prerequisites are enforced, so students must assess in order to enroll in English and Math.
• The College has greatly increased outreach efforts at high schools, resulting in greater concurrent enrollment. o There were 837 concurrently
enrolled students in fall 2015, up 12% from fall 2014 and up 131% from fall 2013.
• Assessment is the first topic covered in the College’s online orientation.
• Orientation and educational planning have been added to high school outreach activities.
• Increasing schedule of off-campus assessments.
• Offering Saturday assessments. • 3SP is providing early assessment to high
school students. • Four new counselors have been hired
(EOP&S, STEM, Career, and Veterans/International Students), and there are plans to hire four more.
Increase from 77% on both measures to 100% in line with 3SP mandates
3

Goal #1- College Analysis and Response
District Measure Strength or Weakness College Response Plans for Improvement Expected
Improvement(s) Measure 1.3.1: Percentage of new students successfully completing at least one English and Math class in their first year
Weakness – College rate has not increased as much as the District average and is currently below the District average; however, the College is progressing towards its expected improvements
• Many of LAMC’s students place into Dev. Com. or ESL on the English assessment (about one-third of assessed students) and take these courses in their first year, but these subjects were not included in the calculation of this metric.
• Many new students do not have priority registration and are unable to enroll in the English and Math classes they need.
• Many students (76%) are part-time and take only one or two courses per term.
• The College is launching a new first year experience program (METAS) beginning in summer 2016 in which students will complete English and Math courses in their first year.
• Additional online courses in English and Math have been developed.
• Interventions (AtD and Basic Skills Initiative) to increase student success in English and Math classes.
• Completing AOC requirements for 3SP will improve registration priority for new students and will also make students more aware of the importance of completing English and Math early in their college careers.
• Exploring the implementation of learning communities where English and Math faculty work together on complementary curriculum and students take both English and Math together in their first year.
Increase from 17% to 18% by 2017-18
Measure 1.3.2: Persistence – Fall-to-Spring & Fall-to-Fall
On par with District – Fall-to-Spring Persistence rates have increased - this brings the College rates in line with District averages
• Due to the offering of summer and winter intersessions, students can complete their programs in the summer or winter terms without needing to re-enroll the following spring/fall.
• Counselors visit classes to encourage current students to enroll in the next semester.
• Council of Instruction is looking more closely at sequencing to ensure that there are enough sections offered to accommodate all students prepared to take the next course in the sequence.
• The College’s annual Fall Kickoff, which has proven to increase successful course completion, course retention, and term-to-term persistence, will be expanded to include more students.
• Developing pathways to transition students from non-credit to credit coursework.
• Growing Adult Education offerings and support services.
• Offering accelerated course sequences to move students more quickly through pre-college coursework.
Maintain Fall-to-Spring persistence at 88% (2017-18 target) Increase Fall-to-Fall persistence from 75% to 78% (by 2017-18)
4

III. Goal #2- Comparison of College to District
*Year for Objective 2 metrics denotes the final year of the measurement period for each cohort. For example, 2014 is final year for the three year measurement period beginning in 2011.
Goal #2- Teaching and Learning for Success 2012 2013 2014 2014 District
3-year change College
3-year change District
Objective 1. Provide a learner-centered learning environment
2.1.1 Measure of active learning/project learning 66% 64% 68% 69% 3% 4%
2.1.1 Measure of student engagement in and out of class 16% 16% 15% 19% -1% -1%
2.1.1 Measure of self-efficacy/self-directed learning 75% 69% 79% 78% 4% 6%
2.1.3 Measure of how technology is being used to improve student learning and engagement
N/A 76% 66% 66% N/A N/A
Objective 2. Improve student outcomes* 2.2.1 Percentage of new student cohort completing 30 units in 3 years 55% 57% 57% 63% 2% 2%
2.2.1 Percentage of new student cohort completing 60 units in 3 years 23% 25% 24% 29% 1% 1%
2.2.2 Percentage of new student cohort successfully completing English 101 and Math 125 (or above) in 3 years
21% 23% 24% 26% 3% 1%
2.2.2 Percentage of new student cohort successfully completing English 101 and Math 125 (or above) in 6 years
31% 29% 32% 31% 1% -2%
2.2.3 Completion rate (i.e., certificate, degree or transfer) in 3 years 11% 8% 8% 12% -2% -2%
2.2.3 Completion rate (i.e., certificate, degree or transfer) in 6 years 27% 26% 28% 30% 1% -5%
5

Goal #2- College Analysis and Response
District Measure Strength or Weakness College Response Plans for Improvement Expected
Improvement(s) Measure 2.1.1: Active/project learning
On par with District – College rate is similar to District average
• Faculty embrace student-centered teaching methods.
• “The Eagle’s Nest” is a center where faculty can engage in professional development activities.
• The College’s hiring committees look for this approach in the teaching demonstrations when interviewing new full-time faculty candidates.
• Avenues that allow for broad-based discussion of student learning (e.g., SLO Summits, Flex Day workshops, Eagle’s Nest events, etc.) will continue to be expanded.
• The Eagle’s Nest serves as a forum for interdisciplinary research/discussions centered on student learning outcomes assessment and improvement, development of innovative curriculum, and alternate modes of delivery (pedagogy) to improve both teaching and learning, and it will continually provide workshops, trainings, and other resources on these topics.
Increase from 68% to 69% by 2017-18
Measure 2.1.1: Student engagement in and out of class
Weakness – College rate is below District average
• 76% of LAMC students are part-time and therefore less likely to be engaged in campus activities due to work and other responsibilities.
• We currently have a lack of athletics programs, athletics facilities, and fields.
• The Associate Dean of Student Services has been assigned to work closely with the ASO.
• Senior administration’s involvement and support of ASO has been increased.
• Students, especially ASO representatives, have become increasingly involved in shared governance meetings.
• Plans are underway to collaborate with the local baseball league (SIBL) for use of their athletics fields.
• The College has added a women’s cross country team for fall 2016 and plans to add a women’s soccer team in spring 2017.
• New faculty are serving as mentors for student clubs.
• Offering online tutoring (NetTutor) and student mentoring.
• Offering a “student ambassador” program. • Outreach and Recruitment is attending
parents’ nights at local high schools to encourage parents to get involved in/support their children’s college education.
• Student engagement should increase due to events like the annual Fall Kickoff and the creation of learning communities (see 1.3.1).
Increase from 15% to 21% by 2017-18
6

Goal #2- College Analysis and Response
District Measure Strength or Weakness College Response Plans for Improvement Expected
Improvement(s) Measure 2.1.1: Self-efficacy/self-directed learning
Strength – College rate is similar to District average and exceeds the goal set by the College
• The College has increased the number of course sections that promote information competency.
• NetTutor and “Libguides” (library research guides) provide resources for students outside of class.
• The College plans to offer more courses on information literacy at local high schools.
• The College plans to institutionalize the Science Success Center and Math Center, which were previously paid for with DOE grant funds.
Maintain rate of at least 74% (74% is the 2017-18 College target – currently the College is at 79%)
Measure 2.1.3: Technology is being used to improve student learning and engagement
On par with District – College rate is similar to District average; however, it has fallen below the College’s established benchmark
• Providing user-friendly and innovative technology is a focus at LAMC and is its own goal in the LAMC Strategic Plan.
• Increasing professional development opportunities in the use of technology for teaching and learning (e.g. Eagle’s Nest and Flex Day workshops).
• The College is updating its Technology Master Plan and Technology Replacement Plan.
Benchmark = 75% (Currently the College is at 66%)
7

Goal #2- College Analysis and Response
District Measure Strength or Weakness College Response Plans for Improvement Expected
Improvement(s) Measure 2.2.1 Percentage of new student cohort completing 30 units and completing 60 units in 3 years
Weakness – The College has increased in these rates over the past 3 years; however, it is still behind the District averages
• Although we are still below District average, we are seeing improvement, likely due to efforts to increase Pell recipients and events like the Fall Kickoff – activities that will be continued to sustain the progress.
• Students receiving Pell Grants are far more likely to attain these unit thresholds within 3 years than students receiving no Financial Aid or only a BOG waiver.
• 76% of students attend part time, which makes timely unit accumulation a challenge.
• Encourage students to apply for Pell Grants (a CGCA is being hired with Student Equity funds to conduct Financial Aid inreach).
• The efforts described for Measure 1.3.2 to increase student persistence should also contribute to increases in these metrics.
• Integration of student success initiatives (including 3SP, Student Equity, AtD, and Basic Skills) and the College’s master planning documents will be addressed by the College’s new Integrated Planning Committee.
• Beginning in summer 2016, the College is launching a new first year experience program (METAS) that will utilize a cohort model and that will provide students with guaranteed spots in classes in the summer and (full-time) for their first year.
Increase “completion of 30 units within 3 years” from 57% to 62% (by 2017-18) Increase “completion of 60 units within 3 years” from 24% to 30% (by 2017-18)
8

Goal #2- College Analysis and Response
District Measure Strength or Weakness College Response Plans for Improvement Expected
Improvement(s) Measure 2.2.2 Percentage of new student cohort successfully completing English 101 and Math 125 (or above) in 3 years and in 6 years
On par with District – College rates are similar to District averages. The College is making progress towards its established goals.
• Many LAMC students place into pre-college level English and Math courses, resulting in long course sequences prior to achieving this goal.
• New math courses (137 and the 123A/B/C sequence) are alternative pathways to transfer-level math at LAMC that are not included in the calculation of this measure for LAMC.
• Math 125, Math 227, Math 265, Math 266, and Math 267 are now offered online.
• English and Math AtD/Basic Skills Initiative interventions are helping students progress through the English and Math sequences, which will also help increase degree and transfer rates: o Students can concurrently enroll in
English 21 & 28 or English 28 & 101 in the same semester (there is coordinated content and a single instructor).
o Math 115 and 125 are scheduled in two-semester sequences: instructors teach at the same time/days and use the same book for both semesters.
o The English and Math Departments have developed online preparation materials for their assessment exams that should help place students more accurately so they will not have to take unnecessary courses.
• The College’s online student orientation stresses the importance of proper placement and preparing for the assessment. There is also a separate student-directed online YouTube presentation on the importance of assessment and the consequences of not being properly placed.
• The College also has a new orientation video produced by the ASO.
Increase “successful completion of English 101 and Math 125 (or above) in 3 years” from 24% to 28% (by 2017-18) Increase “successful completion of English 101 and Math 125 (or above) in 6 years” from 32% to 34% (by 2017-18)
9

Goal #2- College Analysis and Response
District Measure Strength or Weakness College Response Plans for Improvement Expected
Improvement(s) Measure 2.2.3 Completion rate (i.e., certificate, degree, or transfer) in 3 years and in 6 years
Weakness – The 3-year completion rate fell for both the College and the District. While the College has improved the 6-year completion rate, it is still below the District average.
• LAMC has seen large increases in the number of students awarded degrees and certificates in recent years. Also the number of transfers to the UCs and CSUs increased to 407 in 2014-15, up from 332 in 2013-14 and 213 in 2012-13. These increases should be reflected in the coming years as these cohorts make their way through the pipeline.
• 76% of students attend part time, which makes timely certificate/degree completion and/or transfer a challenge.
• The College has developed new programs in Health Occupations disciplines (CNA and Pharmacy Tech).
• Offering more sections with an increased focus on sequencing, so students can complete their requirements more quickly.
• Hiring of additional counselors (four were hired this year and there are plans to hire four more) and other full-time faculty members.
• The continuation of three pathway grants (IT, CNA, and Biotech) and others to come will increase CTE completion in shorter periods of time.
• Four new Associate Degrees for Transfer (for a total of 13) should increase degree and transfer rates.
• Integration of all student success initiatives and master planning documents (as discussed in 2.2.1) will help to streamline services and improve student outcomes.
Increase the “completion rate within 3 years” from 8% to 13% (by 2017-18) Increase the “completion rate within 6 years” from 28% to 31% (by 2017-18)
10

IV. Institutional Efficiency- Comparison of College to District
Institutional Efficiency- College Analysis and Response District Measure Strength or
Weakness College Response Plans for Improvement Expected Improvement(s)
Average class size in credit classes
Strength – The College’s ACS is the highest in the District (currently and historically)
• As shown by our high average class size, LAMC carries out effective scheduling practices.
• The College will continue to offer and develop DE courses strategically to efficiently meet FTES targets.
• Faculty professional development for online instruction is offered through such venues as the Eagle's Nest.
Increase from 39.3 to 41.1 by 2017-18
Cost/FTES (annual) Weakness – Even though cost per FTES fell in 2014, LAMC still has a higher annual cost/ FTES than the District average. However, it is on par with the other smaller colleges.
• LAMC has one of the lowest instructional costs per FTES in the District for the past 5 years.
• The construction of a central plant will substantially lower utility costs.
• The College is anticipating breaking ground on the central plant within three months, with completion expected within a year.
M&O costs will be reduced by approximately $400,000/year (or ~$63/FTES) due to the construction of the new central plant
Institutional Efficiency 2012 2013 2014 2014 District
3-year change College
3-year change District
Average Class Size in Credit Classes 42.6 39.1 39.3 36.5 -8% -9%
Cost/FTES (annual) $4,501 $4,656 $4,537 $4,358 1% 5%
11

Institutional Effectiveness Report to the Board of Trustees
May 25, 2016
Executive Summary
Los Angeles Pierce College (LAPC) is committed to providing students with Access and Preparation for Success, Teaching and Learning for Success, and Institutional Efficiency. Thanks to the dedicated efforts of our faculty and staff, as well as vital support from the District, LAPC performed better than the LACCD average on 16 of the 18 (89%) institutional effectiveness metrics, which exceeds our prior year performance (83%). Of the three metrics LAPC reported as a weakness last year, two are now above the LACCD average:
• Percentage of new students completing Math assessment in the first term or before • Measure of active learning/project learning (based on survey responses)
However, a metric that was reported as a strength last year is now below the LACCD average:
• Measure of student engagement in and out of class (based on survey responses)
To address this new weakness, we created an office of student engagement, recently hired a Dean of student engagement, and a student engagement coordinator (counselor) dedicated to enhancing student life. With a focus on developing student life, there has been an increase in the number of student clubs and organizations, which offer a variety of opportunities for student involvement. In addition, the office of student engagement publishes a monthly newsletter highlighting campus activities and student leaders. We have also developed college wide partnerships to offer more opportunities for student involvement, such as, the one book one-campus project (library), town hall (political science), and baseball tailgate (athletics).
Access and Preparation for Success Recent system-wide changes have introduced additional funding targeted to ensure that colleges guide 100 percent of new students through the matriculation process. To meet this challenge and maximize the use of Student Success and Support Program (SSSP) funds, LAPC is hiring tenure-track counselors and scaling up matriculation initiatives such as the annual Go Days orientation program. Our Go Days initiative received Honorable Mention in the Exemplary Program Awards from the Academic Senate for California Community Colleges (ASCCC). Teaching and Learning for Success Developmental education remains a challenge nationwide at all community colleges. To meet this challenge, LAPC is scaling up appropriate accelerated developmental pathways, including: 1) The First Year Experience; 2) Enhanced Noncredit/Adult Education developmental education courses; 3) specialized mathematics interventions, such as Statway, Algebra Success at LAPC (ASAP), and Pre-algebra Immersion (PI); and, 4) Summer Bridge for English. We continue to make investments in classroom technology, and have won two consecutive Title V Grants focused on improving access through Distance Education. The College is working to further improve access to technology and has created a Technology Master Plan to guide those efforts. The availability of Student Equity funds enables LAPC to pilot student success and engagement initiatives over the next several years, including: in-class tutoring, peer mentor programs, and professional development for faculty on active learning techniques. Institutional Efficiency Due to workload reductions in 2011-2012, efficiency was high in both average class size and cost per FTES. However, data from fall 2013 and fall 2014 show that an increase in offerings has led to a decline in average class size. This is a concern, which the College is taking steps to address. The College continues to analyze enrollment trends and respond with improved scheduling to address student need. With the new Student Information System (SIS), LAPC will improve scheduling to meet predicted student demand—particularly to encourage more students to attend full-time. An increase in the percent of full-time students will allow LAPC to meet FTES targets while decreasing headcount and the associated variable costs for each headcount (e.g. creating student ID’s, parking spaces, etc.). This would allow LAPC to reduce Cost/FTES.

LOS ANGELES PIERCE COLLEGE
LOS ANGELES

2015 College Planning and Effectiveness Report Los Angeles Pierce College
May 25, 2016
I. Alignment of College and District Strategic Plans Since 2011, the College has operated with the Educational Master Plan as the overarching document driving the College’s planning and decision making process. However, after reviewing the planning process in 2013, the College determined that the Educational Master Plan was too narrowly focused on educational programs and did not adequately account for operational services provided by the administrative services division of the College. As a result, the College wrote a new Strategic Master Plan and adopted it as the overarching document to integrate the four divisions of the College. The concept of the new Strategic Master Plan provides the College with an inclusive and comprehensive plan, allowing for Academic Affairs, Student Services, Administrative Services, and the President’s office to align each their operational plans with the Strategic Master Plan. The new Strategic Master Plan is based on four goals with the acronym CAPS: Engaging the Completion Agenda, Demonstrating Accountability, Cultivating Partnerships and Ensuring Student Success.
District Strategic Plan Goal College Strategic Plan Goal
Goal 1: Access and Preparation for Success – Improve equitable access; help students attain important early educational momentum points.
Goal A.2: Ensure all eligible new students complete the matriculation process. Goal A.4: Ensure equitable access and success for subpopulations of students. Goal D.1: Address the basic skills needs of underprepared students in developmental and introductory courses Goal D.6: Increase student awareness and use of student support services and programs
Goal 2: Teaching and Learning for Success – Strengthen effective teaching and learning by providing a learner-centered educational environment; help students attain their goals of certificate and degree completion, transfer, and job training and career placement; increase equity in the achievement of these outcomes.
Goal A.1: Increase student completion of degrees, certificates, college transfer requirements, and licensure requirements. Goal A.3: Increase course completion and long-term persistence of students. Goal D.4: Support faculty and staff by maximizing the effective use of technology, enabling academic innovation in instructional delivery Goal D.5: Provide a learner-centered environment that promotes active learning and student engagement Goal D.7: Increase student participation in Associated Student Organization (ASO) activities and shared-governance committees Goal D.8: Enhance opportunities for student involvement in cocurricular and extracurricular activities that will enrich campus life
1

District Strategic Plan Goal College Strategic Plan Goal
Goal 3: Organizational Effectiveness – Improve organizational effectiveness through data-informed planning and decision-making, process assessment, and professional development.
Goal B.1: Improve financial reporting process for more accurate budgetary forecasting, allowing for fiscal stability. Goal B.2: Improve operational efficiencies and processes along with internal cash controls. Goal B.3: Improve campus-wide health, safety, and security through enhanced risk-management practices. Goal B.4: Improve facilities oversight of both bond-related and college state-funded alterations and improvements. Goal B.5: Increase self-audit to ensure compliance with program requirements. Goal B.6: Develop and implement professional development programs for faculty, classified staff, and administrators. Goal B.7: Meet annual enrollment management goals. Goal B.8: Meet or exceed accreditation standards and policies. Goal D.2: Enhance customer service interfaces considering timely responses and quality of experience. Goal D.3: Maintain a robust and reliable information technology infrastructure with current computing equipment for the entire college population.
Goal 4: Resources and Collaboration – Increase and diversify sources of revenue in order to achieve and maintain fiscal stability and to support District initiatives. Enhance and maintain mutually beneficial external partnerships with business, labor, and industry and other community and civic organizations in the greater Los Angeles area.
Goal C.1: Develop and enhance revenues generated through grants, entrepreneurial ventures, and community partnerships. Goal C.2: Expand productive sustainable community alliances to enhance annual donations to the Foundation. Goal C.3: Foster partnerships with business and industry to increase career opportunities for students.
II. Goal #1- Comparison of College to District
Goal #1- Access and Preparation for Success 2012 2013 2014 2014 District
3 year change College
3 year change District
Objective 1. Ensure equitable access to education 1.2 Percentage of eligible students receiving Pell Grant 82% 80% 78% 70% -4% -1%
Objective 2. Increase the percentage of new students who complete the matriculation process
2

Goal #1- Access and Preparation for Success 2012 2013 2014 2014 District
3 year change College
3 year change District
2.1 Percentage of new students completing English assessment in the first term or before
76% 73% 78% 78% 2% 4%
2.1 Percentage of new students completing Math assessment in the first term or before 75% 73% 82% 82% 7% 8%
Objective 3. Increase the percentage of new students successfully completing at least one English and Math class in their first year and persisting to subsequent terms.
3.1 Percentage of new students successfully completing at least one English and Math class in their first year
22% 23% 27% 24% 5% 7%
3.2 Persistence - Fall to Spring 90% 89% 90% 88% 0% 1%
3.2 Persistence - Fall to Fall 79% 79% 78% 75% -1% 0%
Goal #1- College Analysis and Response
District Measure Strength or Weakness College Response Plans for Improvement Expected Improvement(s)
Measure 1.1.2: Percentage of eligible students receiving Pell Grants
Strength LAPC is above the LACCD average (78% vs 70%)
Continue to perform outreach in the high schools and in our classrooms. Send emails to students about Financial Aid. Continue to run Financial Aid Awareness Month activities. Continue to conduct secret shopper evaluations to ensure students are receiving high quality service.
“Ensure 90% satisfaction rate on all secret shopper evaluation questions for each department” (Goal D.2)
Measure 1.2.1: Percentage of new students completing English assessment and Math assessment in the first term or before
Strength for English, Strength for Math
LAPC meets the LACCD average (78%) for English LAPC meets the LACCD average (82%) for Math
SSSP legislation requires all new students to be assessed in English and Math.
“100% of eligible new students complete assessment” (Goal A.1)
3

Goal #1- College Analysis and Response
District Measure Strength or Weakness College Response Plans for Improvement Expected Improvement(s)
Measure 1.3.1: Percentage of new students successfully completing at least one English and Math class in their first year
Strength LAPC is above the LACCD average (27% vs 24%)
Continue to scale up accelerated developmental pathways in English and Math.
“Increase [annually by 2%] the percentage of students who started in Basic Skills English and completed a college level English course” “Increase [annually by 2%] the percentage of students who started in Basic Skills Math and completed a college level Math course” (Goal D.1)
Measure 1.3.2: Persistence – Fall-to-Spring & Fall-to-Fall
Strength for FA-SP and Strength for FA-FA
LAPC is above the LACCD average (90% vs 88%) for Fall-to-Spring Persistence LAPC is above the LACCD average (78% vs 75%) for Fall-to-Fall Persistence
Align and integrate SSSP and Equity efforts to increase student persistence.
“Increase [annually by 2%] the overall long-term persistence rate” (Goal A.3)
III. Goal #2- Comparison of College to District
Goal #2- Teaching and Learning for Success 2012 2013 2014 2014 District
3 year change College
3 year change District
Objective 1. Provide a learner-centered learning environment
1.1 Measure of active learning/project learning 63% 70% 69% 7% 4%
1.1 Measure of student engagement in and out of class 24% 18% 19% -7% -1%
1.1 Measure of self-efficacy/self-directed learning 69% 74% 78% 6% 6%
1.3 Measure of how technology is being used to improve student learning and engagement
NA 66% 66% NA NA
Objective 2. Improve student outcomes*
2.1 Percentage of new student cohort completing 30 units in 3 years 68% 70% 69% 63% 1% 2%
4

Goal #2- Teaching and Learning for Success 2012 2013 2014 2014 District
3 year change College
3 year change District
2.1 Percentage of new student cohort completing 60 units in 3 years 34% 35% 32% 29% -2% 1%
2.2 Percentage of new student cohort successfully completing English 101 and Math 125 (or above) in 3 years
35% 36% 32% 26% -2% 1%
2.2 Percentage of new student cohort successfully completing English 101 and Math 125 (or above) in 6 years
44% 42% 40% 31% -4% -2%
2.3 Completion rate (i.e., certificate, degree or transfer) in 3 years 21% 17% 13% 12% -8% -2%
2.3 Completion rate (i.e., certificate, degree or transfer) in 6 years 46% 41% 38% 30% -8% -5%
*Year for Objective 2 metrics denotes the final year of the measurement period for each cohort. For example, 2014 is final year for the three year measurement period beginning in 2011.
Goal #2- College Analysis and Response
District Measure Strength or Weakness College Response Plans for Improvement Expected Improvement(s)
Measure 2.1.1: Active /project learning
Strength LAPC is above the LACCD average (70% vs 69%)
Increase professional development activities for faculty on active learning.
“90% of faculty are proficient in active learning techniques and authentic assessment by 2017-2018” (Goal D.5)
Measure 2.1.1: Student engagement in and out of class
Weakness LAPC is below the LACCD average (18% vs 19%)
Increase student engagement activities offered on campus, and better promote campus events.
“Complete annual activities identified in the Student Engagement Plan” (Goal D.8)
Measure 2.1.1: Self-efficacy/self-directed learning
Weakness LAPC is below the LACCD average (74% vs 78%)
Increase student awareness and use of student support services and programs that help students improve self-efficacy and self-directed learning, such as increasing completion of student educational plans for new and continuing students.
“100% of eligible new students complete an abbreviated student educational plan” (Goal A.2)
Measure 2.1.3: Technology is being used to improve student learning and engagement
Strength LAPC meets the LACCD average (66%) Improve technology campus wide, as identified in the Technology Master Plan.
“Ensure 100% of goals identified in the Technology Master Plan are on target for completion by 2018-2019” (Goal D.3)
5

Goal #2- College Analysis and Response
District Measure Strength or Weakness College Response Plans for Improvement Expected Improvement(s)
Measure 2.2.1 Percentage of new student cohort completing 30 units and completing 60 units in 3 years
Strength for 30 units and Strength for 60 units
LAPC is above the LACCD average (69% vs 63%) for 30 Units LAPC is above the LACCD average (32% vs 29%) for 60 Units
Scale up student success initiatives funded through new sources of revenue such as Equity Funding.
“Increase [annually by 2%] the overall rate of students completing 30 credits” (Goal A.3)
Measure 2.2.2 Percentage of new student cohort successfully completing English 101 and Math 125 (or above) in 3 years and in 6 years
Strength for 3 years and Strength for 6 years
LAPC is above the LACCD average (32% vs 26%) for 3 years LAPC is above the LACCD average (40% vs 31%) for 6 years
Continue to scale up accelerated developmental pathways, including developmental education curriculum through non-credit adult education.
“Increase [annually by 2%] the percentage of students who started in Basic Skills English and completed a college level English course” “Increase [annually by 2%] the percentage of students who started in Basic Skills Math and completed a college level Math course” (Goal D.1)
Measure 2.2.3 Completion rate (i.e., certificate, degree, or transfer) in 3 years and in 6 years
Strength for 3 years and Strength for 6 years
LAPC is above the LACCD average (13% vs 12%) for 3 years LAPC is above the LACCD average (38% vs 30%) for 6 years
Continue to increase the number of Associate Degrees-Transfer (AD-Ts) offered, which will increase degree completion and transfer rates.
“Increase [annually by 2%] the overall completion rate” (Goal A.1)
6

IV. Institutional Efficiency- Comparison of College to District
Institutional Efficiency- College Analysis and Response District Measure Strength or
Weakness College Response Plans for Improvement Expected Improvement(s)
Average class size in credit classes
Strength LAPC is above the LACCD average (38.9 vs 36.5)
Maximize scheduling of high demand, high enrollment courses.
“Meet average fill target of 90% at census and maintain or increase average class size of 39 each semester” (Plan for Enrollment Management Goal 6, which maps to Strategic Master Plan Goal B.7)
Cost/FTES (annual) Strength LAPC is more efficient than the LACCD average ($4,053 vs $4,358)
Schedule courses to meet predicted student demand—particularly to encourage more students to attend full-time. An increase in the percent of full-time students will allow Pierce to meet FTES targets while decreasing headcount and the associated variable costs for each headcount (e.g. creating student ID’s, parking spaces, etc.). This would allow Pierce to reduce Cost/FTES.
“Ensure 95% of predicted seats demanded are offered” (Plan for Enrollment Management Goal 7, which maps to Strategic Master Plan Goal B.7)
Institutional Efficiency 2012 2013 2014 2014 District
3 year change College
3 year change District
Average Class Size in Credit Classes 41.8 38.9 38.9 36.5 -7% -9%
Cost/FTES (annual) $3,946 $4,086 $4,053 $4,358 3% 5%
7
Institutional Effectiveness Report to the Board of Trustees
May 25, 2016
Executive Summary
Los Angeles Southwest College (LASC) serves approximately 8,700 students each semester. LASC has the highest proportion of female (70%) and African-American students (60%) of any campus in the district. Hispanic/Latinos make up 34% of credit and 95% of noncredit students. Further, 75% of students attend part time and more than 90% of new students assess into developmental English and Math courses. To ensure that the college meets the needs of this population, LASC recently reviewed and revised its Mission to include types of degrees and other credentials it offers. The college is also in the process of completing its Educational, Facilities, and Technology Master Plans. Additionally, the college has been notified of the State’s intent to award the Community College Basic Skills and Transformation Program 2015-16 Grant that will be used to improve the progression rate of students from developmental education to college level instruction.
Access and Preparation for Success
Recent policy changes have affected Pell participation at LASC and the college will increase awareness of financial aid policies and procedures. The college will continue to improve SSSP and Equity practices to ensure that students continue to complete English and Math assessment in their first term or before at high rates. The college plans on implementing more boot camps and institutionalization of the Passage program to better prepare students for success in their first year of college and completion of their educational goals.
Teaching and Learning for Success
Work on the QFE began shortly after the accreditation visit. The college is in the process of evaluating and selecting a system for tracking and documenting learning outcomes assessments; the college is also in the process of completing its Master Plans and there is a conscious effort to meaningfully engage classified staff and students in the planning process. The college’s Mission has been revised to meet accreditation standards. Professional Development activities and their expansion to Classified Staff are also being explored. Collectively, these action projects and other ongoing activities will help students complete their academic and career goals in a timely fashion.
Institutional Efficiency
The college’s average class size and Cost/FTES is among the least efficient in the LACCD. Average class size, it is believed, has been impacted by enrollment priorities and inefficient enrollment management processes. Salary increases and other annual operating increases have contributed to the larger than district average Cost/FTES. When compared to other institutions of education, however, the college spends less per-student (36% less than California Community Colleges, 54% less than K-12 schools, 64% less than Cal State Universities, and 80% less than Institutions in the University of California system). Strategies to improve institutional effectiveness are – nonetheless – being explored. Evaluation of the enrollment management process, improved outreach and in-reach activities in student services, and collaboration with faculty to improve scheduling of programs are among the activities the college intends to carry out for the improvement of institutional efficiency.


I. Alignment of College and District Strategic Plans
LACCD Strategic
Plan
LASC Mission
LASC Strategic
Plan • Resources • Collaboration
and Partnerships
• Institutional Effectiveness and Accountability
• Success • Access and Preparation for Success
Goal 1: Access and
Preparation for Success
Goal 2: Teaching and Learning for
Success
Goal 4: Resources and Collaboration
Goal 3: Organizational Effectiveness
In honor of its founding history, Los Angeles Southwest College empowers a diverse student population to achieve their academic and career goals, and to become critical thinkers and socially responsive leaders*. * New Mission Statement awaiting approval.

II. Goal #1 – Access and Preparation for Success
76% 78%
68% 70%
60%
65%
70%
75%
80%
LASC2012
LASC2013
LASC District
Percent of eligible students receiving Pell Grant
2014
83%
77% 81%
78% 80%
77% 78% 82%
60%
65%
70%
75%
80%
85%
LASC2012
LASC2013
LASC District
New students who complete Assessment in first term or before
English Math
2014
13% 15%
20%
24%
5%
10%
15%
20%
25%
LASC2012
LASC2013
LASC District
New students who successfully completed at least one English and
Math class in their first year
2014
83% 87%
85% 88%
69% 66%
68%
75%
60%
65%
70%
75%
80%
85%
90%
LASC2012
LASC2013
LASC District
Persistence of new students
Fall to Spring Fall to Fall
2014

III. Goal #2 – Teaching and Learning for Success Goal #2- Teaching and Learning for Success
2012 2014
LASC LASC District
Measure of active learning/project learning 69% 71% 69%
Measure of student engagement in and out of class 22% 21% 19%
Measure of self-efficacy/self-directed learning 71% 76% 78%
Measure of how technology is being used to improve student learning and engagement
NA 69% 66%
46% 41%
56% 63%
17% 14% 21%
29%
5%
15%
25%
35%
45%
55%
65%
LASC2012
LASC2013
LASC District
Unit Completion in 3 Years
Cohort completing 30 units Cohort completing 60 units
2014
14% 14%
21% 26%
15% 17% 16%
31%
5%10%15%20%25%30%35%
LASC2012
LASC2013
LASC District
Cohort Completion of English 101 & Math 125 or Above
In 3 Years In 6 Years
2014
9% 8% 13% 12%
22% 22% 19%
30%
0%5%
10%15%20%25%30%35%
LASC2012
LASC2013
LASC District
Completion Rate (Certificate, Degree or Transfer)
In 3 Years In 6 Years
2014

IV. Institutional Efficiency
Educational System Per-Student Funding K – 12* $11,107
California Community Colleges* $7,897
California State University* $14,120
University of California* $24,788
* Fast Facts 2016, Community College League of California
Institutional Efficiency
2012 2013 2014 3 year change College
3 year change District
2014 Relative
to District
LASC LASC LASC District
Average Class Size in Credit Classes 35.6 35.6 34.3 36.5 -4% -9% 2.2
Cost/FTES (annual) $5,009 $4,853 $5,057 $4,358 1% 5% $ (699)

College Analysis
Access & Preparation for Success • Above or near district on 3 out of
6 indicators (< 3% difference) Teaching & Learning for Success • Above or near district on 5 out of
10 indicators (< 3% difference) Institutional Efficiency • Above district on both indicators
Ongoing Improvements
• Review and revision of Mission to meet accreditation standards
• Completion of Educational, Facilities and Technology Master Plans
• Community Colleges Basic Skills and Student Outcomes Transformation Program Grant
College Analysis and Response
Areas for Improvement • English and Math Assessment • Improvement of student outcomes:
– Persistence – Unit Completion – Achievement of English/Math
Competency – Completion Rate
LASC QFE Total points: 26 of 30 • Learning Outcomes
Assessment • Planning Integration • Professional Development

2015 College Planning and Effectiveness Report Los Angeles Southwest College
May 25, 2016
I. Alignment of College and District Strategic Plans The 2014-2020 Los Angeles Southwest College Strategic Master Plan was developed in complete alignment with the 2012-2017 LACCD Strategic Plan. The College Strategic Plan provides a blueprint for the future of LASC over a six year period and it serves as the foundation of all other plans, and for the allocation of campus resources. The College’s integrated planning process was also recently evaluated and revised. The process infuses LASC’s Strategic Goals throughout the planning process (including master plans, program review and program planning) and budgeting process. The College’s integrated planning and evaluation structure ensures that short- and long-term goals are met.
District Strategic Plan Goal College Strategic Plan Goal
Goal 1: Access and Preparation for Success – Improve equitable access; help students attain important early educational momentum points.
Goal 1: Access and Preparation for Success: Improve equitable access to a high-quality education that promotes student success.
Goal 2: Teaching and Learning for Success – Strengthen effective teaching and learning by providing a learner-centered educational environment; help students attain their goals of certificate and degree completion, transfer, and job training and career placement; increase equity in the achievement of these outcomes.
Goal 2: Success: Increase student success and academic excellence with a focus on student-centered instruction and support services.
Goal 3: Organizational Effectiveness – Improve organizational effectiveness through data-informed planning and decision-making, process assessment, and professional development.
Goal 3: Institutional Effectiveness and Accountability: Enhance institutional effectiveness and accountability through data-driven decision making, as well as planning, evaluation, and improvement of college programs, professional development opportunities, and governance structures.
Goal 4: Resources and Collaboration – Increase and diversify sources of revenue in order to achieve and maintain fiscal stability and to support District initiatives. Enhance and maintain mutually beneficial external partnerships with business, labor, and industry and other community and civic organizations in the greater Los Angeles area.
Goal 4: Resources: Optimize human, physical, technological, and financial resources to ensure quality services for our students. Goal 5: Collaboration and Partnerships: Maximize collaboration within the college while cultivating and strengthening partnerships with industry, community, and other educational institutions.
1

II. Goal #1- Comparison of College to District
Goal #1- Access and Preparation for Success 2012 2013 2014 2014 District
3 year change College
3 year change District
Objective 1. Ensure equitable access to education 1.2 Percentage of eligible students receiving Pell Grant 76% 78% 68% 70% -8% -1%
Objective 2. Increase the percentage of new students who complete the matriculation process
2.1 Percentage of new students completing English assessment in the first term or before
83% 77% 81% 78% -2% 4%
2.1 Percentage of new students completing Math assessment in the first term or before 80% 77% 78% 82% -2% 8%
Objective 3. Increase the percentage of new students successfully completing at least one English and Math class in their first year and persisting to subsequent terms.
3.1 Percentage of new students successfully completing at least one English and Math class in their first year
13% 15% 20% 24% 7% 7%
3.2 Persistence - Fall to Spring 83% 87% 85% 88% 2% 1%
3.2 Persistence - Fall to Fall 69% 66% 68% 75% -1% 0%
Goal #1- College Analysis and Response
District Measure Strength or Challenge College Response Plans for Improvement Expected Improvement(s)
Measure 1.1.2: Percentage of eligible students receiving Pell Grants
Challenge
Negative – 3 Y change
Slightly Below – LACCD Average
National policy changes have affected Pell participation in California. Changes to the lifetime Pell eligibility limits, elimination of financial aid eligibility for students without a high school diploma or its equivalent, and the reduction of income to asset protection allowances have discouraged and, in some cases, students have maxed out of eligibility.
• Increase awareness of the FAFSA application process and financial aid policies and procedures.
• Conduct workshops to educate students regarding budget planning and goal setting.
• Support the California Community Colleges “I Can Afford College” campaign.
The percentage of eligible students receiving Pell Grants will increase by at least 5% over the next three years.
2

Goal #1- College Analysis and Response
District Measure Strength or Challenge College Response Plans for Improvement Expected Improvement(s)
Measure 1.2.1: Percentage of new students completing English assessment and Math assessment in the first term or before
Strength
Slight 3 Y decrease
Above – LACCD Average
(1 measure)
The percentage of new students completing English and Math assessments in their first term or before has historically been a strong suit for LASC. The College shows an increase on this measure from 2013 to 2014.
• During the outreach process, continue informing new students about the assessment process.
• Increase the percentage of new students completing assessment by providing access to the assessment test at remote locations.
The College expects an increase in the percentage of new students completing English assessment by 4% and Math assessment by 4% in their first term or before, within three years.
Measure 1.3.1: Percentage of new students successfully completing at least one English and Math class in their first year
Improving
Positive – 3 Y change
Below – LACCD Average
The percentage of new students successfully completing at least one English and Math class in their first year continues to be below the District average; however, the College has made great strides on this measure over the last three years (7% change).
• Encourage more students to enroll in the English and Math courses they assess into in their first year.
• Collaborate with counselors to ensure that all new students will have an educational plan that includes Math and English during their first semester.
• Implement more boot camps that prepare students for success in their Math and English courses.
The College expects an increase in the percentage of new students that complete at least one English and Math class in their first year by 5%, within three years. (align with District average)
Measure 1.3.2: Persistence – Fall-to-Spring & Fall-to-Fall
Improving
Slight 3 Y change (+/-)
Below – LACCD Average
In 2011 these measures (Fall to Spring and Fall to Fall Persistence) were 79% and 56%, respectively. Over the last three years the college has greatly improved on this measure. The small changes on this measure suggest that interventions are holding steadfast; however, through development of the educational master plan, the college looks to improve on this measure with new student-centered interventions.
• Begin to track the use of Early Alert by faculty, to assist students in danger of failing to utilize resources available to them.
• Implement of Student Equity Plan activities, including imbedded tutoring and implementation of learning communities.
• Support student success center in assisting students to use tools that will help them succeed and persist.
• Institutionalization of the Passage program, which is designed to increase persistence among first-year students and men of color.
The College goal is to increase the persistence rate of first-year students, within three years, from Fall to Spring by 3%, and from Fall to Fall by 7%. (align with District average)
3

III. Goal #2- Comparison of College to District
*Year for Objective 2 metrics denotes the final year of the measurement period for each cohort. For example, 2014 is final year for the three year measurement period beginning in 2011.
Goal #2- Teaching and Learning for Success 2012 2013 2014 2014 District
3 year change College
3 year change District
Objective 1. Provide a learner-centered learning environment 1.1 Measure of active learning/project learning 69% 71% 69% 2% 4%
1.1 Measure of student engagement in and out of class 22% 21% 19% 0% -1%
1.1 Measure of self-efficacy/self-directed learning 71% 76% 78% 5% 6%
1.3 Measure of how technology is being used to improve student learning and engagement
NA 69% 66% NA NA
Objective 2. Improve student outcomes* 2.1 Percentage of new student cohort completing 30 units in 3 years 46% 41% 56% 63% 10% 2%
2.1 Percentage of new student cohort completing 60 units in 3 years 17% 14% 21% 29% 4% 1%
2.2 Percentage of new student cohort successfully completing English 101 and Math 125 (or above) in 3 years
14% 14% 21% 26% 7% 1%
2.2 Percentage of new student cohort successfully completing English 101 and Math 125 (or above) in 6 years
15% 17% 16% 31% 1% -2%
2.3 Completion rate (i.e., certificate, degree or transfer) in 3 years 9% 8% 13% 12% 4% -2%
2.3 Completion rate (i.e., certificate, degree or transfer) in 6 years 22% 22% 19% 30% -3% -5%
4

Goal #2- College Analysis and Response
District Measure Strength or Challenge College Response Plans for Improvement Expected
Improvement(s) Measure 2.1.1: Active /project learning
Strength
Positive – 3 Y Change
Above –LACCD Average
On this measure, LASC exceed the District average and has increased modestly over the last three years.
• Identify and implement student-centered interventions that engage students in active learning.
• Continue to offer and improve professional development activities that focus on methods to improve active learning.
Increase the percentage of active learning/project learning by 2%, within three years.
Measure 2.1.1: Student engagement in and out of class
Challenge
No 3 Y Change
Above – LACCD Average
On this measure, LASC exceed the District average over the last three years. However, the college agrees that student engagement in and out of class needs to increase.
• Institutionalization of the Passage program, which is designed to increase improve student engagement.
• Collaborate with the ASO to implement a comprehensive process that substantively engages students.
Increase the percentage of student engagement in and out of the class by 4%, within three years.
Measure 2.1.1: Self-efficacy/self-directed learning
Strength
Positive – 3 Y Change
Slightly Below – LACCD Average
On this measure, LASC has increased by 5% over the last three years and is just below the District average.
• Continued implementation of SB 1456 and Federal Financial Aid regulations empower students to self-govern and complete their educational goals in a timely fashion, fostering self-efficacy.
• In collaboration with Academic Senate, continue offering professional development activities designed to improve teaching strategies related to self-directed learning.
• Collaborate with the ASO to develop a support network for students to strengthen academic skills, personal development, and character enrichment.
Increase the percentage of self-efficacy/self-directed learning students by 4%, within three years.
Measure 2.1.3: Technology is being used to improve student learning and engagement
Strength
Above – LACCD Average
On this measure, LASC exceed the District average.
• Encourage faculty to continue using technology in the classroom to improve student learning and engagement.
• Continue to use social media to engage students and improve student learning.
Increase this measure by 3%, within three years.
5

Goal #2- College Analysis and Response
District Measure Strength or Challenge College Response Plans for Improvement Expected
Improvement(s) Measure 2.2.1 Percentage of new student cohort completing 30 units and completing 60 units in 3 years
Improving
Positive – 3 Y change
Below – LACCD Average
LASC continues to be below the District average on this measure, but the college continues to improve at a faster rate than the District (10% and 4%, respectively, over three years on these measures).
• Continue to expand tutoring and supplemental instruction across disciplines on campus, especially in high enrollment classes with low success rates.
• Institutionalization of the Passage program, which is designed to improve completion and attainment of educational milestones among first-year students and men of color.
• Continue to support the Working Students Success Network program, which helps low-income students with families to reach economic stability and move up the economic ladder.
• Through the recently promised Community College Basic Skills and Student Outcomes Transformation Program Grant, develop and implement student-centered interventions and policies.
Increase the percentage of new student cohort completing 30 units in 3 years by 7% and the percentage of new student cohort completing 60 units in 3 years by 8%. (align with district average)
Measure 2.2.2 Percentage of new student cohort successfully completing English 101 and Math 125 (or above) in 3 years and in 6 years
Improving
Positive – 3 Y change
Below – LACCD Average
LASC continues to be below the District average on this measure, but the college continues to improve at a faster rate than the District (7% and 1%, respectively, over three years on these measures).
• Continue to expand tutoring and supplemental instruction across disciplines on campus, especially in high enrollment classes with low success rates.
• Institutionalization of the Passage program, which is designed to improve completion and attainment of educational milestones among first-year students and men of color.
• Continue to support the Working Students Success Network program, which helps low-income students with families to reach economic stability and move up the economic ladder.
• Through the recently promised Community College Basic Skills and Student Outcomes Transformation Program Grant, develop and implement student-centered interventions and policies.
Increase the percentage of new student cohort successfully completing English 101 and Math 125 (or above) in 3 years and in 6 years by 5% and 10%, respectively.
6

Goal #2- College Analysis and Response
District Measure Strength or Challenge College Response Plans for Improvement Expected
Improvement(s) Measure 2.2.3 Completion rate (i.e., certificate, degree, or transfer) in 3 years and in 6 years
Improving
Moderate 3 Y Change
Above – LACCD Average
(1 measure)
Within a three year window, this measure has the college performing slightly above the District average. Within a six year window, however, the college trails the District average by an enormous amount. Three year comparisons show that the college continues to gain ground at a better rate than the District on these measures. Despite the preparedness issues, results in measures 2.1.1 through 2.2.3 show that the college is improving on these measures.
• Continue to expand tutoring and supplemental instruction across disciplines on campus, especially in high enrollment classes with low success rates.
• Institutionalization of the Passage program, which is designed to improve completion and attainment of educational milestones among first-year students and men of color.
• Continue to support the Working Students Success Network program, which helps low-income students with families to reach economic stability and move up the economic ladder.
• Through the recently promised Community College Basic Skills and Student Outcomes Transformation Program Grant, develop and implement student-centered interventions and policies.
Increase completion rates in 3 years and in 6 years by 5% and 10%, respectively.
7

IV. Institutional Efficiency- Comparison of College to District
Institutional Efficiency- College Analysis and Response District Measure Strength or
Challenge College Response Plans for Improvement Expected Improvement(s)
Average class size in credit classes
Challenge Enrollment priorities, brought on by SB1456 and Title V, have contributed to the reduction of class sizes. The enrollment management process has been rolled out but the process has not been evaluated and its effectiveness is currently unknown.
• Encourage timely submission of final grades so students can enroll in a failed course during a subsequent semester.
• Institute in-reach activities to encourage all eligible students to enroll in all semesters in which the college offers classes.
• Continue outreach activities to maximize average class size in credit classes.
• Evaluate the effectiveness of the enrollment management process and make improvements to increase average class size in credit classes.
Increase this measure to 36.5 within three years (align with District average)
Cost/FTES (annual) Challenge The annual Cost/FTES has increased by 1% over the last three years and by 4% from 2013 to 2014. Salary increases and other annual operating increases contributed to the increase in this measure, despite the college meeting a FTES growth target of 8%. K – 12, CCC, CSU, UC all have a higher Per-Student costs than LASC.
• Evaluate the effectiveness of the enrollment management process and make improvements to decrease the annual Cost/FTES.
Decrease this measure to $4,358 within three years (align with District average)
Institutional Efficiency 2012 2013 2014 2014 District
3 year change College
3 year change District
Average Class Size in Credit Classes 35.6 35.6 34.3 36.5 -4% -9%
Cost/FTES (annual) $5,009 $4,853 $5,057 $4,358 1% 5%
8