looking to the future: proactive wetland conservation planning
TRANSCRIPT
Looking to the Future: Proactive Wetland
Conservation Planning
New England Wetlands Program
Development Grant Webinar Series
March 12, 2015 2:30 – 4:00 PM

Welcome and Introductions (10 min.)
ID Restoration and Protection Opportunities (20 min.)
Brief Q&A (5 min.)
Potential for Tidal Marsh Migration (20 min.)
Brief Q&A (5 min.)
Discussion (30 min.)
Wrap-Up
Agenda


Kristen Puryear is an Ecologist with the Maine Natural Areas Program, within Maine’s Department of Agriculture, Conservation and Forestry. Her responsibilities include field inventories, ecological monitoring, conservation planning, and working with foresters and land managers of private and public lands. Recent projects have included the establishment of an invasive plant mapping and monitoring program in the State, vegetation team leader for the National Wetland Condition Assessment in Maine, technical support for the Maine Natural Resources Conservation Program, and the identification of wetland mitigation sites statewide. Kristen holds an MS in Plant Biology from the University of Vermont, and a BA in Geology-Archaeology from Bates College.
Today’s
Presenters
Kristen Puryear Ecologist, Maine Natural Areas Program

Identifying Wetland
Restoration and Protection
Opportunities in Maine
Kristen Puryear, Ecologist
Maine Natural Areas Program
Department of Agriculture, Conservation and Forestry

Maine Natural Areas Program
Our mission is to ensure the maintenance of Maine’s natural heritage for the benefit of present and future generations.
MNAP facilitates informed decision-making in:
conservation, natural resources management, and development planning.
We track the locations and status of: • Rare plant populations
• Rare and exemplary natural communities and ecosystems
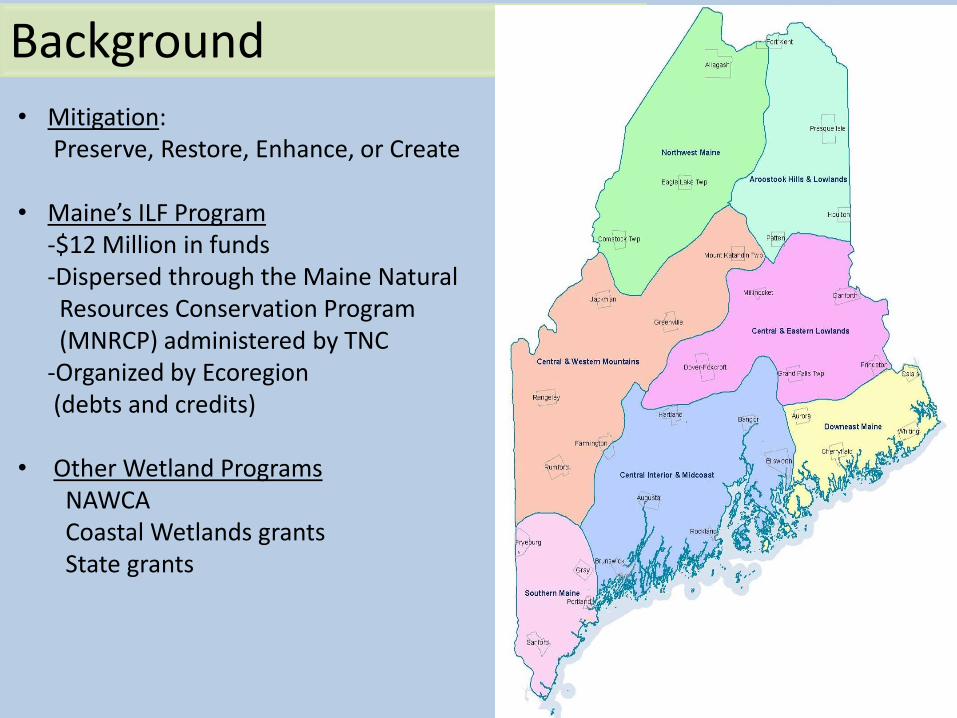
Background
• Mitigation: Preserve, Restore, Enhance, or Create • Maine’s ILF Program -$12 Million in funds -Dispersed through the Maine Natural Resources Conservation Program (MNRCP) administered by TNC -Organized by Ecoregion (debts and credits) • Other Wetland Programs NAWCA Coastal Wetlands grants State grants

Objectives
1. Identify potential mitigation sites through landscape analysis and outreach 2. Conduct field inventory and assessment of potential and proposed wetland mitigation project areas 3. Provide landowners and land managers with ecological assessments
4. Create and maintain “In Lieu Fee” database of potential & proposed sites 5. Provide technical support to MNRCP

Methods
Landscape Analysis - remote, quick, Level I survey approach - can be done with available statewide data - can identify intact wetlands and upland buffers with multiple ecological values …However… - highlights remote areas with little development pressure - limited ability to detect restoration or enhancement need

Methods
Landscape Analysis - Topographic maps and aerial photos - Conservation land and buffer - NWI, Streams, mapped vernal pools - Rare species and significant habitats - SWAP Focus Areas

Methods
Landscape Analysis - Topographic maps and aerial photos - Conservation land and buffer - NWI, Streams, mapped vernal pools - Rare species and significant habitats - SWAP Focus Areas - Barrier data, soils, disturbed wetlands (NWI modifier)

Methods
Outreach - Contact land trusts, towns, and state agencies - Request for “leads” - Gather local knowledge regarding conservation priorities and impaired wetlands - Focus on places where there is local and regional interest by landowners and land managers (= momentum)
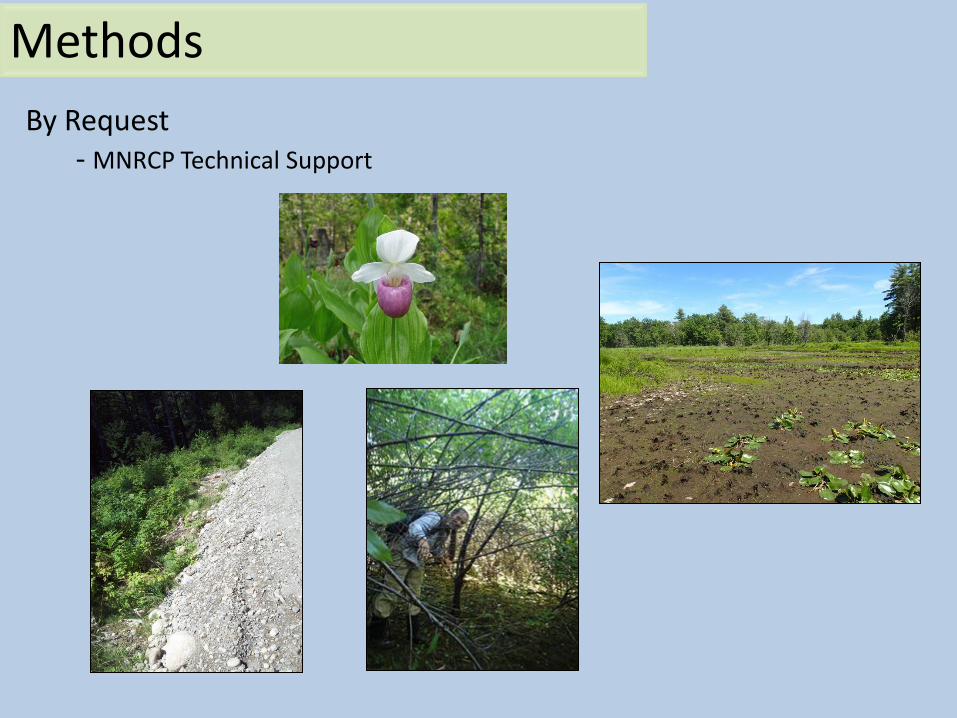
Methods
By Request - MNRCP Technical Support

Methods
1. Prioritize site visits 2. Request landowner permission 3. Conduct field survey
• Wetland types • Wetland functions and values • Rare plant and natural community survey • Invasive species • Other impairments
4. Summarize results 5. Maps and reports to landowners and/or applicant 6. Enter data in ILF database

Results
The Numbers:
Contacted: over 200 land trusts, town CCs, public land managers Responses: 70 different entities Site leads (from landscape analysis and outreach): 431 Field surveys: 150 sites Of the 150 Surveyed sites: Natural Resource Values Percent of Sites
Intersect SWAP Focus Areas 50%
Near Conservation Land 75%
Support rare species/NCs 44%
Intersect with Significant Wildlife Habitats 75%

Results

Results
32% of sites contained an impairment
0
5
10
15
20
25
30
Wetland Impairment by Type
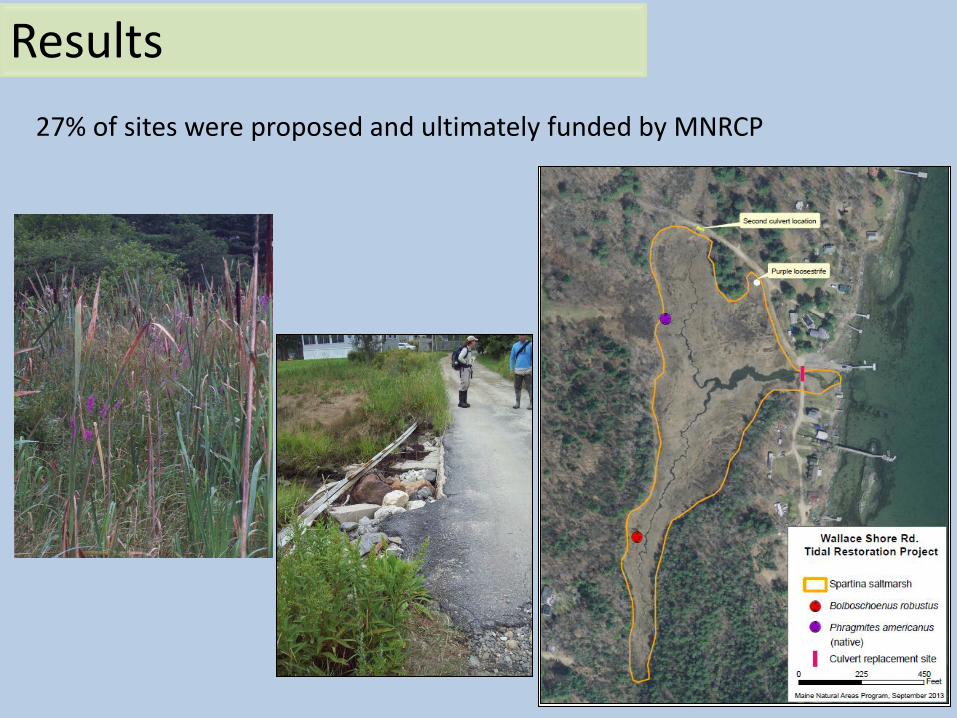
Results
27% of sites were proposed and ultimately funded by MNRCP

Outputs and Outcomes • Catalyzed projects and fueled momentum • Field surveys identified unique features, impairments, inform
management
• Increased field data on wetland resources, including rare plants and natural communities and wildlife habitats
• Database of potential and successful mitigation opportunities
• Technical support of MNRCP

Kristen Puryear (207) 287-8043
[email protected] www.maine.gov/dacf/mnap
For more information:
Thank you!

Today’s Presenters
Don Cameron, Botanist and Ecologist, Maine Natural Areas Program
Don Cameron is a Botanist and Ecologist with the Maine Natural Areas Program. Don’s responsibilities include surveying for rare and exemplary habitats throughout Maine, managing the state’s Official List of Threatened and Endangered Plants, monitoring federally listed plant species, and providing technical assistance for development and conservation planning. Recently, Don’s work has focused on a statewide assessment of subalpine fir forests, assessment of rare wetland types in northern Maine, and an investigation of the potential for tidal marsh migration based on projected sea level rise. Don holds an MS in Plant Ecology from the SUNY College of Environmental Science & Forestry.

Investigating the Potential for Tidal Marsh Migration
If sea level rises as projected where will marshes go?
Maine Natural Areas Program
Maine Geological Survey
Funded by:
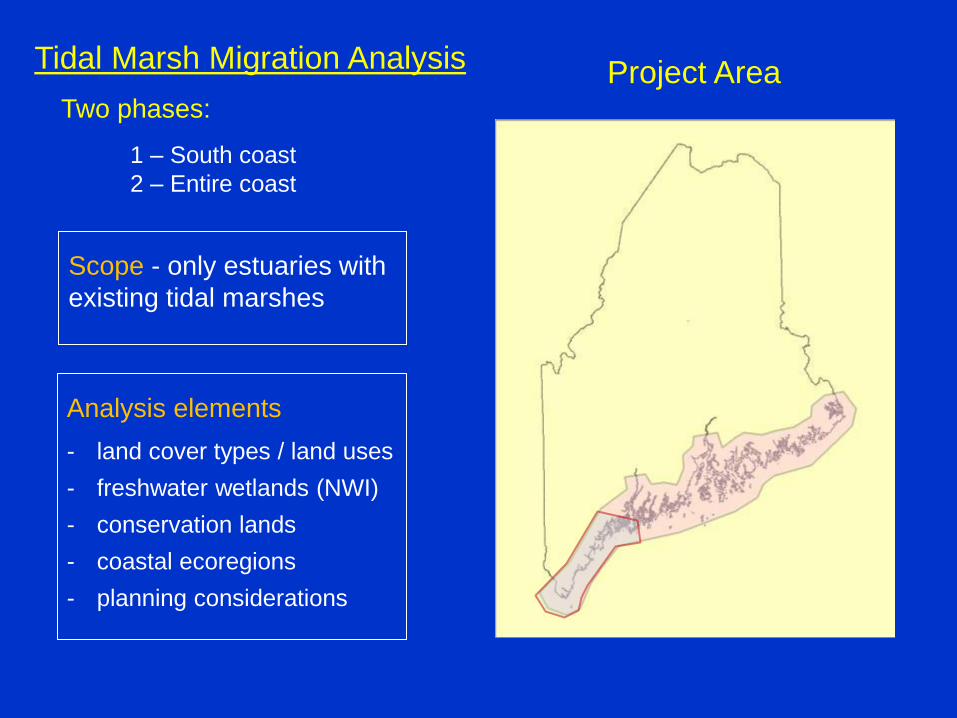
Project Area
Analysis elements
- land cover types / land uses
- freshwater wetlands (NWI)
- conservation lands
- coastal ecoregions
- planning considerations
Tidal Marsh Migration Analysis
Two phases:
1 – South coast
2 – Entire coast
Scope - only estuaries with
existing tidal marshes

Tidal Marsh Migration Project
Steps
1.Tidal marsh mapping
2.LiDAR ground truthing
3.Sea level rise simulations
4.Marsh migration analysis
5.Communicate results
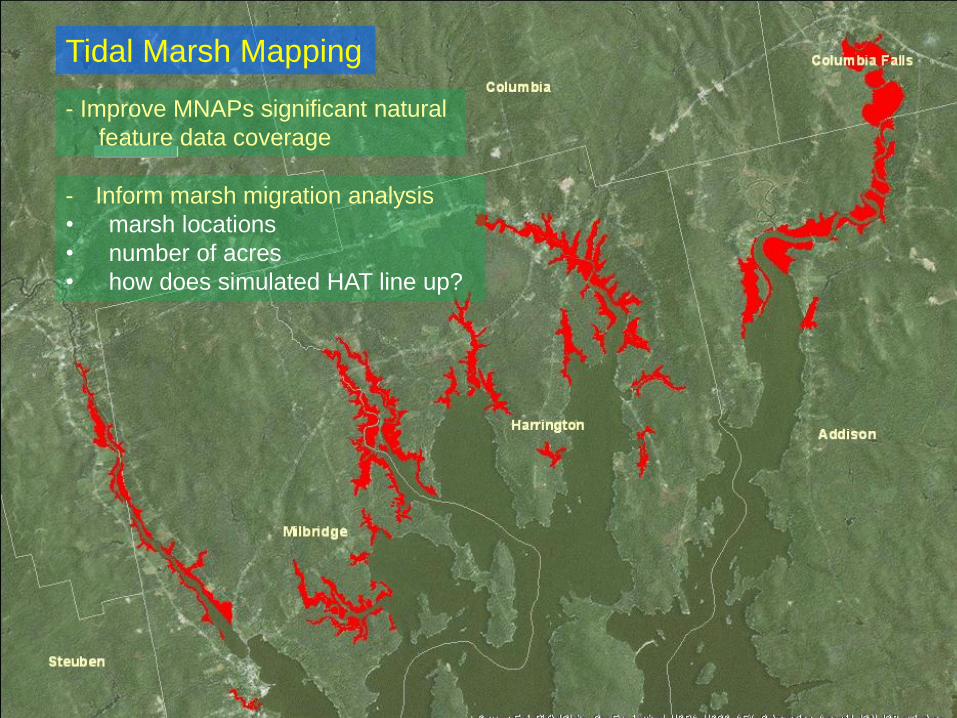
Tidal Marsh Mapping
- Improve MNAPs significant natural
feature data coverage
- Inform marsh migration analysis
• marsh locations
• number of acres
• how does simulated HAT line up?

- minimum mapping unit ~ 2.5 ac
- mapping was a combination
of ground truthing and GIS
imagery analysis
- Result = 22,408 acres mapped
in 170 estuaries

Step 2:
Groundtruth LiDAR
LiDAR available
for Phase 1

LiDAR Groundtruthing - Scarborough Marsh, near Old Neck Road
Vertical & horizontal
control point

Scarborough
Difference, m
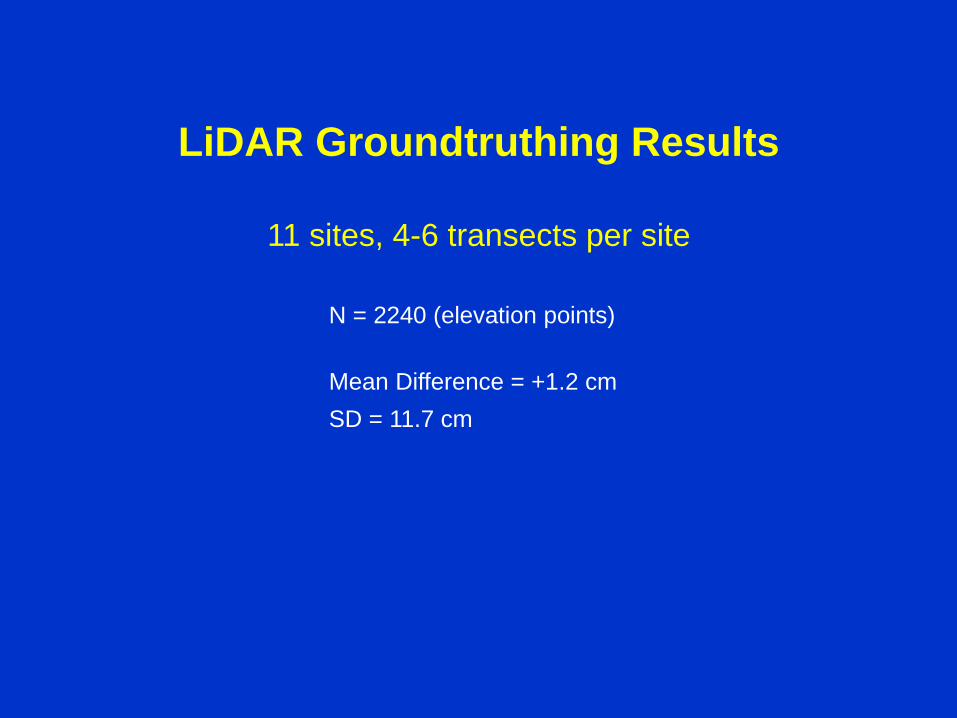
LiDAR Groundtruthing Results
11 sites, 4-6 transects per site
N = 2240 (elevation points)
Mean Difference = +1.2 cm
SD = 11.7 cm

Adapted from IPCC and Hugo Ahlenius, United Nations Environment Programme, 2007
http://maps.grida.no/go/graphic/projected-sea-level-rise-for-the-21st-century
1990 2000 2010 2020 2030 2040 2050 2060 2070 2080 2090 2100
0.0
0.2
0.4
0.6
0.8
Model projections,
including ice sheet
dynamic processes
(IPCC AR4)
Sea L
evel
Ris
e
(m)
IPC
C T
AR
(Th
ird A
ssessm
en
t) Pro
jectio
ns
Four Sea Level Rise Simulations
(1ft, 2ft, 3.3ft, & 6ft)
Pete Slovinsky, Maine Geological Survey 2015

Sea Level Rise Simulations - 1’, 2’, 3.3’, 6’
1 – create a model of highest annual tide (HAT) coastwide
- data from local tide stations was used to address wide tidal
variability, and was interpolated across a grid to assign values
to sections of the coast (MGS - Slovinsky, Hallstead).
2 – create 4 SLR simulations with HAT as starting point
- simulations are described as a bath tub model, only showing
what non-tidal areas will inundated at each SLR depth, and do
not address what may happen to existing marshes. SLAMM
(Sea Level Affecting Marshes Model) was not used due to a
lack of sedimentation data for most of the estuaries.

Use existing marshes to identify
potential migration areas
Assumption: marshes are most likely to
migrate in estuarine areas where they
already exist.
Step 4: Marsh migration analysis

Example result:
Hay Creek, Jonesport

Example result:
Hay Creek, Jonesport

Example result:
Hay Creek, Jonesport

Example result:
Hay Creek, Jonesport

Example result:
Hay Creek, Jonesport

What data is most relevant in
planning for tidal mash migration?

ME Landcover data (based on 2004 imagery)

Pixel
value Cover type
Developed 2 Developed, High Intensity (80-100% impervious)
3 Developed, Medium Intensity (50-79% impervious)
4 Developed, Low Intensity (21-49% impervious)
5 Developed, Open Space (developed areas, but 0-20% impervious - city parks, golf courses, baseball fields, etc.)
16 Road/Runway (impervious road or runway, but not in developed areas)
Agricultural 6 Cultivated Crop (production of annual crops such as corn, potatoes, strawberries, and tilled barren fields)
7 Pasture/Hay (grasses are major vegetation, managed for harvesting as hay or grazing)
Natural 8 Grassland/Herbaceous (unmanaged grasslands - rare in Maine)
9 Deciduous Forest (> 20% tree canopy cover, > 75% of trees are deciduous)
10 Evergreen Forest (> 20% tree canopy cover, > 75% of trees are evergreen)
11 Mixed Forest (> 20% tree canopy cover, 25-75% are deciduous)
12 Scrub/Shrub (woody vegetation < 5m tall is > 20% of cover - typically regenerating fields, cuts, or rights-of-way)
13 Wetland Forest (freshwater wetland with > 20% tree canopy cover)
15 Wetland (all other wetlands)
19 Unconsolidated Shore (rocky shore, mudflats, sand beach, exposed lake shoreline)
20 Bare Ground (open quarries and pits, granite outcrops and peaks)
21 Open Water (water bodies typically > 10m wide)
23 Recent Clearcut (forested area with > 90% canopy removal 2001-2004)
24 Light Partial Cut (forested area with 20-50% canopy removal 1995-2001)
25 Heavy Partial Cut (forested area with 50-100% canopy removal 1995-2001)
26 Regenerating Forest (forested area with canopy increase 1995-2001)
ME Landcover Categories

6ft SLR simulation
w/ 3 land cover classes

0
2000
4000
6000
8000
10000
12000
14000
16000
1ft 2ft 3ft 6ft
acre
s
SLR Simulation
Acreages for 4 SLR Simulations, Natural & Agricultural vs Developed Lands as per MELCD
Natural&Agricultural
Developed
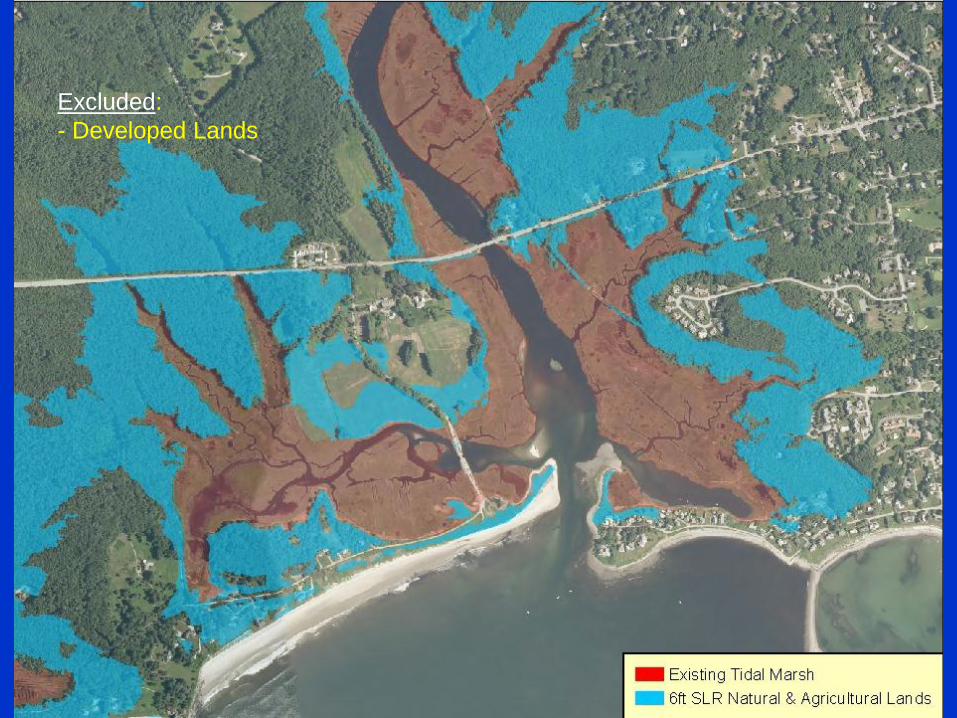
Excluded:
- Developed Lands


Excluded:
- Developed Lands
- Conservation Lands
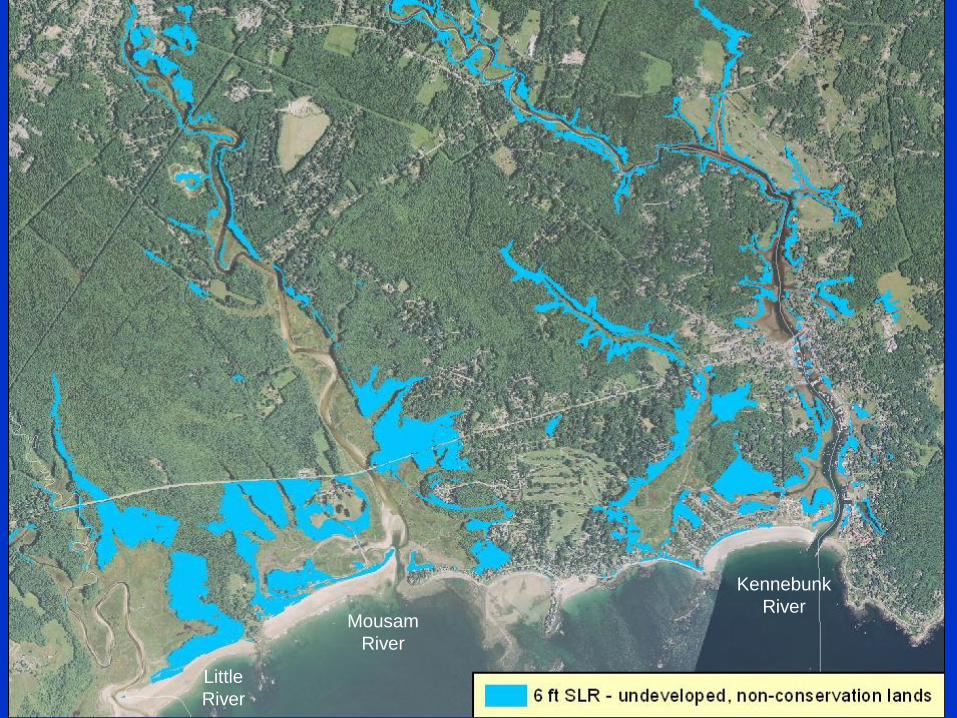
Kennebunk
River Mousam
River
Little
River
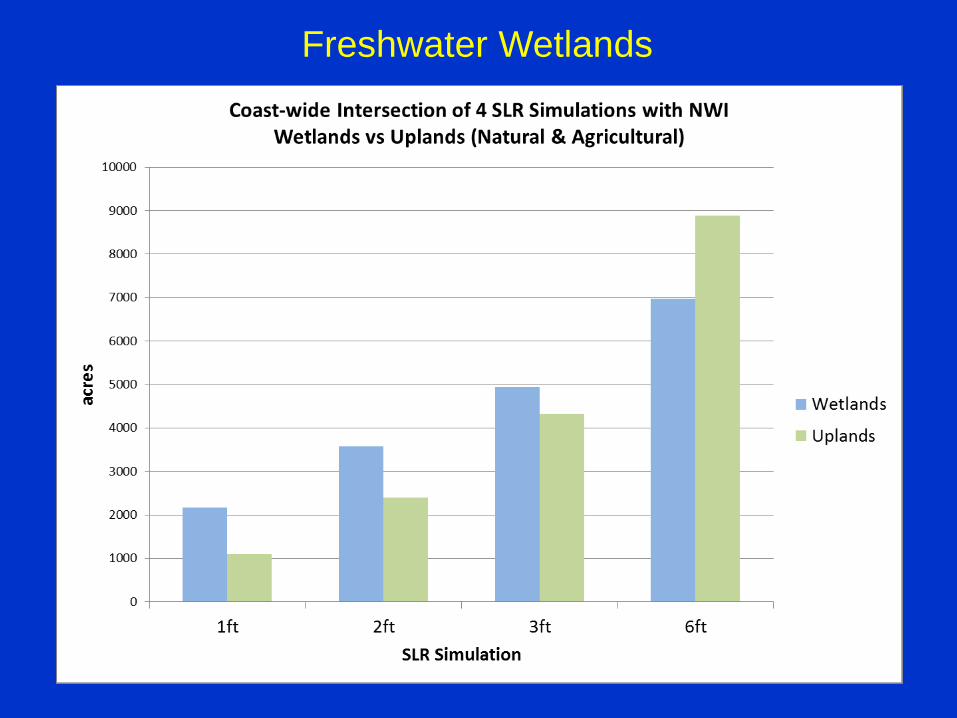
Freshwater Wetlands

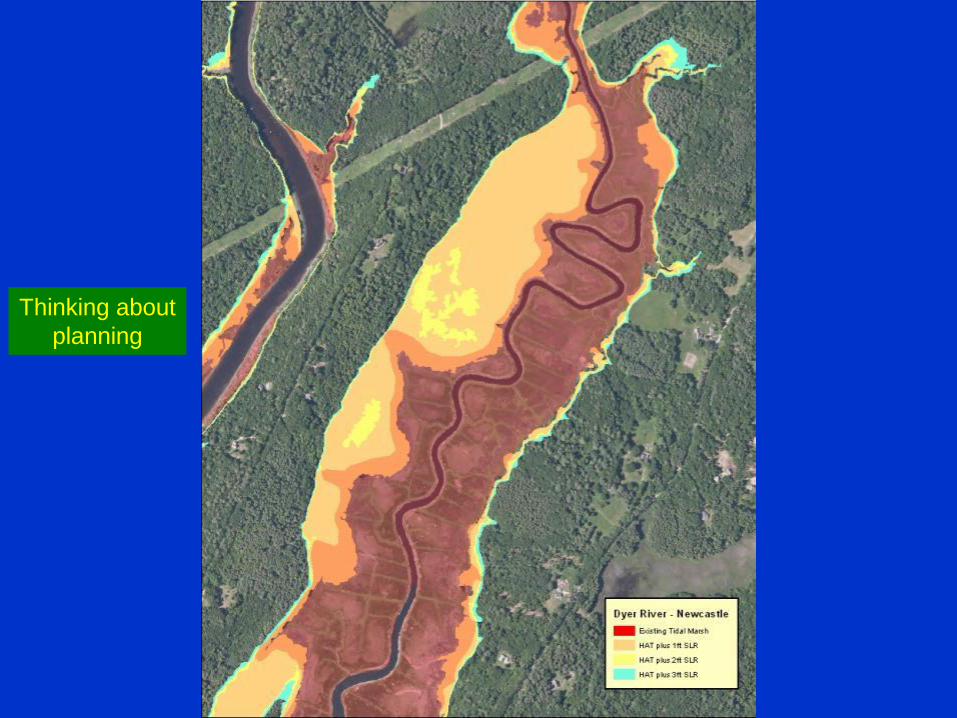
Thinking about
planning

Thinking about
planning

Thinking about
planning
steep
slopes
steep
slopes
Thinking about
planning

Planning:
- limited benefit
Thinking about
Planning:
steep slopes =
limited long
term benefit

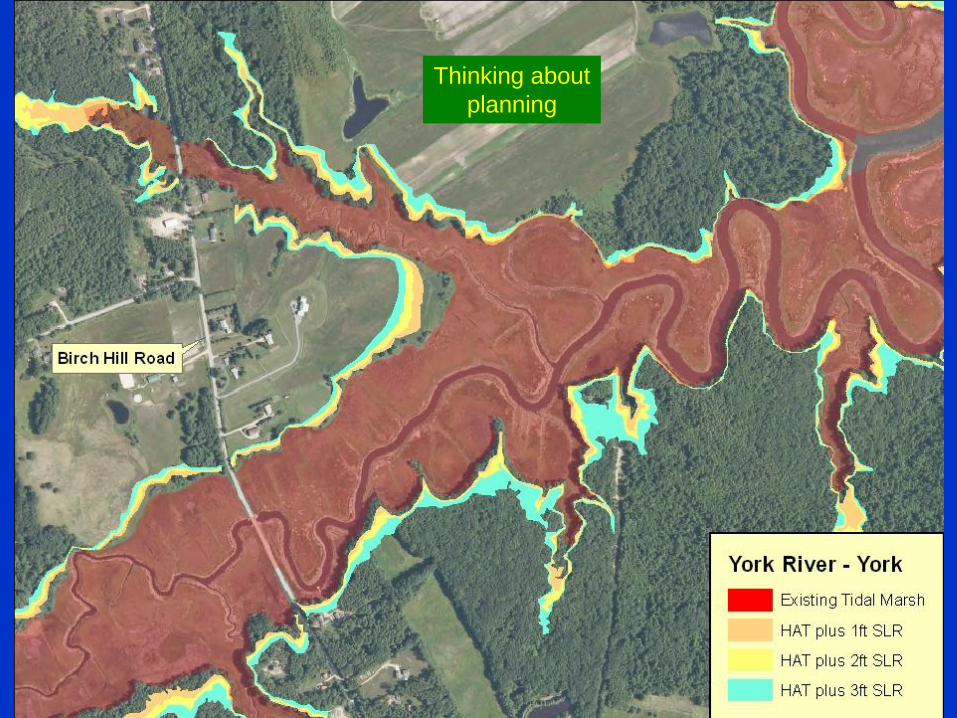
Thinking about
planning

Thinking about
planning

Thinking about
planning
Thinking about
planning

Thinking about
Planning:
increased benefit
longer term
Sea Level Rise simulations are now being used to:
• Assist coastal towns in planning and preparing for SLR impacts
• Inform conservation planning
• Assess vulnerability at Maine’s most popular State Parks
• Start identifying sites with high resilience to climate change
Funded by:
Step 5: Communicate results
• Results presented and shared with primary coastal conservation
programs including Rachel Carson NWR, TNC, MCHT, as well as to
reps from other orgs & agencies at several conferences

New England Wetlands Program Development Grant Webinar Series
Discussion

Thank you
Next Webinar: 2nd Thursdays – April 9, 2015
Next Call for Presenters to Follow
Questions and Comments? Kimberly Roth [email protected] 978-349-2525