looking over the horizon• -...
TRANSCRIPT

Regus plc Annual Report and Accounts 2015
Looking over the horizon•
Regus plc A
nnual Repo
rt and Acco
unts 2015

Clear global leader•
What’s inside
Strategic report
1 Performance highlights
2 Industry fundamentals
10 Our business model
12 Chairman’s statement
13 Chief Executive Officer’s review
16 Our strategic objectives and KPIs
18 Chief Financial Officer’s review
21 Risk management and principal risks
25 People
26 Corporate responsibility
Governance
28 Board of Directors
30 Corporate governance
36 Nomination Committee report
38 Audit Committee report
42 Directors’ Remuneration report
53 Directors’ report
54 Directors’ statements
Financial statements
55 Auditors’ report
56 Consolidated income statement
57 Consolidated statement of comprehensive income
58 Consolidated statement of changes in equity
59 Consolidated balance sheet
60 Consolidated statement of cash flows
61 Notes to the accounts
100 Parent company accounts
102 Segmental analysis
104 Post-tax cash return on net investment
105 Five-year summary
106 Shareholder information
For more information please visit www.regus.com
Regus is the world’s largest provider of flexible workspace solutions, with customers including some of the most successful entrepreneurs, individuals and multi-billion dollar corporations.
Through our range of office formats, as well as our growing mobile, virtual office, and workplace recovery businesses, we enable people and businesses to work where they want, when they want, how they want, and at a range of price points.
Founded in Brussels, Belgium, in 1989, Regus is based in Luxembourg and listed on the London Stock Exchange.
2,768workplaces
106countries
977cities
9,290colleagues
2.3mmembers

www.regus.com 1
Strategic report
Go
vernanceFinancial statem
ents
Key financial highlights Key growth highlights
• Group revenue increased 15.9% to £1,927.0m at constant currency
• Underlying operating profit increased 37% to £144.8m at constant currency
• Strong cash performance, with £215.7m (23.1p per share) of cash generated before net growth capital expenditure, dividends and disposal proceeds
• Increased returns on investment: 23.1% 2015 post-tax cash return on all investment made up to 31 December 2011
• Conservative balance sheet maintained. Net debt of £190.6m (0.66x net debt: EBITDA)
• 13% increase in full year dividend to 4.5p
Net growth capital expenditure (£m)
£215.7m 2,768 £284.9m
Cash flow before growth capital expenditure and dividends (£m)
Number of locations
2015 Post-tax cash return on net investment by year group (%)1
• 554 new locations added to the network
• 22% increase in the network
• £284.9m of net capital invested in growth
• Two new countries added – Iraq and Brunei – now in 106 countries
• 145 new towns and cities added in the year to strengthen our networks
• Now in 977 towns and cities
08 09 1410 1511 12 13
24.226.8
9.8
20.4 20.3
13.3
(8.0) (9.3)
11.2
07and
earlier
1514131211
284.9
206.6
260.2
147.8
71.2
1514131211
2,768
2,269
1,8311,411
1,203
1514131211
215.7
175.6
115.4112.497.7
Performance highlights
2015 – another year of substantial progress•
1. Turn to page 10 for details on how we calculate our post-tax cash return on net investment.

2 Regus plc Annual Report and Accounts 2015
Industry fundamentals
Flexible workspace – the market opportunities•
No limitsTechnology has stripped away the restrictions of time and place: the right workspace is whatever people need, when they need it.
Constant connectionsNo one is ever offline – colleagues and customers are always within range and within touch.
Network convenienceThe increasing availability of flexible spaces to work – offices, hotspots, hubs and more – is driving increased adoption by companies and people right across the world.
A fast-growing industry that is rapidly developing to serve customer needs. Workspace flexibility is becoming the new norm.
External factors enabling change
1.3 billion* people work on the move
* Source: Regus and IDC data
www.regus.com 3
Strategic report
Go
vernanceFinancial statem
ents
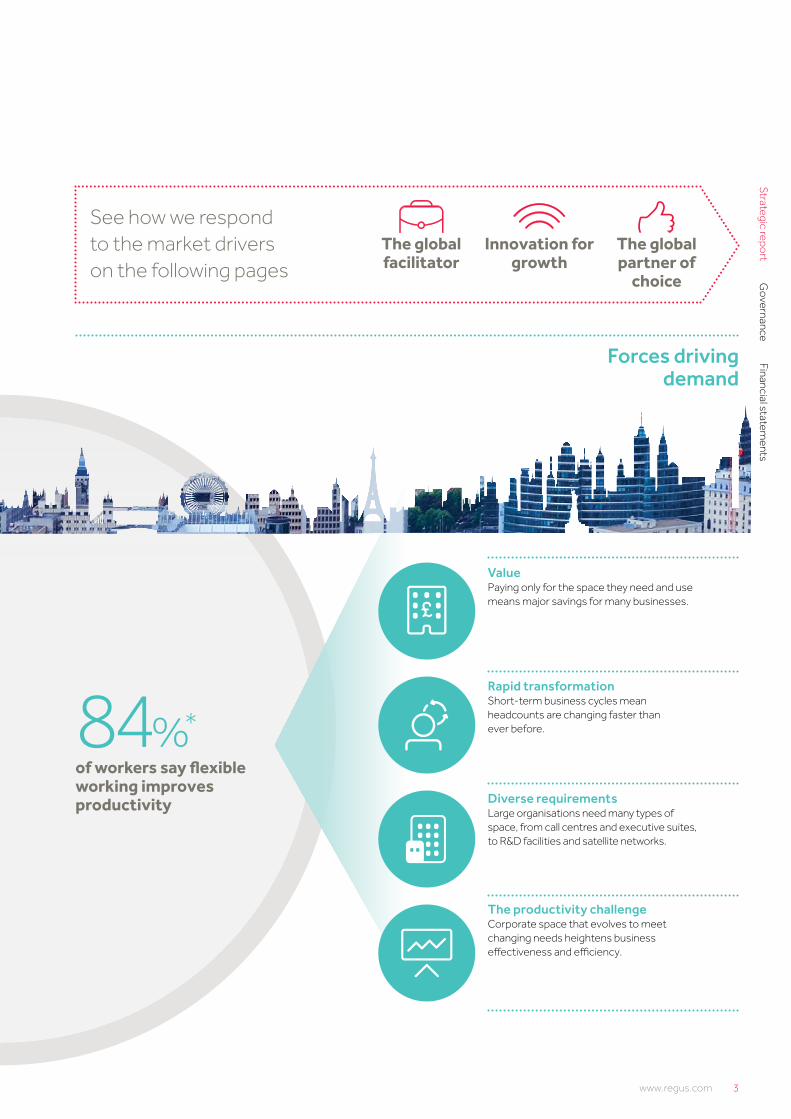
ValuePaying only for the space they need and use means major savings for many businesses.
Rapid transformationShort-term business cycles mean headcounts are changing faster than ever before.
Diverse requirementsLarge organisations need many types of space, from call centres and executive suites, to R&D facilities and satellite networks.
The productivity challengeCorporate space that evolves to meet changing needs heightens business effectiveness and efficiency.
Forces driving demand
See how we respond to the market drivers on the following pages
84%* of workers say flexible working improves productivity
Innovation for growth
The global facilitator
The global partner of
choice

Meeting market demand.
Office Workplace recovery Mobile Home
The global facilitator
The most flexible office and
co-working solutions in the world,
allowing people to work where, when, and how
they want.
Drop-in workplaces and technology services to help
people stay productive on
the move.
Virtual office solutions for home-based
workers, start-ups, and
established firms moving into
new markets.
Ensuring businesses
can continue in the event of disaster.
4 Regus plc Annual Report and Accounts 2015

Office Home
Virtual office solutions for home-based workers, start-ups, and established firms moving into new markets; ranging from prestigious business addresses, to telephone services, mail management, and access to over 2,000 business lounges.
The world’s most extensive networkRegus has 2,768 workplaces in 106 countries, serving customers ranging from single-person start-ups to global corporations. We offer the ability to work how you want, where you want, and at a range of price points. We see the potential for more than 20,000 locations globally in the long term.
• Flexibility
• Consistency
• Support
• Professionalism
• Flexibility
• Inspiration
• Community
• Creative workstyle
• Value
• Ease
• Functional
• Convenience
• Convenience
• Professionalism
• Productivity
• Mobility
• Business support
• Inspiration
• Connections
• Funding
• Exclusivity
• Privacy
• Luxury
• Status
Offering a range of formatsWe are seeing a generational shift in what people want from their workspace, meaning different customers require different solutions. Our growing range of formats enables us to deliver a working environment that matches the needs of each customer.
Drop-in workplaces and technology services to help people stay productive on the move, giving users access to over 2,000 locations in 977 cities through our advanced web and mobile booking system, as well as 18m wi-fi hotspots.
Mobile
Ensuring business continuity in the event of a disaster through access to our international network of business centres and 24/7 support from our dedicated operations team. Our Dynamic recovery product guarantees local recovery in the optimal locations based upon the type of disaster.
Workplace recovery
www.regus.com 5
Strategic report
Go
vernanceFinancial statem
ents

We invest significantly in innovation every year.
Businesses large and small pick Regus because of our understanding
of how to set up global technology networks and provide services that help them
work more efficiently.
Innovation for growth
6 Regus plc Annual Report and Accounts 2015

MarketplaceAn online trading platform that allows our customers to promote services to each other, as well as giving them access to specially curated offers from our partners around the world
Access controlCloud-based electronic access control that simplifies lock and key administration, while providing customers with mobile app convenience and improved control over their workspace
Client appAn easy to use client self-service application that allows individuals, corporates and enterprises to find locations, book rooms, access benefits and facilitate administration
Cloud communicationsIntegrated audio, video, and web-based communications, allowing customers to make and take office calls wherever they are and whenever they want on the device of their choice
www.regus.com 7
Strategic report
Go
vernanceFinancial statem
ents

“Regus allows us to mobilise very quickly in new markets...
a quick call to Regus and we’re good to go.”
Our scale, range of formats, products and service offering mean we are the only
global player equipped to offer businesses the full range of office space they need.
The global partner of choice
8 Regus plc Annual Report and Accounts 2015

Regus allows us to mobilise very quickly in new markets. It certainly helps us with new business initiatives, popping up very quickly in cities across the US – a quick call to Regus and we’re good to go.”Anthony Smith, Director, Real Estate and Workplace Services, Asia Pacific, Google
When I first saw Spaces, I noticed the light and the room – there’s so much here, which is really hard to find in central London. Everybody seems lively and happy here, positive and excited about the future.”Leonora Ross-Skinner, Exponential
We particularly enjoy a fantastic relationship with our Regus Account Director. Great relationships, flexibility, listening to requirements, coming to the table with suggestions and ideas – these factors all make me want to stay with the company.”Chris Spratt, Director of Property and Facilities, Michael Page
It’s about break-out space, where we can be innovative. The first-floor space here (Spaces, Oxford Street, London) is great for that – somewhere people can go to have a conversation that’s not structured, a casual conversation that tends to be where the magic happens.”Chris Bailey-Jones, Moneysupermarket.com
www.regus.com 9
Strategic report
Go
vernanceFinancial statem
ents

Our business model
How we create value•
Once again, our progress in 2015 has justified our confidence in the Regus business model. Rigorous planning, stress-testing and constant review clearly demonstrate that it remains fit for purpose.
Our business
Customers Returns
Our business comprises four fundamental elements: our people, our network, our products and our brands. The geographic scale of Regus‘ operations is unmatched. Critically, as our physical network grows, so does our lead over other workspace alternatives.
These elements are underpinned by:
• rigorous planning processes to support the execution of our growth strategy;
• constant investment in innovation to differentiate Regus from all competitors; and
• disciplined management procedures to minimise the risks inherent in rapid growth.
Customers – from self-employed entrepreneurs to multinational corporations – use Regus because they want to be in the best places where they can focus on what they are doing. They stay because we provide them with an excellent service at competitive rates, with a product that flexes to meet their every requirement. Demand continues to increase – during 2015, membership grew to over 2.3m worldwide.
Our approach to investment ensures we deliver strong post-tax cash returns, generating long-term shareholder value through returns on investment that are well in excess of our cost of capital.
Our focus is on optimising revenue generation through improving the performance of each location. This gives us the solid foundation we need to deliver strong returns, particularly when combined with our discipline on overhead costs, which continue to fall as a percentage of revenues.
How we calculate our returns These returns are based on the post-tax return divided by the net growth capital investment.
Post-tax cash return = EBITDA less amortisation of partner contribution, less tax based on EBIT, less maintenance capital expenditure.
Net growth capital investment = growth capital less partner contributions.
9,290colleagues
2.3m members
10 Regus plc Annual Report and Accounts 2015
2015 Post-tax cash return on net investment by year group (%)1
08 09 1410 1511 12 13
24.226.8
9.8
20.4 20.3
13.3
(8.0) (9.3)
11.2
07and
earlier
1. Turn to page 104 to see how our calculation of post-tax cash return on net investment reconciles to our audited statutory accounts.

Cash flow before growth capital expenditure and dividends (£m)
1514131211
215.7
175.6
115.4112.497.7
1514131211
4.54.0
3.63.2
2.9
FinalInterim
Dividend per share (p) £284.9million net growth capital expenditure
Investment in growth
A particularly attractive feature of the Regus business model is our strong conversion of profit into cash. The cash flows we generate from our locations support a significant proportion of our continued investment in developing our network. Strong cash generation underpins the Group’s progressive dividend as well as funding the addition of locations to our network.
We invest significant sums in growth, both through organic openings and selective acquisitions, and we continue to find many high-quality opportunities that meet our stringent returns criteria. Our network growth is enhanced by our continued investment in developing new location formats and a greater diversity in partner relationships. Together, these are enabling us to grow in a more capital-efficient way.
Our ability to adapt our growth plans to reflect changing market conditions is another important aspect of our capability to manage risk through the economic cycle. With relatively short lead times between contracting with a partner and opening a new location, depending on where we are in the economic cycle we can either rapidly capitalise on a favourable investment environment, or restrict growth.
We have a progressive dividend policy. 2015 dividend increased by 13%.
Cash
Returns to shareholders
www.regus.com 11
Strategic report
Go
vernanceFinancial statem
ents

12 Regus plc Annual Report and Accounts 2015
I would like to thank our former CFO, Dominique Yates, for his contribution to Regus. He leaves us with our balance sheet and financial returns looking strong after a period of significant expansion. I would also like to thank Alex Sulkowski, who retired from the Board in May 2015, for his contribution to the Board and Group.
An external evaluation of the performance of the Board was carried out during the year by an independent leadership consultancy. The results of the review have been incorporated into our efforts to continuously improve the processes and effectiveness of the Board.
Our peopleEvery year, our success is attributable to the energy, commitment and skills of our people in all the markets where we operate and at every level of the organisation. Once again, I would like to thank them on behalf of the Board for their outstanding contribution, delivering another strong set of results for the benefit of our customers, our business and our investors.
DividendWe remain committed to a sustainable and progressive dividend policy. I am therefore pleased to announce that the Board is recommending a 13% increase in the final dividend to 3.1p per share, reflecting the continued strong performance of the business. Subject to the approval of shareholders at the 2015 AGM, this will be paid on 27 May 2016 to shareholders on the register at the close of business on 29 April 2016. The full year dividend is 4.5p (2014: 4.0p), an increase of 13%.
Douglas Sutherland
Chairman
1 March 2016
Chairman’s statement
Another year of substantial development•
The Group has completed another year of successfully implementing its strategy as evidenced by delivering both strong results and growth. We continue to significantly expand the network with convenient locations and innovative formats for our customers, while maintaining attractive financial returns.Douglas Sutherland
Chairman
During the period, Group revenues grew to £1,927.0m (2014: £1,676.1m), representing an increase of 15.9% at constant currency (up 15.0% at actual rates). Notwithstanding the significant growth in the network, underlying operating profit advanced 37% at constant currency to £144.8m (2014: £104.3m), up 39% at actual rates. Including the non-recurring gain of £15.3m, our reported statutory operating profit was £160.1m, an increase of 51% at constant currency.
This strong performance has been delivered whilst adding 554 new locations to our network and continuing to drive operating efficiency, with overheads as a percentage of revenue reducing by a further two percentage points. Our strong cash generation and disciplined approach to investment in growth have also enabled the Group to maintain a robust and conservative capital structure.
Rigorous risk managementWe continue to take a rigorous approach to risk management across every aspect of our business. A good illustration of this is the process we go through to ensure that our new locations deliver the challenging financial returns that we seek. Every single locality goes through a detailed process before approval, comparing its anticipated performance against what is being achieved in comparable locations, the competitive environment and considering the maximum cash outlay and downside risk just as much as upside potential and returns.
Our investment in growth is kept under constant review and can be curtailed within a short period if market conditions dictate. Over time, we are taking an increasingly capital-light approach to investment, in which we will increasingly become the facilitator between the property investor and the end customer, with the aim of further improving margins and reducing risk.
Board updateWe welcomed Dominik de Daniel, our new CFO and COO, to our international management team and Board in November 2015 and look forward to his input as we continue to deliver on our growth ambitions. He is a proven and capable leader who brings very relevant experience to Regus’ finance and operations teams.
In May 2015 we welcomed François Pauly to the Board as a new Independent Non-Executive Director. François’ extensive executive and board experience along with his international business knowledge is already contributing to the continued strategic development of Regus.

www.regus.com 13
Strategic report
Go
vernanceFinancial statem
entsChief Executive Officer’s review
A high-growth business•
2015 has been another successful year for Regus. We have continued to see powerful structural growth drivers in our market. More and more organisations and individuals are reassessing their approach to physical workspace and how they work. These positive dynamics have seen our business deliver strong underlying progress; strategically, operationally, and financially. We have added more locations to our market-leading network than ever before, generated attractive returns on our investments and significantly increased our profit through further operational efficiency.
Strong financial performanceThe post-tax cash return on net growth capital expenditure achieved from locations opened on or before 31 December 2011 was 23.1%, an improvement on the returns for the same estate in 2014 of 20.9% and a level well above our cost of capital. The 2015 post-tax cash return on investment from locations opened on or before 31 December 2012 was 21.5% (2014: 18.0%).
Group revenue increased by 15.9% at constant currency to £1,927.0m (2014: £1676.1m) (15.0% at actual rates). Underlying operating profit, before the net non-recurring gain of £15.3m, increased to £144.8m, up 37% at constant currency (39% at actual rates). Including the non-recurring gain, our statutory operating profit increased
51% at constant currency to £160.1m (up 54% at actual rates).
We invested £284.9m in net growth capital expenditure during the year, adding a further 554 new openings to the network, which stood at 2,768 locations at the end of the year.
We generated an increased gross margin of 28.3% on all our locations that were open on or before 31 December 2012 and also improved the gross margin on those locations that were added to the network during 2013 and 2014, both of which were material years of growth and consequently represent an increasingly significant element of our overall revenue. The initial performance of the locations added to the network during 2015 is in line with our expectations, albeit these are still at an early stage of progression towards financial maturity.
Through detailed planning and strengthening our controls and processes, we have delivered improved operational effectiveness of our business, with a further reduction in overheads as a percentage of revenues. Total Group overheads were up only 2% at constant currency compared to a 22% increase in the size of our network. As a result, total overheads as a percentage of revenues further reduced from 16.7% to 14.7%.
Cash conversion remains a strong feature of our business model. Cash generated before investment in growth, dividends and share repurchases, and excluding the £80m net proceeds arising from the disposal of various portfolios of property assets in the first quarter, increased 23% to £215.7m (2014: £175.6m). After taking the net growth capital expenditure of £284.9m and disposal proceeds into account, and after paying dividends of £38.8m and spending approximately £32.0m buying our own shares, Group net debt increased from £138.0m at 31 December 2014 to £190.6m at 31 December 2015. This represents a Group net debt : EBITDA leverage ratio of 0.66 times, which is well below our internal 1.5 times limit and reflects our continued prudent approach to the Group’s capital structure.
AmericasOur Americas business achieved a good performance and is a key growth region in absolute terms. In total we had 1,140 locations in the region at the end of December 2015. On a like-for-like basis mature revenues increased 3.9% at constant currency to £712.1m (up 7.9% at actual rates) with an average mature occupancy of 83.0% (2014: 79.1%). During the year we added 180 locations to the Americas network, expanding the business into more parts of the region. This expansion increased the average number of available workstations from 131,665 to 149,414, with a total of 165,464 at the period end.
In the Americas, the USA is our predominant market. It has performed well and we have made good progress expanding into secondary and tertiary markets on variable lease deals and increasing the range of price points by expanding the number of formats being offered. Mexico has remained a good market and after recent economic issues we have seen an improvement in our business in Brazil.
EMEAThe reported revenues of our EMEA business have been impacted by the appreciation of sterling against the euro. Mature revenues on a constant currency basis increased 5.5% to £321.2m but were down 5.8% at actual rates. Occupancy on the Mature business increased from 77.6% to 79.4%. During 2015 we added 183 new locations, taking the total number of locations to 736, and added Iraq to the network. The average number of workstations increased from 61,274 to 77,901. At period end we had 82,491 workstations.
We have experienced strong growth in the incredibly diverse region of the Middle East and Africa. In Europe, across the many countries in which we operate, there has been a mixture of performance, but the overall result has been good. We have experienced an improved performance in Spain, whereas Russia has been a difficult market requiring the renegotiation of rental
An excellent year in the development of our business. Our financial results are strong and we remain in robust financial health. We continue to find attractive opportunities to build out our global network and service the structural changes in the world of work.Mark Dixon
Chief Executive Officer
On a regional basis, mature* revenues and contribution can be analysed as follows:
£mRevenue Contribution Mature gross margin (%)
2015 2014 2015 2014 2015 2014
Americas 712.1 660.1 189.0 157.3 26.5% 23.8%EMEA 321.2 341.0 89.6 83.2 27.9% 24.4%Asia Pacific 239.1 230.6 68.7 64.9 28.7% 28.1%UK 352.9 340.2 86.8 81.0 24.6% 23.8%Other 2.9 0.6 1.0 0.2 Total 1,628.2 1,572.5 435.1 386.6 26.7% 24.6%
* Centres open on or before 31 December 2013.

14 Regus plc Annual Report and Accounts 2015
agreements. These challenging conditions also provided opportunities and we have seen an increase in share-of-profit deals.
Asia PacificOur Asia Pacific business continues to move forward and has been our fastest growth region overall, with 146 new locations being added including our first centre in Brunei. In total we had 545 locations in the region. Mature revenues increased 3.9% to £239.1m at constant currency (up 3.7% at actual rates) with an average mature occupancy of 85.4% (2014: 78.9%) driven by growth in lower relative REVPOW markets. The average number of workstations increased from 58,911 to 78,571. At the end of the period we had 91,887 workstations, making it our second largest region.
There remains ample opportunity for growth in Asia Pacific both from building out in existing countries and adding new ones, like Brunei. We have continued to expand our business in China, which has not experienced any impact from the recent economic slowdown. We remain watchful however, and look to drive growth in secondary and tertiary areas using capital-light deals.
UKOur UK business has delivered a good performance. Mature revenues advanced 3.7% to £352.9m with mature occupancy at 81.1% (2014: 83.7%). With growth in the UK in recent years driven primarily through acquisitions, which started to feed into the Mature business in 2015, this is a good revenue improvement. The number of occupied workstations has remained very stable, but during 2015 expansions
our competitors in our speed of expansion, increasing operational efficiency and the relevance and quality of our service offering.
As part of our investment case we are constantly striving to improve our business and future potential returns. Whilst this is an ongoing process, we have recently implemented two important changes.
We have changed the field structure to introduce a clustering approach to the local management of locations. This has improved the cost structure of the business going forward and will lead to higher productivity. With the in-field selling resource now focused on a specific number of locations, we believe this will better promote the active marketing of the whole range of what is offered by the entire cluster, including format and price point. So, as well as improving operational leverage, this structural change also has the potential to deliver incremental revenues.
The other important change we have implemented is to improve the compensation basis for location managers. Under the previous system bonuses consisted primarily of sales commissions. This has now been replaced by a quarterly profit share bonus scheme that better aligns rewards within the business with the interests of our shareholders. We have, however, retained the requirement to improve customer service, as measured by a Net Promoter Score, and reward export sales to locations outside of the manager’s cluster.
Today, our return on investment is highly attractive, our cash flow is strong, and we have a proven, successful growth story that has seen us significantly develop our network over the past two years while continuing to deliver consistently strong returns. 2015 saw us hit many key milestones, as we added a record 554 locations across the world to bring the total space under our management to over 46 million square feet, entered Brunei, our 106th national market, celebrated 20 years in China and 10 in India, opened our 500th centre in Asia Pacific and our 1,000th centre in North America (United States and Canada).
We continued to differentiate our proposition, with the launch of services and benefits including the new Spaces (targeting creative workers) and Signature workspace formats, the continued growth of Regus Express in more airports, railway stations and shopping malls around the world, access to 18 million Wi-Fi hotspots and 800 airside lounges and our new community app. Importantly, we
Chief Executive Officer’s review continued
increased the available inventory in the Mature business by 3%, which largely accounts for the occupancy reduction. During 2015, 45 new locations were added in the UK taking the total number of locations to 347. We are now seeing more growth in regional locations in the UK to complement our presence in the major cities. Total average workstations increased from 60,037 to 65,721 with 70,956 at the year-end.
We also opened our first co-working Spaces location in Oxford Street. After only six months this has proved a popular format and location and has achieved strong occupancy and good margins.
Market context2015 was a very significant year in the development of Regus. The change we have seen over the past two years has been remarkable, as an increasing number of businesses – from large corporations to entrepreneurial start-ups – have come to recognise the power of flexible workspace in helping them maximise the positive impact of new technologies and transform performance.
Increasing awareness of our industry, coupled with shortening company and project lifecycles, is leading customers to distribute their workforces and service their customers in new ways that drive efficiency and reduced costs.
Our investment caseWe are the number one player in a fast-growing global market. Our strategy addresses the clear structural growth drivers in the market. We have detailed, stress-tested plans for extending our leadership across the world, outperforming
Our investment caseMarket leader – No 1 player in highly
fragmented market
Structurally growing demand
Attractive returns on investment and cash flow
Proven ability to manage growth
Significant runway for growth with expected incremental post tax cash returns of at least 20%
Prudent management of capital structure

www.regus.com 15
Strategic report
Go
vernanceFinancial statem
ents
strengthened our business with the appointment of senior executives to bring additional energy, experience and intellect to our leadership teams.
Strategic directionDespite our existing market leadership we have scope for significant growth. Our future is therefore about realising that potential, both in larger markets like China, India and the US, where we see the potential for a combined total of over 9,500 locations (up from over 1,000 today), and in our most developed networks, such as the UK where we have 347 locations and see significant scope for further expansion.
In doing so, we want to ensure that we can provide a solution for customers with every potential budget. We are focused on capturing the growth opportunity we have and realising the potential of the business, thereby generating significant value for shareholders as we move towards a potential 20,000 locations. Effective planning, strong partnerships and product innovation will be the key factors in attaining this goal.
PlanningBusiness planning is critical as we go forwards. The simpler our business is to operate, ensuring that our people can get it right 100 per cent of the time, the more efficiently we can roll it out. As we enter the next stage of growth, we have developed
a more sophisticated approach to planning, while keeping it simple, effective and fully aligned with our business goals.
Today, planning at Regus revolves entirely around defining and meeting customer needs through factors such as format, service portfolio and price point. Our approach is therefore structured, transparent, focused on the detail and planned at every level. As a result, we understand what we want to achieve, the risks involved and how to mitigate those risks.
PartnershipsAdding 554 locations during 2015 involved opening more than two every working day throughout the year. This is why we are further industrialising our approach to growth while keeping a very firm hand on risk.
We already have a very successful growth story. By changing the mix of formats, segments, markets and models and by streamlining our methodology through careful planning and automation within a new network of shared service centres, we can grow in a far more capital-efficient way. Increasingly, by partnering more with the companies that own and fund real estate, we bring together investors in property and our fast-growing global customer base and continue to generate attractive returns on our investments.
Products and innovationOur business is based on the understanding that physical space needs to keep up with changes in technology. For this reason, we have invested a substantial amount in R&D during the past three years, building a world-class technical infrastructure and an array of apps and services.
We will also continue to add to our line-up of formats that deliver a bespoke workspace environment to different parts of the addressable market, including the Spaces, Signature Group, OpenOffice, KORA and Express formats.
Taking this approach means that we can support any organisation’s office needs, anywhere in the world. We provide a truly global and fast-growing network, with the right offer at the right price, in which it is easy to buy space for as little as a few hours or for several years. As part of this, we make best-of-breed products and services easily accessible to every member of the workforce, wherever they are and whatever their requirements.
As we move ahead, we will have partnerships and alliances in place, building on those we already have with the likes of Microsoft, Google and Polycom, to bring customers those things that they cannot get for themselves. We will help customers become more productive, faster than ever before. In addition, we will increasingly provide the means for them to extract added value from their relationship with Regus, by collaborating, promoting their products and services to one another and participating in shared communities.
2016 outlook We remain confident in our business model and the long-term structural drivers of our industry. We will continue to invest to increase our levels of customer service, make our business relevant to a wider market, drive greater operational efficiency and deliver long-term shareholder value. We will continue to adhere to our strict financial criteria in executing our growth plans and remain suitably vigilant given the current global macroeconomic uncertainty, with flexibility in both our expansion plans and our cost base. Current trading is in line with management’s expectations and we remain confident in our prospects for 2016.
Mark Dixon
Chief Executive Officer
1 March 2016
Group income statement
£m 2015 2014
% Change (actual
currency)
% Change (constant currency)
Revenue 1,927.0 1,676.1 15.0% 15.9%Gross profit (centre contribution) 428.4 383.1 12% 12%Overheads (inc. R&D) (283.9) (279.6) 2% 2%Underlying operating profit* 144.8 104.3 39% 37%Non-recurring items 15.3 – – –Operating profit 160.1 104.3 54% 51%Underlying profit before tax 130.4 87.1 50% 46%Profit before tax 145.7 87.1 67% 63%Underlying taxation (25.9) (17.2)Taxation (25.8) (17.2)Underlying profit for the period 104.5 69.9 50% 43%Profit for the period 119.9 69.9 72% 64%Underlying EBITDA 290.0 224.8 29% 28%EBITDA 305.3 224.8 36% 34%
* After contribution from joint ventures
Gross marginRevenue £m Gross margin %2015 2014 2015 2014
Mature 12 1,301.3 1,289.0 28.3% 27.8%New 13 326.9 283.5 20.6% 9.8%New 14 169.2 62.0 4.2% (9.4)%Pre-15 1,797.4 1,634.5 24.6% 23.3%New 151 118.7 – (11.4)% –Group (including closures) 1,927.0 1,676.1 22.2% 22.9%
1 New 15 includes any cost incurred in 2015 for centres which will open in 2016.

16 Regus plc Annual Report and Accounts 2015
Our strategic objectives and key performance indicators
Our strategy is clear and simple•
Revenue growth achieved through the addition of new locations, the development of incremental revenue streams and active management of the existing network to drive efficiency, contributes to improvements in gross profit. Combined with strong overhead cost control, this drives operating profit and cash flow, generating strong returns on investment well ahead of the Group’s cost of capital.
Growth is demand-led as we respond to customers looking to outsource more of their workplace needs and/or benefit from the flexibility and convenience we provide. By expanding our networks and developing our growing range of formats, we expand our addressable audience and provide our existing customers with additional convenience. It is important to remember that our locations perform well in their own right and that the network then provides incremental opportunities.
We continue to be mindful of growing only in locations where the potential investment opportunity meets our stringent returns criteria.
We are also focused on increased partnering and using more capital-efficient ways of expanding the network.
Delivering attractive,
sustainable returns
Controlling costs
Developing national
networks
Industry- leading
innovation
Innovation is core to Regus’ strategy and allows us to maintain our market-leading position and customer service. We invest in R&D to ensure we stay on top of (and even help shape) trends, by developing location formats, products and services that meet our customers’ needs and help them work more conveniently, efficiently and effectively. New product development provides existing customers with additional reasons to use Regus and also opens up new revenue opportunities.
Cost control is achieved through operational excellence and the significant economies of scale and operational leverage that network growth brings.
Strategic objectives and KPIs Our approach
We seek to leverage our scale and unique position to provide customers with convenient and innovative work environments, while delivering attractive and sustainable returns to our investors.
£

www.regus.com 17
Strategic report
Go
vernanceFinancial statem
ents
Key performance indicators How we did Future ambitions and risks
Delivering profitable growth and strong, sustainable returns is central to creating future shareholder value. Regus is committed to delivering these returns by optimising revenue development and controlling costs. Our post-2011 investments are progressing as expected.
We will continue to add breadth and convenience to the network through further measured investment in high-quality assets, across our range of formats, with the potential for attractive returns for shareholders. We are also focused on developing our range of location formats. As of 22 February 2016 we had visibility over approximately £100m of net growth capital expenditure for 2016, representing some 300 locations.
We will continue to control overheads to deliver further economies of scale, notwithstanding continued and significant investments made in the business to develop the network and our operating platform, processes and people.
We will continue our investment in R&D as the Group focuses on customer requirements and developing appropriate offerings to satisfy their needs, thereby increasing the reasons to do business with Regus. We believe this provides a key point of differentiation for Regus.
2015 Post-tax cash return on net investment (%)Overall 2015 return on net investment made up to 31 December 2011 of 23.1%.
Network location growth554 new locations added, opening in 145 new towns and cities, at a net growth capital investment of £284.9m
Total overheads as a % of revenues (%)Overheads as a % of revenues reduced 2.0ppt to 14.7%
Investment in R&D (£m)£10.3m invested, up 18%
1514131211
2,768
2,269
1,831
1,4111,203
1514131211
14.716.7
18.518.519.3
1514131211
10.3
8.7
7.2
4.5
3.1
08 09 1410 1511 12 13
24.226.8
9.8
20.4 20.3
13.3
(8.0) (9.3)
11.2
07and
earlier

18 Regus plc Annual Report and Accounts 2015
approximately £100m, representing approximately 300 locations and 4m sq ft of additional space.
Every potential investment is rigorously evaluated by our internal Investment Committee and has to meet our stringent financial hurdles before being approved. This is a process to which we apply maximum focus, given how critical the original decision is to our ultimate success.
Operational developmentsWe are constantly striving to improve our business and future potential returns. Whilst this is an ongoing process, we have recently implemented changes to the operational field structure, introducing a cluster approach to the management and organisation of our locations. With the in-field selling resource focused on a specific number of locations, we believe this will better promote the active marketing of the whole range of what is offered by the entire cluster, including format and price point. Moreover, the unrivalled scale of our business provides us with the opportunity to automate more processes to allow our employees to have greater focus on customer service across more than one location. We believe this will generate many positives for our business, including improved cost efficiency in the field, better productivity and a sharper focus on ‘selling the cluster’ to unlock the full benefit of our broad offering. We have also implemented important changes to the compensation structure for our colleagues operating our locations by moving away from a largely sales commission-based bonus system to one based on financial performance. We believe this will be important and better align business behaviour with the interests of our shareholders.
Non-recurring itemsAs previously disclosed, during the first quarter of 2015 we completed the sale of various portfolios of property assets acquired during 2014. The disposal raised £84m of cash before expenses and resulted in a non-recurring profit of £21.3m after expenses. During the second half two non-recurring items, relating to a litigation action in California and the Competition and Markets Authority’s review of the acquisition of Avanta in the UK, reduced the overall net gain by £6m to £15.3m.
While these items have had a significant impact on our 2015 results, except where specifically mentioned the following commentary and profit and loss analysis excludes the overall profit impact from these non-recurring items.
Chief Financial Officer’s review
Strong growth in network and attractive returns•
2015 has been another successful year in delivering against our strategy of achieving strong returns on investment. Good business performance and overhead control are driving these improved returns.Dominik de Daniel
Chief Financial Officer and Chief Operating Officer
during 2012 (which are not yet fully financially mature), the Group delivered a post-tax cash return of 21.5% in respect of all locations opened on or before 31 December 2012 (the equivalent return for the 12 months to 31 December 2014 on the same estate was 18.0%).
This strong performance reflects the underlying progress of the business as our locations mature, as well as our continued focus on efficiency and productivity, and the economies of scale on overheads that we enjoy as the Group continues to grow.
The chart below also shows the status of our centre openings by year of opening, with pleasing progress in the development of returns for centres added in 2012 and 2013 as they continue to progress towards full maturity.
Developing the networkDuring 2015, we invested £284.9m of net growth capital expenditure, adding a further 554 locations to the network. These locations added approximately 7.7m sq ft, taking the Group’s total space globally to over 46m sq ft as at 31 December 2015. In 2014 we invested net growth capital expenditure of £206.6m, adding 452 locations, the equivalent of 5.7m sq ft of space. We remain confident that the returns from these investments will, in due course, be in line with the returns we generate on our historic investments. This investment in developing our network continues to increase the depth and breadth of our geographic scope, thereby building further resilience into the business.
We continue to have a good pipeline of new openings. As of 22 February we had visibility on net capital expenditure so far for 2016 of
Return on investmentThe focus of our strategy remains on driving returns that achieve our post-tax cash payback criteria, which typically is within four years. For the 12 months to 31 December 2015, the Group delivered a post-tax cash return of 23.1% in respect of locations opened on or before 31 December 2011 (up from 20.9% on the same estate for the 12 months to 31 December 2014). Incorporating the centres opened
08 09 1410 1511 12
24.221.9
26.8
18.0
9.8
14.9
20.4
24.3
20.3
15.313.3
4.2
(8.0)(9.5) (9.3)
11.2
0.007and
earlier
2014 2015
13
Post tax cash return on net investment by year group – 12 months to 31 December (%)

www.regus.com 19
Strategic report
Go
vernanceFinancial statem
ents
Financial performanceGroup income statement (before non-recurring profit)
£m2015
Underlying 2014
% Change
(actual currency)
% Change (constant currency)
Revenue 1,927.0 1,676.1 15.0% 15.9%Gross profit (centre contribution) 428.4 383.1 12% 12%Overheads (including R&D) (283.9) (279.6) (2)% (2)%Joint ventures 0.3 0.8Operating profit 144.8 104.3 39% 37%Net finance costs (14.4) (17.2)Profit before tax 130.4 87.1 50% 46%Taxation (25.9) (17.2)Effective tax rate 19.9% 19.7%Profit for the period 104.5 69.9 50% 43%Basic EPS (p) 11.2 7.4 51% 45%Depreciation & amortisation 145.2 120.5EBITDA 290.0 224.8 29% 28%
RevenueGroup revenues increased 15.9% at constant currency to £1,927.0m (2014: £1,676.1m), an increase of 15.0% at actual rates. This strong improvement reflects good underlying like-for-like growth as well as the contribution from additional locations. Mature revenues (from 1,771 like-for-like locations added on or before 31 December 2013) grew a healthy 4.3% at constant currency to £1,628.2m (2014: £1,572.5m), up 3.5% at actual rates. Mature occupancy was 82.4% (2014: 79.6%).
Gross profitGroup gross profit improved 12% at constant currency rates to £428.4m (2014: £383.1m), up 12% at actual rates. The slight reduction in Group gross margin from 22.9% to 22.2% reflects the dilution from a relatively large number of immature locations resulting from the significant investment in growing the network over recent years (see table below). The mature gross margin improved from 24.6% to 26.7%.
Gross margin
£m
Mature centres
2015
New centres
2015
Closed centres
2015Total 2015
Revenue 1,628.2 287.9 10.9 1,927.0Cost of sales (1,193.1) (294.3) (11.2) (1,498.6)Gross profit (centre contribution) 435.1 (6.4) (0.3) 428.4Gross margin 26.7% (2.2)% (2.8)% 22.2%
£m
Mature centres
2014
New centres
2014
Closed centres
2014Total 2014
Revenue 1,572.5 62.0 41.6 1,676.1Cost of sales (1,185.9) (67.8) (39.3) (1,293.0)Gross profit (centre contribution) 386.6 (5.8) 2.3 383.1Gross margin 24.6% (9.4)% 5.5% 22.9%
Continued improved overhead efficiencyAs anticipated, the Group has made further strong progress in relation to overhead efficiency, thereby building on the progress achieved in recent years. We have benefited from our investment in management, systems and processes. As a consequence, in spite of significant growth, total overheads (including R&D expenditure) grew only 2% at constant currency to £283.9m (up 2% at actual rates). As a percentage of revenues, total overheads declined from 16.7% in 2014 to 14.7% in 2015. We continue to maintain a strong focus on overhead discipline and anticipate further scale benefits.
Investment in R&D increased 18% from £8.7m in 2014 to £10.3m for 2015.
Operating profit (excluding non-recurring items)As a result of the strong control of overheads, the incremental gross profit almost completely falls through to augment the Group operating profit, which increased 37% at constant currency to £144.8m (2014: £104.3m) (up 39% at actual rates). Consequently, the underlying Group operating margin increased from 6.2% in 2014 to 7.5% in 2015.
Net finance costsNotwithstanding the increase in net debt from an opening position of £138.0m to £190.6m, the Group’s net finance costs decreased from £17.2m to £14.4m, reflecting strong treasury discipline and a favourable foreign exchange movement on inter-company balances compared with 2014. During 2015 the Group incurred the additional cost of the €210m Schuldschein debt security which we issued in May 2014, but this was largely offset through subsequent lower utilisation of the Revolving Credit Facility.
Within the overall net finance costs, the Group also incurred a notional, non-cash, interest charge of £1.6m (2014: £2.0m) relating to the accounting treatment of fair value adjustments on various acquisitions made in past years. In addition there were also other non-cash costs of £1.4m (2014: £1.3m) relating to the amortisation of upfront charges on the establishment of our various borrowing facilities.
Tax The underlying effective tax rate for the year was 19.9%. The Group’s reported tax rate was 17.7% (2014: 19.7%).
Earnings per share Statutory Group earnings per share increased significantly to 12.8p (2014: 7.4p). Excluding the positive contribution from the non-recurring items, underlying Group earnings per share increased 51% to 11.2p, reflecting the strong growth in underlying Group operating profit.
The weighted average number of shares in issue for the year was 933,457,741 (2014: 944,081,638). The weighted average number of shares for diluted earnings per share was 953,678,034 (2014: 972,814,973). During the year, the Group purchased 9,543,800 shares at a cost of approximately £24.5m designated to be held in treasury to satisfy future exercises under various Group long-term incentive schemes. Over the same period, the Group reissued 1,936,642 shares from treasury to satisfy such exercises.

20 Regus plc Annual Report and Accounts 2015
Cash flow and fundingThe ability to generate cash is an attractive feature of our business model and Group cash generation continues to be strong. Cash generated before the investment in growth capital expenditure, dividends and share repurchases, and excluding the exceptional £80m disposal proceeds after expenses, increased 23% in 2015 to £215.7m (2014: £175.6m), reflecting the strong growth in underlying Group operating profit and very strong cash conversion.
Group net debt increased from £138.0m at 31 December 2014 to £190.6m at 31 December 2015. This increase comes after taking the growth capital expenditure and disposal proceeds into account, and after paying dividends of £38.8m and spending approximately £32.0m on a combination of buying our own shares as a further hedge against the cost of the exercise of options by our employees across our various option and LTIP plans, and cash-settling the exercise of some of those options. This represents an underlying Group net debt : EBITDA leverage ratio of 0.66 times, which is well below our internal 1.5 times limit and reflects our continued prudent approach to the Group’s capital structure.
During the period, we extended and amended our key £320m Revolving Credit Facility, which is now committed until 2020 and which has further improved our debt maturity profile.
weakening against the US dollar and strengthening against the euro and Japanese yen as well as a number of other currencies. Nonetheless, overall this decreased reported revenue and gross profit by £16.4m and £1.0m respectively, however, operating profit increased by £1.9m compared to last year.
Chief Financial Officer’s review continued
Together with the Schuldschein debt security which we issued last year, the Group has adequate financial headroom to continue to execute on its strategy.
Foreign exchangeThe Group’s results are exposed to translation risk from the movement in currencies. During 2015 key individual currency exchange rates have moved, as shown in the table below. The movements were, however, mixed with sterling
Cash flowThe table below reflects the Group’s cash flow:£m 2015 2014
Group EBITDA 290.0 224.8Working capital 103.5 80.3Less: growth-related partner contributions (59.8) (47.0)Maintenance capital expenditure (74.9) (53.8)Taxation (29.1) (20.9)Finance costs (13.2) (13.5)Other items (0.8) 5.7Cash flow before growth capital expenditure, share repurchases, dividends and non-recurring disposal proceeds 215.7 175.6
Gross growth capital expenditure (344.7) (253.6)Less: growth-related partner contributions 59.8 47.0Net growth capital expenditure5 (284.9) (206.6)
Total net cash flow from operations (69.2) (31.0)
Non-recurring disposal proceeds 84.0 –Less: costs of disposal (4.0) –Corporate financing activities (32.0) (17.3)Dividend (38.8) (35.4)Opening net cash/debt (138.0) (57.2)Exchange movements 7.4 2.9Closing net debt (190.6) (138.0)
5 Net growth capital expenditure of £284.9m relates to the cash outflow in 2015. Accordingly, it includes capital expenditure related to locations added in 2014 and 2016, as well as 2015. The total net investment in the 2015 additions amounts to £247.9m so far.
Foreign exchange ratesAt 31 December Annual average
Per £ sterling 2015 2014 % 2015 2014 %
US dollar 1.48 1.56 (5)% 1.53 1.64 (7)%Euro 1.36 1.28 6% 1.38 1.25 10%Japanese yen 179 186 (4)% 185 175 6%
Risk management The principal risks and uncertainties affecting the Group remain unchanged. A detailed assessment of the principal risks and uncertainties which could impact the Group’s long-term performance and the risk management structure in place to identify, manage and mitigate such risks can be found on pages 21 to 24 and 38 and 39 of the Annual Report and Accounts.
Related partiesThere have been no changes to the type of related party transactions entered into by the Group that had a material effect on
the financial statements for the period ended 31 December 2015. Details of related party transactions that have taken place in the period can be found in note 31 to the 2015 Annual Report and Accounts (page 97).
DividendsConsistent with Regus’ progressive dividend policy and subject to shareholder approval, we will increase the final dividend for 2015 by approximately 13% to 3.1p (2014: 2.75p). This will be paid on Friday, 27 May 2016, to shareholders on the register at the close of business on Friday 29 April 2016. This represents an increase in the full year dividend of approximately 13%, taking it from 4.0p for 2014 to 4.5p for 2015.
Dominik de Daniel
Chief Financial Officer and Chief Operating Officer
1 March 2016

www.regus.com 21
Strategic report
Go
vernanceFinancial statem
ents
Identification, mitigation and management of risks is central to our strategy and our enterprise-wide risk management process allows us to understand the nature, scope and potential impact of our key business and strategic risks so we are able to manage these effectively.
Regus’ business could be impacted by various risks, leading to failure to achieve strategic targets for growth or loss of financial standing, cash flow, earnings, return on investment, and reputation. Not all these risks are wholly within the Group’s control and it may be affected by risks which are not yet manifested or reasonably foreseeable.
Effective risk management is critical to achieving our strategic objectives and protecting our personnel, assets and our reputation. Regus therefore has a comprehensive approach to risk management, as set out in more detail in the Corporate Governance Report.
A critical part of the risk management process is to assess the impact and likelihood of risks occurring so that appropriate mitigation plans can be developed and implemented.
For all known risks facing the business, Regus attempts to minimise the likelihood
Effective risk management requires awareness and engagement at all levels of our organisation. It is for this reason that risk management is incorporated into the day-to-day management of our business, as well as being reflected in the Group’s core processes and controls. The Board oversees the risk management strategy and the effectiveness of the Group’s internal control framework. Risk management is at the heart of everything we do, particularly as we look to grow across multiple markets around the world. For this reason, we conduct risk assessments throughout the year as part of our business review process and all investment decisions. These activities include:
• Monthly business reviews of all countries and Group functions
• Individual reviews of every new location investment and all acquisitions
• Annual planning process for all markets and Group functions
• Review of the status of our key risks in each Audit Committee meeting
and mitigate the impact. According to the nature of the risk, Regus may elect to take or tolerate risk, treat risk with controls and mitigating actions, transfer risk to third parties, or terminate risk by ceasing particular activities or operations. Regus has zero tolerance of financial and ethics non-compliance and ensures that Health, Safety, Environmental & Security risks are managed to levels that are as low as reasonably practicable.
Whilst overall responsibility for the risk management process rests with the Board, it has delegated responsibility for assurance to the Audit Committee. Executive management is responsible for designing, implementing and maintaining the necessary systems of internal control.
A list of key risks is prepared and the Board collectively assesses the severity of each risk, the likelihood of it occurring and the strength of the controls in place. This approach allows the effect of any mitigating procedures to be reflected in the final assessment. It also recognises that risk cannot be totally eliminated at an acceptable cost and that there are some risks which, with its experience and after due consideration, the Board will choose to accept.
Board
Audit Committee
General management
Senior leadership team
Business assurance function
Defines Regus’ risk appetite and tolerance
Accountable for the design and implementation of risk management
processes and controls
• Assists management and the Board in conducting risk studies
• Advises and guides on policies and internal control framework
• Reviews risk profiles
• Tests compliance with internal controls
Reviews effectiveness of internal controls
Monitors risk identification and assessment
Responsible for compliance and ensuring that staff are adequately trained
Accountable for the regular review and appraisal of key risks
Monitors progress against internal and external audit recommendations
Assesses overall effectiveness of risk management
Contributes to the identification and assessment of key risks
Approves the annual internal and external audit plans
Risk management and principal risks
Risk management remains at the core of what we do•

22 Regus plc Annual Report and Accounts 2015
Principal risks
Risk Mitigation Progress in 2015StrategicLease obligations – The single greatest financial risk to Regus is represented by the financial commitments deriving from the portfolio of leases held across the Group.
Whilst Regus has demonstrated consistently that it has a fundamentally profitable business model which works in all geographies, the profitability of centres is impacted by movements in market rents, which, in turn, impact the price at which Regus can sell to its customers.
The fact that the outstanding lease terms with our landlords are, on average, significantly longer than the outstanding terms on our contracts with our customers creates a potential mismatch if rentals fall significantly, which can impact profitability and cash flows.
This risk is mitigated in a number of ways:
1) 94% of our leases are ‘flexible’, meaning that they are either terminable at our option within six months and / or located in or assignable to a standalone legal entity, which is not fully cross-guaranteed. In this way, individual centres are sustained by their own profitability and cash flow. During the most recent downturn we were able to negotiate revised terms with our partners to reflect downward movements in market rates to help recovery.
2) Over a quarter of our leases with landlords are variable in nature, which means that payments to landlords vary with the performance of the relevant centre. In this way the ‘risk’ to profitability and cash flow of that centre from fluctuations in market rates is softened by the consequent adjustment to rental costs. In a number of cases, we take no risk at all since the lease is signed by a partner who also undertakes all of the capital investment and pays us a fixed percentage of revenues as well as a share of centre profit.
3) The sheer number of leases and geographic diversity of our business reduces the overall risk to our business as the phasing of the business cycle and the performance of the commercial property market often varies from country to country and region to region.
4) Each year a significant number of leases in our portfolio reach a natural break point.
During 2015, the number of ‘flexible’ leases as a percentage of the total increased from 92% to 94%. At the end of 2015, we were operating 2,768 locations in 977 towns and cities across 106 countries.
Economic downturn – An economic downturn could adversely affect the Group’s operating revenues, thereby reducing operating performance or, in an extreme downturn, resulting in operating losses.
The Group has taken a number of actions to mitigate this risk:
1) More than a quarter of our leases are performance-related to a greater or lesser extent and our rental payments, if any, vary with revenues earned by the centre.
2) Lease contracts include break clauses when leases can be terminated at our behest. The Group also looks to stagger leases in locations where we have multiple centres so that we can manage our overall inventory in those locations.
3) We review our customer base to assess exposure to a particular customer or industry group.
4) The increasing geographic spread of the Group’s network increases the depth and breadth of our business and provides better protection from an economic downturn in a single market or region.
We increased the number of centres operating on performance-related leases by 20%.
We also increased the scale of our network by 22% and added 145 new towns and cities. Our monthly business performance reviews provide early warning of any impact on our business performance and allow management to react with speed. More generally, investment in our management team has also led to improved, more responsive decision-making at a country and area level.
Shifting demand and technology trends – Technology developments are driving demand for flexible working. Failure to recognise these could mean Regus’ product offering is sub-optimal.
Regus continually invests in R&D to develop new products and services to increase its competitive advantage, protect current revenues and unlock potential new sources of revenue.
The Group increased spend on R&D by 18% in 2015.
FinancialFunding – The Group relies on external funding to support a net debt position of £190.6m at the end of 2015. The loss of these facilities would cause a liquidity issue for the Group.
The Group constantly monitors its cash flow and financial headroom development and maintains a 12-month rolling forecast and a three-year strategic outlook. The Group also monitors the relevant financial ratios against the covenants in its facilities to ensure the risk of breach is being managed.
The Group also stresses these forecasts with downside scenario planning to assess risk and determine potential action plans.
The Board intends to maintain a prudent approach to the Group’s capital structure by holding the net debt : Group EBITDA leverage ratio below c. 1.5 times.
Part of the annual planning process is a debt strategy and action plan to ensure that the Group will have sufficient funding in place to achieve its strategic objectives.
The Group also constantly reviews and manages the maturity profile of its external funding.
We extended and amended our £320m Revolving Credit Facility, which is now committed until 2020.
Together with the Group’s €210m of debt securities, consisting of €165m of three-year notes and €45m of five-year notes, this provides £474m of available debt financing.
Regus had a net debt : EBITDA ratio at 31 December 2015 of 0.66 times. There is significant headroom on each of the covenant ratios.
Our A- for long-term debt and A1 for short-term debt ratings, accorded by an independent credit rating agency, makes additional sources of financing potentially available.
Risk management and principal risks continued

www.regus.com 23
Strategic report
Go
vernanceFinancial statem
ents
Risk Mitigation Progress in 2015FinancialExchange rates – The principal exposures of the Group are to the US dollar and the euro with approximately 33.9% of the Group’s revenues being attributable to the US dollar and 13.0% to the euro.
Any depreciation or appreciation of sterling would have an adverse or beneficial impact to the Group’s reported financial performance and position respectively. The Group does not generally hedge the translation exchange risk of its business results. Rather, it assumes that shareholders will take whatever steps they deem necessary based on their varied appetites for exchange risk and differing base currency investment positions.
1) Given that transactions generally take place in the functional currency of Group companies, the Group’s exposure to transactional foreign exchange risk is limited.
2) Where possible, the Group attempts to create natural hedges against currency exposures through matching income and expenses, and assets and liabilities, in the same currency.
3) The Group, where deemed appropriate, uses currency swaps to maintain the currency profile of its external debt.
Overall in 2015 the movement in exchange rates decreased reported revenue and gross profit by £16.4m and £1.0m respectively, however operating profit increased by £1.9m compared to last year.
During 2015 the Group had cross-currency swaps on €165m of debt securities to retain the currency profile of its external debt following the issue of a €210m loan note (which was used to repay sterling debt on the Group’s Revolving Credit Facility).
Interest rates – Operating in a net debt position, an increase in interest rates would increase finance costs.
The Group constantly monitors its interest rate exposure as part of its monthly treasury review.
As part of the Group’s balance sheet management it utilises interest rate swaps.
During 2015 the Group maintained interest rate swaps to convert a substantial proportion of its debt from floating to fixed rates.
OperationalCyber security – Regus has significant experience in operating and maintaining an enterprise infrastructure and application suite. The Group has ensured that information security is part of its ongoing business practice. The trend towards an integrated digital economy and use of external cloud services combined with the rise in malicious attacks and increasing consequential costs warrants particular attention to cyber security risks.
This risk is mitigated as follows:
1) The Group maintains an active information security program under the direction of the Group CIO with oversight by the Board
2) Both internal and external audits are conducted periodically to review risks and ensure appropriate measures are in place
3) The Group ensures compliance with all major legislation and directives
4) The Group maintains a mandatory training programme to promote staff awareness of information security and compliance best practice
5) Data, systems and access permissions are strictly segregated to reduce exposure to risk
All core production applications have been made PCI (Payment Card Industry) – compliant and the Group no longer stores credit card details in any of its systems.
Internal and external audits have been completed and an ongoing monitoring and improvement programme is in place.
Loss of critical systems – The Group’s systems and applications are housed in a central data centre. Should the data centre be impacted as a result of circumstances outside the Group’s control there could be an adverse impact on the Group’s operations and therefore its financial results.
Regus manages this risk through:
1) Business continuity plans.
2) A detailed service agreement with our external data centre provider which incorporates appropriate back-up procedures and controls.
3) Ensuring appropriate business interruption insurance is in place.
We undertake regular testing of business continuity procedures to ensure that they are adequate and appropriate.

24 Regus plc Annual Report and Accounts 2015
Risk Mitigation Progress in 2015OperationalFraud – Landlord and supplier and procurement related fraud
Regus manages this risk through:
1) A rigorous investment approval process to review the proposed deal structure against local market conditions and alternatives.
2) Centralised procurement contracts with suppliers for key services and products.
3) Standardised processes to manage and monitor spend.
4) A strong governance framework and policies on gifts and hospitality, business conduct and bribery and corruption.
5) Regular reviews to monitor effectiveness of controls.
GrowthEnsuring demand is there to support our growth – Regus has undertaken significant growth to develop local and national networks. Adding capacity carries the risk of creating overcapacity. Failure to fill new centres would create a negative impact on the Group’s profitability and cash generation.
Regus mitigates this risk as follows:
1) Each investment or acquisition proposal is reviewed and approved by the Investment Committee.
2) The monthly business review process monitors new centre development against the investment case to ensure that the anticipated returns are being generated.
3) As part of the annual planning process, a growth plan is agreed for each country which clearly sets out the annual growth objectives.
On aggregate, our new centres continue to perform in line with management expectations and are delivering attractive returns.
Human ResourcesAbility to recruit at the right level – Our ability to increase our management capacity and capabilities through the hiring of experienced professionals not only supports our ability to execute our growth strategy, but also enables us to improve succession planning throughout the Group.
Mitigating actions include:
1) Succession planning discussions are an integral part of our business planning and review process.
2) Part of the annual planning process is the Human Resources Plan, and performance against this Plan is reviewed through the year.
3) Our global performance management system and quarterly staff survey allow us to keep close to our employees and maintain a two-way dialogue throughout the year.
4) Regular external and internal evaluation of the performance of the Board.
Our capability to hire the best talent continued to increase in 2015. Our direct recruit approach saved over £2m of search fees as our talent knowledge around the world deepens and expands. This has allowed us to further plan for succession in all markets.
Our diversity continues to flourish with our workforce split fairly evenly male/female, which is an important factor in hiring talent in a growth business.
Training and employee engagement – As a service- based business the strength and capabilities of our increasingly geographically diverse team are critical to achieving our strategic objectives.
One of the key items in the Human Resources Plan is the Global Induction & Training Plan, which sets out the key objectives for the forthcoming year. Performance against these objectives is reviewed through the year.
Our employee survey also provides insight into employee issues, which is then used to improve the Plan.
We trained our employees, many through the Regus Online Learning Academy, including employees from new centre acquisitions and new talent to Regus.
In 2015 there were over 297,000 training modules completed on-line and face-to-face.
Our online learning curriculum was a winner of the Most Dramatic Business Impact Award at the Cornerstone Client Excellence Awards 2015 for the impact that this training had on sales performance. This is just one example of our relevant and easy-to-access development initiatives for front-line employees.
Risk management continued

www.regus.com 25
Strategic report
Go
vernanceFinancial statem
ents
We know that our success will be defined by having the right people in place to deliver against our plans and make results happen. We firmly believe that if we get most senior layers of talent right, the rest of the organisation will follow, particularly in the all-important area of customer service.
Global leadershipDuring 2015 and throughout the first half of 2016, therefore, the focus of the Group’s people strategy was and will continue to be on building the global leadership teams and succession hierarchies needed to support flawless execution as we drive towards 20,000 locations.
This has been a very significant recruitment and development exercise, as all joiners need to be exceptional individuals who are already prepared for the Regus growth journey before they arrive at the Group.
induction process, and continues throughout each individual’s career with internal coaching and mentoring, business-school partnerships, bespoke training programmes and more. We also have a competitive reward strategy, in which we aim to lock in the talent we need through incentives.
Maximising potential and retaining talent is an important priority at every level of the organisation, and we ensure that we give people opportunities to excel, from our intake of talented graduates to our customer-focused staff at country and location level. We run our staff satisfaction survey on a quarterly basis to ensure we are never reliant on out-dated information. Results consistently show that our people understand the Group vision and what is expected of them.
An outstanding teamThe challenges ahead of us are great, but we have in place an integrated and truly world-class team at all levels of the organisation with the will, the capability and the energy to help Regus meet its targets.
People
They must already have excelled in a high-growth organisation and have proved they have the intellect, vision and passion required for key roles within such an exciting, fast-paced and rewarding environment.
We successfully built an outstandingly skilled and experienced senior management team during 2015. Throughout the first half of 2016, recruitment volumes will remain high as we deliver on our succession-planning policies and build our network of shared service centres. Thereafter, our primary focus will be building country teams as we grow our local networks across the world.
Retaining talentWe aim to deliver exceptional opportunities for personal growth and development, and have in place a widespread programme of interventions to maximise personal capabilities. This starts with a high-quality
Attracting, developing, growing and retaining the best available leadership talent at Board, functional directorship and country level are key components of Regus’ corporate objectives, driven by deep planning and ongoing business review processes.
The people to support and drive growth•

26 Regus plc Annual Report and Accounts 2015
Corporate responsibility
Focused on our communities•
Economic support for communitiesOur presence is helping to generate wealth in every location where we operate, from major cities in world-leading economies to smaller communities in emerging states. We give start-ups and multinationals alike the freedom and flexibility to operate where they need to, employing local people and drawing on local supply chains. This in turn helps to improve and grow the business environment, attracting people and organisations to the area in a virtuous circle.
Reducing environmental impactOur services directly enable local business communities to become more sustainable. Not only does the offer of flexible space reduce carbon emissions by enabling people to work closer to where they live, but we also provide facilities such as video conferencing that eradicate the need to travel for meetings.
In addition, we encourage and enable the uptake of best practice across our network through a range of initiatives targeting reduced use of paper and increased recycling. We are also continuing to introduce carbon-reduction and energy-efficiency policies and procedures in our centres, including control upgrades and energy-efficient lighting and temperature systems. While each of these makes a small individual contribution on its own, across our fast-growing network they are collectively delivering a substantial reduction in our environmental impact.
Efficiency schemes2015 saw our Green Committee accelerate its efforts in reducing energy and carbon across our UK portfolio, with particular emphasis on acquisitions. In the two years or so since the acquisition of MBW we have managed through good housekeeping and management to reduce this portfolio’s overall energy-related carbon emissions by circa 17%. By continuing to apply our greener working strategies to our traditional portfolio, we further reduced its energy carbon footprint by 2.5%. This has given an overall combined reduction of 5% in our CRC returns for 2014/2015.*
be relaunching our Employee Engagement Programmes with an emphasis on the continued reduction of carbon, energy, water and waste. Significant further work is planned for these areas in 2016.
Charitable investmentsWe actively invest in our communities, additionally encouraging and enabling our colleagues and customers, suppliers and the public to do so as well. Direct Group investment can take the form of financial donations to charities and humanitarian appeals, the concession of working space and other in-kind donations to worthwhile causes, and employee recognition programmes for charity initiatives. We also provide the support of Regus facilities for the fund-raising activities of our staff, customers and suppliers. These include in-centre initiatives (such as collections campaigns, charitable networking events and recycling projects) as well as off-site activities like fun runs, sponsored walks and volunteering at venues like soup kitchens and orphanages.
In total over £209,000 was raised and used to support 219 projects for 195 charities. Further detail is provided in the table below:
2015 was also the year when the new energy auditing (ESOS) regulations had to be applied. We are pleased to report that Regus embraced these new requirements to identify further energy-saving opportunities across our whole portfolio. The outcomes and results will be reviewed by our Green Committee in early 2016 for appropriate implementation.
We are also conscious that as new centres are acquired their energy-related carbon footprints will need to be reviewed and this will form part of our ongoing work. To help us we are using specialist external energy consultancies to record our energy consumption on a monthly basis across all our centres and to assist and advise us in the purchase, management and monitoring of our energy.
Due to our business constantly changing and expanding, we will in 2016 review the targets set out in 2009 to ensure they remain appropriate for the current and future portfolios.
We continue to be voluntary participants of the Carbon Disclosure Project and use it to gauge our ongoing performance for continuous improvement. We are happy to report a disclosure score of 87% in 2015.
Our new centre refurbishments now automatically include energy-saving features such as LED lighting and more efficient controls for heating and cooling. There is also a general emphasis across our teams to keep our carbon footprint as low as practically possible and to keep implementing our carbon reducing policies. We have plans to upgrade a number of centre BMS control systems and to further train staff on their efficient usage.
By encouraging our clients to make more use of local centres and nearby touchdown facilities, we believe we are helping them mitigate the risks of disruption by, amongst other things, severe weather events brought about by climate change.
In 2016 our refreshed Green Committee will
At Regus, we are confident that the positive impact of our mission to provide flexible workspaces in many thousands of places across the world is significant, wide-ranging and growing in scope and influence as our network expands.
* Excludes newly acquired Evans sites.
2013 2014 2015
Countries with community engagement activity 20 38 43Projects 54 132 219Charities supported 78 100 195Donations made £80,500 £155,328 £209,905
Extracting value from wasteWhen Regus colleagues in Fortaleza, Brazil, encouraged customers to participate in a programme to collect and segregate paper, cardboard, plastic cups, toner cartridges and other office detritus, the collected materials were donated to a local orphanage. By using the waste to make a small financial gain, the orphanage has developed a new income stream which is helping to sustain its future.

www.regus.com 27
Strategic report
Go
vernanceFinancial statem
entsMake-a-Wish (India)The Regus Mumbai team partnered with Make-a-Wish (India), which make wishes come true for severely ill children, many of whom have life-threatening conditions. Team members ran in the Mumbai Marathon and raised enough money to help 50 children fulfil their dreams.
Responding to disasterMore than eight million people were affected by the massive earthquake in Nepal in 2015. We responded with a worldwide campaign to raise awareness and encourage support for the victims by providing funds for the International Federation of Red Cross and Red Crescent Societies volunteers, who have been helping those most in need since the earthquake hit.
Grace to be Born (the Philippines)The Grace to be Born Maternity Home & Nursery is an orphanage and halfway house for unmarried mothers seeking shelter. The Regus Social Action Club, made up of colleagues from our Global Service Centre, raised funds and donated gifts-in-kind, such as groceries, clothes and toys to help further the support that the shelter provides.
Going Pink for Susan G. Koman (USA)The Regus Life Savers team raised US$16,994 for this highly effective US initiative that aims to find a cure for breast cancer. Regus centres across the country ‘went pink’ for the cure, holding numerous networking events to raise funds.
Community heroesThe Regus Community heroes programme recognises and celebrates the community initiatives our people are running across the world. The project that was most highly rated by our internal community was profiled in our community video and received a $10,000 donation. The top three projects in 2015 were:
Facilitating donationsTo help our customers set up and manage their own fund-raising programmes, we launched the My Regus Charities and Causes platform in 2015, enabling them to promote their own CSR initiatives, track progress and record donations to any of 1.6 m registered charities. When working in different countries, time zones and in multiple currencies, we strive to make everything easier so our teams and customers can gain the most for supported beneficiaries. We believe this will ultimately benefit the great causes we are all engaged with across the globe.

28 Regus plc Annual Report and Accounts 2015
Board of Directors
Building our future growth•
Board balance and diversity
The role of the Board is to provide entrepreneurial leadership and to review the overall strategic development of the Group.
Douglas Sutherland Mark Dixon Dominik de Daniel Lance BrowneChairman Chief Executive Officer Chief Finance Officer and Chief
Operating OfficerSenior Independent Non-Executive Director
Committee membership
Appointment
18 May 2010 Founder 1 November 2015 27 August 2008Experience
Douglas was Chief Financial Officer of Skype during its acquisition by eBay and was also Chief Financial Officer at SecureWave during its acquisition by PatchLink.
Prior to this, Douglas was an Arthur Andersen Partner with international management responsibilities. He has served as a director of companies in multiple jurisdictions and was the founding Chairman of the American Chamber of Commerce in Luxembourg.
Chief Executive Officer and founder, Mark Dixon is one of Europe‘s best known entrepreneurs. Since founding Regus in Brussels, Belgium in 1989, he has achieved a formidable reputation for leadership and innovation. Prior to Regus he established businesses in the retail and wholesale food industry. A recipient of several awards for enterprise, Mark has revolutionised the way business approaches its property needs with his vision of the future of work.
Dominik served for over nine years as the Chief Financial Officer of Adecco Group, the world leading provider of human resource solutions; Dominik was also the Adecco Group’s Head of Global Solutions and was responsible for global information management and for Adecco Group’s activity in China.
Dominik previously held the CFO position at DIS AG, the market leader in professional staffing in Germany, before the company was ultimately acquired by Adecco Group.
Lance was previously CEO then Chairman of Standard Chartered Bank (China) Ltd, Non-Executive Director of IMI plc, Senior Advisor to the City of London, Chairman of China Goldmines plc, and Director of Business Development at Powergen International.
External appointments
Douglas is currently also a Director of Median Gruppe S.à r.l. and Socrates Health Solutions Inc.
Lance is Chairman of Travelex (China), and a WS Atkins International Advisory Board member.
Board gender diversity Balance of Non-Executive and Executive Directors
N N A R
1. Chairman: 12. Executive: 23. Non-Executive: 5
1
2
3
1. Female: 25%2. Male: 75%
1
2

www.regus.com 29
Strategic report
Go
vernanceFinancial statem
ents
Elmar Heggen Nina Henderson Florence Pierre François PaulyIndependent Non-Executive Director
Independent Non-Executive Director
Independent Non-Executive Director
Independent Non-Executive Director
1 June 2010 20 May 2014 21 May 2013 19 May 2015
Elmar has extensive management experience. Since 2006 he has been the Chief Financial Officer, Head of the Corporate Centre and a Member of the Executive Committee of the RTL Group, the leading European entertainment network. Joining the RTL Group in 2000 he has previously held the positions of Vice President of Mergers and Acquisitions and Vice President of Strategy and Controlling. Prior to joining RTL, Elmar was Vice President & General Manager of Felix Schoeller Digital Imaging in the UK.
During her 30 year career with Bestfoods and its predecessor company CPC International, Nina has held a number of international and North American general management and executive marketing positions, including Vice President of Bestfoods and President of Bestfoods Grocery. She has also served as a director of numerous companies including AXA Financial Inc, Royal Dutch Shell plc., Del Monte Food Company and Pactiv Corporation.
Florence has over 30 years of international corporate finance practice, holding senior positions at BNP, Financière Rothschild, Degroof Corporate Finance, 3i Infrastructure plc and her own M&A advisory boutique. Florence has an international perspective, having worked in Chicago, New York, Paris and Brussels. She has also taught economics and finance, published a number of books and articles on valuation, and has been a member of several French entrepreneurship and innovation committees.
François has over 30 years of management experience in the banking sector. Until October 2014 François served as Chief Executive and Chairman of the Management Board of Banque Internationale à Luxembourg (“BIL”). Previous management experience includes Executive appointments at BIP Investment Partners S.A., Dexia Group and at Sal. Oppenheimer jr. & Cie. S.C.A.
Elmar is Chief Financial Officer and Member of the Executive Committee of the RTL Group. He is also a Board Member of Atresmedia (Spain) and Metropole television (France) and Chairman of the Broadcast Centre Europe SA.
Nina is currently a director of CNO Financial Group and Walter Energy Inc. She is Managing Partner of Henderson Advisory, a Director of the Visiting Nurse Service of New York and the Foreign Policy Association, and a Trustee of Drexel University.
Florence is a director at ESL Network, and also shares her time between directorships, consulting and venture investments in companies providing innovative and internet services.
François serves as the Non- Executive Chairman of the Board of BIL and Senior Advisory Partner at Castik Capital Partners. He also serves as a Non-Executive Director of Société de la Bourse de Luxembourg S.A., Luxair SA, Group la Luxembourgeoise SA, BIP Investment Partners SA, M&C S.p.A and Cobepa SA. François also serves on the Boards of several charitable organisations.
Length of tenure of Non-Executive Directors
N A R A RN A RNAN R
1. 0-3 years: 32. 3-6 years: 13. 6-9 years: 2
1
2
3
A RN
Key
Member of Remuneration Committee
Member of Audit Committee
Member of Nomination Committee
Chairman, Remuneration Committee
Chairman, Audit Committee
Chairman, Nomination Committee
A
R
N
R
A
N

30 Regus plc Annual Report and Accounts 2015
We have seen the benefits of having strength and diversity on the Board and our aim is to maintain a Board which is reflective of the broad range of skills, backgrounds and experience necessary to properly serve our shareholders. We have pursued this objective by engaging Board members based on merit who have had broad executive responsibilities and bring very different and complementary personal experiences and approaches to matters including the evaluation of opportunities and management of risks.
Remuneration policyAs indicated in our 2014 Directors’ Remuneration Report, during 2015 the Remuneration Committee has reviewed the remuneration and incentive framework for our Executive Directors and has consulted with our major shareholders and investor bodies on the introduction of the remuneration policy as set out on pages 44 to 47; this policy has been designed to promote the long-term success of the Company and approval will be sought for it at the 2016 annual general meeting.
Audit Committee and auditors In view of our continuing long-term ambition for growth and the significant investments that have been made across the business, the Audit Committee has again played a substantial role in ensuring appropriate governance and challenge around our risk and assurance processes. This is covered in further detail on pages 21 to 24 and 34 and 35. Full details of the work of the Audit Committee are detailed in the Audit Committee Report on pages 38 to 41 and includes our intention to commence an audit tendering process before June 2018.
Board evaluationAn external Board evaluation was performed in respect of 2015, the process and results are summarised on page 33.
Douglas Sutherland
Chairman
Corporate Governance
Your Board is collectively responsible for the long-term success of the Company•
Good governance starts with a strong Board providing entrepreneurial leadership and setting the values for the Group.Douglas Sutherland
Chairman
Dear ShareholderI am pleased to introduce the Governance section of our Annual Report which documents your Board’s approach to directing and controlling Regus.
Our approach to governanceWe firmly believe that good governance starts with a strong Board providing entrepreneurial leadership and setting the values for the Group against a backdrop of prudent and appropriate safeguards, checks and balances which are regularly reviewed and which ensure that the right considerations underpin every decision we make.
As a Board we regularly discuss and review our:
• Performance and progress
• Major risks and their mitigation
• Behaviours and values
• People and how we can create a high performing team
• Future development and succession
• Customers
• Shareholders
I hope that the reports contained in this section provide you with an insight into how we strive to achieve effective governance and the progress we have made in 2015. I also trust that you will find our reports to be fair, balanced and understandable; this is a reflection of how we do business and how the Board serves its stakeholders.
Board compositionDuring the year we were pleased to refresh our Board and add new skills by appointing François Pauly as an Independent Non-Executive Director and Dominik de Daniel as an Executive Director holding the combined role of Chief Financial Officer and Chief Operating Officer.
In this section
31 Corporate governance
36 Nomination Committee report
38 Audit Committee report
42 Directors’ Remuneration report
53 Directors’ report
54 Directors’ statements

www.regus.com 31
Strategic report
Go
vernanceFinancial statem
ents
UK Corporate Governance CodeThe UK Corporate Governance Code, as published by the Financial Reporting Council in September 2014 and available on www.frc.gov.uk (the “Code”), sets out a series of principles and provisions documenting good practice in governance. Our Corporate Governance Report is structured to report against the main principles of the Code, which relate to: leadership; effectiveness; accountability; remuneration; and relations with shareholders. Together with the Audit Committee Report, the Nomination Committee Report and the Directors’ Remuneration Report this Corporate Governance Report shows how we have applied the principles of the Code during 2015, when we complied with all the provisions of the Code except in relation to Senior Independent Director contact with major shareholders. Further information on this is provided in our Compliance Statement on page 35.
The Chairman ensures that each meeting covers an appropriate range of topics including operations, strategy, business development, special projects and administrative matters. Minutes are taken of all Board discussions and decisions and all Directors are encouraged to request inclusion in the Board minutes of any unresolved concerns that they may have.
The Board has a formal schedule of matters reserved for its decision and which cannot be delegated. These include:
• approval of long-term objectives and commercial strategy;
• approval of the annual budget;
• approval of regulatory announcements including the interim and annual financial statements;
• approval of terms of reference and membership of the Board and its Committees;
• changes to the Group’s capital structure;
• changes to the Group’s management and control structure;
• capital expenditure in excess of £5m; and
• material contracts (annual value in excess of £5m).
Board CommitteesThe Board is supported by the Audit Committee, the Remuneration Committee and the Nomination Committee (the “Committees”) to which it has delegated certain powers. The work of the Committees is further detailed on pages 36 to 52 and their terms of reference can be found on the Company’s website: www.regus.com.
The Company Secretary acts as Secretary to all the Committees and minutes of meetings are circulated to all Board members.
LeadershipRole of the Board Your Board is collectively responsible for the long-term success of the Company. The Board sets the strategy for the Group and ensures that the necessary resources, measures and controls are in place to implement the agreed strategy and to monitor performance. The Board also sets the values and standards which form the basis of the corporate culture at Regus.
The Chairman sets the Board meeting schedule and agenda. In 2015 the Board met eight times with all Directors present at every Board meeting. Details of Board membership throughout the year and attendance at meetings is set out below.
The main principles of the UK Corporate Governance Code relate to leadership, effectiveness, accountability, remuneration and relations with shareholders.
Members
Attendance (out of possible
maximum number of meetings)
Douglas Sutherland, Chairman 8/8Lance Browne 8/8Dominik de Daniel* 1/1Mark Dixon 8/8Elmar Heggen 8/8Nina Henderson 8/8François Pauly** 5/5Florence Pierre 8/8Alex Sulkowski*** 4/4Dominique Yates**** 7/7
* Dominik de Daniel was appointed on 1 November 2015.
** François Pauly was appointed on 19 May 2015.
*** Alex Sulkowski left the Board on 19 May 2015.
**** Dominique Yates stepped down on 1 November 2015.

32 Regus plc Annual Report and Accounts 2015
EffectivenessBoard compositionThe Board currently comprises the Chairman, two Executive Directors and five Independent Non-Executive Directors. Board composition and the composition of the Committees is regularly reviewed and refreshed. During 2015 François Pauly was appointed as a new Independent Non-Executive Director and Dominik de Daniel was appointed as a new Executive Director holding the combined position of Chief Financial Officer and Chief Operating Officer. The Board considers all Non-Executive Directors to be independent.
The Board considers that its current composition continues to ensure that no individual or group dominates its decision making process and that the Board has the right balance of skills to be able to discharge its duties effectively.
Board appointments and successionThe Board is satisfied that succession plans are in place for the orderly succession of appointments to the Board and to senior management positions. The Board has established a Nomination Committee with responsibility for leading the process for Board appointments and succession planning. Further details of the Nomination Committee’s work and responsibilities are contained on page 36 and 37.
Development, information and supportAppropriate training is made available for all new Directors to assist them in the discharge of their duties. All Directors have the opportunity to meet with major shareholders and have access to the Company’s operations and employees.
Training is provided on an ongoing basis to meet particular needs with the emphasis on governance and accounting developments. During the year the Company Secretary provided updates to the Board on relevant governance matters, whilst the Audit Committee regularly considers new accounting developments through presentations from management, internal business assurance and the external auditors.
The Board programme includes the receipt of monthly Board reports and presentations given at Board meetings from management with strategic responsibilities. These, together with site visits, increase the Non-Executive Directors’ understanding of the business and sector.
All Directors have access to the advice and services of the Company Secretary, who is responsible for ensuring that Board procedures, corporate governance and regulatory compliance are followed and complied with. Appointment and removal of the Company Secretary is a matter reserved for the Board.
Should a Director request independent professional advice to carry out his duties, such advice is available to him or her at the Company’s expense.
Corporate Governance continued
Re-election of the BoardAll Executive and Non-Executive Directors submit themselves for re-election by shareholders annually and Directors appointed during the period since the last annual general meeting are required to seek election at the next annual general meeting under the Company’s articles of association. Dominik de Daniel, who was appointed in 2015 after the last annual general meeting, will seek election at the 2016 annual general meeting.
Time commitmentIn accordance with the terms of their appointment agreements, the Chairman and all Non-Executive Directors are expected to allocate such time as is necessary for the proper performance of their duties as Directors of the Company and are required to advise the Board if there is a change in circumstances which will impact on the time they are able to dedicate to the Company. Copies of all Non-Executives’ appointment agreements are available for inspection at the Company’s Registered Office during normal business hours and at the annual general meeting. Details of other commitments held by the Directors are disclosed on pages 28 and 29.
Douglas Sutherland
Chairman
The Chairman is responsible for leadership of the Board, setting its agenda and monitoring its effectiveness. He ensures effective communication with shareholders and that the Board is aware of the views of major shareholders. He facilitates both the contribution of the Non-Executive Directors and constructive relations between the Executive Directors and Non-Executive Directors, and regularly meets with the Non-Executive Directors without the Executive Directors being present. In addition, he oversees the corporate responsibility activities of the Group, including community projects and environmental impact initiatives.
Mark Dixon
Chief Executive
The Chief Executive is responsible for formulating strategy and for its delivery once agreed by the Board. He creates a framework of strategy, values, organisation and objectives to ensure the successful delivery of key targets, and allocates decision-making and responsibilities accordingly.
Role of Board membersThere is a clear division of responsibilities at the head of the Company between the running of the Board and the running of the Company’s business. No one individual Director has unfettered powers of decision-making and all Directors are required to act in the best interests of the Company.
The Group’s insurance programme is reviewed annually and appropriate insurance cover is obtained to protect the Directors and senior management in the event of a claim being brought against any of them in their capacity as Directors and Officers of the Company.

www.regus.com 33
Strategic report
Go
vernanceFinancial statem
ents
Board performance evaluationAn external evaluation of the Board was carried out by an independent leadership consultancy, Panthea, with experience in conducting such reviews. Panthea also performed the last external review of the board and was selected in order to have the perspective on the development of the Board during the period since the last external review. Another independent evaluator will be chosen for the next external Board review in order to bring other viewpoints to the process. The recent evaluation included a series of one-to-one discussions between the reviewer and each Board member and a review of Board materials. The evaluation results were reviewed by the Board and suggestions are being addressed in our efforts to continuously improve the processes and effectiveness of the Board and its Committees. No reportable matters were noted by the evaluation and we continue to have full confidence in the Board’s members and processes.
The Senior Independent Director annually leads the Non-Executive Directors performance evaluation of the Chairman taking the views of the Executive Directors into account.
Going concernThe Directors, having made appropriate enquiries, have a reasonable expectation that the Group and the Company have adequate resources to continue in operational existence for a period of at least 12 months from the date of approval of the financial statements. For this reason they continue to adopt the going concern basis in preparing the Accounts on pages 55 to 105.
In adopting the going concern basis for preparing the financial statements, the Directors have considered the further information included in the business activities commentary as set out on pages 13 to 17, as well as the Group’s principle risks and uncertainties as set out on pages 21 to 24.
Further details on the going concern basis of preparation can be found in note 24 of the notes to the accounts on page 81.
AccountabilityFinancial and business reportingIn accordance with its responsibilities the Board considers this Annual Report and Accounts, taken as a whole to be fair, balanced and understandable, providing the information necessary for shareholders to assess the Company’s position and performance, business model and strategy. A statement by the Company’s auditor about their responsibilities in relation to the Annual Report and Accounts is included on page 55.
The Board conducts regular reviews of the Group’s strategic direction. Country and regional strategic objectives, plans and performance targets are set by the Executive Directors and are regularly reviewed by the Board in the context of the Group’s overall objectives. Further details of the basis on which the Company generates and preserves value over the longer term and the strategy for delivering the objectives of the Company are contained in the Strategic Report on pages 1 to 27.
Lance Browne
Senior Independent Director
The Senior Independent Director acts as a sounding board and confidant for the Chairman, as an intermediary for other Directors as necessary and leads the appraisal of the Chairman’s performance. He is also available to shareholders if they have concerns that cannot be resolved through normal channels.
Non-Executive Directors
The Non-Executive Directors each bring their own senior-level experience and objectivity to the Board. The independent counsel and challenge brought to the Group by the Non-Executive Directors enhances the development of strategy and the overall decision making of the Board. The Non-Executive Directors scrutinise the performance of management and are responsible for determining appropriate levels of executive remuneration.
Non-Executive Directors are subject to the re-election requirements and serve the Company under letters of appointment, which have an initial three-year term.
Lynsey Blair
Company Secretary
The Company Secretary is responsible for advising the Board, through the Chairman, on all governance matters and ensuring that appropriate minutes are taken of all Board meetings and discussions.

34 Regus plc Annual Report and Accounts 2015
Corporate Governance continued
Longer term viabilityThe Directors have also assessed the viability of the Group and Company over a three-year period to 31 December 2018. This is based on three years of strategic outlook and planning and related stress scenario testing. Whilst the Board has no reason to believe that the Group will not be viable over a longer period, using a three-year period was chosen to give greater certainty over the assumptions used.
In making their assessment, the Directors took account of the further information included in the business activities commentary as set out on pages 13 to 17, as well as the Group’s principal risks and uncertainties and related mitigation approaches as set out on pages 21 to 24. They assessed potential financial and operational aspects of various severe but plausible scenarios in the context of these principle risks and uncertainties and potential combinations thereof along with the likely effectiveness of available mitigating actions.
Based on this assessment, the Directors have a reasonable expectation that the Group and Company will be able to continue in operation and meet all their liabilities as they fall due over the period up to 31 December 2018.
Principal risksThe Board is responsible for assessing the nature and extent of the principal risks it is willing to take to achieve its strategic objectives. The key risks to the Group and the steps taken to manage and mitigate them which were reviewed and approved by the Board are detailed on pages 21 to 24.
The Board has delegated authority for overseeing and reviewing the process of identifying, managing and reviewing risks to the Audit Committee which reports regularly to the Board.
RemunerationRemuneration Committee The Board has established a Remuneration Committee with responsibility for the design and implementation of the remuneration policy for both Executive Directors and the Chairman. In doing so the Committee will pay due regard to wider remuneration trends across the Group, legal requirements and best corporate governance. The aim is to ensure our Remuneration Policy is aligned to Company strategy, key business objectives and the best interests of our shareholders and stakeholders. Further details of the Remuneration Committee’s work is contained on pages 42 to 52. Although not required under Luxembourg law, but in order to maintain transparency, approval for the Company’s Remuneration Policy and the Annual Report on Remuneration will be sought at the annual general meeting.
Internal control systemsThe Board has delegated its responsibility for the Company’s system of internal control and risk management and for ensuring the effectiveness of this system to the Audit Committee. Details of the system and the Committee’s review of its effectiveness are reported on pages 39 and 40.
Audit Committee and auditorsThe Board has established an Audit Committee consisting entirely of Independent Non-Executive Directors. The Audit Committee has responsibility for ensuring the integrity of financial information and the effectiveness of financial controls and the internal control and risk management system. Further details of the Audit Committee’s work and responsibilities are contained on pages 38 to 41.
All members of the Audit Committee are considered by the Board to be independent in character and judgement and are competent in accounting and/or auditing. Furthermore, and in compliance with the Code, the Board regards Elmar Heggen as the Committee member possessing recent and relevant financial experience.
On recommendation of the Audit Committee it is intended that the external audit contract should be put out to tender before June 2018 and it is proposed that KPMG be re-appointed as the auditor for the financial year ending 31 December 2016.
Control environmentHigh standards of behaviour are demanded from staff at all levels in the Group. The following procedures are in place to support this:
A clearly defined organisation structure with established responsibilities;
An induction process to educate new team members on the standards required from them in their role, including business ethics and compliance, regulations and internal policies;
Provision to all team members of a copy of the ‘Team Member Handbook’ which contains detailed guidance on employee policies and the standards of behaviour required of staff;

www.regus.com 35
Strategic report
Go
vernanceFinancial statem
ents
Relations with ShareholdersDialogue with shareholdersThe Company reports formally to shareholders twice a year, with the half-year results typically announced in August and the preliminary final results in March. There are programmes for the Chief Executive and the Chief Financial Officer and Chief Operating Officer to give presentations of these results to the Company’s institutional investors, analysts and media in London and other key locations.
The Chief Executive and the Chief Financial Officer and Chief Operating Officer maintain a close dialogue with institutional investors on the Company’s performance, governance, plans and objectives. These meetings also serve to develop an ongoing understanding of the views and any concerns of the Company’s major shareholders.
On 6 October 2015 Regus hosted a Capital Markets Day, which focussed on providing information to investors on the Group’s strategy and operations.
Non-Executive Directors are given regular updates as to the views of institutional shareholders. The Chairman attends the main presentations of the half year and full year results and is also available to meet with shareholders on request.
The principal communication with private shareholders is through the Annual Report, the half-year results and the annual general meeting.
The Company continues to engage the services of Brunswick as its investor relations adviser.
Annual general meetingThe annual general meeting each year is held in May in Luxembourg and is attended, other than in exceptional circumstances, by all members of the Board. In addition to the formal business of the meeting, there is normally a trading update and shareholders are invited to ask questions and are also
Non-Executive Director is able to gain full awareness of the issues and concerns of major shareholders. Notwithstanding this policy, all Directors have a standing invitation to participate in meetings with investors.
Agreement with controlling shareholderOn 23 September 2014, Mark Dixon entered into a Relationship Agreement with the Company so as to comply with Listing Rule LR 9.2.2A(2)(a), which came into effect on 16 May 2014. The following undertakings were given by Mark Dixon:
• all transactions and relationships with any member of the Group will be conducted on arm’s length terms and on a normal commercial basis;
• no action will be taken that would have the effect of preventing the Company from complying with its obligations under the Listing Rules; and
• no resolution will be proposed, or procured to be proposed, which is intended to, or appears to be intended to, circumvent the proper application of the Listing Rules.
The Company confirms that it has complied with its obligations under the Relationship Agreement during the financial period under review, and that so far as it is aware all other parties to that agreement have complied with it.
The Company confirms that there are no contracts of significance between Mark Dixon and any member of the Group, with the exception of Mark Dixon’s service agreement as a Director of the Company, the terms of which are outlined in the Directors’ Remuneration Report.
given the opportunity to meet the Directors informally afterwards.
Notice of the annual general meeting together with any related documents is required to be mailed to shareholders at least 30 clear days before the meeting and separate resolutions are proposed on each issue.
The voting in respect of all resolutions to be put to the annual general meeting is conducted by means of a poll vote.
The level of proxy votes cast and the balance for and against each resolution, together with the level of abstentions, if any, are announced following voting on a poll. Where the Board considers that a significant proportion of votes have been cast against a resolution, the actions which the Board intends to take to understand the reasons behind the vote result will also be explained.
Financial and other information is made available on the Company’s website: www.regus.com.
Compliance statementThe Company has complied with the provisions of the Code throughout the year ended 31 December 2015, with the exception of the following:
• Provision E.1.1 – The Senior Independent Non-Executive Director Lance Browne does not have regular meetings with major external shareholders.
The Board considers it appropriate for the Chairman to be the main conduit to investors, rather than the Senior Independent Non-Executive Director. The Chairman participates in investor meetings and makes himself available for questions, in person, at the time of major announcements as well as upon request.
The Chairman regularly updates the Board and particularly the Senior Independent Non-Executive Director on the results of his meetings and the opinions of investors. On this basis, the Board considers that the Senior Independent
Policies and procedure manuals and guidelines that are readily accessible through the Group’s intranet site;
Operational audit and self-certification tools which require individual centre managers to confirm their adherence to Group policies and procedures; and
To underpin the effectiveness of controls, it is the Group’s policy to recruit and develop appropriately skilled management and staff of high calibre and integrity and with appropriate disciplines.

36 Regus plc Annual Report and Accounts 2015
seven countries of residence. Along with their international operational experience, they also bring a depth of working knowledge covering multiple industries, business models, corporate cultures, organisational models, functional areas and business issues. Biographical details of the Directors are set out on pages 28 and 29.
Succession planningWe ensure that succession plans are in place for the orderly succession for appointments to the Board and senior management positions, so that there is an appropriate balance of skills and experience within the Company and on the Board. Our aim is for our Board and senior management team to be reflective of the international nature of our business and the communities in which we operate and we are seeking to achieve this through the development of people from all parts of our business, supplemented by the hiring of experienced professionals.
Succession planning discussions are an integral part of the Group’s business planning and review process and the continued development of the management capacity and capabilities within the business enabled succession planning to be addressed in a robust way in 2015.
Details of the gender balance on our Board and within our business are included on page 37 opposite.
Terms of referenceBelow is a summary of the terms of reference of the Nomination Committee, complete details of which are available on the Company’s website (www.regus.com), are:
• Board appointment and composition – to regularly review the structure, size and composition of the Board and make recommendations on the role and nomination of Directors for appointment and reappointment to the Board for the purpose of ensuring a balanced and diverse Board in respect of skills, knowledge and experience.
• Board Committees – to make recommendations to the Board in relation to the suitability of candidates for membership of the Audit and Remuneration Committees. The appointment and removal of Directors are matters reserved for the full Board.
Nomination Committee report
Our aim is for our Board and senior management team to be reflective of the international nature of our business and the communities in which we operate.Lance Browne
Chairman
Dear shareholderI am pleased to present to you my report on the Nomination Committee.
2015 was an important year for the Nomination Committee during which we continued our work to refresh and strengthen your Board. Key activities in 2015 included:
• Identifying and recommending the appointment of François Pauly as Independent Non-Executive Director; François was subsequently appointed to the Board at the Company’s annual general meeting held on 19 May 2015.
• Identifying and recommending the appointment of Dominik de Daniel as an Executive Director holding the combined position of Chief Financial Officer and Chief Operating Officer. Dominik was subsequently appointed by the Board with effect from 1 November 2015 and offers himself for election at the Company’s 2016 annual general meeting.
• Reviewing our succession policy for Executive Director and senior management roles.
Board appointmentsThe Committee’s regular internal Board review process monitors effectiveness, performance, balance, independence, leadership and succession planning enabling us to identify the capabilities and roles required for a particular Board appointment. In view of the future development of the Group and our objective to continue to enhance the diversity of the Board, the Nomination Committee maintains an ongoing programme of engagement with highly qualified potential Non-Executive Directors of varied backgrounds and gender; François Pauly was engaged through this programme and we did not need to make use of a search agency in relation to his appointment. Russell Reynolds Associates provided search services to the Company in respect of Dominik de Daniel’s appointment; they are independent of the Company.
Our recommendations for Board appointments are based on merit whilst reflecting our succession policy of continuing to increase the diversity of the Board over time. Our eight current Board members comprising two women and six men represent six different nationalities and
Length of tenure of Non-Executive Directors within the Committee
1. 0-3 years: 32. 3-6 years: 13. 6-9 years: 2
1
2
3
Members
Attendance (out of possible
maximum number of meetings)
Lance Browne, Chairman 4/4Elmar Heggen 4/4Nina Henderson 4/4François Pauly* 3/3Florence Pierre 4/4Alex Sulkowski** 1/1Douglas Sutherland 4/4
* François Pauly joined the Nomination Committee on 19 May 2015.
** Alex Sulkowski left the Nomination Committee on 19 May 2015.

www.regus.com 37
Strategic report
Go
vernanceFinancial statem
ents
• Board effectiveness – to assess the role of the Chairman and Chief Executive and make appropriate recommendations to the Board.
• Board performance – to assist the Chairman with the annual performance evaluation to assess the performance and effectiveness of the overall Board and individual Directors.
• Leadership – to remain fully informed about strategic issues and commercial matters affecting the Company and to keep under review the leadership needs of the organisation to enable it to compete effectively.
Lance Browne
Chairman, Nomination Committee
Gender split of Board
1. Female: 25%2. Male: 75%
1
2
Gender split of business centre employees
1. Female: 76%2. Male: 24%
1
2
Gender split of Group employees
1. Female: 49%2. Male: 51% 1
2
Our Board compositionAs at the date of this report, the Board comprises eight members: the Chairman (Douglas Sutherland), five Non-Executive Directors and two Executive Directors.
The Board considers all the Non-Executive Directors to be independent.
The names of the Directors serving as at 31 December 2015 and their biographical details are set out on pages 28 and 29.
All Directors served throughout the year under review, except as noted below:
Dominik de Daniel – appointed 1 November 2015
François Pauly – appointed 19 May 2015
Alex Sulkowski – resigned 19 May 2015
Dominique Yates – resigned 1 November 2015
Regus aim to appoint a Board with varied backgrounds and gender to reflect the society in which we operate.
38 Regus plc Annual Report and Accounts 2015
• Internal audit – to monitor and review the annual internal audit programme ensuring that the internal audit function is adequately resourced and free from management restrictions, and to review and monitor responses to the findings and recommendations of the internal auditor.
• External audit – to advise the Board on the appointment, reappointment, remuneration and removal of the external auditor.
• Employee concerns – to review the Company’s arrangements under which employees may in confidence raise any concerns regarding possible wrongdoing in financial reporting or other matters. The Audit Committee ensures that these arrangements allow proportionate and independent investigation and appropriate follow-up action.
The Chairman of the Audit Committee routinely reports to the Board on how the Committee has discharged its responsibilities, as well as highlighting any concerns that have been raised as and when they arise.
Activities of the Audit Committee during the yearThe following sections summarise the main areas of focus of the Committee and the results of the work undertaken in 2015:
Financial reportingOur main focus was the review of the half-year results and this Annual Report together with the formal announcements relating thereto; before recommending these to the Board we ensure that the actions and judgements made by management are appropriate. Particular focus is given to:
• critical accounting policies and practices and changes thereto;
• changes in the control environment;
• control observations identified by the auditor;
• decisions requiring judgements by management;
• adjustments resulting from the audit;
• clarity of the disclosures made and compliance with accounting standards and relevant financial and governance reporting requirements; and
• the process surrounding compilation of the Annual Report and Accounts to ensure they are fair, balanced and reasonable.
Audit Committee report
The Committee’s key objective is to provide effective governance over the Company’s financial reporting.Elmar Heggen
Chairman
Dear shareholderAs Chairman of the Audit Committee (the “Committee”), I am pleased to present to you this year’s Committee report which shows how the Committee applied the principles of the UK Corporate Governance Code during 2015.
Key ObjectiveActing on behalf of the Board, the Committee’s key objective is to provide effective governance over the Company’s financial reporting; this is achieved by monitoring, reviewing and making recommendations to the Board in respect of:
• the integrity of the Company’s external financial reporting;
• the Company’s system of internal control and compliance; and
• the Company’s external auditors.
Membership and meetingsThe Committee currently has five members, all of whom are Independent Non-Executive Directors.
Five Committee meetings were held during 2015. At the request of the Committee Chairman, the external auditors, the Executive Directors, the Company Secretary (acting as secretary to the Committee), the General Counsel and the Business Assurance Director may attend each meeting. The Audit Committee also routinely meets independently, without the presence of management, with the Company’s external auditors and with the Business Assurance Director to informally discuss matters of interest.
ResponsibilitiesSummary terms of reference of the Committee, the full text of which is freely available on the Company’s website (www.regus.com), are:
• Financial reporting – to provide support to the Board by monitoring the integrity of financial reporting and ensuring that the published financial statements of the Group and any formal announcements relating to the Company’s financial performance comply fully with the relevant statutes and accounting standards.
• Internal control and risk systems – to review the effectiveness of the Group’s internal controls and risk management systems.
12
3 1. 0-3 years: 32. 3-6 years: 13. 6-9 years: 1
Members
Attendance (out of possible
maximum number of meetings)
Elmar Heggen, Chairman 5/5Lance Browne 5/5Nina Henderson 5/5François Pauly* 3/3Florence Pierre 5/5Alex Sulkowski** 2/2
* François Pauly joined the Audit Committee on 19 May 2015.
** Alex Sulkowski left the Audit Committee on 19 May 2015.
Length of tenure of Non-Executive Directors within the Committee

www.regus.com 39
Strategic report
Go
vernanceFinancial statem
ents
The Committee discussed and reviewed the following significant issues with KPMG and management in relation to the financial statements for 2015:
• Fair value accounting for business combinations: The Committee has considered the business combinations purchased during the year and the fair value and goodwill accounting valuations in relation thereto. Particular consideration has been given to the assessment of what qualifies as a “business combination” under IFRS and to management’s judgements relating to the non-current assets acquired; The Committee is satisfied that management have adopted balanced accounting policies and made appropriate judgements.
• Valuation of intangibles and goodwill: The Committee has considered the impairment testing undertaken and disclosures made in relation to the value of the Company’s goodwill and intangibles and has challenged the key assumptions made by management in their valuation methodology. The Committee considers that an appropriately cautious approach has been used by management and is satisfied that no impairment of intangibles and goodwill is required. See notes 12 and 13 for further information.
Following its in depth review of this Annual Report the Committee has advised the Board that it considers the Annual Report, taken as a whole, to be fair, balanced and understandable, providing the information necessary for shareholders to assess the Company’s position and performance, business model and strategy. As such the Committee recommended the Annual Report to the Board.
Risk managementOn behalf of the Board, the Audit Committee oversees and reviews an ongoing process for identifying, evaluating and managing the risks faced by the Group. Major business risks and their financial implications are appraised by the responsible executives as a part of the planning process and are endorsed by regional management. Key risks are reported to the Audit Committee, which in turn ensured that the Board is made aware of them. The appropriateness of controls is considered by the executives, having regard to cost, benefit, materiality and the likelihood of risks crystallising. Key risks and actions to mitigate those risks were considered by both the Audit Committee and the Board in the year under review, and were formally reviewed and approved by the Board.
• a system of regular reports from management setting out key performance and risk indicators has been developed.
The above process is designed to provide assurance by way of cumulative assessment and is embedded in operational management and governance processes.
Key elements of the Group’s system of internal control which have operated throughout the year under review are as follows:
• The risk assessments of all significant business decisions at the individual transaction level, and as part of the annual business planning process. A Group-wide risk register is developed annually whereby all Company-inherent risks are identified and assessed, and appropriate action plans developed to manage the risk per the Company’s risk appetite. The Board reviews the Group’s principal risks register annually and management periodically reports on the progress against agreed actions to keep a close watch on how we are managing our key risks.
• The annual strategic planning process, which is designed to ensure consistency with the Company’s strategic objectives. The final budget is reviewed and approved by the Board. Performance is reviewed against objectives at each Board meeting.
• Comprehensive monthly business review processes under which business performance is reviewed at business centre, area, country, regional and functional levels. Actual results are reviewed against targets, explanations are received for all material movements, and recovery plans are agreed where appropriate.
• The documentation of key policies and control procedures (including finance, operations, and health and safety) having Group-wide application. These are available to all staff via the Group’s intranet system.
• Formal procedures for the review and approval of all investment and acquisition projects. The Group Investment Committee reviews and approves all investments. Additionally, the form and content of routine investment proposals are standardised to facilitate the review process.
• The delegation of authority limits with regard to the approval of transactions.
Principal risksThere are a number of risks and uncertainties which could have an impact on the Group’s long-term performance. The Group has a risk management structure in place designed to identify, manage and mitigate business risks. Risk assessment and evaluation is an integral part of the annual planning process, as well as the Group’s monthly review cycle.
The Group’s principal risks, together with an explanation of how the Group manages these risks, are presented on pages 21 to 24 of this Annual Report.
Internal controlThe Committee has a delegated responsibility from the Board for the Company’s system of internal control and risk management and for reviewing the effectiveness of this system. Such a system is designed to identify, evaluate and control the significant risks associated with the Group’s achievement of its business objectives with a view to safeguarding shareholders’ investments and the Group’s assets. Due to the limitations that are inherent in any system of internal control, this system is designed to meet the Company’s particular needs and the risks to which it is exposed, and is designed to manage rather than eliminate risk.
Accordingly, such a system can provide reasonable, but not absolute, assurance against material misstatement or loss.
In accordance with the FRC Revised Guidance, the Committee confirms that there is an ongoing process for identifying, evaluating and managing the significant risks faced by the Group.
During the year under review, the Committee continued to revisit its risk identification and assessment processes, inviting Board members and senior management to convene and discuss the Group’s key risks and mitigating controls.
A risk-based approach has been adopted in establishing the Group’s system of internal control and in reviewing its effectiveness. To identify and manage key risks:
• a number of Group-wide procedures, policies and standards have been established;
• a framework for reporting and escalating matters of significance has been maintained;
• reviews of the effectiveness of management actions in addressing key Group risks identified by the Board have been undertaken; and

40 Regus plc Annual Report and Accounts 2015
• The generation of targeted, action-oriented reports from the Group’s sales and operating systems on a daily, weekly and monthly basis, which provide management at all levels with performance data for their area of responsibility, and which help them to focus on key issues and manage them more effectively.
• The delivery of a centrally co-ordinated assurance programme by the business assurance department that includes key business risk areas. The findings and recommendations of each review are reported to both management and the Committee.
• Annual internal control self-assessment and management certification exercise covering the effectiveness of financial and operational controls. This is based on a comprehensive internal control questionnaire collated and reviewed by business assurance. Results and any necessary mitigating action plans are presented to senior management and the Board.
• The maintenance of high standards of behaviour which is demanded from staff at all levels in the Group. The following procedures are in place to support this:
• a clearly defined organisation structure with established responsibilities;
• an induction process to educate new team members on the standards required from them in their role, including business ethics and compliance, regulation and internal policies;
• the availability of the ‘Team Member Handbook’, via the Group’s intranet, which contains the Company’s Code of Business Conduct, detailed guidance on employee policies and the standards of behaviour required of staff;
• policies, procedure manuals and guidelines are readily accessible through the Group’s intranet site;
• operational audit and self-certification tools which require individual managers to confirm their adherence to Group policies and procedures; and
• a Group-wide policy to recruit and develop appropriately skilled management and staff of high calibre and integrity and with appropriate disciplines.
External auditorsKPMG Luxembourg, Société coopérative was the Company’s auditor for the year ended 31 December 2015. The Audit Committee is responsible for oversight of the external auditor, including an annual assessment of their independence and objectivity and the measures in place to safeguard this.
During the year, the external auditor audited the consolidated financial statements of the Company, performed control observations throughout the Group and provided an overview of the half-year results of the Company.
KPMG Luxembourg, Société coopérative did not perform any significant non-audit services.
Measures in place to safeguard KPMG’s independence were:
• the Company’s policy to use the external auditor for non-audit-related services only where the use of the external auditor will deliver a demonstrable benefit to the Company as compared to the use of other potential providers of the services and where it will not impair their independence or objectivity;
• all proposals for permitted defined non-audit services to use the external auditor must be submitted to, and authorised by, the Chief Financial Officer; permitted non-audit services include advice on financial accounting and regulatory reporting matters, reviews of internal accounting and risk management controls, non-statutory audits (e.g. regarding acquisitions and disposal of assets and interests in companies) and tax compliance and advisory services;
• prohibited non-audit services include book-keeping and other accounting services, actuarial valuation services, recruitment services in relation to key management positions and transaction (acquisitions, mergers and dispositions) work that includes investment banking services, preparation of forecasts or investment proposals and deal execution services; and
• KPMG is required to adhere to a rotation policy requiring rotation of the lead audit partner at least every seven years. A new lead audit partner took responsibility for the audit in respect of the financial year ended 31 December 2015.
The Committee and the Board regard responsible corporate behaviour as an integral part of the overall governance framework and believes, that it should be fully integrated into management structures and systems. Therefore the risk management policies, procedures and monitoring methods described above apply equally to the identification, evaluation and control of the Company’s safety, ethical and environmental risks and opportunities. This approach ensures that the Company has the necessary and adequate information to identify and assess risks and opportunities affecting the Company’s long-term value arising from its handling of corporate responsibility and corporate governance matters.
The Committee has completed its annual review of the effectiveness of the system of internal control for the year to 31 December 2015 and is satisfied that it is in accordance with the FRC Revised Guidance and the Code. The assessment included consideration of the effectiveness of the Board’s ongoing process for identifying, evaluating and managing the risks facing the Group.
Whistle-blowing policyThe Company has an externally hosted whistle-blowing channel (‘EthicsPoint’), which is available to all employees via email, and on the Company’s intranet. The aim of the policy is to encourage all employees, regardless of seniority, to bring matters that cause them concern to the attention of the Audit Committee.
The Business Assurance Director, where appropriate and in consultation with the senior management team, decides on the appropriate method and level of investigation. The Audit Committee is notified of all material discourses made and receives reports on the results of investigations and actions taken on a regular basis. The Audit Committee has the power to request further information, conduct its own inquiries or order additional action as it sees fit.
Audit Committee report continued
www.regus.com 41
Strategic report
Go
vernanceFinancial statem
ents
The breakdown of the fees paid to the external auditor during the year to 31 December 2015 can be found in note 5 of the Notes to the Financial Statements on page 69.
In assessing the effectiveness of the external audit process for 2015 the Committee has considered:
• the audit process as a whole and its suitability for the challenges facing the Group;
• the strength and independence of the external audit team;
• the audit team’s understanding of the control environment;
• the culture of the external auditor in seeking continuous improvement and increased quality;
• the quality and timeliness of communications and reports received; and
• the quality of interaction with management.
Following the Committee’s assessment of the effectiveness of the external audit process for 2015 and of KPMG’s continuing independence, the Committee has recommended to the Board that a resolution to reappoint KPMG Luxembourg, Société coopérative as the Company’s auditor in respect of the financial year ending 31 December 2016 be proposed at the annual general meeting.
KPMG has been the Company’s external auditor since 2008. In light of the new EU legislation regarding auditor independence and rotation, the Committee has recommended to the Board that it is in the best interests of the Company for the Committee to launch a tendering process before June 2018 in respect of the financial year ending 31 December 2018. The Committee has debated the advantages and disadvantages related to tendering the Regus external audit prior to this and concluded that given the significant level of other changes which remain ongoing, including the mix of countries in which much of the audit work is conducted, the rapid growth and evolving structure of the Group, changes in financial organisation and personnel, ongoing efforts to continue to improve audit effectiveness with the existing external auditor, and other factors, that it was not appropriate or in the interest of shareholders to bring this timeline forward.
Elmar Heggen
Chairman, Audit Committee

42 Regus plc Annual Report and Accounts 2015
12
3 1. 0-3 years: 32. 3-6 years: 13. 6-9 years: 1
We are proposing three principal changes to the Remuneration Policy for Executive Directors. Our objective is to simplify the Remuneration Policy, set remuneration levels which reflect the size and scope of the Group and our corporate strategy and incorporate performance hurdles for variable pay. These changes are explained below.
1. Repositioning of base salaries to reflect the increased size and scale of the GroupCurrent salaries for Mark Dixon (and formerly Dominique Yates) were set in the context of the Company’s positioning five years ago which was towards the bottom end of the FTSE 350, when the scale of the Group’s operations was significantly smaller. The appointment of Dominik de Daniel to the position of Chief Operating Officer and Chief Financial Officer represents a significantly expanded role. This newly created position requires pay considerably above the level of the previous stand-alone Chief Financial Officer role. Dominik de Daniel’s salary on appointment is £725,000.
In addition to positioning ourselves competitively when recruiting externally, we must also set salaries appropriately for those already within the organisation. Accordingly, from 1 January 2016 Mark Dixon’s salary was increased to £825,000. While this is a significant increase from the current level, we believe it is the right decision for the Company in the context of the external environment to reflect the market rate for an executive who has led the Company through a period of outstanding success and who continues to implement an ambitious profitable growth strategy.
2. Increase to bonus potential with compulsory deferralUnder the current policy, there is a significant weighting towards fixed pay. This no longer adequately reflects our philosophy of pay for performance and longer term alignment with equity ownership, and nor is it usual in the market in general. We therefore propose to raise the maximum bonus opportunity for the Executive Directors at Regus to 150% of salary (with 90% of salary paid for target performance) and to introduce compulsory deferral of half of bonus into shares, vesting after three years.
3. Introduction of a single Performance Share Plan (“PSP”)Our current policy of linking long-term reward potential under the Co-Investment Plan (“CIP”) with the outcome of performance under the annual bonus is unusual. The potential reward under the CIP is reliant entirely upon short-term
Directors’ Remuneration report
The Committee’s challenge is to ensure that we set a policy that enables us to motivate our people and recruit the calibre of talent that will lead the Company in sustaining its record of profitable growth. Nina Henderson
Chairman
Dear shareholder I am pleased to present this Directors’ Remuneration Report, which follows a year in which the Company has continued to make excellent progress.
The Committee’s challenge is to ensure that we set a policy that enables us to motivate our people and recruit the calibre of talent that will lead the Company in sustaining its record of profitable growth. In last year’s report, the Committee committed to review the remuneration framework for Executive Directors during 2015. The review’s objectives were to create a structure that is competitive, aligned with our strategic objectives and is straightforward.
There are three sections to this report. This letter summarises the 2015 highlights and explains the changes we are making to the Remuneration Policy with effect from 2016. Our new Remuneration Policy follows in full on pages 44 to 47. Finally, the Annual Report on Remuneration on pages 48 to 52 describes the amounts paid to Directors in respect of 2015 and describes how we intend to implement the policy for 2016.
Context for changesOver the last five years Regus has demonstrated continued growth and sustained strong performance. Revenues have increased by over 85% and EPS has grown from 0.3p to 12.8p. This sustained financial growth has been reflected in our share price and market value. Continued strong revenue and profit growth in 2015, combined with a return on investment of 11.4% gives us confidence in the future and in our ability to meet our long-term goals to continue to expand globally.
Growth of this nature brings new challenges and demands. A key driver of the Company’s growth has been and will continue to be its people and their talents. The Company’s human resource continues to evolve adding new capabilities and skills. For example, the creation of our new role of Chief Financial Officer and Chief Operating Officer, with Dominik de Daniel appointed to this role effective from 1 November 2015.
Summary of main changesOur Remuneration Policy for senior management continues to evolve with the growth in size and scale of the Company, The policy must enable us to hire and retain top talent with the capability to lead the Company on its journey of continued growth. We seek to ensure that our remuneration structure provides alignment with our shareholders and is straightforward and transparent.
Length of tenure of Non-Executive Directors within the Committee
Members of the CommitteeAll members of the Committee are independent. Committee membership during the year and attendance at the meetings is set out below:
Member
Attendance (out of possible
maximum number of meetings)
Nina Henderson, Chair 4/4Lance Browne 4/4Elmar Heggen 4/4François Pauly* 3/3Florence Pierre 4/4Alex Sulkowski** 1/1
* François Pauly joined the Remuneration Committee on 19 May 2015.
** Alex Sulkowski left the Remuneration Committee on 19 May 2015.

www.regus.com 43
Strategic report
Go
vernanceFinancial statem
ents
performance captured in the annual bonus and subject to an executive’s ability to invest via the voluntary deferral mechanism. This is complex, disproportionately favourable to higher earning executives, and not in line with prevailing best practice. Accordingly, from 2016, shareholder approval will be sought for a new PSP, and the CIP will no longer be used.
Under the PSP an annual grant policy will be followed (initially 200% of salary). The first awards under the PSP will be made in early 2016 and will replace any CIP grants which would have otherwise been made in 2016.
For the first awards, the PSP will operate with three performance metrics, designed to align closely with our current growth strategy. These will be relative TSR vs the FTSE 350, EPS growth and return on invested capital.
As before, clawback provisions will apply.
Performance and reward in 2015 As highlighted in the strategic report on pages 1 to 27, 2015 was a strong year delivering attractive shareholder returns. The chart to the right shows the growth in EPS per share achieved from 2010 (0.3p) to 2015 (12.8p). The TSR graph on page 52 shows that as at 31 December 2015, the value of £100 invested in Regus shares on 31 December 2008 would be worth £789, as compared to a value of £197 if £100 were invested in the FTSE 350 (excluding Investment Trusts).
Annual bonusThe 2015 bonus plan was based on performance against an operating profit target. The achieved operating profit of £144.8 for 2015 exceeded the operating profit target for full bonus while maintaining our growth objectives, therefore bonuses were paid at 100%.
Co-Investment PlanThe performance metrics utilised in respect of the CIP Matching Shares granted in 2013 which vested during 2015 were adjusted EPS and relative TSR. As a result of strong performance against both measures, the CIP vested at 97%.
ConclusionYou will be asked to approve four remuneration-related resolutions at our annual general meeting:
First, our revised Remuneration Policy will be put to shareholders for approval. As a Luxembourg registered company, this is not a statutory requirement. However, the Committee is committed to upholding the highest governance standards and a full and open dialogue with shareholders. In developing our proposals, we actively consulted with all of our largest institutional shareholders. The feedback we received has been both supportive and constructive.
Secondly, the Annual Report on Remuneration which will be subject to an advisory vote.
Finally, approval is sought for our new Performance Share Plan and Deferred Bonus Share Plan.
On behalf of the Committee, I commend this report to you and ask for your support at the forthcoming annual general meeting.
Nina Henderson
Chairman of the Remuneration Committee
Key features of our framework for 2016
Salary
Benefits/pension
50% deferred
Deferred shares
Performance Share Plan awards
Annual bonus
• Repositioned to reflect the increased size and scale of the Group
• Repositioned to reflect increased responsibilities
• Reflect location and nature of role
• Maximum 200% of salary
• Based on stretching EPS, TSR and ROI targets over three years
• Clawback and withholding provisions apply
• Three-year performance period • Five-year vesting period
• Maximum 150% of salary
• Based on stretching operating profit targets for the year
• 50% in deferred shares
• Clawback and withholding provisions apply
• Three-year holding period
Earnings per share (pence)
0
3
6
9
12
15
1413121110
7.47.17.5
4.3
0.315
12.8
year

44 Regus plc Annual Report and Accounts 2015
Policy Table for Executive Directors
ComponentPurpose / link to strategy Operation Maximum Performance framework
Base salary To provide a competitive component of fixed remuneration to attract and retain people of the highest calibre and experience needed to shape and execute the Company’s strategy.
Salaries are set by the Committee. The Committee reviews all relevant factors such as: the scope and responsibilities of the role, the skills, experience and circumstances of the individual, sustained performance in role, the level of increase for other roles within the business, and appropriate market data.
Salaries are reviewed annually and any changes normally made effective from 1st January.
The base salaries effective 1st January 2016 are set out on page 48 of the Annual Report on Remuneration.
There is no prescribed maximum salary. Salary increases will normally be broadly in line with increases awarded to other employees in the business, although the Committee retains discretion to award larger increases if it considers it appropriate (e.g. to reflect a change in role, development and performance in role, or to align to market data).
While there are no performance targets attached to the payment of salary, performance is a factor considered in the annual salary review process.
Benefits To provide a competitive benefits package.
Incorporates various cash / non-cash benefits which may include: a company car (or allowance) and fuel allowance, private health insurance, life assurance, and, where necessary, other benefits to reflect specific individual circumstances, such as housing or relocation allowances, representation allowances, reimbursement of school fees, travel allowances, or other expatriate benefits.
Benefit provision is set at an appropriately market competitive rate for the nature and location of the role. There is no prescribed maximum as some costs may change in accordance with market conditions.
N/A
Pension To provide retirement benefits in line with the overall Group policy.
Provided through participation in the Company’s money purchase (personal pension) scheme, under which the Company matches individual contributions up to a maximum of base salary.
The Company may amend the form of an Executive Director’s pension arrangements in response to changes in legislation or similar developments.
7% of base salary. The Committee may set a higher level to reflect local practice and regulation, if relevant.
N/A
Directors’ Remuneration report continued
Remuneration PolicyThis Remuneration Policy, as determined by the Remuneration Committee, will be effective from 1 January 2016 subject to shareholder approval at the 2016 annual general meeting. This policy supersedes that approved by shareholders in 2014.
Overview of Remuneration PolicyThe revised policy, which was developed as part of a remuneration review carried out during last year, has the following objectives:
• To enable the Group to recruit and retain individuals with the capability to lead the Company on its ambitious future growth path;
• To ensure that our structures are transparent and capable of straightforward explanation externally and to employees;
• To align the targets for variable pay with the strategic objectives for the Group; and
• To reflect the global operating model of the Group while recognising governance best practice.
As a result of this remuneration review, the following key changes are proposed to our remuneration arrangements for Executive Directors:
• Annual bonus – Under the previous policy there was a significant weighting towards fixed pay, which was not aligned with our philosophy of pay for performance, longer term alignment and equity ownership. As a result the maximum bonus potential for Executive Directors will be increased from 100% of base salary to 150% with compulsory deferral of half of any bonus paid for three years. Awards are subject to recovery and with-holding provisions.
• Introduction of a single PSP – Our previous share-matching arrangement, the CIP, was linked to the outcome of performance under the annual bonus and as a result, the potential reward was reliant entirely
upon short-term performance. In order to provide a clearer focus on long-term performance, and reduce complexity, the CIP will be terminated and replaced with a single PSP. As with the annual bonus, PSP awards are subject to recovery and withholding.
• Introduction of shareholding guidelines – In line with best practice and to ensure long-term alignment with shareholders, shareholding guidelines of a minimum of 200% of base salary will be introduced.
• Clarification of recruitment and termination payments – The policy has been clarified to ensure alignment with best practice and to encompass new elements of the Executive’s packages, primarily the PSP.

www.regus.com 45
Strategic report
Go
vernanceFinancial statem
ents
ComponentPurpose / link to strategy Operation Maximum Performance framework
Annual bonus To incentivise and reward annual performance and create further alignment with shareholders interests via the delivery and retention of deferred equity.
Provides an opportunity for additional reward (up to a maximum specified as a % of salary) based on annual performance against targets set and assessed by the Committee.
Half of any annual bonus paid will be in deferred shares which will vest after three years, subject to continued employment but no further performance targets. The other half is paid in cash following the relevant year end.
A dividend equivalent provision allows the Committee to pay dividends, at the Committee’s discretion, on vested shares (in cash or shares) at the time of vesting and may assume the reinvestment of dividends on a cumulative basis.
Recovery and withholding provisions apply to bonus awards (see note 1 below).
150% of base salary per annum.
Performance metrics are selected annually based on the current business objectives. The majority of the bonus will be linked to key financial metrics, of which there will typically be a significant profit-based element (see note 3 below).
Performance below threshold results in zero payment, with no more than three-fifths of the bonus available at target. Payments rise from 0% to 100% of the maximum opportunity levels for performance between the threshold and maximum targets.
Performance Share Plan(“PSP”)
Motivates and rewards the creation of long-term shareholder value.
Aligns Executive Directors’ interests with those of shareholders.
Awards will normally be made annually under the PSP, and will take the form of either nil-cost options or conditional share awards. Participation and individual award levels will be determined at the discretion of the Committee within the policy.
Awards vest five years following grant, subject to performance against pre-determined targets (measured after three years) which are set and communicated at the time of grant.
Recovery and withholding provisions apply to PSP awards (see note 1 below).
A dividend equivalent provision allows the Committee to pay dividends, at the Committee’s discretion, on vested shares (in cash or shares) at the time of vesting and may assume the reinvestment of dividends on a cumulative basis.
The normal plan limit is 250% of base salary.
Awards have a performance period of three financial years starting at the beginning of the financial year in which the award is made. Performance conditions will measure the long-term success of the Company (see note 4 below).
In respect of each performance measure, performance below the threshold target results in zero vesting. The starting point for the vesting of each performance element will be no higher than 25% and rises on a straight-line basis to 100% for attainment of levels of performance between the threshold and maximum targets. There is no opportunity to re-test.
Shareholding guidelines
To align Executive Directors’ interests with those of our long-term shareholders and other stakeholders.
Executive Directors are expected to build a holding in the Company’s shares to a minimum value of two times their base salary. This must be built via the retention of the net-of-tax shares vesting under the Company’s equity based share plans.
N/A N/A
Notes to the policy table:
1) Recovery and withholding provisions may be applied as a result of misconduct, material misstatement or error in calculation of performance. Awards subsequent to the grant but before the expiry of the holding period, may be reduced or an Executive Director may be required to repay an award at any time within three years of the date on which the award vests.
2) For the avoidance of doubt, by approval of the policy, authority has been given to the Company to honour any commitments entered into with current or former Directors (such as the payment of a pension or the unwinding of legacy share schemes) that have been disclosed to shareholders in previous Directors’ Remuneration Reports. Details of any payments to former directors will be set out in the Annual Report on Remuneration as they arise. The previous Remuneration Policy included the CIP which is being replaced by the new PSP. Under the CIP, Executive Directors could defer a proportion of their bonus into shares and receive a performance based matching award for each deferred share. The final CIP awards were made in March 2015. Details of this award are set out in the Annual Report on Remuneration. Subject to satisfaction of the relevant performance targets, the final CIP awards will be fully vested and exercisable from 4 March 2020 until 4 March 2025.
3) Annual bonus performance measures are determined at the start of each year, based on the key business priorities for the year. The majority will be based on clear financial targets, including a significant weighting towards profit, as this is the primary indicator of our sustainable growth.
4) PSP performance metrics are determined at the time of grant. Performance measures may include measures of profits and profitability (such as EPS), capital return (such as EVA or ROI) and other measures of long-term success (such as relative TSR). These measures align with our long-term goal of value creation for shareholders through underlying financial growth and above-market returns.

46 Regus plc Annual Report and Accounts 2015
Directors’ Remuneration report continued
5) As Regus operates in a number of geographies employee remuneration practices vary across the Group to reflect local market practice. However, employee remuneration policies are based on the same broad principles. Our primary objective in awarding variable pay is to drive achievement of results, according to role, and to recognise and reward excellent performance. Accordingly, to account for variances in responsibilities, influence and seniority, incentive schemes are not uniform in approach.
6) In order to ensure that the Remuneration Policy achieves its intended aims, the Remuneration Committee retains discretion over the operation of certain elements of the variable pay policy. This includes the discretion to adjust the annual bonus and PSP outcome if it is not considered to be reflective of the wider performance of Regus. In addition the Committee may adjust elements of the plans including, but not limited to:
• Participation;
• The timing of the grant of award and/or payment;
• The size of an award (up to plan limits) and/or payment;
• Discretion relating to the measurement of performance in the event of a change of control;
• Determination of a good leaver (in addition to any specified categories) for incentive plan purposes;
• Adjustments required in certain circumstances (e.g. rights issues, corporate restructuring and special dividends); and
• The ability to recognise exceptional events within existing performance conditions.
Should any such discretions be exercised, an explanation would be provided in the following Annual Report on Remuneration and may be subject to shareholder consultation as appropriate.
7) The Committee reserves the right to make any remuneration payments and payments for loss of office (including exercising any discretions available to it in connection with such payments) notwithstanding that they are not in line with the policy set out above where the terms of the payment were agreed (i) before the policy came into effect or (ii) at a time when the relevant individual was not a Director of the Company and, in the opinion of the Committee, the payment was not in consideration for the individual becoming a Director of the Company. For these purposes “payments” includes the Committee satisfying awards of variable remuneration and, in relation to an award over shares, the terms of the payment are “agreed” at the time the award is granted. The Committee may make minor amendments to the policy set out above (for regulatory, exchange control, tax or administrative purposes or to take account of a change in legislation) without obtaining shareholder approval for that amendment.
Policy table for the Chairman and Non-Executive Directors
Component Operation Maximum fee Performance framework
Chairman fees
Reviewed, but not necessarily increased, annually and as determined by the Remuneration Committee. The Committee will consider, where appropriate, pay data at companies of a similar scale.
A single fee which reflects all Board and Committee duties.
Set at a level sufficient to attract and retain individuals with the required skills, experience and knowledge to allow the Board to effectively carry out its duties.
There is no prescribed maximum although fees and fee increases will be considered in line with the increases of the wider workforce and market rates.
Neither the Chairman nor the Non-Executive Directors are eligible for any performance-related remuneration.
Non-Executive Director fees
Reviewed, but not necessarily increased, annually and as determined by the Chairman and the Executive Directors. The Committee will consider, where appropriate, pay data at companies of a similar scale.
A base fee is payable with additional fees for chairing key Board Committees and for being the Senior Independent Director.
Set at a level sufficient to attract and retain individuals with the required skills, experience and knowledge to allow the Board to effectively carry out its duties.
Consideration of conditions elsewhere in the GroupWhen setting the policy for the remuneration of the Executive Directors, the Committee has regard to the pay and employment conditions of employees within the Group. The Committee does not consult directly with employees when formulating the remuneration policy for Executive Directors.
Consideration of shareholder viewsThe Committee is dedicated to ensuring that Regus shareholders understand and support our remuneration structures. Accordingly, where changes are being made to the Remuneration Policy, or in the event of a significant exercise of discretion we will consult with shareholders, as appropriate, to explain our approach and rationale fully.
Such an approach was followed in relation to the changes to policy for 2016. Additionally, the Committee considers shareholder feedback received in relation to each annual general meeting alongside any views expressed during the year. We actively engage with our largest shareholders and consider the range of views expressed. Except for in exception circumstances the members of the Committee, including the Committee Chairman, attend the Company’s annual general meeting and are available to listen to views and to answer shareholders’ questions about Directors’ remuneration.
The Committee also reviews the executive remuneration framework in the context of published shareholder guidelines.
Approach to recruitment remunerationWhen determining the remuneration package for a newly appointed Executive Director, the Committee would seek to apply the following principles:
• The package must be sufficiently competitive to facilitate the recruitment of individuals of the highest calibre and experience needed to shape and execute the Company’s strategy. At the same time, the Committee would seek to pay no more than necessary.
• The remuneration package for a new Executive Director would be set in accordance with the terms of the approved remuneration policy in force at the time of the appointment. Salaries would reflect the skills and experience of the individual, and may (but not

www.regus.com 47
Strategic report
Go
vernanceFinancial statem
ents
necessarily) be set at a level to allow future salary progression to reflect performance in role.
• The Committee may offer additional cash and/or share-based payments in the year of appointment when it considers these to be in the best interests of the Company and, therefore, shareholders. Per the remuneration policy the maximum level of variable remuneration which may be awarded is 400% of salary (of which 250% is permitted under the PSP under the exceptional circumstances limit and 150% under the annual bonus plan). Performance conditions for variable pay in the year of appointment may be different to those applying to other directors, which would be subject to stretching performance conditions.
• Where an individual forfeits remuneration at a previous employer as a result of appointment to the Company, the Committee may offer compensatory payments or awards to facilitate recruitment. Such payments or awards could include cash as well as performance and non-performance-related share awards, and would be in such form as the Committee considers appropriate taking into account all relevant factors such as the form, expected value, anticipated vesting and timing of the forfeited remuneration. The aim of any such award would be to ensure that so far as possible, the expected value and structure of the award will be no more generous than the amount forfeited.
• Any share-based awards referred to in this section will be granted as far as possible under the Company’s existing share plans. If necessary, awards may be granted outside of these plans as permitted under the Listing Rules, and in line with the approach and the limits set out above.
In the case of an internal appointment, variable pay awarded in respect of the incumbent’s prior role may pay out according to its terms of grant. In addition, any other ongoing remuneration obligations prior to their appointment may continue, provided that they are put to shareholders for approval at the first annual general meeting following their appointment.
The remuneration package for a newly appointed Non-Executive Director would normally be in line with the structure set out in the Policy Table for Non-Executive Directors on page 46.
Service contracts Executive Directors have service contracts with the Group which can be terminated by the Company or the Director by giving 12 months’ notice. This applies to current Executive Directors and would normally be applied as the policy for future appointments.
The Company may terminate employment of the Chief Executive by making a payment in lieu of notice which would not exceed 12 months’ salary.
Under the current service agreements Mark Dixon’s contract provides that, on a change of control he may terminate the contract by giving one month’s notice and will, in addition to contractual payments for the one-month notice period, receive a payment equal to 12 months’ salary, and remain eligible for a discretionary bonus.
The Chairman and Non-Executive Directors are appointed for a three year term, which is renewable, with six months’ notice on either side, no contractual termination payments being due and subject to retirement pursuant to the Articles of Association at the annual general meeting.
Policy on payment for loss of officeWhere an Executive Director leaves employment, the Committee’s approach to determining any payment for loss of office will normally be based on the following principles:
• The Committee’s objective is to find an outcome which is in the best interests of the Company and its shareholders, taking into account the specific circumstances, contractual obligations and seeking to pay no more than is warranted. Payments in lieu of notice will not exceed 12 months’ salary and benefits.
• Treatment of annual bonus: There is no contractual right to receive an annual bonus in the year of termination. However the Committee has discretion for certain leavers to make a payment under the annual bonus. This will reflect the period of service during the year and performance (measured at the same time as performance for other plan participants, if feasible). Should the Committee make a payment in these circumstances, the rationale would be set out in the following Annual Report on Remuneration.
• Treatment of share plans: If an Executive Director leaves employment with the Company unvested PSP and deferred bonus shares will lapse unless the
Committee in its absolute discretion determines otherwise for reasons including, amongst others, injury, disability, retirement, redundancy and death. In such circumstances an Executive Director’s award normally vests based on the time served and in the case of the PSP, achievement of performance criteria.
Should the Committee adjust the time pro-rating, then this would be explained in the following Annual Report on Remuneration. If the Executive Director ceases to be an employee for any reason other than those specified above then the award shall lapse immediately on such cessation.
The terms of any other unvested share awards on termination will be as set out in the prior policy.
Awards will vest on the normal vesting date unless the Committee determines, in its discretion, that awards will vest at the date of cessation.
The Committee reserves the right to make additional exit payments where such payments are made in good faith in discharge of an existing legal obligation (or by way of damages for breach of such an obligation) or by way of settlement or compromise of any claim arising in connection with the termination of a Director’s office or employment.
Policy in Respect of External Board Appointments for Executive DirectorsIt is recognised that external non-executive directorships may be beneficial for both the Company and Executive Director. At the discretion of the Board, Executive Directors are permitted to retain fees received in respect of any such non-executive directorship.

48 Regus plc Annual Report and Accounts 2015
Illustration of Remuneration PolicyThe charts opposite illustrate the application of the Remuneration Policy set out in the Policy Table for Executive Directors. This assumes the level of fixed remuneration (salary, benefits and pension) as at 1 January 2016 and the following in respect of each scenario:
• “Minimum” represents fixed remuneration only (i.e. current salary, benefits and pension).
• “Target” represents fixed remuneration plus three-fifths of the maximum annual bonus award and threshold (25%) vesting of the PSP award
• “Maximum” represents the maximum annual bonus of 150% of salary and full vesting of the normal PSP grant of 200% of base salary.
Directors’ Remuneration report continued
Members of the CommitteeAll members of the Committee are independent. Committee membership during the year and attendance at the meetings is set out on page 42. In addition to the designated members of the Remuneration Committee, the Chairman, Chief Executive Officer and Company Secretary also attended Committee meetings during the year although none were present during discussions concerning their own remuneration.
Terms of referenceThe Committee’s terms of reference are available on the Company’s website (www.regus.com).
Implementation of the Remuneration Policy for 2016As summarised within the introductory letter, and set out fully within the Remuneration Policy section, a series of amendments to the Executive Directors’ Remuneration Policy are proposed. Details of how we intend to operate our policy in 2016, subject to shareholder approval, are outlined below.
Base salaries for the Executive Directors The salaries for the Executive Directors for 2016 (and compared to 2015) are as follows. Dominik de Daniel was appointed with effect from 1 November 2015, and his salary will first be reviewed with effect from 1 January 2017.
Salary 2015 Salary 2016Percentage
increase
Mark Dixon £587,000 £825,000 41%Dominik de Daniel £725,000 £725,000 0%
Current salaries for Mark Dixon (and formerly Dominique Yates) were set in the context of the Company’s positioning five years ago which was towards the bottom end of the FTSE 350, when the scale of the Group’s operations was significantly smaller. With the appointment of Dominik de Daniel as Chief Financial Officer and Chief Operating, it was necessary to pay considerably above the level of the previous Chief Financial Officer. Dominik de Daniel’s salary on appointment is £725,000.
As well as positioning ourselves competitively when recruiting externally, we must also set salaries appropriately for those already within the organisation. Accordingly, from 1 January 2016 Mark Dixon’s salary was increased to £825,000. While this is a significant increase from the current level, we believe it is the right decision for the Company in the context of the external environment to reflect the market rate for an executive who has led the Company through a period of outstanding success and is effectively implementing an ambitious profitable growth strategy.
Annual BonusFor 2016, the maximum bonus potential for both Executive Directors is 150% of salary. The on-target bonus is 90% of salary. Half of any bonus paid will be deferred into shares, which will vest after three years subject to continued employment.
The 2016 annual bonus will include a measurement against an operating profit target ranging from threshhold to stretch. The target is not being disclosed prospectively as it is commercially sensitive; however a description of relative performance will be included in next year’s Annual Report.
Performance Share Plan (PSP)PSP awards will be made at 200% of salary to Executive Directors, subject to shareholder approval of the revised Remuneration Policy and the new PSP.
Annual Report on Remuneration
Chief Executive Officer
Fixed Target Maximum Fixed Target Maximum
Chief Financial Officerand Chief Operating Officer
Annual Bonus Fixed
PSP
0
£1
£2
£3
£4
100% 46%
43% 43%
11%33% 11%
33%
44%44%
23% 100% 46% 23%
£m

www.regus.com 49
Strategic report
Go
vernanceFinancial statem
ents
Remuneration outcomes for 2015Single total figure of remuneration tableThe following table shows the total remuneration in respect of the year ending 31 December 2015, together with the prior year comparative.
£’000Salary / fees Benefits Pension Annual bonus CIP Total2015 2014 2015 2014 2015 2014 2015 2014 2015 2014 2015 2014
Mark Dixon 587.0 587.0 6.0 6.6 41.1 41.1 587.0 587.0 769.5 1,548.5 1,990.6 2,770.2Dominik de Daniel 120.8 – – – 8.5 – 120.8 – – – 250.1 –Dominique Yates 279.4 320.8 111.5 125.2 26.5 31.7 279.4 320.8 393.4 – 1,090.2 798.5Non-Executive DirectorsDouglas Sutherland 200.0 165.0 – – – – – – – – 200 165.0Lance Browne 69.5 61.5 – – – – – – – – 69.5 61.5Elmar Heggen 60.0 50.0 – – – – – – – – 60.0 50.0Nina Henderson 67.5 30.5 – – – – – – – – 67.5 30.5Florence Pierre 52.5 27.4 – – – – – – – – 52.5 44.5François Pauly 30.9 – – – – – – – – – 30.9 –Alex Sulkowski 19.2 50.0 – – – – – – – – 19.2 50.0
The salary, benefits, pension and cash element of the bonus for Dominique Yates were paid in Swiss francs and have been converted to sterling for the table above using the average exchange rate for the relevant year. Dominique Yates stepped down from the Board on 1 November 2015. His salary, benefits, pension, annual bonus and CIP have been pro-rated to reflect his period of qualifying service.
Dominik de Daniel was appointed to the Board on 1 November 2015. Remuneration detailed above reflects time served.
Benefits – Include private health insurance and life insurance and for Dominique Yates, a representation allowance and expatriate allowances.
Pension – Includes pension contributions of 7% of salary into defined contribution arrangements (or cash equivalent) plus any contributions in accordance with standard local practice or employment regulations.
Annual bonus – The bonus shown is the full awarded bonus in respect of the relevant financial year for the period served as a Director.
CIP awards – Includes the value of Matching Share awards made to Mark Dixon and Dominique Yates under the CIP in previous years which vested in respect of a performance period ending in the relevant financial year. The vesting of the final tranche of the 2008/2009 Matching Shares is included in the 2014 column (820,205 shares vested out of the maximum of 954,420). The vesting of the first tranche of the 2013 Matching Shares is included in the 2015 column (371,485 shares vested out of the maximum of 380,011). The figure reflects the average market price of shares in the last quarter of 2015, being 313.028p per share.
François Pauly joined the Board with effect from 19 May 2015.
Alex Sulkowski stepped down from the Board with effect from 19 May 2015.
Determination of 2015 Annual BonusThe 2015 bonus plan was based on performance against an operating profit target. The achieved operating profit of £144.8 exceeded the operating profit target for full bonus while maintaining our growth objectives, therefore bonuses were paid at 100%.
Dominik de Daniel’s bonus was pro-rated for the two month period served during the year.
The awards will be subject to three independently operated performance metrics as summarised below:Performance conditions Threshold vesting Threshold Maximum
EPS (33.3% weighting) 0% Compound annual growth of 5% Compound annual growth of 25%
Relative TSR versus FTSE 350 (excluding investment trusts) (33.3% weighting)
25% Median 10% compound annual growth above median
Return on investment (33.3% weighting) 0% Return to be equal to 2015 performance Return to be 300 basis points above 2015 performance
The first awards under the PSP will be made in early 2016 and will replace any CIP grants that would otherwise have been made in 2016.
Chairman and Non-Executive Directors’ feesThe Directors’ fees for 2016 are as outlined below:
£’000 2015 2016Percentage
change
Non-Executive Chairman 200 200 0%Basic fee for Non-Executive Director 50 50 0%Additional fees:
Chair of Audit Committee 10 10 0%Chair of Remuneration Committee 10 10 0%Chair of Nomination Committee 6 6 0%Senior Independent Director 6 6 0%Variable dislocation allowance for non-Luxembourg directors1 2.5 to 7.5 2.5 to 7.5 0%
1) The level of dislocation allowance for non-Luxembourg directors is determined according to their country of residence.

50 Regus plc Annual Report and Accounts 2015
CIP awards vesting in respect of 2015The 2013 Matching Share award is divided into three separate equal tranches subject to performance periods over three, four and five years respectively from 1 January 2013. The first tranche of the 2013 Matching Share award was based on a three-year performance period to 31 December 2015. The vesting conditions for this tranche are outlined below.
TSR target (25% of tranche)
Regus TSR % achieved relative to FTSE All Share Total Return Index% of shares
vesting
Below the Index 0%Equal to the Index 25%Equal to the Index + 15% p.a. 100%
EPS target (75% of tranche)
EPS targets for year ending 2015 (Tranche 1)% of shares
vesting
12.0p 25%12.6p 50%13.3p 75%14.0p 100%
The Committee has assessed performance against the TSR and EPS targets set in 2013 and concluded that 97% of the total award should vest (and the remainder of that tranche shall lapse).
• TSR (25% of total award). From a base point of 100%, Regus achieved a TSR value of 243.3% compared to 24.9% for the FTSE All Share Index over the performance period, equating to a vesting of 100% of this part of the award.
• EPS (75% of total award). Based on achieving a 2015 EPS of 13.9p, which reflects underlying performance delivered during the three-year performance period, the Committee concluded that 97% of this part of the award should vest.
CIP granted during the financial yearThe Executive Directors deferred 50% of their 2014 annual bonus into Investment Shares under the CIP.
For each Investment Share held the Executive Directors may earn up to a maximum of four Matching Shares. The Matching Shares will be released in March 2020 at the end of the holding period, subject to continuous employment with the Group and the achievement of EPS and TSR performance conditions. As the Investment Shares had a value of 50% of salary the maximum number of Matching Shares awarded in 2015 was equivalent to 200% of salary.
Details of the Investment Share and Matching Share awards made during 2015 to the Executive Directors are shown in the table below. Executive Director Type of interest Face value (£’000) Threshold vesting End of holding period
Mark Dixon Investment Shares 293.5 N/A 3 March 2018Matching Shares 1,174.0 25% 3 March 2020
Dominique Yates Investment Shares 167.8 N/A 3 March 2018Matching Shares* 670.9 25% 3 March 2020
* Dominique Yates will leave the Group in 2016 and therefore the Matching Shares awarded to Dominique Yates will lapse.
The face value has been calculated using the share price of 221.8p, the closing price prior to the date of grant (4 March 2015).
The vesting of the Matching Shares is subject to continuous employment with the Group and to the EPS and TSR performance conditions, as detailed below:
TSR target (25%)The number of shares vesting will be determined by comparing the Company’s TSR to the TSR of the constituents of the FTSE 350 Index (excluding financial services and mining companies and investment trusts) (the “FTSE 350 Constituents”) over the performance period commencing on 1 January 2015 and ending on 31 December 2017.
Regus TSR compared to the FTSE 350 Constituents% of shares
vesting
Median 25%Upper quartile or above 100%
Straightline vesting occurs between these points. No shares will vest below the threshold target.
EPS target (75%)The number of shares vesting will be determined based on EPS performance in the year ending 31 December 2017 against the following targets:
Compound annual growth in EPS over the Performance Period% of shares
vesting
24% 25%32% 100%
Directors’ Remuneration report continued

www.regus.com 51
Strategic report
Go
vernanceFinancial statem
ents
The target for 2017 is based on compound annual growth from an equivalent base year EPS figure for 2014 of 7.4p.
Straightline vesting occurs between these points. No shares will vest below the threshold target.
One-off award on recruitment of Dominik de DanielOn 2 November 2015, an award over 328,751 ordinary shares of 1p each in the Company was granted to the Company’s Chief Financial Officer and Chief Operating Officer, Dominik de Daniel. The award was structured as a conditional award and was granted under a one-off award arrangement established under Listing Rule 9.4.2(2) in order to facilitate the recruitment of Dominik de Daniel.
The level of the award was determined by reference to compensation otherwise due to Dominik de Daniel, that he gave up upon accepting employment with Regus.
In the normal course of events the award will vest over five years, and to the extent to which performance conditions are achieved. The applicable performance target is set out below:
Performance metric Target Vesting at target
Compound annual growth in EPS over the performance period 5% 100%
Total pension benefitsDuring the year under review, the Executive Directors received pension contributions of 7% of salary into defined contribution arrangements (or cash equivalent) plus any contributions in accordance with standard local practice or employment regulations. Details of the value of pension contributions received in the year under review are set out in the Pension column of the single total figure remuneration table.
Statement of share scheme interests and shareholdingsExecutive Directors are required to build up and maintain a shareholding. The following table sets out for Directors who served during the year, the total number of shares held (including the interests of connected persons) as at 31 December 2015 alongside the interests in share schemes for the Executive Directors. For Dominique Yates the shareholding is at the date he stepped down from the Board.
Shares held
Shareholding guidelines Interests in share/option awards
% of salary required
% of salary achieved(a)
Guideline met?
CIP
One-off awardShare Option
Plan (“SOP”)Investment
Shares(c)Matching
Shares(d)
Executive DirectorsMark Dixon 294,267,501 200% 167,036% Yes 423,962 1,695,848 –Dominique Yates 785,262 200% 784% Yes 250,206 154,278 907,333(e)
Dominik de Daniel 91,700 200% 42% No(b) 328,751(f)
Non-Executive DirectorsDouglas Sutherland 400,000Lance Browne 14,994Elmar Heggen –Nina Henderson 16,500François Pauly 50,000Florence Pierre –
a) Based on share price of 333.20p and base salary as at 31 December 2015, save for Dominique Yates whose percentage of salary achieved is based on share price of 334.6p as at 1 November 2015 and base salary as at 31 December 2015.
b) Dominik de Daniel joined the Board on 1 November 2015. Upon appointment Dominik de Daniel was granted a conditional award, details of which may be found above.
c) The CIP Investment Shares are in the form of unvested conditional shares granted on 6 March 2013, 5 March 2014 and 4 March 2015, and which vest subject to continued employment at the end of a three-year holding period.
d) The CIP Matching Shares are in the form of unvested conditional shares which will vest subject to the achievement of EPS and TSR performance targets. The number of share interests includes the following awards which were unvested as at 31 December 2015. For Mark Dixon, the number includes 754,340 Matching Shares granted on 6 March 2013, 412,204 Matching Shares granted on 5 March 2014, and 529,304 Matching shares granted on 4 March 2015. For Dominique Yates, the number shows 154,278 Matching Shares granted on 6 March 2013. All other Matching Shares awards granted under the CIP to Domique Yates will lapse on cessation of employment.
e) The SOP grants are vested market value share options (exercise price 74.35p) which were granted to Dominique Yates on 2 September 2011 to aid his recruitment.
f) The One-off Award is in the form of un-vested conditional shares awarded to Dominik de Daniel as a one-off award arrangement established under Listing Rule 9.4.2(2) in order to facilitate his recruitment.
g) With the exception of the Directors’ interests disclosed in the table above, no Director had any additional interest in the share capital of the Company during the year.
Payments for loss of office to past DirectorsDominique Yates stepped down from the Board on 1 November 2015. He will remain an employee of the Group for a period which will end no later than 31 August 2016. The Committee has determined that Dominique Yates will continue to receive his contractual salary and contractual benefits until 31 August 2016. If he leaves his employment earlier his salary and benefits will be appropriately adjusted.
The Committee considered the bonus of Dominique Yates at the same time as for other Executive Directors and concluded that a bonus of £279,400 should be awarded for the ten months of the year that he was a Director.

52 Regus plc Annual Report and Accounts 2015
Supporting disclosures and additional contextPercentage change in remuneration of the Chief Executive OfficerThe table below shows the percentage change in remuneration of the Chief Executive Officer and Group support employees (on a per capita basis) between the year ending 31 December 2013 and the year ending 31 December 2014 and between the year ending 31 December 2014 and the year ending 31 December 2015. Given the significant scale and diversity of the overall global employee population, the Committee considers the Group support employees a relevant comparison.
2013 compared to 2014 2014 compared to 2015Chief
ExecutiveGroup support
employees Chief
ExecutiveGroup support
employees
Salary – 23.4% – 1.9%Benefits (38)% 14.3% (9.1)% 12.7%Annual bonus 21% 39.6% – 24.4%
Relative importance of spend on payThe table below shows total employee remuneration and distributions to shareholders in respect of the years ending 31 December 2015, 2014 and 2013 and the percentage changes between years.
2015 2014 2013
Change 2014 to
2015
Change 2013 to
2014
Total employee remuneration £356.4m £334.6m £316.1m 6.5% 5.8%Distributions to shareholders £38.8m £35.4m £31.1m 9.6% 13.8%
Performance graph and tableThe table below provides remuneration data for the Chief Executive Officer for each of the seven financial years over the equivalent period.
2009 2010 2011 2012 2013 2014 2015
Single total figure of remuneration (£’000) £628 £759 £1,130 £1,773 £1,854 £2,770 £1,990Bonus (% of maximum) – 19% 50% 100% 79% 100% 100%Long term incentive vesting (% of maximum) – – – 11% 35% 86% 97%
Advisors to the Remuneration Committee Aon Hewitt provided independent advice to the Committee during the year. Aon Hewitt was appointed by the Committee during 2015 following a competitive selection process undertaken by the Committee. The fees charged by Aon Hewitt for the provision of independent advice to the Committee during 2015 were £94,000. The Committee is comfortable that Aon Hewitt’s engagement partner and team are objective and independent in their provision of advice to the Committee.
Statement of voting at the annual general meetingThe Committee is directly accountable to shareholders and, in this context, is committed to an open and transparent dialogue with shareholders on the issue of executive remuneration. The members of the Committee attend the Company’s annual general meeting and are available to answer shareholders’ questions about Directors’ remuneration. Votes cast by proxy and at the annual general meeting held on 19 May 2015 in respect of the Annual Remuneration Report for 2014 are shown in the table below:
Resolution Votes For Votes Against Total
votes castVotes
Withheld# % # %
Approval of Annual Remuneration Report for year ended 31 December 2014 771,490,952 97.8% 17,320,449 2.2% 788,811,401 1,310,016
For and on behalf of the Board
Nina Henderson
Chairman of the Remuneration Committee
1 March 2016
0
100
200
300
400500
600
700
800
900
1514131211100908
17.3
Regus FTSE 350 (excl. investment trusts)
year
penceThe graph shows the value, by 31 December 2015, of £100 invested in Regus on 31 December 2008 compared with the value of £100 invested in the FTSE 350 Index (excluding investment trusts). TSR refers to share price growth plus dividends reinvested over the relevant period. The Committee considers the FTSE 350 (excluding investment trusts) relevant since it is an index of companies of similar size to Regus.
Directors’ Remuneration report continued

www.regus.com 53
Strategic report
Go
vernanceFinancial statem
entsDirectors’ report
The Directors of Regus plc (société anonyme) (the ‘Company’) present their Annual Report and the audited financial statements of the Company and its subsidiaries (together the ‘Group’) for the year ended 31 December 2015.
DirectorsThe Directors of the Company who held office during the financial year under review were:
Executive DirectorsMark Dixon
Dominique Yates (resigned 1 November 2015)
Dominik de Daniel (appointed 1 November 2015)
Non-Executive DirectorsDouglas Sutherland
Lance Browne
Elmar Heggen
Nina Henderson
François Pauly (appointed 19 May 2015)
Florence Pierre
Alex Sulkowski (resigned 19 May 2015)
Biographical details for the Directors are shown on pages 28 and 29.
Details of the Directors’ interests and shareholdings are given in the Remuneration Report on pages 42 to 52.
The Corporate Responsibility Statement, Corporate Governance Report, Nomination Committee Report, Audit Committee Report, Remuneration Report and Director Statements on pages 26 to 54 all form part of this report.
Principal activityThe Company is the world’s leading provider of global office outsourcing services.
Business reviewThe Directors have presented a Strategic Report as follows:
The Chief Executive Officer’s Review and Chief Financial Officer’s Review on pages 13 to 20 respectively address:
• review of the Company’s business (pages 13 to 17);
• trends and factors likely to affect the future development, performance and position of the business (pages13 to 17);
• development and performance during the financial year (pages 18 to 20);
• position of the business at the end of the year (pages 19 to 20).
The Risk Management report, on pages 21 to 24, includes a description of the principal risks and uncertainties facing the Company.
The Corporate Responsibility Report, on pages 26 and 27, includes the sections of
the Strategic Report in respect of:
• environmental matters; and
• social and community issues.
The People Report on page 25 of the Strategic Report addresses employee development and performance. The Nomination Committee Report on pages 36 and 37 covers our diversity.
The Directors’ Statements on page 54 includes the statutory statement in respect of disclosure to the auditor.
The Directors do not consider any contractual or other relationships with external parties to be essential to the business of the Group .
Results and dividendsProfit before taxation for the year was £145.7m (2014: £87.1m).
The Directors are pleased to recommend a final dividend of £28.8m (2014: £25.8m), being 3.10p per share (2014: 2.75p per share). The total dividend for the year will therefore be 4.50p per share, made up of the interim dividend of 1.4p per share paid in October 2015 (2014: 1.25p per share) and, assuming the final dividend is approved by shareholders at the forthcoming annual general meeting, an additional 3.10p per share (2014: 2.75p per share) which is expected to be paid on 27 May 2016 to shareholders on the register at the close of business on 29 April 2016.
Policy and practice on payment of creditorsThe Group does not follow a universal code dealing specifically with payments to suppliers but, where appropriate, our practice is to:
• agree the terms of payment upfront with the supplier;
• ensure that suppliers are made aware of these terms of payment; and
• pay in accordance with contractual and other legal obligations.
At 31 December 2015, the number of creditor days outstanding for the Group was 31 days (2014: 21 days) and for the Company was 99 days (2014: 19 days).
EmployeesThe Group treats applicants for employment with disabilities with full and fair consideration according to their skills and capabilities.
Should an employee become disabled during their employment, efforts are made to retain them in their current employment or to explore opportunities for their retraining or redeployment elsewhere within the Group.
Political and charitable donationsIt is the Group’s policy not to make political donations either in the UK or overseas. The
Group made charitable donations of £209,905 during the year (2014: £155,328).
Capital structureThe Company’s share capital comprises 950,969,822 issued and fully paid up ordinary shares of 1p nominal value in Regus plc (2014: 950,969,822). All ordinary shares have the same rights to vote at general meetings of the Company and to participate in distributions. There are no securities in issue that carry special rights in relation to the control of the Company. The Company’s shares are traded on the London Stock Exchange.
Details of the role of the Board of Directors (the ‘Board’) and the process for the appointment of Directors can be found on pages 28 and 29, and 36 and 37.
At the Company’s annual general meeting held on 19 May 2015 the shareholders of the Company approved a resolution giving authority for the Company to purchase in the market up to 93,873,657 ordinary shares representing approximately 10% of the issued share capital (excluding Treasury shares) as at 17 April 2015.
9,543,800 shares were purchased pursuant to this authority during the year under review.
Details of the Company’s employee share schemes can be found in the report of the Remuneration Committee on pages 42 to 52.
The outstanding awards and options do not carry any rights in relation to the control of the Company.
Substantial interestsAt 1 March 2016, the Company has been notified of the following substantial interests held in the issued share capital of the Company.
Number of ordinary shares
% of issued share capital
Estorn Limited* 294,267,501 31.37Prudential Plc 91,334,639 9.82FMR LLC 46,612,296 5.01
* Mark Dixon indirectly owns 100% of Estorn Limited
AuditorsIn accordance with Luxembourg law, a resolution for the reappointment of KPMG Luxembourg, Société coopérative as auditors of the Company is to be proposed at the forthcoming annual general meeting.
ApprovalThis report was approved by the Board on 16 February 2016.
On behalf of the Board
Lynsey Blair
Company Secretary
1 March 2016

54 Regus plc Annual Report and Accounts 2015
fair review of the development and performance of the business and the position of the parent company and the undertakings included in the consolidation taken as a whole, together with a description of the principal risks and uncertainties that they face.
We, the Directors of the Company, confirm that to the best of our knowledge:
• the financial statements prepared in accordance with the applicable set of accounting standards, give a true and fair view of the assets, liabilities, financial position and profit or loss of the Company and the undertakings included in the consolidation as a whole; and
• the Directors’ Report, including content contained by reference, includes a fair review of the development and performance of the business and the position of the Company and the undertakings included in the consolidation taken as a whole, together with a description of the principal risks and uncertainties that they face.
By order of the Board
Mark Dixon
Chief Executive Officer
Dominik de Daniel
Chief Financial Officer
1 March 2016
Directors’ statements
The Directors are responsible for keeping adequate accounting records that are sufficient to show and explain the Company’s transactions and which disclose with reasonable accuracy at any time the financial position of the parent company and to enable them to ensure that its financial statements comply with applicable law and regulations. They have general responsibility for taking such steps as are reasonably open to them to safeguard the assets of the Group and to prevent and detect fraud and other irregularities.
Under applicable law and regulations, the Directors are also responsible for preparing a Directors’ Report, a Remuneration Report and a Corporate Governance Statement that complies with that law and those regulations.
The Directors are responsible for the maintenance and integrity of the corporate and financial information included on the Company’s websites.
Legislation in the UK governing the preparation and dissemination of financial statements may differ from legislation in other jurisdictions.
Statutory statement as to disclosure to auditorThe Directors who held office at the date of approval of this Directors’ statements confirm that:
• so far as they are each aware, there is no relevant audit information of which the Company’s auditor is unaware; and
• each Director has taken all the steps that he ought to have taken as a Director in order to make himself aware of any relevant audit information and to establish that the Company’s auditor is aware of that information.
These financial statements have been approved by the Directors of the Company. The Directors confirm that the financial statements have been prepared in accordance with applicable law and regulations and that they include a
Statement of Directors’ responsibilities in respect of the Annual Report and financial statements The Directors are responsible for preparing the Annual Report and the Group and parent company financial statements in accordance with applicable law and regulations.
Company law requires the Directors to prepare Group and parent company financial statements for each financial year. Under that law, they are required to prepare the Group financial statements in accordance with International Financial Reporting Standards (‘IFRSs’) as adopted by the EU and applicable law and have elected to prepare the parent company annual accounts in accordance with Luxembourg Generally Accepted Accounting Practice and applicable law.
Under company law, the Directors must not approve the financial statements unless they are satisfied that they give a true and fair view of the state of affairs of the Group and parent company and their profit or loss for the period.
In preparing each of the Group and parent company financial statements, the Directors are required to:
• select suitable accounting policies and then apply them consistently;
• make judgements and estimates that are reasonable and prudent;
• for the Group financial statements, state whether they have been prepared in accordance with IFRSs as adopted by the EU;
• for the parent company annual accounts, state whether applicable Luxembourg accounting standards have been followed, subject to any material departures disclosed and explained in the parent company annual accounts; and
• prepare the financial statements on the going concern basis unless it is inappropriate to presume that the Group and the parent company will continue in business.

www.regus.com 55
Strategic report
Go
vernanceFinancial statem
ents
Stra
tegi
c re
port
Go
vern
ance
Fina
ncia
l sta
tem
ents
Auditors’ report
To the Shareholders of Regus plc (société anonyme) 26, Boulevard Royal L-2449 Luxembourg
www.regus.com 55
Report of the Réviseur d’Entreprises Agréé Report on the consolidated financial statements We have audited the accompanying consolidated financial statements of Regus plc (société anonyme), which comprise the consolidated balance sheet as at 31 December 2015 and the consolidated statements of income, comprehensive income, changes in equity and cash flows for the year then ended, and a summary of significant accounting policies and other explanatory information, as set out on pages 56 to 99.
Board of Directors’ responsibility for the consolidated financial statements The Board of Directors is responsible for the preparation and fair presentation of these consolidated financial statements in accordance with International Financial Reporting Standards as adopted by the European Union, and for such internal control as the Board of Directors determines is necessary to enable the preparation of consolidated financial statements that are free from material misstatement, whether due to fraud or error.
Responsibility of the Réviseur d’Entreprises agréé Our responsibility is to express an opinion on these consolidated financial statements based on our audit. We conducted our audit in accordance with International Standards on Auditing as adopted for Luxembourg by the Commission de Surveillance du Secteur Financier. Those standards require that we comply with ethical requirements and plan and perform the audit to obtain reasonable assurance about whether the consolidated financial statements are free from material misstatement.
An audit involves performing procedures to obtain audit evidence about the amounts and disclosures in the consolidated financial statements. The procedures selected depend on the judgement of the Réviseur d’Entreprises agréé, including the assessment of the risks of material misstatement of the consolidated financial statements, whether due to fraud or error. In making those risk assessments, the Réviseur d’Entreprises agréé considers internal control relevant to the entity’s preparation and fair presentation of the consolidated financial statements in order to design audit procedures that are appropriate in the circumstances, but not for the purpose of expressing an opinion on the effectiveness of the entity’s internal control. An audit also includes evaluating the appropriateness of accounting policies used and the reasonableness of accounting estimates made by the Board of Directors, as well as evaluating the overall presentation of the consolidated financial statements.
We believe that the audit evidence we have obtained is sufficient and appropriate to provide a basis for our audit opinion.
Opinion In our opinion, the consolidated financial statements, as set out on pages 56 to 99, give a true and fair view of the consolidated financial position of Regus plc (société anonyme) as of 31 December 2015, and of its consolidated financial performance and its consolidated cash flows for the year then ended in accordance with International Financial Reporting Standards as adopted by the European Union.
Report on other legal and regulatory requirements The consolidated Directors’ report, including the corporate governance statement, which is the responsibility of the Board of Directors, is consistent with the consolidated financial statements and includes the information required by the law with respect to the Corporate Governance Statement.
KPMG Luxembourg, Société coopérative Cabinet de révision agréé Stephen Nye
Luxembourg, 1 March 2016
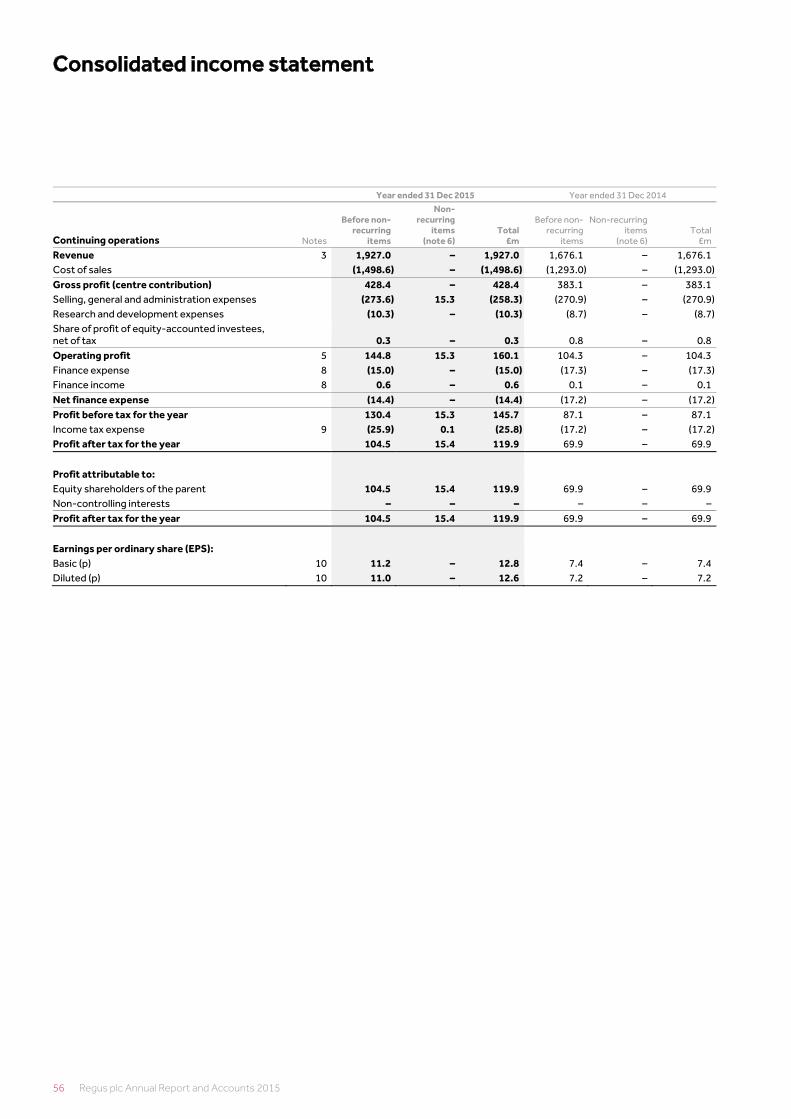
56 Regus plc Annual Report and Accounts 2015
Consolidated income statement
56 Regus plc Annual Report and Accounts 2015
Year ended 31 Dec 2015 Year ended 31 Dec 2014
Continuing operations Notes
Before non-recurring
items
Non-recurring
items (note 6)
Total £m
Before non-recurring
items
Non-recurring items
(note 6) Total
£m
Revenue 3 1,927.0 – 1,927.0 1,676.1 – 1,676.1Cost of sales (1,498.6) – (1,498.6) (1,293.0) – (1,293.0)Gross profit (centre contribution) 428.4 – 428.4 383.1 – 383.1Selling, general and administration expenses (273.6) 15.3 (258.3) (270.9) – (270.9)Research and development expenses (10.3) – (10.3) (8.7) – (8.7)Share of profit of equity-accounted investees, net of tax 0.3 – 0.3 0.8 – 0.8Operating profit 5 144.8 15.3 160.1 104.3 – 104.3Finance expense 8 (15.0) – (15.0) (17.3) – (17.3)Finance income 8 0.6 – 0.6 0.1 – 0.1Net finance expense (14.4) – (14.4) (17.2) – (17.2)Profit before tax for the year 130.4 15.3 145.7 87.1 – 87.1Income tax expense 9 (25.9) 0.1 (25.8) (17.2) – (17.2)Profit after tax for the year 104.5 15.4 119.9 69.9 – 69.9
Profit attributable to: Equity shareholders of the parent 104.5 15.4 119.9 69.9 – 69.9Non-controlling interests – – – – – –Profit after tax for the year 104.5 15.4 119.9 69.9 – 69.9
Earnings per ordinary share (EPS): Basic (p) 10 11.2 – 12.8 7.4 – 7.4Diluted (p) 10 11.0 – 12.6 7.2 – 7.2

www.regus.com 57
Strategic report
Go
vernanceFinancial statem
ents
Stra
tegi
c re
port
Go
vern
ance
Fina
ncia
l sta
tem
ents
Consolidated statement of comprehensive income
www.regus.com 57
Notes
Year ended 31 Dec 2015
£m
Year ended 31 Dec 2014
£m
Profit for the year 119.9 69.9 Other comprehensive income that is or may be reclassified to profit or loss in subsequent periods: Cash flow hedges – effective portion of changes in fair value, net of income tax 0.6 (2.7)Foreign currency translation differences for foreign operations (5.3) 6.1Items of other comprehensive income that are or may be reclassified to profit or loss in subsequent periods (4.7) 3.4 Other comprehensive income that will never be reclassified to profit or loss in subsequent periods: Re-measurement of defined benefit liability, net of income tax (0.3) –Items of other comprehensive income that will never be reclassified to profit or loss in subsequent periods (0.3) –
Other comprehensive income for the period, net of income tax (5.0) 3.4
Total comprehensive income for the year 114.9 73.3
Total comprehensive income attributable to: Equity shareholders of the parent 114.9 73.3Non-controlling interests – –Total comprehensive income for the year 114.9 73.3

58 Regus plc Annual Report and Accounts 2015
Consolidated statement of changes in equity
58 Regus plc Annual Report and Accounts 2015
Attributable to equity holders of the parent(a)
Share capital
£m
Treasury shares
£m
Foreign currency
translation reserve
£m
Hedging reserve
£m
Revaluation reserve
£mOther
£m
Retained earnings
£m
Total equity attributable
to equity holders
£m
Non-controlling
interests £m
Total equity
£m
Balance at 1 January 2014 9.5 (4.1) 6.6 – 10.5 15.3 476.4 514.2 – 514.2Total comprehensive income for the year: Profit for the year – – – – – – 69.9 69.9 – 69.9Other comprehensive income: Re-measurement of defined benefit liability, net of income tax (note 26) – – – – – – – – – –Cash flow hedges – effective portion of changes in fair value, net of income tax – – – (2.7) – – – (2.7) – (2.7)Foreign currency translation differences for foreign operations – – 6.1 – – – – 6.1 – 6.1Total other comprehensive income, net – – 6.1 (2.7) – – – 3.4 – 3.4Total comprehensive income for the year – – 6.1 (2.7) – – 69.9 73.3 – 73.3Transactions with owners, recorded directly in equity Share-based payments – – – – – – 2.6 2.6 – 2.6Ordinary dividend paid (note 11) – – – – – – (35.4) (35.4) – (35.4)Purchase of treasury shares in Regus plc – (17.2) – – – – – (17.2) – (17.2)Settlement of share awards – 1.4 – – – – (1.5) (0.1) – (0.1)Balance at 31 December 2014 9.5 (19.9) 12.7 (2.7) 10.5 15.3 512.0 537.4 – 537.4Total comprehensive income for the year: Profit for the year – – – – – – 119.9 119.9 – 119.9Other comprehensive income: Re-measurement of defined benefit liability, net of income tax (note 26) – – – – – – (0.3) (0.3) – (0.3)Cash flow hedges – effective portion of changes in fair value, net of income tax – – – 0.6 – – – 0.6 – 0.6Foreign currency translation differences for foreign operations – – (5.3) – – – – (5.3) – (5.3)Total other comprehensive income, net – – (5.3) 0.6 – – 119.6 114.9 – 114.9Total comprehensive income for the year – – (5.3) 0.6 – – 119.6 114.9 – 114.9Transactions with owners, recorded directly in equity Share-based payments – – – – – – 2.2 2.2 – 2.2Ordinary dividend paid (note 11) – – – – – – (38.8) (38.8) – (38.8)Purchase of treasury shares in Regus plc – (24.5) – – – – – (24.5) – (24.5)Settlement of share awards – 1.5 – – – – (9.0) (7.5) – (7.5)Balance at 31 December 2015 9.5 (42.9) 7.4 (2.1) 10.5 15.3 586.0 583.7 – 583.7
(a) Total reserves attributable to equity holders of the parent.
Share capital represents the net proceeds (the nominal value) on the issue of the Company’s equity share capital.
At 31 December 2015 treasury shares represent 20,490,613 (2014: 12,883,455) ordinary shares of the Group that were acquired for the purposes of the Group’s employee share option plans and the share buy-back programme. During the period, 9,543,800 (2014: 9,484,516) shares were purchased in the open market and 1,936,642 (2014: 1,858,441) treasury shares held by the Group were utilised to satisfy the exercise of share awards by employees. As at 1 March 2016, 20,486,213 treasury shares were held.
The foreign currency translation reserve is used to record exchange differences arising from the translation of the financial statements of foreign subsidiaries and joint ventures.
The revaluation reserve arose on the restatement of the assets and liabilities of the UK associate from historic to fair value at the time of the acquisition of the outstanding 58% interest on 19 April 2006.
Other reserves include £37.9m arising from the Scheme of Arrangement undertaken on 14 October 2008, £6.5m relating to merger reserves and £0.1m to the redemption of preference shares partly offset by £29.2m arising from the Scheme of Arrangement undertaken in 2003.

www.regus.com 59
Strategic report
Go
vernanceFinancial statem
ents
Stra
tegi
c re
port
Go
vern
ance
Fina
ncia
l sta
tem
ents
Consolidated balance sheet
www.regus.com 59
Notes
As at 31 Dec 2015
£m
As at 31 Dec 2014
£m
Non-current assets Goodwill 12 612.2 497.2Other intangible assets 13 53.8 52.7Property, plant and equipment 14 917.0 718.8Deferred tax assets 9 36.4 40.0Other long-term receivables 15 63.0 49.3Investments in joint ventures 21 5.6 0.7Total non-current assets 1,688.0 1,358.7Current assets Trade and other receivables 16 557.8 440.1Corporation tax receivable 9 17.9 12.5Assets held for sale 18 – 62.6Cash and cash equivalents 23 63.9 72.8Total current assets 639.6 588.0Total assets 2,327.6 1,946.7Current liabilities Trade and other payables (incl. customer deposits) 17 (816.5) (670.2)Deferred income (240.7) (205.3)Corporation tax payable 9 (14.0) (10.3)Obligations under finance leases 19 – –Bank and other loans 19 (9.2) (1.4)Provisions 20 (5.3) (2.6)Liabilities held for sale 18 – (2.1)Total current liabilities (1,085.7) (891.9)Net current liabilities (446.1) (303.9)Total assets less current liabilities 1,241.9 1,054.8Non-current liabilities Other payables 17 (383.8) (292.9)Non-current derivative financial liabilities 24 (15.0) (7.7)Obligations under finance leases 19 – (0.1)Bank and other loans 19 (245.3) (209.3)Deferred tax liability 9 (1.6) (2.2)Provisions 20 (7.6) (4.3)Provision for deficit on joint ventures 21 (4.1) (0.7)Retirement benefit obligations 26 (0.8) (0.2)Total non-current liabilities (658.2) (517.4)Total liabilities (1,743.9) (1,409.3)Total assets less liabilities 583.7 537.4Total equity Issued share capital 22 9.5 9.5Treasury shares (42.9) (19.9)Foreign currency translation reserve 7.4 12.7Hedging reserve (2.1) (2.7)Revaluation reserve 10.5 10.5Other reserves 15.3 15.3Retained earnings 586.0 512.0Total shareholders’ equity 583.7 537.4Non-controlling interests – –Total equity 583.7 537.4Total equity and liabilities 2,327.6 1,946.7
Approved by the Board on 1 March 2016
Mark Dixon Dominik de Daniel Chief Executive Officer Chief Financial Officer
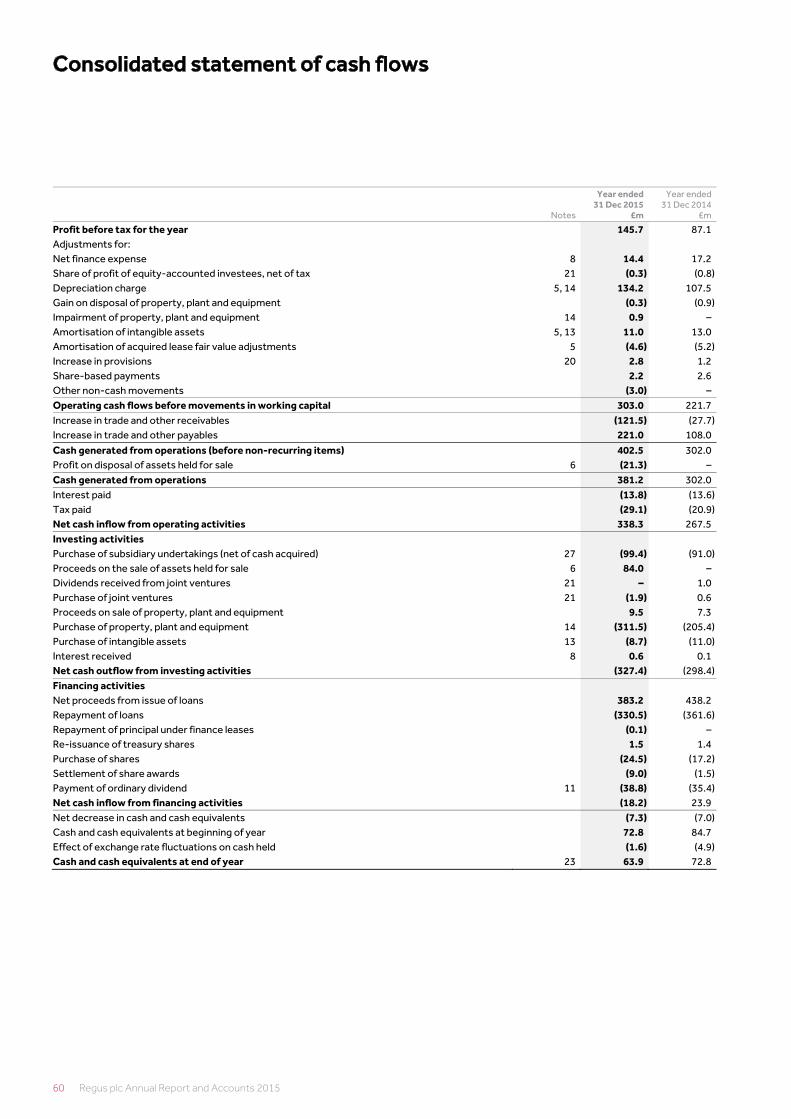
60 Regus plc Annual Report and Accounts 2015
Consolidated statement of cash flows
60 Regus plc Annual Report and Accounts 2015
Notes
Year ended 31 Dec 2015
£m
Year ended 31 Dec 2014
£m
Profit before tax for the year 145.7 87.1Adjustments for: Net finance expense 8 14.4 17.2Share of profit of equity-accounted investees, net of tax 21 (0.3) (0.8)Depreciation charge 5, 14 134.2 107.5Gain on disposal of property, plant and equipment (0.3) (0.9)Impairment of property, plant and equipment 14 0.9 –Amortisation of intangible assets 5, 13 11.0 13.0Amortisation of acquired lease fair value adjustments 5 (4.6) (5.2)Increase in provisions 20 2.8 1.2Share-based payments 2.2 2.6Other non-cash movements (3.0) –Operating cash flows before movements in working capital 303.0 221.7Increase in trade and other receivables (121.5) (27.7)Increase in trade and other payables 221.0 108.0
Cash generated from operations (before non-recurring items) 402.5 302.0Profit on disposal of assets held for sale 6 (21.3) –Cash generated from operations 381.2 302.0Interest paid (13.8) (13.6)Tax paid (29.1) (20.9)Net cash inflow from operating activities 338.3 267.5Investing activities Purchase of subsidiary undertakings (net of cash acquired) 27 (99.4) (91.0)Proceeds on the sale of assets held for sale 6 84.0 –Dividends received from joint ventures 21 – 1.0Purchase of joint ventures 21 (1.9) 0.6Proceeds on sale of property, plant and equipment 9.5 7.3Purchase of property, plant and equipment 14 (311.5) (205.4)Purchase of intangible assets 13 (8.7) (11.0)Interest received 8 0.6 0.1Net cash outflow from investing activities (327.4) (298.4)Financing activities Net proceeds from issue of loans 383.2 438.2Repayment of loans (330.5) (361.6)Repayment of principal under finance leases (0.1) –Re-issuance of treasury shares 1.5 1.4Purchase of shares (24.5) (17.2)Settlement of share awards (9.0) (1.5)Payment of ordinary dividend 11 (38.8) (35.4)Net cash inflow from financing activities (18.2) 23.9Net decrease in cash and cash equivalents (7.3) (7.0)Cash and cash equivalents at beginning of year 72.8 84.7Effect of exchange rate fluctuations on cash held (1.6) (4.9)Cash and cash equivalents at end of year 23 63.9 72.8

www.regus.com 61
Strategic report
Go
vernanceFinancial statem
ents
Stra
tegi
c re
port
Go
vern
ance
Fina
ncia
l sta
tem
ents
Notes to the accounts
www.regus.com 61
1. Authorisation of financial statements The Group and Company financial statements for the year ended 31 December 2015 were authorised for issue by the Board of Directors on 1 March 2016 and the balance sheets were signed on the Board’s behalf by Mark Dixon and Dominik de Daniel. Regus plc S.A. is a public limited company incorporated in Jersey and registered and domiciled in Luxembourg. The Company’s ordinary shares are traded on the London Stock Exchange.
Regus plc S.A. owns a network of business centres which are leased to a variety of business customers. Information on the Group’s structure is provided in note 32, and information on other related party relationships of the Group is provided in note 31.
The Group financial statements have been prepared and approved by the Directors in accordance with International Financial Reporting Standards as adopted by the European Union (‘Adopted IFRSs’). The Company prepares its parent company annual accounts in accordance with Luxembourg GAAP; extracts from these are presented on page 100.
2. Accounting policies Basis of preparation The Group financial statements consolidate those of the parent company and its subsidiaries (together referred to as the ‘Group’) and equity account the Group’s interest in the associate and jointly controlled entities. The extract from the parent company annual accounts presents information about the Company as a separate entity and not about its Group.
The accounting policies set out below have been applied consistently to all periods presented in these Group financial statements. Amendments to adopted IFRSs issued by the International Accounting Standards Board (IASB) and the International Financial Reporting Interpretations Committee (IFRIC) with an effective date from 1 January 2015 did not have a material effect on the Group financial statements, unless otherwise indicated.
The following standards, interpretations and amendments to standards were adopted by the Group for periods commencing on or after 1 January 2015:
IAS 19 Defined Benefit Plans: Employee Contributions – Amendments to IAS 19 IAS 40 Investment Property – Amendments to IAS 40 IFRS 3 Business Combinations – Contingent consideration arrangements IFRS 3 Business Combinations – Joint arrangements IFRS 8 Operating Segments – Amendments to IFRS 8 IFRS 13 Fair Value Measurement – Amendments to IFRS 13 Various Annual Improvements (2010 – 2012 Cycle) Various Annual Improvements (2011 – 2013 Cycle)
Judgements made by the Directors in the application of these accounting policies that have significant effect on the consolidated financial statements and estimates with a significant risk of material adjustment in the next year are discussed in note 33.
The consolidated financial statements are prepared on a historical cost basis, with the exception of certain financial assets and liabilities that are measured at fair value as described in note 24.
The Directors, having made appropriate enquiries, have a reasonable expectation that the Group and the Company have adequate resources to continue in operational existence for the foreseeable future. For this reason they continue to adopt the going concern basis in preparing the consolidated financial statements on pages 56 to 99.
In adopting the going concern basis for preparing the consolidated financial statements, the Directors have considered the further information included in the business activities commentary as set out on pages 13 to 15 as well as the Group’s principal risks and uncertainties as set out on pages 21 to 24.
Further details on the going concern basis of preparation can be found in note 24 to the notes to the consolidated financial statements on page 81.
These Group consolidated financial statements are presented in pounds sterling (£), which is Regus plc’s functional currency, and all values are in million pounds, rounded to one decimal place, except where indicated otherwise.
The attributable results of those companies acquired or disposed of during the year are included for the periods of ownership.
Associates are those entities in which the Group has significant influence, but not control, over the financial and operating policies.
The consolidated financial statements include the Group’s share of the total recognised income and expense of associates on an equity accounted basis, from the date that significant influence commences until the date that significant influence ceases or the associate qualifies as a disposal group at which point the investment is carried at the lower of fair value less costs to sell and carrying value.
Joint ventures include jointly controlled entities that are those entities over whose activities the Group has joint control, whereby the Group has rights to the net assets of the arrangement, rather than rights to its assets and obligations for its liabilities. The consolidated financial statements include the Group’s share of the total recognised gains and losses of jointly controlled entities on an equity accounted basis, from the date that joint control commences until the date that joint control ceases or the jointly controlled entity qualifies as a disposal group at which point the investment is carried at the lower of fair value less costs to sell and carrying value.

62 Regus plc Annual Report and Accounts 2015
Notes to the accounts continued
62 Regus plc Annual Report and Accounts 2015
2. Accounting policies (continued) When the Group’s share of losses exceeds its interest in a joint venture, the Group’s carrying amount is reduced to nil and recognition of further losses is discontinued except to the extent that the Group has incurred legal or constructive obligations or made payments on behalf of a joint venture.
On 19 April 2006 the Group acquired the remaining 58% of the shares of the UK business that were not already owned by the Group. As a result the Group fully consolidated the UK business from that date. The acquisition was accounted for through the purchase method and as a consequence the entire assets and liabilities of the UK business were revalued to fair value. The effect of these adjustments on the 42% of the UK business already owned was reflected in the revaluation reserve.
On 14 October 2008, Regus plc acquired the entire share capital of Regus Group plc in exchange for the issue of new shares of Regus plc on the basis of one share in Regus plc for one share held previously in Regus Group plc. At the date of the transaction, Regus plc had nominal assets and liabilities and therefore the transaction was accounted for as a reverse acquisition of Regus plc by Regus Group plc. Consequently, no fair value acquisition adjustments were required and the aggregate of the Group reserves have been attributed to Regus plc.
IFRSs not yet effective The following IFRSs have been issued but have not been applied by the Group in these consolidated financial statements as they are effective for years beginning on or after 1 January 2015 or have not yet been endorsed by the European Union. Except for IFRS16 Leases, their adoption is not expected to have a material effect on the consolidated financial statements:
IAS 1 Disclosure Initiative (Amendment to IAS 1) 1 January 2016IAS 16 Clarification of Acceptable Methods of Depreciation and Amortisation 1 January 2016IAS 38 Clarification of Acceptable Methods of Depreciation and Amortisation 1 January 2016IFRS 11 Accounting for Acquisitions of interests in Joint operations – Amendments to IFRS 11 1 January 2016IFRS 14 Regulatory Deferral Accounts 1 January 2016 Annual Improvements to IFRSs 2012-2014 Cycle 1 January 2016IFRS 9 Financial Instruments 1 January 2018IFRS 15 Revenue from Contracts with Customers 1 January 2018IFRS 16 Leases 1 January 2019
The Group did not adopt any standards, interpretations and amendments to standards which were available for optional early adoption and relevant to the Group. The Group will adopt the above standards or amendments in the year in which they become effective and/or endorsed by the European Union, whichever is later.
Basis of consolidation Subsidiaries are entities controlled by the Group. Control exists when the Group controls an entity when it is exposed to, or has the rights to, variable returns from its involvement with the entity and has the ability to affect those returns through its power over the entity. The financial statements of subsidiaries are included in the consolidated financial statements from the date that control commences. The results are consolidated until the date control ceases or the subsidiary qualifies as a disposal group, at which point the assets and liabilities are carried at the lower of fair value less costs to sell and carrying value.
Impairment of non-financial assets For goodwill, assets that have an indefinite useful life and intangible assets that are not yet available for use, the recoverable amount was estimated at 31 October 2015. At each reporting date, the Group reviews the carrying amount of these assets to determine whether there is an indicator of impairment. If any indicator is identified then the assets’ recoverable amount is re-evaluated.
The carrying amount of the Group’s other non-financial assets (other than deferred tax assets) are reviewed at the balance sheet date to determine whether there is an indicator of impairment. If any such indication exists, the assets recoverable amount is estimated.
An impairment loss is recognised whenever the carrying amount of an asset or its cash-generating unit (CGU) exceeds its recoverable amount. Impairment losses are recognised in the income statement.
A CGU is the smallest identifiable group of assets that generates cash inflows that are largely independent of the cash inflows from other assets or groups of assets. The Group has identified individual business centres as the CGU.
We evaluate the potential impairment of property, plant and equipment at the centre (CGU) level where there are indicators of impairment.
Centres (CGUs) are grouped by country of operation for the purposes of carrying out impairment reviews of goodwill as this is the lowest level at which it can be assessed.
Individual fittings and equipment in our centres or elsewhere in the business that become obsolete or are damaged are assessed and impaired where appropriate.
Calculation of recoverable amount The recoverable amount of relevant assets is the greater of their fair value less costs to sell and value in use. In assessing value in use, the estimated future cash flows are discounted to their present value using a pre-tax discount rate that reflects current market assessments of the time value of money and the risks specific to the asset. For an asset that does not generate largely independent cash inflows, the recoverable amount is determined for the cash-generating unit to which the asset belongs.
Goodwill All business combinations are accounted for using the purchase method. Goodwill is initially measured at cost, being the excess of the aggregate of the consideration transferred and the amount recognised for non-controlling interests, and any previous interest held, over the net identifiable

www.regus.com 63
Strategic report
Go
vernanceFinancial statem
ents
Stra
tegi
c re
port
Go
vern
ance
Fina
ncia
l sta
tem
ents
www.regus.com 63
assets acquired and liabilities assumed. If the fair value of the net assets acquired is in excess of the aggregate consideration transferred, the Group re-assesses whether it has correctly identified all of the assets acquired and all of the liabilities assumed and reviews the procedures used to measure the amounts to be recognised at the acquisition date. If the re-assessment still results in an excess of the fair value of net assets acquired over the aggregate consideration transferred, then the gain is recognised in profit or loss.
Positive goodwill is stated at cost less any provision for impairment in value. An impairment test is carried out annually and, in addition, whenever indicators exist that the carrying amount may not be recoverable.
Business combinations that took place prior to the Group’s transition date to IFRS on 1 January 2004 have not been restated under the requirements of IFRS.
Intangible assets Intangible assets acquired separately from the business are capitalised at cost. Intangible assets acquired as part of an acquisition of a business are capitalised separately from goodwill if their fair value can be identified and measured reliably on initial recognition.
Intangible assets are amortised on a straight-line basis over the estimated useful life of the assets as follows:
Brand – Regus brand Indefinite lifeBrand – Other acquired brands 20 yearsComputer software Up to 5 yearsCustomer lists 2 yearsManagement agreements Minimum duration of the contract
Amortisation of intangible assets is expensed through administration expenses in the income statement.
Acquisitions of non-controlling interests Acquisitions of non-controlling interests are accounted for as transactions with owners in their capacity as owners and therefore no goodwill is recognised as a result. Adjustments to non-controlling interests arising from transactions that do not involve the loss of control are based on a proportionate amount of the net assets of the subsidiary.
Assets held for sale Assets held for sale are measured at the lower of the carrying value of the identified assets and its fair value less cost to sell.
Leases Plant and equipment leases for which the Group assumes substantially all of the risks and rewards of ownership are classified as finance leases. All other leases, including all of the Group’s property leases, are categorised as operating leases.
Finance leases Plant and equipment acquired by way of a finance lease is capitalised at the commencement of the lease at the lower of its fair value and the present value of the minimum lease payments at inception. Future payments under finance leases are included in creditors, net of any future finance charges. Minimum lease payments are apportioned between the finance charge and the reduction of the outstanding liability. Finance charges are recognised in the income statement over the lease term so as to produce a constant periodic rate of interest on the remaining balance of the liability.
Operating leases Minimum lease payments under operating leases are recognised in the income statement on a straight-line basis over the lease term. Lease incentives, including partner contributions and rent-free periods are included in the calculation of minimum lease payments. The commencement of the lease term is the date from which the Group is entitled to use the leased asset. The lease term is the non-cancellable period of the lease, together with any further periods for which the Group has the option to continue to lease the asset and when at the inception of the lease it is reasonably certain that the Group will exercise that option.
Contingent rentals include rent increases based on future inflation indices or non-guaranteed rental payments based on centre turnover or profitability and are excluded from the calculation of minimum lease payments. Contingent rentals are recognised in the income statement as they are incurred.
Onerous lease provisions are an estimate of the net amounts payable under the terms of the lease to the first break point, discounted at an appropriate pre-tax rate that reflects the time value of money and the risks specific to the liability.
Partner contributions Partner contributions are contributions from our business partners (property owners and landlords) towards the initial costs of opening a business centre, including the fit-out of the property and the losses that we incur early in the centre life. The partner contribution is treated as a lease incentive and is amortised over the period of the lease.
Property, plant and equipment Property, plant and equipment is stated at cost less accumulated depreciation and any impairment in value. Depreciation is calculated on a straight-line basis over the estimated useful life of the assets as follows:
Buildings 50 yearsLeasehold improvements 10 yearsFurniture 10 yearsOffice equipment and telephones 5 yearsComputer hardware 3 – 5 years

64 Regus plc Annual Report and Accounts 2015
Notes to the accounts continued
64 Regus plc Annual Report and Accounts 2015
2. Accounting policies (continued) Revenue Revenue from the provision of services to customers is measured at the fair value of consideration received or receivable (excluding sales taxes). Where rent-free periods are granted to customers, rental income is spread on a straight-line basis over the length of the customer contract.
Workstations Workstation revenue is recognised when the provision of the service is rendered. Amounts invoiced in advance are accounted for as deferred income and recognised as revenue upon provision of the service.
Customer service income Service income (including the rental of meeting rooms) is recognised as services are rendered. In circumstances where Regus acts as an agent for the sale and purchase of goods to customers, only the commission fee earned is recognised as revenue.
Management and franchise fees Fees received for the provision of initial and subsequent services are recognised as revenue as the services are rendered. Fees charged for the use of continuing rights granted by the agreement, or for other services provided during the period of the agreement, are recognised as revenue as the services are provided or the rights used.
Membership card income Revenue from the sale of membership cards is deferred and recognised over the period that the benefits of the membership card are expected to be provided.
These categories represent all material sources of revenue earned from the provision of global workplace solutions.
Employee benefits The Group’s major pension plans are of the defined contribution type. For these plans the Group’s contribution and other paid and unpaid benefits earned by the employees are charged to the income statement as incurred.
The cost of providing benefits under the defined benefit plan is determined using the projected unit credit method.
Re-measurements, comprising actuarial gains and losses, the effect of the asset ceiling, excluding net interest and the return on plan assets, excluding net interest, are recognised immediately in the statement of financial position with a corresponding debit or credit to retained earnings through other comprehensive income (OCI) in the period in which they occur. Re-measurements are not reclassified to profit or loss in subsequent periods.
Service costs are recognised in profit or loss, and include current and past service costs as well as gains and losses on curtailments.
Net interest is calculated by applying the discount rate to the net defined benefit liability or asset. The Group recognises the following changes in the net defined benefit obligation under ‘cost of sales’, ‘selling, general and administration expenses’ and ‘research and development expenses’ in the consolidated income statement: service costs comprising current service costs; past service costs; and gains and losses on curtailments and non-routine settlements.
Settlements of defined benefit schemes are recognised in the period in which the settlement occurs.
Share-based payments The share option programme entitles certain employees and Directors to acquire shares of the ultimate parent company; these awards are granted by the ultimate parent.
The fair value of options granted is recognised as an employee expense with a corresponding increase in equity. The fair value is measured at grant date and spread over the period during which the employees become unconditionally entitled to the options. The fair value of the options granted is measured using the Black-Scholes valuation model or the Monte Carlo method, taking into account the terms and conditions upon which the options were granted.
The amount recognised as an expense is adjusted to reflect the actual number of share options that vest except where forfeiture is due only to share prices not achieving the threshold for vesting.
Share appreciation rights (CIP) are also granted by the Company to certain employees. The fair value of the amount payable to the employee is recognised as an expense with a corresponding increase in equity. The fair value is initially recognised at grant date and spread over the period during which the employees become unconditionally entitled to payment. The fair value of the share appreciation rights is measured based on the Monte Carlo valuation model, taking into account the terms and conditions upon which the instruments were granted.
Taxation Tax on the profit for the year comprises current and deferred tax. Tax is recognised in the income statement except to the extent that it relates to items recognised directly in equity, in which case it is recognised in equity.
Current tax is the expected tax payable on the taxable income for the year, using tax rates enacted or substantively enacted at the balance sheet date, and any adjustment to tax payable in respect of previous years.
Deferred tax is provided on temporary differences between the carrying amounts of assets and liabilities for financial reporting purposes and the amounts used for taxation purposes. The following temporary differences are not provided for: the initial recognition of goodwill; the initial recognition of assets and liabilities that affect neither accounting nor taxable profit other than in a business combination; and differences relating to investments in subsidiaries to the extent that they will probably not reverse in the foreseeable future. The amount

www.regus.com 65
Strategic report
Go
vernanceFinancial statem
ents
Stra
tegi
c re
port
Go
vern
ance
Fina
ncia
l sta
tem
ents
www.regus.com 65
of deferred tax provided is based on the expected manner of realisation or settlement of the carrying amount of assets and liabilities, using tax rates enacted or substantively enacted at the balance sheet date.
A deferred tax asset is recognised for all unused tax losses only to the extent that it is probable that future taxable profits will be available against which the asset can be utilised.
Deferred tax assets and liabilities are offset when there is a legally enforceable right to set off current tax assets against current tax liabilities and when they relate to income taxes levied by the same taxation authority and the Group intends to settle its current tax assets and liabilities on a net basis.
Provisions A provision is recognised in the balance sheet when the Group has a present legal or constructive obligation as a result of a past event that can be estimated reliably, and it is probable that an outflow of economic benefits will be required to settle the obligation.
Restructuring provisions are made for direct expenditures of a business reorganisation where the plans are sufficiently detailed and well advanced and where the appropriate communication to those affected has been undertaken at the balance sheet date.
Provision is made for onerous contracts to the extent that the unavoidable costs of meeting the obligations under a contract exceed the economic benefits expected to be delivered, discounted using an appropriate weighted average cost of capital.
Net finance expenses Interest charges and income are accounted for in the income statement on an accruals basis. Financing transaction costs that relate to financial liabilities are charged to interest expense using the effective interest rate method and are recognised within the carrying value of the related financial liability on the balance sheet. Fees paid for the arrangement of credit facilities are recognised as a prepayment and recognised through the finance expense over the term of the facility. In the event of a facility being drawn the relevant unamortised portion of the fee is recognised within the carrying value of the financial liability and charged to the interest expense using the effective interest rate method.
Where assets or liabilities on the Group balance sheet are carried at net present value, the increase in the amount due to unwinding the discount is recognised as a finance expense or finance income as appropriate.
Costs arising on bank guarantees and letters of credit and foreign exchange gains or losses are included in other finance costs (note 8).
Interest bearing borrowings and other financial liabilities Financial liabilities, including interest bearing borrowings, are recognised initially at fair value less attributable transaction costs. Subsequent to initial recognition, financial liabilities are stated at amortised cost with any difference between cost and redemption value being recognised in the income statement over the period of the borrowings on an effective interest rate method.
The Group derecognises financial liabilities when the Group’s obligations are discharged, cancelled or expired.
Financial liabilities are classified as financial liabilities at fair value through profit or loss where the liability is either held for trading or is designated as held at fair value through profit or loss on initial recognition. Financial liabilities at fair value through profit or loss are stated at fair value with any resultant gain or loss recognised in the income statement.
Financial assets Financial assets are classified either at fair value through profit or loss, held-to-maturity investments, available-for-sale financial assets or loans and receivables. The classification depends on the nature and purpose of the financial assets and is determined on initial recognition.
Financial assets at fair value through profit or loss are measured at fair value and changes therein, including any interest or dividend income, are recognised in profit or loss.
Held-to-maturity financial assets are initially recognised at fair value plus any directly attributable transaction costs. Subsequent to initial recognition, they are measured at amortised costs using the effective interest rate method.
Available-for-sale financial assets are initially recognised at fair value plus any directly attributable transaction costs. Subsequent to initial recognition, they are measured at fair value and changes therein, other than impairment losses and foreign currency differences on debt instruments, are recognised in OCI and accumulated in the fair value reserve. When these assets are derecognised, the gain or loss accumulated in equity is reclassified to profit or loss.
Trade and other receivables that have fixed or determinable payments that are not quoted in an active market are classified as loans and receivables. Loans and receivables are measured at amortised cost using the effective interest rate method, less any impairment. Interest income is recognised by applying the effective interest rate, except for short-term receivables when recognition would be immaterial.
Customer deposits Deposits received from customers against non-performance of the contract are held on the balance sheet as a current liability until they are returned to the customer at the end of their relationship with the Group.
Foreign currency transactions and foreign operations Transactions in foreign currencies are recorded using the rate of exchange ruling at the date of the transaction. Monetary assets and liabilities denominated in foreign currencies are translated using the closing rate of exchange at the balance sheet date and the gains or losses on translation are taken to the income statement. Non-monetary assets and liabilities that are measured in terms of historical cost in a foreign currency are translated using the exchange rate at the date of the transaction. The results and cash flows of foreign operations are translated using the average rate for the period. Assets and liabilities, including goodwill and fair value adjustments, of foreign operations are translated using the closing rate, with all exchange differences arising on consolidation being recognised in other comprehensive income, and presented in the foreign currency translation reserve in equity. Exchange differences are released to the income statement on disposal.

66 Regus plc Annual Report and Accounts 2015
Notes to the accounts continued
66 Regus plc Annual Report and Accounts 2015
2. Accounting policies (continued) Cash and cash equivalents Cash and cash equivalents comprise cash at bank and in hand and are subject to an insignificant risk of changes in value.
Derivative financial instruments The Group’s policy on the use of derivative financial instruments can be found in note 24. Derivative financial instruments are measured initially at fair value and changes in the fair value are recognised through profit or loss unless the derivative financial instrument has been designated as a cash flow hedge whereby the effective portion of changes in the fair value are deferred in equity.
Foreign currency translation rates
At 31 December Annual average
2015 2014 2015 2014
US dollar 1.48 1.56 1.53 1.64Euro 1.36 1.28 1.38 1.25Japanese yen 179 186 185 175
3. Segmental analysis – statutory basis An operating segment is a component of the Group that engages in business activities from which it may earn revenues and incur expenses, including those that relate to transactions with other operating segments. An operating segment’s results are reviewed regularly by the chief operating decision maker (the Board of Directors of the Group) to make decisions about resources to be allocated to the segment and assess its performance, and for which discrete financial information is available.
The business is run on a worldwide basis but managed through four principal geographical segments: Americas; Europe, Middle East and Africa (EMEA); Asia Pacific; and the United Kingdom. These geographical segments exclude the Group’s non-trading, holding and corporate management companies. The results of business centres in each of these regions form the basis for reporting geographical results to the chief operating decision maker. All reportable segments are involved in the provision of global workplace solutions.
The Group’s reportable segments operate in different markets and are managed separately because of the different economic characteristics that exist in each of those markets. Each reportable segment has its own discrete senior management team responsible for the performance of the segment.
The accounting policies of the operating segments are the same as those described in the Annual Report and Accounts for Regus plc for the year ended 31 December 2014. The performance of each segment is assessed on the basis of the segment operating profit, which excludes internal revenue, corporate overheads and foreign exchange gains and losses arising on transactions with other operating segments.

www.regus.com 67
Strategic report
Go
vernanceFinancial statem
ents
Stra
tegi
c re
port
Go
vern
ance
Fina
ncia
l sta
tem
ents
www.regus.com 67
Americas EMEA Asia Pacific United Kingdom All other operating
segments Total
2015
£m 2014
£m 2015
£m2014
£m2015
£m2014
£m2015
£m2014
£m2015
£m 2014
£m 2015
£m2014
£m
Revenues from external customers 779.2 677.9 406.6 369.5 289.1 242.0 449.2 386.1 2.9 0.6 1,927.0 1,676.1Revenues from internal customers – 0.3 0.3 0.5 – – 1.2 1.2 – – 1.5 2.0Segment revenues 779.2 678.2 406.9 370.0 289.1 242.0 450.4 387.3 2.9 0.6 1,928.5 1,678.1Gross profit (centre contribution) 171.0 149.3 90.5 79.0 58.2 60.6 107.7 94.0 (0.2) 1.1 427.2 384.0Reportable segment profit 99.7 77.6 40.5 24.4 26.0 26.6 84.6 68.8 (12.0) (9.0) 238.8 188.4Share of profit of joint ventures – – 1.1 1.7 – – (0.8) (0.9) – – 0.3 0.8Finance expense (0.2) (1.3) (0.4) (0.2) (1.3) (0.7) (1.6) (2.1) – – (3.5) (4.3)Finance income – – 0.5 0.3 (0.1) (0.1) – 0.1 – – 0.4 0.3Depreciation and amortisation 72.2 59.5 21.9 17.8 19.0 14.7 25.2 18.5 4.9 7.4 143.2 117.9Taxation (income)/charge (9.2) 1.3 (3.6) (5.9) (3.5) (5.9) (2.6) 2.2 (6.9) (8.9) (25.8) (17.2)Assets 1,247.1 1,017.4 506.6 347.6 321.4 257.0 842.1 579.9 1.7 1.7 2,918.9 2,203.6Liabilities (1,118.0) (915.9) (611.9) (435.9) (327.8) (243.8) (811.8) (582.1) (0.2) (0.3) (2,869.7) (2,178.0)Net assets/(liabilities) 129.1 101.5 (105.3) (88.3) (6.4) 13.2 30.3 (2.2) 1.5 1.4 49.2 25.6Non-current asset additions 146.9 118.9 48.4 35.3 58.9 31.1 46.6 19.8 – – 300.8 205.1
Revenue in the “All other operating segments” category is generated from services related to the provision of workplace solutions, including fees earned from franchise agreements and commissions earned from the sale of outsourced workplace solution products. Revenue from internal customers is determined by reference to current market prices.
4. Segmental analysis – entity-wide disclosures The Group’s primary activity and only business segment is the provision of global workplace solutions, therefore all revenue is attributed to a single group of similar products and services. It is not meaningful to separate this group into further categories of products. Revenue is recognised where the service is provided.
The Group has a diversified customer base and no single customer contributes a material percentage of the Group’s revenue.
The Group’s revenue from external customers and non-current assets analysed by foreign country is as follows:
2015 2014
£m External revenue
Non-current assets(a)
External revenue
Non-current assets(a)
Country of domicile – Luxembourg 6.2 2.5 4.9 1.5 United States of America 636.3 720.5 524.9 575.6 United Kingdom 391.1 282.2 386.1 275.7 All other countries 893.4 646.4 760.2 465.9 1,927.0 1,651.6 1,676.1 1,318.7
(a) Excluding deferred tax assets.

68 Regus plc Annual Report and Accounts 2015
Notes to the accounts continued
68 Regus plc Annual Report and Accounts 2015
4. Segmental analysis – entity-wide disclosures (continued) 2015
£m Revenue
Gross profit (centre
contribution)Operating
profitShare of
JV profitFinance
expenseFinance income
Depreciation and
amortisation Profit
before tax
Reportable segment results 1,928.5 427.2 238.8 0.3 (3.5) 0.4 143.2 236.0Exclude: Internal revenue (1.5) (1.5) – – – – – –Corporate overheads – 2.7 (94.3) – (12.5) 0.2 2.0 (106.6)Foreign exchange gains and losses – – – – 1.0 – – 1.0Non–recurring items – – 15.3 – – – – 15.3
Published Group total 1927.0 428.4 159.8 0.3 (15.0) 0.6 145.2 145.7
2014
£m Revenue
Gross profit (centre
contribution)Operating
profitShare of JV profit
Finance expense
Finance income
Depreciation and
amortisation Profit
before tax
Reportable segment results 1,678.1 384.0 188.4 0.8 (4.3) 0.3 117.9 185.2Exclude: Internal revenue (2.0) (2.0) – – – – – –Corporate overheads – 1.1 (84.9) – (12.1) (0.2) 2.6 (97.2)Foreign exchange gains and losses – – – – (0.9) – – (0.9)Non–recurring items – – – – – – – –Published Group total 1,676.1 383.1 103.5 0.8 (17.3) 0.1 120.5 87.1
2015
£m Assets Liabilities Net assets/
(liabilities)
Reportable segment results 2,918.9 (2,869.7) 49.2Exclude: Segmental inter-company amounts (726.0) 1,429.3 703.3Corporate overhead assets and liabilities (excluding amounts due to/from reportable segments): Cash 29.8 – 29.8Deferred taxation 24.3 – 24.3Bank and other loans – (234.4) (234.4)Other 80.6 (69.1) 11.5Published Group total 2,327.6 (1,743.9) 583.7
2014
£m Assets Liabilities Net assets/
(liabilities)
Reportable segment results 2,203.6 (2,178.0) 25.6Exclude: Segmental inter-company amounts (405.5) 1,012.5 607.0Corporate overhead assets and liabilities (excluding amounts due to/from reportable segments): Cash 30.0 – 30.0Deferred taxation 23.6 – 23.6Bank and other loans – (203.6) (203.6)Other 95.0 (40.2) 54.8Published Group total 1,946.7 (1,409.3) 537.4

www.regus.com 69
Strategic report
Go
vernanceFinancial statem
ents
Stra
tegi
c re
port
Go
vern
ance
Fina
ncia
l sta
tem
ents
www.regus.com 69
5. Operating profit Operating profit has been arrived at after charging/(crediting):
Notes 2015
£m2014
£m
Depreciation on property, plant and equipment Owned assets 14 133.6 107.0Finance leases 14 0.6 0.5
Amortisation of intangibles 13 11.0 13.0Provision for bad debts 24 6.5 4.5Profit on disposal of property, plant and equipment (0.3) (0.9)Impairment of property, plant and equipment 0.9 –Rents payable in respect of operating leases
Property 657.5 572.6Contingent rents paid 38.4 26.5Equipment 2.9 2.4
Amortisation of partner contributions (35.6) (26.6)Amortisation of acquired lease fair value adjustments (4.6) (5.2)Staff costs 7 356.4 334.6
2015
£m2014
£m
Fees payable to the Group’s auditor for the audit of the Group accounts 0.8 0.7Fees payable to the Group’s auditor and its associates for other services:
The audit of the Company’s subsidiaries pursuant to legislation 1.0 1.0Other services pursuant to legislation Tax services – –Other services – –
6. Non-recurring items
2015
£m2014
£m
Disposal of assets held for sale 18 21.3 –Competition & Markets Authority investigation (2.8) –California class action (3.2) – 15.3 –
Disposal of assets held for sale During 2014 the Group completed a project to dispose of the assets and liabilities of specific non-core operations to release the related capital originally invested in these operations. The sale of these assets and liabilities, which were previously classified as assets held for sale (note 18), completed during February 2015 for a consideration of £84.0 million and a non-recurring profit of £21.3 million after expenses.
The following major classes of assets and liabilities were disposed of as part of the assets held for sale:
2015
£m
Assets Goodwill (note 12) 10.3Trade and other receivables 49.6Assets held for sale 59.9 Liabilities Trade and other payables (1.2)Liabilities held for sale (1.2) Net assets held for sale 58.7Disposal related costs 4.0 Proceeds on disposal 84.0Profit on disposal 21.3

70 Regus plc Annual Report and Accounts 2015
Notes to the accounts continued
70 Regus plc Annual Report and Accounts 2015
6. Non-recurring items (continued) Competition & Markets Authority investigation The United Kingdom Competition & Markets Authority initiated an inquiry into competition in the serviced offices industry after the Group acquired Avanta Serviced Offices Group plc during 2015. This inquiry is ongoing and expected to be completed during 2016. The Group has provided for £2.8m in respect of related legal costs.
California class action During 2015 a class action was filed against the Group alleging a breach of labour regulations in California. While the outcome of this legal action remains uncertain, the Group has provided for £3.2m in respect of any potential settlement and related legal costs.
7. Staff costs
2015
£m 2014
£m
The aggregate payroll costs were as follows: Wages and salaries 302.5 281.9Social security 46.5 45.6Pension costs 5.2 4.6Share-based payments 2.2 2.5 356.4 334.6
2015 Average full time
equivalents
2014 Average full time
equivalents
The average number of persons employed by the Group (including Executive Directors), analysed by category and geography, was as follows: Centre staff 6,842 6,159Sales and marketing staff 467 601Finance staff 778 742Other staff 1,203 1,198 9,290 8,700 Americas 3,064 3,065EMEA 2,107 1,929Asia Pacific 1,832 1,497United Kingdom 996 1,046Corporate functions 1,291 1,163 9,290 8,700
Details of Directors’ emoluments and interests are given on pages 42 to 54 in the Remuneration Report.
8. Net finance expense
2015
£m 2014
£m
Interest payable and similar charges on bank loans and corporate borrowings (9.5) (8.4)Interest payable and similar charges on finance leases – –Total interest expense (9.5) (8.4)Other finance costs (including foreign exchange) (3.9) (7.0)Unwinding of discount rates (1.6) (1.9)Total finance expense (15.0) (17.3)Total interest income 0.6 0.1Unwinding of discount rates – –Total finance income 0.6 0.1Net finance expense (14.4) (17.2)

www.regus.com 71
Strategic report
Go
vernanceFinancial statem
ents
Stra
tegi
c re
port
Go
vern
ance
Fina
ncia
l sta
tem
ents
www.regus.com 71
9. Taxation (a) Analysis of charge in the year
2015
£m2014
£m
Current taxation Corporate income tax (18.1) (17.6)Previously unrecognised tax losses and temporary differences (3.0) 0.9Under provision in respect of prior years (3.5) (3.9)Total current taxation (24.6) (20.6)Deferred taxation Origination and reversal of temporary differences (11.3) (11.0)Previously unrecognised tax losses and temporary differences 11.2 15.5Under provision in respect of prior years (1.1) (1.1)Total deferred taxation (1.2) 3.4Tax charge on profit (25.8) (17.2)
(b) Reconciliation of taxation charge
2015 2014
£m % £m %
Profit before tax 145.7 87.1
Tax on profit at 29.22% (2014: 29.22%) (42.6) (29.2) (25.5) (29.2)Tax effects of: Expenses not deductible for tax purposes (8.6) (5.9) (9.5) (10.9)Items not chargeable for tax purposes 40.2 27.6 24.8 28.5Non-recurring items not chargeable for tax purposes 4.6 3.2 – –Recognition of previously unrecognised deferred tax assets 8.2 5.6 16.4 18.8Movements in temporary differences in the year not recognised in deferred tax (23.3) (16.0) (20.2) (23.3)Adjustment to tax charge in respect of previous years (4.6) (3.2) (5.0) (5.7)Differences in tax rates on overseas earnings 0.3 0.2 1.8 2.0
(25.8) (17.7) (17.2) (19.8)
The applicable tax rate is determined based on the tax rate in Luxembourg which was the statutory tax rate applicable in the country of domicile of the parent company of the Group for the financial year.

72 Regus plc Annual Report and Accounts 2015
Notes to the accounts continued
72 Regus plc Annual Report and Accounts 2015
9. Taxation (continued) (c) Factors that may affect the future tax charge Unrecognised tax losses to carry forward against certain future overseas corporation tax liabilities have the following expiration dates:
2015
£m 2014
£m
2015 – 0.72016 3.4 3.22017 6.3 13.62018 10.1 12.52019 18.9 17.72020 45.3 29.12021 8.8 9.72022 13.8 14.32023 and later 54.0 31.5 160.6 132.3Available indefinitely 226.6 210.8Tax losses available to carry forward 387.2 343.1Amount of tax losses recognised in the deferred tax asset 113.4 107.1Total tax losses available to carry forward 500.6 450.2
The following deferred tax assets have not been recognised due to uncertainties over recoverability.
2015
£m 2014
£m
Intangibles 26.7 30.4Accelerated capital allowances 19.4 13.5Tax losses 101.2 91.0Rent 9.2 11.3Short-term timing differences 8.2 6.6
164.7 152.8
Estimates relating to deferred tax assets, including assumptions about future profitability, are re-evaluated at the end of each reporting period.
(d) Corporation tax
2015
£m 2014
£m
Corporation tax payable (14.0) (10.3)Corporation tax receivable 17.9 12.5

www.regus.com 73
Strategic report
Go
vernanceFinancial statem
ents
Stra
tegi
c re
port
Go
vern
ance
Fina
ncia
l sta
tem
ents
www.regus.com 73
(e) Deferred taxation The movement in deferred tax is analysed below:
Intangibles £m
Property, plant and
equipment £m
Tax losses £m
Rent £m
Short-term temporary
differences £m
Total £m
Deferred tax asset At 1 January 2014 (33.5) 13.2 36.4 27.1 (9.8) 33.4Acquisitions – – 1.7 – (0.4) 1.3Current year movement 0.3 (4.0) (4.7) 8.0 5.2 4.8Prior year movement 1.9 0.2 (2.2) 0.2 (1.2) (1.1)Transfers – 0.4 (0.2) (0.2) 0.7 0.7Exchange movement (3.1) 1.6 0.4 1.6 0.4 0.9At 1 January 2015 (34.4) 11.4 31.4 36.7 (5.1) 40.0Acquisitions – – – – – –Current year movement (2.0) (9.7) (3.3) 11.4 3.5 (0.1)Prior year movement – (5.6) 4.0 (0.2) – (1.8)Transfers – (0.4) 0.8 0.4 (0.2) 0.6Exchange movement (3.2) (0.1) (0.9) 2.2 (0.3) (2.3)At 31 December 2015 (39.6) (4.4) 32.0 50.5 (2.1) 36.4
Deferred tax liability At 1 January 2014 (0.2) (0.6) 0.2 0.1 (1.1) (1.6)Current year movement – (0.7) (0.1) – 0.5 (0.3)Prior year movement – 0.1 – – (0.1) –Transfers – (0.4) 0.1 0.2 (0.6) (0.7)Exchange movement – 0.5 0.1 – (0.2) 0.4At 1 January 2015 (0.2) (1.1) 0.3 0.3 (1.5) (2.2)Current year movement – (1.0) 1.1 0.2 (0.3) –Prior year movement – 1.6 – – (0.9) 0.7Transfers – 0.4 (0.8) (0.4) 0.2 (0.6)Exchange movement 0.2 (1.4) 0.1 (0.1) 1.7 0.5At 31 December 2015 – (1.5) 0.7 – (0.8) (1.6)
The movements in deferred taxes included above are after the offset of deferred tax assets and deferred tax liabilities where there is a legally enforceable right to set off and they relate to income taxes levied by the same taxation authority.
Deferred tax assets recognised on short-term temporary differences consist predominantly of provisions deductible when paid and share-based payments. Deferred tax assets have been recognised in excess of deferred tax liabilities on the basis that there are forecast taxable profits in the entities concerned.
At the balance sheet date, the temporary difference arising from unremitted earnings of overseas subsidiaries was £189.9m (2014: £249.8m). The only tax that would arise on these reserves would be non-creditable withholding tax.
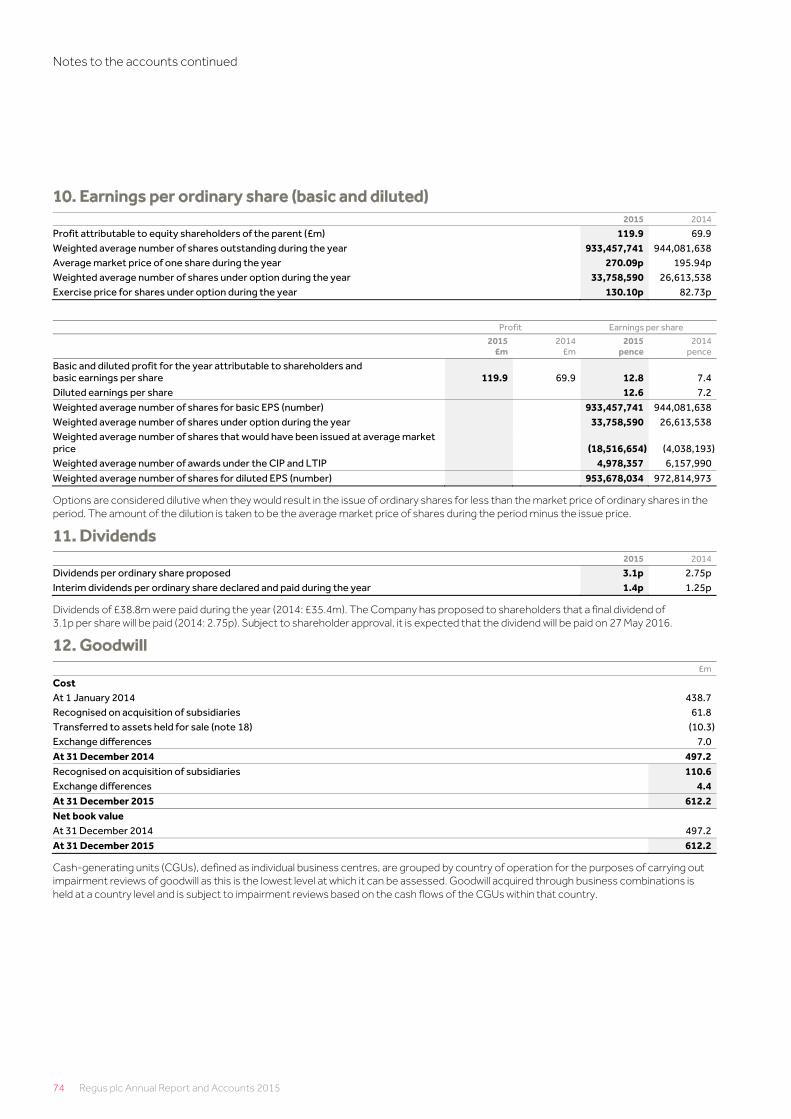
74 Regus plc Annual Report and Accounts 2015
Notes to the accounts continued
74 Regus plc Annual Report and Accounts 2015
10. Earnings per ordinary share (basic and diluted) 2015 2014
Profit attributable to equity shareholders of the parent (£m) 119.9 69.9Weighted average number of shares outstanding during the year 933,457,741 944,081,638Average market price of one share during the year 270.09p 195.94pWeighted average number of shares under option during the year 33,758,590 26,613,538Exercise price for shares under option during the year 130.10p 82.73p
Profit Earnings per share
2015 £m
2014 £m
2015 pence
2014 pence
Basic and diluted profit for the year attributable to shareholders and basic earnings per share 119.9 69.9 12.8 7.4Diluted earnings per share 12.6 7.2Weighted average number of shares for basic EPS (number) 933,457,741 944,081,638Weighted average number of shares under option during the year 33,758,590 26,613,538Weighted average number of shares that would have been issued at average market price (18,516,654) (4,038,193)Weighted average number of awards under the CIP and LTIP 4,978,357 6,157,990Weighted average number of shares for diluted EPS (number) 953,678,034 972,814,973
Options are considered dilutive when they would result in the issue of ordinary shares for less than the market price of ordinary shares in the period. The amount of the dilution is taken to be the average market price of shares during the period minus the issue price.
11. Dividends 2015 2014
Dividends per ordinary share proposed 3.1p 2.75pInterim dividends per ordinary share declared and paid during the year 1.4p 1.25p
Dividends of £38.8m were paid during the year (2014: £35.4m). The Company has proposed to shareholders that a final dividend of 3.1p per share will be paid (2014: 2.75p). Subject to shareholder approval, it is expected that the dividend will be paid on 27 May 2016.
12. Goodwill £m
Cost At 1 January 2014 438.7Recognised on acquisition of subsidiaries 61.8Transferred to assets held for sale (note 18) (10.3)Exchange differences 7.0At 31 December 2014 497.2Recognised on acquisition of subsidiaries 110.6Exchange differences 4.4At 31 December 2015 612.2Net book value At 31 December 2014 497.2At 31 December 2015 612.2
Cash-generating units (CGUs), defined as individual business centres, are grouped by country of operation for the purposes of carrying out impairment reviews of goodwill as this is the lowest level at which it can be assessed. Goodwill acquired through business combinations is held at a country level and is subject to impairment reviews based on the cash flows of the CGUs within that country.

www.regus.com 75
Strategic report
Go
vernanceFinancial statem
ents
Stra
tegi
c re
port
Go
vern
ance
Fina
ncia
l sta
tem
ents
www.regus.com 75
The goodwill attributable to the reportable business segments is as follows:
2015
£m2014
£m
Carrying amount of goodwill included within the Americas business segment 260.2 214.9Carrying amount of goodwill included within the EMEA business segment 100.4 72.3Carrying amount of goodwill included within the Asia Pacific business segment 29.9 29.7Carrying amount of goodwill included within the UK business segment 221.7 180.3 612.2 497.2
The carrying value of goodwill and indefinite life intangibles allocated to two countries, the USA and the UK, is material relative to the total carrying value comprising 75.4% of the total. The remaining 24.6% of the carrying value is allocated to a further 40 countries. The goodwill and indefinite life intangibles allocated to the USA and the UK are set out below:
Goodwill £m
Intangible assets
£m 2015
£m2014
£m
USA 240.0 – 240.0 193.3UK 221.7 11.2 232.9 191.5Other countries 150.5 – 150.5 123.6 612.2 11.2 623.4 508.4
The indefinite life intangible asset relates to the brand value arising from the acquisition of the remaining 58% of the UK business in the year ended 31 December 2006 (see note 13).
The value in use for each country has been determined using a model which derives the individual value in use for each country from the value in use of the Group as a whole. Although the model includes budgets and forecasts prepared by management it also reflects external factors, such as capital market risk pricing as reflected in the market capitalisation of the Group and prevailing tax rates, which have been used to determine the risk adjusted discount rate for the Group. Management believes that the projected cash flows are a reasonable reflection of the likely outcomes over the medium to long term. In the event that trading conditions deteriorate beyond the assumptions used in the projected cash flows, it is also possible that impairment charges could arise in future periods.
The following key assumptions have been used in calculating value in use for each country:
• Future cash flows are based on the budget for 2016 approved by the Board. The model excludes cost savings and restructurings that are anticipated but had not been committed to at the date of the determination of the value in use. Thereafter forecasts have been prepared by management for a further four years from 2016 that reflect an average annual growth rate of 3% (2015: 3%).
• These forecasts exclude the impact of both organic and acquisitive growth expected to take place in future periods.
• Management consider these projections to be a reasonable projection of margins expected at the mid-cycle position. Cash flows beyond 2019 have been extrapolated using a 2% growth rate which management believes is a reasonable long-term growth rate for any of the markets in which the relevant countries operate. A terminal value is included in the assessment, reflecting the Group’s expectation that it will continue to operate in these markets and the long-term nature of the businesses.
• The Group applies a country specific pre-tax discount rate to the pre-tax cash flows for each country. The country specific discount rate is based on the underlying weighted average cost of capital (WACC) for the Group. The Group WACC is then adjusted for each country to reflect the assessed market risk specific to that country. The Group pre-tax WACC increased marginally from 12.4% in 2014 to 12.7% in 2015 (post-tax WACC: 10.2%). The country specific pre-tax WACC reflecting the respective market risk adjustment has been set between 12.1% and 17.3% (2014: 11.3% to 17.2%).
The amount by which the value in use exceeds the carrying amounts of goodwill are sufficiently large to enable the Directors to conclude that a reasonably possible change in the key assumptions would not result in an impairment charge in any of the countries. Foreseeable events are unlikely to result in a change in the projections of such a significant nature as to result in the goodwill carrying amount exceeding their recoverable amount. The forecast models used in assessing the impairment of goodwill are based on the related business centre structure at the end of the year. These models therefore do not reflect the expected improvement in margin as new centres mature.
The key assumptions used in the US model forecasts a centre contribution of 26%, with an average centre contribution of 26% over the next five years. Revenue and costs grow at 3% per annum from 2015, maintaining a terminal 2020 centre gross margin of 26%. Thereafter a 2% long-term growth rate is assumed on revenue and cost into perpetuity. The cash flows have been discounted using a pre-tax discount rate of 16% (2014: 15%).
The UK model forecasts a 2015 centre contribution of 21%, with an average centre contribution of 21% over the next five years. Revenue and costs grow at 3% per annum from 2015, maintaining a terminal 2020 centre gross margin of 21%. Thereafter a 2% long-term growth rate is assumed on revenue and cost into perpetuity. The cash flows have been discounted using a pre-tax discount rate of 13% (2014: 13%).

76 Regus plc Annual Report and Accounts 2015
Notes to the accounts continued
76 Regus plc Annual Report and Accounts 2015
12. Goodwill (continued) Management has considered the following sensitivities:
Market growth and WIPOW – Management has considered the impact of a variance in market growth and WIPOW. The value in use calculation shows that if the long-term growth rate was reduced to nil, the recoverable amount of the US and UK would still be greater than their carrying value.
Discount rate – Management has considered the impact of an increase in the discount rate applied to the calculation. The value-in-use calculation shows that for the recoverable amount to be less than its carrying value, the pre-tax discount rate would have to be increased to 30% (2014: 23%) for the US and 36% (2014: 35%) for the UK.
13. Other intangible assets
Brand £m
Customer lists
£m Software
£m Total
£m
Cost At 1 January 2014 51.6 24.2 40.7 116.5Additions at cost – – 11.0 11.0Acquisition of subsidiaries – 0.3 – 0.3Transferred to assets held for sale (note 18) – – – –Disposals – – – –Exchange rate movements 2.5 0.4 (0.5) 2.4At 31 December 2014 54.1 24.9 51.2 130.2Additions at cost – – 8.7 8.7Acquisition of subsidiaries – 4.1 – 4.1Disposals – – – –Exchange rate movements 2.2 (0.2) (1.2) 0.8At 31 December 2015 56.3 28.8 58.7 143.8Amortisation At 1 January 2014 19.0 21.9 22.6 63.5Charge for year 2.0 1.5 9.5 13.0Transferred to assets held for sale (note 18) – – – –Disposals – – – –Exchange rate movements 1.3 (0.2) (0.1) 1.0At 31 December 2014 22.3 23.2 32.0 77.5Charge for year 2.2 2.9 5.9 11.0Disposals – – – –Exchange rate movements 1.1 0.4 – 1.5At 31 December 2015 25.6 26.5 37.9 90.0 Net book value At 1 January 2014 32.6 2.3 18.1 53.0At 31 December 2014 31.8 1.7 19.2 52.7At 31 December 2015 30.7 2.3 20.8 53.8
Included with the brand value is £11.2m relating to the acquisition of the remaining 58% of the UK business in the year ended 31 December 2006. The Regus brand acquired in this transaction is assumed to have an indefinite useful life due to the fact that the value of the brand is intrinsically linked to the continuing operation of the Group.
As a result of the Regus brand acquired with the UK business having an indefinite useful life no amortisation is charged but the carrying value is assessed for impairment on an annual basis. The brand was tested at the balance sheet date against the recoverable amount of the UK business segment at the same time as the goodwill arising on the acquisition of the UK business (see note 12).
The remaining amortisation life for non-indefinite life brands is nine years.

www.regus.com 77
Strategic report
Go
vernanceFinancial statem
ents
Stra
tegi
c re
port
Go
vern
ance
Fina
ncia
l sta
tem
ents
www.regus.com 77
14. Property, plant and equipment Land and buildings
£m
Leasehold improvements
£m
Furniture and equipment
£m
Computer hardware
£mTotal
£m
Cost At 1 January 2014 8.1 744.7 382.3 59.7 1,194.8Additions 2.0 149.7 38.7 15.0 205.4Acquisition of subsidiaries 47.3 3.9 6.8 0.1 58.1Transferred to assets held for sale (note 18) (49.3) – (0.4) – (49.7)Disposals (5.5) (1.8) (0.7) (0.4) (8.4)Exchange rate movements – 7.5 4.2 1.4 13.1At 1 January 2015 2.6 904.0 430.9 75.8 1,413.3Additions 11.4 220.0 61.6 18.5 311.5Acquisition of subsidiaries – 18.1 3.3 2.0 23.4Disposals (2.6) (9.6) (2.0) (0.2) (14.4)Exchange rate movements – 3.5 3.3 (1.2) 5.6At 31 December 2015 11.4 1,136.0 497.1 94.9 1,739.4Accumulated depreciation At 1 January 2014 0.9 324.5 220.6 40.1 586.1Charge for the year 0.7 64.5 32.5 9.8 107.5Transferred to assets held for sale (note 18) (0.4) – – – (0.4)Disposals (0.6) (1.1) (0.3) – (2.0)Exchange rate movements (0.4) 1.9 0.9 0.9 3.3At 1 January 2015 0.2 389.8 253.7 50.8 694.5Charge for the year – 85.1 37.4 11.7 134.2Impairment – 0.9 – – 0.9Disposals (0.2) (3.9) (1.1) – (5.2)Exchange rate movements – (2.0) 0.6 (0.6) (2.0)At 31 December 2015 – 469.9 290.6 61.9 822.4 Net book value At 1 January 2014 7.2 420.2 161.7 19.6 608.7At 31 December 2014 2.4 514.2 177.2 25.0 718.8At 31 December 2015 11.4 666.1 206.5 33.0 917.0
Additions include £nil in respect of assets acquired under finance leases (2014: £nil).
The net book value of leasehold improvements, furniture and equipment includes amounts held under finance leases as follows:
2015
£m2014
£m
Cost 17.9 24.1Accumulated depreciation (16.6) (22.4)Net book value 1.3 1.7
15. Other long-term receivables
2015
£m2014
£m
Deposits held by landlords against rent obligations 53.5 42.9Amounts owed by joint ventures 4.0 3.7Prepayments and accrued income 5.5 2.7 63.0 49.3

78 Regus plc Annual Report and Accounts 2015
Notes to the accounts continued
78 Regus plc Annual Report and Accounts 2015
16. Trade and other receivables
2015
£m 2014
£m
Trade receivables 206.2 160.9Amounts owed by joint ventures 4.9 2.8Other receivables 102.6 78.1Acquired lease fair value asset 2.5 2.1Deposits held by landlords against rent obligations 15.8 14.9Prepayments and accrued income 158.5 138.9VAT recoverable 67.3 42.4 557.8 440.1
17. Trade and other payables (including customer deposits)
2015
£m 2014
£m
Trade payables 94.2 61.9VAT payable 60.8 46.6Other tax and social security 10.4 8.7Customer deposits 331.6 290.4Deferred partner contributions 48.3 35.2Amounts owed to joint ventures 1.6 1.4Rent accruals 112.2 80.1Acquired lease fair value liability 3.7 3.8Other accruals 133.0 112.8Other payables 20.7 29.3
Total current 816.5 670.2
2015
£m 2014
£m
Deferred partner contributions 199.5 154.7Rent accruals 169.6 121.5Acquired lease fair value liability 11.0 13.6Other payables 3.7 3.1
Total non-current 383.8 292.9
18. Assets and liabilities held for sale In 2014, the Group undertook a project to dispose of the assets and liabilities or specific non-core operations to release the related capital originally invested in these operations. These assets and liabilities were classified as held for sale and their net realisable value is estimated to be greater than their book value. The sale of these assets and liabilities completed during February 2015 for a consideration of £84.0m and a non-recurring profit of £21.3m after expenses (note 6).
The major classes of assets and liabilities classified by the Group as held for sale as at 31 December 2014 are as follows:
2014
£m
Assets Goodwill (note 12) 10.3Property, plant and equipment (note 14) 49.3Trade and other receivables 3.0Assets held for sale 62.6
Liabilities Trade and other payables (2.1)Liabilities held for sale (2.1)Net assets held for sale 60.5
There is no cumulative income or expense included in other comprehensive income relating to the net assets held for sale.
There are no assets or liabilities classified as held for sale in 2015.

www.regus.com 79
Strategic report
Go
vernanceFinancial statem
ents
Stra
tegi
c re
port
Go
vern
ance
Fina
ncia
l sta
tem
ents
www.regus.com 79
19. Borrowings The Group’s total loan and borrowing position at 31 December 2015 and at 31 December 2014 had the following maturity profiles:
Bank and other loans
2015
£m2014
£m
Repayments falling due as follows: Amounts falling due after more than one year: In more than one year but not more than two years 3.1 2.2In more than two years but not more than five years 208.9 207.1In more than five years 33.3 –Total non-current 245.3 209.3Total current 9.2 1.4Total bank and other loans 254.5 210.7
Obligations under finance leases The maturity of the Group’s finance obligations is as follows:
2015
£m2014
£m
Amounts payable Within one year or on demand – –In more than one year but not more than two years – 0.1In more than two years but not more than five years – – – 0.1Less: finance charges allocated to future periods – –Present value of future minimum lease payments – –Total current – –Total non-current – 0.1 – 0.1
20. Provisions 2015 2014
Onerous leases and
closures £m
Other £m
Total £m
Onerous leases and
closures £m
Other £m
Total £m
At 1 January 4.0 2.9 6.9 4.4 1.3 5.7Acquired in the period 3.0 0.1 3.1 1.2 – 1.2Provided in the period 3.9 2.9 6.8 0.7 2.1 2.8Utilised in the period – – – (0.5) (0.5) (1.0)Provisions released (3.2) (0.8) (4.0) (1.8) – (1.8)Exchange differences – 0.1 0.1 – – –At 31 December 7.7 5.2 12.9 4.0 2.9 6.9Analysed between: Current 0.4 4.9 5.3 0.9 1.7 2.6Non-current 7.3 0.3 7.6 3.1 1.2 4.3At 31 December 7.7 5.2 12.9 4.0 2.9 6.9
Onerous leases and closures Provisions for onerous leases and closures costs relate to the estimated future costs of centre closures and onerous property leases. The maximum period over which the provisions are expected to be utilised expires by 31 December 2021.
Other Other provisions include the estimated costs of claims against the Group outstanding at the year end, of which, due to their nature, the maximum period over which they are expected to be utilised is uncertain.

80 Regus plc Annual Report and Accounts 2015
Notes to the accounts continued
80 Regus plc Annual Report and Accounts 2015
21. Investments in joint ventures
Investments in joint ventures
£m
Provision for deficit in
joint ventures £m
Total £m
At 1 January 2014 1.3 (1.2) 0.1Additions/(disposals) (0.6) – (0.6)Dividends paid (1.0) – (1.0)Share of profit 0.8 – 0.8Other – 0.5 0.5Exchange rate movements 0.2 – 0.2At 31 December 2014 0.7 (0.7) –Additions/(disposals) 1.9 – 1.9Dividends paid – – –Share of profit 3.2 (2.9) 0.3Other – (0.5) (0.5)Exchange rate movements (0.2) – (0.2)At 31 December 2015 5.6 (4.1) 1.5
The results of the joint ventures below are the full results of the joint ventures and do not represent the effective share:
2015
£m 2014
£m
Income statement Revenue 27.6 26.8Expenses (24.9) (23.4)Profit before tax for the year 2.7 3.4Tax charge (0.5) (0.6)Profit after tax for the year 2.2 2.8Net assets/(liabilities) Fixed assets 8.4 6.5Current assets 27.1 14.6Current liabilities (32.6) (15.9)Non-current liabilities (9.7) (9.6)Net assets (6.8) (4.4)
22. Share capital Ordinary equity share capital
2015 2014
NumberNominal value
£m Number Nominal value
£m
Authorised Ordinary 1p shares at 1 January & 31 December 8,000,000,000 80.0 8,000,000,000 80.0Issued and fully paid up Ordinary 1p shares at 1 January & 31 December 950,969,822 9.5 950,969,822 9.5
Treasury share transactions involving Regus plc shares As at 31 December 2015, 20,490,613 (2014: 12,883,455) shares were held as treasury shares. During the year ended 31 December 2015, Regus plc repurchased 9,543,800 (2014: 9,484,516) of its own shares in the open market and utilised 1,936,642 (2014: 1,858,441) treasury shares held by the Group to satisfy the exercise of share awards by employees.
The holders of ordinary shares in Regus Group plc were entitled to receive such dividends as were declared by the Company and were entitled to one vote per share at meetings of the Company. Treasury shares do not carry such rights until reissued.

www.regus.com 81
Strategic report
Go
vernanceFinancial statem
ents
Stra
tegi
c re
port
Go
vern
ance
Fina
ncia
l sta
tem
ents
www.regus.com 81
23. Analysis of financial assets At
1 Jan 2015 £m
Cash flow £m
Non-cash changes
£m
Exchange movements
£m
At 31 Dec 2015
£m
Cash and cash equivalents 72.8 (7.3) – (1.6) 63.9Gross cash 72.8 (7.3) – (1.6) 63.9Debt due within one year (1.4) (7.8) – – (9.2)Debt due after one year (209.3) (45.0) – 9.0 (245.3)Finance leases due within one year – – – – –Finance leases due after one year (0.1) 0.1 – – – (210.8) (52.7) – 9.0 (254.5)Net financial assets/(liabilities) (138.0) (60.0) – 7.4 (190.6)
Cash and cash equivalent balances held by the Group that are not available for use amounted to £16.0m at 31 December 2015 (2014: £17.4m). Of this balance, £12.5m (2014: £13.5m) is pledged as security against outstanding bank guarantees and a further £3.5m (2014: £3.9m) is pledged against various other commitments of the Group.
Non-cash changes comprise the amortisation of the debt issue costs, finance leases and movements in debt maturity.
24. Financial instruments and financial risk management The objectives, policies and strategies applied by the Group with respect to financial instruments and the management of capital are determined at Group level. The Group’s Board maintains responsibility for the risk management strategy of the Group and the Chief Financial Officer is responsible for policy on a day-to-day basis. The Chief Financial Officer and Group Treasurer review the Group’s risk management strategy and policies on an ongoing basis. The Board has delegated to the Group Audit Committee the responsibility for applying an effective system of internal control and compliance with the Group’s risk management policies. The Audit Committee is supported by the Head of Risk Management in performing this role.
Exposure to credit, interest rate, and currency risks arise in the normal course of business.
Going concern The Strategic Report on pages 1 to 27 of the Annual Report and Accounts sets out the Group’s strategy and the factors that are likely to affect the future performance and position of the business. The financial review on pages 18 to 20 within the Strategic Report reviews the trading performance, financial position, and cash flows of the Group. During the year ended 31 December 2015 the Group made a significant investment in growth and the Group’s net debt position increased by £52.6m to a net debt position of £190.6 as at 31 December 2015. The investment in growth is funded by a combination of cash flow generated from the Group’s mature business centres and debt. The Group has a £320m revolving credit facility provided by a group of relationship banks with a final maturity in 2020. As at 31 December 2015 £205.1m was available and undrawn.
After making enquiries, the Directors have a reasonable expectation that the Group has adequate resources to continue in operational existence for the foreseeable future and, accordingly, continue to adopt the going concern basis in preparing the Annual Report and Accounts.
Credit risk Credit risk could occur where a customer or counterparty defaults under the contractual terms of a financial instrument and arises principally in relation to customer contracts and the Group’s cash deposits.
A diversified customer base, requirement for customer deposits, and payments in advance on workstation contracts minimise the Group’s exposure to customer credit risk. No single customer contributes a material percentage of the Group’s revenue. The Group’s policy is to provide against trade receivables when specific debts are judged to be irrecoverable or where formal recovery procedures have commenced. A provision is created where debts are more than three months overdue which reflects the Group’s historical experience of the likelihood of recoverability of these trade receivables. These provisions are reviewed on an ongoing basis to assess changes in the likelihood of recoverability.
The maximum exposure to credit risk for trade receivables at the reporting date, analysed by geographic region, is summarised below.
2015
£m2014
£m
Americas 41.2 28.0EMEA 68.9 57.9Asia Pacific 33.7 28.7UK 62.4 46.3 206.2 160.9
All of the Group’s trade receivables relate to customers purchasing workplace solutions and associated services and no individual customer has a material balance owing as a trade receivable.

82 Regus plc Annual Report and Accounts 2015
Notes to the accounts continued
82 Regus plc Annual Report and Accounts 2015
24. Financial instruments and financial risk management (continued) The ageing of trade receivables at 31 December was:
Gross 2015
£m
Provision 2015
£m
Gross 2014
£m
Provision 2014
£m
Not overdue 158.4 – 120.4 –Past due 0 – 30 days 31.2 – 25.8 –Past due 31 – 60 days 7.4 – 7.9 –More than 60 days 20.8 (11.6) 15.1 (8.3) 217.8 (11.6) 169.2 (8.3)
At 31 December 2015, the Group maintained a provision of £11.6m against potential bad debts (2014: £8.3m) arising from trade receivables. The Group had provided £6.5m (2014: £4.5m) in the year and utilised £3.2m (2014: £2.5m). Customer deposits of £331.6m (2014: £290.4m) are held by the Group, mitigating the risk of default.
The Group believes no provision is generally required for trade receivables that are not overdue as the Group collects the majority of its revenue in advance of the provision of office services and requires deposits from its customers.
Cash investments and derivative financial instruments are only transacted with counterparties of sound credit ratings, and management does not expect any of these counterparties to fail to meet their obligations.
Liquidity risk The Group manages liquidity risk by closely monitoring the global cash position, the available and undrawn credit facilities, and forecast capital expenditure and expects to have sufficient liquidity to meet its financial obligations as they fall due. The Group has free cash and liquid investments (excluding blocked cash) of £47.9m (2014: £55.2m). In addition to cash and liquid investments, the Group had £205.1m available and undrawn under its committed borrowings. The Directors consider the Group has adequate liquidity to meet day-to-day requirements.
In May 2014 the Group issued debt securities for a total amount of EUR 210.0m (£154.2m) using the German “Schuldschein” framework for debt issuance. These securities consisted of EUR 165.0m of three year notes and EUR 45.0m of five year notes, and were sold to a number of banks and institutional investors.
The Group maintains a £320m revolving credit facility with a final maturity date in September 2020. As at 31 December £205.1m was available and undrawn under this facility.
Although the Group has net current liabilities of £446.1m (2014: £303.9m), the Group does not consider that this gives rise to a liquidity risk. A large proportion of the net current liabilities comprise non-cash liabilities such as deferred income which will be recognised in future periods through the income statement. Although the Group holds customer deposits of £331.6m (2014: £290.4m) these are spread across a large number of customers and no deposit held for an individual customer is material. Therefore the Group does not believe the balance represents a liquidity risk. The net current liabilities, excluding deferred income, were £205.4m at 31 December 2015 (2014: £98.6m).
Market risk The Group is exposed to market risk primarily related to foreign currency exchange rates, interest rates, and the market value of our investments in financial assets. These exposures are actively managed by the Group treasury department in accordance with a written policy approved by the Board of Directors. The Group does not use financial derivatives for trading or speculative reasons.
Interest rate risk The Group manages its exposure to interest rate risk through the relative proportions of fixed rate debt and floating rate debt. The surplus cash balances are invested short-term, and at the end of 2015 no cash was invested for a period exceeding three months.
Foreign currency risk The Group is exposed to foreign currency exchange rate movements. The majority of day-to-day transactions of overseas subsidiaries are carried out in local currency and the underlying foreign exchange exposure is small. Transactional exposures do arise in some countries where it is local market practice for a proportion of the payables or receivables to be in other than the functional currency of the affiliate. Intercompany charging, funding, and cash management activity may also lead to foreign exchange exposures. It is the policy of the Group to seek to minimise such transactional exposures through careful management of non-local currency assets and liabilities, thereby minimising the potential volatility in the income statement. Net investments in Regus affiliates with a functional currency other than sterling are of a long-term nature and the Group does not normally hedge such foreign currency translation exposures.
From time to time the Group uses short-term derivative financial instruments to manage its transactional foreign exchange exposures where these exposures cannot be eliminated through balancing the underlying risks. No transactions of a speculative nature are undertaken.

www.regus.com 83
Strategic report
Go
vernanceFinancial statem
ents
Stra
tegi
c re
port
Go
vern
ance
Fina
ncia
l sta
tem
ents
www.regus.com 83
The foreign currency exposure arising from open third party transactions held in a currency other than the functional currency of the related entity is summarised as follows:
2015 £m GBP JPY EUR USD
Trade and other receivables – – 9.1 16.4Trade and other payables (1.4) (1.2) (21.9) (19.4)Net statement of financial position exposure (1.4) (1.2) (12.8) (3.0)
2014
£m GBP JPY EUR USD
Trade and other receivables 0.1 – 5.7 11.4Trade and other payables (0.9) (2.2) (26.9) (12.9)Net statement of financial position exposure (0.8) (2.2) (21.2) (1.5)
Other market risks The Group does not hold any available-for-sale equity securities and is therefore not subject to risks of changes in equity prices in the income statement.
Sensitivity analysis For the year ending 31 December 2015 it is estimated that a general increase of one percentage point in interest rates would have decreased the Group’s profit before tax by approximately £1.7m (2014: decrease of £0.9m) with a corresponding increase in total equity.
It is estimated that a five percentage point weakening in the value of the US dollar against sterling would have decreased the Group’s profit before tax by approximately £6.0m for the year ended 31 December 2015 (2014: £3.1m). It is estimated that a five percentage point weakening in the value of the euro against sterling would have decreased the Group’s profit before tax by approximately £1.8m for the year ended 31 December 2015 (2014: decrease of £0.1m).
It is estimated that a five percentage point weakening in the value of the US dollar against sterling would have decreased the Group’s total equity by approximately £10.7m for the year ended 31 December 2015 (2014: £11.7m). It is estimated that a five percentage point weakening in the value of the euro against sterling would have decreased the Group’s total equity by approximately £5.9m for the year ended 31 December 2015 (2014: £6.4m).
Capital management The Group’s parent company is listed on the UK stock exchange and the Board’s policy is to maintain a strong capital base. The Chief Financial Officer monitors the diversity of the Group’s major shareholders and further details of the Group’s communication with key investors can be found in the Corporate Governance Report on page 35. In 2006, the Board approved the commencement of a progressive dividend policy to enhance the total return to shareholders.
The Group’s Chief Executive Officer, Mark Dixon, is the major shareholder of the Company and all executive members of the Board hold shares in the Company. Details of the Directors’ shareholdings can be found in the report of the Remuneration Committee on pages 42 to 43. In addition, the Group operates various share option plans for key management and other senior employees.
In the year ended 31 December 2015 Regus plc purchased 1,110,796 (2014: nil) of its own shares in the open market to satisfy employee share awards. Regus plc also purchased 9,543,800 (2014: 9,484,516) of its own shares in the open market to hold as treasury shares. 1,936,642 (2014: 1,858,441) treasury shares held by the Group were utilised to satisfy the exercise of share awards by employees. As at 1 March 2016, 20,486,213 shares were held as treasury shares.
The Company declared an interim dividend of 1.4p per share (2014: 1.25p) during the year ended 31 December 2015 and proposed a final dividend of 3.1p per share (2014: 2.75p per share), a 13% increase on the 2014 dividend.
The Group’s objective when managing capital (equity and borrowings) is to safeguard the Group’s ability to continue as a going concern and to maintain an optimal capital structure to reduce the cost of capital. The Group has a net debt position of £190.6m at the end of 2015 (2014: £138.0m) and £205.1m (2014: £256.6m) of committed undrawn borrowings.

84 Regus plc Annual Report and Accounts 2015
Notes to the accounts continued
84 Regus plc Annual Report and Accounts 2015
24. Financial instruments and financial risk management (continued) Effective interest rates In respect of financial assets and financial liabilities, the following table indicates their effective interest rates at the balance sheet date and the periods in which they mature. Interest payments are excluded from the table.
The undiscounted cash flow of these instruments is not materially different from the carrying value.
As at 31 December 2015
Effective interest
rate %(a)
Carrying value
£m
Contractual cash flow
£m
Less than 1 year
£m1-2 years
£m 2-5 years
£m
More than 5 years
£m
Cash and cash equivalents 0.4% 63.9 63.9 63.9 – – –Trade and other receivables – 454.0 465.6 408.4 26.7 30.5 –Financial assets(b) 517.9 529.5 472.3 26.7 30.5 – Non-derivative financial liabilities(a): Finance lease liabilities – – – – – – –Bank loans and corporate borrowings 4.0% (245.3) (245.3) – (124.1) (88.0) (33.2)Other loans 12.4% (9.2) (9.2) (9.1) (0.1) – –Customer deposits – (331.6) (331.6) (331.6) – – –Trade and other payables – (191.5) (191.5) (187.8) (3.7) – – Derivative financial liabilities: Cross-currency interest rate swaps – Outflow – (14.2) (135.3) – (135.3) – –– Inflow – – 121.1 – 121.1 – –Interest rate swaps – Outflow – (0.8) (0.8) – – (0.8) –– Inflow – – – – – – –Financial liabilities (792.6) (792.6) (528.5) (142.1) (88.8) (33.2)
(a) All financial instruments are classified as variable rate instruments.
(b) Financial assets are all held at amortised cost.
As at 31 December 2014
Effective interest rate
%(a)
Carrying value
£m
Contractual cash flow
£m
Less than 1 year
£m1-2 years
£m 2-5 years
£m
More than 5 years
£m
Cash and cash equivalents 0.3% 72.8 72.8 72.8 – – –Trade and other receivables – 345.9 354.1 307.3 21.5 25.3 –Financial assets(b) 418.7 426.9 380.1 21.5 25.3 – Non-derivative financial liabilities(a): Finance lease liabilities 0.7% (0.1) (0.1) (0.1) – – –Bank loans and corporate borrowings 3.7% (209.3) (209.3) – (2.2) (207.1) –Other loans 14.6% (1.4) (1.4) (1.4) – Customer deposits – (290.4) (290.4) (290.4) – – –Trade and other payables – (150.6) (150.6) (147.9) (2.7) – – Derivative financial liabilities: Cross-currency interest rate swaps – Outflow – (7.0) (135.7) – – (135.7) –– Inflow – – 128.7 – – 128.7 –Interest rate swaps – Outflow – (0.7) (0.7) – – (0.7) –– Inflow – – – – – – –Financial liabilities (659.5) (659.5) (439.8) (4.9) (214.8) –
(a) All financial instruments are classified as variable rate instruments.
(b) Financial assets are all held at amortised cost.

www.regus.com 85
Strategic report
Go
vernanceFinancial statem
ents
Stra
tegi
c re
port
Go
vern
ance
Fina
ncia
l sta
tem
ents
www.regus.com 85
Fair value disclosures The fair values together with the carrying amounts shown in the balance sheet are as follows:
31 December 2015 Carrying amount Fair value
£m Loans and
receivables Other financial
liabilities
Fair value –hedging
instruments Total Level 1 Level 2 Level 3 Total
Cash and cash equivalents 63.9 – – 63.9 – – – –Trade and other receivables 454.0 – – 454.0 – – – –Finance lease liabilities – – – – – – – –Bank loans and corporate borrowings – (245.3) – (245.3) – – – –Other loans (9.2) – (9.2) – – – –Customer deposits – (331.6) – (331.6) – – – –Trade and other payables – (191.5) – (191.5) – – – –Derivative financial liabilities – – (15.0) (15.0) – (15.0) – (15.0) 517.9 (777.6) (15.0) (274.7) – (15.0) – (15.0)Unrecognised gain –
31 December 2014 Carrying amount Fair value
£m Loans and
receivables
Other financial liabilities
Fair value – hedging
instruments Total Level 1 Level 2 Level 3 Total
Cash and cash equivalents 72.8 – – 72.8 – – – –Trade and other receivables 345.9 – – 345.9 – – – –Finance lease liabilities – (0.1) – (0.1) – – – –Bank loans and corporate borrowings – (209.3) – (209.3) – – – –Other loans – (1.4) – (1.4) – – – –Customer deposits – (290.4) – (290.4) – – – –Trade and other payables – (150.6) – (150.6) – – – –Derivative financial liabilities – – (7.7) (7.7) – (7.7) – (7.7) 418.7 (651.8) (7.7) (240.8) – (7.7) – (7.7)Unrecognised gain –
During the years ended 31 December 2014 and 31 December 2015, there were no transfers between levels for fair value measured instruments, and no financial instruments requiring level 3 fair value measurements were held.
Valuation techniques When measuring the fair value of an asset or a liability, the Group uses market observable data as far as possible. Fair values are categorised into different levels in a fair value hierarchy based on the inputs used in the valuation techniques as follows:
• Level 1: quoted prices in active markets for identical assets or liabilities;
• Level 2: inputs other than quoted prices included in level 1 that are observable for the asset or liability, either directly or indirectly; and
• Level 3: inputs for the asset or liability that are not based on observable market data.
The following tables show the valuation techniques used in measuring level 2 fair values, finance leases and methods used for financial assets and liabilities not measured at fair value:
Type Valuation technique
Cash and cash equivalents, trade and other receivables/payables and customer deposits
For cash and cash equivalents, receivables/payables with a remaining life of less than one year and customer deposits, the book value approximates the fair value because of their short-term nature.
Finance lease liabilities The fair value of finance leases has been calculated by discounting future cash flows at an appropriate discount rate which reflects current market assessments and the risks specific to such liabilities.
Loans and overdrafts The fair value of bank loans, overdrafts and other loans approximates the carrying value because interest rates are at floating rates where payments are reset to market rates at intervals of less than one year.
Foreign exchange contracts and interest rate swaps The fair values are based on a combination of broker quotes, forward pricing and swap models.
There was no significant unobservable input used in our valuation techniques.

86 Regus plc Annual Report and Accounts 2015
Notes to the accounts continued
86 Regus plc Annual Report and Accounts 2015
24. Financial instruments and financial risk management (continued) Derivative financial instruments The following table summarises the notional amount of the open contracts as at 31 December 2015:
2015
EUR m 2014
EUR m
Derivatives used for cash flow hedging 210.0 210.0
Committed borrowings
2015Facility
£m
2015 Available
£m
2014 Facility
£m
2014Available
£m
Schuldschein loan note 154.2 – 163.6 –Revolving credit facility 320.0 205.1 320.0 256.6Guarantee and letter of credit facility 75.0 4.6 95.0 15.5Total 549.2 209.7 578.6 272.1
In May 2014 the Group issued debt securities for a total amount of €210.0m (£154.2m) using the German “Schuldschein” framework for debt issuance. These securities consisted of €165.0m of three year notes and €45.0m of five year notes, and were sold to a number of banks and institutional investors. These securities are subject to covenants which are similar to our banking facilities. The Group is in compliance with these covenant requirements.
The underlying interest obligation on these debt securities is floating rate and in euro, however, as part of the Group’s balance sheet management and to protect against a future increase in interest rates, €165.0 million was swapped into a fixed rate GBP liability and €45.0m was swapped into a fixed rate euro liability. While providing the Group with protection against higher interest rates, given the current positive yield curve, the immediate impact of this hedging is a modest increase in financing expense.
The Group maintains a £320.0m revolving credit facility and a £75.0m bank guarantee and letter of credit facility both with final maturities in April 2020 and September 2017 respectively. Both facilities are subject to financial covenants relating to operating cash flow, net debt to EBITDA, and EBITDA plus rent to interest plus rent. The Group is in compliance with all covenant requirements.
25. Share-based payments There are three share-based payment plans, details of which are outlined below:
Plan 1: Regus Group Share Option Plan During 2004 the Group established the Regus Group Share Option Plan that entitles Executive Directors and certain employees to purchase shares in Regus plc (previously Regus Group plc). In accordance with this programme, holders of vested options are entitled to purchase shares at the market price of the shares at the day before the date of grant.
The Regus Group also operates the Regus Group Share Option Plan (France) which is included within the numbers for the Regus Share Option Plan disclosed above. The terms of the Regus Share Option Plan (France) are materially the same as the Regus Group Share Option Plan with the exception that they are only exercisable from the fourth anniversary of the date of grant, assuming the performance conditions have been met.
Reconciliation of outstanding share options
2015 2014
Number of share options
Weighted average
exercise price per share
Number of share options
Weighted average
exercise price per share
At 1 January 36,096,491 144.20 26,841,120 125.20Granted during the year 1,906,565 250.80 14,721,296 186.15Lapsed during the year (4,062,226) 205.94 (4,407,566) 155.91Exercised during the year (4,446,206) 95.12 (1,058,359) 98.81Outstanding at 31 December 29,494,624 155.35 36,096,491 144.22Exercisable at 31 December 2,853,016 100.00 2,118,056 103.62

www.regus.com 87
Strategic report
Go
vernanceFinancial statem
ents
Stra
tegi
c re
port
Go
vern
ance
Fina
ncia
l sta
tem
ents
www.regus.com 87
Date of grant Numbers
granted
Weighted average
exercise price per share Lapsed Exercised At 31 Dec 2015
Exercisable from Expiry date
23/03/2010 3,986,000 100.50 (3,463,777) (352,743) 169,480 23/03/2013 23/03/202028/06/2010 617,961 75.00 (546,198) (38,072) 33,691 28/06/2013 28/06/202001/09/2010 160,646 69.10 (146,728) (8,126) 5,792 01/09/2013 01/09/202001/04/2011 2,400,000 114.90 (954,402) (321,244) 1,124,354 01/04/2014 01/04/202130/06/2011 9,867,539 109.50 (4,900,647) (2,440,482) 2,526,410 30/06/2014 30/06/202131/08/2011 300,000 67.00 – (100,000) 200,000 31/08/2014 31/08/202102/09/2011 1,000,000 74.35 (92,667) (604,888) 302,445 01/09/2014 02/09/202113/06/2012 11,189,000 84.95 (3,703,446) (1,496,721) 5,988,833 13/06/2015 13/06/202212/06/2013 7,741,000 155.60 (2,993,810) – 4,747,190 12/06/2016 12/06/202318/11/2013 (Grant 1) 1,053,000 191.90 (1,053,000) – – 18/11/2016 17/11/202318/11/2013 (Grant 2) 600,000 191.90 (355,000) – 245,000 18/11/2016 17/11/202318/12/2013 (Grant 1) 200,000 195.00 (200,000) – – 18/12/2016 17/12/202318/12/2013 (Grant 2) 1,000,000 195.00 – – 1,000,000 18/12/2016 17/12/202320/05/2014 1,845,500 187.20 (1,210,300) – 635,200 20/05/2017 19/05/202405/11/2014 12,875,796 186.00 (766,132) – 12,109,664 05/11/2017 04/11/202419/05/2015 1,906,565 250.80 (1,500,000) – 406,565 19/05/2018 18/05/2025Total 56,743,007 139.18 (21,886,107) (5,362,276) 29,494,624
Nil options awarded during the year under the Regus Share Option Plan (France) are included in the above table (2014: 311,828), 33,603 lapsed during the year (2014: 162,250) and 13,861 were exercised during the year (2014: 5,044).
Performance conditions for share options March, June and September 2010 share option plan The Group and regional performance targets for the options awarded in March, June and September 2010, based on a combination of EPS and the Regus Total Shareholder Return (‘TSR’) % achieved relative to the FTSE All Share Total Return index is at least at the median over the performance period for the year ending 2010, were partially met. Those options that are eligible to vest will vest as follows:
Proportion to vest
2013 1/32014 1/32015 1/3
April 2011 share option plan The performance targets for the options awarded in April 2011, based on pre-growth profit for the year ending 31 December 2011, were partially met. Those options that are eligible to vest will vest as follows:
Proportion to vest
April 2014 1/3April 2015 1/3April 2016 1/3
June 2011 share option plan The Group and regional performance targets for the options awarded in June 2011, based on pre-growth profit for the year ending 31 December 2011, were partially met. Those options that are eligible to vest will vest as follows:
Proportion to vest
June 2014 1/3June 2015 1/3June 2016 1/3
August 2011 share option plan The options awarded in August 2011 are conditional on the ongoing employment of the related employee for a specified period of time. Once this condition is satisfied those options that are eligible to vest will vest as follows:
Proportion to vest
August 2014 1/3August 2015 1/3August 2016 1/3

88 Regus plc Annual Report and Accounts 2015
Notes to the accounts continued
88 Regus plc Annual Report and Accounts 2015
25. Share-based payments (continued) September 2011 share option plan The performance targets for the options awarded in September 2011, based on the pre-growth operating profit for the year ending 31 December 2012, were partially met. Those options that are eligible to vest will vest as follows:
Proportion
to vest
September 2014 1/3September 2015 1/3September 2016 1/3
June 2012 share option plan The Group performance targets for the options awarded in June 2012, based on pre-growth profit for the year ending 31 December 2012, were partially met. Once performance conditions are satisfied those options that are eligible to vest will vest as follows:
Proportion
to vest
June 2015 1/3June 2016 1/3June 2017 1/3
June 2013 share option plan The Group performance targets for the options awarded in June 2013, based on Group operating profit for the year ending 31 December 2013, were partially met. Those options that are eligible to vest will vest as follows:
Proportion
to vest
June 2016 1/3June 2017 1/3June 2018 1/3
November 2013 (Grant 1) share option plan The options awarded in November 2013 (Grant 1) are conditional on the ongoing employment of the related employees for a specified period of time. Once this condition is satisfied those options that are eligible to vest will vest as follows:
Proportion
to vest
November 2016 1/3November 2017 1/3November 2018 1/3
November 2013 (Grant 2) share option plan The options awarded in November 2013 (Grant 2) are partly subject to a performance target based on the earnings before tax for the years ending 31 December 2016 and 31 December 2017, such that the number of shares vesting will be subject to the satisfaction of a pre-determined earnings before tax target in 2016 and 2017.
Once performance conditions are satisfied those options that are eligible to vest will vest on the anniversary of the grant date in the year following achievement of one or more of the target thresholds. Those options not subject to the performance targets are eligible to be exercised in three equal tranches from the third anniversary of the grant date.
December 2013 (Grant 1) share option plan The options awarded in December 2013 (Grant 1) are conditional on the ongoing employment of the related employee for a specified period of time. Once this condition is satisfied those options that are eligible to vest will vest as follows:
Proportion
to vest
December 2016 1/3December 2017 1/3December 2018 1/3
December 2013 (Grant 2) share option plan The options awarded in December 2013 (Grant 2) are subject to a performance target based on the earnings before tax for the years ending 31 December 2018 and 31 December 2021, such that the number of shares vesting will be subject to the satisfaction of a pre-determined earnings before tax target in 2018 and 2021.
Once performance conditions are satisfied those options that are eligible to vest will vest on the anniversary of the grant date in the year following attainment of one or more of the target thresholds. Those options not subject to the performance targets are eligible to be exercised in three equal tranches from the third anniversary of the grant date.

www.regus.com 89
Strategic report
Go
vernanceFinancial statem
ents
Stra
tegi
c re
port
Go
vern
ance
Fina
ncia
l sta
tem
ents
www.regus.com 89
May 2014 share option plan The options awarded in May 2014 are conditional on the ongoing employment of the related employees for a specified period of time. Once this condition is satisfied those options that are eligible to vest will vest as follows:
Proportion to vest
May 2017 1/3May 2018 1/3May 2019 1/3
November 2014 share option plan The options awarded in November 2014 are conditional on the ongoing employment of the related employees and the achievement of margin targets. The dates and percentage of options vesting are dependent on the year in which the margin targets are achieved, the earliest dates on which the options are eligible to vest is as follows:
Proportion to vest
November 2017 1/5November 2018 1/5November 2019 1/5November 2020 1/5November 2021 1/5
May 2015 share option plan The options awarded in May 2015 are conditional on the ongoing employment of the related employees and the achievement of margin targets. The dates and percentage of options vesting are dependent on the year in which the margin targets are achieved, the earliest dates on which the options are eligible to vest is as follows:
Proportion to vest
May 2018 1/5May 2019 1/5May 2020 1/5May 2021 1/5May 2022 1/5
Measurement of fair values The fair value of the rights granted through the employee share purchase plan was measured based on the Monte Carlo simulation or the Black-Scholes formula. The expected volatility is based on the historic volatility adjusted for any abnormal movement in share prices.

90 Regus plc Annual Report and Accounts 2015
Notes to the accounts continued
90 Regus plc Annual Report and Accounts 2015
25. Share-based payments (continued) The inputs to the model are as follows:
May 2015November
2014May
2014
December 2013
(Grant 2)
December2013
(Grant 1)
November 2013
(Grant 2)
Share price on grant date 250.80p 188.40p 191.00p 195.00p 195.00p 191.90pExercise price 250.80p 186.00p 187.20p 195.00p 195.00p 191.90pExpected volatility 27.23% –
30.12%24.67% –
33.53%27.30%–
41.91%32.91% 32.91% 32.69%
Number of simulations – – – – – –Number of companies – – – – – –Option life 3–7 years 3–7 years 3–5 years 5–8 years 3–5 years 3–5 yearsExpected dividend 1.59% 2.02% 2.00% 1.46% 1.46% 1.46%Fair value of option at time of grant 42.35p –
69.12p27.24p –
54.58p 30.80p–
59.63p52.41p –
65.95p 40.56p–
52.41p 45.73pRisk-free interest rate 0.81% –
1.53%0.90% –
1.81% 0.99%–
1.47%1.57%–
2.30p 0.85%–
1.57%1.22%
November 2013
(Grant 1)June 2013
June 2012
September 2011
August 2011
June 2011
Share price on grant date 191.90p 158.00p 88.55p 72.50p 75.90p 110.70pExercise price 191.90p 155.60p 84.95p 74.35p 67.00p 109.50pExpected volatility 32.69% 40.31%–
48.98%47.87%–
52.74%52.59%–
46.08% 52.61%–
46.13%51.55%–
44.99%Number of simulations – 30,000 30,000 30,000 30,000 30,000Number of companies
– – – – –
FTSE All Share Index
Option life 3–5 years 3–5 years 3–5 years 3–5 years 3–5 years 3–5 yearsExpected dividend 1.46% 2.03% 3.27% 3.66% 3.49% 2.35%Fair value of option at time of grant 39.63p–
51.24p39.21p–
58.39p29.88p–
31.12p22.89p–
22.71p 27.32p–
27.01p39.41p–
40.96pRisk-free interest rate 0.85%–
1.57%0.67%–
1.20%0.65%–
1.11%1.16%–
1.75% 1.29%–
1.91%1.81%–
2.57%
April 2011 September 2010 June 2010
EPS TSR EPS TSR EPS TSR
Share price on grant date 70.60p 70.60p 73.20p 73.20p 94.00p 94.00pExercise price 69.10p 69.10p 75.00p 75.00p 100.50p 100.50pExpected volatility
50.28%–
45.61%50.28%–
45.61%46.18%–
54.32%46.99%–
56.36% 47.02%–
64.82%46.74%–
55.98%Number of simulations 30,000 30,000 30,000 30,000 30,000 30,000Number of companies
FTSE All Share Index
FTSE All Share Index
FTSE All Share Index
FTSE All Share Index
FTSE All Share Index
FTSE All Share Index
Option life 3–5 years 3–5 years 3–5 years 3–5 years 3–5 years 3–5 yearsExpected dividend 3.40% 3.40% 3.28% 3.28% 2.55% 2.55%Fair value of option at time of grant
22.80p–
23.60p21.51p–
21.51p35.20p–
42.70p12.40p–
17.40p 45.49p–
61.77p19.50p–
26.30pRisk-free interest rate
1.51%–
2.17%1.51%–
2.17%2.76%–
3.05%2.76%–
3.05% 3.07%–
3.38%3.07%–
3.38%
Plan 2: Regus plc Co-Investment Plan (CIP) and Long-Term Incentive Plan (LTIP) The CIP operates in conjunction with the annual bonus whereby a gross bonus of up to 50% of basic annual salary will be taken as a deferred amount of shares (Investment Shares) to be released at the end of a defined period of not less than three years, with the balance paid in cash. Awards of Matching Shares are linked to the number of Investment Shares awarded and will vest depending on the Company’s future performance. The maximum number of Matching Shares which can be awarded to a participant in any calendar year under the CIP is 200% of salary. As such the maximum number of Matching Shares which can be awarded, based on Investment Shares awarded, is in the ratio of 4:1.
The LTIP provides for the Remuneration Committee to make stand alone long-term incentive awards without reference to the annual bonus up to a maximum of 100% of salary per calendar year.
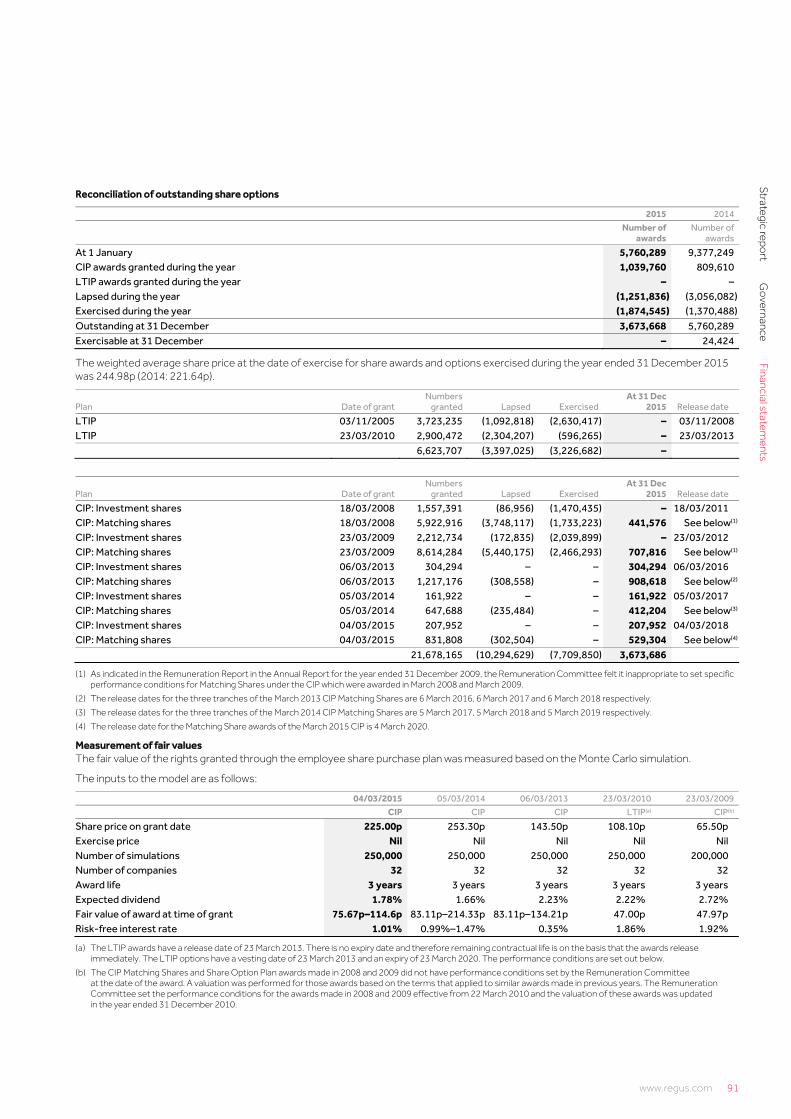
www.regus.com 91
Strategic report
Go
vernanceFinancial statem
ents
Stra
tegi
c re
port
Go
vern
ance
Fina
ncia
l sta
tem
ents
www.regus.com 91
Reconciliation of outstanding share options
2015 2014
Number of
awardsNumber of
awards
At 1 January 5,760,289 9,377,249CIP awards granted during the year 1,039,760 809,610LTIP awards granted during the year – –Lapsed during the year (1,251,836) (3,056,082)Exercised during the year (1,874,545) (1,370,488)Outstanding at 31 December 3,673,668 5,760,289Exercisable at 31 December – 24,424
The weighted average share price at the date of exercise for share awards and options exercised during the year ended 31 December 2015 was 244.98p (2014: 221.64p).
Plan Date of grantNumbers
granted Lapsed Exercised At 31 Dec
2015 Release date
LTIP 03/11/2005 3,723,235 (1,092,818) (2,630,417) – 03/11/2008LTIP 23/03/2010 2,900,472 (2,304,207) (596,265) – 23/03/2013 6,623,707 (3,397,025) (3,226,682) –
Plan Date of grantNumbers
granted Lapsed Exercised At 31 Dec
2015 Release date
CIP: Investment shares 18/03/2008 1,557,391 (86,956) (1,470,435) – 18/03/2011 CIP: Matching shares 18/03/2008 5,922,916 (3,748,117) (1,733,223) 441,576 See below(1)
CIP: Investment shares 23/03/2009 2,212,734 (172,835) (2,039,899) – 23/03/2012 CIP: Matching shares 23/03/2009 8,614,284 (5,440,175) (2,466,293) 707,816 See below(1)
CIP: Investment shares 06/03/2013 304,294 – – 304,294 06/03/2016 CIP: Matching shares 06/03/2013 1,217,176 (308,558) – 908,618 See below(2)
CIP: Investment shares 05/03/2014 161,922 – – 161,922 05/03/2017 CIP: Matching shares 05/03/2014 647,688 (235,484) – 412,204 See below(3)
CIP: Investment shares 04/03/2015 207,952 – – 207,952 04/03/2018 CIP: Matching shares 04/03/2015 831,808 (302,504) – 529,304 See below(4)
21,678,165 (10,294,629) (7,709,850) 3,673,686
(1) As indicated in the Remuneration Report in the Annual Report for the year ended 31 December 2009, the Remuneration Committee felt it inappropriate to set specific performance conditions for Matching Shares under the CIP which were awarded in March 2008 and March 2009.
(2) The release dates for the three tranches of the March 2013 CIP Matching Shares are 6 March 2016, 6 March 2017 and 6 March 2018 respectively.
(3) The release dates for the three tranches of the March 2014 CIP Matching Shares are 5 March 2017, 5 March 2018 and 5 March 2019 respectively.
(4) The release date for the Matching Share awards of the March 2015 CIP is 4 March 2020.
Measurement of fair values The fair value of the rights granted through the employee share purchase plan was measured based on the Monte Carlo simulation.
The inputs to the model are as follows:
04/03/2015 05/03/2014 06/03/2013 23/03/2010 23/03/2009
CIP CIP CIP LTIP(a) CIP(b)
Share price on grant date 225.00p 253.30p 143.50p 108.10p 65.50p Exercise price Nil Nil Nil Nil Nil Number of simulations 250,000 250,000 250,000 250,000 200,000 Number of companies 32 32 32 32 32 Award life 3 years 3 years 3 years 3 years 3 years Expected dividend 1.78% 1.66% 2.23% 2.22% 2.72% Fair value of award at time of grant 75.67p–114.6p 83.11p–214.33p 83.11p–134.21p 47.00p 47.97p Risk-free interest rate 1.01% 0.99%–1.47% 0.35% 1.86% 1.92%
(a) The LTIP awards have a release date of 23 March 2013. There is no expiry date and therefore remaining contractual life is on the basis that the awards release immediately. The LTIP options have a vesting date of 23 March 2013 and an expiry of 23 March 2020. The performance conditions are set out below.
(b) The CIP Matching Shares and Share Option Plan awards made in 2008 and 2009 did not have performance conditions set by the Remuneration Committee at the date of the award. A valuation was performed for those awards based on the terms that applied to similar awards made in previous years. The Remuneration Committee set the performance conditions for the awards made in 2008 and 2009 effective from 22 March 2010 and the valuation of these awards was updated in the year ended 31 December 2010.

92 Regus plc Annual Report and Accounts 2015
Notes to the accounts continued
92 Regus plc Annual Report and Accounts 2015
25. Share-based payment (continued) It is recognised by the Remuneration Committee that the additional EPS targets represent a highly challenging goal and consequently in determining whether they have been met the Committee will exercise its discretion. The overall aim is that the relevant EPS targets must have been met on a run-rate or underlying basis. As such an adjusted measure of EPS will be calculated to assess the underlying performance of the business.
While the Remuneration Committee reserves the right to adjust EPS as it sees fit at the time, by way of example, the following adjustments may be considered for the 2008 and 2009 grants:
• In a fast-growing company such as Regus, costs are necessarily incurred in one year to drive profits in future years. Thus it is important to ensure management is not incentivised to cut back on these investments to meet EPS targets in any one year. Accordingly, those costs, incurred in the vesting year, which it considers necessary to drive future growth, will be excluded from the EPS calculation. These would include, inter alia, the costs of the business development departments, excess marketing expenditures and current year losses from investing in new locations.
• Any one-off or non-recurring costs will be excluded.
• It is expected that in the relevant periods the cash tax rate will rise as cumulative tax losses are utilised, thereby increasing progressively the challenge of achieving a 14p EPS target. This will then be further complicated by the need to recognise deferred tax assets as the business strengthens, reducing the accounting rate of tax in one year and increasing it in the next. To provide greater clarity and incentive to management EPS will be calculated based upon the cash tax rate up to a maximum of 30%.
• The Remuneration Committee is of the opinion that the EPS and performance targets are a transparent and accurate measure of the Company’s performance at this time and are the key corporate metrics for driving long-term shareholder value. In addition, the TSR condition will ensure that executives are encouraged to focus on ensuring that the Company’s return to shareholders is competitive compared to comparable companies.
The performance conditions are as follows: 2008 and 2009 CIP Investment and matching grants The Remuneration Committee agreed to the following modifications to the awards made in 2008 and 2009 and that the following performance conditions would apply to these awards effective from 22 March 2010.
The total number of matching awards made in 2008 and 2009 to each participant was divided into three separate equal amounts and was subject to future performance periods of three, four and five years respectively. Thus, conditional on meeting the performance targets, the first amount vested in March 2013, the second vested in March 2014 and the third vested in March 2015. These vesting dates relate to the financial years ending 31 December 2012, 31 December 2013 and 31 December 2014 respectively. The vesting of these awards was subject to the achievement of challenging corporate performance targets. 75% of each of the three amounts was subject to defined earnings per share (EPS) targets over the respective performance periods. The remaining 25% of each were subject to relative total shareholder return (TSR) targets over the respective periods. The targets were as follows:
EPS targets for the financial years ending
% of awards eligible for vesting 2012 2013 2014
25% 15p 17p 18p50% 16p 20p 22p75% 17p 23p 26p100% 18p 26p 30p
% of awards eligible for vesting Regus TSR % achieved relative to
FTSE All Share Total Return index(a)
Nil Equal to or below the index 25% Above 100% but below 101% Increments of 0.75% For each complete 1% above 100% 100% 200% or above
(a) Over the three-, four- or five-year performance period.

www.regus.com 93
Strategic report
Go
vernanceFinancial statem
ents
Stra
tegi
c re
port
Go
vern
ance
Fina
ncia
l sta
tem
ents
www.regus.com 93
2013 CIP Investment and matching grants The total number of matching awards made in 2013 to each participant was divided into three separate equal amounts and is subject to future performance periods of three, four and five years respectively. Thus, conditional on meeting the performance targets, the first amount will vest in March 2016, the second will vest in March 2017 and the third will vest in March 2018. These vesting dates relate to the financial years ending 31 December 2015, 31 December 2016 and 31 December 2017 respectively. The vesting of these awards is subject to the achievement of challenging corporate performance targets. 75% of each of the three amounts is subject to defined earnings per share (EPS) targets over the respective performance periods. The remaining 25% of each will be subject to relative total shareholder return (TSR) targets over the respective periods. The targets are as follows:
EPS targets for the financial years ending
% of awards eligible for vesting 2015 2016 2017
25% 12.0p 14.0p 16.0p50% 12.6p 14.6p 16.6p75% 13.3p 15.3p 17.3p100% 14.0p 16.0p 18.0p
No shares will vest in each respective year unless the minimum EPS target for that year is achieved.
% of awards eligible for vesting Regus TSR % achieved relative to FTSE All Share Total Return index(a)
Below index 0% Equal to index 25% Equal to index + 15% p.a. 100%
(a) Over the three-, four- or five-year performance period.
2014 CIP Investment and matching grants The total number of matching awards made in 2014 to each participant was divided into three separate equal amounts and is subject to future performance periods of three, four and five years respectively. Thus, conditional on meeting the performance targets, the first amount will vest in March 2017, the second will vest in March 2018 and the third will vest in March 2019. These vesting dates relate to the financial years ending 31 December 2016, 31 December 2017 and 31 December 2018 respectively. The vesting of these awards is subject to the achievement of challenging corporate performance targets. 75% of each of the three amounts is subject to defined earnings per share (EPS) targets over the respective performance periods. The remaining 25% of each will be subject to relative total shareholder return (TSR) targets over the respective periods. The targets are as follows:
EPS targets for the financial years ending
% of awards eligible for vesting 2016 2017 2018
25% 14.3p 16.1p 17.1p50% 15.2p 17.4p 18.9p75% 16.1p 18.8p 20.7p100% 17.0p 20.2p 22.5p
No shares will vest in each respective year unless the minimum EPS target for that year is achieved.
% of awards eligible for vesting Regus TSR % achieved relative to FTSE All Share Total Return index(a)
Below index 0% Median 25% Upper quartile or above 100%
(a) Over the three-, four- or five-year performance period.
2015 CIP Investment and matching grants The total number of matching awards made in 2015 to each participant is subject to a future performance period of three years. Conditional on meeting the performance targets, the matching shares will vest in March 2020. The vesting date relates to the earning per share (EPS) performance in the last finance year of the performance period, being 31 December 2017. The vesting of these awards is subject to the achievement of challenging corporate performance targets. 75% is subject to defined EPS targets over the performance period. The remaining 25% will be subject to relative total shareholder return (TSR) targets over the period. The targets are as follows:
% of awards eligible for vesting Compound annual growth in EPS over the
performance period
25% 24%100% 32%

94 Regus plc Annual Report and Accounts 2015
Notes to the accounts continued
94 Regus plc Annual Report and Accounts 2015
25. Share-based payments (continued) The target is based on compound annual growth from an equivalent “base year” EPS figure for 2014 of 7.4p.
% of awards eligible for vesting
Regus TSR % achieved relative to FTSE 350 Index (excluding financial services and
mining companies)
Below index 0%Median 25%Upper quartile or above 100%
Plan 3: One-Off Award In November 2015, an award of 328,751 ordinary shares of 1p each in the Company was granted to the Company’s Chief Financial Officer and Chief Operating Officer, Dominik de Daniel. The award was structured as a conditional award and was granted under a one-off award arrangement established under Listing Rule 9.4.2(2).
In the normal course of events the award will vest over five years, if and to the extent to which performance conditions are achieved. The applicable performance target is set out below:
Performance metric Target Vesting at target
Compound annual growth in EPS over the performance period 5% 100%
Reconciliation of outstanding share options
2015 2014
Number of
awards Number of
awards
At 1 January – –One-off award granted during the year 328,751 –Lapsed during the year – –Exercised during the year – –Outstanding at 31 December 328,751 –Exercisable at 31 December – –
26. Retirement benefit obligations The Group accounts for the Swiss and Philippines pension plans as defined benefit plans under IAS 19 (2011) – Employee Benefits.
The reconciliation of the net defined benefit asset/(liability) and its components is as follows:
2015
£m 2014
£m
Fair value of plan assets 3.9 3.2Present value of obligations (4.7) (3.4)Net funded obligations (0.8) (0.2)
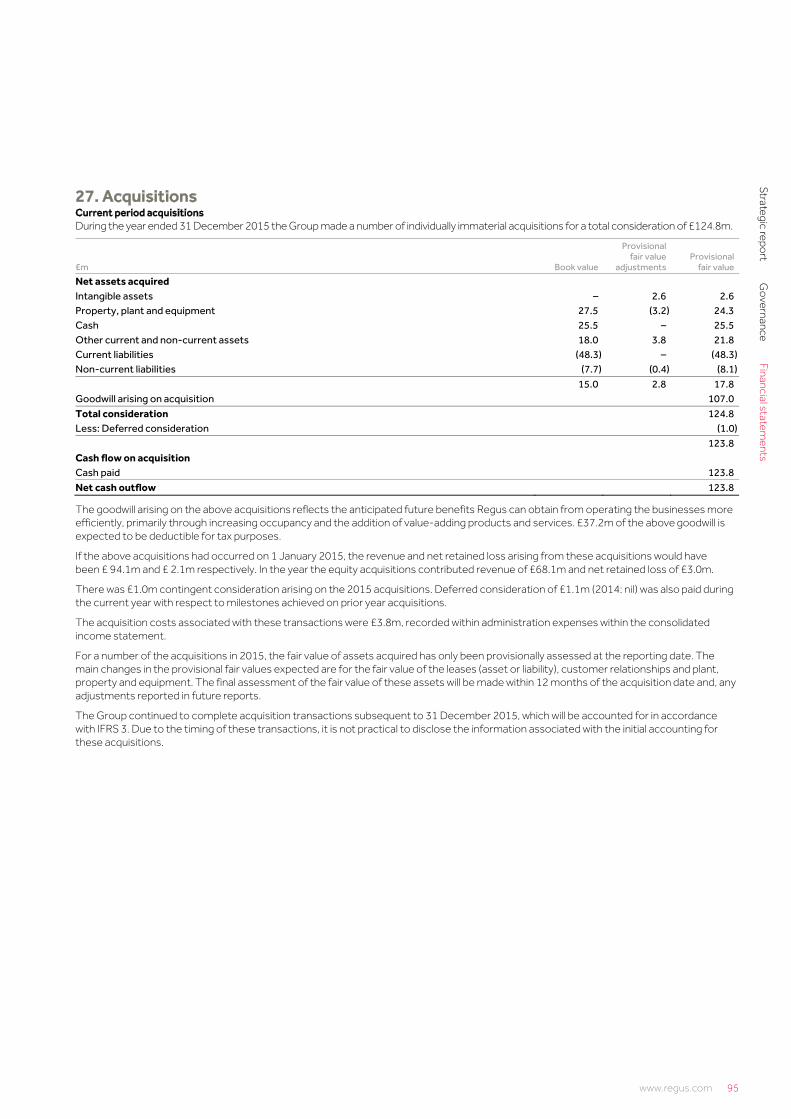
www.regus.com 95
Strategic report
Go
vernanceFinancial statem
ents
Stra
tegi
c re
port
Go
vern
ance
Fina
ncia
l sta
tem
ents
www.regus.com 95
27. Acquisitions Current period acquisitions During the year ended 31 December 2015 the Group made a number of individually immaterial acquisitions for a total consideration of £124.8m.
£m Book value
Provisional fair value
adjustmentsProvisional
fair value
Net assets acquired Intangible assets – 2.6 2.6Property, plant and equipment 27.5 (3.2) 24.3Cash 25.5 – 25.5Other current and non-current assets 18.0 3.8 21.8Current liabilities (48.3) – (48.3)Non-current liabilities (7.7) (0.4) (8.1) 15.0 2.8 17.8Goodwill arising on acquisition 107.0Total consideration 124.8Less: Deferred consideration (1.0) 123.8Cash flow on acquisition Cash paid 123.8Net cash outflow 123.8
The goodwill arising on the above acquisitions reflects the anticipated future benefits Regus can obtain from operating the businesses more efficiently, primarily through increasing occupancy and the addition of value-adding products and services. £37.2m of the above goodwill is expected to be deductible for tax purposes.
If the above acquisitions had occurred on 1 January 2015, the revenue and net retained loss arising from these acquisitions would have been £ 94.1m and £ 2.1m respectively. In the year the equity acquisitions contributed revenue of £68.1m and net retained loss of £3.0m.
There was £1.0m contingent consideration arising on the 2015 acquisitions. Deferred consideration of £1.1m (2014: nil) was also paid during the current year with respect to milestones achieved on prior year acquisitions.
The acquisition costs associated with these transactions were £3.8m, recorded within administration expenses within the consolidated income statement.
For a number of the acquisitions in 2015, the fair value of assets acquired has only been provisionally assessed at the reporting date. The main changes in the provisional fair values expected are for the fair value of the leases (asset or liability), customer relationships and plant, property and equipment. The final assessment of the fair value of these assets will be made within 12 months of the acquisition date and, any adjustments reported in future reports.
The Group continued to complete acquisition transactions subsequent to 31 December 2015, which will be accounted for in accordance with IFRS 3. Due to the timing of these transactions, it is not practical to disclose the information associated with the initial accounting for these acquisitions.

96 Regus plc Annual Report and Accounts 2015
Notes to the accounts continued
96 Regus plc Annual Report and Accounts 2015
27. Acquisitions continued Prior period acquisitions During the year ended 31 December 2014 the Group made a number of individually immaterial acquisitions for a total consideration of £104.2m.
£m Book value
Provisional fair value
adjustmentsProvisional
fair value
Final fair value
adjustments Final
fair value
Net assets acquired Intangible assets 0.1 1.1 1.2 1.5 2.7Property, plant and equipment 61.2 (2.3) 58.9 (0.9) 58.0Cash 9.8 – 9.8 – 9.8Other current and non-current assets 9.4 – 9.4 0.5 9.9Current liabilities (21.5) – (21.5) (0.2) (21.7)Non-current liabilities (7.1) (1.5) (8.6) (0.6) (9.2) 51.9 (2.7) 49.2 0.3 49.5Goodwill arising on acquisition 55.0 58.6Total consideration 104.2 108.1Less: Fair value adjustment of historical investment in acquired joint venture (2.7) (2.7)Less: Deferred consideration (1.7) (5.6)
99.8 99.8Cash flow on acquisition Cash paid 99.8 99.8Net cash outflow 99.8 99.8
The goodwill arising on the above acquisitions reflects the anticipated future benefits Regus can obtain from operating the businesses more efficiently, primarily through increasing occupancy and the addition of value-adding products and services. £13.3m of the above goodwill is expected to be deductible for tax purposes.
If the above acquisitions had occurred on 1 January 2014, the revenue and net retained profit arising from these acquisitions would have been £18.7m and £2.4m respectively. In the year the equity acquisitions contributed revenue of £16.0m and net retained loss of £1.2m.
There was £5.6m contingent consideration arising on the above acquisitions.
The acquisition costs associated with these transactions were £1.3m, recorded within administration expenses within the consolidated income statement.
28. Capital commitments
2015
£m 2014
£m
Contracts placed for future capital expenditure not provided for in the financial statements 46.7 26.3
These commitments are principally in respect of fit out obligations on new centres opening in 2016. In addition, our share of the capital commitments of joint ventures amounted to £2.0m at 31 December 2015 (2014: £nil).
29. Non-cancellable operating lease commitments At 31 December 2015 the Group was committed to making the following payments in respect of operating leases:
2015 2014
Property
£m
Motor vehicles, plant
and equipment £m
Total £m
Property £m
Motor vehicles, plant and
equipment £m
Total £m
Lease obligations falling due: Within one year 715.7 1.3 717.0 594.1 0.7 594.8Between two and five years 2,029.0 2.0 2031.0 1,659.9 1.1 1,661.0After five years 922.7 – 922.7 684.0 – 684.0 3,667.4 3.3 3,670.7 2,938.0 1.8 2,939.8
Non-cancelable operating lease commitments exclude future contingent rental amounts such as the variable amounts payable under performance-based leases, where the rents vary in line with a centre’s performance.
The Group’s non-cancellable operating lease commitments do not generally include purchase options nor do they impose restrictions on the Group regarding dividends, debt or further leasing.

www.regus.com 97
Strategic report
Go
vernanceFinancial statem
ents
Stra
tegi
c re
port
Go
vern
ance
Fina
ncia
l sta
tem
ents
www.regus.com 97
30. Contingent assets and liabilities The Group has bank guarantees and letters of credit held with certain banks, substantially in support of leasehold contracts with a variety of landlords, amounting to £122.8m (2014: £115.2m). There are no material lawsuits pending against the Group.
31. Related parties Parent and subsidiary entities The consolidated financial statements include the results of the Group and the subsidiaries listed in note 32.
Joint ventures The following table provides the total amount of transactions that have been entered into with related parties for the relevant financial year.
£m
Management fees received
from related parties
Amounts owed by
related party
Amounts owed to
related party
2015 Joint ventures 2.2 7.2 7.62014 Joint ventures 2.2 3.5 4.6
As at 31 December 2015, £nil of the amounts due to the Group has been provided for (2014: £nil). All outstanding balances with these related parties are priced on an arm’s length basis. None of the balances is secured.
Key management personnel No loans or credit transactions were outstanding with Directors or officers of the Company at the end of the year or arose during the year, that are required to be disclosed.
Compensation of key management personnel (including Directors): Key management personnel include those personnel (including Directors) that have responsibility and authority for planning, directing and controlling the activities of the Group:
2015
£m2014
£m
Short-term employee benefits 11.3 9.7Retirement benefit obligations 0.4 0.4Share-based payments 3.2 2.2 14.9 12.3
Share-based payments included in the table above reflect the accounting charge in the year. The full fair value of awards granted in the year was £3.5m (2014: £2.7m). These awards are subject to performance conditions and vest over three, four and five years from the award date.
Transactions with related parties During the year ended 31 December 2015 the Group acquired goods and services from a company indirectly controlled by a Director of the Company amounting to £15,466 (2014: £44,039). There was a £15,466 balance outstanding at the year-end (2014: 2,723).
All outstanding balances with these related parties are priced on an arm’s length basis and are to be settled in cash. None of the balances is secured.

98 Regus plc Annual Report and Accounts 2015
Notes to the accounts continued
98 Regus plc Annual Report and Accounts 2015
32. Principal Group companies The Group’s principal subsidiary undertakings at 31 December 2015, their principal activities and countries of incorporation are set out below:
Name of undertaking Country of incorporation
% of ordinary
share and votes
held Name of undertaking Country of incorporation
% of ordinary
share and votes
held
Principal activity – Trading companies Principal activity – Management companies (continued)
Regus do Brasil Ltda Brazil 100 Regus Management (UK) Ltd United Kingdom 100Regus Paris SAS France 100 Regus Management Group LLC United States 100Regus GmbH & Co. KG Germany 100 Principal activity – Holding companies Excellent Business Centres GmbH Germany 100 RGN Limited Partner Holdings Corp Canada 100Regus Business Centres Italia Srl Italy 100 Regus Holdings SAS France 100Regus Japan KK Japan 100 Regus GmbH & Co. KG Germany 100Regus Management de Mexico,SA de CV Mexico 100 Regus Business Services (HK) Limited Hong Kong 100Regus Amsterdam BV Netherlands 100 Umbrella Holdings Sarl Luxembourg 100Regus Business Centre LLC Russia 100 Regus Group Limited United Kingdom 100Regus Management Singapore Pte Ltd Singapore 100 Marley Acquisitions Limited United Kingdom 100Regus Management Group (Pty) Ltd South Africa 100 Business Exchange Holdings Limited United Kingdom 100Regus Management España SL Spain 100 Regus Estates UK Limited United Kingdom 100Regus Business Centre SA Switzerland 100 Regus Centres UK Limited United Kingdom 100ABC Business Centres Limited United Kingdom 100 Regus Corporation LLC United States 100Acorn Offices Limited United Kingdom 100 Regus H Holdings LLC United States 100Avanta Managed Offices Ltd United Kingdom 100 MWB Business Exchange Centres Ltd United Kingdom 100 Stonemartin Corporate Centre Limited United Kingdom 100 HQ Global Workplaces LLC United States 100 RGN National Business Centre LLC United States 100 Office Suites Plus Properties LLC United States 100 Regus Business Centres LLC United States 100 Principal activity – Management companies
Regus Australia Management Pty Australia 100 Regus Business Centres SAS France 100 RBW Global Sarl Luxembourg 100 Pathway Finance Sarl Luxembourg 100 Pathway IP Sarl Luxembourg 100 Regus Service Centre Philippines BV Philippines 100 Regus Global Management Centre SA Switzerland 100 Regus Group Services Ltd United Kingdom 100
33. Key judgemental areas adopted in preparing these accounts The preparation of consolidated financial statements in accordance with IFRS requires management to make certain judgements and assumptions that affect reported amounts and related disclosures.
Fair value accounting for business combinations For each business combination, we assess the fair values of assets and liabilities acquired. Where there is not an active market in the category of the non-current assets typically acquired with a business centre or where the books and records of the acquired company do not provide sufficient information to derive an accurate valuation, management calculates an estimated fair value based on available information and experience.
The main categories of acquired non-current assets where management’s judgement has an impact on the amounts recorded include tangible fixed assets, customer list intangibles and the fair market value of leasehold assets and liabilities. For significant business combinations management also obtains third-party valuations to provide additional guidance as to the appropriate valuation to be included in the financial statements.

www.regus.com 99
Strategic report
Go
vernanceFinancial statem
ents
Stra
tegi
c re
port
Go
vern
ance
Fina
ncia
l sta
tem
ents
www.regus.com 99
Valuation of intangibles and goodwill We evaluate the fair value of goodwill and other intangible assets to assess potential impairments on an annual basis, or during the year if an event or other circumstance indicates that we may not be able to recover the carrying amount of the asset. We evaluate the carrying value of goodwill based on our CGUs aggregated at a country level and make that determination based upon future cash flow projections which assume certain growth projections which may or may not occur. We record an impairment loss for goodwill when the carrying value of the asset is less than its estimated recoverable amount. Further details of the methodology and assumptions applied to the impairment review in the year ended 31 December 2015, including the sensitivity to changes in those assumptions can be found in note 12.
Impairment of property plant and equipment We evaluate the potential impairment of property, plant and equipment at a centre (CGU) level where there are indicators of impairment at the balance sheet date. In the assessment of value-in-use, key judgemental areas in determining future cash flow projections include: an assessment of the location of the centre; the local economic situation; competition; local environmental factors; the management of the centre; and future changes in occupancy, revenue and costs of the centre.
Tax assets and liabilities We base our estimate of deferred tax assets and liabilities on current tax laws and rates and, in certain cases, business plans and other expectations about future outcomes. Changes in existing laws and rates, and their related interpretations, and future business results may affect the amount of deferred tax liabilities or the valuation of deferred tax assets over time. Our accounting for deferred tax consequences represents management’s best estimate of future events that can be appropriately reflected in the accounting estimates. It is current Group policy to recognise a deferred tax asset when it is probable that future taxable profits will be available against which the assets can be used. The Group considers it probable if the entity has made a taxable profit in the previous year and is forecast to continue to make a profit in the foreseeable future. Where appropriate, the Group assesses the potential risk of future tax liabilities arising from the operation of its business in multiple tax jurisdictions and includes provisions within tax liabilities for those risks that can be estimated reliably. Changes in existing tax laws can affect large international groups similar to Regus and could result in significant additional tax liabilities over and above those already provided for.
Onerous lease provisions We have identified certain poor performing centres where the lease is considered onerous, i.e. the Group does not expect to recover the unavoidable lease costs up to the first break point. The accounts include a provision for our estimate of the net amounts payable under the terms of the lease to the first break point, discounted at the Group weighted average cost of capital, where appropriate.
Dilapidations Certain of our leases with landlords include a clause obliging the Group to hand the property back in the condition as at the date of signing the lease. The costs to bring the property back to that condition are not known until the Group exits the property so the Group estimates the costs at each balance sheet date. However, given that landlords often regard the nature of changes made to properties as improvements, the Group estimates that it is unlikely that any material dilapidation payments will be necessary. Consequently, provision has been made only for those potential dilapidation payments when it is probable that an outflow will occur and can be reliably estimated.

100 Regus plc Annual Report and Accounts 2015
Parent company accounts
100 Regus plc Annual Report and Accounts 2015
Summarised extract of Company balance sheet (prepared under Luxembourg GAAP)
As at 31 Dec 2015
(Luxembourg GAAP)
£m
As at 31 Dec 2014
(Luxembourg GAAP)
£m
Assets C. Fixed assets III. Financial assets
1. Shares in affiliated undertakings 644.6 683.42. Loans to affiliated undertakings – –4. Loans to undertakings with which the Company is linked by virtue of participating interests – –
D. Current assets II. Debtors
2. Amount owed by affiliated undertakings – 0.9a) becoming due and payable within one year
4. Other receivables 0.3 –a) becoming due and payable within one year
III. Transferable securities 2. Own shares 42.9 19.9
(20,490,613 shares of £0.01 per share (2014: 12,883,455 shares)) IV. Cash at bank and in hand – –E. Prepayments 0.1 0.6Total assets 687.9 704.8Liabilities A. Capital and reserves I. Subscribed capital 9.5 9.5II. Share premium and similar premiums 53.7 53.7IV. Reserves
1. Legal reserve 0.9 0.92. Reserve for own shares 42.9 19.94. Other reserves 477.1 500.1
V. Results brought forward 57.9 105.0VI. Results for the financial year (17.3) (9.5)VII. Interim dividends (13.0) (11.8) 611.7 667.8C. Provisions
2. Provisions for taxation 0.1 0.13. Other provisions – –
D. Non-subordinated debts 4. Trade creditors 0.7 0.5
a) becoming due and payable within one year 6. Amounts owed to affiliated undertakings
a) becoming due and payable within one year 1.6 0.4b) becoming due and payable after more than one year 73.8 36.0
76.1 36.9Total liabilities 687.9 704.8
Approved by the Board on 1 March 2016
Mark Dixon Dominik de Daniel Chief Executive Officer Chief Financial Officer

www.regus.com 101
Strategic report
Go
vernanceFinancial statem
ents
Stra
tegi
c re
port
Go
vern
ance
Fina
ncia
l sta
tem
ents
www.regus.com 101
Accounting policies Basis of preparation The annual accounts have been prepared in accordance with Luxembourg legal and regulatory requirements under the historical cost convention, which differs in material respects from IFRS in both the measurement and presentation of certain transactions.
The Company is included in the consolidated financial statements of Regus plc.
The balance sheet has been extracted from the full accounts of Regus plc for the period ended 31 December 2015, which are available from the Company’s registered office, 26 Boulevard Royal, Luxembourg and which will be filed with both the Luxembourg Register of Commerce and the Jersey Register of Companies.
Financial assets Shares in affiliated undertakings are valued at purchase price including acquisition costs. Where any permanent diminution in value is identified, value adjustments are recorded in the profit and loss account. These value adjustments are not continued if the reasons which caused their initial recording cease to apply.

102 Regus plc Annual Report and Accounts 2015
Segmental analysis
102 Regus plc Annual Report and Accounts 2015
Segmental analysis – management basis (unaudited)
Americas
2015EMEA
2015Asia Pacific
2015
United Kingdom
2015 Other
2015 Total2015
Mature(1) Workstations(4) 125,841 54,548 52,352 51,524 – 284,265 Occupancy (%) 83.0% 79.4% 85.4% 81.1% – 82.4% Revenue (£m) 712.1 321.2 239.1 352.9 2.9 1,628.2 Contribution (£m) 189.0 89.6 68.7 86.8 (0.2) 433.9 REVPOW 6,817 7,417 5,351 8,441 6,950 2014 Expansions(2) Workstations(4) 12,677 15,774 16,753 4,302 – 49,506 Occupancy (%) 59.8% 65.1% 61.2% 74.2% – 63.2% Revenue (£m) 43.6 56.6 36.2 32.8 – 169.2 Contribution (£m) (5.7) 5.1 (0.9) 8.6 – 7.1 2015 Expansions(2) Workstations(4) 10,635 7,224 9,178 7,880 – 34,917 Occupancy (%) 48.3% 51.6% 32.8% 82.8% – 34.7% Revenue (£m) 22.6 26.7 13.0 56.4 – 118.7 Contribution (£m)(5) (10.7) (4.0) (8.8) 10.0 – (13.5) Closures Workstations(4) 261 355 288 2,015 – 2,919 Occupancy (%) 72.4% 71.5% 74.3% 74.7% – 74.1% Revenue (£m) 0.9 2.1 0.8 7.1 – 10.9 Contribution (£m) (1.6) (0.2) (0.8) 2.3 – (0.3) Total Workstations(4) 149,414 77,901 78,571 65,721 – 371,607 Occupancy (%) 78.5% 73.9% 74.0% 80.7% – 77.0% Revenue (£m) 779.2 406.6 289.1 449.2 2.9 1,927.0 Contribution (£m) 171.0 90.5 58.2 107.7 (0.2) 427.2 Unallocated contribution (£m) – – – – – 1.2 REVPAW (£) 5,215 5,219 3,679 6,835 – 5,186 Period end workstations(6) Mature 126,073 56,316 53,027 52,893 – 288,309 2014 Expansions 12,614 11,952 16,829 4,985 – 46,380 2015 Expansions 26,777 14,223 22,031 13,078 – 76,109 Total 165,464 82,491 91,887 70,956 – 410,798

www.regus.com 103
Strategic report
Go
vernanceFinancial statem
ents
Stra
tegi
c re
port
Go
vern
ance
Fina
ncia
l sta
tem
ents
www.regus.com 103
Segmental analysis – management basis (unaudited)
Americas
2014EMEA
2014Asia Pacific
2014
United Kingdom
2014 Other
2014Total2014
Mature(1) Workstations(4) 125,540 53,301 51,923 50,082 – 280,846 Occupancy (%) 79.1% 77.6% 78.9% 83.7% – 79.6% Revenue (£m) 660.1 341.0 230.6 340.2 0.6 1,572.5 Contribution (£m) 157.3 83.2 64.9 81.0 1.1 387.5 REVPOW 6,647 8,244 5,629 8,116 – 7,034 2014 Expansions(2) Workstations(4) 4,977 6,510 6,170 3,284 – 20,941 Occupancy (%) 42.7% 49.0% 34.9% 72.3% – 47.0% Revenue (£m) 12.7 20.0 8.3 21.0 – 62.0 Contribution (£m)(6) (7.5) (3.8) (5.0) 10.5 – (5.8) Closures(3) Workstations(4) 1,148 1,463 818 6,671 – 10,100 Occupancy (%) 70.5% 69.4% 73.4% 76.9% – 74.8% Revenue (£m) 5.1 8.5 3.1 24.9 – 41.6 Contribution (£m) (0.5) (0.4) 0.7 2.5 – 2.3 Total Workstations(4) 131,665 61,274 58,911 60,037 – 311,887 Occupancy (%) 77.7% 74.4% 74.2% 82.3% – 77.3% Revenue (£m) 677.9 369.5 242.0 386.1 0.6 1,676.1 Contribution (£m) 149.3 79.0 60.6 94.0 1.1 384.0 Unallocated contribution (£m) – – – – – (0.9) REVPAW (£) 5,149 6,030 4,108 6,431 – 5,374
Notes:
(1) The mature business comprises centres not opened in the current or previous financial year.
(2) Expansions include new centres opened and acquired businesses.
(3) A closure for the 2014 comparative data is defined as a centre closed during the period from 1 January 2014 to 31 December 2015.
(4) Workstation numbers are calculated as the weighted average for the year.
(5) 2015 expansions includes any costs incurred in 2015 for centres which will open in 2016.
(6) Workstations available at period end.

104 Regus plc Annual Report and Accounts 2015
Post-tax cash return on net investment
104 Regus plc Annual Report and Accounts 2015
The purpose of this page is to reconcile some of the key numbers used in the returns calculation back to the Group’s audited statutory accounts, and thereby, give the reader greater insight into the returns calculation drivers. The methodology and rationale for the calculation are discussed in the Chief Financial Officer’s review on page 18 of these accounts.
Description Reference 2012
Aggregation2013
Expansions2014
Expansions2015
Expansions 2016
Expansions Closures Total
Revenue Income statement, p56 1,301.3 326.9 169.2 118. – 10.9 1,927.0Centre Contribution Income statement, p56 367.8 67.3 7.1 (12.6) (0.9) (0.3) 428.4(Profit)/loss on disposal of assets EBIT reconciliation
(analysed below) – 0.1 – – – (0.4) (0.3)Underlying centre contribution 367.8 67.4 7.1 (12.6) (0.9) (0.7) 428.1Selling, general and administration expenses(1) Income statement, p56 (163.9) (49.0) (41.2) (27.8) (0.2) (1.8) (283.9)EBIT EBIT reconciliation
(analysed below) 203.9 18.4 (34.1) (40.4) (1.1) (2.5) 144.2Depreciation and amortisation Note 5, p69 79.5 31.6 20.3 11.8 – 2.0 145.2Amortisation of partner contributions Note 5, p69 (20.4) (6.5) (5.6) (2.9) – (0.2) (35.6)Amortisation of acquired lease fair value adjustments
Note 5, p69 (2.6) (2.2) (0.3) 0.5 – – (4.6)
Non-cash items 56.5 22.9 14.4 9.4 – 1.8 105.0Taxation (2) (40.7) (3.7) 6.8 8.0 0.2 0.5 (28.9)Adjusted net cash profit 219.7 37.6 (12.9) (23.0) (0.9) (0.2) 220.3Maintenance capital expenditure Capital expenditure
(analysed below) 61.1 13.8 – – – – 74.9Partner contributions Partner contributions
(analysed below) (23.6) (3.7) – – – – (27.3)Net maintenance capital expenditure 37.5 10.1 – – – – 47.6Post-tax cash return 182.2 27.5 (12.9) (23.0) (0.9) (0.2) 172.7 Growth capital expenditure Capital expenditure
(analysed below) 965.0 307.5 208.4 305.2 9.5 – 1,795.6
Partner contributions(3) Partner contributions (analysed below) (116.7) (62.0) (47.4) (57.3) – – (283.4)
Net investment 848.3 245.5 161.0 247.9 9.5 – 1,512.2 Post-tax cash return on net investment 21.5% 11.2% (8.0%) (9.3%) – – 11.4%
(1) Including research and development expenses (2) Based on EBIT at the Group’s long term effective tax rate of 20%
(3) The 2014 expansions includes £3.4m of partner contributions arising in 2015
2015 EBIT reconciliation Reference £m
EBIT 144.2 Profit on disposal of assets
Note 5, p69 0.3
Share of profit on joint ventures
Income statement,
p56 0.3 Operating profit Income
statement, p56 144.8
2015 Partner contributions Reference £m
Opening partner contributions 189.9• Current Note 17, p78 35.2• Non-current Note 17, p78 154.7Acquired in the period –Received in the period 87.1• 2013 expansions and
before 27.3• 2014 expansions(3) 3.4• 2015 expansions 56.4Utilised in the period Note 5, p69 (35.6)Exchange differences 6.4Closing partner contributions 247.8
• Current Note 17, p78 48.3• Non-current Note 17, p78 199.5
2015 Capital expenditure Reference £m
Maintenance capital expenditure
CFO review, p20 74.9
Growth capital expenditure
CFO review, p20 344.7
Total capital expenditure 419.6Analysed as
• Purchase of subsidiary undertakings
Cash flow, p60 99.4
• Purchase of property, plant and equipment
Cash flow, p60 Note 14, p77 311.5
• Purchase of intangible assets
Cash flow, p60 Note 13, p76 8.7
2015
Movement in capital expenditure 2012
Aggregation2013
Expansions2014
Expansions2015
Expansions 2016
Expansions Closures Total
2014 Growth capital expenditure 970.8 313.0 240.7 4.3 – – 1,528.82015 Capital expenditure(4) 9.8 0.3 26.7 298.4 9.5 – 344.7Property disposals – – (58.5) – – – (58.5)Reclassification of centres(5) (2.5) – – 2.5 – – –Centre closures(6) (13.1) (5.8) (0.5) – – – (19.4)2015 Growth capital expenditure 965.0 307.5 208.4 305.2 9.5 – 1,795.6
(4) 2016 expansions relate to costs and investments incurred in 2015 for centres which will open in 2016
(5) The 2012 aggregation represents the reclassification of centres which have been refurbished, expanded or relocated and therefore taken on the profile of a new centre.
(6) The growth capital expenditure for an estate is reduced by the investment in centres closed during the year, but only where that investment has been fully recovered.
7

www.regus.com 105
Strategic report
Go
vernanceFinancial statem
ents
Stra
tegi
c re
port
Go
vern
ance
Fina
ncia
l sta
tem
ents
Five-year summary
Regus plc Annual Report and Accounts 2015 105
Full year ended 31 Dec 2015
£m
Full year ended 31 Dec 2014
£m
Full year ended 31 Dec 2013
£m
Full year ended 31 Dec 2012
£m
Full year ended 31 Dec 2011
£m
Revenue 1,927.0 1,676.1 1,533.5 1,244.1 1,162.6Cost of sales (1,498.6) (1,293.0) (1,159.7) (923.4) (883.5)Gross profit (centre contribution) 428.4 383.1 373.8 320.7 279.1Administration expenses before non-recurring expenses (273.6) (270.9) (275.9) (225.7) (221.6)Research & development (10.3) (8.7) (7.2) (4.5) (3.1)Administration expenses (283.9) (279.6) (283.1) (230.2) (224.7)Operating profit (before non-recurring items) 144.5 103.5 90.7 90.5 54.4Non-recurring items 15.3 – – – –Operating profit (including non-recurring items) 159.8 103.5 90.7 90.5 54.4
Share of post-tax profit/(loss) of joint ventures 0.3 0.8 0.1 (0.3) 0.1Profit before financing costs 160.1 104.3 90.8 90.2 54.5Finance expense (15.0) (17.3) (10.5) (5.9) (6.4)Finance income 0.6 0.1 1.2 0.8 1.3Profit before tax for the year 145.7 87.1 81.5 85.1 49.4Tax (charge)/credit (25.8) (17.2) (14.6) (14.2) (9.0)Profit after tax for the year 119.9 69.9 66.9 70.9 40.4
Attributable to: Equity shareholders of the parent 119.9 69.9 66.9 70.9 41.7Minority interests – – – – (1.3) 119.9 69.9 66.9 70.9 40.4
Earnings per ordinary share (EPS): Basic (p) 12.8p 7.4p 7.1p 7.5p 4.3pDiluted (p) 12.6p 7.2p 7.0p 7.5p 4.3pWeighted average number of shares outstanding (‘000s) 933,458 944,082 943,775 941,922 941,899Balance sheet data (as at 31 December) Intangible assets 666.0 549.9 491.7 363.9 331.3Property, plant and equipment 917.0 718.8 608.7 437.5 333.5Deferred tax assets 36.4 40.0 33.4 33.9 32.2Trade and other receivables 644.3 565.2 423.8 333.9 319.2Cash, cash equivalents and liquid investments 63.9 72.8 84.7 132.3 197.5Total assets 2,327.6 1,946.7 1,642.3 1,301.5 1,213.7Current liabilities (1,085.7) (891.9) (758.8) (612.5) (578.4)Non-current liabilities (650.6) (513.1) (364.4) (157.0) (126.4)Provisions (7.6) (4.3) (4.9) (4.6) (8.2)Equity minority interests – – – – –Equity shareholders’ funds (583.7) (537.4) (514.2) (527.4) (500.7)Total liabilities and shareholders’ funds (2,327.6) (1,946.7) (1,642.3) (1,301.5) (1,213.7)

106 Regus plc Annual Report and Accounts 2015
Shareholder information
106 Regus plc Annual Report and Accounts 2015
Corporate directory Secretary and Registered Office Lynsey Blair, Company Secretary Regus plc (Société Anonyme) Registered Office: Registered Head Office: 22 Grenville Street 26 Boulevard Royal St Helier L-2449 Luxembourg Jersey JE4 8PX
Registered Number Jersey Luxembourg 101523 R.C.S. B 141 159
Registrars Capita (Registrars) Jersey Limited 12 Castle Street St Helier Jersey JE2 3RT
Auditor KPMG Luxembourg, Société cooperative 39, Avenue John F. Kennedy L-1855 Luxembourg
Legal advisers to the Company as to English law Slaughter and May One Bunhill Row London EC1Y 8YY
Legal advisers to the Company as to Luxembourg law MNKS Vertigo Polaris Building 2 – 4 rue Eugène Ruppert L-2453 Luxembourg
Corporate stockbrokers Investec Bank plc 2 Gresham Street London EC2V 7QP
J.P. Morgan Cazenove 25 Bank Street Canary Wharf London E14 5JP
Financial PR advisors Brunswick Group LLP 16 Lincoln’s Inn Fields London WC2A 3ED
Glossary Available workstations The total number of workstations in the Group (also termed Inventory). During the year, this is expressed as a weighted average. At period ends the absolute number is used
Centre contribution Gross profit comprising centre revenues less direct operating expenses but before administrative expenses
EBITDA Earnings before interest, tax, depreciation and amortisation
EBITDAR Earnings before interest, tax, depreciation, amortisation and rent
Enquiries Client enquiries about Regus products or services
Expansions A general term which includes new business centres established by Regus and acquired centres in the year
Forward order book The future workstation revenue already contracted with clients at a point in time
Post-tax cash return EBITDA achieved, less the amortisation of any partner capital contribution, less tax based on the EBIT and after deducting maintenance capital expenditure.
Like for like The financial performance from centres owned and operated for a full 12 month period prior to the start of the financial year, which therefore have a full year comparative
Mature business Operations owned for a full 12 month period prior to the start of the financial year, which therefore have a full year comparative
Occupancy Occupied workstations divided by available workstations expressed as a percentage
Occupied workstations Workstations which are in use by clients. This is expressed as a weighted average for the year
REVPAW Total revenue per available workstation (Revenue/available workstations)
REVPOW Total revenue per occupied workstation
WIPOW Workstation income per occupied workstation

The Forest Stewardship Council® (FSC) is an international network which promotes responsible management of the world’s forests. Forest certification is combined with a system of product labelling that allows consumers to readily identify timber-based products from certified forests.
Designed and produced by Black Sun Plc | www.blacksunplc.com
Printed in England by the Pureprint Group

Regus plc S.A. 26 Boulevard Royal L-2449 Luxembourg
www.regus.com
Regus plc A
nnual Repo
rt and Acco
unts 2015