"longitudinal twin study of early literacy development...
TRANSCRIPT
Longitudinal twin study of early literacy development: Preschool
through Grade 1
BRIAN BYRNE1, STEFAN SAMUELSSON2,3, SALLY WADS-WORTH4, JACQUELINE HULSLANDER5, ROBIN CORLEY4,JOHN C. DEFRIES4, PETER QUAIN6, ERIK G. WILLCUTT5,RICHARD K. OLSON5
1School of Psychology and Language and Cognition Research Centre, University of NewEngland, Armidale, Australia; 2Department of Education, Stavanger University, Stavan-
ger, Norway; 3Department of Behavioral Sciences, Linkoping University, Linkoping,Sweden; 4Institute for Behavioral Genetics, University of Colorado, Boulder, USA;5Department of Psychology, University of Colorado, Boulder, USA; 6School of
Psychology, University of New England, Armidale, Australia
Abstract. Grade 1 literacy skills of twin children in Australia (New South Wales) and
the United States (Colorado) were explored in a genetically sensitive design (N = 319pairs). Analyses indicated strong genetic influence on word and nonword identification,reading comprehension, and spelling. Rapid naming showed more modest, though
reliable, genetic influence. Phonological awareness was subject to high nonsharedenvironment and no reliable genetic effects, and individual measures of memory andlearning were also less affected by genes than nonshared environment. Multivariate
analyses showed that the same genes affected word identification, reading comprehen-sion, and spelling. Country comparisons indicated that the patterns of genetic influenceon reading and spelling in Grade 1 were similar, though for the U.S. but not theAustralian children new genes came on stream in the move from kindergarten to Grade
1. We suggest that this is because the more intensive kindergarten literacy curriculum inNew South Wales compared with Colorado, consistent with the mean differencesbetween the two countries, means that more of the genes are ‘‘online’’ sooner in
Australia because of accelerated overall reading development.
Key words: Environment, Genetics, Phonological decoding, Reading comprehension,Spelling, Word identification
Introduction
We are conducting an international longitudinal twin study (ILTS) of thegenetic and environmental influences on children�s early progress in lit-eracy. Our twin design includes monozygotic and same-sex dizygotic twinpairs, recruited in the last year prior to formal schooling and followedthrough the first three years of school. The sample is from the USA,Scandinavia, and Australia. We have already reported on the preschool
Reading and Writing (2007) 20:77–102 � Springer 2006DOI 10.1007/s11145-006-9019-9
phase (Byrne et al., 2002; Samuelsson et al., 2005; this volume) and onthe progress from preschool to kindergarten (Byrne et al., 2005, 2006;Samuelsson et al., this volume), and in this article we include measuresfrom the second school year, Grade 1, as well.
That reading problems aggregate in families has been known for acentury (Thomas, 1905), and in the last 50 years evidence that this is inpart due to shared genes has been found. The heritability of the groupdeficit of dyslexia is put at between .5 and .7 for children in the 8–16 yearage range, depending on the reading phenotype, and variability in readingability across the normal range is at least as heritable (Gayan & Olson,2003; see Olson & Byrne, 2005, and Pennington & Olson, 2005, forreviews). Some success has been achieved in identifying several chromo-somal regions and candidate genes that are implicated in readingdisabilities (Cope et al., 2005; Deffenbacher et al., 2004; Fisher & De-Fries, 2002; Hannula-Jouppi et al., 2005; Meng et al., 2005; Schumacheret al., 2006; Taipale et al., 2003). Aspects of the environment also play arole in determining variability in literacy levels, including the family-based situation that twins share (Byrne et al., 2005; Gayan & Olson,2001; Olson, Wise, Connors, Rack, & Fulker, 1989; Olson, Forsberg, &Wise, 1994; Petrill, Deater-Deckard, Thompson, & DeThorne, in press;Petrill, Deater-Deckard, Thompson, Schatschneider, & DeThorne, thisvolume; Samuelsson et al., 2005, this volume.). Adoption studies, whichare also genetically and environmentally informative, have also been usedto identify home environment factors that influence the growth of liter-acy (e.g., Petrill, Deater-Deckard, Schatschneider, & Davis, 2005;Wadsworth, Corley, Hewitt, Plomin, & DeFries, 2002).
The use of twins to separate genetic and environmental factors gov-erning individual differences relies on the fact that monozygotic twinsshare all of their genes whereas dizygotic twins share, on average, half oftheir segregating genes. It also relies on an assumption that within fam-ilies both types of twins share equally similar environments, an assump-tion that allows researchers to distinguish family-based (‘‘shared’’)environment influences from those that affect one twin but not the other(‘‘nonshared environment’’). For characteristics that are fully determinedby genes, monozygotic twins will be identical and dizygotic twins about50% alike, on average. For characteristics that are fully determined byshared environment, both types of twins will be identical. For charac-teristics that are fully determined by nonshared environment, twins willbe no more alike than randomly selected individuals. These are idealizedsituations, rarely realized, but departures from these ideals can be used toestimate the mix of genetic and environmental (shared and nonshared)
78 BRIAN BYRNE ET AL.

factors affecting the characteristic of interest. See Plomin, DeFries,McClearn & McGuffin (2001) for an introduction to twin methodology.
We elected to begin with preschool children in an attempt to circum-vent a problem inherent in the exclusive use of school-age children, whenreading levels have often become entrenched (Juel, 1988). The problem isthe possible confounding effects of reading levels themselves on correlatedabilities such as vocabulary and phonological awareness, making it moredifficult to separate cause and effect in describing the etiology of readingdifficulties. We assess variables known to predict subsequent readingability when administered prior to or near the start of school, and/orwhich covary with literacy levels during childhood and adolescence. Theyinclude phonological awareness, letter knowledge and other aspects ofprint familiarity, verbal fluency (rapid automatized naming), verbalshort-term memory, learning potential within and outside the domain ofphonology, vocabulary and other ‘‘higher’’ language functions such asmorphology, and nonverbal measures such as Block Design. We alsocollected information from parents relating to home literacy and to thechildren�s levels of attention and hyperactivity. For full details, see Byrneet al. (2002) and Samuelsson et al. (2005, this volume).
During the school years our test battery includes word and nonwordidentification, orthographic coding, spelling, reading comprehension,phonological awareness, verbal short-term memory, vocabulary andgrammatical processes. We also continue to collect questionnaire datafrom parents. For full details, see Byrne et al. (2005, 2006).
In some of our analyses we have combined country samples, initiallybecause of restricted sample sizes as the project developed and later becauseresults indicated no reliable country differences in etiological patterns forsome of our measures. At the preschool phase, we detected substantial ge-netic and more modest shared and nonshared environment influences onphonological awareness, verbal short-term memory, rapid naming, andnonverbal IQ (Block Design). At the same time we found the oppositepattern with print awareness, vocabulary, grammar and morphology, sub-stantial shared environment and modest genetic influence. Country sampleswere remarkably similar in the pattern of genetic and environmental influ-ences, despite lower mean levels of print awareness in the Scandinavianchildren, which we expected on the basis of societal attitudes to readinginstruction in those communities (Samuelsson et al., 2005, this volume).
At the end of the first kindergarten school year, reading, phonologicalawareness, and rapid naming for the combined Australian and U.S. sam-ples are seen to be highly heritable, and spelling equally affected by genesand shared environment. Our measure of grammatical control, the Test forthe Reception of Grammar (TROG–Bishop, 1989), continues to show
79LONGITUDINAL TWIN STUDY OF EARLY LITERACY DEVELOPMENT
shared environment effects and no reliable genetic effects. In addition,analyses by Samuelsson et al. (this volume) have shown strong trends, notyet significantwith the current sample sizes, for stronger genetic influence inthe Australian sample at kindergarten. We will return to the question ofcountry differences in genetic influence at the end of kindergarten when wecompare results from Australia and the US at the end of first grade.
As well as generating univariate estimates, it is possible to conductmultivariate analyses with these data. In our research, these have includedvariables measured simultaneously, for example in the preschool phase,and variables measured successively, for example at preschool followedby kindergarten. For these developmental analyses, we have explored thesame variable assessed in different phases as well as different variablesacross the phases. We have mostly employed genetic Cholesky decom-positions, similar in principle to hierarchical regression where the effectsof an independent variable on a dependent variable are assessed after theeffects of another, correlated predictor are taken into account. Forexample, it allows us to determine whether a single genetic source affectsphonological awareness and letter knowledge, to check if phonologicalawareness in kindergarten is affected by the same genes as govern it inpreschool, and to discover if the shared environment effect on grammar inpreschool is continuous with the one operating at kindergarten. Multi-variate approaches can also be couched in terms of genetic, sharedenvironment and nonshared environment correlations among measures.Next we describe selected multivariate results so far.
At preschool, a common set of genes influences general verbal ability,phonological awareness, rapid naming, and print knowledge. A second setaffects phonological awareness and print knowledge independently of thefirst set, and rapid naming and print knowledge are each subject to inde-pendent genetic influence by a third and fourth set respectively. Thus thereis both genetic overlap and genetic independence among those four majorlatent traits. As far as shared environment is concerned, one factor affectsall four traits and a second influences phonological awareness, rapidnaming, and print knowledge independently of the more general factor(for a result consistent with this, see Petrill, Deater-Deckard, Thompson,DeThorne, & Schatschneider, in press). There is just one nonsharedenvironment factor, and it affects all four traits. For full details, includingcorrelations associated with these analyses, see Samuelsson et al. (2005).
In the kindergarten phase, the first follow-up for the twins, we againsee both common and independent factors in operation. There is a geneticfactor affecting kindergarten phonological awareness, rapid naming,reading, and spelling, a second one that influences rapid naming andreading (but not spelling), and a third that is common to reading and
80 BRIAN BYRNE ET AL.

spelling. Thus reading is subject to three genetic effects, one unrelated tomeasures of phonological awareness and rapid naming, and spelling issubject to just two. There is just one shared environment factor, and itcovers all four traits. Similarly, a single nonshared environment factoraffects all traits, but in this case another one influences rapid naming(alone). Details are in Byrne et al. (2005, 2006). It remains to be seenwhether the kindergarten country differences (Australia versus the US)suggested in Samuelsson (this volume) are reflected in these multivariaterelations when they are examined separately by country. Once largersamples are available, we will undertake these analyses.
Longitudinal analyses showed that both phonological awareness andrapid naming are subject to both genetic continuity and genetic disconti-nuity in the progression from preschool to kindergarten. That is, for each ofthese variables one genetic source exerts influence at both phases and asecond comes into play in kindergarten as well. For phonological awareness,the items at the follow-up testing are not identical to those used in preschoolbut cover the same constructs of elision, blending, and rhyme/alliteration, soit is unlikely that the new genetic source is related to test constructiondifferences. However, in the case of rapid naming, colors and objects con-stitute the items at preschool whereas colors, letters and digits are used inkindergarten (preschool children are not secure in letter and digit recogni-tion). Since for color naming alone there were no new genetic influences inkindergarten, it seems that the second genetic influence on rapid naming inkindergarten is related to the change in item mix (Byrne et al., 2005, 2006).
In another longitudinal analysis, we tracked determinants of preschoolprint knowledge, phonological awareness, and rapid naming in relation tokindergarten reading (Byrne et al., 2006). A common genetic sourceinfluenced all four variables, a second one affected phonological aware-ness uniquely, and a third affected rapid naming uniquely (that is, neitherloaded significantly on any other factor, including kindergarten reading).(A fourth factor specific to the reading latent trait, showing up as con-tributing .17 of the total heritability of reading of .70, was indicated, buton available sample size did not achieve significance at p<.05.). Perhapsthe most noteworthy aspect of this analysis is that preschool phonologicalawareness and rapid naming, both with heritabilities of .6 or over, onlyshared genetic variance with kindergarten reading through the genes thatalso determine preschool print knowledge. Related to that is the obser-vation that a common genetic source determines the relatively modestheritability of preschool print knowledge of .23 but also accounts for themajor portion of the heritability of kindergarten reading, namely .52 outof a total of .70. This may underlie the often-observed fact that early lettername knowledge, which constituted a substantial part of our print
81LONGITUDINAL TWIN STUDY OF EARLY LITERACY DEVELOPMENT

knowledge composite, is the best predictor of subsequent reading levels,even though letter knowledge typically reaches ceiling by the end of thefirst school year (Foulin, 2005). Apparently, preschool letter knowledgedepends in part on genes that subsequently play a substantial role inschool reading levels.
Kindergarten reading is affected by only one significant source ofshared environment, and that source is shared with all three preschooltraits. That is, no shared environment source specific to school was inevidence in our data for kindergarten reading. Given that members of thetwin pairs in our sample attend the same school as each other, these datasuggest that school is not having a differential effect on early readinglevels, although of course attendance at school results in almost all of themean increase in reading at this age (Morrison, Griffith, & Alberts, 1997).Reading is also affected by a nonshared environment factor, on this oc-casion common to preschool print knowledge and phonological aware-ness but not rapid naming. Rapid naming, in turn, is subject to a specificnonshared environment source, continuing a trend for it to show a certainlevel of etiological specificity in our data. Since nonshared environmentincludes test error, this pattern may mean that our measures of rapidnaming are more prone to error than are our other measures.
Quantifying genetic, shared environment and nonshared environmentfactors is one thing, identifying them is another. In the case of genes, it isunknown which, if any, of the chromosomal regions and genes so farimplicated in severe reading disability may be at work in influencingreading levels in this unselected sample. Shared environment refers tocircumstances that members of a twin pair share, and we have data onsome aspects of these, such as home literacy practices. We have shownrelationships between these practices and phenotypic levels of perfor-mance on some of our preschool measures, documented in Samuelssonet al. (2005, this volume), but to date we have not further tied theseaspects to the specific factors emerging in the behavior-genetic analysesjust described. Nonshared environment includes test error, as mentioned,and this can be expected to be relatively high in twins as young as ours(four years up). Further, because each member of a twin pair is assessedby a different tester (see Byrne et al., 2002, for a justification of this), wecannot rule out tester effects as contributing to this source. We also haveinformation on some of the factors that might contribute to nonsharedenvironment effects, such as individual children�s medical histories andbirth weight, but again progress must await further analyses.
As mentioned earlier, we have also noted differences between ourcountry sample means. Some of these have ready explanations. Forexample, in Norway and Sweden parents are discouraged from teaching
82 BRIAN BYRNE ET AL.
letters and words to their preschool children, and reading is not formallytaught in the first school year (Samuelsson et al., 2005, this volume). Thus,we found lower levels of print awareness in thepreschool phase andminimalword reading ability at the end of kindergarten in the Scandinavian sample.Other differences remain largely unexplained. Generally the Australianchildren have outperformed their American counterparts at both phases sofar reported. We have speculated that this may be due to different ascer-tainment methods, with the Australian sample primarily recruited througha voluntary twin research registry (Australian Twin Registry of theNational Health and Medical Research Council), and the US samplethrough Colorado birth records. However, this difference is not reflected inhigher educational levels among parents in the Australian families; on thecontrary there are indications of lower levels (Byrne et al., 2005). Once thechildren start school, theAustralian children attend for full days, in contrastto typical half days in the state of Colorado, and this might explain theobservation that it is in measures that depend on direct school instruction,reading and spelling, compared to other variables such as workingmemoryand vocabulary, that the biggest effect sizes are noted (Byrne et al., 2005).
In this article we turn our attention to the second follow-up testinground, conducted when the children were near the end of Grade 1. Thetests include word reading, reading comprehension, spelling, phonologicalawareness, rapid naming, and aspects of memory and learning. We remainprimarily focused on the literacy variables, along with their simultaneousrelations with other Grade 1 measures and with the literacy and cognitive/linguistic tests of the prior testing rounds.With the introduction of readingcomprehension assessment in this phase, we are particularly interested inits genetic and environmental relations with word-level reading skills andwith earlier measures of the higher language functions of vocabulary andgrammar. There is a good deal of debate about the degree to which readingcomprehension is dependent on word reading efficiency and possible rolesfor other cognitive and language skills (Curtis, 1980; Hoover & Gough,1990; Mehta, Foorman, Branum-Martin, & Taylor, 2005; Perfetti,Landi, & Oakhill, 2005; Keenan, Betjemann, Wadsworth, DeFries, &Olson, 2006). Our design can potentially contribute to that debate.
Method
Participants
In this report we have excluded the small Scandinavian Grade 1 sample(29 twin pairs) because reading is not taught in the first school year
83LONGITUDINAL TWIN STUDY OF EARLY LITERACY DEVELOPMENT

(kindergarten) and so those children have had one year less of readinginstruction than their US and Australian counterparts. The effects of thiscan be seen in relatively low word identification and reading compre-hension scores in the Scandinavian sample (reading comprehension wasjust 50 and 55% of the Australian and US levels, respectively). Thesample at Grade 1 consisted of 167 monozygotic twin pairs, (92 U.S. and75 Australian) and 152 dizygotic pairs (105 U.S. and 47 Australian), total319 pairs. Mean ages at testing were 88.7 months and 83.9 months for theUS and Australia respectively. This is a significant difference (p<.001),due in part to the fact that the US children are tested in the summer afterthe end of the school year and the Australian children are tested duringthe final three to four months of the school year (owing to the shortersummer vacation in Australia of six weeks versus twelve in the US). Aswill be seen in Results, the Australian children generally outperformed theUS ones, so the higher age and months of schooling in the US sample hasnot resulted in superior performance.
Materials
Test of Word Reading Efficiency (TOWRE)In this test (Torgesen, Wagner, & Rashotte, 1999), children read a list ofwords and a list of nonwords as quickly as possible, with the score beingthe number correctly read in 45 sec. There are two equivalent forms of thetest, Forms A and B, and we administered both to optimise the reliabilityof the scores. (Test–retest reliability for children aged 6–9 years, .97 forword and .90 for nonword standard scores; MZr = .92 for word and .83for nonword standard scores—we present MZr values as lower-boundestimates of reliability in our sample).
Woodcock Passage Comprehension from the Woodcock ReadingMastery Test (Revised), (Woodcock, 1989). This uses a cloze procedure(in which the child fills a blank in a passage that they are reading) toassess the child�s ability to understand passages of connected text(MZr = .77).
SpellingWe used the Wide Range Achievement Test (WRAT), (Jastak &Wilkinson, 1984) spelling subtest. Children spell words until they maketen consecutive errors. Score is total number correct. (MZr = .77).
Rapid namingWe gave two versions of this test, using digits and letters from theComprehensive Test of Phonological Processing (CTOPP, Wagner,
84 BRIAN BYRNE ET AL.

Torgesen & Rashotte, 1999). (Test–retest reliability for rapid namingcomposite for ages 8–17 years, .79; MZr = .58 for digits and .56 forletters).
Phonological awareness testsWe gave two tests of phonological awareness from the CTOPP: Elision(saying part of a word after eliding a segment, as in cup without /k/);Blending (smoothly amalgamating segments into words, as in /I/ + /t/ tomake it). (Test–retest reliabilities for children aged 5–7 years; elision, .88,blending, .88; MZr = .41 for elision, .45 for blending).
Verbal memory testsWe administered two subtests from the Wide Range Assessment ofMemory and Learning (WRAML, Adams & Sheslow, 1990): SoundSymbol, where the child is asked to recall different syllables associatedwith eight abstract figures, a procedure that is repeated four times, withthe total number of sounds recalled across all four trials used as thedependent variable (MZr = .46); and Verbal Learning, in which the childis required to learn a list of eight words, repeated four times in differentorders. The total number recalled across the four trials is the dependentvariable (MZr = .39). We also administered the Sentence Memorysubstest from Wechsler Preschool and Primary Scale of Intelligence(WPPSI) battery (Wechsler, 1989). The child is asked to repeat shortsentences verbatim (MZr = .59).
ProcedureThe children were tested in their schools or homes in a session lastingabout one hour. Following best practice for twin studies, two testersassessed each twin pair at the same time, one tester per child. This guardsagainst possible biases, such as a single tester tending to assess monozy-gotic children as being more alike than they actually are.
Results
Mean scores by country are presented in Table 1. As noted above, theAustralian children achieved higher scores, in fact on every measureexcept CTOPP Blending, t (626) = 1.33, p = .18 (minimum t value forother comparisons = 3.34, for WRAML Verbal Learning).
Because of the mean country differences, scores were standardizedwithin country prior to further behavior genetic analyses of the combinedsample. They were also age- and gender-adjusted, and truncated
85LONGITUDINAL TWIN STUDY OF EARLY LITERACY DEVELOPMENT

to ±3 SD. Twin correlations based on these standardized and adjustedscores are also reported in Table 1. The patterns of MZ and DZ corre-lations were, with some exceptions, similar across the samples, thus jus-tifying combination of the samples to achieve greater power in ourbehavior genetic analyses. The exceptions were for RAN letters, CTOPPelision, and WRAML verbal learning. The latter two tests may be subjectto relatively high measurement error (see below). When RAN letters anddigits are combined into a more stable latent trait, the pattern falls intoline with the preschool picture of relatively high genetic influence (seeTable 2).
Higher monozygotic than dizygotic correlations were observed foreach variable, evidence for genetic influence. The data were modelled
Table 1. Means (and standard deviations) of Grade 1 measures by country, and twin
correlations by country and for the combined sample.
Measure
Means (standard
deviations)
Correlations
US Australia Combined
US Australia MZr DZr MZr DZr MZr DZr
TOWRE SWA 101.0 (14.3) 109.0 (13.3) .86 .46 .78 .30 .83 .42
TOWRE PDA 100.2 (13.4) 108.7 (13.0) .81 .42 .65 .23 .74 .37
TOWRE SWB 100.5 (14.8) 108.8 (14.0) .86 .47 .74 .26 .81 .42
TOWRE PDB 98.4 (14.0) 109.0 (13.3) .75 .40 .62 .21 .69 .35
Woodcock Comp.a 92.20 (9.49) 95.47 (10.33) .78 .45 .74 .39 .77 .44
WRAT Spelling 99.1 (15.5) 112.8 (16.2) .76 .46 .79 .34 .77 .43
CTOPP RAN, digits 9.71 (2.21) 10.41 (1.97) .61 .38 .57 .49 .58 .38
CTOPP RAN, letters 9.58 (2.08) 10.49 (2.07) .64 .40 .43 .46 .56 .43
CTOPP Elision 10.87 (3.01) 11.71 (2.83) .37 .35 .46 .18 .41 .30
CTOPP Blending 11.35 (2.44) 11.62 (2.62) .42 .38 .49 .23 .45 .35
WRAML Sound
Symbol
8.55 (2.55) 10.14 (2.58) .45 .19 .43 ).07 .46 .11
WRAML Verbal
Learning
9.74 (3.13) 10.59 (3.01) .47 .29 .28 .25 .39 .28
WPPSI Sentence
Memory
9.85 (2.80) 10.74 (3.08) .62 .45 .53 .37 .59 .43
Note. TOWRE = Test of Word Reading Efficiency; SWA, SWB = Sight Word, Forms A
and B; PDA, PDB = Phonemic Decoding, Forms A and B; WRAT = Wide Range
Achievement Test; CTOPP = Comprehensive Test of Phonological Processing;
WRAML = Wide Range Assessment of Memory and Learning; WPPSI = Wechsler
Preschool and Primary Scale of Intelligence.aAge equivalent score.
86 BRIAN BYRNE ET AL.

within the Mx package (Neale, Boker, Xie, & Maes, 2002), after somedata reduction, with the results presented in Table 2. That includedforming a latent trait from the four TOWRE tests, which intercorrelatedabove .85, and from the two rapid naming tests, which correlated .79.Correlations among the three tests we considered to represent learning,WRAML Sound Symbol and Verbal Learning and WPPSI SentenceMemory, were in the order of .21 to .36 (see Table 3), and consequentlywe modeled them separately. Similarly, the correlation of .39 between thetwo phonological awareness measures, elision and blending, made itprudent to model them separately. We did, however, also form latenttraits from these two groups of tests, memory and phonological aware-ness, and we report the estimates in Table 2 as well.
The results of the Mx modelling are for the pooled samples data.Confidence intervals that contain .00 suggest that the component is notstatistically significant. The nonshared environment term, e2, alsoincludes measurement error, and several variables where this term is high,including the CTOPP phonological awareness tests and the WRAML
Table 2. Mx model fitting estimates for grade 1 measures (95% confidence intervals in
parentheses) for the combined Australian and U.S. Samples, standardized within sam-
ples.
Variable a2 c2 e2
TOWRE word efficiency .81 (.57, .87) .03 (.00, .26) .17 (.13, .22)
TOWRE nonword eff. .71 (.43, .79) .03 (.00, .28) .27 (.21, .34)
TOWRE combined .82 (.58, .86) .00 (.00, .23) .18 (.14, .23)
Woodcock Comp. .76 (.53, .84) .03 (.00, .25) .21 (.16, .27)
WRAT Spelling .71 (.47, .82) .07 (.00, .29) .22 (.18, .29)
CTOPP RAN (latent trait) .56 (.23, .82) .19 (.00, .47) .26 (.18, .37)
CTOPP Elision .29 (.00, .57) .15 (.00, .42) .56 (.42, .70)
CTOPP Blending .19 (.00, .54) .26 (.00, .50) .55 (.41, .68)
CTOPP PA Latent Trait .20 (.00, .58) .29 (.00, .58) .52 (.34, .67)
WRAML Sound Symbol .44 (24, .59) .00 (.00, .14) .56 (.41, .69)
WRAML Verbal Learning .33 (.00, .57) .10 (.00, .39) .57 (.43, .71)
WPPSI Sentence Memory .35 (.05, .67) .24 (.00, .49) .40 (.27, .50)
Memory Latent Trait .56 (.08, .87) .11 (.00, .45) .33 (.13, .62)
Note. TOWRE = Test of Word Reading Efficiency; CTOPP = Comprehensive Test of
Phonological Processing; WRAML = Wide Range Assessment of Memory and Learning;
WPPSI = Wechsler Preschool and Primary Scale of Intelligence.
a2 = additive genetic variance, c2 = shared environment variance, e2 = nonshared
environment variance. Estimates with confidence intervals including .00 are not signifi-
cantly greater than 0.
87LONGITUDINAL TWIN STUDY OF EARLY LITERACY DEVELOPMENT

learning tests, may be subject to such error in this sample. Of those fourtests, only Sound Symbol showed statistically significant genetic effects.
In Table 3 we present the phenotypic correlations among all variablesfor the combined sample after standardization within country. All valueswere significant beyond p = .01. The correlations were not significantlydifferent between samples. The literacy variables, word and non-word reading, reading comprehension, and spelling, intercorrelated quitehighly, as expected. Rapid naming correlated modestly with those vari-ables, as did elision. The remaining variables, blending and the learning/memory tests, had weaker relations with literacy and with each other.
We next explored the genetic and environmental correlations amongword reading, spelling, rapid naming, and reading comprehension.Table 4 contains the genetic and nonshared environment correlations,which refer to the degree to which the same genetic and environmentalinfluences are present across measurements. We have omitted sharedenvironment correlations because for three of the four variables theshared environment effect is close to zero; the exception is rapid naming
Table 3. Grade 1 test intercorrelations for the combined sample, scores standardized
within samples.
Test 2 3 4 5 6 7 8 9 10 11 12 13
1. TOWRE SWA .88 .96 .88 .83 .80 .59 .64 .54 .33 .37 .33 .30
2. TOWRE PDA .89 .94 .77 .75 .60 .62 .56 .34 .34 .33 .31
3. TOWRE SWB .84 .84 .79 .61 .66 .54 .33 .35 .34 .30
4. TOWRE PDB .75 .76 .59 .62 .55 .33 .33 .31 .30
5. Comp .77 .48 .53 .56 .41 .40 .36 .35
6. Spell .45 .51 .52 .42 .38 .27 .26
7. RAN-D .79 .43 .26 .20 .31 .20
8. RAN-L .41 .25 .22 .29 .20
9. Elision .39 .28 .21 .31
10. Blending .21 .17 .27
11. SS .36 .21
12. VL .29
13. Sent.
Note. TOWRE = Test of Word Reading Efficiency; SWA, SWB = Sight Word, Forms A
and B; PDA, PDB = Phonemic Decoding, Forms A and B; Comp. = Woodcock
Reading Mastery Test (Revised) Passage Comprehension; Spell = Wide Range
Achievement Test, Spelling; RAN-D, RAN-L Comprehensive Test of Phonological Pro-
cessing, Rapid Digit, Letter Naming; Elision, Blending = Comprehensive Test of Pho-
nological Processing Elsion, Blending; SS, VL = Wide Range Assessment of Memory and
Learning Sound Symbol, Verbal learning; Sent. = Wechsler Preschool and Primary Scale
of Intelligence, Sentence Memory.
88 BRIAN BYRNE ET AL.
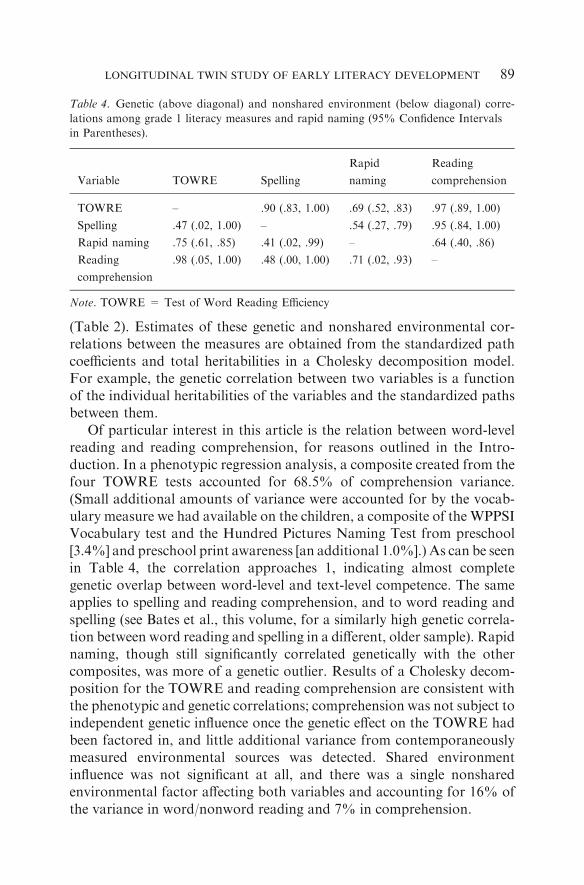
(Table 2). Estimates of these genetic and nonshared environmental cor-relations between the measures are obtained from the standardized pathcoefficients and total heritabilities in a Cholesky decomposition model.For example, the genetic correlation between two variables is a functionof the individual heritabilities of the variables and the standardized pathsbetween them.
Of particular interest in this article is the relation between word-levelreading and reading comprehension, for reasons outlined in the Intro-duction. In a phenotypic regression analysis, a composite created from thefour TOWRE tests accounted for 68.5% of comprehension variance.(Small additional amounts of variance were accounted for by the vocab-ulary measure we had available on the children, a composite of the WPPSIVocabulary test and the Hundred Pictures Naming Test from preschool[3.4%] and preschool print awareness [an additional 1.0%].) As can be seenin Table 4, the correlation approaches 1, indicating almost completegenetic overlap between word-level and text-level competence. The sameapplies to spelling and reading comprehension, and to word reading andspelling (see Bates et al., this volume, for a similarly high genetic correla-tion between word reading and spelling in a different, older sample). Rapidnaming, though still significantly correlated genetically with the othercomposites, was more of a genetic outlier. Results of a Cholesky decom-position for the TOWRE and reading comprehension are consistent withthe phenotypic and genetic correlations; comprehension was not subject toindependent genetic influence once the genetic effect on the TOWRE hadbeen factored in, and little additional variance from contemporaneouslymeasured environmental sources was detected. Shared environmentinfluence was not significant at all, and there was a single nonsharedenvironmental factor affecting both variables and accounting for 16% ofthe variance in word/nonword reading and 7% in comprehension.
Table 4. Genetic (above diagonal) and nonshared environment (below diagonal) corre-
lations among grade 1 literacy measures and rapid naming (95% Confidence Intervals
in Parentheses).
Variable TOWRE Spelling
Rapid
naming
Reading
comprehension
TOWRE – .90 (.83, 1.00) .69 (.52, .83) .97 (.89, 1.00)
Spelling .47 (.02, 1.00) – .54 (.27, .79) .95 (.84, 1.00)
Rapid naming .75 (.61, .85) .41 (.02, .99) – .64 (.40, .86)
Reading
comprehension
.98 (.05, 1.00) .48 (.00, 1.00) .71 (.02, .93) –
Note. TOWRE = Test of Word Reading Efficiency
89LONGITUDINAL TWIN STUDY OF EARLY LITERACY DEVELOPMENT

The nonshared environment correlations are generally ‘‘significant,’’ inthat the confidence intervals do not contain zero. However, the very wideconfidence intervals on all except the TOWRE/rapid naming value indi-cate that caution is needed in interpreting the estimates.
We examined the development of reading and spelling across kinder-garten and Grade 1 in Cholesky decompositions, reported in Tables 5(reading) and 6 (spelling). The interpretation of these tables can beillustrated with the additive genetic (A) matrix for reading (Table 5) forthe combined sample. Factor A1 shows that the genes affecting kinder-garten TOWRE performance also affect Grade 1 performance; the sub-stantial paths of .85 and .78 have confidence intervals that do not containzero. Factor A2 shows that the Grade 1 scores are also affected by asecond genetic source (a path value of .44 and a significant confidenceinterval). The situation for shared environment is different, with just asingle significant effect, on kindergarten reading, in evidence. Fornonshared environment there is continuity (Factor E1) and a new sourcecoming into play in Grade 1 (Factor E2). Spelling, unlike reading, doesnot show a reliable second genetic source in Grade 1 (Table 6).
In Tables 5 and 6 we also present separate country analyses forreading and spelling, respectively. Samuelsson et al. (this volume) notedthat genetic influence on kindergarten reading and spelling performancewas substantially higher in the Australian sample. We examined if thiswas the case for the subset of twins in our sample who had follow-up dataat Grade 1, and compared the same twins� genetic and environmentalestimates for reading and spelling at the end of first grade. We cautionthat conducting these analyses separately by country runs the risk ofpresenting unreliable estimates due to the reduced N, especially within theAustralian sample. However we believe that these analyses serve aworthwhile purpose in addressing the important question of whether andhow differing educational experiences might affect the pattern of geneticand environmental influences on early literacy.
It can be seen in Table 5 that at the end of kindergarten, estimates ofgenetic influence on TOWRE word and nonword reading efficiencyappeared stronger in the Australian sample (a2 = .89) than in the Col-orado sample (a2 = .61). However, because the confidence intervalsoverlap, these differences were not statistically significant. The sampledifference in genetic influence was most pronounced for kindergartenspelling (Table 6), where the confidence intervals (.14, .58; .46, .86 in theUS and Australian samples respectively) were somewhat more divergent.Conversely, shared environment influence on spelling was much higher inthe Colorado sample, although again these differences were not signifi-cant. Thus, these end-of-kindergarten results for twins with comparable
90 BRIAN BYRNE ET AL.

Table
5.Choleskymodel
ofadditivegenetic
(A),
sharedenvironment(C
),andnonsharedenvironment(E)Factorloadingsonkindergarten
andgrade1towre
latenttraitbycountryandforcombined
samples(95%
confidence
intervalsin
parentheses).
Variable
US
Australia
Combined
A1
A2
a2
A1
A2
a2
A1
A2
a2
Kindergarten
TOWRE
.78(.67,.90)
.61(.45,.80).94(.81,.97)
.89(.65,.94).85(.75,.94)
.72(.56,.87)
Grade1
TOWRE
.73(.56,.86).51(.33,.65).79(.55,.92).80(.62,.89).31(.00,.50).74(.44,.83).78(.63,.87).44(.26,.57).81(.58,.87)
C1
C2
c2C1
C2
c2C1
C2
c2
Kindergarten
TOWRE
.57(.36,.70)
.33(.13,.49).17(.00,.51)
.03(.00,.26).46(.23,.60)
.21(.05,.37)
Grade1
TOWRE
.15(.00,.41).27(.00,.48).10(.00,.33).11(.00,.52).00(.00,.44).01(.00,.27).04(.00,.33).16(.00,.43).03(.00,.24)
E1
E2
e2E1
E2
e2E1
E2
e2
Kindergarten
TOWRE
.25(.22,.30)
.06(.05,.09).29(.24,.35)
.08(.06,.12).27(.24,.30)
.07(.06,.09)
Grade1
TOWRE
.15(.07,.23).30(.25,.37).11(.08,.16).24(.12,.37).44(.36,.53).25(.17,.37).19(.12,.26).36(.31,.42).17(.13,.22)
Note.TOWRE
=TestofWord
ReadingEfficiency.
91LONGITUDINAL TWIN STUDY OF EARLY LITERACY DEVELOPMENT

Table
6.Choleskymodel
ofadditivegenetic
(A),
sharedenvironment(C
),andnonsharedenvironment(E)factorloadingsonkindergarten
spellingcomposite
andgrade1wratspellingbycountryandforcombined
samples(95%
confidence
intervalsin
parentheses).
Variable
US
Australia
Combined
A1
A2
a2
A1
A2
a2
A1
A2
a2
Kindergarten
Spelling
.59(.37,.76)
.35(.14,.58).85(.68,.93)
.72(.46,.86).70(.56,.83)
.49(.32,.69)
Grade1
WRAT
.65(.34,.90).49(.00,.67).65(.36,.82).80(.60,.92).31(.00,.57).74(.45,.85).75(.54,.90).41(.00,.59).72(.49,.82)
C1
C2
c2C1
C2
c2C1
C2
c2
Kindergarten
Spelling
.63(.42,.76)
.40(.18,.57).30(.00,.58)
.09(.00,.34).52(.31,.66)
.28(.09,.44)
Grade1
WRAT
.26(.00,.52).23(.00,.48).12(.00,.38).00(.00,.55).21(.00,.51).04(.00,.32).14(.00,.40).18(.00,.44).05(.00,.28)
E1
E2
e2E1
E2
e2E1
E2
e2
Kindergarten
Spelling
.51(.45,.58)
.25(.20,.33).43(.37,.51)
.19(.14,.26).48(.43,.53)
.23(.19,.28)
Grade1
WRAT
.20(.12,.29).43(.37,.51).23(.17,.31).08(.00,.19).46(.39,.54).22(.15,.30).15(.09,.22).45(.40,.50).22(.18,.28)
Note.WRAT
=WideRangeAchievem
entTest,Spelling.
92 BRIAN BYRNE ET AL.

first-grade follow-up data mirror the pattern reported by Samuelssonet al. (this volume) for a larger sample from the same study.
In contrast, by the end of Grade 1, differences in point estimatesbetween countries were greatly diminished. In particular, there werealmost no sample differences in genetic and environmental estimates forthe TOWRE word and nonword reading efficiency latent trait, and thesample differences in genetic and environmental estimates for spellingwere much reduced with highly overlapping confidence intervals. Inaddition, country comparisons for reading comprehension, assessed onlyin Grade 1, show an almost identical pattern: for the US sample,a2 = .77, c2 = .04 (nonsignificant), and e2 = .19; respective Australianfigures are a2 = .77, c2 = .00, and e2 = .23.
We can converge on these univariate estimates of genetic and envi-ronmental effects by examining how genetic and environmental stabilitymay vary across the US and Australian samples. The country-basedCholesky analyses in Table 5 show that for reading the new genes thatcome on stream in Grade 1, evident in the whole-sample analysis, may berestricted to the US sample–Path A2 was not significant in the Australiansample, although it remains to be seen whether it becomes so once theAustralian sample reaches the same size as the U.S. sample. Even so, inthe Australian sample the genetic influence at kindergarten was alreadysubstantial at .89, as we noted above, leaving little room for a new geneticsource the next year, in comparison to the lower kindergarten influenceevident in the US children (a2 = .61).
Discussion
In this paper we report new analyses in an ongoing longitudinal twinstudy of early literacy growth. We cover Grade 1 performance in readingand spelling along with the normally associated variables of rapid nam-ing, phonological awareness, and learning processes. The data are fromthe third testing phase of twin children whose preschool and kindergartenresults have been the subjects of earlier publications (Byrne et al., 2002,2005, 2006; Samuelsson et al., 2005).
Word and nonword reading, reading comprehension, and spellingwere substantially heritable near the end of first grade, and the estimateswere quite similar in the Australian and U.S samples. Shared environmenteffects on these variables were low and nonsignificant, and nonsharedenvironment effects, which include test error, were modest. The word-level reading results continue the trend for substantial genetic effectsnoted already in the kindergarten data for the combined Australian and
93LONGITUDINAL TWIN STUDY OF EARLY LITERACY DEVELOPMENT
U.S. samples (Byrne et al., 2005, 2006), though Samuelsson at al. (thisvolume) noted that genetic influence was higher at kindergarten in theAustralian sample, also confirmed in the present analyses for thekindergarten twins for whom we had follow-up data at Grade 1.
The similar results for the Australian and U.S. samples near the end offirst grade are partially consistent with a much larger British study of7-year-old twins (N = 3909 pairs; Harlaar, Spinath, Dale, & Plomin,2005). Those investigators also employed the TOWRE as their wordreading measure (tested over the telephone) and reported heritabilities at.65 for boys and .67 for girls, somewhat lower than the value of .81 forour combined-sex and country samples from Australia and the US, and.79 (US) and .74 (Australia) for our samples considered separately. Intheir study, shared environment effects for both sexes were significant at.19 and .17 for males and females respectively whereas ours at .00 for thecombined sex and country sample was not. Harlaar et al. computed theirestimates using a composite comprised of the summed, standardizedsubtest scores, and we employed latent trait modelling. To check if thedifferent pattern of results was a consequence of computational method,we recomputed ours using the same composite as Harlaar et al. had used.The results were virtually identical as with the latent trait. It is worthnoting that in the case of shared environment influence, the confidenceintervals for our data and those of Harlaar et al. overlap (.07–.29 for boysand .06–.27 for girls, .00–.23 in our data). Thus although the point esti-mates suggest a discrepancy between the two samples, for which we haveno ready explanation, it is possible that no discrepancy in fact exists.
Petrill et al. (this volume) reported results from measures of word andnonword reading accuracy for a sample of 211 twin pairs from Ohio thathad nearly the same mean age (86.4 Months, SD = 8.04) as our Colo-rado sample with 197 pairs (88.7 Months, SD = 4.0), so we will comparetheir results with those from our Colorado sample. The Petrill et al.heritability estimates for word (.58) and nonword (.51) accuracy weresignificant, but lower than ours for word (.81) and nonword (.85) readingefficiency in Colorado. In addition, their shared environment estimatesfor word (.33) and nonword (.21) accuracy were larger than ours for word(.09) and nonword (.00) reading efficiency. Differences between thesample estimates could be due to the different measures, reading accuracybeing less influenced than reading efficiency by genetic factors, but againwe caution that in view of the overlapping confidence intervals, no dis-crepancy may in fact exist. What we can say at this point is that genes arethe dominant influence on individual differences in word and nonwordreading near the end of first grade in Australia, Colorado, Ohio, and theU.K. Moreover, for individual differences in reading comprehension on
94 BRIAN BYRNE ET AL.
the Woodcock measure that is shared by the Australia, Colorado, andOhio samples, the heritability estimates were .77, .77, and .76 respectively.
Spelling in kindergarten had a lower heritability of .39 in our previousanalyses of the combined Australian and U.S. samples (Byrne et al., 2005;but see later discussion of sample differences), compared to .72 near theend of first grade (although the upper-bound confidence interval of .63 ofthe kindergarten value overlaps with the lower-bound, .46, of the Grade 1result), and shared environment was significant at .40 whereas it was notnear the end of Grade 1. Significance aside, it is possible that as childrenprogress through school genes rather than factors that contribute totwins� shared environment, such as home and school, come to exert amajor influence on differential levels of spelling. Note, however, that thespelling tests and the scoring methods in the two phases were different. Inkindergarten, we employed a list comprised of single-syllable words andnonwords, with a scoring system that valued phonemic accuracy such thatincorrect but phonemically plausible responses were given part scores. InGrade 1, we used the WRAT, and scored each word as correct orincorrect, with no allowance for partial accuracy. Thus it is not clear if thedevelopmental pattern of genetic and environmental influence we reporthere, even if reliable, reflects genuine age-based change or test differences.It is worth noting, however, that shared environment influences on cog-nitive variables tend to decline, and genetic influences increase, as childrengrow older (McGue, Bouchard, Iacono, & Lykken, 1993).
In support of an increasing dominance of genetic influence over sharedenvironment from kindergarten to the first grade, we note that for wordand nonword reading, spelling, and reading comprehension in Grade 1the pattern of effects for the US and Australian samples was very similar,with highly overlapping confidence intervals, in marked contrast to thesituation in kindergarten reported in Samuelsson et al. (this volume). Asreported in that paper, there was evidence of lower heritability and highershared environment influence on reading and spelling in the US samplethan in the Australian one at the earlier grade (kindergarten). In thepresent study we found the same pattern for the subsamples of Australianand U.S. kindergarten twins that were subsequently tested at the end offirst grade. In these kindergarten subsamples, genetic influence on spellingin particular was higher in the Australian sample. Samuelsson et al.suggested that the generally more restricted and variable literacyinstruction available in Colorado kindergartens may limit the degree towhich genes can influence response to instruction, in comparison to thesituation in New South Wales, which apparently challenges children moreconsistently and may therefore press into service more genetically-drivenprocesses. If true, it appears that this effect has ‘‘washed out’’ a year later,
95LONGITUDINAL TWIN STUDY OF EARLY LITERACY DEVELOPMENT
presumably in the face of increasing intensity and consistency of teachingin the Colorado first grade classes.
Petrill et al. (this volume) reported very similar results from his firsttesting wave to ours at kindergarten for word and nonword readingaccuracy, when compared to our measures of word and nonword readingefficiency for the Colorado sample (see Samuelsson et al., for furtherdiscussion of these results). However, Petrill et al. noted only a modestincrease in genetic influence on word reading accuracy in their secondwave of testing at nearly the same mean age as our Colorado sampleat the end of first grade, and practically no increase in heritability fornonword reading accuracy. However, Petrill et al. also administered ameasure of reading comprehension to a subsample of his twins at the firsttesting wave with sufficient word reading skills to complete the test, and toall the twins in his second testing wave. He found a substantial increase ingenetic influence for this measure, from h2 = .50 in wave 1 to h2 = .76 inwave 2 that was consistent with the developmental pattern we found forall of our reading and spelling measures from the end of kindergarten tothe end of first grade.
Reading comprehension, measured with the same test used by Petrillet al. (this volume), but for the first time in this study near the end of firstgrade, was (a) substantially heritable, (b) phenotypically correlated withword reading to a high level, and (c) shown to depend on the same genes asword reading (see Petrill et al., this volume, for a very similar result,including a heritability estimate of .76, virtually identical to that of both theAustralian andU.S. samples). This pattern of reading comprehension levelsbeing substantially dependent on word-level skills may change in laterschool years. Keenan et al. (2006), also using a twin sample, have shownthat among school-aged children listening comprehension makes an inde-pendent genetic contribution to reading comprehension afterword reading,and together genetic influences on word reading and listening comprehen-sion account for all the genetic influence on reading comprehension.
Our measures of phonological awareness, Elision and Blending fromthe CTOPP, had only modest heritability levels at the end of first grade,and these could not be regarded as reliable (Table 2). When modelled as alatent trait, neither genetic influence nor shared environment influencewas significant. Nonshared environment was a significant and substantialinfluence. This contrasts with both previous phases of the study, whengenetic influence on a phonological awareness latent trait was above.60. A similar developmental shift from strong genetic to strongenvironmental influence in phonological awareness was also noted byPetrill et al. (this volume). We do not have a ready explanation for thischange in our results from kindergarten to first grade. The distributions
96 BRIAN BYRNE ET AL.

do not reveal ceiling effects, eliminating range restriction from consider-ation. The high nonshared environment effects on these tests are consis-tent with increasing levels of measurement error in our first grade sample(also found by Petrill et al. in their second testing wave for differentmeasures of phonological awareness), but our internal consistency mea-sure of Cronbach�s alpha was substantial in both cases (Elision, .91,Blending, .82). Elision correlated more substantially with other variablesthan did Blending (Table 3), so of the two tests it may hold more promiseas a measure of phonological awareness for children aged 7.
Of the three measures of verbal memory (WPPSI sentence memory,WRAML sound-symbol, and WRAML verbal learning), two showedsignificant genetic influence and all showed high non-shared environmentinfluence, perhaps indicative of high measurement error. Based on theircommon factor loading, we modelled the three measures as a verbalmemory latent trait that yielded a higher estimate of genetic influence(.56), but with a very broad confidence interval (.08, .87). This broadconfidence interval brackets the heritability estimate of .63 found for amore reliable verbal memory latent trait in kindergarten by Byrne et al.(2005), and .57 for a verbal memory latent trait in preschool reported bySamuelsson et al. (2005).
The source of the new genetic influence that comes into play for wordreading in the US sample in Grade 1, also found by Petrill et al. (thisvolume) for their second testing wave, is unknown. We did entertain thepossibility that genes that influence rapid naming may be part of thepicture because processes governing automatized name retrieval maybecome more involved as reading rates increase with age. However, aCholesky decomposition showed that the independent genetic influenceon Grade 1 reading was unaffected by including rapid naming in themodel. That is, in a model that entered the variables in the order ofkindergarten reading, rapid naming, Grade 1 reading, the independentpath, A3, to Grade 1 reading remained significant at .40. (Rapid namingwas subject to significant independent genetic influence in the model, butthat influence was not shared with Grade 1 reading.) Thus our hypothesiswas not confirmed. We hope that fuller investigation of this question,which will benefit from increased sample size, may help us identify thenature of this second genetic source on reading.
Summary and conclusions
In our Grade 1 sample, literacy levels, including word reading efficiency,nonword reading efficiency, reading comprehension, and spelling, were
97LONGITUDINAL TWIN STUDY OF EARLY LITERACY DEVELOPMENT
genetically determined to a large degree, as was rapid naming. Wedetected no reliable shared environment effects on these variables,suggesting that schools are not contributing significantly to differentiallevels of literacy at this age for these variables in these communities.However, apart from the restrictions just mentioned, caution needs to beexercised in considering this potentially controversial conclusion. Onereason is that we have modelled the variables assuming additive genetics.Should it turn out that this assumption is unfounded, for example thatdominance and/or epistasis are in operation, we may have underestimatedshared environment (Coventry & Keller, 2005; Keller & Coventry, 2005).Further, it is clear that intensive and well-designed classroom and pre-school interventions can make a difference for struggling readers (Elbro &Petersen, 2004; Hindson et al., 2005) and thus the absence of sharedenvironment effects in the present data does not mean that schools cannotmake a difference. And, as reported earlier, Harlaar et al. (2005) doobserve modest but reliable shared environment effects in data based onalmost 4000 sets of UK twins of the same age as our sample at the end offirst grade. Recall from the Introduction, however, that we had shownshared environment effects in kindergarten reading but that they werecontinuous with the shared environment prior to school, and that no neweffects came on stream in kindergarten.
Multivariate analyses showed that (a) reading comprehension andword reading are affected by the same genes, and (b) there is both geneticcontinuity and genetic change in word reading as children move fromkindergarten to Grade 1, although the change was restricted to the USsample. We hope that future research will determine if the first of theseremains the case as children progress into higher grades. We also hopethat future research will shed light on the second finding, helping usnarrow the interpretation of the genetic sources. In future reports we willbe able to cover Grade 2 results from the same sample, filling out thepicture of the course of literacy growth as it is governed by genetic andenvironmental processes.
Acknowledgements
The research was supported by the Australian Research Council(A79906201), the National Institute for Child Health and HumanDevelopment (HD27802 and HD38526), the Research Council ofNorway (154715/330), the Swedish Research Council (345-2002-3701),and Stavanger University. We are grateful for support from the Austra-lian Twin Registry and the Australian Multiple Birth Association. We
98 BRIAN BYRNE ET AL.

also thank our testers: in Australia, Frances Attard, Nicole Church,Marreta Coleman, Cara Newman; in Norway, Bjarte Furnes; inSweden, Inger Fridolfsson; in the USA, Kim Corley, Rachael Cole,Barb Elliott, Kari Gilmore, Angela Villella, and Ingrid Simece.
References
Adams, W., & Sheslow, D. (1990). Wide range assessment of memory and learning.Wilmington, Delaware: Jastak Associates.
Bates, T. C., Castles, A., Luciano, M., Wright, M., Coltheart, M., & Martin, N. G.
Genetic and environmental bases of reading and spelling: A unified genetic dualroute model. Reading and Writing: An Interdisciplinary Journal (in press).
Bishop, D. V. M. (1989). Test for reception of grammar (TROG) (2nd ed.). Abingdon,
UK: Medical Research Council.Byrne, B., Delaland, C., Fielding-Barnsley, R., Quain, P., Samuelsson, S., Hoien, T.,
Corley, R., DeFries, J. C., Wadsworth, S., Willcutt, E. G., & Olson, R. K. (2002).Longitudinal twin study of early reading development in three countries:
Preliminary results. Annals of Dyslexia, 52, 49–73.Byrne, B., Wadsworth, S., Corley, R., Samuelsson, S., Quain, P., DeFries, J. C.,
Willcutt, E. G., & Olson, R. K. (2005). Longitudinal twin study of early literacy
development: Preschool and kindergarten phases. Scientific Studies of Reading, 9,219–235.
Byrne, B., Olson, R. K., Samuelsson, S., Wadsworth, S., Corley, R., DeFries, J. C., &
Willcutt, E. G. (2006). Genetic and environmental influences on early literacy.Journal of Research in Reading, 29, 33–49.
Cope, N., Harold, D., Hill, G., Moskvina, V., Stevenson, J., Holmans, P., Owen, M.
J., O�Donovan, M. C., & Williams, J. (2005). Strong evidence that KIAA0319 onchromosome 6p is a susceptibility gene for developmental dyslexia. AmericanJournal of Human Genetics, 76, 581–591.
Coventry, W. L., & Keller, M. C. (2005). Exploring the extent of parameter bias in the
Classical Twin Design: A comparison of parameter estimates from the ExtendedTwin-Family and Classical Twin Designs. Twin Research and Human Genetics, 8,214–223.
Curtis, M. E. (1980). Development of components of reading skill. Journal ofEducational Psychology, 72, 656–669.
Deffenbacher, K. E., Kenyon, J. B., Hoover, D. M., Olson, R. K., Pennington, B. F.,
DeFries, J. C., & Smith, S. D. (2004). Refinement of the 6P21.3 QTL influencingdyslexia: Linkage and association analyses. Human Genetics, 115, 128–138.
Elbro, C., & Petersen, D. K. (2004). Long-term effects of phoneme awareness and lettersound training: An intervention study with children at risk for dyslexia. Journal of
Educational Psychology, 96, 660–670.Fisher, S. E., & DeFries, J. C. (2002). Developmental dyslexia: genetic dissection of a
complex cognitive trait. Nature Reviews Neuroscience, 3, 767–780.
Foulin, J. N. (2005). Why is letter-name knowledge such a good predictor of learning toread? Reading & Writing: An Interdisciplinary Journal, 18, 129–155.
99LONGITUDINAL TWIN STUDY OF EARLY LITERACY DEVELOPMENT

Gayan, J., & Olson, R. K. (2001). Genetic and environmental influences onorthographic and phonological skills in children with reading disabilities. Develop-mental Neuropsychology, 20(2), 487–511.
Gayan, J., & Olson, R. K. (2003). Genetic and environmental influences on individual
differences in printed word recognition. Journal of Experimental Child Psychology,84, 97–123.
Hannula-Jouppi K., Kaminen-Ahola N., Taipale M., Eklund R., Nopola-Hemmi J.,
Kaariainen H., & Kere J. (2005). The axon guidance receptor gene ROBO1 is acandidate gene for developmental dyslexia. Public Library of Science: Genetics, 1(4)e50, 0467–0474.
Harlaar, N., Spinath, F. M., Dale, P. S., & Plomin, R (2005). Genetic influences on earlyword recognition abilities and disabilities: A study of 7-year-old twins. Journal ofChild Psychology and Psychiatry, 46, 373–384.
Hindson, B. A., Byrne, B., Fielding-Barnsley, R., Newman, C., Hine, D. W., &Shankweiler, D. (2005). Assessment and early instruction of preschool children atrisk for reading disability. Journal of Educational Psychology, 97, 687–704.
Hoover, W. A., & Gough, P. B. (1990). The simple view of reading. Reading & Writing:
An Interdisciplinary Journal, 2, 127–160.Jastak, S., & Wilkinson, G. S. (1984). The wide range achievement test-revised:admin-
istration manual. Wilmington, DE: Jastak Associates, Inc.
Juel, C. (1988). Learning to read and write: A longitudinal study of 54 children fromfirst through fourth grades. Journal of Educational Psychology, 80, 437–447.
Keenan, J. M., Betjemann, R., Wadsworth, S. J., DeFries, J. C., & Olson, R. K. (2006).
Genetic and environmental influences on reading and listening comprehension.Journal of Research in Reading, 29, 75–91.
Keller, M. C., & Coventry, W. L. (2005). Quantifying and addressing parameterindeterminacy in the Classical Twin Design. Twin Research and Human Genetics, 8,
201–213.McGue, M., Bouchard, T. J. Jr., Iacono, W. G., & Lykken, D. T. (1993). Behavioral
genetics of cognitive ability: A lifespan perspective. In R. Plomin & G. E. McClearn
(Eds.), Nature, nurture, and psychology (pp. 59–76). Washington, DC: AmericanPsychological Association.
Mehta, P. D., Foorman, B. R., Branum-Martin, L., & Taylor, W. P. (2005). Literacy as
a unidimensional multivlevel construct: Validation,sources of influence, andimplications in a longitudinal study in Grades 1 to 4. Scientific Studies of Reading,9, 85–116.
Meng, H., Smith, S. D., Hager, K., Held, M., Liu, J., Olson, R. K., Pennington, B. F.,DeFries, J. C., Gelernter, J., O�Reilly-Pol, T., Somlo, S., Skudlarski, P., Shaywitz,S. F., Shaywitz, B. A., Marchione, K., Wang, Y., Paramasivam, M., LoTurco, J. J.,Page, G. P., & Gruen, J. R. (2005). DCDC2 is associated with reading disability and
modulates neuronal development in the brain. Proceedings of the National Academyof Sciences, 102, 17053–17058.
Morrison, F. J., Griffith, E. M., & Alberts, D. M. (1997). Nature–nurture in the
classroom: Entrance age, school readiness, and learning in children. DevelopmentalPsychology, 33, 254–262.
Neale M. C., Boker S. M., Xie G., & Maes H. H. (2002). Mx: Statistical Modeling. VCU
Box 900126, Richmond, VA 23298: Department of Psychiatry. 6th Edition.Olson, R. K., & Byrne, B. (2005). Genetic and environmental influences on reading and
language ability and disability. In H. Catts & A. Kamhi (Eds.), The connections
100 BRIAN BYRNE ET AL.

between language and reading disabilities (pp. 173–200). Mahwah, NJ: LaurenceErlbaum Associates.
Olson, R. K., Forsberg, H., & Wise, B. (1994). Genes, environment, and thedevelopment of orthographic skills. In V.W. Berninger (Ed.), The varieties of
orthographic knowledge I: Theoretical and developmental issues (pp. 27–71).Dordrecht, The Netherlands: Kluwer Academic Publishers.
Olson, R. K., Wise, B., Conners, F., Rack, J., & Fulker, D. (1989). Specific deficits in
component reading and language skills: Genetic and environmental influences.Journal of Learning Disabilities, 22, 339–348.
Pennington, B. F., & Olson, R. K. (2005). Genetics of dyslexia. In M. Snowling &
C. Hulme (Eds.), The science of reading: A handbook (pp. 453–472). Oxford:Blackwell Publishing.
Perfetti, C. A., Landi, N., & Oakhill, J. (2005). The acquisition of reading comprehen-
sion skill. In M. Snowling & C. Hulme (Eds.), The science of reading: A handbook(pp. 227–247). Oxford: Blackwell.
Petrill, S. A., Deater-Deckard, K., Schatschneider, C., & Davis, C. (2005). Measuredenvironmental influences on early reading: Evidence from an adoption study.
Scientific Studies of Reading, 9, 237–260.Petrill, S. A., Deater-Deckard, K., Thompson, L. A., & DeThorne, L. S. (2006).
Reading skills in early readers: Genetic and shared environmental influences.
Journal of Learning Disabilities, 39, 48–55.Petrill, S. A., Deater-Deckard, K., Thompson, L. A., DeThorne, L. S., & Schatschne-
ider, C. (2006). Genetic and environmental effects of serial naming and phonological
awareness on early reading outcomes, Journal of Educational Psychology, 98, 112–121.
Petrill, S. A., Deater-Deckard, K., Thompson, L. A., Schatschneider, C., & DeThorne,L. S. (in press). Reading and Writing: An Interdisciplinary Journal.
Plomin, R., DeFries, J. C., McClearn, G. E., & McGuffin, P. (2001). Behavioral genetics.(4th ed.). New York: Worth.
Samuelsson, S., Byrne, B., Quain, P., Wadsworth, S., Corley, R., DeFries, J. C.,
Willcutt, E. G., & Olson, R. K. (2005). Environmental and genetic influences onprereading skills in Australia, Scandinavia, and the United States. Journal ofEducational Psychology, 97, 705–722.
Samuelsson, S., Olson, R. K., Wadsworth, S., Corley, R., DeFries, J. C., Willcutt, E.,Hulslander, J., & Byrne, B. (in press). Genetic and environmental influences on pre-reading skills and early reading and spelling development: A comparison between
the United States, Australia, and Scandinavia. Reading and Writing: An Interdis-ciplinary Journal.
Schumacher, J., Anthoni, H., Dahdouh, F., Konig, I. R., Hillmer, A. M., Kluck, N.,Manthey, M., Plume, E., Warnke, A., Remschmidt, H., Hulsmann, J., Cichon, S.,
Lindgren, C. M., Propping, P., Zucchelli, M., Ziegler, A., Peyrard-Janvid, M.,Schulte-Korne, G., Nothen, M. M., & Kere, J (2006). Strong genetic evidence ofDCDC2 as a susceptibility gene for dyslexia. American Journal of Human Genetics,
78, 52–62.Taipale, M., Kaminen, N., Nopola-Hemmi, J., Haltia, T., Myllyluoma, B., Lyytinen,
H., Muller, K., Kaaranen, M., Lindsberg, P. J., Hannula-Jouppi, K., & Kere, J.
(2003). A candidate gene for developmental dyslexia encodes a nuclear tertatrico-peptide repeat domain protein dynamically regulated in the brain. Proceedings of theNational Academy of Sciences, 20, 11553–11558.
101LONGITUDINAL TWIN STUDY OF EARLY LITERACY DEVELOPMENT
Thomas, C. J. (1905). Congenital word-blindness and its treatment. Ophthalmoscope, 3,380–385.
Torgesen, J., Wagner, R., & Rashotte, C. A. (1999). A test of word reading efficiency(TOWRE). Austin, Texas: PRO-ED.
Wadsworth, S. J., Corley, R. P., Hewitt, J. K., Plomin, R., & DeFries, J. C. (2002).Parent-offspring resemblance for reading performance at 7:12, and 16 years of age inthe Colorado Adoption Project. Journal of Child Psychology and Psychiatry and
Allied Disciplines, 43(6), 769–774.Wagner, R. K., Torgesen, J. K., & Rashotte, C. A. (1999). The comprehensive test of
phonological processes (CTOPP). Austin, Texas: PRO-ED.
Wechsler, D. (1989). Manual for the wechsler preschool and primary scale of intelligence-revised. New York: Psychological Corporation.
Woodcock, R. W. (1989). Woodcock reading mastery tests. Circle Pines, MN: American
Guidance Service.
Address for correspondence: Brian Byrne, School of Psychology, University of New England,Armidale, NSW, 2351, AustraliaPhone: 61-26773-2370; Fax: 61-26773-3820; E-mail: [email protected]
102 BRIAN BYRNE ET AL.