longitudinal analysis of klamath river · pdf filetechnical memorandum: longitudinal analysis...
TRANSCRIPT

TECHNICAL MEMORANDUM:
LONGITUDINAL ANALYSIS OF KLAMATH RIVER PHYTOPLANKTON DATA 2001-2004
PREPARED FOR THE
YUROK TRIBE ENVIRONMENTAL PROGRAM
BY
KIER ASSOCIATES, FISHERIES AND WATERSHED PROFESSIONALS BLUE LAKE AND ARCATA, CALIFORNIA
AND
AQUATIC ECOSYSTEM SCIENCES LLC
ASHLAND, OREGON
SEPTEMBER, 2006
TECHNICAL MEMORANDUM:
LONGITUDINAL ANALYSIS OF KLAMATH RIVER PHYTOPLANKTON DATA 2001-2004
PREPARED FOR THE
YUROK TRIBE ENVIRONMENTAL PROGRAM
BY
JACOB KANN, PH.D AQUATIC ECOSYSTEM SCIENCES LLC
ASHLAND, OREGON
AND
ELI ASARIAN KIER ASSOCIATES, FISHERIES AND WATERSHED PROFESSIONALS
BLUE LAKE AND ARCATA, CALIFORNIA
SEPTEMBER 2006
Citation: Kann, J and E. Asarian. 2006. Technical Memorandum: Longitudinal Analysis of Klamath River
Phytoplankton Data 2001-2004. Prepared by Kier Associates and Aquatic Ecosystem Sciences for the Yurok Tribe Environmental Program, Klamath, California. 36 pp.
Cover photo credits: Michael Hentz and Eli Asarian

CONTENTS
INTRODUCTION …………………………………………………….…………. METHODS ……………………………………………………………….….…….
Field and laboratory methods …………………......……………………………….
Data analysis approach………………………………………………………..…….. RESULTS…………………………………………………………………………….
Longitudinal analysis ………....…..……………………………………………….... Biovolume of total and nitrogen-fixing phytoplankton………………………….... Chlorophyll a………………………………………………………………..……. Major taxonomic groups…………………………………………………….…….
Seasonal trends……………………………………………………….……………… Major taxonomic groups………………………………………………….……… Reservoir samples at various depths ………………………………..……………. Species composition………………………………………………………………
SUMMARY/CONCLUSIONS…………………………………………………….. LITERATURE CITED…………………………………………………………….. ELECTRONIC APPENDICES ON CD A. Spreadsheet of PacifiCorp 2001-2004 phytoplankton data.
1 1
1
4 5
5 5 7 12
1216 16 25 33 36

KIER ASSOCIATES/AQUATIC ECOSYSTEM SCIENCES – ANALYSIS OF KLAMATH RIVER PHYTOPLANKTON, 2001-2004
1
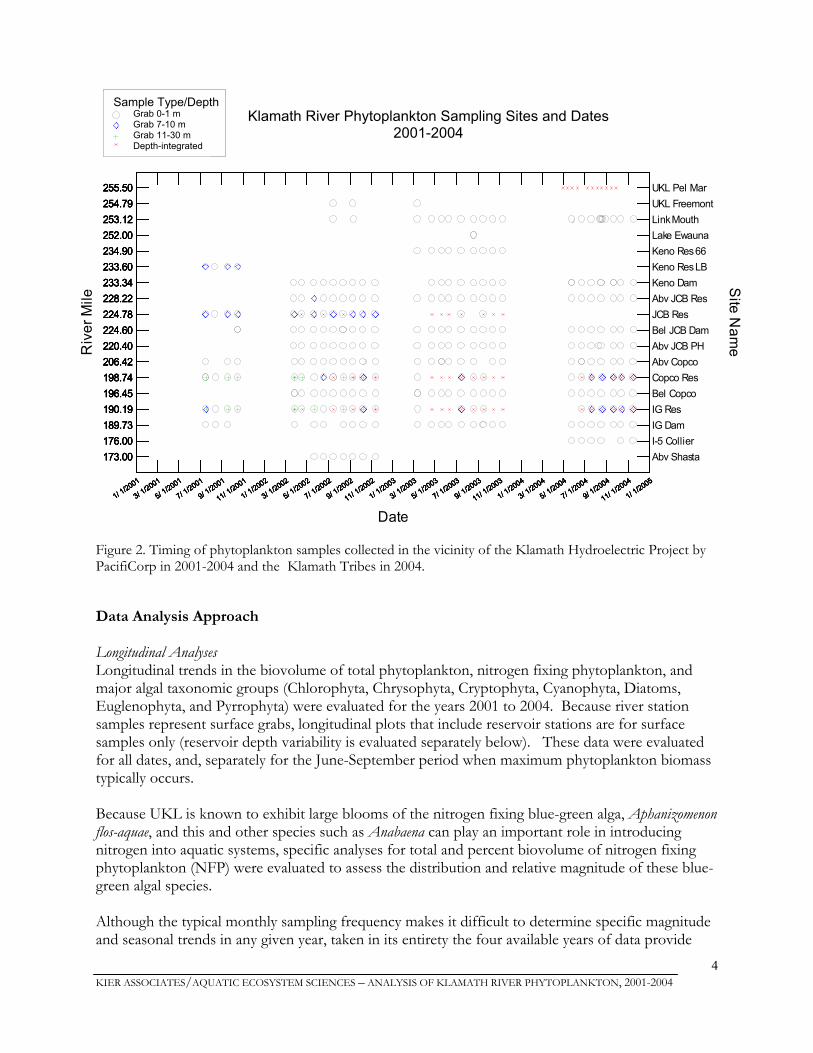
INTRODUCTION The Klamath Hydroelectric Project (KHP) in southern Oregon and northern California is currently undergoing the Federal Energy Regulatory Commission (FERC) relicensing process. This process requires, among other things, that the two states make a finding, under Section 401 of the federal Clean Water Act, that project operations will comply with the states’ water quality standards and other aquatic resource protection requirements. As part of these processes, PacifiCorp (the KHP operators) conducted a water quality monitoring program to help determine KHP effects on Klamath River water quality. This program included a phytoplankton sampling component from 2001-2005. The complete set of 2001-2004 phytoplankton data were posted on PacifiCorp’s website in October 2004; 2005 data have not yet been released. Raymond (2005) described PacifiCorp’s phytoplankton sampling methodology and presented some summary statistics for the 2001-2004 data. Kann (2006) provided a detailed longitudinal analysis of the PacifiCorp 2001-2004 data for toxigenic Microcystis aeruginosa. However, to date, PacifiCorp’s 2001-2004 dataset has not been comprehensively analyzed for general phytoplankton trends in the Klamath River system. The purpose of this memo is to analyze and summarize PacifiCorp’s 2001-2004 dataset, including the description of seasonal, annual, and longitudinal patterns in algal species composition and biovolume. Due to the importance of Upper Klamath Lake (UKL) to Klamath River nutrient and algal dynamics, phytoplankton data collected by the Klamath Tribes near the outlet of UKL are also utilized to provide a context for comparison. METHODS Field and Laboratory Methods A total of 22 sites on the Klamath River and several of its tributaries were sampled for phytoplankton between the outlet of UKL (river mile 254.79) and the Klamath River’s confluence with the Shasta River (river mile 173). Locations of PacifiCorp mainstem sampling sites are shown in Figure 1 and Table 1. In 2002 only, samples were collected in Spencer Creek, Shovel Creek, Fall Creek, and the Shasta River; tributary data are not analyzed herein. Sampling was performed by E&S Environmental Chemistry (Corvallis, Oregon) and laboratory analyses for chlorophyll a and phytoplankton species biovolume and abundance were performed by Aquatic Analysts (White Salmon, WA). Samples were collected approximately monthly from 2001-2004, with the number of sample stations and length of the sampling season varying between years (Figure 2). The start of the monitoring season varied from March in 2002-2003 to July in 2001, and monitoring ended each year in October or November. Raymond (2005) provides the following description of the sampling methodology:
“Samples were collected from approximately 0.5 m depth at the river and stream sites, and from 0.5 to 1.0 m depth in the reservoirs at sites near the dams. In addition, an integrated sample of the top 10 m of water in Copco and Iron Gate reservoirs was collected by lowering a weighted tube to 10 m, clamping off the top, retrieving the tube and draining it into a container. The contents of the container were mixed and dispensed into sample bottles. Approximately every 10th sample, but at least one sample in every sample set, was duplicated for quality control purposes.”

KIER ASSOCIATES/AQUATIC ECOSYSTEM SCIENCES – ANALYSIS OF KLAMATH RIVER PHYTOPLANKTON, 2001-2004
2
The Klamath Tribes of Oregon collected phytoplankton samples near the outlet of Upper Klamath Lake at Pelican Marina (river mile 255.50) in the year 2004 only at bi-weekly intervals. Samples were depth-integrated across the entire 1.5-2.5m water column and were processed by the same laboratory as PacifiCorp’s samples (Klamath Tribes Upper Klamath Lake Phytoplankton Data; 1990-1999 and 2004-2005- Electronic data file)
Figure 1. Phytoplankton samples collected in 2001-2004 in the vicinity of the Klamath Hydroelectric Project, by PacifiCorp and the Klamath Tribes. Figure adapted from Raymond (2005).
KR25550

KIER ASSOCIATES/AQUATIC ECOSYSTEM SCIENCES – ANALYSIS OF KLAMATH RIVER PHYTOPLANKTON, 2001-2004
3
Table 1. Locations where PacifiCorp and the Klamath Tribes collected phytoplankton samples in the vicinity of the Klamath Hydroelectric Project in the years 2001-2004. Table adapted from Raymond (2005).
Data Collector
Site ID River Mile
Latitude Longitude Site Name
PacifiCorp KR17300 173.00 41.8362 -122.5825 Klamath River above Shasta River
PacifiCorp KR17600 176.00 41.8301 -122.5937 Klamath River at I-5 Rest Area
PacifiCorp KR18973 189.73 41.9310 -122.4423 Iron Gate dam Outflow
PacifiCorp KR19019 190.19 41.9342 -122.4350 Iron Gate reservoir near dam
PacifiCorp KR19645 196.45 41.9731 -122.3652 Copco 2 dam Outflow
PacifiCorp KR19874 198.74 41.9794 -122.3333 Copco reservoir
PacifiCorp KR20642 206.42 41.9721 -122.2016 Klamath River upstream of Shovel Creek
PacifiCorp KR22040 220.40 42.0932 -122.0713 Klamath River upstream, of J.C. Boyle Powerhouse
PacifiCorp KR22460 224.60 42.1217 -122.0494 Klamath River below J.C. Boyle dam
PacifiCorp KR22478 224.78 42.1228 -122.0470 J.C. Boyle reservoir at Log Boom
PacifiCorp KR22600 226.00 42.1351 -122.0313 J.C. Boyle reservoir at Hwy 66 Bridge
PacifiCorp KR22822 228.22 42.1499 -122.0154 Klamath River above J.C. Boyle reservoir
PacifiCorp KR23334 233.34 42.1353 -121.9489 Keno dam Outflow
PacifiCorp KR23360 233.60 42.1345 -121.9482 Keno reservoir at Log Boom
PacifiCorp KR23490 234.90 42.1222 -121.9194 Klamath River at Keno Bridge (Hwy 66)
PacifiCorp KR25200 252.00 - - Lake Ewuana (coordinates not provided, river mile approximated from general location)
PacifiCorp KR25312 253.12 42.2188 -121.7884 Link River at Mouth
PacifiCorp KR25479 254.79 42.2383 -121.8053 Upper Klamath Lake at Fremont St Bridge Klamath Tribes KR25550 255.50 Upper Klamath Lake at Pelican Marina
PacifiCorp SP00 0 42.1528 -122.0325 Spencer Creek near Mouth PacifiCorp SR00 0 41.9724 -122.2027 Shovel Creek near Mouth
PacifiCorp FA00 0 41.9681 -122.3653 Fall Creek near Mouth
PacifiCorp SH01 1 41.8231 -122.5944 Shasta River near Mouth
KIER ASSOCIATES/AQUATIC ECOSYSTEM SCIENCES – ANALYSIS OF KLAMATH RIVER PHYTOPLANKTON, 2001-2004
4
Figure 2. Timing of phytoplankton samples collected in the vicinity of the Klamath Hydroelectric Project by PacifiCorp in 2001-2004 and the Klamath Tribes in 2004. Data Analysis Approach Longitudinal Analyses Longitudinal trends in the biovolume of total phytoplankton, nitrogen fixing phytoplankton, and major algal taxonomic groups (Chlorophyta, Chrysophyta, Cryptophyta, Cyanophyta, Diatoms, Euglenophyta, and Pyrrophyta) were evaluated for the years 2001 to 2004. Because river station samples represent surface grabs, longitudinal plots that include reservoir stations are for surface samples only (reservoir depth variability is evaluated separately below). These data were evaluated for all dates, and, separately for the June-September period when maximum phytoplankton biomass typically occurs. Because UKL is known to exhibit large blooms of the nitrogen fixing blue-green alga, Aphanizomenon flos-aquae, and this and other species such as Anabaena can play an important role in introducing nitrogen into aquatic systems, specific analyses for total and percent biovolume of nitrogen fixing phytoplankton (NFP) were evaluated to assess the distribution and relative magnitude of these blue-green algal species. Although the typical monthly sampling frequency makes it difficult to determine specific magnitude and seasonal trends in any given year, taken in its entirety the four available years of data provide
PCorp Phyto Sampling Dates and Sites, gray=0-1m, blue=2-10m, green=11-30m, red=depth integrated
1/ 1/2001
3/ 1/2001
5/ 1/2001
7/ 1/2001
9/ 1/2001
11/ 1/2001
1/ 1/2002
3/ 1/2002
5/ 1/2002
7/ 1/2002
9/ 1/2002
11/ 1/2002
1/ 1/2003
3/ 1/2003
5/ 1/2003
7/ 1/2003
9/ 1/2003
11/ 1/2003
1/ 1/2004
3/ 1/2004
5/ 1/2004
7/ 1/2004
9/ 1/2004
11/ 1/2004
1/ 1/2005
Date
173.00176.00189.73190.19196.45198.74206.42220.40224.60224.78228.22233.34233.60234.90252.00253.12254.79255.50
Riv
er M
ile
Abv ShastaI-5 CollierIG DamIG ResBel CopcoCopco ResAbv CopcoAbv JCB PHBel JCB DamJCB ResAbv JCB ResKeno DamKeno Res LBKeno Res 66Lake EwaunaLink MouthUKL FreemontUKL Pel Mar
Site N
ame
1/ 1/2001
3/ 1/2001
5/ 1/2001
7/ 1/2001
9/ 1/2001
11/ 1/2001
1/ 1/2002
3/ 1/2002
5/ 1/2002
7/ 1/2002
9/ 1/2002
11/ 1/2002
1/ 1/2003
3/ 1/2003
5/ 1/2003
7/ 1/2003
9/ 1/2003
11/ 1/2003
1/ 1/2004
3/ 1/2004
5/ 1/2004
7/ 1/2004
9/ 1/2004
11/ 1/2004
1/ 1/2005
173.00176.00189.73190.19196.45198.74206.42220.40224.60224.78228.22233.34233.60234.90252.00253.12254.79255.50
Klamath River Phytoplankton Sampling Sites and Dates
2001-2004 Grab 0-1 m Grab 7-10 m Grab 11-30 m Depth-integrated
Sample Type/Depth

KIER ASSOCIATES/AQUATIC ECOSYSTEM SCIENCES – ANALYSIS OF KLAMATH RIVER PHYTOPLANKTON, 2001-2004
5
adequate resolution to evaluate general seasonal and longitudinal patterns in algal species composition and biovolume. The robustness of longitudinal trends is enhanced by combining the data from all years and evaluating each sample station, with stations arranged in longitudinal (downstream-upstream) order (Figures 3-6 and Tables 2 and 3). The Klamath Tribes phytoplankton data from UKL (UKL Pel Mar in Figure 2 above) are biweekly but are only available for 2004. However, because the predominance of high blue-green algal biomass is well documented in UKL (Kann 1998; Kann and Welch 2005), this station is included below as a representation of phytoplankton conditions at the outlet of UKL. UKL chlorophyll a data were available for 2001-2004 and are shown in Figure 5. Seasonal Analyses Seasonal trends in surface samples (Figures 7-11) and at varying depths for reservoir stations (Figures 12-14) were evaluated for major taxonomic groups. Seasonal trends in surface samples for dominant phytoplankton species are shown in Figures 15-19. RESULTS Longitudinal Analysis Biovolume of Total and Nitrogen Fixing Phytoplankton Analysis of all dates Box plots of total phytoplankton biovolume over all years, combined for all sample dates, show a declining longitudinal trend in biovolume from the headwaters at UKL to the station above JC Boyle powerhouse (RM 220.4), with the greatest median (red line in Figure 3) decreases occurring between UKL (RM 255.5) and Link Mouth (RM 253.12), between Keno Dam (RM 233.4) and above JC Boyle Reservoir (RM 228.22) and then, again, between below JC Boyle Dam (RM 224.6) and above the JC Boyle powerhouse (Figure 3; top panel). Upper quartile (UQ) values (top line of the box indicating the upper 25% of measurements) show a similar trend through the above JC Boyle reach, but then increase in JC Boyle Reservoir (RM 224.78). Low values in samples above the JC Boyle powerhouse are highly influenced by bypass operations and often consist predominantly of spring water inflow. Between RM 220.4 (Abv JCB PH) and Abv Copco (RM 206.42) releases from JC Boyle reenter the river at the powerhouse increasing the median total biovolume above Copco to levels similar to those below JC Boyle Dam (Figure 3: top panel). However, the UQ value at the above Copco station was substantially lower than both the JC Boyle Reservoir station and the below JC Boyle Dam station (7x and 2.3x lower, respectively; Table 2). As discussed in Asarian and Kann (2006), flows and concentrations at this location are influenced by hydropower peaking operations from the J.C. Boyle Powerhouse. From this point downstream, both median and UQ total biovolume showed an overall increase as the river traveled through the Copco/Iron Gate reservoir complex (Figure 3; Table 2). The median Copco and Iron Gate Reservoir values were 2-3 times greater than the median value above Copco, and the UQ values were 9.2 and 3.6 times higher, respectively. Below Iron Gate Reservoir, total phytoplankton biovolume decreases but remains elevated compared to that above Copco, where the upper quartile was 3 times higher and the median 2 times higher (Table 2). Continuing downstream from Iron Gate to Interstate 5 and above the Shasta River confluence (Figure 3: RM 173/176) levels returned to values similar to those above Copco station.

KIER ASSOCIATES/AQUATIC ECOSYSTEM SCIENCES – ANALYSIS OF KLAMATH RIVER PHYTOPLANKTON, 2001-2004
6
Figure 3. Total phytoplankton biovolume (top panel), total biovolume of nitrogen-fixing species (middle panel), and percent biovolume of nitrogen fixing species (bottom panel) of surface samples at major Klamath River sampling sites for the years 2001-2004, all months. The line inside each box is the median and the edges of each box are the 25th and 75th percentiles. The whiskers represent data points beyond 1.5 times the interquartile (75th-25th) range, while individual points shown in black are outliers.
Total and Nitrogen-Fixing Phytoplankton Biovolume, Klamath River 2001-2004 (all dates)
173/176189.73
190.19196.45
198.74206.42
220.40224.60
224.78228.22
233.34234.90
253.12255.50
0.0
0.1
1.0
10.0
100.0
Tota
l Bio
volu
me
(mm
3 /L)
173/176189.73
190.19196.45
198.74206.42
220.40224.60
224.78228.22
233.34234.90
253.12255.50
0.0
0.1
1.0
10.0
100.0
173/176189.73
190.19196.45
198.74206.42
220.40224.60
224.78228.22
233.34234.90
253.12255.50
0.0
0.1
1.0
10.0
100.0
173/176189.73
190.19196.45
198.74206.42
220.40224.60
224.78228.22
233.34234.90
253.12255.50
0.00
0.01
0.10
1.00
10.00
100.00
Nitr
ogen
-Fix
er B
i ovo
lum
e (m
m3 /L
)
173/176189.73
190.19196.45
198.74206.42
220.40224.60
224.78228.22
233.34234.90
253.12255.50
0.00
0.01
0.10
1.00
10.00
100.00
Nitr
ogen
-Fix
er B
i ovo
lum
e (m
m3 /L
)
173/176189.73
190.19196.45
198.74206.42
220.40224.60
224.78228.22
233.34234.90
253.12255.50
0.00
0.01
0.10
1.00
10.00
100.00
173/176189.73
190.19196.45
198.74206.42
220.40224.60
224.78228.22
233.34234.90
253.12255.50
River Mile
0.010.020.030.040.050.060.070.080.090.0
100.0
Bio
volu
me
Nitr
ogen
-Fix
ers
( %)
173/176189.73
190.19196.45
198.74206.42
220.40224.60
224.78228.22
233.34234.90
253.12255.50
River Mile
0.010.020.030.040.050.060.070.080.090.0
100.0
Bio
volu
me
Nitr
ogen
-Fix
ers
( %)
173/176189.73
190.19196.45
198.74206.42
220.40224.60
224.78228.22
233.34234.90
253.12255.50
0.010.020.030.040.050.060.070.080.090.0
100.0
I-5 Shasta
IG DamIG Res
Bel Copco
Copco Res
Abv Copco
Abv JCB PH
Bel JCB Dam
JCB Res
Abv JCB Res
Keno Dam
Keno Res 66
Link Mouth
UKL Pel Mar

KIER ASSOCIATES/AQUATIC ECOSYSTEM SCIENCES – ANALYSIS OF KLAMATH RIVER PHYTOPLANKTON, 2001-2004
7
A separate evaluation of NFP species (Figure 3; middle panel) showed a trend similar to total biovolume, with a consistent decline from UKL to the above Copco station (RM 206.42), and then a substantial increase through the Copco/Iron Gate Reservoir complex. However, both median and UQ values for NFP species showed a greater relative increase than did total biovolume, where median and UQ values for Copco Reservoir were 20 and 515 times higher than for above Copco, and were 50 and 138 times higher for Iron Gate Reservoir than for above Copco (Figure 3: middle panel; Table 2). The most pronounced longitudinal trend occurred for the percent biovolume of NFP species (Figure 4: lower panel). Beginning at UKL, median percent NFP biovolume decreases from 94% down to <1% at the above Copco Station; and although the median then increased slightly in Copco Reservoir (to 5.8%), it rose to 29% in Iron Gate Reservoir. Further, the upper distribution of percent nitrogen fixers increased in both reservoirs to levels similar to those at UKL (the UQ was 89% and 80% for Copco and Iron Gate, respectively; Table 2). June-September analysis The basic trends for the June-September period followed that of the analysis using data from all dates; generally decreasing from UKL to above Copco and then increasing through the reservoir complex (Figure 4; Table 2). However, because June-September is the major growing season for blue-green algae blooms in the basin, the trends in biovolume and percent biovolume of NFP species tended to be more pronounced than the analysis using all dates (Figure 4; middle and bottom panels). For example, NFP biovolume and percent biovolume were 10.8 and 5.7 times higher in Copco Reservoir than they were at the above Copco station, and were 164 and 37 times higher in Iron Gate Reservoir The overall distribution of June-September reservoir values was higher than that for the analysis including all dates, and the UQ values increased substantially from the above Copco Station (Figure 4). Compared to an UQ NFP composition of 24.5% above Copco, reservoir UQ NFP percent composition values returned to levels closer to UKL, exceeding ~90% in both reservoirs (Table 2) Despite declining between UKL and above Copco Reservoir, all parameters (total biovolume, NFP biovolume, and NFP percent biovolume) showed a clear increase in the Copco/Iron Gate Reservoir complex during the June- September period. Chlorophyll a Although not as pronounced for the analysis including all dates (Figure 5; top panel), the June-September analysis (Figure 5; bottom panel) for chlorophyll confirms the trends shown above for total phytoplankton biomass. Distribution of chlorophyll a, which provides an approximation of algal biomass, showed the same basic decreasing trend between UKL and above Copco (RM 206.42), then increasing (both median and UQ values) as the river traveled through the reservoir complex.

KIER ASSOCIATES/AQUATIC ECOSYSTEM SCIENCES – ANALYSIS OF KLAMATH RIVER PHYTOPLANKTON, 2001-2004
8
Figure 4. Total phytoplankton biovolume (top panel), total biovolume of nitrogen-fixing species (middle panel), and percent biovolume of nitrogen fixing species (bottom panel) of surface samples at major Klamath River sampling sites for the years 2001-2004, June 1- September 30.
Total and Nitrogen-Fixing Phytoplankton Biovolume, Klamath River 2001-2004 (Jun-Sep)
173/176189.73
190.19196.45
198.74206.42
220.40224.60
224.78228.22
233.34234.90
253.12255.50
0.0
0.1
1.0
10.0
100.0
Tota
l Bio
volu
me
(mm
3 /L)
173/176189.73
190.19196.45
198.74206.42
220.40224.60
224.78228.22
233.34234.90
253.12255.50
0.0
0.1
1.0
10.0
100.0
173/176189.73
190.19196.45
198.74206.42
220.40224.60
224.78228.22
233.34234.90
253.12255.50
0.0
0.1
1.0
10.0
100.0
173/176189.73
190.19196.45
198.74206.42
220.40224.60
224.78228.22
233.34234.90
253.12255.50
0.00
0.01
0.10
1.00
10.00
100.00
Nitr
ogen
-Fix
er B
iovo
lum
e (m
m3 /L
)
173/176189.73
190.19196.45
198.74206.42
220.40224.60
224.78228.22
233.34234.90
253.12255.50
0.00
0.01
0.10
1.00
10.00
100.00
Nitr
ogen
-Fix
er B
iovo
lum
e (m
m3 /L
)
173/176189.73
190.19196.45
198.74206.42
220.40224.60
224.78228.22
233.34234.90
253.12255.50
0.00
0.01
0.10
1.00
10.00
100.00
173/176189.73
190.19196.45
198.74206.42
220.40224.60
224.78228.22
233.34234.90
253.12255.50
River Mile
0.010.020.030.040.050.060.070.080.090.0
100.0
Bio
volu
me
Nitr
ogen
-Fix
ers
( %)
173/176189.73
190.19196.45
198.74206.42
220.40224.60
224.78228.22
233.34234.90
253.12255.50
River Mile
0.010.020.030.040.050.060.070.080.090.0
100.0
Bio
volu
me
Nitr
ogen
-Fix
ers
( %)
173/176189.73
190.19196.45
198.74206.42
220.40224.60
224.78228.22
233.34234.90
253.12255.50
0.010.020.030.040.050.060.070.080.090.0
100.0
I-5 Shasta
IG DamIG Res
Bel Copco
Copco Res
Abv Copco
Abv JCB PH
Bel JCB Dam
JCB Res
Abv JCB Res
Keno Dam
Keno Res 66
Link Mouth
UKL Pel Mar
KIER ASSOCIATES/AQUATIC ECOSYSTEM SCIENCES – ANALYSIS OF KLAMATH RIVER PHYTOPLANKTON, 2001-2004
9
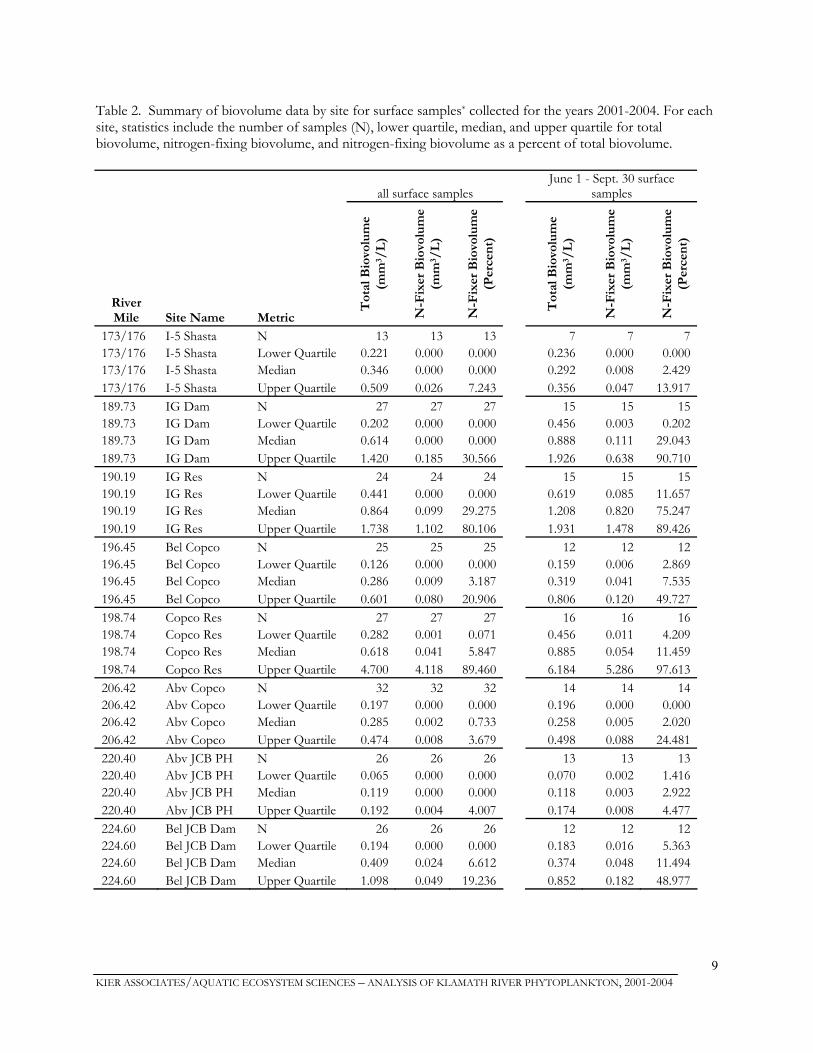
Table 2. Summary of biovolume data by site for surface samples* collected for the years 2001-2004. For each site, statistics include the number of samples (N), lower quartile, median, and upper quartile for total biovolume, nitrogen-fixing biovolume, and nitrogen-fixing biovolume as a percent of total biovolume.
all surface samples June 1 - Sept. 30 surface
samples
River Mile Site Name Metric
Tot
al B
iovo
lum
e (m
m3 /
L)
N-F
ixer
Bio
volu
me
(mm
3 /L)
N-F
ixer
Bio
volu
me
(Per
cent
)
Tot
al B
iovo
lum
e (m
m3 /
L)
N-F
ixer
Bio
volu
me
(mm
3 /L)
N-F
ixer
Bio
volu
me
(Per
cent
)
173/176 I-5 Shasta N 13 13 13 7 7 7 173/176 I-5 Shasta Lower Quartile 0.221 0.000 0.000 0.236 0.000 0.000173/176 I-5 Shasta Median 0.346 0.000 0.000 0.292 0.008 2.429173/176 I-5 Shasta Upper Quartile 0.509 0.026 7.243 0.356 0.047 13.917189.73 IG Dam N 27 27 27 15 15 15 189.73 IG Dam Lower Quartile 0.202 0.000 0.000 0.456 0.003 0.202189.73 IG Dam Median 0.614 0.000 0.000 0.888 0.111 29.043189.73 IG Dam Upper Quartile 1.420 0.185 30.566 1.926 0.638 90.710190.19 IG Res N 24 24 24 15 15 15 190.19 IG Res Lower Quartile 0.441 0.000 0.000 0.619 0.085 11.657190.19 IG Res Median 0.864 0.099 29.275 1.208 0.820 75.247190.19 IG Res Upper Quartile 1.738 1.102 80.106 1.931 1.478 89.426196.45 Bel Copco N 25 25 25 12 12 12 196.45 Bel Copco Lower Quartile 0.126 0.000 0.000 0.159 0.006 2.869196.45 Bel Copco Median 0.286 0.009 3.187 0.319 0.041 7.535196.45 Bel Copco Upper Quartile 0.601 0.080 20.906 0.806 0.120 49.727198.74 Copco Res N 27 27 27 16 16 16 198.74 Copco Res Lower Quartile 0.282 0.001 0.071 0.456 0.011 4.209198.74 Copco Res Median 0.618 0.041 5.847 0.885 0.054 11.459198.74 Copco Res Upper Quartile 4.700 4.118 89.460 6.184 5.286 97.613206.42 Abv Copco N 32 32 32 14 14 14 206.42 Abv Copco Lower Quartile 0.197 0.000 0.000 0.196 0.000 0.000206.42 Abv Copco Median 0.285 0.002 0.733 0.258 0.005 2.020206.42 Abv Copco Upper Quartile 0.474 0.008 3.679 0.498 0.088 24.481220.40 Abv JCB PH N 26 26 26 13 13 13 220.40 Abv JCB PH Lower Quartile 0.065 0.000 0.000 0.070 0.002 1.416220.40 Abv JCB PH Median 0.119 0.000 0.000 0.118 0.003 2.922220.40 Abv JCB PH Upper Quartile 0.192 0.004 4.007 0.174 0.008 4.477224.60 Bel JCB Dam N 26 26 26 12 12 12 224.60 Bel JCB Dam Lower Quartile 0.194 0.000 0.000 0.183 0.016 5.363224.60 Bel JCB Dam Median 0.409 0.024 6.612 0.374 0.048 11.494224.60 Bel JCB Dam Upper Quartile 1.098 0.049 19.236 0.852 0.182 48.977

KIER ASSOCIATES/AQUATIC ECOSYSTEM SCIENCES – ANALYSIS OF KLAMATH RIVER PHYTOPLANKTON, 2001-2004
10
Table 2 (continued)
all surface samples June 1 - Sept. 30 surface
samples
River Mile Site Name Metric
Tot
al B
iovo
lum
e (m
m3 /
L)
N-F
ixer
Bio
volu
me
(mm
3 /L)
N-F
ixer
Bio
volu
me
(Per
cent
)
Tot
al B
iovo
lum
e (m
m3 /
L)
N-F
ixer
Bio
volu
me
(mm
3 /L)
N-F
ixer
Bio
volu
me
(Per
cent
)
224.78 JCB Res N 15 15 15 9 9 9 224.78 JCB Res Lower Quartile 0.239 0.000 0.000 0.213 0.026 0.768224.78 JCB Res Median 0.375 0.051 5.545 0.628 0.085 12.804224.78 JCB Res Upper Quartile 3.339 0.102 20.207 3.845 0.232 35.508228.22 Abv JCB Res N 24 24 24 12 12 12 228.22 Abv JCB Res Lower Quartile 0.287 0.000 0.000 0.296 0.016 2.324228.22 Abv JCB Res Median 0.527 0.028 6.807 0.611 0.059 10.112228.22 Abv JCB Res Upper Quartile 1.479 0.126 22.953 1.636 0.730 86.204233.34 Keno Dam N 24 24 24 12 12 12 233.34 Keno Dam Lower Quartile 0.518 0.015 3.471 1.464 0.490 49.946233.34 Keno Dam Median 1.464 0.285 31.349 2.402 1.308 78.168233.34 Keno Dam Upper Quartile 3.408 1.308 78.168 4.908 3.581 89.518234.90 Keno Res 66 N 9 9 9 4 4 4 234.90 Keno Res 66 Lower Quartile 0.420 0.015 5.789 2.492 1.118 48.231234.90 Keno Res 66 Median 1.187 0.341 29.975 5.539 2.820 71.461234.90 Keno Res 66 Upper Quartile 8.350 2.189 65.302 9.797 8.383 91.863253.12 Link Mouth N 28 28 28 19 19 19 253.12 Link Mouth Lower Quartile 0.579 0.312 72.419 0.631 0.502 93.071253.12 Link Mouth Median 1.786 1.604 96.280 2.139 2.116 98.922253.12 Link Mouth Upper Quartile 8.013 7.949 99.145 9.135 9.024 99.556255.50 UKL Pel Mar* N 11 11 11 8 8 8 255.50 UKL Pel Mar* Lower Quartile 4.232 2.299 44.981 10.003 9.437 92.868255.50 UKL Pel Mar* Median 10.249 9.989 93.509 11.034 10.347 97.186255.50 UKL Pel Mar* Upper Quartile 14.887 14.638 99.693 20.414 20.392 99.842
*Note that although the Pelican Marina site in Upper Klamath Lake (river mile 255.50) is depth-integrated across the entire 1.5-2.5m water column, it is compared to surface samples at the other sites.

KIER ASSOCIATES/AQUATIC ECOSYSTEM SCIENCES – ANALYSIS OF KLAMATH RIVER PHYTOPLANKTON, 2001-2004
11
Figure 5. Chlorophyll a concentrations at Klamath River sites for all dates (top panel) and June-September (bottom panel), 2001-2004. Data are from samples collected by PacifiCorp and the Klamath Tribes.
Chlorophyll a at Klamath River Sites 2001-2004, June-September
173/176
189.730
190.190
196.450
198.740
206.420
220.400
224.600
224.780
228.220
233.340
234.900
253.120
255.500
River Mile
1.0
10.0
100.0
Chl
orop
hyll
a C
o nc.
(ug/
L )
173/176
189.730
190.190
196.450
198.740
206.420
220.400
224.600
224.780
228.220
233.340
234.900
253.120
255.500
1.0
10.0
100.0
Chl
orop
hyll
a C
o nc.
(ug/
L )
I-5 Shasta
IG DamIG Res
Bel Copco
Copco Res
Abv Copco
Abv JCB PH
Bel JCB Dam
JCB Res
Abv JCB Res
Keno Dam
Keno Res 66
Link Mouth
UKL FB/PM
Chlorophyll a at Klamath River Sites 2001-2004, all dates
173/176
189.730
190.190
196.450
198.740
206.420
220.400
224.600
224.780
228.220
233.340
234.900
253.120
255.500
River Mile
1.0
10.0
100.0
Chl
orop
hyll
a C
o nc.
(ug/
L )
173/176
189.730
190.190
196.450
198.740
206.420
220.400
224.600
224.780
228.220
233.340
234.900
253.120
255.500
1.0
10.0
100.0
Chl
orop
hyll
a C
o nc.
(ug/
L )
I-5 Shasta
IG DamIG Res
Bel Copco
Copco Res
Abv Copco
Abv JCB PH
Bel JCB Dam
JCB Res
Abv JCB Res
Keno Dam
Keno Res 66
Link Mouth
UKL FB/PM

KIER ASSOCIATES/AQUATIC ECOSYSTEM SCIENCES – ANALYSIS OF KLAMATH RIVER PHYTOPLANKTON, 2001-2004
12
Major Taxonomic Groups Cyanophyta As expected, based upon the longitudinal trend described above in NFP species, which are comprised of algae from the taxonomic group Cyanophyta (blue-green algae), the longitudinal trend in both total biovolume and percent biovolume of the Cyanophyta (Figure 6) was similar to that of NFP shown above. UKL, dominated by the blue-green algal species Aphanizomenon flos-aquae, showed high median and UQ biomass and percent biomass levels. Downstream values then drop substantially, with median values decreasing from 10.8 mm3/L to less than 0.01 mm3/L above Copco (RM 206.42). However, although still low relative to UKL, median values were 5.8 and 86 times higher in Copco and Iron Gate Reservoirs than they were above Copco (Figure 6; top panel and Table 3). The trend in Cyanophyta percent composition is more pronounced through the reservoir complex than absolute biomass, with levels in Copco and Iron Gate increasing from 5% above Copco to 50% and 82% in Copco and Iron Gate Reservoirs, respectively. As with total and NFP biomass, the upper distribution or UQ metric showed a more pronounced increase in the reservoir complex, especially for Copco Res (RM 198.74) which showed the overall increase to be 65 times higher than the above Copco station (Figure 6; bottom panel and Table 3). Moreover, percent Cyanophyta composition increased to 90% and 78% in Copco and Iron Gate, respectively. These trends in the upper distribution indicate that periodic high values of both biovolume and percent biovolume of Cyanophyta occurred in the reservoir complex relative to stations directly upstream. Other dominant groups As expected as the system changed from the lacustrine environment of UKL to the riverine environment of the Klamath River, diatoms increased in prevalence downstream, before decreasing again in the Copco/Iron Gate Reservoir complex (Figure 6; red color) as the Cyanophyta again dominated. Other major taxonomic groups that increased in prevalence downstream were the Cryptophyta (cryptophytes) and Chlorophyta (green algae); with the highest percent composition for these groups occurring in JC Boyle Reservoir (JCB Res; RM 224.78). As with the Cyanophyta, the species in these groups (e.g., Cryptomonas erosa and Actinastrum hantzschii) tend to be more lacustrine. Relative to diatoms and the Cyanophyta, the Euglenophyta (euglena), Pyrrophyta (dinoflagellates), and Chrysophyta (golden algae) comprised a very minor portion of the overall biovolume at all stations. Seasonal Trends Phytoplankton can respond to changes in their environment with periods of rapid growth or decline. These changes usually occur at intervals substantially shorter than the monthly sampling frequency of the PacifiCorp dataset. Given these limitations, apparent differences in peak biomass between years may in fact be due to the timing of sample collection rather than to any real differences. As such, it is not the goal in the following sections to compare the specific magnitudes among years, but rather to determine the general consistency of seasonal trends among years and to determine general seasonal trajectories. Bi-weekly data, such as that collected by the Klamath Tribes at its Pelican Marina site in UKL, would provide much-improved resolution for identifying and interpreting seasonal and inter-annual trends.

KIER ASSOCIATES/AQUATIC ECOSYSTEM SCIENCES – ANALYSIS OF KLAMATH RIVER PHYTOPLANKTON, 2001-2004
13
Figure 6. Median and upper quartile biovolume and percent composition of major phytoplankton taxonomic groups for surface samples collected June 1 – September 30, 2001-2004.
Upper Quartile Biovolume of Major Phytoplankton Taxa, 2001-2004 June-Sept, Surface Samples
173/176 189.73 190.19 196.45 198.74 206.42 220.40 224.60 224.78 228.22 233.34 253.12 255.500
5
10
15
20
25
Upp
er Q
u arti
le B
iovo
lum
e (m
m3 /L
)
CHRYSOPHYTAPYRROPHYTAEUGLENOPHYTACHLOROPHYTACRYPTOPHYTADIATOMSCYANOPHYTA
173/176 189.73 190.19 196.45 198.74 206.42 220.40 224.60 224.78 228.22 233.34 253.12 255.50River Mile
0102030405060708090
100
% C
ompo
s itio
n
CHRYSOPHYTAPYRROPHYTAEUGLENOPHYTACHLOROPHYTACRYPTOPHYTADIATOMSCYANOPHYTA
I-5 Shasta
IG DamIG Res
Bel Copco
Copco Res
Abv Copco
Abv JCB PH
Bel JCB Dam
JCB Res
Abv JCB Res
Keno Dam
Link Mouth
UKL Pel Mar
n= 7 n=15 n=15 n=12 n=16 n=14 n= 8n=19n=12n=12n= 9n=12n=13
Median Biovolume of Major Phytoplankton Taxa, 2001-2004 June-Sept, Surface Samples
173/176 189.73 190.19 196.45 198.74 206.42 220.40 224.60 224.78 228.22 233.34 253.12 255.500
2
4
6
8
10
12
Med
ian
Bio
volu
me
(mm
3 /L)
CHRYSOPHYTAPYRROPHYTAEUGLENOPHYTACHLOROPHYTACRYPTOPHYTADIATOMSCYANOPHYTA
173/176 189.73 190.19 196.45 198.74 206.42 220.40 224.60 224.78 228.22 233.34 253.12 255.50River Mile
0102030405060708090
100
% C
ompo
sitio
n
CHRYSOPHYTAPYRROPHYTAEUGLENOPHYTACHLOROPHYTACRYPTOPHYTADIATOMSCYANOPHYTA
I-5 Shasta
IG DamIG Res
Bel Copco
Copco Res
Abv Copco
Abv JCB PH
Bel JCB Dam
JCB Res
Abv JCB Res
Keno Dam
Link Mouth
UKL Pel Mar
n= 7 n=15 n=15 n=12 n=16 n=14 n= 8n=19n=12n=12n= 9n=12n=13

KIER ASSOCIATES/AQUATIC ECOSYSTEM SCIENCES – ANALYSIS OF KLAMATH RIVER PHYTOPLANKTON, 2001-2004
14
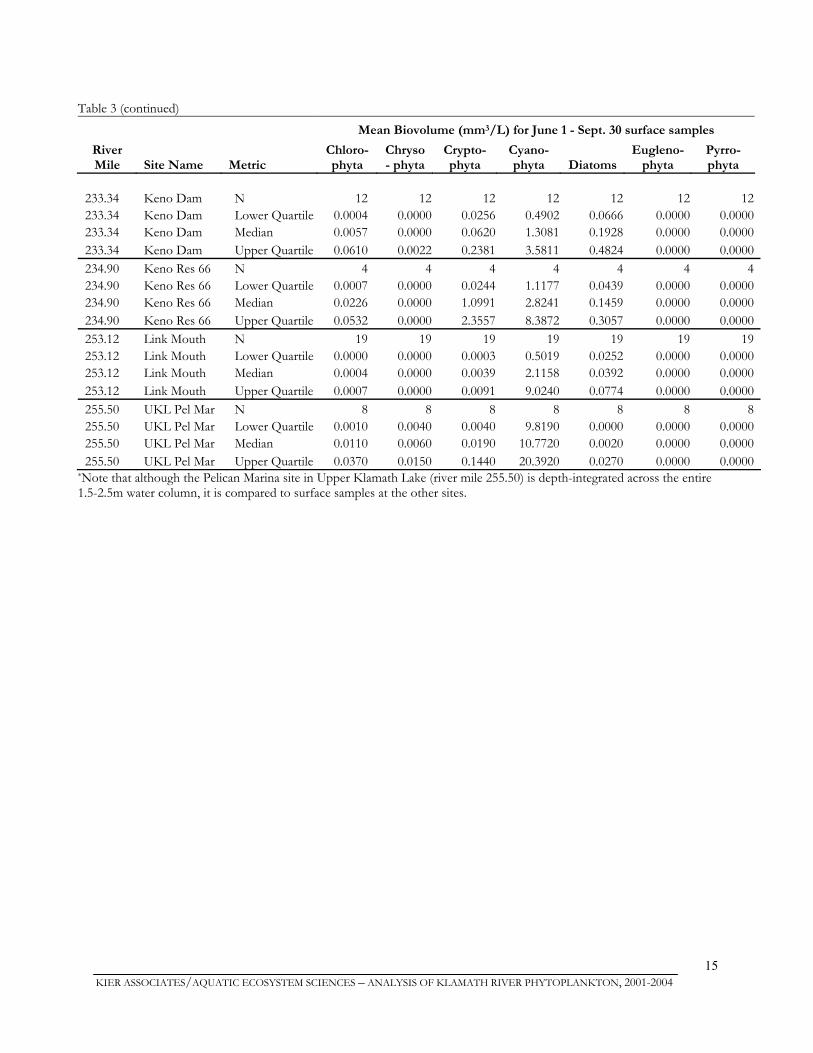
Table 3. Summary of biovolume data by site for surface samples* collected for the years 2001-2004 during the period June 1 – September 30. For each site, statistics include the number of samples (N) and the mean total biovolume for each major taxonomic group.
Mean Biovolume (mm3/L) for June 1 - Sept. 30 surface samples
River Mile Site Name Metric
Chloro- phyta
Chryso- phyta
Crypto- phyta
Cyano- phyta Diatoms
Eugleno- phyta
Pyrro- phyta
173/176 I-5 Shasta N 7 7 7 7 7 7 7173/176 I-5 Shasta Lower Quartile 0.0000 0.0000 0.0000 0.0000 0.2252 0.0000 0.0000173/176 I-5 Shasta Median 0.0000 0.0000 0.0045 0.0294 0.2646 0.0000 0.0000173/176 I-5 Shasta Upper Quartile 0.0003 0.0000 0.0061 0.0774 0.3003 0.0000 0.0000189.73 IG Dam N 15 15 15 15 15 15 15189.73 IG Dam Lower Quartile 0.0012 0.0000 0.0070 0.0070 0.0617 0.0000 0.0000189.73 IG Dam Median 0.0043 0.0000 0.0169 0.1707 0.1626 0.0000 0.0000189.73 IG Dam Upper Quartile 0.0188 0.0011 0.0574 0.6381 0.7728 0.0000 0.0000190.19 IG Res N 15 15 15 15 15 15 15190.19 IG Res Lower Quartile 0.0030 0.0000 0.0177 0.0846 0.0369 0.0000 0.0000190.19 IG Res Median 0.0091 0.0000 0.0554 0.8278 0.1072 0.0000 0.0000190.19 IG Res Upper Quartile 0.0115 0.0025 0.0793 1.4777 0.3245 0.0000 0.0000196.45 Bel Copco N 12 12 12 12 12 12 12196.45 Bel Copco Lower Quartile 0.0002 0.0000 0.0003 0.0161 0.0207 0.0000 0.0000196.45 Bel Copco Median 0.0015 0.0000 0.0129 0.0557 0.1425 0.0000 0.0000196.45 Bel Copco Upper Quartile 0.0060 0.0000 0.0247 0.1778 0.4024 0.0000 0.0000198.74 Copco Res N 16 16 16 16 16 16 16198.74 Copco Res Lower Quartile 0.0006 0.0000 0.0000 0.0262 0.0108 0.0000 0.0000198.74 Copco Res Median 0.0045 0.0000 0.0047 0.0550 0.0445 0.0000 0.0000198.74 Copco Res Upper Quartile 0.0120 0.0035 0.0205 6.1296 0.4748 0.0000 0.0000206.42 Abv Copco N 14 14 14 14 14 14 14206.42 Abv Copco Lower Quartile 0.0019 0.0000 0.0005 0.0000 0.1395 0.0000 0.0000206.42 Abv Copco Median 0.0057 0.0000 0.0044 0.0096 0.1709 0.0000 0.0000206.42 Abv Copco Upper Quartile 0.0221 0.0003 0.0166 0.0946 0.2550 0.0000 0.0000220.40 Abv JCB PH N 13 13 13 13 13 13 13220.40 Abv JCB PH Lower Quartile 0.0012 0.0000 0.0000 0.0017 0.0588 0.0000 0.0000220.40 Abv JCB PH Median 0.0020 0.0000 0.0013 0.0027 0.0827 0.0000 0.0000220.40 Abv JCB PH Upper Quartile 0.0054 0.0000 0.0048 0.0288 0.1251 0.0000 0.0000224.60 Bel JCB Dam N 12 12 12 12 12 12 12224.60 Bel JCB Dam Lower Quartile 0.0025 0.0000 0.0033 0.0168 0.0678 0.0000 0.0000224.60 Bel JCB Dam Median 0.0049 0.0000 0.0314 0.0487 0.1284 0.0000 0.0000224.60 Bel JCB Dam Upper Quartile 0.0395 0.0003 0.0445 0.3209 0.2060 0.0000 0.0000224.78 JCB Res N 9 9 9 9 9 9 9224.78 JCB Res Lower Quartile 0.0229 0.0000 0.0503 0.0260 0.0616 0.0000 0.0000224.78 JCB Res Median 0.0662 0.0000 0.2022 0.0849 0.1176 0.0000 0.0000224.78 JCB Res Upper Quartile 0.3117 0.0003 0.5285 0.3038 0.1631 0.0000 0.0000228.22 Abv JCB Res N 12 12 12 12 12 12 12228.22 Abv JCB Res Lower Quartile 0.0005 0.0000 0.0000 0.0158 0.1281 0.0000 0.0000228.22 Abv JCB Res Median 0.0104 0.0000 0.0022 0.0593 0.2820 0.0000 0.0000228.22 Abv JCB Res Upper Quartile 0.0438 0.0003 0.0262 0.7299 0.4419 0.0000 0.0000
KIER ASSOCIATES/AQUATIC ECOSYSTEM SCIENCES – ANALYSIS OF KLAMATH RIVER PHYTOPLANKTON, 2001-2004
15
Table 3 (continued)
Mean Biovolume (mm3/L) for June 1 - Sept. 30 surface samples River Mile Site Name Metric
Chloro- phyta
Chryso- phyta
Crypto- phyta
Cyano- phyta Diatoms
Eugleno- phyta
Pyrro- phyta
233.34 Keno Dam N 12 12 12 12 12 12 12233.34 Keno Dam Lower Quartile 0.0004 0.0000 0.0256 0.4902 0.0666 0.0000 0.0000233.34 Keno Dam Median 0.0057 0.0000 0.0620 1.3081 0.1928 0.0000 0.0000233.34 Keno Dam Upper Quartile 0.0610 0.0022 0.2381 3.5811 0.4824 0.0000 0.0000234.90 Keno Res 66 N 4 4 4 4 4 4 4234.90 Keno Res 66 Lower Quartile 0.0007 0.0000 0.0244 1.1177 0.0439 0.0000 0.0000234.90 Keno Res 66 Median 0.0226 0.0000 1.0991 2.8241 0.1459 0.0000 0.0000234.90 Keno Res 66 Upper Quartile 0.0532 0.0000 2.3557 8.3872 0.3057 0.0000 0.0000253.12 Link Mouth N 19 19 19 19 19 19 19253.12 Link Mouth Lower Quartile 0.0000 0.0000 0.0003 0.5019 0.0252 0.0000 0.0000253.12 Link Mouth Median 0.0004 0.0000 0.0039 2.1158 0.0392 0.0000 0.0000253.12 Link Mouth Upper Quartile 0.0007 0.0000 0.0091 9.0240 0.0774 0.0000 0.0000255.50 UKL Pel Mar N 8 8 8 8 8 8 8255.50 UKL Pel Mar Lower Quartile 0.0010 0.0040 0.0040 9.8190 0.0000 0.0000 0.0000255.50 UKL Pel Mar Median 0.0110 0.0060 0.0190 10.7720 0.0020 0.0000 0.0000255.50 UKL Pel Mar Upper Quartile 0.0370 0.0150 0.1440 20.3920 0.0270 0.0000 0.0000
*Note that although the Pelican Marina site in Upper Klamath Lake (river mile 255.50) is depth-integrated across the entire 1.5-2.5m water column, it is compared to surface samples at the other sites.

KIER ASSOCIATES/AQUATIC ECOSYSTEM SCIENCES – ANALYSIS OF KLAMATH RIVER PHYTOPLANKTON, 2001-2004
16
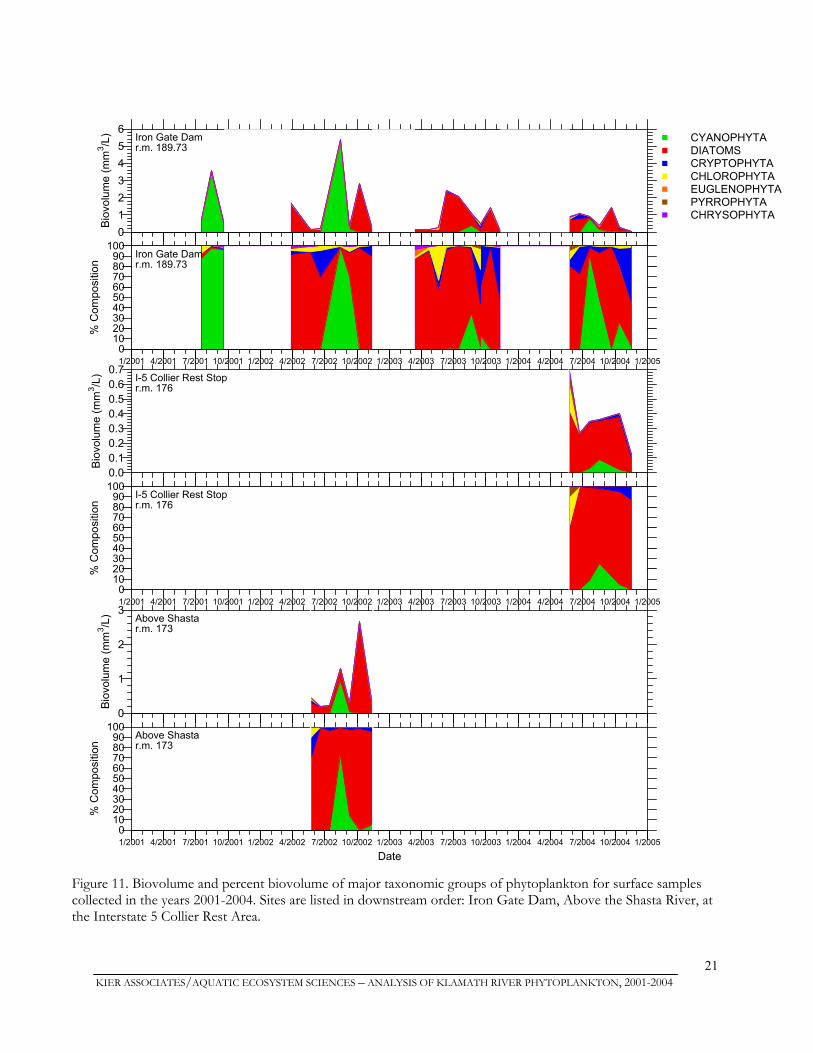
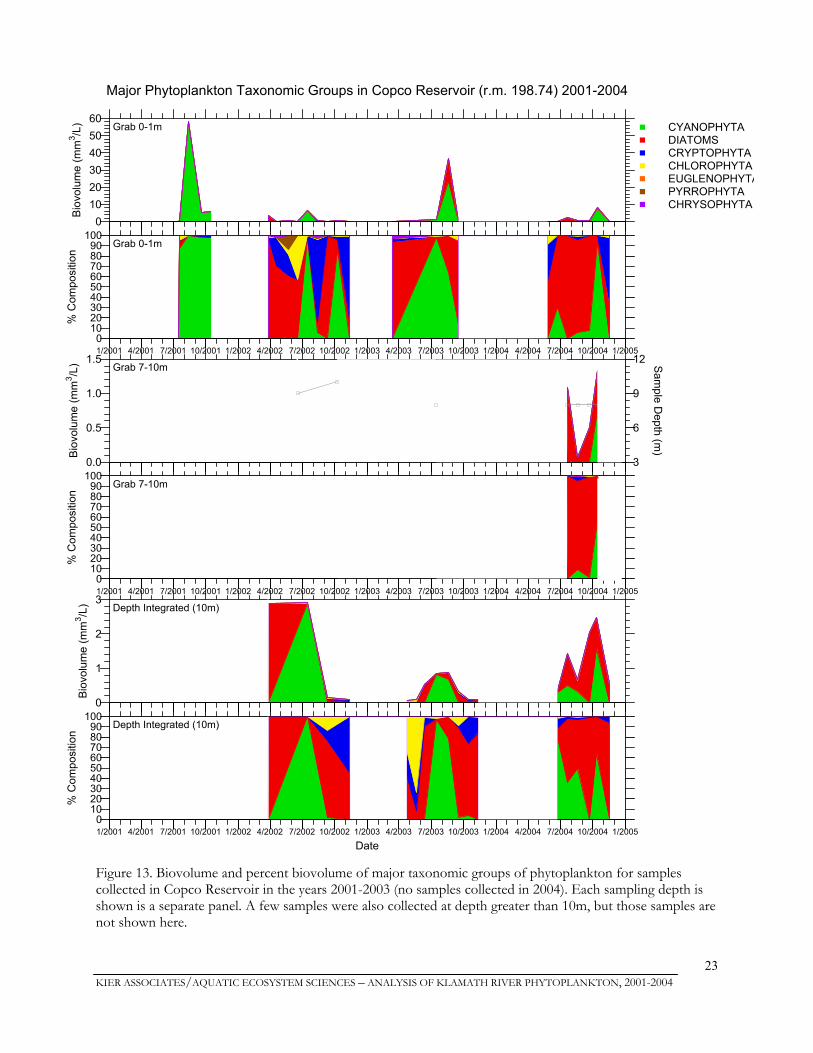
Major Taxonomic Groups Seasonal trends for major taxonomic groups are shown for each station ordered longitudinally from UKL to the Klamath River above the Shasta River confluence in Figures 7-11. Similar to the above analyses, Cyanophyta biomass and composition dominated the June-September period at up-river stations (Figure 7), with diatoms, cryptophytes, and chlorophytes dominating during the spring months. Although the summer Cyanophyta dominance persists downstream to Below JCB Dam (RM 224.6), the period of dominance becomes seasonally restricted at sites downstream (Figures 8 and 9). The importance of diatoms, cryptophytes, and chlorophytes begins to increase in importance below Keno Dam (RM 233.34) with diatoms dominating for much of the summer growing season by the time the river reaches the above Copco station (Figure 9; RM 206.42). Only restricted peaks in Cyanophyta dominance were observed at this station, occurring in July-August of 2003 and June-July of 2004. In contrast, peak Cyanophyta in Copco and Iron Gate Reservoirs (Figure 10) was substantially higher (note scale change from Figure 9 showing the Abv Copco station), with an overall decrease in diatom dominance during the summer months. Given that Cyanophyta tend to be buoyant and concentrate near the surface, and that releases from Iron Gate Reservoir are drawn from a depth ~30-40 feet, it is not surprising that the Iron Gate Dam station (RM 189.73 showed reduced composition of Cyanophyta, although relative to Abv. Copco, levels were higher and the period of dominance was protracted (Figure 11). Sampling frequency was insufficient (stations at RM’s 173 and 176 were each only sampled in one year) to thoroughly evaluate stations below Iron Gate dam (Figure 11); however there is an indication of continued but diminished blue-green peaks, with increasing diatom dominance. The overall seasonal pattern observed at most stations consists of spring diatom dominance, followed by increasing chlorophytes and cryptophytes, followed by a period of Cyanophyta (blue-green algae) dominance, and finally a return to diatoms during the fall. The magnitude and period of Cyanophyta dominance was dependant upon whether the station is a reservoir or river station. Reservoir samples at various depths Periodic multiple depth sampling occurred in JC Boyle, Copco, and Iron Gate Reservoirs from 2001-2004 (Figures 12-14). The grab samples shown as 0-1m are the same as the surface samples depicted in all above graphs; other sample depths consist of either a depth integrated sample of the top 8-10 m of the water column (thus is inclusive of the 0-1 m grab sample), and a depth-specific sample taken between the 7 and 10 m depths. Depth-specific samples were limited but tend to indicate that in JC Boyle and Copco Reservoirs, the composition of diatoms increases relative to the surface samples that showed higher predominance of chlorophytes and cryptophytes in JC Boyle (Figure 12) and higher Cyanophyta in Copco (Figure 13). The depth integrated sampling was more consistent, and as expected based on dilution of surface water where algae tend to be more concentrated, overall water column biovolume was substantially lower (again note scale change from surface to depth-integrated graphs) than surface samples in all three reservoirs. Although overall biovolume was lower in the depth-integrated samples, they showed a similar seasonal pattern of blue-green dominance as the surface samples. This may be partially due to the inclusion of surface material in the integrated sample. Copco and Iron Gate depth-integrated samples during summer months also showed greater dominance by cryptophytes and chlorophytes than did surface samples (Figures 13 and 14).

KIER ASSOCIATES/AQUATIC ECOSYSTEM SCIENCES – ANALYSIS OF KLAMATH RIVER PHYTOPLANKTON, 2001-2004
17
010203040506070
Bio
volu
me
(mm
3 /L)
CHRYSOPHYTAPYRROPHYTAEUGLENOPHYTACHLOROPHYTACRYPTOPHYTADIATOMSCYANOPHYTAUKL Pel Mar
r.m. 255.50
1/2001 4/2001 7/2001 10/2001 1/2002 4/2002 7/2002 10/2002 1/2003 4/2003 7/2003 10/2003 1/2004 4/2004 7/2004 10/2004 1/20050
102030405060708090
100
% C
ompo
sitio
n
UKL Pel Marr.m. 255.50
0
10
20
30
40
Bio
volu
me
(mm
3 /L) Link Mouth
r.m. 253.12
1/2001 4/2001 7/2001 10/2001 1/2002 4/2002 7/2002 10/2002 1/2003 4/2003 7/2003 10/2003 1/2004 4/2004 7/2004 10/2004 1/20050
102030405060708090
100
% C
ompo
sitio
n
Link Mouthr.m. 253.12
0
5
10
15
Biov
olum
e (m
m3 /L
) Keno Res 66r.m. 234.9
1/2001 4/2001 7/2001 10/2001 1/2002 4/2002 7/2002 10/2002 1/2003 4/2003 7/2003 10/2003 1/2004 4/2004 7/2004 10/2004 1/2005
Date
0102030405060708090
100
% C
ompo
sitio
n
Keno Res 66r.m. 234.9
Figure 7. Biovolume and percent biovolume of major taxonomic groups of phytoplankton for surface samples collected in the years 2001-2004. Sites are listed in downstream order: Upper Klamath Lake at Pelican Marina, Link River at its mouth, and Keno Reservoir at the Highway 66 Bridge.

KIER ASSOCIATES/AQUATIC ECOSYSTEM SCIENCES – ANALYSIS OF KLAMATH RIVER PHYTOPLANKTON, 2001-2004
18
0
5
10
15B
iovo
lum
e (m
m3 /L
)
CHRYSOPHYTAPYRROPHYTAEUGLENOPHYTACHLOROPHYTACRYPTOPHYTADIATOMSCYANOPHYTABel Keno Dam
r.m. 233.34
1/2001 4/2001 7/2001 10/2001 1/2002 4/2002 7/2002 10/2002 1/2003 4/2003 7/2003 10/2003 1/2004 4/2004 7/2004 10/2004 1/20050
102030405060708090
100
% C
ompo
sitio
n
Bel Keno Damr.m. 233.34
01234567
Bio
volu
me
(mm
3 /L) Abv JCB Res
r.m. 228.22
1/2001 4/2001 7/2001 10/2001 1/2002 4/2002 7/2002 10/2002 1/2003 4/2003 7/2003 10/2003 1/2004 4/2004 7/2004 10/2004 1/20050
102030405060708090
100
% C
ompo
sitio
n
Abv JCB Resr.m. 228.22
0123456789
Biov
olum
e (m
m3 /L
) JCB Resr.m. 224.78
1/2001 4/2001 7/2001 10/2001 1/2002 4/2002 7/2002 10/2002 1/2003 4/2003 7/2003 10/2003 1/2004 4/2004 7/2004 10/2004 1/2005
Date
0102030405060708090
100
% C
ompo
sitio
n
JCB Resr.m. 224.78
Figure 8. Biovolume and percent biovolume of major taxonomic groups of phytoplankton for surface samples collected in the years 2001-2004. Sites are listed in downstream order: Keno Dam, Above J.C. Boyle Reservoir, and J.C. Boyle Reservoir.

KIER ASSOCIATES/AQUATIC ECOSYSTEM SCIENCES – ANALYSIS OF KLAMATH RIVER PHYTOPLANKTON, 2001-2004
19
0
1
2
3
Bio
volu
me
(mm
3 /L)
CHRYSOPHYTAPYRROPHYTAEUGLENOPHYTACHLOROPHYTACRYPTOPHYTADIATOMSCYANOPHYTABel JCB Dam
r.m. 224.6
1/2001 4/2001 7/2001 10/2001 1/2002 4/2002 7/2002 10/2002 1/2003 4/2003 7/2003 10/2003 1/2004 4/2004 7/2004 10/2004 1/20050
102030405060708090
100
% C
ompo
sitio
n
Bel JCB Damr.m. 224.6
0.00.10.20.30.40.50.60.70.80.9
Bio
volu
me
(mm
3 / L) Abv JCBPH
r.m. 220.4
1/2001 4/2001 7/2001 10/2001 1/2002 4/2002 7/2002 10/2002 1/2003 4/2003 7/2003 10/2003 1/2004 4/2004 7/2004 10/2004 1/20050
102030405060708090
100
% C
ompo
sitio
n
Abv JCBPHr.m. 220.4
0.0
0.5
1.0
1.5
2.0
Biov
olum
e (m
m3 / L
) Abv Copcor.m. 206.42
1/2001 4/2001 7/2001 10/2001 1/2002 4/2002 7/2002 10/2002 1/2003 4/2003 7/2003 10/2003 1/2004 4/2004 7/2004 10/2004 1/2005
Date
0102030405060708090
100
% C
ompo
sitio
n
Abv Copcor.m. 206.42
Figure 9. Biovolume and percent biovolume of major taxonomic groups of phytoplankton for surface samples collected in the years 2001-2004. Sites are listed in downstream order: Below J.C. Boyle Dam, Above J.C. Boyle Powerhouse, and Above Copco Reservoir.

KIER ASSOCIATES/AQUATIC ECOSYSTEM SCIENCES – ANALYSIS OF KLAMATH RIVER PHYTOPLANKTON, 2001-2004
20
0102030405060
Bio
volu
me
(mm
3 /L)
CHRYSOPHYTAPYRROPHYTAEUGLENOPHYTACHLOROPHYTACRYPTOPHYTADIATOMSCYANOPHYTACopco Res
r.m. 198.74
1/2001 4/2001 7/2001 10/2001 1/2002 4/2002 7/2002 10/2002 1/2003 4/2003 7/2003 10/2003 1/2004 4/2004 7/2004 10/2004 1/20050
102030405060708090
100
% C
ompo
sitio
n
Copco Resr.m. 198.74
0
1
2
3
Bio
volu
me
(mm
3 /L) Below Copco
r.m. 196.45
1/2001 4/2001 7/2001 10/2001 1/2002 4/2002 7/2002 10/2002 1/2003 4/2003 7/2003 10/2003 1/2004 4/2004 7/2004 10/2004 1/20050
102030405060708090
100
% C
ompo
sitio
n
Below Copcor.m. 196.45
0
5
10
15
20
Biov
olum
e (m
m3 /L
) Iron Gate Resr.m. 190.19
1/2001 4/2001 7/2001 10/2001 1/2002 4/2002 7/2002 10/2002 1/2003 4/2003 7/2003 10/2003 1/2004 4/2004 7/2004 10/2004 1/2005
Date
0102030405060708090
100
% C
ompo
sitio
n
Iron Gate Resr.m. 190.19
Figure 10. Biovolume and percent biovolume of major taxonomic groups of phytoplankton for surface samples collected in the years 2001-2004. Sites are listed in downstream order: Copco Reservoir, Below Copco Dam, and Iron Gate Reservoir.
KIER ASSOCIATES/AQUATIC ECOSYSTEM SCIENCES – ANALYSIS OF KLAMATH RIVER PHYTOPLANKTON, 2001-2004
21
0123456
Biov
olu m
e (m
m3 /L
)
CHRYSOPHYTAPYRROPHYTAEUGLENOPHYTACHLOROPHYTACRYPTOPHYTADIATOMSCYANOPHYTAIron Gate Dam
r.m. 189.73
1/2001 4/2001 7/2001 10/2001 1/2002 4/2002 7/2002 10/2002 1/2003 4/2003 7/2003 10/2003 1/2004 4/2004 7/2004 10/2004 1/20050
102030405060708090
100
% C
o mpo
sitio
n
Iron Gate Damr.m. 189.73
0.00.10.20.30.40.50.60.7
Bio
v olu
me
(mm
3 /L) I-5 Collier Rest Stop
r.m. 176
1/2001 4/2001 7/2001 10/2001 1/2002 4/2002 7/2002 10/2002 1/2003 4/2003 7/2003 10/2003 1/2004 4/2004 7/2004 10/2004 1/20050
102030405060708090
100
% C
o mpo
sitio
n
I-5 Collier Rest Stopr.m. 176
0
1
2
3
Biov
olu m
e (m
m3 /L
) Above Shastar.m. 173
1/2001 4/2001 7/2001 10/2001 1/2002 4/2002 7/2002 10/2002 1/2003 4/2003 7/2003 10/2003 1/2004 4/2004 7/2004 10/2004 1/2005
Date
0102030405060708090
100
% C
o mpo
sitio
n
Above Shastar.m. 173
Figure 11. Biovolume and percent biovolume of major taxonomic groups of phytoplankton for surface samples collected in the years 2001-2004. Sites are listed in downstream order: Iron Gate Dam, Above the Shasta River, at the Interstate 5 Collier Rest Area.

KIER ASSOCIATES/AQUATIC ECOSYSTEM SCIENCES – ANALYSIS OF KLAMATH RIVER PHYTOPLANKTON, 2001-2004
22
Figure 12. Biovolume and percent biovolume of major taxonomic groups of phytoplankton for samples collected in J.C. Boyle Reservoir in the years 2001-2003 (no samples collected in 2004). Each sampling depth is shown is a separate panel.
Sample DepthSample Depth
Major Phytoplankton Taxonomic Groups in J.C. Boyle Reservoir (r.m. 224.78) 2001-2004
0123456789
Bio
volu
me
(mm
3 /L)
CHRYSOPHYTAPYRROPHYTAEUGLENOPHYTACHLOROPHYTACRYPTOPHYTADIATOMSCYANOPHYTAGrab 0-1m
1/2001 4/2001 7/2001 10/2001 1/2002 4/2002 7/2002 10/2002 1/2003 4/2003 7/2003 10/2003 1/2004 4/2004 7/2004 10/2004 1/20050
102030405060708090
100
% C
ompo
sitio
n
Grab 0-1m
0
1
2
3
4
5
Bio
volu
me
(mm
3 /L)
2
4
6
8
10
12 Sam
ple Depth (m
)
Grab 7-10m
1/2001 4/2001 7/2001 10/2001 1/2002 4/2002 7/2002 10/2002 1/2003 4/2003 7/2003 10/2003 1/2004 4/2004 7/2004 10/2004 1/20050
102030405060708090
100
% C
ompo
sitio
n
Grab 7-10m
0.0
0.5
1.0
1.5
2.0
Bio
volu
me
(mm
3 /L) Depth Integrated (8 or 10m)
1/2001 4/2001 7/2001 10/2001 1/2002 4/2002 7/2002 10/2002 1/2003 4/2003 7/2003 10/2003 1/2004 4/2004 7/2004 10/2004 1/2005
Date
0102030405060708090
100
% C
ompo
sitio
n
Depth Integrated (8 or 10m)
KIER ASSOCIATES/AQUATIC ECOSYSTEM SCIENCES – ANALYSIS OF KLAMATH RIVER PHYTOPLANKTON, 2001-2004
23
Figure 13. Biovolume and percent biovolume of major taxonomic groups of phytoplankton for samples collected in Copco Reservoir in the years 2001-2003 (no samples collected in 2004). Each sampling depth is shown is a separate panel. A few samples were also collected at depth greater than 10m, but those samples are not shown here.
Major Phytoplankton Taxonomic Groups in Copco Reservoir (r.m. 198.74) 2001-2004
0102030405060
Bio
v olu
me
(mm
3 /L)
CHRYSOPHYTAPYRROPHYTAEUGLENOPHYTACHLOROPHYTACRYPTOPHYTADIATOMSCYANOPHYTAGrab 0-1m
1/2001 4/2001 7/2001 10/2001 1/2002 4/2002 7/2002 10/2002 1/2003 4/2003 7/2003 10/2003 1/2004 4/2004 7/2004 10/2004 1/20050
102030405060708090
100
% C
o mpo
sitio
n
Grab 0-1m
0.0
0.5
1.0
1.5
Biov
olum
e (m
m3 /L
)
3
6
9
12 Sam
ple Depth (m
)
Grab 7-10m
1/2001 4/2001 7/2001 10/2001 1/2002 4/2002 7/2002 10/2002 1/2003 4/2003 7/2003 10/2003 1/2004 4/2004 7/2004 10/2004 1/20050
102030405060708090
100
% C
o mpo
sitio
n
Grab 7-10m
0
1
2
3
Biov
o lum
e (m
m3 /L
) Depth Integrated (10m)
1/2001 4/2001 7/2001 10/2001 1/2002 4/2002 7/2002 10/2002 1/2003 4/2003 7/2003 10/2003 1/2004 4/2004 7/2004 10/2004 1/2005
Date
0102030405060708090
100
% C
o mpo
sitio
n
Depth Integrated (10m)

KIER ASSOCIATES/AQUATIC ECOSYSTEM SCIENCES – ANALYSIS OF KLAMATH RIVER PHYTOPLANKTON, 2001-2004
24
Figure 14. Biovolume and percent biovolume of major taxonomic groups of phytoplankton for samples collected in Iron Gate Reservoir in the years 2001-2003 (no samples collected in 2004). Each sampling depth is shown is a separate panel. A few samples were also collected at depth greater than 10m, but those samples are not shown here.
Sample DepthSample Depth
Major Phytoplankton Taxonomic Groups in Iron Gate Reservoir (r.m. 190.19) 2001-2004
0
5
10
15
20
Bio
vol u
me
(mm
3 /L)
CHRYSOPHYTAPYRROPHYTAEUGLENOPHYTACHLOROPHYTACRYPTOPHYTADIATOMSCYANOPHYTAGrab 0-1m
1/2001 4/2001 7/2001 10/2001 1/2002 4/2002 7/2002 10/2002 1/2003 4/2003 7/2003 10/2003 1/2004 4/2004 7/2004 10/2004 1/20050
102030405060708090
100
% C
omp o
sitio
n
Grab 0-1m
0.0
0.5
1.0
1.5
Biov
olu m
e (m
m3 /L
)
3
6
9
12 Sam
ple Depth (m
)
Grab 7-10m
1/2001 4/2001 7/2001 10/2001 1/2002 4/2002 7/2002 10/2002 1/2003 4/2003 7/2003 10/2003 1/2004 4/2004 7/2004 10/2004 1/20050
102030405060708090
100
% C
omp o
sitio
n
Grab 7-10m
012345678
Biov
o lum
e (m
m3 /L
) Depth Integrated (10m)
1/2001 4/2001 7/2001 10/2001 1/2002 4/2002 7/2002 10/2002 1/2003 4/2003 7/2003 10/2003 1/2004 4/2004 7/2004 10/2004 1/2005
Date
0102030405060708090
100
% C
omp o
sitio
n
Depth Integrated (10m)

KIER ASSOCIATES/AQUATIC ECOSYSTEM SCIENCES – ANALYSIS OF KLAMATH RIVER PHYTOPLANKTON, 2001-2004
25
Species Composition Seasonal trends for dominant species are shown for each station ordered longitudinally from UKL to the Klamath River above the Shasta River confluence in Figures 15-19. The intent of this section is not to provide detailed information on individual species, but rather to determine those species that comprise the major taxonomic groups described above in Figures 7-11. To improve graphical presentation, genera with more than one species observed were combined. As discussed above, Aphanizomenon (APFA) is the major cyanophyte in water exiting UKL, often comprising >90% of the total Cyanophyta (Figure 15). There were also several incidences when Microcystis aeruginosa (MSAE) accounted for a small portion (<10%) of the cyanophyte biovolume leaving UKL. Moving downstream, APFA continues to dominate the Cyanophyta and MSAE is not noted again at considerable levels until Bel JC Boyle Dam (Figure 17). The seasonal APHA peak becomes more restricted as the river continues to the Keno and JC Boyle reaches (Figure 16), with increased summer dominance by Cryptomonas (e.g., CXER), Cyclotella , and Melosira. Spring and early-summer genera in this reach included the diatoms Fragilaria, Stephanodiscus, and Asterionella. In the bypass reach Abv JCBPH (RM 220.4; Figure 17) where water is comprised mainly of spring inflow rather than reservoir or lake releases, the community was more diverse, and tended to be dominated by periphytic or attached diatom genera such as Diatoma, Cocconeis, Gomphonema, Navicula, and Nitzschia. Although this trend in increased periphytic diatoms continued to the Above Copco station (Abv Copco; RM 206.42), APFA again increased as water released from the JC Boyle Powerhouse mixed with water from the bypass reach.
Periphytic species then declined substantially and were replaced by more planktonic species in the Copco Iron Gate Reservoir complex (Figure 18). For example, APFA increased from 20.1% of the June-September biovolume above Copco to 70.8% of the biovolume in Copco Reservoir (Tables 4 and 5). Likewise, the second most dominant species in Copco reservoir for this period was MSAE (14.3%), a species that did not rank in the top ten dominant species above Copco, and was present at levels≤5% at upstream stations. Other planktonic genera that were periodically important in Copco Reservoir include the cyanophyte Anabaena, and the diatoms Fragilaria and Stephanodiscus (Figure 18). Below Copco, APFA decreased to 30.4% (RM 196.45; Table 4) and the period of APFA dominance was more restricted (Figure 18). In addition, diatoms increased in importance with Nitzschia and Fragilaria accounting for 32.4% of the biovolume on a seasonal basis (Table 4). In Iron Gate Reservoir, APFA again increased to 83% of the biovolume, with Gloeotrichia (GTEC), another nitrogen-fixing blue-green, ranking second at 5.7% (Table 4). MSAE decreased in importance in Iron Gate Reservoir, but did show annual peaks in most years at the site below Iron Gate Dam (RM 189.73) where MSAE comprised 16.8% of biovolume in August 2004 and 6.7% in September 2004.
Seasonal patterns in the reservoirs generally included spring dominance by diatoms (e.g., Stephanodiscus and Melosira), summer dominance by the Cyanophyta (e.g., Aphanizomenon, Microcystis, and Gloeotrichia), and fall dominance by Cryptomonas and Fragilaria (Figure 18). Although limited by sampling frequency, there is an indication that 14-17 miles below Iron Gate Dam at both RM 176 and RM 173 that the periphytic diatom Cocconeis increases substantially in importance (Figure 18; Table 4).

KIER ASSOCIATES/AQUATIC ECOSYSTEM SCIENCES – ANALYSIS OF KLAMATH RIVER PHYTOPLANKTON, 2001-2004
26
010203040506070
Bio
volu
me
(mm
3 /L) UKL Pel Mar
r.m. 255.50
1/2001 4/2001 7/2001 10/2001 1/2002 4/2002 7/2002 10/2002 1/2003 4/2003 7/2003 10/2003 1/2004 4/2004 7/2004 10/2004 1/20050
102030405060708090
100
% C
ompo
sitio
n
UKL Pel Marr.m. 255.50
0
10
20
30
40
Bio
volu
me
(mm
3 /L) Link Mouth
r.m. 253.12
1/2001 4/2001 7/2001 10/2001 1/2002 4/2002 7/2002 10/2002 1/2003 4/2003 7/2003 10/2003 1/2004 4/2004 7/2004 10/2004 1/20050
102030405060708090
100
% C
ompo
sitio
n
Link Mouthr.m. 253.12
0
5
10
15
Bio
volu
me
(mm
3 /L) Keno Res 66
r.m. 234.9
1/2001 4/2001 7/2001 10/2001 1/2002 4/2002 7/2002 10/2002 1/2003 4/2003 7/2003 10/2003 1/2004 4/2004 7/2004 10/2004 1/2005
Date
0102030405060708090
100
% C
ompo
sitio
n
Keno Res 66r.m. 234.9
Figure 15. Biovolume and percent biovolume of dominant species of phytoplankton for surface samples collected in the years 2001-2004. Sites are listed in downstream order: Upper Klamath Lake at Pelican Marina, Link River at its mouth, and Keno Reservoir at the Highway 66 Bridge.
Actinastrum hantzschii (ChlChlamydomonas sp. (ChlAnabaena sp. (Cya)Microcystis aeruginosa (Cya)Aphanizomenon flos-aquae (Cya)
Cymbella sp. (Dia)Cyclotella sp. (Dia)Asterionella formosa (Dia)Rhodomonas minuta (Cry)Cryptomonas sp. (Cry)
Melosira sp. (Dia)Gomphonema sp. (Dia)Fragilaria sp. (Dia)Diatoma sp. (Dia)Cocconeis sp. (Dia)
OtherStephanodiscus sp. (Dia)Nitzschia sp. (Dia)Navicula sp. (Dia)

KIER ASSOCIATES/AQUATIC ECOSYSTEM SCIENCES – ANALYSIS OF KLAMATH RIVER PHYTOPLANKTON, 2001-2004
27
0
5
10
15
Bio
volu
me
(mm
3 /L) Bel Keno Dam
r.m. 233.34
1/2001 4/2001 7/2001 10/2001 1/2002 4/2002 7/2002 10/2002 1/2003 4/2003 7/2003 10/2003 1/2004 4/2004 7/2004 10/2004 1/20050
102030405060708090
100
% C
ompo
sit io
n
Bel Keno Damr.m. 233.34
01234567
Bio
v olu
me
(mm
3 /L) Abv JCB Res
r.m. 228.22
1/2001 4/2001 7/2001 10/2001 1/2002 4/2002 7/2002 10/2002 1/2003 4/2003 7/2003 10/2003 1/2004 4/2004 7/2004 10/2004 1/20050
102030405060708090
100
% C
ompo
sit io
n
Abv JCB Resr.m. 228.22
01234567
Bio
v olu
me
(mm
3 /L) JCB Res
r.m. 224.78
1/2001 4/2001 7/2001 10/2001 1/2002 4/2002 7/2002 10/2002 1/2003 4/2003 7/2003 10/2003 1/2004 4/2004 7/2004 10/2004 1/2005
Date
0102030405060708090
100
% C
ompo
sit io
n
JCB Resr.m. 224.78
Figure 16. Biovolume and percent biovolume of dominant species of phytoplankton for surface samples collected in the years 2001-2004. Sites are listed in downstream order: Keno Dam, Above J.C. Boyle Reservoir, and J.C. Boyle Reservoir.
Actinastrum hantzschii (ChlChlamydomonas sp. (ChlAnabaena sp. (Cya)Microcystis aeruginosa (Cya)Aphanizomenon flos-aquae (Cya)
Cymbella sp. (Dia)Cyclotella sp. (Dia)Asterionella formosa (Dia)Rhodomonas minuta (Cry)Cryptomonas sp. (Cry)
Melosira sp. (Dia)Gomphonema sp. (Dia)Fragilaria sp. (Dia)Diatoma sp. (Dia)Cocconeis sp. (Dia)
OtherStephanodiscus sp. (Dia)Nitzschia sp. (Dia)Navicula sp. (Dia)

KIER ASSOCIATES/AQUATIC ECOSYSTEM SCIENCES – ANALYSIS OF KLAMATH RIVER PHYTOPLANKTON, 2001-2004
28
0
1
2
3B
iovo
lum
e ( m
m3 /L
) Bel JCB Damr.m. 224.6
1/2001 4/2001 7/2001 10/2001 1/2002 4/2002 7/2002 10/2002 1/2003 4/2003 7/2003 10/2003 1/2004 4/2004 7/2004 10/2004 1/20050
102030405060708090
100
% C
ompo
sitio
n
Bel JCB Damr.m. 224.6
0.00.10.20.30.40.50.60.70.80.9
Bio
volu
me
(mm
3 /L) Abv JCBPH
r.m. 220.4
1/2001 4/2001 7/2001 10/2001 1/2002 4/2002 7/2002 10/2002 1/2003 4/2003 7/2003 10/2003 1/2004 4/2004 7/2004 10/2004 1/20050
102030405060708090
100
% C
ompo
sitio
n
Abv JCBPHr.m. 220.4
0.0
0.5
1.0
1.5
2.0
Bio
volu
me
(mm
3 /L) Abv Copco
r.m. 206.42
1/2001 4/2001 7/2001 10/2001 1/2002 4/2002 7/2002 10/2002 1/2003 4/2003 7/2003 10/2003 1/2004 4/2004 7/2004 10/2004 1/2005
Date
0102030405060708090
100
% C
ompo
sitio
n
Abv Copcor.m. 206.42
Figure 17. Biovolume and percent biovolume of dominant species of phytoplankton for surface samples collected in the years 2001-2004. Sites are listed in downstream order: Below J.C. Boyle Dam, Above J.C. Boyle Powerhouse, and Above Copco Reservoir.
Actinastrum hantzschii (ChlChlamydomonas sp. (ChlAnabaena sp. (Cya)Microcystis aeruginosa (Cya)Aphanizomenon flos-aquae (Cya)
Cymbella sp. (Dia)Cyclotella sp. (Dia)Asterionella formosa (Dia)Rhodomonas minuta (Cry)Cryptomonas sp. (Cry)
Melosira sp. (Dia)Gomphonema sp. (Dia)Fragilaria sp. (Dia)Diatoma sp. (Dia)Cocconeis sp. (Dia)
OtherStephanodiscus sp. (Dia)Nitzschia sp. (Dia)Navicula sp. (Dia)

KIER ASSOCIATES/AQUATIC ECOSYSTEM SCIENCES – ANALYSIS OF KLAMATH RIVER PHYTOPLANKTON, 2001-2004
29
0102030405060
Bio
volu
me
(mm
3 / L) Copco Res
r.m. 198.74
1/2001 4/2001 7/2001 10/2001 1/2002 4/2002 7/2002 10/2002 1/2003 4/2003 7/2003 10/2003 1/2004 4/2004 7/2004 10/2004 1/20050
102030405060708090
100
% C
ompo
sitio
n
Copco Resr.m. 198.74
0
1
2
3
Bio
volu
me
(mm
3 /L) Below Copco
r.m. 196.45
1/2001 4/2001 7/2001 10/2001 1/2002 4/2002 7/2002 10/2002 1/2003 4/2003 7/2003 10/2003 1/2004 4/2004 7/2004 10/2004 1/20050
102030405060708090
100
% C
ompo
sitio
n
Below Copcor.m. 196.45
0
5
10
15
20
Bio
volu
me
(mm
3 / L) Iron Gate Res
r.m. 190.19
1/2001 4/2001 7/2001 10/2001 1/2002 4/2002 7/2002 10/2002 1/2003 4/2003 7/2003 10/2003 1/2004 4/2004 7/2004 10/2004 1/2005
Date
0102030405060708090
100
% C
ompo
sitio
n
Iron Gate Resr.m. 190.19
Figure 18. Biovolume and percent biovolume of dominant species of phytoplankton for surface samples collected in the years 2001-2004. Sites are listed in downstream order: Copco Reservoir, Below Copco Dam, and Iron Gate Reservoir.
Actinastrum hantzschii (ChlChlamydomonas sp. (ChlAnabaena sp. (Cya)Microcystis aeruginosa (Cya)Aphanizomenon flos-aquae (Cya)
Cymbella sp. (Dia)Cyclotella sp. (Dia)Asterionella formosa (Dia)Rhodomonas minuta (Cry)Cryptomonas sp. (Cry)
Melosira sp. (Dia)Gomphonema sp. (Dia)Fragilaria sp. (Dia)Diatoma sp. (Dia)Cocconeis sp. (Dia)
OtherStephanodiscus sp. (Dia)Nitzschia sp. (Dia)Navicula sp. (Dia)

KIER ASSOCIATES/AQUATIC ECOSYSTEM SCIENCES – ANALYSIS OF KLAMATH RIVER PHYTOPLANKTON, 2001-2004
30
0123456
Bio
volu
me
( mm
3 /L) Iron Gate Dam
r.m. 189.73
1/2001 4/2001 7/2001 10/2001 1/2002 4/2002 7/2002 10/2002 1/2003 4/2003 7/2003 10/2003 1/2004 4/2004 7/2004 10/2004 1/20050
102030405060708090
100
% C
ompo
siti o
n
Iron Gate Damr.m. 189.73
0.00.10.20.30.40.50.60.7
Biov
o lum
e (m
m3 /L
) I-5 Collier Rest Stopr.m. 176
1/2001 4/2001 7/2001 10/2001 1/2002 4/2002 7/2002 10/2002 1/2003 4/2003 7/2003 10/2003 1/2004 4/2004 7/2004 10/2004 1/20050
102030405060708090
100
% C
ompo
siti o
n
I-5 Collier Rest Stopr.m. 176
0
1
2
3
Bio
volu
me
( mm
3 /L) Above Shasta
r.m. 173
1/2001 4/2001 7/2001 10/2001 1/2002 4/2002 7/2002 10/2002 1/2003 4/2003 7/2003 10/2003 1/2004 4/2004 7/2004 10/2004 1/2005
Date
0102030405060708090
100
% C
ompo
siti o
n
Above Shastar.m. 173
Figure 19. Biovolume and percent biovolume of dominant species of phytoplankton for surface samples collected in the years 2001-2004. Sites are listed in downstream order: Iron Gate Dam, Above the Shasta River, at the Interstate 5 Collier Rest Area.
Actinastrum hantzschii (ChlChlamydomonas sp. (ChlAnabaena sp. (Cya)Microcystis aeruginosa (Cya)Aphanizomenon flos-aquae (Cya)
Cymbella sp. (Dia)Cyclotella sp. (Dia)Asterionella formosa (Dia)Rhodomonas minuta (Cry)Cryptomonas sp. (Cry)
Melosira sp. (Dia)Gomphonema sp. (Dia)Fragilaria sp. (Dia)Diatoma sp. (Dia)Cocconeis sp. (Dia)
OtherStephanodiscus sp. (Dia)Nitzschia sp. (Dia)Navicula sp. (Dia)

KIER ASSOCIATES/AQUATIC ECOSYSTEM SCIENCES – ANALYSIS OF KLAMATH RIVER PHYTOPLANKTON, 2001-2004
31
Table 4. Biovolume for 10 most dominant species at each site, for surface samples collected in the years 2001-2004, June 1 – Sept 30. See Table 5 for a key to four-letter species codes.
Species ranked by mean biovolume (mm3/L) for samples June 1 - Sept. 30 River Mile
Site Name N All 1 2 3 4 5 6 7 8 9 10
Species COPC APFA SNUL EPSX GFSB DTVL MLVR OSXX MLGR RHCU Mean 0.4 0.1578 0.1519 0.0220 0.0188 0.0110 0.0101 0.0080 0.0068 0.0058 0.0048
173/ 176
I-5 Shasta 7
Percent 36.8% 35.4% 5.1% 4.4% 2.6% 2.4% 1.9% 1.6% 1.4% 1.1% Species APFA FRCR MLGR GTEC CXER DTVL NZPL MLGA COPC MSAE Mean 1.4 0.7154 0.2200 0.2059 0.0501 0.0426 0.0248 0.0237 0.0185 0.0171 0.0112 189.73 IG
Dam 15 Percent 50.8% 15.6% 14.6% 3.6% 3.0% 1.8% 1.7% 1.3% 1.2% 0.8% Species APFA GTEC FRCR CXER MLGR NZPL CJHR MSAE RDMN MLGAMean 3.0 2.4966 0.1724 0.0918 0.0456 0.0391 0.0322 0.0270 0.0080 0.0072 0.0049 190.19 IG Res 15
Percent 83.0% 5.7% 3.0% 1.5% 1.3% 1.1% 0.9% 0.3% 0.2% 0.2% Species APFA NZPL MSAE FRCR MLAM MLGR MLGA CXER EDEL STBI Mean 0.5 0.1653 0.0994 0.0941 0.0767 0.0261 0.0193 0.0144 0.0109 0.0044 0.0040 196.45 Bel
Copco 12 Percent 30.4% 18.3% 17.3% 14.1% 4.8% 3.6% 2.7% 2.0% 0.8% 0.7% Species APFA MSAE NZPL FRCR CXER CHXX MLGR CJHR RDMN COPC Mean 7.9 5.6065 1.1307 0.8561 0.2084 0.0538 0.0083 0.0069 0.0047 0.0040 0.0035 198.74 Copco
Res 16 Percent 70.8% 14.3% 10.8% 2.6% 0.7% 0.1% 0.1% 0.1% 0.1% 0.0% Species APFA ATHN COPC NVTP DTVL NZDS CXER RHCU NZFR STHN Mean 0.4 0.0763 0.0373 0.0320 0.0223 0.0207 0.0168 0.0166 0.0116 0.0105 0.0104 206.42 Abv
Copco 14 Percent 20.1% 9.8% 8.4% 5.9% 5.5% 4.4% 4.4% 3.1% 2.8% 2.7% Species DTVL APFA COPC MLAM MSAE ATHN NVTP RHCU CCMG SNUL Mean 0.1 0.0146 0.0138 0.0112 0.0074 0.0065 0.0062 0.0059 0.0058 0.0054 0.0043 220.40
Abv JCB PH
13 Percent 11.4% 10.7% 8.7% 5.8% 5.0% 4.8% 4.6% 4.5% 4.2% 3.3% Species APFA STHN CCMG MLAM MSAE CXER MLGR SNUL SCQD ATHNMean 0.6 0.2092 0.0713 0.0402 0.0359 0.0307 0.0273 0.0217 0.0162 0.0154 0.0136 224.60
Bel JCB Dam
12 Percent 36.6% 12.5% 7.0% 6.3% 5.4% 4.8% 3.8% 2.8% 2.7% 2.4% Species APFA ATHN CXER STHN MLAM MLGR CCMG SCQD SCAC SFSR Mean 2.0 0.8004 0.2681 0.2570 0.1205 0.1138 0.0814 0.0619 0.0283 0.0257 0.0231 224.78 JCB
Res 9 Percent 40.7% 13.6% 13.1% 6.1% 5.8% 4.1% 3.2% 1.4% 1.3% 1.2% Species APFA CCMG STHN SNUL MLAM COPC CXER ATHN MLGR NVCV Mean 1.2 0.5575 0.1097 0.0922 0.0568 0.0452 0.0437 0.0369 0.0366 0.0277 0.0148 228.22
Abv JCB Res
12 Percent 47.2% 9.3% 7.8% 4.8% 3.8% 3.7% 3.1% 3.1% 2.3% 1.3% Species APFA CXER STHN CCMG STBI MLGR NZPL MLGA RDMN NZAC Mean 3.8 2.7610 0.4814 0.1934 0.1771 0.0258 0.0200 0.0163 0.0146 0.0102 0.0096 233.34 Keno
Dam 12 Percent 72.5% 12.6% 5.1% 4.7% 0.7% 0.5% 0.4% 0.4% 0.3% 0.3% Species APFA FRCR CXER COPC STAS NZPL GFSB MLGR STAM DTVL Mean 8.6 8.5183 0.0224 0.0206 0.0091 0.0089 0.0086 0.0075 0.0057 0.0037 0.0029 253.12 Link
Mouth 19 Percent 98.7% 0.3% 0.2% 0.1% 0.1% 0.1% 0.1% 0.1% 0.0% 0.0%
Species APFA MSAE CXER CHXX CXOV RDMN KMXX GD XX MLGR
MG XX
Mean 19.1 18.7380 0.2018 0.0580 0.0303 0.0182 0.0129 0.0120 0.0069 0.0058 0.0056 255.50 UKL Pel Mar
8
Percent 98.1% 1.1% 0.3% 0.2% 0.1% 0.1% 0.1% 0.0% 0.0% 0.0%

KIER ASSOCIATES/AQUATIC ECOSYSTEM SCIENCES – ANALYSIS OF KLAMATH RIVER PHYTOPLANKTON, 2001-2004
32
Table 5. Key to four-letter species codes for most dominant phytoplankton species at sites listed in Table 4 for surface samples in years 2001-2004, with species listed in alphabetical order. Species Code Species Name Major Taxonomic Group APFA Aphanizomenon flos-aquae Cyanophyta ATHN Actinastrum hantzschii Chlorophyta CCMG Cyclotella meneghiniana Diatoms CHXX Chlamydomonas sp Chlorophyta CJHR Ceratium hirundinella Pyrrophyta COPC Cocconeis placentula Diatoms CXER Cryptomonas erosa Cryptophyta CXOV Cryptomonas ovata Cryptophyta DTVL Diatoma vulgare Diatoms EDEL Eudorina elegans Chlorophyta EPSX Epithemia sorex Diatoms FRCR Fragilaria crotonensis Diatoms GDXX Glenodinium sp Pyrrophyta GFSB Gomphonema subclavatum Diatoms GTEC Gloeotrichia echinulata Cyanophyta KMXX Chromulina sp Chrysophyta MGXX Mougeotia sp Chlorophyta MLAM Melosira ambigua Diatoms MLGA Melosira granulata angustissima Diatoms MLGR Melosira granulata Diatoms MLVR Melosira varians Diatoms MSAE Microcystis aeruginosa Cyanophyta NVCV Navicula cryptocephala veneta Diatoms NVTP Navicula tripunctata Diatoms NZAC Nitzschia acicularis Diatoms NZDS Nitzschia dissipata Diatoms NZFR Nitzschia frustulum Diatoms NZPL Nitzschia palea Diatoms OSXX Oscillatoria sp Cyanophyta RDMN Rhodomonas minuta Cryptophyta RHCU Rhoicosphenia curvata Diatoms SCAC Scenedesmus acuminatus Chlorophyta SCQD Scenedesmus quadricauda Chlorophyta SFSR Sphaerocystis schroeteri Chlorophyta SNUL Synedra ulna Diatoms STAM Stephanodiscus astraea minutula Diatoms STAS Stephanodiscus astraea Diatoms STBI Stephanodiscus binderanus Diatoms STHN Stephanodiscus hantzschii Diatoms

KIER ASSOCIATES/AQUATIC ECOSYSTEM SCIENCES – ANALYSIS OF KLAMATH RIVER PHYTOPLANKTON, 2001-2004
33
The overall longitudinal trend for individual species for the June-September period showed a declining trend in APFA from UKL to above Copco and a subsequent increase in Copco and Iron Gate Reservoirs (Table 4). As expected based on the trend in both nitrogen-fixing phytoplankton (NFP) and Cyanophyta described above, 85.1% of the biovolume in Copco reservoir surface stations was comprised of APFA and MSAE, and 88.7% was comprised of APFA and GTEC in Iron Gate Reservoir.
SUMMARY AND CONCLUSIONS The purpose of this report was to provide an analysis of PacifiCorp’s 2001-2004 phytoplankton dataset for the Klamath River from Upper Klamath Lake to above the Shasta River’s confluence with the Klamath. Due to the importance of Upper Klamath Lake (UKL) to the Klamath River’s nutrient and algal dynamics, phytoplankton data collected by the Klamath Tribes near the outlet of UKL were also used to provide a context for comparison. Longitudinal trends for two time periods (all available sample dates and, then, June-September) showed the same basic trend of decreasing total phytoplankton biovolume, decreasing nitrogen-fixing phytoplankton (NFP) biovolume, and decreasing NFP percent composition from UKL to the station above Copco Reservoir. Downstream from this station these trends reverse as the river continues through the impounded areas of Copco and Iron Gate reservoirs, with total biovolume, NFP biovolume, and percent NFP all then increasing substantially, especially during the June-September period. The most pronounced change occurred in the upper 25th percentile (upper quartile) of the distribution, where compared to an NFP composition of 24.5% above Copco, reservoir NFP percent composition values returned to levels closer to those of UKL, exceeding 90% in both reservoirs. Thus, despite a decline in the downstream magnitude along the longitudinal profile between UKL and above Copco Reservoir, all parameters (total biovolume, NFP biovolume, and NFP percent biovolume) showed clear increases (by tens to hundreds of times) in the Copco/Iron Gate Reservoir complex during the June-September period. Although not as pronounced as for the analyses of phytoplankton biovolume, the longitudinal trend in chlorophyll a, which provides an approximation of algal biomass, showed the same basic decreasing trend between UKL and above Copco Reservoir, and then increased (both median and upper quartile values) as the river traveled through the reservoir complex. As expected as the system changed from the lacustrine environment of UKL to the riverine environment of the Klamath River, diatoms increased in prevalence downstream before decreasing again in the Copco/Iron Gate Reservoir complex as the Cyanophyta again dominated. Moreover, because Cyanophyta (blue-green algae) are comprised chiefly of algae from the NFP group, the longitudinal trend in both total biovolume and percent biovolume of the Cyanophyta was similar to that of NFP. The trend in Cyanophyta percent composition was more pronounced through the reservoir complex than absolute biomass, with levels in Copco and Iron Gate increasing from 5% above Copco to 50% and 82% in Copco and Iron Gate Reservoirs, respectively. Earlier analyses by Kann (2006) showed this same trend for Microcystis aeruginosa, a species that does not fix nitrogen, but that is a member of the Cyanophyta.

KIER ASSOCIATES/AQUATIC ECOSYSTEM SCIENCES – ANALYSIS OF KLAMATH RIVER PHYTOPLANKTON, 2001-2004
34
Consistently more pronounced trends in the upper quartile (UQ) relative to the median indicate that periodic high values or bloom events of NFP and Cyanophyta occurred in the reservoir complex relative to stations directly upstream. Periodic multiple depth sampling in JC Boyle, Copco, and Iron Gate Reservoirs from 2001-2004 tend to indicate that the composition of diatoms increases relative to the surface samples, and as expected, based on the dilution of surface water where algae tend to be more concentrated, overall water column biovolume was substantially lower than surface samples in all three reservoirs. Although overall biovolume was lower in the depth-integrated samples, they showed a seasonal pattern of blue-green dominance similar to the surface samples. These samples indicate the buoyant nature of most Cyanophyta which tend to be concentrated near the surface. Thus, the Iron Gate Dam station (RM 189.73) which consists of water drawn from ~30-40 ft at the outlet of Iron Gate Reservoir, showed reduced composition of Cyanophyta, although relative to Abv. Copco, the levels were higher and the period of dominance was prolonged. Aphanizomenon (APFA) was the major cyanophyte leaving UKL, decreasing in importance downstream to the bypass reach where the community was more diverse and tended to be dominated by periphytic or attached diatom genera such as Diatoma, Cocconeis, Gomphonema, Navicula, and Nitzschia. Periphytic species then declined substantially and were replaced by more planktonic species in the Copco/Iron Gate Reservoir complex with APFA increasing from 20.1% of the June-September biovolume above Copco to 70.8% of the biovolume in Copco Reservoir. The second most dominant species in Copco reservoir for this period was Microcystis aeruginosa (MSAE, 14.3%), a species that did not rank in the top ten dominant species above Copco, and was present at levels ≤5% at stations directly upstream. In Iron Gate Reservoir, APFA again increased to 83% of the biovolume, with Gloeotrichia (GTEC), another nitrogen-fixing blue-green, ranking second at 5.7%. MSAE decreased in importance in Iron Gate Reservoir, but did show annual peaks in most years at the site below Iron Gate Dam (RM 189.73) where MSAE comprised 16.8% of biovolume in August 2004 and 6.7% in September 2004. The overall longitudinal trend for phytoplankton biovolume and important nitrogen-fixing and bloom forming species all confirm the same declining trend from UKL to above Copco Reservoir, with a subsequent increase in the Copco/Iron Gate Reservoir complex. These results are similar to the analysis of the PacifiCorp dataset for MSAE only (Kann 2006), where analyses showed increased incidence and magnitude of MSAE in Copco and Iron Gate Reservoirs relative to stations upstream. Although MSAE is not a nitrogen–fixing species, it is an important member of the Cyanophyta. As stated in Kann (2006) and Kann and Corum (2006) this trend of increasing Cyanophyta is consistent with literature showing that MSAE and other buoyant cyanobacteria such as APFA do not dominate in river conditions of turbulent mixing such as that known to occur in the Klamath River above Copco and Iron Gate Reservoirs. Because cyanophytes tend to thrive at low turbulent diffusivity (calm-stable conditions) when their flotation velocity exceeds the rate of turbulent mixing, they are favored in lake and reservoir environments that tend to be warmer and less turbulent than riverine ones (Reynolds 1986). In conclusion, these analyses show that although the Klamath River receives a large loading of algal biomass (made up largely of the cyanophyte, APHA) from UKL, the analyzed data provide clear evidence that Copco and Iron Gate Reservoirs are providing habitat conditions that foster increased overall phytoplankton biovolume comprised largely of nitrogen-fixing cyanophyte species as well as

KIER ASSOCIATES/AQUATIC ECOSYSTEM SCIENCES – ANALYSIS OF KLAMATH RIVER PHYTOPLANKTON, 2001-2004
35
toxigenic MSAE. The relative increase in nitrogen-fixing species is important ecologically because these species have the potential to introduce additional nitrogen into the Klamath River system. Although nitrogen increases from algal fixation are not separable from reservoir sediment loading of nitrogen, nutrient budgets in Copco and Iron Gate Reservoirs for the year 2002 indicated that the reservoirs can act as both sources and sinks for nitrogen during the algal growing season (Kann and Asarian 2005). Thus, this analysis underscores the need to account for reservoir hydrologic and nutrient alterations that foster increased phytoplankton growth in the Klamath River. Evaluation of impaired water quality due to hydrologic alterations attributable to the Klamath Hydroelectric Project should include such reservoir alterations as increased water retention time, higher water column stability, and internal sediment loading of nutrients. Although upstream loading of nutrients and algae are important, alterations to the river such as these can contribute to a further increase in algal production, especially of blue-green algal blooms.

KIER ASSOCIATES/AQUATIC ECOSYSTEM SCIENCES – ANALYSIS OF KLAMATH RIVER PHYTOPLANKTON, 2001-2004
36
LITERATURE CITED Asarian, E. and J. Kann. 2006. Klamath River Nitrogen Loading and Retention Dynamics, 1996-
2004. Kier Associates Final Technical Report to the Yurok Tribe Environmental Program, Klamath, California. 56pp + appendices.
Kann, J. 1998. Ecology and water quality dynamics of a shallow hypertrophic lake dominated by
Cyanobacteria (Aphanizomenon flos-aquae). Doctoral Dissertation. University of North Carolina. Curriculum in Ecology. Chapel Hill, North Carolina.
Kann, J. and E. B. Welch. 2005. Wind control on water quality in shallow, hypereutrophic Upper
Klamath Lake, Oregon. Lake Reserv. Manage. 21(2):149-158 Kann, J. 2006. Microcystis aeruginosa Occurrence in the Klamath River System of Southern
Oregon and Northern California. Technical Memorandum Prepared for the Yurok Tribe Environmental and Fisheries Programs by Aquatic Ecosystem Sciences LLC, Ashland, OR. February 3, 2006. 26 pp. + appendices.
Kann, J., and E. Asarian. 2005. 2002 Nutrient and Hydrologic Loading to Iron Gate and Copco
Reservoirs, California. Kier Associates Final Technical Report to the Karuk Tribe Department of Natural Resources, Orleans, California.
Kann, J. and S. Corum. 2006. Summary of 2005 Toxic Microcystis aeruginosa Trends in Copco and
Iron Gate Reservoirs on the Klamath River, CA. Technical Memorandum Prepared for the Karuk Tribe of California by Aquatic Ecosystem Sciences LLC, Ashland, OR. March 2006.
Raymond, R. 2005. E & S Environmental Chemistry, Inc Technical Memorandum: Methods and
Data for PacifiCorp Phytoplankton Sampling in the Klamath River System, 2001-2005. Reynolds, C.S. 1986. The ecology of freshwater phytoplankton. Cambridge University Press,
Cambridge, UK. 384p. ELECTRONIC APPENDICES ON CD A. Spreadsheet of PacifiCorp 2001-2004 phytoplankton data.