longi green energy technology target price change...
TRANSCRIPT
See Appendix A-1 for Analyst Certification, Important Disclosures and non-US research analyst disclosures. Citi Research is a division of Citigroup Global Markets Inc. (the "Firm"), which does and seeks to do business with companies covered in its research reports. As a result, investors should be aware that the Firm may have a conflict of interest that could affect the objectivity of this report. Investors should consider this report as only a single factor in making their investment decision. Certain products (not inconsistent with the author's published research) are available only on Citi's portals. Not for distribution in the People's Republic of China, excluding the Hong Kong Special Administrative Region and Qualified Foreign Institutional Investors.
20 Mar 2017 04:30:06 ET │ 23 pages Solar Power Asia │ China
LONGi Green Energy Technology (601012.SS) Robust EPS Growth to Continue Into 2017E; Raise TP to Rmb18.3
Summary — We reiterate Buy on LONGi Green Energy (LONGi), and raise TP to Rmb18.3 (from Rmb17.3), still set at 20x 2017E PER (1x PEG) as we raise 2017-18E EPS by 6-10%. We expect solid EPS growth for LONGi in 2017E, fuelled by: 1) market share gain of mono-Si solar products in China, from 26% to 35% 2017E; 2) LONGi’s wafer and module capacity expansion plans of 60%/30%; and 3) its cost reduction of 9-10% yoy. Based on this, LONGi is likely to achieve 20% EPS CAGR over 2016-19E, implying current valuation of 17.2x 2017E PER is attractive.
Multi-Si to mono-Si shift to continue – We expect market share of mono-Si products to further +9ppt to 35% in 2017E for China, and +8ppt to 32% globally, driven by: 1) China’s strong push on front runner program to encourage technological enhancement; and 2) ramp-up of distributed solar projects, both favoring high-efficiency mono-Si products. According to management, LONGi’s orders for mono-Si wafer and module have already been fully booked for 1H17, and new orders signed recently can only be delivered in 2H17.
Capacity expansion to drive sales volume growth — LONGi plans to expand its wafer and module capacity to 12GW/6.5GW by end-2017, up 60%/30% yoy, with its capex mainly funded by bank facilities, CB issuance, and JV partnerships. Its wafer and module shipment should increase to 9.1GW/4.5GW, +36%/+106% yoy from 6.7GW/2.2GW in 2016.
Further cost reduction of 9-10% in 2017E — LONGi achieved 28.2%/27.2% gross margins for wafer and module segments in 2016, both well above peers and industry expectations. As highlighted in our initiation report, we believe LONGi’s cost advantage is sustainable due to: 1) economies of scale; 2) equipment co-development with Dalian Linton, and 3) lower capex. Capitalizing on these, LONGi’s wafer and module unit cost should continue to fall by 10%/9% yoy in 2017E.
Estimate Change Target Price Change
Asian Utilities
China Solar Sector
Scott Chui AC +852-2501-2262 [email protected]
Pierre Lau, CFA [email protected]
Buy 1 Price (17 Mar 17 15:00) Rmb15.720 Target price Rmb18.300
from Rmb17.300 Expected share price return 16.4% Expected dividend yield 1.8% Expected total return 18.2% Market Cap Rmb31,375M US$4,545M
Price Performance (RIC: 601012.SS, BB: 601012 CH)
Statistical Abstract
Year to Net Profit Diluted EPS EPS growth P/E P/B ROE Yield 31 Dec (RmbM) (Rmb) (%) (x) (x) (%) (%)
2015A 549 0.322 75.8 48.8 4.9 12.4 0.3
2016A 1,556 0.855 165.1 18.4 3.1 19.8 0.6
2017E 1,842 0.913 6.8 17.2 2.8 17.2 1.8
2018E 2,374 1.177 28.9 13.4 2.4 19.4 2.3
2019E 2,985 1.480 25.7 10.6 2.0 21.0 2.9 Source: Powered by dataCentral
Citi Research
Equities

LONGi Green Energy Technology (601012.SS) 20 March 2017 Citi Research
2
601012.SS: Fiscal year end 31-Dec
Price: Rmb15.720; TP: Rmb18.300; Market Cap: Rmb31,375m; Recomm: Buy Profit & Loss (Rmbm)
2015 2016 2017E 2018E 2019E Valuation ratios
2015 2016 2017E 2018E 2019E
Sales revenue 5,937 11,421 15,140 20,477 23,214 PE (x) 48.8 18.4 17.2 13.4 10.6 Cost of sales -4,736 -8,361 -11,318 -15,458 -17,313 PB (x) 4.9 3.1 2.8 2.4 2.0 Gross profit 1,201 3,059 3,822 5,019 5,901 EV/EBITDA (x) 33.5 13.5 10.7 8.8 7.4 Gross Margin (%) 20.2 26.8 25.2 24.5 25.4 FCF yield (%) -2.3 -5.4 -17.3 -13.2 2.9 EBITDA (Adj) 941 2,245 3,060 4,371 5,510 Dividend yield (%) 0.3 0.6 1.8 2.3 2.9 EBITDA Margin (Adj) (%) 15.9 19.7 20.2 21.3 23.7 Payout ratio (%) 14 12 30 30 30 Depreciation -275 -390 -738 -1,194 -1,517 ROE (%) 11.8 19.7 17.2 19.4 21.0 Amortisation -7 -8 -8 -8 -8 Cashflow (Rmbm) 2015 2016 2017E 2018E 2019E EBIT (Adj) 659 1,847 2,314 3,169 3,985 EBITDA 941 2,245 3,060 4,371 5,510 EBIT Margin (Adj) (%) 11.1 16.2 15.3 15.5 17.2 Working capital -605 -2,270 -1,261 -1,626 -686 Net interest -80 -85 -197 -391 -491 Other 28 561 -467 -739 -879 Associates 14 17 17 30 96 Operating cashflow 365 536 1,333 2,007 3,946 Non-op/Except -1 13 0 0 0 Capex -980 -2,082 -6,812 -6,203 -3,013 Pre-tax profit 593 1,793 2,135 2,808 3,590 Net acq/disposals -146 -68 -180 0 0 Tax -72 -242 -288 -379 -484 Other -90 -2 0 0 0 Extraord./Min.Int./Pref.div. 0 -4 -5 -56 -121 Investing cashflow -1,216 -2,152 -6,992 -6,203 -3,013 Reported net profit 520 1,547 1,842 2,374 2,985 Dividends paid -64 -79 -553 -712 -896 Net Margin (%) 8.8 13.5 12.2 11.6 12.9 Financing cashflow 1,759 5,001 4,665 1,875 782 Core NPAT 549 1,556 1,842 2,374 2,985 Net change in cash 918 3,421 -994 -2,322 1,714 Per share data 2015 2016 2017E 2018E 2019E Free cashflow to s/holders -615 -1,546 -5,479 -4,196 933 Reported EPS (Rmb) 0.305 0.850 0.913 1.177 1.480 Core EPS (Rmb) 0.322 0.855 0.913 1.177 1.480 DPS (Rmb) 0.045 0.100 0.277 0.357 0.449 CFPS (Rmb) 0.214 0.294 0.661 0.995 1.956 FCFPS (Rmb) -0.361 -0.849 -2.716 -2.080 0.462 BVPS (Rmb) 3.193 5.057 5.705 6.566 7.673 Wtd avg ord shares (m) 1,704 1,799 1,996 1,996 1,996 Wtd avg diluted shares (m) 1,704 1,820 2,017 2,017 2,017 Growth rates 2015 2016 2017E 2018E 2019E Sales revenue (%) 61.7 92.4 32.6 35.2 13.4 EBIT (Adj) (%) 78.2 180.2 25.3 36.9 25.7 Core NPAT (%) 85.4 183.2 18.4 28.9 25.7 Core EPS (%) 75.8 165.1 6.8 28.9 25.7 Balance Sheet (Rmbm) 2015 2016 2017E 2018E 2019E Cash & cash equiv. 2,246 5,817 4,823 2,501 4,215 Accounts receivables 2,081 3,833 5,289 7,433 8,427 Inventory 1,534 1,213 1,816 2,737 3,102 Net fixed & other tangibles 3,432 6,716 12,790 17,799 19,295 Goodwill & intangibles 134 210 201 193 185 Financial & other assets 781 1,384 2,243 2,898 3,234 Total assets 10,209 19,172 27,162 33,560 38,458 Accounts payable 1,379 2,009 2,720 3,715 4,161 Short-term debt 1,394 2,089 2,139 2,189 2,239 Long-term debt 670 2,384 7,227 9,708 11,215 Provisions & other liab 1,111 2,597 3,364 4,463 5,027 Total liabilities 4,555 9,079 15,449 20,075 22,641 Shareholders' equity 5,634 10,093 11,387 13,104 15,315 Minority interests 19 1 326 381 502 Total equity 5,654 10,094 11,712 13,486 15,817 Net debt (Adj) -182 -1,344 4,543 9,396 9,238 Net debt to equity (Adj) (%) -3.2 -13.3 38.8 69.7 58.4
For definitions of the items in this table, please click here.

LONGi Green Energy Technology (601012.SS) 20 March 2017 Citi Research
3
We reiterate our Buy rating on LONGi Green Energy (LONGi), and raise our target price to Rmb18.3, still set at 20x 2017E PER (1x PEG) as we raise our 2017-18E earnings by 6-10%. We expect solid EPS growth for LONGi in 2017E, fuelled by: 1) market share gain of mono-Si solar products in China, from 26% to 35% 2017E; 2) LONGi’s wafer and module capacity expansion plans of 60%/30%; and 3) cost reduction of 9-10% yoy. Based on this, LONGi is likely to achieve 20% EPS CAGR over 2016-19E, implying current valuation of 17.2x 2017E PER is attractive.
Management maintains positive outlook for 2017 In general, LONGi’s management maintains its positive view towards China’s solar market for the year ahead, and expects ~30GW of solar installation in 2017. Despite our less optimistic outlook for the whole solar industry in China, we are constructive towards the outlook for mono-Si products. As of now, multi-Si to mono-Si shift has been playing out well, and will likely continue for the rest of the year. This is evidenced by the resilient mono-Si wafer pricing, with 1Q17 staying at roughly Rmb6.15/pc (US$0.77/pc) and up from Rmb5.95/pc in 4Q16 (US$0.74/pc), while trend for multi-Si wafer has been declining.
We expect mono-Si products’ market share increase to be fuelled by: 1) increased application in front runner program; and 2) solar DG projects, with China’s mono-Si market share to increase from 24% in 2016 to 35% in 2017E. Global mono-Si market share should also increase from 28% in 2016 to 32% in 2017E, according to solar industry specialist, EnergyTrend.
Figure 1. China: solar market split between multi-Si and mono-Si Figure 2. Global: solar market split between multi-SI and mono-Si
Source: Citi Research Estimates Source: EnergyTrend, Citi Research Estimates
Core advantages in ingoting and wafer-cutting to maintain LONGi targets to increase its wafer shipment from 6.7GW in 2016 to over 9GW in 2017E. As we expect over half of the wafer shipment will be supplied for its own module manufacturing, wafer external sales volume should stay relatively stable. That said, we contend that LONGi’s core advantage still comes from its ingoting and wafer-cutting process, and expect the advantage over other competitors to remain intact, based on the following few reasons:
1. Economies of scale: LONGi had 7.5GW of wafer capacity by end-2016, and plans to increase further to 12GW by end-2017. The sheer size of its production lines is difficult to be copied by its competitors.
0.5 2.1 8.3 8.2 8.3 9.1 9.9
-
5.0
10.0
15.0
20.0
25.0
30.0
35.0
40.0
2014 2015 2016 2017E 2018E 2019E 2020E
GW
Mono-Si Multi-Si
2015-20E capacity CAGRMulti-Si: -6%Mono-Si: 37%
8.9 18.2 21.6 24.2
38.0
53.8 42.5 41.4
-
10.0
20.0
30.0
40.0
50.0
60.0
70.0
80.0
2015 2016 2017 2018
GW
OthersMulti-SiMono-Si
Robust EPS Growth to Continue Into 2017E; Raise TP to Rmb18.3
LONGi Green Energy Technology (601012.SS) 20 March 2017 Citi Research
4
2. Early bird advantage: LONGi has a dedicated R&D team of over 400 members, with two R&D centres in Xi’an and Taizhou. The R&D team leads the industry in terms of new processes and new product launches. For example, the application of diamond-wire and plan of ingoting capacity expansion were both at least half a year ahead of its peers.
3. More advanced equipment with lower capex: LONGi’s equipment is mainly purchased from Dalian Linton, LONGi’s associate company, as well as NAURA Technology Group Co Ltd (002371.SZ, not rated). Specifications for the equipment are provided by LONGi’s R&D team with confidentiality agreements.
With the continuous input in R&D and capex, LONGi targets to reduce its wafer non-silicon cost by ~35% from 2016 to 2020. Based on this plan, we expect LONGi’s wafer non-silicon cost to decline by 10% yoy in 2017E, in line with the Company’s cost reduction plan.
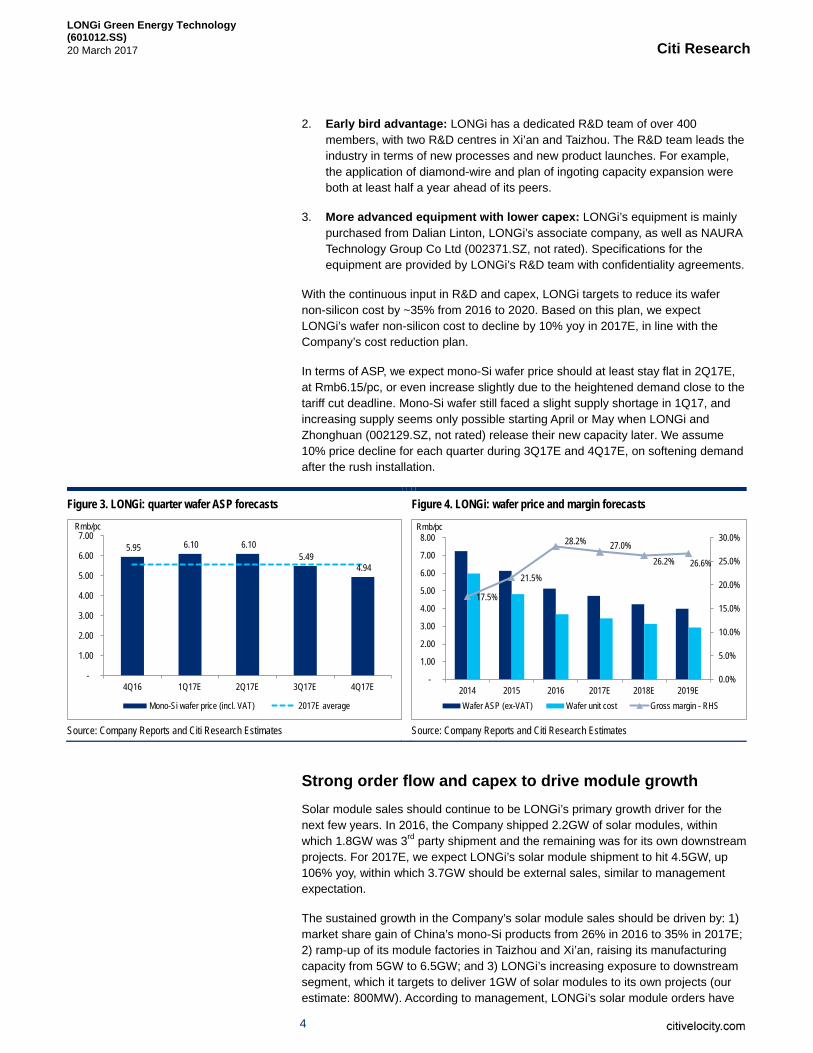
In terms of ASP, we expect mono-Si wafer price should at least stay flat in 2Q17E, at Rmb6.15/pc, or even increase slightly due to the heightened demand close to the tariff cut deadline. Mono-Si wafer still faced a slight supply shortage in 1Q17, and increasing supply seems only possible starting April or May when LONGi and Zhonghuan (002129.SZ, not rated) release their new capacity later. We assume 10% price decline for each quarter during 3Q17E and 4Q17E, on softening demand after the rush installation.
Figure 3. LONGi: quarter wafer ASP forecasts Figure 4. LONGi: wafer price and margin forecasts
Source: Company Reports and Citi Research Estimates Source: Company Reports and Citi Research Estimates
Strong order flow and capex to drive module growth Solar module sales should continue to be LONGi’s primary growth driver for the next few years. In 2016, the Company shipped 2.2GW of solar modules, within which 1.8GW was 3rd party shipment and the remaining was for its own downstream projects. For 2017E, we expect LONGi’s solar module shipment to hit 4.5GW, up 106% yoy, within which 3.7GW should be external sales, similar to management expectation.
The sustained growth in the Company’s solar module sales should be driven by: 1) market share gain of China’s mono-Si products from 26% in 2016 to 35% in 2017E; 2) ramp-up of its module factories in Taizhou and Xi’an, raising its manufacturing capacity from 5GW to 6.5GW; and 3) LONGi’s increasing exposure to downstream segment, which it targets to deliver 1GW of solar modules to its own projects (our estimate: 800MW). According to management, LONGi’s solar module orders have
5.95 6.10 6.10 5.49
4.94
-
1.00
2.00
3.00
4.00
5.00
6.00
7.00
4Q16 1Q17E 2Q17E 3Q17E 4Q17E
Rmb/pc
Mono-Si wafer price (incl. VAT) 2017E average
17.5%
21.5%
28.2% 27.0%26.2% 26.6%
0.0%
5.0%
10.0%
15.0%
20.0%
25.0%
30.0%
-
1.00
2.00
3.00
4.00
5.00
6.00
7.00
8.00
2014 2015 2016 2017E 2018E 2019E
Rmb/pc
Wafer ASP (ex-VAT) Wafer unit cost Gross margin - RHS

LONGi Green Energy Technology (601012.SS) 20 March 2017 Citi Research
5
been fully booked for 1H17, and new orders signed recently can only be delivered in 2H17, illustrating the strong demand from its customers.
Slight margin contraction, but still looks profitable
We estimate that LONGi’s module ASP will decline by 12% yoy, from ~Rmb3.1/W in 2016 to ~Rmb2.7/W in 2017E, due to: 1) elevated price in 1H16 due to solar module shortage especially for PERC products; and 2) increased supply of mono-Si PERC modules in China introducing more competition. In 1Q17, LONGi’s module price was ~Rmb2.8/W (Rmb3.2-3.3/W incl. VAT) for ordinary mono-Si modules, and Rmb3.2/W (Rmb3.7-3.8/W incl. VAT). Assuming 75%/25% proportion for its sales of mono-Si and mono-Si PERC products, we estimate 1Q17E module ASP to be ~Rmb2.9/W, implying that our ASP estimate of Rmb2.7/W for full-year to be quite conservative.
On the other hand, we expect the Company’s unit cost to decline by 9% yoy in 2017E, driven mainly by: 1) cost reduction of ~10% from wafer manufacturing; 2) continuous expansion of solar module facilities; and 3) increasing conversion efficiency.
With these drivers combined, LONGi’s solar module gross margin should normalize to 24.9% in 2017E, from 27.2% in 2016. Despite this, solar module segment should continue to be LONGi’s largest gross profit contributor in 2017E.
Figure 5. LONGi: solar module sales forecasts Figure 6. LONGi: gross profit breakdown by segment (2017E)
Source: Company Reports and Citi Research Estimates Source: Company Reports and Citi Research Estimates
Huge capex for the next few years, but funded by various channels With LONGi’s capacity expansion in ingot, wafer, module, and downstream solar farm segment, we expect capex requirement for the Company to remain significant. For 2017E, management expects to commit ~Rmb7bn of capex, including: 1) Rmb3bn for ingot and wafer expansion; 2) Rmb600m for cell and module expansion; 3) Rmb1.5bn for Malaysian plant expansion; and 4) Rmb2bn for solar farm project construction.
Except for bank facilities, which LONGi said it still has plenty, the Company is also diversifying its funding channels, with examples below:
CB issuance: LONGi is working on the issuance of convertible bonds, with a total amount of Rmb2.8bn, mainly used to fund its Yinchuan 5GW ingot and wafer project, as well as Baoshan 10GW wafer project.
0%20%40%60%80%100%120%140%160%180%200%
-
1,000
2,000
3,000
4,000
5,000
6,000
7,000
8,000
2014 2015 2016 2017E 2018E 2019E
(MW)
3rd party shipment Own downstream projects yoy growth (RHS)
Solar module63%
Mono-Si wafer29%
Electricity generation
4%
Mono-Si cell2%
Others2%

LONGi Green Energy Technology (601012.SS) 20 March 2017 Citi Research
6
JV establishment: LONGi sets up joint ventures in order to reduce its capital commitment and at the same time build up partnership along the supply chain. The joint venture of Lijaing 5GW ingot project is a classic example, which LONGi has partnered with Trina Solar (world’s leading module manufacturer) and Sichuan Yongxiang (key polysilicon players in China, and a subsidiary of Tongwei).
Trust scheme: LONGi has set up investment funds with financial institutions to fund its downstream solar projects. The recent establishment of investment fund was the fund set up with Chang’an Trust, with an initial fund size of Rmb1.2bn, and the major purpose of the trust is to fund LONGi’s solar DG project development.
In order to further strengthen its relationships with partners along the supply chain, as well as secure its polysilicon supply, LONGi also plans to participate in a financial investment with Tongwei on a new polysilicon project in Sichuan.
Joint venture with Tongwei positive to LONGi
On 13 March, Tongwei (600438.SS, not rated) announced the establishment of a joint venture with LONGi, with Tongwei holding 85% stake, and LONGi contributing to the remaining 15% stake. The JV will invest in a 50,000MT polysilicon manufacturing plant in Leshan, Sichuan, and will be separated into two phases, each with a production capacity of 25,000MT.
Total capex of the project is expected to be ~Rmb8bn, and the JV’s initial registered capital is Rmb1.2bn, in which LONGi will contribute Rmb180m. Phase one of polysilicon plant will start construction before June 2017, and is expected to commission in 2018 and generate ~Rmb4.5bn revenue p.a. after commissioning.
We view this JV investment to be beneficial to LONGi in two folds. First, given the limited supply of high-purity polysilicon in China, as well as China’s likely anti-dumping tariff against Korean polysilicon manufacturers, the partnership should clear the investors’ worries on LONGi polysilicon supplies. According to management, the strategic partnership is a step for the Company to obtain adequate polysilicon supplies for its future Yunnan projects (given the proximity of Yunnan and Sichuan).
Second, we believe the investment should provide additional investment income to LONGi. Given Tongwei is one of the cost leaders in the polysilicon industry, with a polysilicon production cost below US$8.8/kg, and 1H16 polysilicon gross margin of 45%, we believe the investment should be profitable as the new plant is likely to be cost efficient as well.

LONGi Green Energy Technology (601012.SS) 20 March 2017 Citi Research
7
Figure 7. LONGi: wafer capacity forecasts Figure 8. LONGi: module capacity forecasts
Source: Company Reports and Citi Research Estimates Source: Company Reports and Citi Research Estimates
850 2,250 3,525 4,675 4,675 4,675 750
750 1,475
1,900 1,900 1,900 800 1,000 1,000
4,000 5,000
5,000
- 2,000 4,000 6,000 8,000
10,000 12,000 14,000 16,000 18,000 20,000
2013 2014 2015 2016E 2017E 2018E
MW
Xi'an Wuxi Kuching, Malaysia Yinchuan Chuxiong
200 1,500
3,500 3,500 3,500
1,000 2,000 2,000 500
500 500 500 500
-
1,000
2,000
3,000
4,000
5,000
6,000
7,000
2014 2015 2016 2017E 2018E
MW
Quzhou Taizhou Yinchuan Xi'an Kuching, Malaysia Andhra Pradesh, India

LONGi Green Energy Technology (601012.SS) 20 March 2017 Citi Research
8
Our 2017-18E net profit forecasts raised by 6-10% We raise our 2017E net profit by 5.8%, as both of LONGi’s wafer and module gross margins in 2016 have come out better-than-expected, driven by strong cost reduction initiatives. As such, we expect the strong margins to be sustained in 2017E. Management has guided that wafer margin in 1Q17 would further increase to ~32%, from 28.2% in 2016 due to elevated wafer pricing. Our revenue forecast for 2017E is adjusted down by 16.7%, as we factor in more solar module shipment to LONGi’s self-owned solar farm projects (from nil to 800MW).
We raise our 2018E net profit by 9.6%, mainly due to higher cost reduction assumptions, similar to our forecasts for 2017E.
Figure 9. LONGi: profit forecasts revisions – New vs. Old
New Old % change Revenue 2017E 15,140 18,176 -16.7% 2018E 20,477 23,603 -13.2% 2019E 23,214 n.a. n.a. Gross profit 2017E 3,822 3,665 4.3% 2018E 5,019 4,498 11.6% 2019E 5,901 n.a. n.a. Gross margin 2017E 25.2% 20.2% 5.1pp 2018E 24.5% 19.1% 5.5pp 2019E 25.4% n.a. n.a. Profit attributable to shareholders 2017E 1,842 1,713 7.6% 2018E 2,374 2,132 11.4% 2019E 2,985 n.a. n.a. Net margin 2017E 12.2% 9.4% 2.7pp 2018E 11.6% 9.0% 2.6pp 2019E 12.9% n.a. n.a. Basic EPS (HKD) 2017E 0.91 0.86 5.8% 2018E 1.18 1.07 9.6% 2019E 1.48 n.a. n.a. Target price 18.30 17.30 5.8% Rating Buy Buy
Source: Citi Research Forecasts
Our 2017-18E estimates are in line with consensus
Both of our 2017-18E net profit estimates are broadly in line with consensus (1-2% ahead of consensus), as LONGi has delivered strong performance during 2016, and provided visible cost reduction outlook to investors.

LONGi Green Energy Technology (601012.SS) 20 March 2017 Citi Research
9
Figure 10. LONGi: net profit estimates – Citi vs. consensus
Net profit (Rmb m) Citi Consensus % Diff 2017E 1,842 1,812 1.7% 2018E 2,374 2,352 0.9% 2019E 2,985 3,257 -8.4%
Source: I/B/E/S, Citi Research estimates
Historical Valuations & Peer Comparison
Figure 11. LONGi: 1-yr forward PER Chart Figure 12. LONGi: 1-yr forward P/B Chart
Source: Citi Research Forecasts Source: Citi Research Forecasts
Figure 13. LONGi: Peer Comparison
Stock Citi Stock Market PER (x) P/B (x) ROE EPS CAGR Code Rating Price Cap 2017E 2018E 2017E 2018E 2017E 2018E 2015-18E LONGi Green Energy 601012 CH Buy 15.72 4,542 17.2 13.4 2.8 2.4 17.2% 19.4% 17.3% GCL-Poly Energy 3800 HK Neutral 1.07 2,538 11.0 9.1 0.8 0.7 7.7% 8.6% -9.3% Daqo New Energy DQ US NR 22.10 231 3.2 3.6 0.7 0.6 16.8% 15.4% 22.2% OCI 010060 KS NR 84,600 1,806 25.4 17.4 0.6 0.6 3.4% 3.9% -30.8% Wacker Chemie WCH GR Sell 99.67 5,582 24.7 21.2 1.8 1.7 7.8% 8.2% 14.2% Comtec Solar 712 HK NR 0.37 72 (2.2) 17.4 n.a. n.a. -2.8% 3.8% 44.9% Canadian Solar CSIQ US Sell 13.74 789 9.2 6.7 0.8 0.7 9.4% 11.5% 13.5% JinkoSolar JKS US Neutral 16.92 534 6.5 5.0 0.5 0.5 7.5% 9.2% -21.3% Simple average 2,012 11.9 11.7 1.1 1.0 8.4% 10.0% 6.3%
Source: I/B/E/S, Citi Research estimates (market closing price as of 17 Mar 2017)
0.0
10.0
20.0
30.0
40.0
50.0
60.0
Jan-13 Jan-14 Jan-15 Jan-16 Jan-17
(x) Historical average PE: 22.8xMax: 69.4xMin: 12.1x
+1SD
mean
+2SD
-1SD
-2SD -10%-5%0%5%10%15%20%25%30%35%
0.0
1.0
2.0
3.0
4.0
5.0
6.0
Apr-12 Apr-13 Apr-14 Apr-15 Apr-16
(x)
PBR (x) ROE - RHS
Historical average PB: 2.3xMax: 5.7xMin: 1.1x
+1SD
-2SD
mean
+2SD
-1SD

LONGi Green Energy Technology (601012.SS) 20 March 2017 Citi Research
10
Financial Statements & Key Assumptions
Figure 14. LONGi: Income statement
(Rmb m) 2013A 2014A 2015A 2016E 2017E 2018E 2019E Net sales 2,279 3,673 5,937 11,421 15,140 20,477 23,214 COGS (2,001) (3,054) (4,736) (8,361) (11,318) (15,458) (17,313) Gross profit 278 618 1,201 3,059 3,822 5,019 5,901 SG&A expenses (145) (210) (408) (909) (1,205) (1,547) (1,613) Other operating items 5 (38) (134) (303) (303) (303) (303) EBIT 138 370 659 1,847 2,314 3,169 3,985 Non-operating items (20) (12) (1) 13 - - - Share of P&L from JV and asso. (0) (0) 14 17 17 30 96 Finance costs (25) (38) (80) (85) (197) (391) (491) Profit before tax 93 319 593 1,793 2,135 2,808 3,590 Taxation (21) (21) (72) (242) (288) (379) (484) Profit after tax 72 299 521 1,551 1,847 2,430 3,106 Minority interests (1) (5) (0) (4) (5) (56) (121) Net profit for shareholders 71 294 520 1,547 1,842 2,374 2,985
Source: Company Reports and Citi Research Estimates
Figure 15. LONGi: Balance sheet
(Rmb m) 2013A 2014A 2015A 2016E 2017E 2018E 2019E Cash and Cash Equivalents 731 1,172 2,246 5,817 4,823 2,501 4,215 Accounts receivable 291 665 2,081 3,833 5,289 7,433 8,427 Inventory 767 1,114 1,534 1,213 1,816 2,737 3,102 Other current assets 369 390 578 1,179 1,858 2,513 2,849 Total Current assets 2,159 3,341 6,439 12,042 13,786 15,184 18,594 PP&E 2,277 2,836 3,198 5,979 12,053 17,061 18,557 Investments 76 67 152 152 332 332 332 Financial Assets - - 51 52 52 52 52 Intangible assets 134 151 134 210 201 193 185 Other non-current assets 42 54 234 738 738 738 738 Total Non Current assets 2,529 3,108 3,769 7,130 13,376 18,376 19,864 Total Assets 4,688 6,449 10,209 19,172 27,162 33,560 38,458 Accounts payable 307 668 1,379 2,009 2,720 3,715 4,161 Short-term debt 688 1,473 1,394 2,089 2,139 2,189 2,239 Other current liabilities 206 409 1,008 2,353 3,120 4,219 4,783 Current liabilities 1,201 2,550 3,781 6,451 7,978 10,123 11,183 Long-term debt 462 491 670 2,384 7,227 9,708 11,215 Other non-current liabilities 33 146 103 244 244 244 244 Non-current liabilities 495 637 774 2,627 7,471 9,952 11,459 Total liabilities 1,695 3,187 4,555 9,079 15,449 20,075 22,641 Share capital 1,988 2,080 4,301 7,344 7,344 7,344 7,344 Retained earnings 942 1,139 1,268 2,683 3,978 5,695 7,905 Reserves and Others 32 (1) 65 65 65 65 65 Minority interest 30 44 19 1 326 381 502 Shareholders' funds 2,992 3,263 5,654 10,094 11,712 13,486 15,817 Liabilities and shareholders' funds 4,688 6,449 10,209 19,172 27,162 33,560 38,458
Source: Company Reports and Citi Research Estimates

LONGi Green Energy Technology (601012.SS) 20 March 2017 Citi Research
11
Figure 16. LONGi: Cash flow statement
(Rmb m) 2013A 2014A 2015A 2016E 2017E 2018E 2019E Net Income 72 299 521 1,551 1,847 2,430 3,106 Depreciation and amortization 192 236 282 398 746 1,202 1,526 Loss (gain) on disposal of fixed assets 0 1 15 15 - - - Net change in working capital (5) (234) (605) (2,270) (1,261) (1,626) (686) Other operating cash flow items (214) 76 174 898 - - - Deferred Income taxes 12 (10) (22) (56) - - - Cash from operations 57 367 365 536 1,333 2,007 3,946 Investment in PP&E (329) (496) (980) (2,082) (6,812) (6,203) (3,013) Proceeds from sale of PP&E 10 2 17 5 - - - Purchase of long-term investments 21 - (171) (110) (180) - - Net acquisitions/disposals - (7) 8 37 - - - Total other investing cash flows 299 346 392 629 - - - Cash from Investing activities 1 (156) (733) (1,520) (6,992) (6,203) (3,013) Change in borrowings (184) 446 (7) 1,172 4,894 2,531 1,557 Equity raised/share buybacks - - 1,979 3,036 - - - Dividends paid - (23) (64) (79) (553) (712) (896) Other financing cash flows (134) 82 (150) 872 325 56 121 Cash from Financing activities (318) 505 1,759 5,001 4,665 1,875 782 Effect of Exchange Rates On Cash (8) 0 11 36 - - - Discontinued Operations - - - - - - - Change in cash (268) 717 1,401 4,053 (994) (2,322) 1,714 Opening cash 999 456 845 1,764 5,817 4,823 2,501 Closing cash 731 1,172 2,246 5,817 4,823 2,501 4,215 Guarantee money (276) (327) (482) (632) - - -
Source: Company Reports and Citi Research Estimates
Figure 17. LONGi: Key assumptions
2013A 2014A 2015A 2016E 2017E 2018E 2019E Wafer Sales volume (mn pc) 268 436 417 989 910 1,229 1,843 - yoy growth 46% 63% -4% 137% -8% 35% 50% ASP (Rmb/pc) 6.9 7.2 6.1 5.1 4.7 4.2 4.0 - yoy change -10% 4% -15% -16% -8% -10% -6% Unit cost (Rmb/pc) 6.1 6.0 4.8 3.7 3.4 3.1 2.9 - yoy change -9% -2% -20% -23% -7% -9% -6% Gross margin 12.0% 17.5% 21.5% 28.2% 27.0% 26.2% 26.6% Solar module Sales volume (MW) 19 721 1,847 3,695 5,727 6,300 - yoy growth 3722% 156% 100% 55% 10% ASP (Rmb/W) 3.7 3.5 3.1 2.7 2.5 2.3 - yoy change -5% -12% -12% -9% -5% Unit cost (Rmb/W) 3.5 2.8 2.2 2.0 1.9 1.8 - yoy change -20% -20% -9% -7% -6% Gross margin 3.5% 19.3% 27.2% 25.0% 23.6% 24.7% Production capacity (MW) Ingot 2,200 3,000 5,000 5,360 11,660 17,660 21,660 Wafer 1,600 3,000 5,000 7,375 11,575 17,575 22,575 Cell - - 400 1,472 2,472 3,472 3,472 Module - 200 1,500 5,000 6,500 7,500 7,500 Capex 329 496 980 2,082 6,812 6,203 3,013 Finance cost 3.7% 3.2% 4.5% 3.6% 3.6% 4.1% 4.0%
Source: Company Reports and Citi Research Estimates

LONGi Green Energy Technology (601012.SS) 20 March 2017 Citi Research
12
Bull/Bear: LONGi Green Energy Technology (601012.SS)
LONGi Green Energy Technology (601012.SS) 20 March 2017 Citi Research
13
LONGi Green Energy Technology Company description Xi'an LONGi is the market leader in the monocrystalline silicon (mono-Si) wafer business globally, with 7.5GW of wafer capacity by end-2016. To promote the application of mono-Si, the Company acquired Lerri Solar, a module manufacturer, in 2014, and tapped into the cell and module manufacturing business. Investment strategy We have a Buy rating on LONGi. We like LONGi's strategy of tapping into the module business, which should effectively promote the use of mono-Si in China. We also expect the company to ride the mono-Si solar module market share gain, from 15% in 2015 to 35% in 2017E, underpinned by: 1) rising cost competitiveness of mono-Si products; 2) China's solar policies such as front runner program and distributed solar providing strong support to high-efficiency products like mono-Si modules; and 3) increasing importance of balance-of-system (BOS) costs. Valuation Our target price of Rmb18.3 for LONGi is based on relative valuation. We compare the stock’s valuation with the company’s closest peers listed in both A-share and H-share markets. The average PE ratio of its peers in 2017E is 20.6x. To be conservative, we apply 20x 2017E PER on LONGi, 0.6x PER discount to its peers, or implies 1.0x PEG, as we forecast the company's 2016-18E EPS CAGR at 20.3%. With this, we arrive at our target price of Rmb18.3. Risks Key downside risks that could cause the shares to trade below our target price include: (1) deterioration of solar installation demand (If the annual installations in China are unexpectedly low, we see LONGi suffering, both in terms of ASP and volume); (2) solar investors running out of cash to build solar farms in China; and (3) expected rapid cost reduction from multi-Si wafer, which increased its cost competitiveness against mono-Si products.
Canadian Solar (CSIQ.O; US$13.74; 3H; 17 Mar 17; 16:00)
Valuation Our target price of US$11.19 for CSIQ is based on relative valuations. We compare the stock with its closest peers listed in the US and Hong Kong. We use both P/E and PB valuations, and ascribe 50% weighting to each methodology. We apply 7.7x 17E P/E (equating to US$11.50) for CSIQ, a 5% premium to the average P/E for its peers (excluding outliers), as we expect project sales to provide stronger growth for CSIQ on a long-term basis. We also apply 0.6x 17E PB (equating to US$10.88) – at par with the average for its peers given that their returns are similar. Risks Our quantitative model assigns a High Risk rating to CSIQ given the stock’s volatility over the past year. Key upside risks that could take the stock above our

LONGi Green Energy Technology (601012.SS) 20 March 2017 Citi Research
14
target price include: 1) higher-than-expected project monetization; 2) higher project sales margins; 3) faster-than-expected cost reduction from a successful black silicon + diamond wire technology rollout; and 4) declines in the polysilicon ASP.
GCL-Poly Energy Holdings (3800.HK; HK$1.07; 2; 17 Mar 17; 16:10)
Valuation Our Target Price of HK$1.00 for GCL-Poly is based on a sum-of-the-parts analysis. For the solar materials business, we apply a 6.0x 2017E EV/EBITDA to the segment, a trough valuation for this business. For the solar farm business under GCL-Poly, we apply a discounted cash flow analysis with period from 2016-34, assuming a 2.9% risk-free rate, 9.8% market risk premium, 50% target gearing and beta of 1.4.
After calculating the enterprise value of various segments, we deduct the net debt and minority interests (excl. GNE portion) from the total to calculate its equity value. We then add back GNE’s equity value portion based on our Target Price of GNE, and finally arrive at our Target Price of HK$1.00. Risks Key downside risks that could cause the shares to trade below our Target Price include: (1) deterioration of solar installation demand (If the annual installations in China are unexpectedly low, we see GCL-Poly suffer, both in terms of ASP and volume); (2) solar investors running out of cash to build solar farms in China; (3) deteriorating curtailment rate in China; and (4) further delay in subsidy payments.
Key upside risks that could cause the shares to trade above our Target Price include: (1) a milder-than-expected polysilicon and wafer ASP declines, (2) stronger-than-expected solar farm investment sentiment in China, (3) improving curtailment rate in China, and (4) faster-than-expected announcement of the 7th batch of subsidy catalogue.
JinkoSolar (JKS.N; US$16.92; 2; 17 Mar 17; 16:00)
Valuation Our target price of US$15.55 for JKS is based on relative valuation. We compare the stock’s valuation with the company’s closest peers listed in the US and Hong Kong. Among relative valuation methodologies, we use both PER and PB valuations, and apply 50% weightings for each of these methodologies.
We apply 5.6x 2017E PER on JKS (equating to US$13.80), ~25% discount to the average PE multiple for its peers (excluding outliers) of 7.3x, as we expect JKS to have limited topline growth on no module capacity expansion, as well as relatively limited cost reduction initiatives. For PB valuation, we apply 0.6x (equating to US$17.30), which is in line with the peer group average.
Based on the above, we arrive at our target price of US$15.55.

LONGi Green Energy Technology (601012.SS) 20 March 2017 Citi Research
15
Risks Key upside risks that could push the stock above our target price for JKS's share price are: 1) higher-than-expected module ASP trend; 2) stronger-than-expected sales volume growth; and 3) more aggressive cost cutting.
Key downside risks that could push the stock below our target price are: 1) unexpected increase in polysilicon prices; 2) trade wars between the US and China, with more punitive trade tariffs introduced; and 3) slower-than-expected cost-cutting progress.
Wacker Chemie AG (WCHG.DE; €99.67; 3; 17 Mar 17; 17:30)
Valuation Our target price is based on a three-stage DCF model. The main assumptions are a WACC of 7.5%, growth rate of 4.0% and long-term restructuring costs of 0.3% of annual sales. This model delivers a fair value of €76/shr. However, one of the features of Wacker over the medium term is the scale of capex versus the installed asset base. While we believe that recovery is likely, there is uncertainty regarding the outlook. Risks We would highlight the following risks to our valuation and target price.
Should solar demand fail to meet the supply in the medium and long term, the resulting overcapacity may cause profits to disappoint. If market conditions lead to a slowdown in the global economy longer than currently expected, this might adversely impact demand growth and cause an intensification of margin pressures. Conversely, a more rapid economic recovery than expected could have a positive impact on demand growth. If the impact from any of these factors proves to be more negative than we anticipate, the stock will likely have difficulty achieving our financial and price targets. However, if any of these factors proves to have less of an effect than we anticipate, the stock could materially outperform our target.
Appendix A-1 Analyst Certification The research analysts primarily responsible for the preparation and content of this research report are either (i) designated by “AC” in the author block or (ii) listed in bold alongside content which is attributable to that analyst. If multiple AC analysts are designated in the author block, each analyst is certifying with respect to the entire research report other than (a) content attributable to another AC certifying analyst listed in bold alongside the content and (b) views expressed solely with respect to a specific issuer which are attributable to another AC certifying analyst identified in the price charts or rating history tables for that issuer shown below. Each of these analysts certify, with respect to the sections of the report for which they are responsible: (1) that the views expressed therein accurately reflect their personal views about each issuer and security referenced and were prepared in an independent manner, including with respect to Citigroup Global Markets Inc. and its affiliates; and (2) no part of the research analyst's compensation was, is, or will be, directly or indirectly, related to the specific recommendations or views expressed by that research analyst in this report.
LONGi Green Energy Technology (601012.SS) 20 March 2017 Citi Research
16
IMPORTANT DISCLOSURES

LONGi Green Energy Technology (601012.SS) 20 March 2017 Citi Research
17

LONGi Green Energy Technology (601012.SS) 20 March 2017 Citi Research
18
Within the past 12 months, Citigroup Global Markets Inc. or its affiliates has acted as manager or co-manager of an offering of securities of Wacker Chemie AG. Citigroup Global Markets Inc. or its affiliates has received compensation for investment banking services provided within the past 12 months from Wacker Chemie AG. Citigroup Global Markets Inc. or an affiliate received compensation for products and services other than investment banking services from JinkoSolar, GCL-Poly Energy Holdings, Canadian Solar, Wacker Chemie AG in the past 12 months. Citigroup Global Markets Inc. currently has, or had within the past 12 months, the following as investment banking client(s): Wacker Chemie AG. Citigroup Global Markets Inc. currently has, or had within the past 12 months, the following as clients, and the services provided were non-investment-banking, securities-related: JinkoSolar, GCL-Poly Energy Holdings, Canadian Solar, Wacker Chemie AG. Citigroup Global Markets Inc. currently has, or had within the past 12 months, the following as clients, and the services provided were non-investment-banking, non-securities-related: JinkoSolar, GCL-Poly Energy Holdings, Canadian Solar. Disclosure for investors in the Republic of Turkey: Under Capital Markets Law of Turkey (Law No: 6362), the investment information, comments and advices given herein are not part of investment advisory activity. Investment advisory services are provided by authorized institutions to persons and entities privately by considering their risk and return preferences. Whereas the comments and advices included herein are of general nature. Therefore, they may not fit to your financial situation and risk and return preferences. For this reason, making an investment decision only by relying on the information given herein may not give rise to results that fit your expectations. Furthermore, Citi Research is a division of Citigroup Global Markets Inc. (the “Firm”), which does and seeks to do business with companies and/or trades on securities covered in this research reports. As a result, investors should be aware that the Firm may have a conflict of interest that could affect the objectivity of this report. Analysts’ compensation is determined by Citi Research management and Citigroup’s senior management and is based upon activities and services intended to benefit the investor clients of Citigroup Global Markets Inc. and its affiliates (the “Firm”). Compensation is not linked to specific transactions or recommendations. Like all Firm employees, analysts receive compensation that is impacted by overall Firm profitability which includes investment banking, sales and trading, and principal trading revenues. One factor in equity research analyst compensation is arranging corporate access events between institutional clients and the management teams of covered companies. Typically, company management is more likely to participate when the analyst has a positive view of the company. For securities recommended in the Product in which the Firm is not a market maker, the Firm is a liquidity provider in the issuers' financial instruments and may act as principal in connection with such transactions. The Firm is a regular issuer of traded financial instruments linked to securities that may have been recommended in the Product. The Firm regularly trades in the securities of the issuer(s) discussed in the Product. The Firm may engage in securities transactions in a manner inconsistent with the Product and, with respect to securities covered by the Product, will buy or sell from customers on a principal basis.

LONGi Green Energy Technology (601012.SS) 20 March 2017 Citi Research
19
The Firm is a market maker in the publicly traded equity securities of Canadian Solar, Wacker Chemie AG. For important disclosures (including copies of historical disclosures) regarding the companies that are the subject of this Citi Research product ("the Product"), please contact Citi Research, 388 Greenwich Street, 28th Floor, New York, NY, 10013, Attention: Legal/Compliance [E6WYB6412478]. In addition, the same important disclosures, with the exception of the Valuation and Risk assessments and historical disclosures, are contained on the Firm's disclosure website at https://www.citivelocity.com/cvr/eppublic/citi_research_disclosures. Valuation and Risk assessments can be found in the text of the most recent research note/report regarding the subject company. Pursuant to the Market Abuse Regulation a history of all Citi Research recommendations published during the preceding 12-month period can be accessed via Citi Velocity (https://www.citivelocity.com/cv2) or your standard distribution portal. Historical disclosures (for up to the past three years) will be provided upon request. Citi Research Equity Ratings Distribution 12 Month Rating Catalyst Watch Data current as of 31 Dec 2016 Buy Hold Sell Buy Hold Sell Citi Research Global Fundamental Coverage 47% 39% 14% 1% 99% 0%
% of companies in each rating category that are investment banking clients 65% 61% 60% 72% 63% 50% Guide to Citi Research Fundamental Research Investment Ratings: Citi Research stock recommendations include an investment rating and an optional risk rating to highlight high risk stocks. Risk rating takes into account both price volatility and fundamental criteria. Stocks will either have no risk rating or a High risk rating assigned. Investment Ratings: Citi Research investment ratings are Buy, Neutral and Sell. Our ratings are a function of analyst expectations of expected total return ("ETR") and risk. ETR is the sum of the forecast price appreciation (or depreciation) plus the dividend yield for a stock within the next 12 months. The Investment rating definitions are: Buy (1) ETR of 15% or more or 25% or more for High risk stocks; and Sell (3) for negative ETR. Any covered stock not assigned a Buy or a Sell is a Neutral (2). For stocks rated Neutral (2), if an analyst believes that there are insufficient valuation drivers and/or investment catalysts to derive a positive or negative investment view, they may elect with the approval of Citi Research management not to assign a target price and, thus, not derive an ETR. Analysts may place covered stocks "Under Review" in response to exceptional circumstances (e.g. lack of information critical to the analyst's thesis) affecting the company and / or trading in the company's securities (e.g. trading suspension). As soon as practically possible, the analyst will publish a note re-establishing a rating and investment thesis. To satisfy regulatory requirements, we correspond Under Review and Neutral to Hold in our ratings distribution table for our 12-month fundamental rating system. However, we reiterate that we do not consider Under Review to be a recommendation. Investment ratings are determined by the ranges described above at the time of initiation of coverage, a change in investment and/or risk rating, or a change in target price (subject to limited management discretion). At other times, the expected total returns may fall outside of these ranges because of market price movements and/or other short-term volatility or trading patterns. Such interim deviations from specified ranges will be permitted but will become subject to review by Research Management. Your decision to buy or sell a security should be based upon your personal investment objectives and should be made only after evaluating the stock's expected performance and risk. Prior to May 1, 2014 Citi Research may have also assigned a three-month relative call (or rating) to a stock to highlight expected out-performance (most preferred) or under-performance (least preferred) versus the geographic and industry sector over a 3 month period. The relative call may have highlighted a specific near-term catalyst or event impacting the company or the market that was anticipated to have a short-term price impact on the equity securities of the company. Absent any specific catalyst the analyst(s) may have indicated the most and least preferred stocks in the universe of stocks under consideration, explaining the basis for this short-term view. This three-month view may have been different from and did not affect a stock's fundamental equity rating, which reflected a longer-term total absolute return expectation. Catalyst Watch Upside/Downside calls: Citi Research may also include a Catalyst Watch Upside or Downside call to highlight specific near-term catalysts or events impacting the company or the market that are expected to influence the share price over a specified period of 30 or 90 days. A Catalyst Watch Upside (Downside) call indicates that the analyst expects the share price to rise (fall) in absolute terms over the specified period. A Catalyst Watch Upside/Downside call will automatically expire at the end of the specified 30/90 day period; the analyst may also close a Catalyst Watch call prior to the end of the specified period in a published research note. A Catalyst Watch Upside or Downside call may be different from and does not affect a stock’s fundamental equity rating, which reflects a longer-term total absolute return expectation. For purposes of FINRA ratings-distribution-disclosure rules, a Catalyst Watch Upside call corresponds to a buy recommendation and a Catalyst Watch Downside call corresponds to a sell recommendation. Any stock not assigned to a Catalyst Watch Upside or Catalyst Watch Downside call is considered Catalyst Watch Non-Rated (CWNR). For purposes of FINRA ratings-distribution-disclosure rules, we correspond CWNR to Hold in our ratings distribution table for our Catalyst Watch Upside/Downside rating system. However, we reiterate that we do not consider CWNR to be a recommendation. For all Catalyst Watch Upside/Downside calls, risk exists that the catalyst(s) and associated share-price movement will not materialize as expected. NON-US RESEARCH ANALYST DISCLOSURES Non-US research analysts who have prepared this report (i.e., all research analysts listed below other than those identified as employed by Citigroup Global Markets Inc.) are not registered/qualified as research analysts with FINRA. Such research analysts may not be associated persons of the member organization and therefore may not be subject to the FINRA Rule 2241 restrictions on communications with a subject company, public appearances and trading securities held by a research analyst account. The legal entities employing the authors of this report are listed below: Citigroup Global Markets Asia Scott Chui; Pierre Lau, CFA Citigroup Global Markets Ltd Andrew Benson
OTHER DISCLOSURES Any price(s) of instruments mentioned in recommendations are as of the prior day’s market close on the primary market for the instrument, unless otherwise stated.

LONGi Green Energy Technology (601012.SS) 20 March 2017 Citi Research
20
The completion and first dissemination of any recommendations made within this research report are as of the Eastern date-time displayed at the top of the Product. If the Product references views of other analysts then please refer to the price chart or rating history table for the date/time of completion and first dissemination with respect to that view. European regulations require that where a recommendation differs from any of the author’s previous recommendations concerning the same financial instrument or issuer that has been published during the preceding 12-month period that the change(s) and the date of that previous recommendation are indicated. For fundamental coverage please refer to the price chart or rating change history within this disclosure appendix or the issuer disclosure summary at https://www.citivelocity.com/cvr/eppublic/citi_research_disclosures. European regulations require that a firm must establish, implement and make available a policy for managing conflicts of interest arising as a result of publication or distribution of investment research. The policy applicable to Citi Research's Products can be found at https://www.citivelocity.com/cvr/eppublic/citi_research_disclosures. The proportion of all Citi Research fundamental research recommendations that were the equivalent to “Buy”,”Hold”,”Sell” at the end of each quarter over the prior 12 months (with the % of these that had received investment firm services from Citi in the prior 12 months shown in brackets) is as follows: Q4 2016 Buy 31% (71%), Hold 45% (64%), Sell 24% (58%); Q3 2016 Buy 32% (68%), Hold 44% (64%), Sell 24% (61%); Q2 2016 Buy 31% (68%), Hold 45% (63%), Sell 24% (61%); Q1 2016 Buy 31% (67%), Hold 45% (63%), Sell 24% (61%). Citigroup Global Markets India Private Limited and/or its affiliates may have, from time to time, actual or beneficial ownership of 1% or more in the debt securities of the subject issuer. Citi Research generally disseminates its research to the Firm’s global institutional and retail clients via both proprietary (e.g., Citi Velocity and Citi Personal Wealth Management) and non-proprietary electronic distribution platforms. Certain research may be disseminated only via the Firm’s proprietary distribution platforms; however such research will not contain changes to earnings forecasts, target price, investment or risk rating or investment thesis or be otherwise inconsistent with the author’s previously published research. Certain research is made available only to institutional investors to satisfy regulatory requirements. Individual Citi Research analysts may also opt to circulate published research to one or more clients by email; such email distribution is discretionary and is done only after the research has been disseminated. The level and types of services provided by Citi Research analysts to clients may vary depending on various factors such as the client’s individual preferences as to the frequency and manner of receiving communications from analysts, the client’s risk profile and investment focus and perspective (e.g. market-wide, sector specific, long term, short-term etc.), the size and scope of the overall client relationship with the Firm and legal and regulatory constraints. Pursuant to Comissão de Valores Mobiliários Rule 483, Citi is required to disclose whether a Citi related company or business has a commercial relationship with the subject company. Considering that Citi operates multiple businesses in more than 100 countries around the world, it is likely that Citi has a commercial relationship with the subject company. Securities recommended, offered, or sold by the Firm: (i) are not insured by the Federal Deposit Insurance Corporation; (ii) are not deposits or other obligations of any insured depository institution (including Citibank); and (iii) are subject to investment risks, including the possible loss of the principal amount invested. The Product is for informational purposes only and is not intended as an offer or solicitation for the purchase or sale of a security. Any decision to purchase securities mentioned in the Product must take into account existing public information on such security or any registered prospectus. Although information has been obtained from and is based upon sources that the Firm believes to be reliable, we do not guarantee its accuracy and it may be incomplete and condensed. Note, however, that the Firm has taken all reasonable steps to determine the accuracy and completeness of the disclosures made in the Important Disclosures section of the Product. The Firm's research department has received assistance from the subject company(ies) referred to in this Product including, but not limited to, discussions with management of the subject company(ies). Firm policy prohibits research analysts from sending draft research to subject companies. However, it should be presumed that the author of the Product has had discussions with the subject company to ensure factual accuracy prior to publication. All opinions, projections and estimates constitute the judgment of the author as of the date of the Product and these, plus any other information contained in the Product, are subject to change without notice. Prices and availability of financial instruments also are subject to change without notice. Notwithstanding other departments within the Firm advising the companies discussed in this Product, information obtained in such role is not used in the preparation of the Product. Although Citi Research does not set a predetermined frequency for publication, if the Product is a fundamental equity or credit research report, it is the intention of Citi Research to provide research coverage of the covered issuers, including in response to news affecting the issuer. For non-fundamental research reports, Citi Research may not provide regular updates to the views, recommendations and facts included in the reports. Notwithstanding that Citi Research maintains coverage on, makes recommendations concerning or discusses issuers, Citi Research may be periodically restricted from referencing certain issuers due to legal or policy reasons. Citi Research may provide different research products and services to different classes of customers (for example, based upon long-term or short-term investment horizons) that may lead to differing conclusions or recommendations that could impact the price of a security contrary to the recommendations in the alternative research product, provided that each is consistent with the rating system for each respective product. Investing in non-U.S. securities, including ADRs, may entail certain risks. The securities of non-U.S. issuers may not be registered with, nor be subject to the reporting requirements of the U.S. Securities and Exchange Commission. There may be limited information available on foreign securities. Foreign companies are generally not subject to uniform audit and reporting standards, practices and requirements comparable to those in the U.S. Securities of some foreign companies may be less liquid and their prices more volatile than securities of comparable U.S. companies. In addition, exchange rate movements may have an adverse effect on the value of an investment in a foreign stock and its corresponding dividend payment for U.S. investors. Net dividends to ADR investors are estimated, using withholding tax rates conventions, deemed accurate, but investors are urged to consult their tax advisor for exact dividend computations. Investors who have received the Product from the Firm may be prohibited in certain states or other jurisdictions from purchasing securities mentioned in the Product from the Firm. Please ask your Financial Consultant for additional details. Citigroup Global Markets Inc. takes responsibility for the Product in the United States. Any orders by US investors resulting from the information contained in the Product may be placed only through Citigroup Global Markets Inc.

LONGi Green Energy Technology (601012.SS) 20 March 2017 Citi Research
21
Important Disclosures for Bell Potter Customers: Bell Potter is making this Product available to its clients pursuant to an agreement with Citigroup Global Markets Australia Pty Limited. Neither Citigroup Global Markets Australia Pty Limited nor any of its affiliates has made any determination as to the suitability of the information provided herein and clients should consult with their Bell Potter financial advisor before making any investment decision. The Citigroup legal entity that takes responsibility for the production of the Product is the legal entity which the first named author is employed by. The Product is made available in Australia through Citigroup Global Markets Australia Pty Limited. (ABN 64 003 114 832 and AFSL No. 240992), participant of the ASX Group and regulated by the Australian Securities & Investments Commission. Citigroup Centre, 2 Park Street, Sydney, NSW 2000. Citigroup Global Markets Australia Pty Limited is not an Authorised Deposit-Taking Institution under the Banking Act 1959, nor is it regulated by the Australian Prudential Regulation Authority. The Product is made available in Australia to Private Banking wholesale clients through Citigroup Pty Limited (ABN 88 004 325 080 and AFSL 238098). Citigroup Pty Limited provides all financial product advice to Australian Private Banking wholesale clients through bankers and relationship managers. If there is any doubt about the suitability of investments held in Citigroup Private Bank accounts, investors should contact the Citigroup Private Bank in Australia. Citigroup companies may compensate affiliates and their representatives for providing products and services to clients. The Product is made available in Brazil by Citigroup Global Markets Brasil - CCTVM SA, which is regulated by CVM - Comissão de Valores Mobiliários ("CVM"), BACEN - Brazilian Central Bank, APIMEC - Associação dos Analistas e Profissionais de Investimento do Mercado de Capitais and ANBIMA – Associação Brasileira das Entidades dos Mercados Financeiro e de Capitais. Av. Paulista, 1111 - 14º andar(parte) - CEP: 01311920 - São Paulo - SP. If the Product is being made available in certain provinces of Canada by Citigroup Global Markets (Canada) Inc. ("CGM Canada"), CGM Canada has approved the Product. Citigroup Place, 123 Front Street West, Suite 1100, Toronto, Ontario M5J 2M3. This product is available in Chile through Banchile Corredores de Bolsa S.A., an indirect subsidiary of Citigroup Inc., which is regulated by the Superintendencia de Valores y Seguros. Agustinas 975, piso 2, Santiago, Chile. The Product is distributed in Germany by Citigroup Global Markets Deutschland AG ("CGMD"), which is regulated by Bundesanstalt fuer Finanzdienstleistungsaufsicht (BaFin). CGMD, Reuterweg 16, 60323 Frankfurt am Main. Research which relates to "securities" (as defined in the Securities and Futures Ordinance (Cap. 571 of the Laws of Hong Kong)) is issued in Hong Kong by, or on behalf of, Citigroup Global Markets Asia Limited which takes full responsibility for its content. Citigroup Global Markets Asia Ltd. is regulated by Hong Kong Securities and Futures Commission. If the Research is made available through Citibank, N.A., Hong Kong Branch, for its clients in Citi Private Bank, it is made available by Citibank N.A., Citibank Tower, Citibank Plaza, 3 Garden Road, Hong Kong. Citibank N.A. is regulated by the Hong Kong Monetary Authority. Please contact your Private Banker in Citibank N.A., Hong Kong, Branch if you have any queries on or any matters arising from or in connection with this document. The Product is made available in India by Citigroup Global Markets India Private Limited (CGM), which is regulated by the Securities and Exchange Board of India (SEBI), as a Research Analyst (SEBI Registration No. INH000000438). CGM is also actively involved in the business of merchant banking, stock brokerage, and depository participant, in India, and is registered with SEBI in this regard. CGM’s registered office is at 1202, 12th Floor, FIFC, G Block, Bandra Kurla Complex, Bandra East, Mumbai – 400051. CGM’s Corporate Identity Number is U99999MH2000PTC126657, and its contact details are: Tel:+9102261759999 Fax:+9102261759961. The Product is made available in Indonesia through PT Citigroup Securities Indonesia. 5/F, Citibank Tower, Bapindo Plaza, Jl. Jend. Sudirman Kav. 54-55, Jakarta 12190. Neither this Product nor any copy hereof may be distributed in Indonesia or to any Indonesian citizens wherever they are domiciled or to Indonesian residents except in compliance with applicable capital market laws and regulations. This Product is not an offer of securities in Indonesia. The securities referred to in this Product have not been registered with the Capital Market and Financial Institutions Supervisory Agency (BAPEPAM-LK) pursuant to relevant capital market laws and regulations, and may not be offered or sold within the territory of the Republic of Indonesia or to Indonesian citizens through a public offering or in circumstances which constitute an offer within the meaning of the Indonesian capital market laws and regulations. The Product is made available in Israel through Citibank NA, regulated by the Bank of Israel and the Israeli Securities Authority. Citibank, N.A, Platinum Building, 21 Ha'arba'ah St, Tel Aviv, Israel. The Product is made available in Italy by Citigroup Global Markets Limited, which is authorised by the PRA and regulated by the FCA and the PRA. Via dei Mercanti, 12, Milan, 20121, Italy. The Product is made available in Japan by Citigroup Global Markets Japan Inc. ("CGMJ"), which is regulated by Financial Services Agency, Securities and Exchange Surveillance Commission, Japan Securities Dealers Association, Tokyo Stock Exchange and Osaka Securities Exchange. Shin-Marunouchi Building, 1-5-1 Marunouchi, Chiyoda-ku, Tokyo 100-6520 Japan. If the Product was distributed by SMBC Nikko Securities Inc. it is being so distributed under license. In the event that an error is found in an CGMJ research report, a revised version will be posted on the Firm's Citi Velocity website. If you have questions regarding Citi Velocity, please call (81 3) 6270-3019 for help. The Product is made available in Korea by Citigroup Global Markets Korea Securities Ltd., which is regulated by the Financial Services Commission, the Financial Supervisory Service and the Korea Financial Investment Association (KOFIA). Citibank Building, 39 Da-dong, Jung-gu, Seoul 100-180, Korea. KOFIA makes available registration information of research analysts on its website. Please visit the following website if you wish to find KOFIA registration information on research analysts of Citigroup Global Markets Korea Securities Ltd. http://dis.kofia.or.kr/websquare/index.jsp?w2xPath=/wq/fundMgr/DISFundMgrAnalystList.xml&divisionId=MDIS03002002000000&serviceId=SDIS03002002000. The Product is made available in Korea by Citibank Korea Inc., which is regulated by the Financial Services Commission and the Financial Supervisory Service. Address is Citibank Building, 39 Da-dong, Jung-gu, Seoul 100-180, Korea. The Product is made available in Malaysia by Citigroup Global Markets Malaysia Sdn Bhd (Company No. 460819-D) (“CGMM”) to its clients and CGMM takes responsibility for its contents. CGMM is regulated by the Securities Commission of Malaysia. Please contact CGMM at Level 43 Menara Citibank, 165 Jalan Ampang, 50450 Kuala Lumpur, Malaysia in respect of any matters arising from, or in connection with, the Product. The Product is made available in Mexico by Acciones y Valores Banamex, S.A. De C. V., Casa de Bolsa, Integrante del Grupo Financiero Banamex ("Accival") which is a wholly owned subsidiary of Citigroup Inc. and is regulated by Comision Nacional Bancaria y de Valores. Reforma 398, Col. Juarez, 06600 Mexico, D.F. In New Zealand the Product is made available to ‘wholesale clients’ only as defined by s5C(1) of the Financial Advisers Act 2008 (‘FAA’) through Citigroup Global Markets Australia Pty Ltd (ABN 64 003 114 832 and AFSL No. 240992), an overseas financial adviser as defined by the FAA, participant of the ASX Group and regulated by the Australian Securities & Investments Commission. Citigroup Centre, 2 Park Street, Sydney, NSW 2000. The Product is made available in Pakistan by Citibank N.A. Pakistan branch, which is regulated by the State Bank of Pakistan and Securities Exchange Commission, Pakistan. AWT Plaza, 1.1. Chundrigar Road, P.O. Box 4889, Karachi-74200. The Product is made available in the Philippines through Citicorp Financial Services and Insurance Brokerage Philippines, Inc., which is regulated by the Philippines Securities and Exchange Commission. 20th Floor Citibank Square Bldg. The Product is made available in the Philippines through Citibank NA Philippines branch, Citibank Tower, 8741 Paseo De Roxas, Makati City, Manila. Citibank NA Philippines NA is regulated by The Bangko Sentral ng Pilipinas. The Product is made available in Poland by Dom Maklerski Banku Handlowego SA an indirect subsidiary of Citigroup Inc., which is regulated by Komisja Nadzoru Finansowego. Dom Maklerski Banku Handlowego S.A. ul.Senatorska 16, 00-923 Warszawa. The Product is made available in the Russian Federation through AO Citibank, which is licensed to carry out banking activities in the Russian Federation in accordance with the general banking license issued by the Central Bank of the Russian Federation and brokerage activities in accordance with the license issued by the Federal Service for

LONGi Green Energy Technology (601012.SS) 20 March 2017 Citi Research
22
Financial Markets. Neither the Product nor any information contained in the Product shall be considered as advertising the securities mentioned in this report within the territory of the Russian Federation or outside the Russian Federation. The Product does not constitute an appraisal within the meaning of the Federal Law of the Russian Federation of 29 July 1998 No. 135-FZ (as amended) On Appraisal Activities in the Russian Federation. 8-10 Gasheka Street, 125047 Moscow. The Product is made available in Singapore through Citigroup Global Markets Singapore Pte. Ltd. (“CGMSPL”), a capital markets services license holder, and regulated by Monetary Authority of Singapore. Please contact CGMSPL at 8 Marina View, 21st Floor Asia Square Tower 1, Singapore 018960, in respect of any matters arising from, or in connection with, the analysis of this document. This report is intended for recipients who are accredited, expert and institutional investors as defined under the Securities and Futures Act (Cap. 289). The Product is made available by The Citigroup Private Bank in Singapore through Citibank, N.A., Singapore Branch, a licensed bank in Singapore that is regulated by Monetary Authority of Singapore. Please contact your Private Banker in Citibank N.A., Singapore Branch if you have any queries on or any matters arising from or in connection with this document. This report is intended for recipients who are accredited, expert and institutional investors as defined under the Securities and Futures Act (Cap. 289). This report is distributed in Singapore by Citibank Singapore Ltd ("CSL") to selected Citigold/Citigold Private Clients. CSL provides no independent research or analysis of the substance or in preparation of this report. Please contact your Citigold//Citigold Private Client Relationship Manager in CSL if you have any queries on or any matters arising from or in connection with this report. This report is intended for recipients who are accredited investors as defined under the Securities and Futures Act (Cap. 289). Citigroup Global Markets (Pty) Ltd. is incorporated in the Republic of South Africa (company registration number 2000/025866/07) and its registered office is at 145 West Street, Sandton, 2196, Saxonwold. Citigroup Global Markets (Pty) Ltd. is regulated by JSE Securities Exchange South Africa, South African Reserve Bank and the Financial Services Board. The investments and services contained herein are not available to private customers in South Africa. The Product is made available in the Republic of China through Citigroup Global Markets Taiwan Securities Company Ltd. ("CGMTS"), 14 and 15F, No. 1, Songzhi Road, Taipei 110, Taiwan and/or through Citibank Securities (Taiwan) Company Limited ("CSTL"), 14 and 15F, No. 1, Songzhi Road, Taipei 110, Taiwan, subject to the respective license scope of each entity and the applicable laws and regulations in the Republic of China. CGMTS and CSTL are both regulated by the Securities and Futures Bureau of the Financial Supervisory Commission of Taiwan, the Republic of China. No portion of the Product may be reproduced or quoted in the Republic of China by the press or any third parties [without the written authorization of CGMTS and CSTL]. If the Product covers securities which are not allowed to be offered or traded in the Republic of China, neither the Product nor any information contained in the Product shall be considered as advertising the securities or making recommendation of the securities in the Republic of China. The Product is for informational purposes only and is not intended as an offer or solicitation for the purchase or sale of a security or financial products. Any decision to purchase securities or financial products mentioned in the Product must take into account existing public information on such security or the financial products or any registered prospectus. The Product is made available in Thailand through Citicorp Securities (Thailand) Ltd., which is regulated by the Securities and Exchange Commission of Thailand. 399 Interchange 21 Building, 18th Floor, Sukhumvit Road, Klongtoey Nua, Wattana ,Bangkok 10110, Thailand. The Product is made available in Turkey through Citibank AS which is regulated by Capital Markets Board. Tekfen Tower, Eski Buyukdere Caddesi # 209 Kat 2B, 23294 Levent, Istanbul, Turkey. In the U.A.E, these materials (the "Materials") are communicated by Citigroup Global Markets Limited, DIFC branch ("CGML"), an entity registered in the Dubai International Financial Center ("DIFC") and licensed and regulated by the Dubai Financial Services Authority ("DFSA") to Professional Clients and Market Counterparties only and should not be relied upon or distributed to Retail Clients. A distribution of the different Citi Research ratings distribution, in percentage terms for Investments in each sector covered is made available on request. Financial products and/or services to which the Materials relate will only be made available to Professional Clients and Market Counterparties. The Product is made available in United Kingdom by Citigroup Global Markets Limited, which is authorised by the Prudential Regulation Authority (“PRA”) and regulated by the Financial Conduct Authority (“FCA”) and the PRA. This material may relate to investments or services of a person outside of the UK or to other matters which are not authorised by the PRA nor regulated by the FCA and the PRA and further details as to where this may be the case are available upon request in respect of this material. Citigroup Centre, Canada Square, Canary Wharf, London, E14 5LB. The Product is made available in United States by Citigroup Global Markets Inc, which is a member of FINRA and registered with the US Securities and Exchange Commission. 388 Greenwich Street, New York, NY 10013. Unless specified to the contrary, within EU Member States, the Product is made available by Citigroup Global Markets Limited, which is authorised by the PRA and regulated by the FCA and the PRA. The Product is not to be construed as providing investment services in any jurisdiction where the provision of such services would not be permitted. Subject to the nature and contents of the Product, the investments described therein are subject to fluctuations in price and/or value and investors may get back less than originally invested. Certain high-volatility investments can be subject to sudden and large falls in value that could equal or exceed the amount invested. Certain investments contained in the Product may have tax implications for private customers whereby levels and basis of taxation may be subject to change. If in doubt, investors should seek advice from a tax adviser. The Product does not purport to identify the nature of the specific market or other risks associated with a particular transaction. Advice in the Product is general and should not be construed as personal advice given it has been prepared without taking account of the objectives, financial situation or needs of any particular investor. Accordingly, investors should, before acting on the advice, consider the appropriateness of the advice, having regard to their objectives, financial situation and needs. Prior to acquiring any financial product, it is the client's responsibility to obtain the relevant offer document for the product and consider it before making a decision as to whether to purchase the product. Citi Research product may source data from dataCentral. dataCentral is a Citi Research proprietary database, which includes the Firm’s estimates, data from company reports and feeds from Thomson Reuters. The printed and printable version of the research report may not include all the information (e.g., certain financial summary information and comparable company data) that is linked to the online version available on the Firm's proprietary electronic distribution platforms. © 2017 Citigroup Global Markets Inc. Citi Research is a division of Citigroup Global Markets Inc. Citi and Citi with Arc Design are trademarks and service marks of Citigroup Inc. and its affiliates and are used and registered throughout the world. All rights reserved. The research data in this report is not intended to be used for the purpose of (a) determining the price or amounts due in respect of one or more financial products or instruments and/or (b) measuring or comparing the performance of a financial product or a portfolio of financial instruments, and any such use is strictly prohibited without the prior written consent of Citi Research. Any unauthorized use, duplication, redistribution or disclosure of this report (the “Product”), including, but not limited to, redistribution of the Product by electronic mail, posting of the Product on a website or page, and/or providing to a third party a link to the Product, is prohibited by law and will result in prosecution. The information contained in the Product is intended solely for the recipient and may not be further distributed by the recipient to any third party. Where included in this report, MSCI sourced information is the exclusive property of Morgan Stanley Capital International Inc. (MSCI). Without prior written permission of MSCI, this information and any other MSCI intellectual property may not be reproduced, redisseminated or used to create any financial products, including any indices. This information is provided on an "as is" basis. The user assumes the entire risk of any use made of this information. MSCI, its affiliates and any third party involved in, or related to, computing or compiling the information hereby expressly disclaim

LONGi Green Energy Technology (601012.SS) 20 March 2017 Citi Research
23
all warranties of originality, accuracy, completeness, merchantability or fitness for a particular purpose with respect to any of this information. Without limiting any of the foregoing, in no event shall MSCI, any of its affiliates or any third party involved in, or related to, computing or compiling the information have any liability for any damages of any kind. MSCI, Morgan Stanley Capital International and the MSCI indexes are services marks of MSCI and its affiliates. The Firm accepts no liability whatsoever for the actions of third parties. The Product may provide the addresses of, or contain hyperlinks to, websites. Except to the extent to which the Product refers to website material of the Firm, the Firm has not reviewed the linked site. Equally, except to the extent to which the Product refers to website material of the Firm, the Firm takes no responsibility for, and makes no representations or warranties whatsoever as to, the data and information contained therein. Such address or hyperlink (including addresses or hyperlinks to website material of the Firm) is provided solely for your convenience and information and the content of the linked site does not in any way form part of this document. Accessing such website or following such link through the Product or the website of the Firm shall be at your own risk and the Firm shall have no liability arising out of, or in connection with, any such referenced website. ADDITIONAL INFORMATION IS AVAILABLE UPON REQUEST