long-term stability of liposomal nanomedicines
TRANSCRIPT
Stability of Liposomal Nanomedicines
Emily Blick
Elizabeth Kelley
Yun Liu
1

OUTLINE
1. Introduction
2. Materials and methods
3. Results and discussions
4. Conclusions
22

WHAT ARE LIPOSOMES?• Lipids in solution form liposomes
• Enclose aqueous solutions
• Vesicles can have one or more bilayers
• Unilamellar vesicles simplest model for drug delivery
Hydrophilic head group
Hydrophobic tails
Hydrophilic Hydrophobic
Unilamellar Liposome3

WHY LIPOSOMES?
• Liposomes are promising candidates for future drug delivery applications
• Similar morphology to the cellular membrane
• Biocompatible, biodegradability, and low toxicity
New cancer drug!
Doxil: Liposomal Injection for Ovarian Cancer
Exparel: Non-opioid pain relief
Liposome Real Toning Ampoule: Skin Care
4
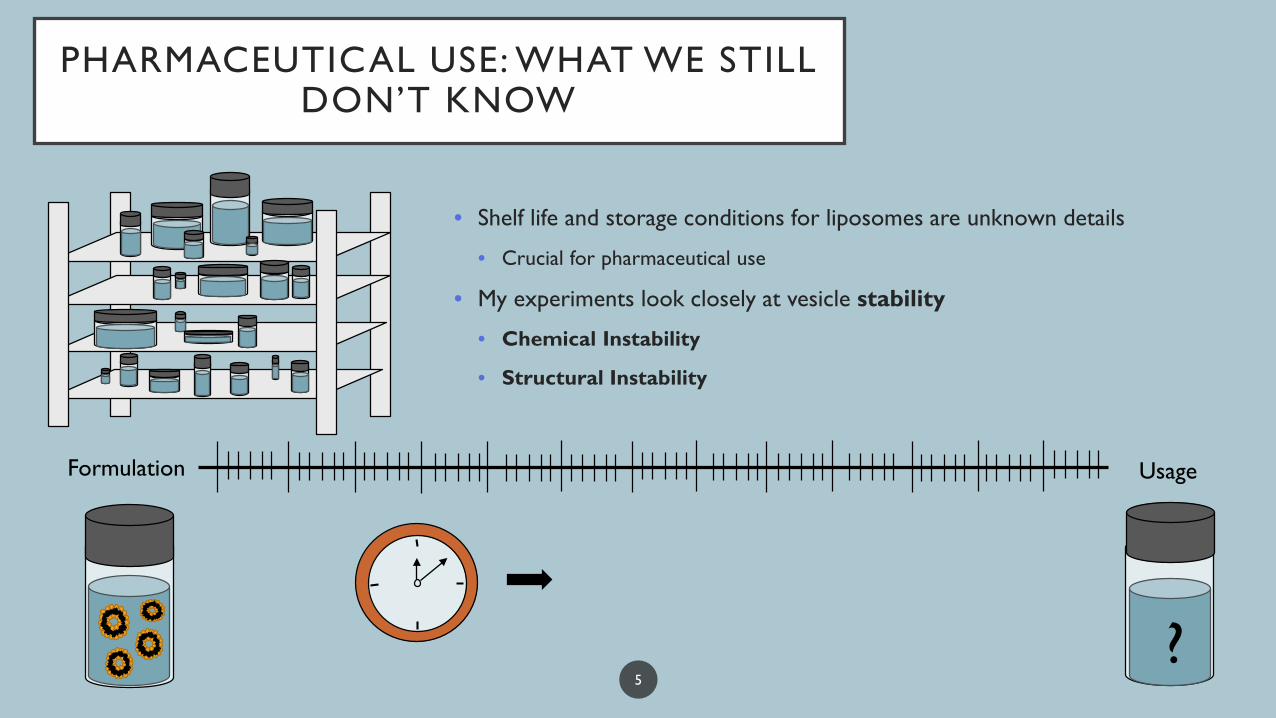
PHARMACEUTICAL USE: WHAT WE STILL DON’T KNOW
• Shelf life and storage conditions for liposomes are unknown details
• Crucial for pharmaceutical use
• My experiments look closely at vesicle stability
• Chemical Instability
• Structural Instability
Formulation Usage
?5

HYDROLYSIS • Break down of lipids from water moisture
• Oxidative degradation of lipids due to the loss of electrons
OXIDATION
CHEMICAL INSTABILITY
Free Fatty Acid
What we can measure!
Free Radicals
What we can measure!
6
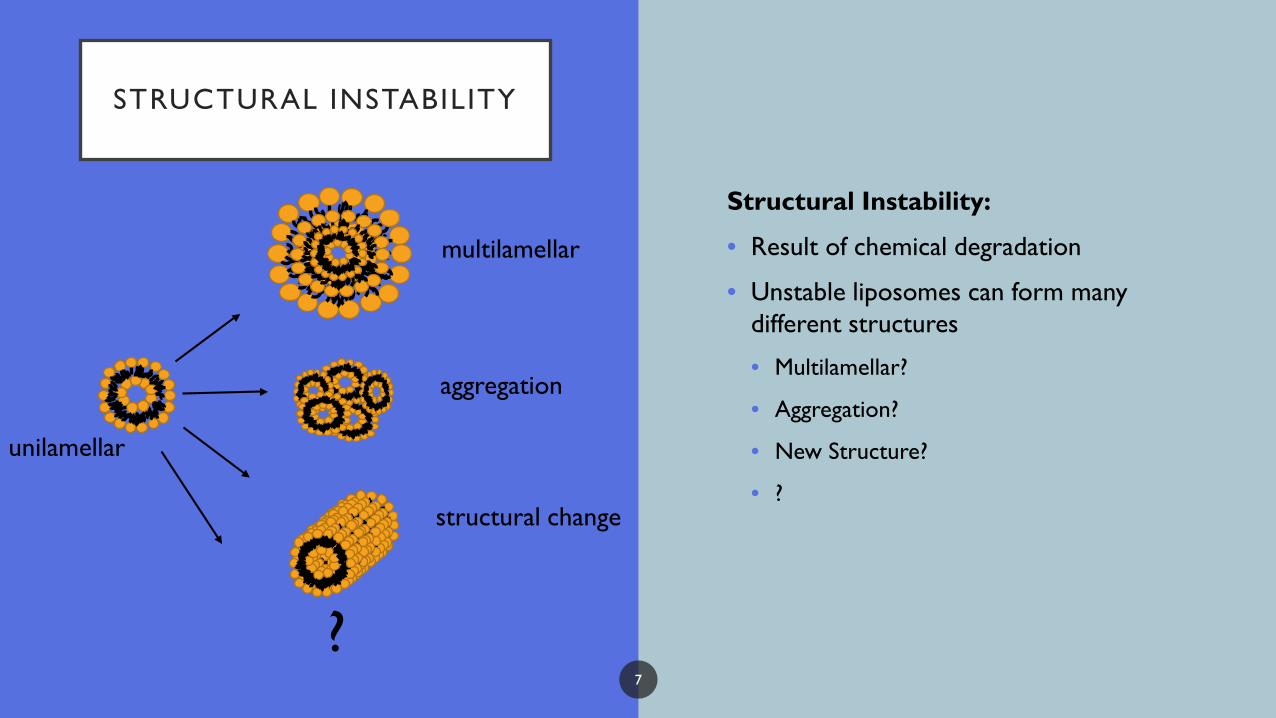
STRUCTURAL INSTABILITY
Structural Instability:
• Result of chemical degradation
• Unstable liposomes can form many different structures
• Multilamellar?
• Aggregation?
• New Structure?
• ?
unilamellar
multilamellar
aggregation
?
structural change
7

OUTLINE
1. Introduction
2. Materials and methods
3. Results and discussions
4. Conclusions
8

MATERIALS
• Using model system 1,2-Dioleoyl-sn-glycero-3-phosphocholine (DOPC)• Commonly used lipid in research
• Unilamellar vesicles
Lipid Extrusion:• Lipids in solution forced through a
filter• Defined pore size
• Decrease filter size throughout extrusion
Porous FilterUnfiltered Liposomes Filtered
Liposomes
9
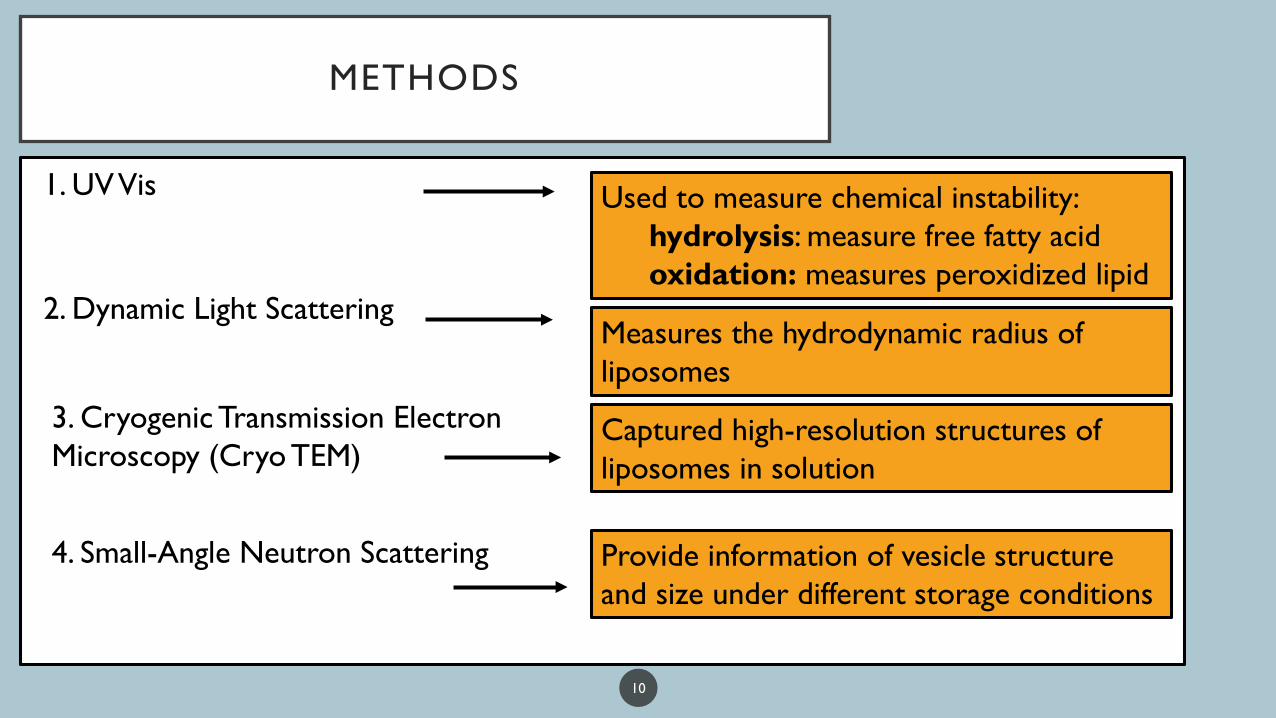
METHODS
Measures the hydrodynamic radius of liposomes
2. Dynamic Light Scattering
1. UV Vis Used to measure chemical instability:hydrolysis: measure free fatty acidoxidation: measures peroxidized lipid
4. Small-Angle Neutron Scattering Provide information of vesicle structure and size under different storage conditions
3. Cryogenic Transmission Electron Microscopy (Cryo TEM)
Captured high-resolution structures of liposomes in solution
10

SMALL ANGLE NEUTRON SCATTERING
• Probes material structures by interacting with nucleus in sample
• Neutron scattering can be measured by a detector
• Scattering vector Q can tell us about structures in our sample to nanometer scale
Neutron beam
Sample
Scattered beamDetector
Q
11

OUTLINE
1. Introduction
2. Materials and methods
3. Results and discussions
4. Conclusions
12
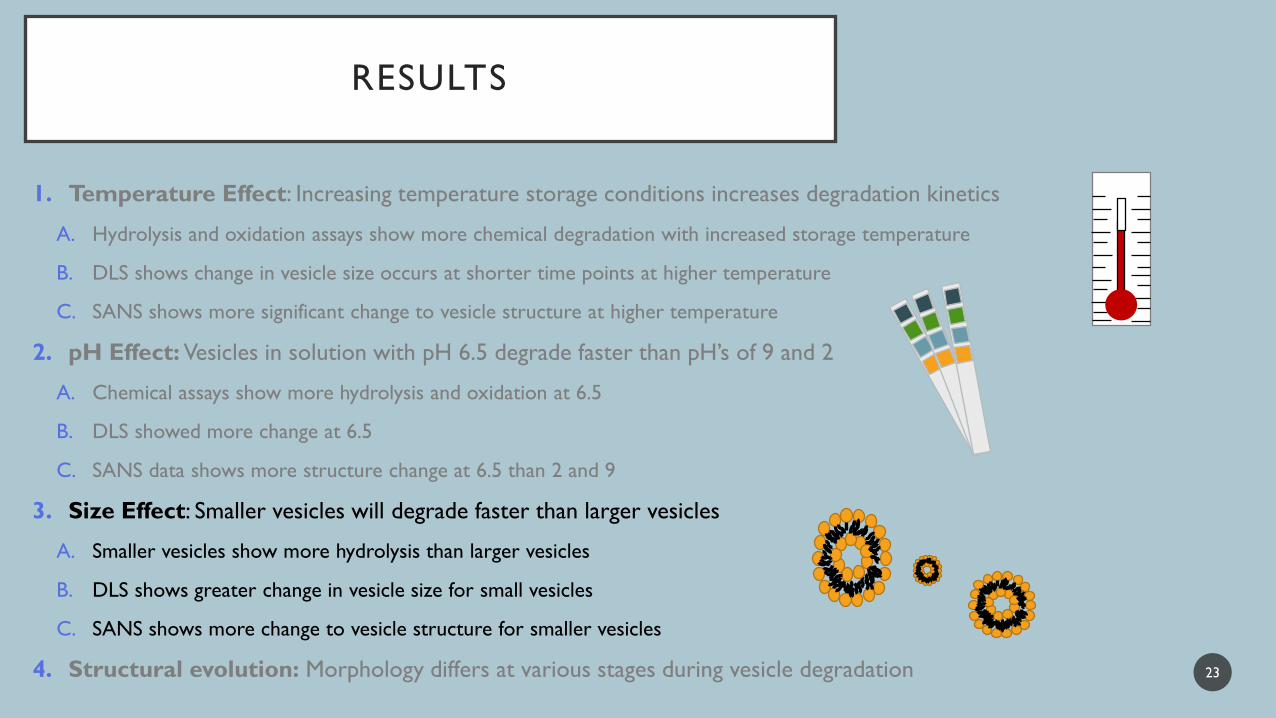
RESULTS
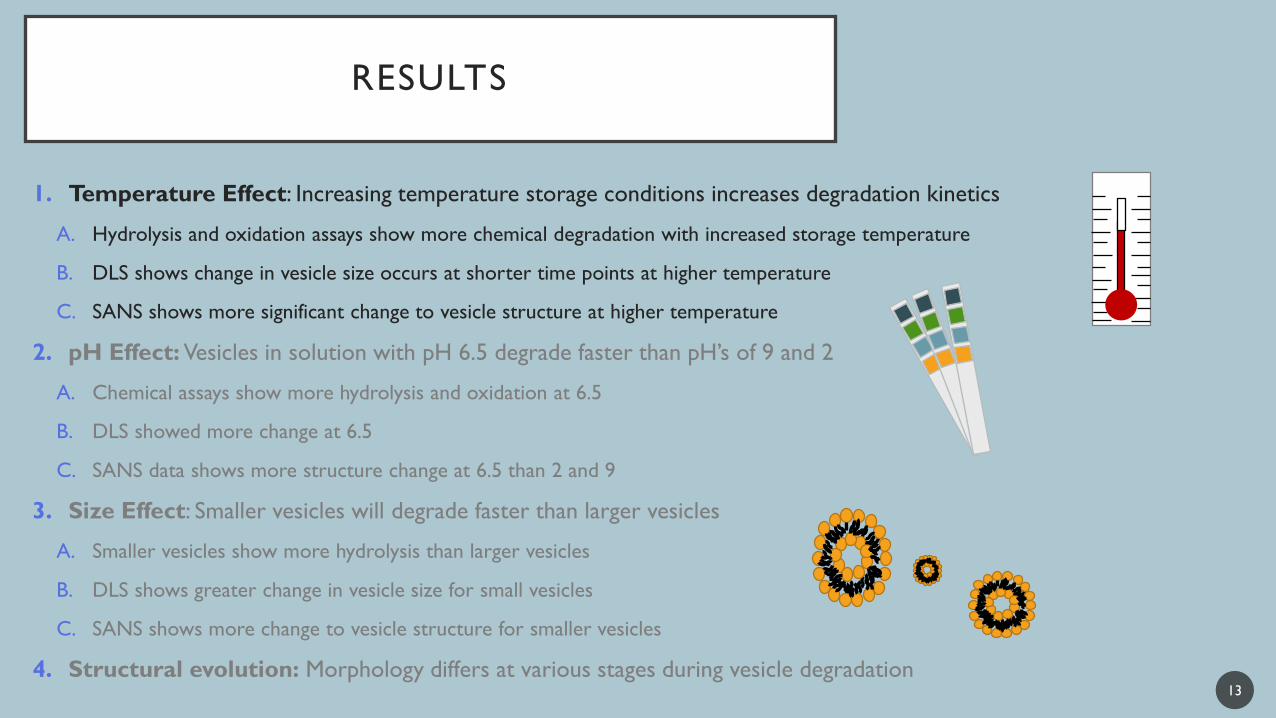
1. Temperature Effect: Increasing temperature storage conditions increases degradation kinetics
A. Hydrolysis and oxidation assays show more chemical degradation with increased storage temperature
B. DLS shows change in vesicle size occurs at shorter time points at higher temperature
C. SANS shows more significant change to vesicle structure at higher temperature
2. pH Effect: Vesicles in solution with pH 6.5 degrade faster than pH’s of 9 and 2
A. Chemical assays show more hydrolysis and oxidation at 6.5
B. DLS showed more change at 6.5
C. SANS data shows more structure change at 6.5 than 2 and 9
3. Size Effect: Smaller vesicles will degrade faster than larger vesicles
A. Smaller vesicles show more hydrolysis than larger vesicles
B. DLS shows greater change in vesicle size for small vesicles
C. SANS shows more change to vesicle structure for smaller vesicles
4. Structural evolution: Morphology differs at various stages during vesicle degradation13
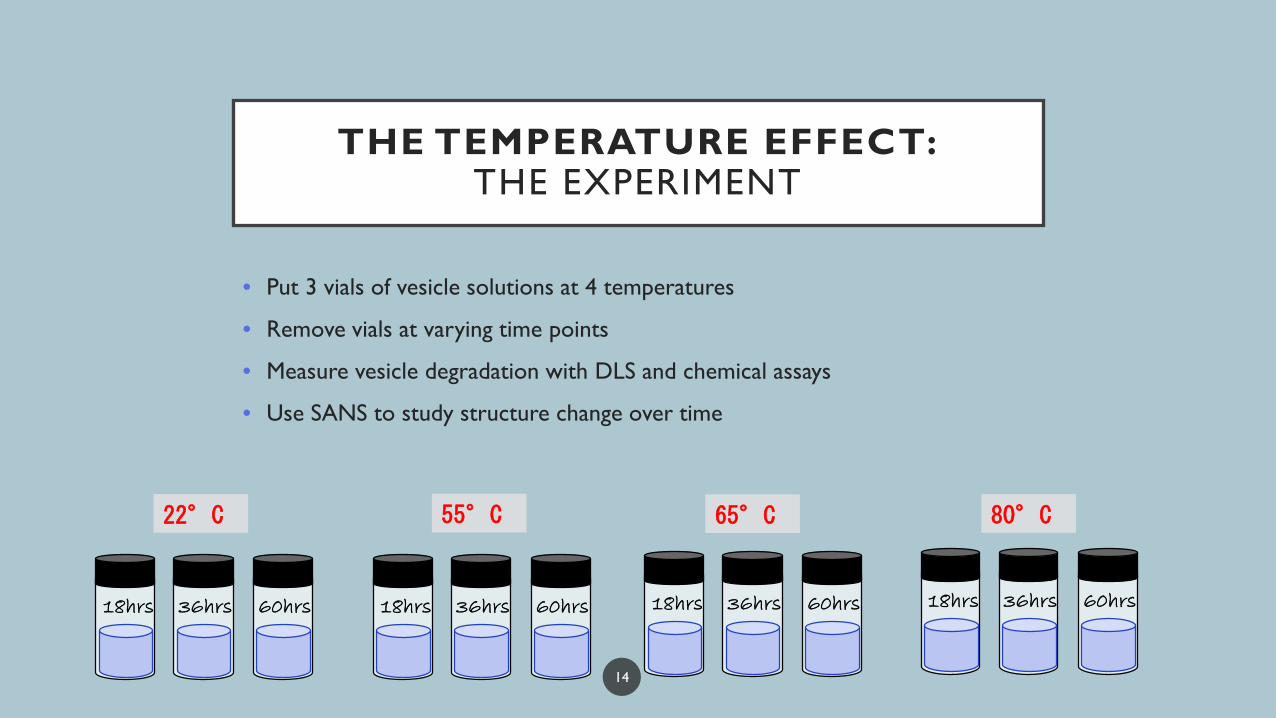
THE TEMPERATURE EFFECT:THE EXPERIMENT
• Put 3 vials of vesicle solutions at 4 temperatures
• Remove vials at varying time points
• Measure vesicle degradation with DLS and chemical assays
• Use SANS to study structure change over time
22°C 55°C 65°C 80°C
36hrs 60hrs18hrs 36hrs 60hrs18hrs 36hrs 60hrs18hrs 36hrs 60hrs18hrs
14
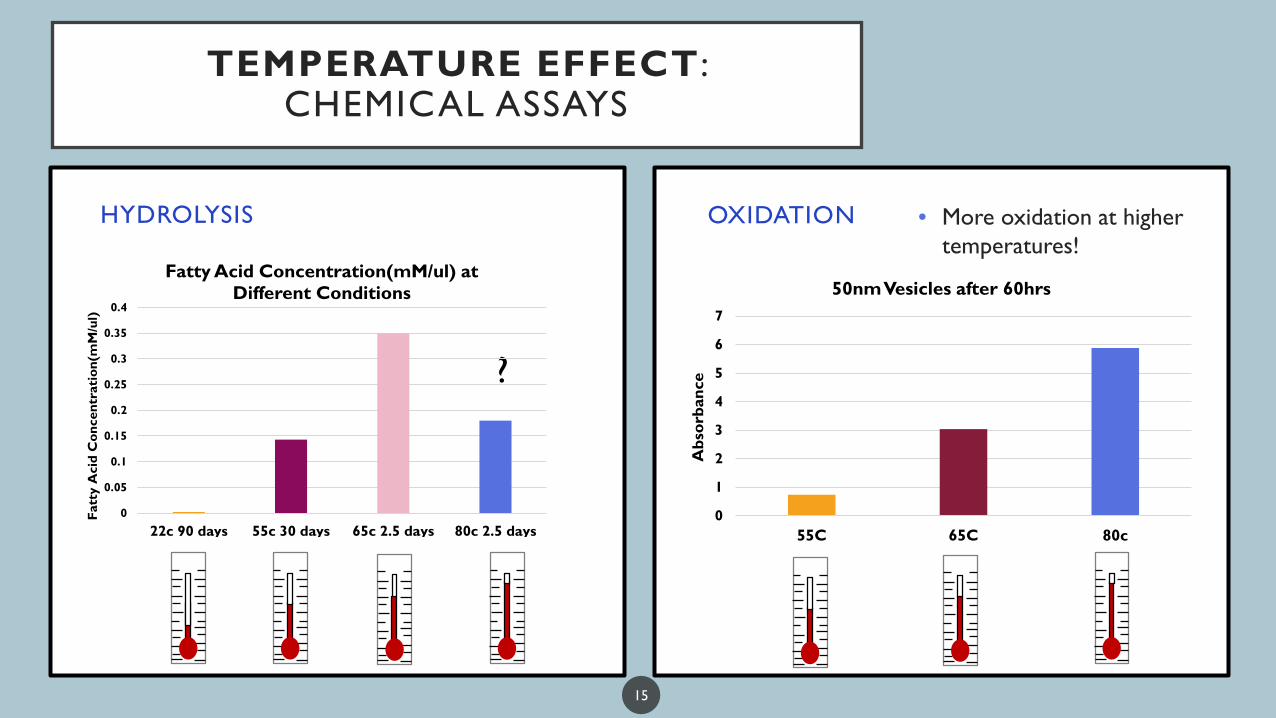
HYDROLYSIS • More oxidation at higher temperatures!
OXIDATION
TEMPERATURE EFFECT : CHEMICAL ASSAYS
0
1
2
3
4
5
6
7
55C 65C 80c
Abs
orba
nce
50nm Vesicles after 60hrs
?
0
0.05
0.1
0.15
0.2
0.25
0.3
0.35
0.4
22c 90 days 55c 30 days 65c 2.5 days 80c 2.5 days
Fatt
y A
cid
Con
cent
rati
on(m
M/u
l)
Fatty Acid Concentration(mM/ul) at Different Conditions
15

TEMPERATURE EFFECT : DLS • Vesicles at higher temperatures change size
quicker
• Degradation kinetics increase with temperature
• Initially see an increase in vesicle size, followed by a decrease and then eventually an increase again
• At 22c vesicles will remain unchanged even after 30 days!
• Note: DLS only tells us about vesicle size not structure
40
50
60
70
80
90
100
110
0 0.5 1 1.5 2 2.5 3
Rad
ius(
nm)
Time(days)
Short Term Temperature Effects8050nm
22c50nm
65c50nm
55c50nm
020406080
100120140160
0 5 10 15 20 25 30
Rad
ius(
nm)
Time(days)
Long term Temperature Effects
22c
55c
Time
16

TEMPERATURE EFFECT : SANS
0
20
40
60
80
100
120
50 55 60 65 70 75 80 85
Rad
ius(
nm)
Temperature(C)
Radius of Gyration at Different Temperatures
BilayerVesicle size Intermediate Structure
• Significant change at low q and Rg showing change in vesicle size
• Intermediate structure change
• At high q samples look similar
• Similar bilayer length scale
• Intermediate structure change
17
55c
65c
80c

RESULTS
1. Temperature Effect: Increasing temperature storage conditions increases degradation kinetics
A. Hydrolysis and oxidation assays show more chemical degradation with increased storage temperature
B. DLS shows change in vesicle size occurs at shorter time points at higher temperature
C. SANS shows more significant change to vesicle structure at higher temperature
2. pH Effect: Vesicles in solution with pH 6.5 degrade faster than pH’s of 9 and 2
A. Chemical assays show more hydrolysis and oxidation at 6.5
B. DLS showed more change at 6.5
C. SANS data shows more structure change at 6.5 than 2 and 9
3. Size Effect: Smaller vesicles will degrade faster than larger vesicles
A. Smaller vesicles show more hydrolysis than larger vesicles
B. DLS shows greater change in vesicle size for small vesicles
C. SANS shows more change to vesicle structure for smaller vesicles
4. Structural evolution: Morphology differs at various stages during vesicle degradation18

THE PH EFFECT: THE EXPERIMENT
• Put 3 vials at different pH values at 22C and 80C for 24 hours
• Measure vesicle degradation with DLS and chemical assays
• Use SANS to study structure change over time
22°C 80°C
pH 9pH 2 pH 6.5 pH 9pH 2pH 6.5
19

HYDROLYSIS
• Slowest hydrolysis rates at neutral pH’s
• Faster hydrolysis rate at 3 and 10
HYDROLYSIS RATE AND PH IN LITERATURE
PH EFFECT : CHEMICAL ASSAYS
0
0.02
0.04
0.06
0.08
0.1
0.12
22c ph2 22c ph6.5 22c ph9 80c ph2 80c ph6.5 80c ph9
Fatt
y A
cid
Con
cent
rati
on(m
M/u
l)
Fatty Acid Concentration (mM/ul) vs pH and Temperature Conditions
“Liposome Stability” https://encapsula.com/hydrolysis-and-oxidation-of-liposomes/
Rate of hydrolysis of HSPC in 0.05 M buffer.
20

PH EFFECT : DLS
• Vesicles at neutral pH grew larger than vesicles at pH of 2 and 9
• Opposing what is suggested in literature
• Different membranes may have changing stability properties80
82
84
86
88
90
92
94
ph 2 80c ph 6.5 80c ph 9 80c
Radius after 24 hours at 80C
Original Vesicle Size
21
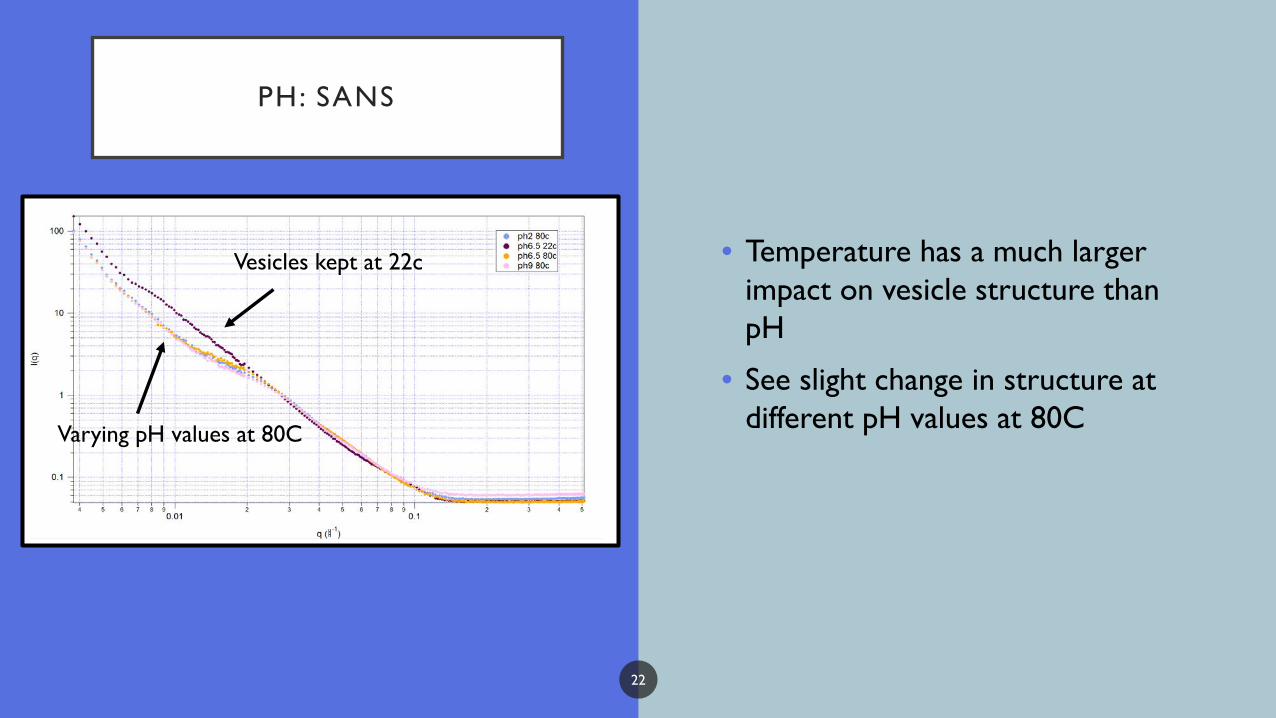
PH: SANS
• Temperature has a much larger impact on vesicle structure than pH
• See slight change in structure at different pH values at 80CVarying pH values at 80C
Vesicles kept at 22c
22
RESULTS
1. Temperature Effect: Increasing temperature storage conditions increases degradation kinetics
A. Hydrolysis and oxidation assays show more chemical degradation with increased storage temperature
B. DLS shows change in vesicle size occurs at shorter time points at higher temperature
C. SANS shows more significant change to vesicle structure at higher temperature
2. pH Effect: Vesicles in solution with pH 6.5 degrade faster than pH’s of 9 and 2
A. Chemical assays show more hydrolysis and oxidation at 6.5
B. DLS showed more change at 6.5
C. SANS data shows more structure change at 6.5 than 2 and 9
3. Size Effect: Smaller vesicles will degrade faster than larger vesicles
A. Smaller vesicles show more hydrolysis than larger vesicles
B. DLS shows greater change in vesicle size for small vesicles
C. SANS shows more change to vesicle structure for smaller vesicles
4. Structural evolution: Morphology differs at various stages during vesicle degradation 23

THE SIZE EFFECT : THE EXPERIMENT
• Repeated temperature effect experiments with duplicates at 50nm and 100nm
22°C 55°C 65°C 80°C
36hrs 60hrs18hrs 36hrs 60hrs18hrs 36hrs 60hrs18hrs 36hrs 60hrs18hrs
36hrs 60hrs18hrs 36hrs 60hrs18hrs 36hrs 60hrs18hrs 36hrs 60hrs18hrs
50 nm
100 nm24

HYDROLYSIS OXIDATION
SIZE EFFECT : CHEMICAL ASSAYS
00.050.1
0.150.2
0.250.3
0.350.4
50 65 2 day 100 65 2 day
Fatt
y A
cid
Con
cent
rati
on(m
M/u
l)
Fatty Acid Concentration(mM/ul) at Different Conditions
0
0.5
1
1.5
2
2.5
3
3.5
100nm 65 C 50nm 65 C
Abs
orba
nce
Oxidation of Liposomes at 65 C
25

SIZE EFFECT : DLS
0
20
40
60
80
100
120
0 5 10 15 20
avg
radi
us (
nm)
days
Radius over Time at 55c with Varying Vesicle Sizes• Smaller vesicles change size more
quickly at the same temperature!
• Data shown here is 55c but reproducible at other temperatures
26
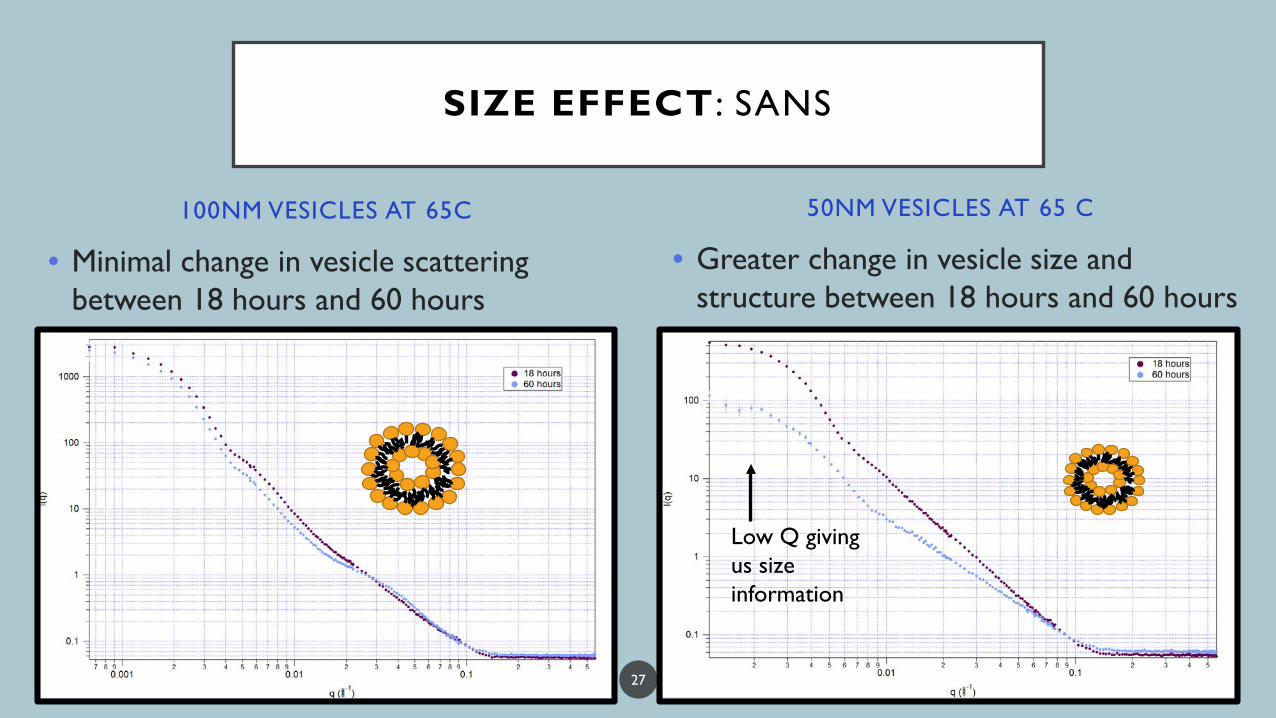
100NM VESICLES AT 65C
• Minimal change in vesicle scattering between 18 hours and 60 hours
• Greater change in vesicle size and structure between 18 hours and 60 hours
50NM VESICLES AT 65 C
SIZE EFFECT : SANS
Low Q giving us size information
27
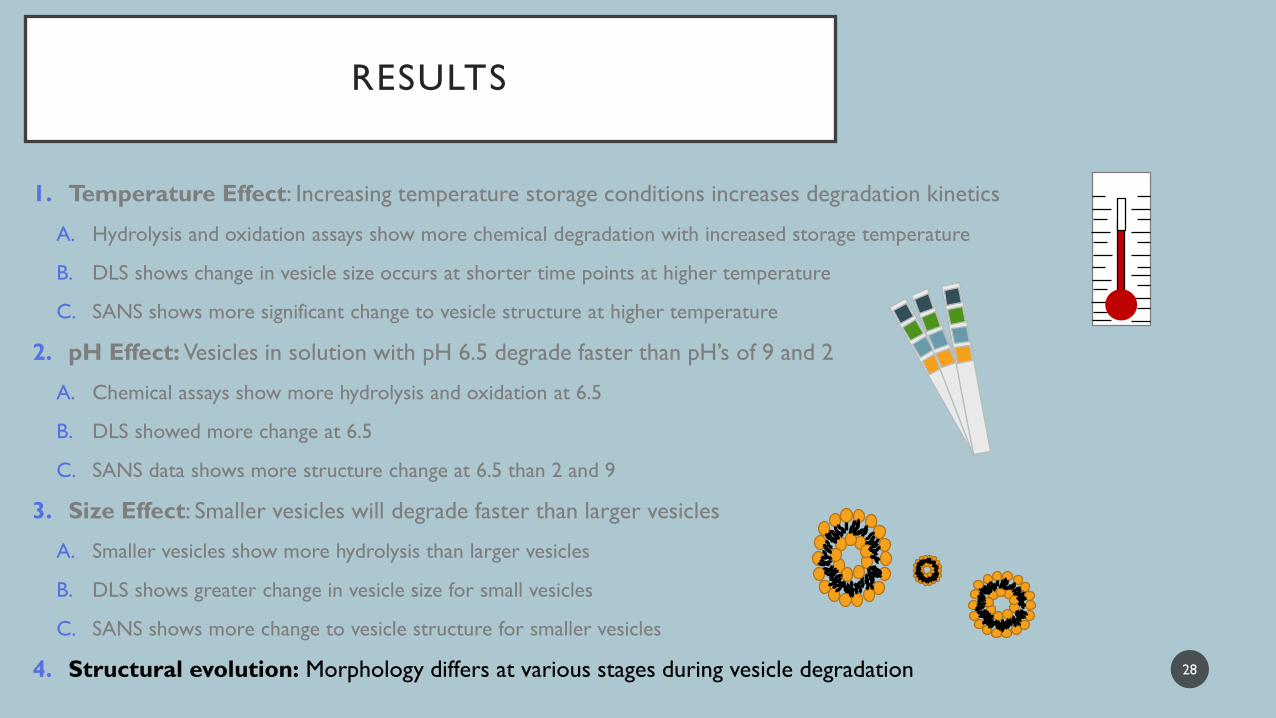
RESULTS
1. Temperature Effect: Increasing temperature storage conditions increases degradation kinetics
A. Hydrolysis and oxidation assays show more chemical degradation with increased storage temperature
B. DLS shows change in vesicle size occurs at shorter time points at higher temperature
C. SANS shows more significant change to vesicle structure at higher temperature
2. pH Effect: Vesicles in solution with pH 6.5 degrade faster than pH’s of 9 and 2
A. Chemical assays show more hydrolysis and oxidation at 6.5
B. DLS showed more change at 6.5
C. SANS data shows more structure change at 6.5 than 2 and 9
3. Size Effect: Smaller vesicles will degrade faster than larger vesicles
A. Smaller vesicles show more hydrolysis than larger vesicles
B. DLS shows greater change in vesicle size for small vesicles
C. SANS shows more change to vesicle structure for smaller vesicles
4. Structural evolution: Morphology differs at various stages during vesicle degradation 28
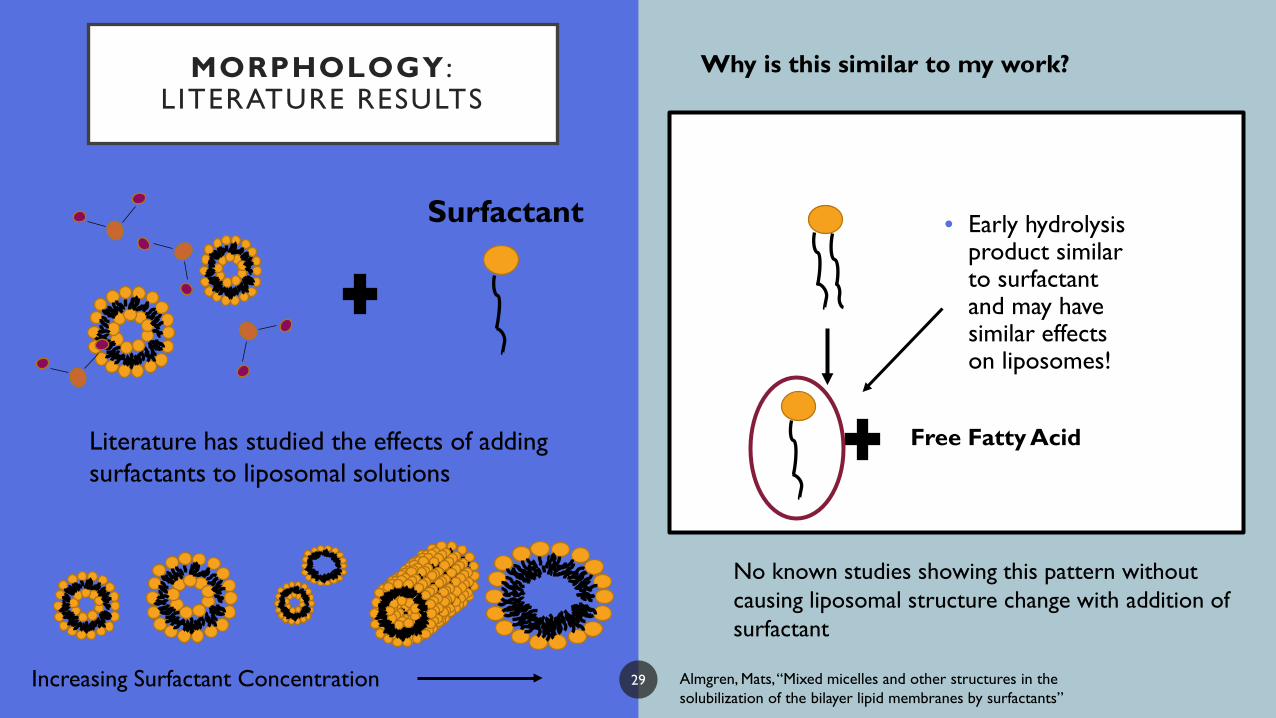
MORPHOLOGY :L ITERATURE RESULTS
Why is this similar to my work?
Surfactant
Literature has studied the effects of adding surfactants to liposomal solutions
Increasing Surfactant Concentration
Break down of lipids from water moisture
Free Fatty Acid
• Early hydrolysis product similar to surfactant and may have similar effects on liposomes!
No known studies showing this pattern without causing liposomal structure change with addition of surfactant
Almgren, Mats, “Mixed micelles and other structures in the solubilization of the bilayer lipid membranes by surfactants”
29

SMALL ANGLE NEUTRON SCATTERING
• Able to generate a 2D scattering pattern on detector
• Generate 1D plots that contain structural information
Neutron beam
Sample
Scattered beamDetector
Q
30
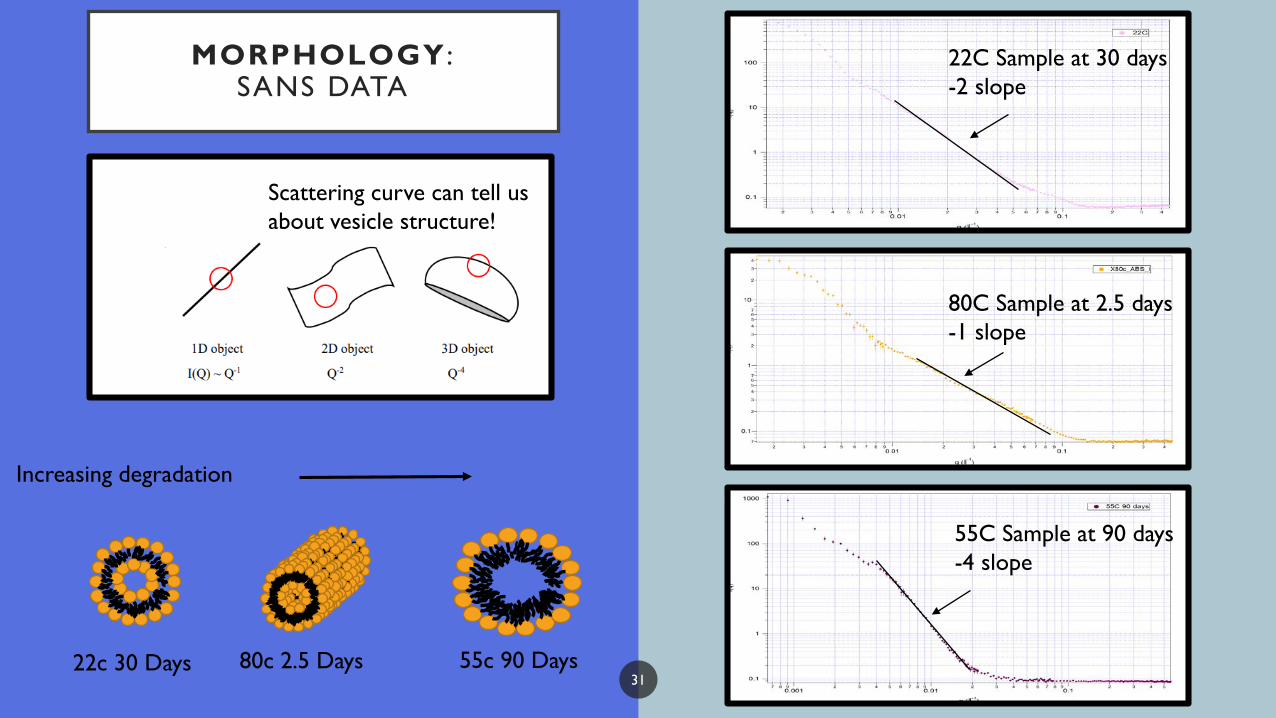
MORPHOLOGY :SANS DATA
22C Sample at 30 days-2 slope
80C Sample at 2.5 days-1 slope
55C Sample at 90 days-4 slope
Scattering curve can tell us about vesicle structure!
22c 30 Days 80c 2.5 Days 55c 90 Days
Increasing degradation
31

MORPHOLOGY :CRYO TEM
Multilamellar Unilamellar
• Overall 22C samples remained unchanged and unilamellar after 30 days!
32
22C SAMPLE 30 DAYS

CONCLUSIONS
• Temperature Effect: Increasing temperature storage conditions increases degradation kinetics
• Temperature increases the hydrolysis and oxidation rate
• pH Effect: Vesicles in solution with pH 6.5 degrade faster than pH’s of 9 and 2
• Opposing what is reported in literature
• Showing various properties will differ between membranes
• Size Effect: Smaller vesicles will degrade faster than larger vesicles
• More hydrolysis and oxidation products present in smaller liposome solutions
• Structural evolution: Morphology differs at various stages during vesicle degradation
• Vesicles undergo transitions into 1D structure and eventually large 3D structure
33

ACKNOWLEDGMENTS
• Center for High Resolution Neutron Scattering
• NIST Center for Neutron Research
• Yun Liu
• Elizabeth Kelley
• Joe Dura
• Julie Borchers
34
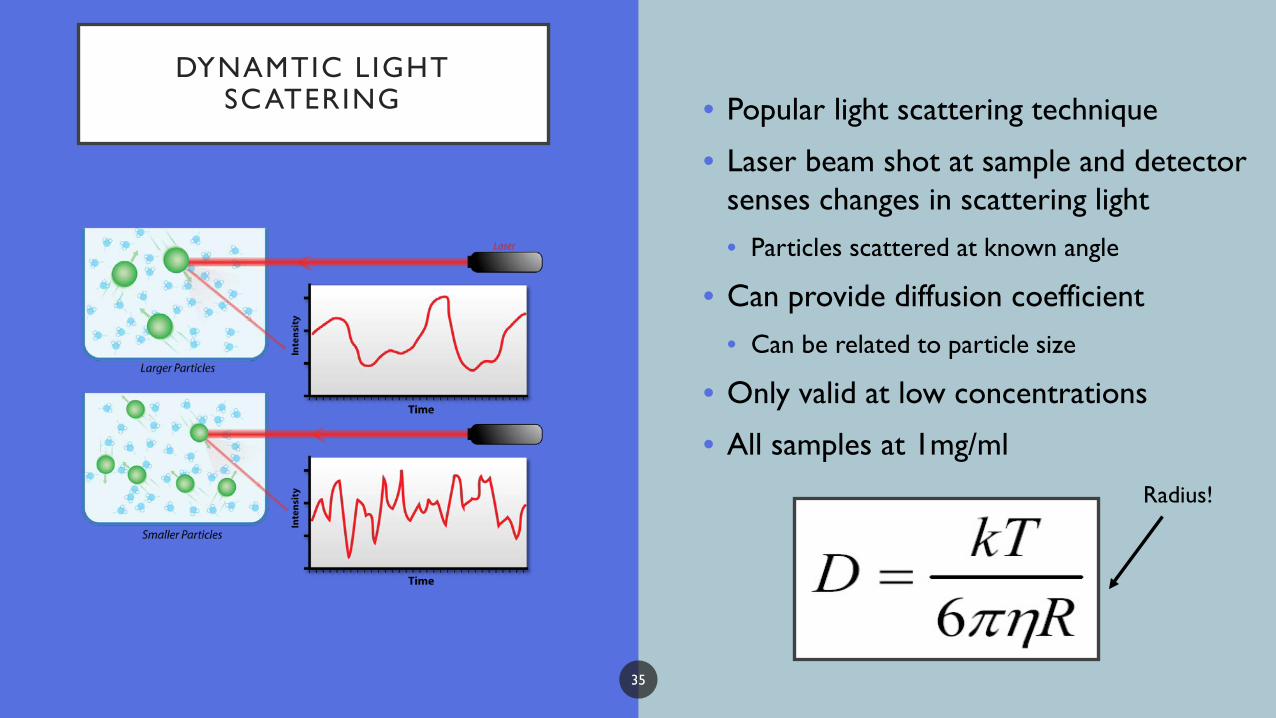
DYNAMTIC LIGHT SCATERING • Popular light scattering technique
• Laser beam shot at sample and detector senses changes in scattering light• Particles scattered at known angle
• Can provide diffusion coefficient • Can be related to particle size
• Only valid at low concentrations
• All samples at 1mg/mlRadius!
35

MY PREVIOUS CONCLUSIONS
• Last summer used DLS to study vesicle size change at different temperatures over time
• Saw significant change in vesicle size at 55c
• Initial expansion and then following contraction of vesicle
• Surprising results not well understood
• Saw dependency on vesicle size with the rate of degradation
Future Work
• Run longer-term stability experiments
• Study the pathways of chemical decomposition
• Use small angle neutron scattering to understand liposome structure at different degradation time points at different temperatures
40
60
80
100
120
0 5 10 15 20
avg
radi
us(n
m)
days
Radius over Time at varying Temperatures
0
20
40
60
80
100
120
0 5 10 15 20
avg
radi
us (
nm)
days
Radius over Time at 55c with Varying Vesicle Sizes
36

LONG-TERM STABILITY EXPERIMENTS
• Ran the same experiments as last summer twice over longer time periods
• Changes:• Controlled for light by completely wrapping everything
in foil
• Ran chemical assays to check for degradation
• Checked pH measurements
• Decided to not continue with 4c because so similar to 22c
• Again saw significant change in vesicle size at 55c• Initial expansion and then following contraction of
vesicle
• Slower than last summer
• Conclusions:• Vesicles are degrading at 55c and forming another
structure
• Exposure to light accelerates this process
• Vesicle size contributes to degradation kinetics
0
20
40
60
80
100
120
0 20 40 60 80 100
Radi
us(n
m)
Time(days)
Batch One
020406080
100120140160
0 5 10 15 20 25 30
Rad
ius(
nm)
Time(days)
Batch Two
22c
55c
37