long term scenario perspective - energy
TRANSCRIPT

Wim Thomas Chief Energy Advisor, Shell International BV 28 March 2012
Long Term Scenario Perspective Integrated Planning Colloquium
South Africa

Why do we use scenarios?
Dealing with uncertainties greater, and time scales longer, than anyone can make predictions for
Today’s complexity requires a broad dialogue with diverse communities to arrive at sustainable solutions
Broaden peoples’ perspective
Challenging assumptions and mental models
Develop strategies and test plans
Identifying risks and opportunities
Relevant to business and policy decision makers
?
To ask “what if” questions, not necessarily give answers
Not forecasts or predictions

CAUTIONARY NOTES – Risks ahead!
3
The companies in which Royal Dutch Shell plc directly and indirectly owns investments are separate entities. In this publication “Shell”, “Shell group” and “Royal Dutch Shell” are sometimes used for convenience where references are made to Royal Dutch Shell plc and its subsidiaries in general. Likewise, the words “we”, “us” and “our” are also used to refer to subsidiaries in general or to those who work for them. These expressions are also used where no useful purpose is served by identifying the particular company or companies. ‘‘Subsidiaries’’, “Shell subsidiaries” and “Shell companies” as used in this publication refer to companies in which Royal Dutch Shell either directly or indirectly has control, by having either a majority of the voting rights or the right to exercise a controlling influence. The companies in which Shell has significant influence but not control are referred to as “associated companies” or “associates” and companies in which Shell has joint control are referred to as “jointly controlled entities”. In this publication, associates and jointly controlled entities are also referred to as “equity-accounted investments”. The term “Shell interest” is used for convenience to indicate the direct and/or indirect (for example, through our 34% shareholding in Woodside Petroleum Ltd.) ownership interest held by Shell in a venture, partnership or company, after exclusion of all third-party interest.
This publication contains forward-looking statements concerning the financial condition, results of operations and/or businesses of Royal Dutch Shell. All statements other than statements of historical fact are, or may be deemed to be, forward-looking statements. Forward-looking statements are statements of future expectations that are based on management’s current expectations and assumptions and involve known and unknown risks and uncertainties that could cause actual results, performance or events to differ materially from those expressed or implied in these statements. Forward-looking statements include, among other things, statements concerning the potential exposure of Royal Dutch Shell to market risks and statements expressing management’s expectations, beliefs, estimates, forecasts, projections and assumptions. These forward-looking statements are identified by their use of terms and phrases such as ‘‘anticipate’’, ‘‘believe’’, ‘‘could’’, ‘‘estimate’’, ‘‘expect’’, ‘‘intend’’, ‘‘may’’, ‘‘plan’’, ‘‘objectives’’, ‘‘outlook’’, ‘‘probably’’, ‘‘project’’, ‘‘will’’, ‘‘seek’’, ‘‘target’’, ‘‘risks’’, ‘‘goals’’, ‘‘should’’ and similar terms and phrases. There are a number of factors that could affect the future operations of Royal Dutch Shell and could cause those results to differ materially from those expressed in the forward-looking statements included in this publication, including (without limitation): (a) price fluctuations in crude oil and natural gas; (b) changes in demand for the Group’s products; (c) currency fluctuations; (d) drilling and production results; (e) reserve estimates; (f) loss of market share and industry competition; (g) environmental and physical risks; (h) risks associated with the identification of suitable potential acquisition properties and targets, and successful negotiation and completion of such transactions; (i) the risk of doing business in developing countries and countries subject to international sanctions; (j) legislative, fiscal and regulatory developments including potential litigation and regulatory effects arising from re-categorisation of reserves; (k) economic and financial market conditions in various countries and regions; (l) political risks, including the risks of expropriation and renegotiation of the terms of contracts with governmental entities, delays or advancements in the approval of projects and delays in the reimbursement for shared costs; and (m) changes in trading conditions. All forward-looking statements contained in this publication are expressly qualified in their entirety by the cautionary statements contained or referred to in this section. Readers should not place undue reliance on forward-looking statements. Additional factors that may affect future results are contained in Royal Dutch Shell’s 20-F for the year ended December 31, 2011 (available at www.shell.com/investor and www.sec.gov ). These factors also should be considered by the reader. Each forward-looking statement speaks only as of the date of this presentation. Neither Royal Dutch Shell nor any of its subsidiaries undertake any obligation to publicly update or revise any forward-looking statement as a result of new information, future events or other information. In light of these risks, results could differ materially from those stated, implied or inferred from the forward-looking statements contained in this publication.

Signals & Signposts - A SNAPSHOT
4
We have entered an ‘era of volatile transitions’
Intensified economic cycles
following the end of the ‘great moderation’
Heightened political instability
New planetary boundaries
defined
Significant demographic transitions – urbanisation
New political consensus building
– a mini-lateral world

Changing demographics and economic landscape
4/2/2012 5
©University of Michigan
Step change in energy use by global rise in population and prosperity
Supply from conventional energy resources outstripped leading to stresses
Environmental stresses – CO2 and emerging tensions for water, food, land, etc
4/2/2012 6
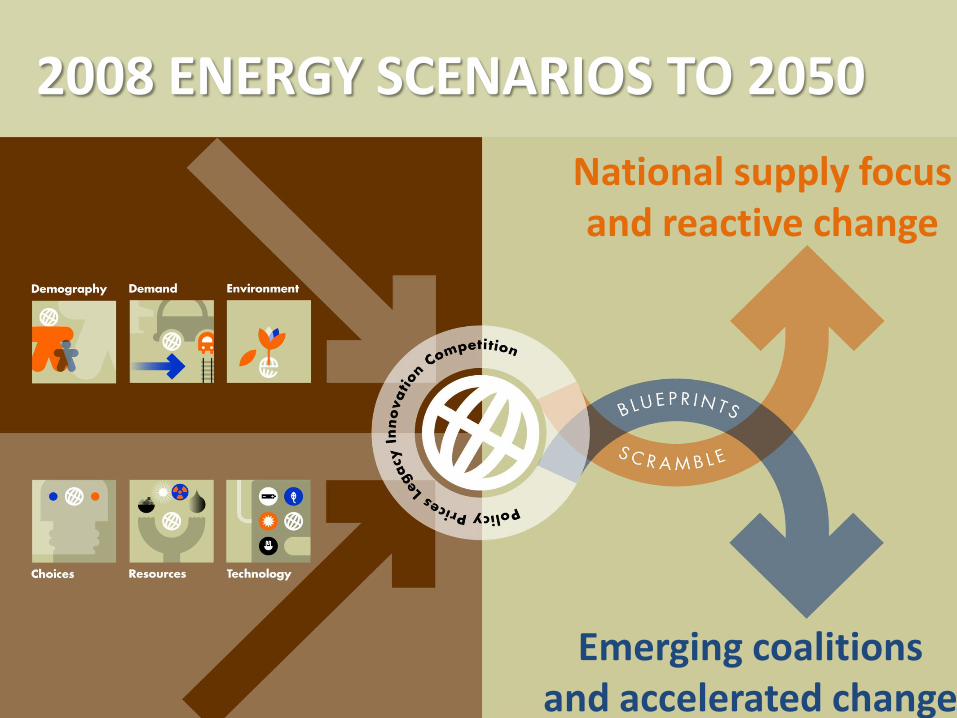
2008 ENERGY SCENARIOS TO 2050
National supply focus and reactive change
Emerging coalitions and accelerated change

HOW FAST CAN WE CHANGE?
7
Technologies take decades to mature and even more decades to reach full market share
Haigh/Kramer – Nature 462 (2009)

Key insights from Shell’s Energy Scenarios to 2050 The three hard truths that must be tackled together
Accelerating demand from emerging economies
Supply struggling to keep pace
Climate change stresses rising
Transformation in energy systems is inevitable Profound impact on mobility, buildings and electricity
generation
Technology plays an important role, but cannot do it alone – demand reduction and behaviour changes are also required
Political and regulatory choices are pivotal – short and long term measures are necessary
Blueprints approach offers more chance of a sustainable future…but more needs to be done ... 2o target will not be met
8


ENERGY GAMECHANGERS…?
Shift in consumption power from West to East
Pressures on oil production – Supply power shifting to OPEC? – Iraq oil uptake & arrangements – Higher cost options – LTO uptake
Natural gas, abundant and affordable – Unconventional gas in US (and
elsewhere?)
Shifting mix of primary energies – Efficiency affecting demand
especially in Transport – Substitution in Transport and
Electricity – Renewables – Nuclear post Japan?
10

ENERGY RELATED CO2 EMISSIONS
11
Non-OECD has overtaken OECD Political process too slow
Transparent CO2 price urgently needed
Abundant natural gas BLUEPRINTS: early CO2 saving as a
replacement fuel for coal in power generation
SCRAMBLE: Energy efficiency measures depressed
Nuclear slowdown will bring coal back Can renewables accelerate
further?
CO2 Pathways
Energy Related CO2 Emissions

ENVIRONMENTAL SCHISMS
An uneven road from Kyoto to Durban – continued divergence on
CO2 policy is politically unsustainable
Fallout from Macondo and Fukushima – a higher public awareness
of risk
New planetary boundaries work points to imminent systemic ecosystem stress – links to Water, Food and
Energy
12 Rockstrom, J et al. A Safe Operating Space for Humanity (Nature 46, September 2009)

FOOD – WATER – ENERGY
Climate Environment 13 Impact on land
used for biofuels
Energy intensity of food production
Impact of water use for energy production
Energy intensity of providing water
Water intensity of food production
Impact of agriculture on water quality
Population and GDP
growth and urbanisation

South Africa Outlook under current & anticipated policies and success in unconventional gas
Energy Mix Imports Electricity CO2 Water
This outlook is based on many assumptions and interpretations of possible future choices from
today’s perspective. Many uncertainties remain and many alternatives to this outlook are possible.
It should be seen as a starting point for discussion and Shell by no means advocates this outlook as
a preferred or inevitable one.
22/02/2012

Growing population and prosperity drives demand particularly in Industry, Transport & Service sectors Coal dominates the energy mix, but gas and renewables emerging
15
Source: History IEA, Outlook Shell FS/B
0
1
2
3
4
2000 2010 2020 2030
EJ /
yea
r (E
nerg
y ca
rrie
r)
South Africa - Total Final Consumption - Sectors
Industry Services
Passenger Transport Freight Transport
Residential Non Energy Use
FSB Energy - Shell WEM v2.4.15 – BBC12 – SAv5
0
2
4
6
8
10
2000 2010 2020 2030
EJ /
yea
r (E
nerg
y so
urce
)
South Africa - Total Primary Energy - Source
Oil Natural Gas Coal Nuclear Hydro Biofuels Biomass Commercial Waste Biomass Traditional Geothermal Solar Wind
Other Renewables

Domestic gas development can make a real difference
16
Source: History IEA, Outlook Shell FS/B
Oil consumption and net imports
Net imports Domestic production
Coal consumption and net exports
Natural Gas consumption and net imports
tcf /
yea
r
0.0
0.2
0.4
0.6
0.8
2000 2010 2020 2030
EJ /
yea
r
0
2
4
6
8
10
2000 2010 2020 2030
mill
ion
boe
/ da
y
0.0
0.2
0.4
0.6
0.8
2000 2010 2020 2030 Net imports Domestic production
Net exports Domestic production FSB Energy - Shell WEM v2.4.15 – BBC12 – SAv5
Dotted lines show without Unconventional Gas

Electricity demand grows strongly with industrialisation
17
Source: History IEA, Outlook Shell FS/B
0.0
0.4
0.8
1.2
2000 2010 2020 2030
EJ/y
r
Electricity Total Final Consumption by Sector
Industry Services
Passenger Transport Freight Transport
Residential
0.0
0.4
0.8
1.2
2000 2010 2020 2030
EJ/y
r
Electricity Total Final Consumption by Source
Oil Natural Gas Coal Nuclear
Hydro Biomass /Waste Solar Wind
FSB Energy - Shell WEM v2.4.15 – BBC12 – SAv5

Large PV resource base remains CO2 emissions and water use increasing, especially in Power sector
18
Note: SA renewable water resource base is approx 50 bln m3 variable over location
1
10
100
1,000
10,000
100,000
1,000,000
PJ /
yea
r
Demand vs Resource Renewables 2050
Used Remaining resource Total TFC
0
1
2
3
2000 2010 2020 2030
billi
on m
3/ye
ar
Fresh water consumption for energy
Fossils production
Biofuels production
Refining, GTL & CTL
Elec. & Heat - Gas
Elec. & Heat - Coal Elec. & Heat - Nuclear
FSB Energy - Shell WEM v2.4.15 – BBC12 – SAv5
0.0
0.2
0.4
0.6
2000 2010 2020 2030
Gt C
O2
/ ye
ar
CO2 Emissions from fossil energy by point of emission
Electricity Gaseous HC Fuels Liquid HC Fuels
Solid HC Fuels Residential
Freight Transport Passenger Transport
Services
Industry

Going from A to B
19
Local objectives
Global, regional and local political, social and economic macro
Local, regional and global options
Energy pathways cannot be seen in isolation
Engaging a broad constituency
Some good modelling helps
Vision 2030
Desired Future
Range of Possible Futures (Scenarios)
Forecasts
VISIONS, SCENARIOS, FORECASTS AND STRATEGIC PATHWAYS
Understanding the drivers, uncertainties, complexities, interrelations, options, risks and possible outcomes in a coherent way and over time

Q& A Views Discussion
