long-term persistence1 - booth school of...
TRANSCRIPT

Journal of the European Economic Association, forthcomingThis Version: September 2015
Long-term Persistence1
Luigi Guiso
Einaudi Institute for Economics and Finance & CEPR
Paola Sapienza
Northwestern University, NBER, & CEPR
Luigi Zingales
University of Chicago, NBER, & CEPR
Abstract We study whether a positive historical shock can generate long-term persistence in development. We show that Italian cities that achieved self-government in the Middle Ages have higher level of civic capital today than similar cities in the same area that did not. The size of this effect increases with the length of the period of independence and its intensity. This effect persists even after accounting for the fact that cities did not become independent randomly. We conjecture that the Middle-Age experience of self-government fostered self-efficacy beliefs - beliefs in one's own ability to complete tasks and reach goals – and this positive attitude, transmitted across generations, enhances civic capital today. Consistently, we find that fifth-graders in former free city-states exhibit stronger self-efficacy beliefs and that these beliefs are correlated with a higher level of civic capital.
JEL: O43, P16, O10 Keywords: civic capital, culture, persistence, institutions, self-efficacy, empowerment
1 We thank Francesco Giavazzi, Paola Giuliano, Eliana La Ferrara, Giuliano Milani, Guido Tabellini, Nicola Gennaioli, two anonymous referees and participants in seminars at Brown University, the University of Chicago, New York University, European University Institute, Stockholm University, the New Economic School and the NBER for very helpful comments. We are most grateful to Giuliano Milani for his advice and help in obtaining data and references on medieval history. We thank the Invalsi Institute for providing us with city-level data on cheating in school. Lorenzo Ciari, Marcello Sartarelli, Luca Riva and Riccardo Marchingiglio have provided excellent research assistance and Peggy Eppink and Janice Luce invaluable editorial help. Luigi Guiso thanks the European University Institute, Paola Sapienza the Zell Center, and Luigi Zingales the Center for Research in Security Prices (CRSP), the Stigler Center, and the Initiative on Global Markets at the University of Chicago for financial support.
1

There are primitive societies in which the level of biological well-being is even lower,
but in which people are not chronically unhappy. What makes the difference between
a low level of living and “la miseria” comes from culture. Unlike the primitive, the
peasant feels himself part of a larger society which he is “in” but not altogether
“of”.
Edward C. Banfield, “The Moral Basis of a Backward Society”
1958
1. Introduction
Although history holds examples of spectacular catch-ups, relative national levels of economic
development tend to be quite persistent over time. The per capita income of European countries at
the end of the twentieth century had a 0.56 correlation with their per capita income at the
beginning of the century. Even over the 300-year span from the eighteenth to the twenty-first
century the correlation is 0.23. 2 This correlation persists despite the massive destruction of
physical and human capital in Europe’s recurrent warfare. Why are these differences in economic
development so persistent?
In an influential paper, Acemoglu et al. (2001) attribute the phenomenon to the long-
lasting effect of formal institutions, such as protection of property rights and limitations on the
power of the executive. Ingrained into a country’s legal rules, these institutions tend to endure
over the centuries. Consistent with this view, they find that countries inhospitable to white men
still suffer of low property rights protection and excessive executive power because the European
colonizers, who did not intend to stay, designed legal institutions aimed at extracting rather than
creating value.
2 These results are obtained using Maddison (2001).
2

This influential explanation faces three objections. First, how can we differentiate the role
of legal institutions from that of the culture and the human capital that the colonizers brought to
the colonies (Glaeser et al., 2004)? Second, if persistence depends on legal institutions, why
should these be so persistent themselves? After all, they are designed to be changeable. Even
constitutions, the least flexible of legal institutions, are often changed: Argentina, which has had
four different constitutions in the last 60 years, is a case in point. Finally, can we completely
reject the hypothesis that persistence depends on geographical factors?3
An alternative interpretation, going back to Putnam et al. (1993), attributes the
persistence of economic development to culture. Williamson (2000) claims that culture is the
most persistent of all institutions and, unlike legal institutions, has no explicit mechanisms for
amendment. Yet even Williamson (2000) is not clear about why and when culture is so persistent.
Putnam (2000) himself documents an example of the rapid deterioration of social capital in
America. Does culture persist only when it is optimal, or does it tend to outlive its usefulness and
the environment that generated it?
To address these questions we revisit Putnam’s hypothesis. He conjectures that
differences in performance among the Italian regions are due to persistent differences in civic
capital originating from the free city-states (Communes) experience during the late Middle Ages.
To study the persistence of culture, Putnam’s conjecture has several advantages. First, it traces the
origin to an historical period whose formal institutions have long disappeared, facilitating the
identification of the cultural effect. Second, his distinction is not just North-South. While free-
cities were concentrated in the Center-North (henceforth North), they did not include all cities in
3 Acemoglu et al. (2001) discuss this challenge and argue that the diseases that were once a serious problem
(yellow fever and malaria) no longer represent a major source of comparative disadvantage today. Still,
other geographical factors impeding economic development could be at the origin of this persistence.
3

this area.4 Thus, we can exploit regional variation within the North to test Putnam’s hypothesis.
Finally, it considers a temporal span of several centuries, during which a different culture could
have formed and taken hold.
We start by comparing current levels of civic capital in different cities within Northern
Italy. Following Putnam et al. (1993), our first measure of civic capital is the number of non-
profit organizations per capita. We complement this with two new measures. As we observe in
Guiso, Sapienza, and Zingales (2011), for an outcome-based measure to qualify as a good gauge
of civic capital, the relationship between the input (civic capital) and the output measure should
be stable and unaffected by other factors, such as legal enforcement. One such output is donation
of blood or organs. Thus, as a second measure of civic capital we use the existence of an organ
donation organization. Finally, in the spirit of Fisman and Miguel (2007), we use the frequency of
cheating in a national exam done by children in each town.
Consistent with Putnam’s conjecture, we find that Northern cities that experienced a
period of independence in the Middle Ages have significantly higher levels of civic capital today
as measured by all three indicators. For example, the number of voluntary associations is 25%
higher in cities that were once free city-states. These results are robust to area dummy variables
and to other geographical controls, such as closeness to the sea or elevation. Furthermore, they
are robust to excluding larger cities, province capitals, or controlling for income levels and for
inequality in the distribution of land.
Not only does civic capital increase with the historical occurrence of a free-city state, but
also with the length and the intensity of the experience. One standard deviation increase in the
length of independence increases the number of non-profit associations by 2.5%, raises the
4 In this paper we use a customary definition of Center-North: all the regions North of Lazio, including
Lazio. In this definition the South coincides with the territory ruled by the Normans at the beginning of the
second millennium. This customary definition is still in usage today.
4

probability of having an organ donation organization by 4.5%, and lowers cheating in math by
2.75%. The free city-state degree of autonomy also mattered. Some cities were independent, but
under the protection of the emperor; others were so independent to fight and win against the
emperor. We find that former free-cities that in 1158 participated in a league to fight the Emperor
(the Lombard League) today exhibit more civic capital than free-cities that at the time chose to
remain neutral, which in turn exhibit more civic capital than cities that chose to be allied with the
emperor.
Our results are consistent with the idea that a distant, important historical experience can
affect individual behavior many years later. Because the institutions set up by the free-cities are
long gone, this persistence cannot be due to any formal institution. Yet, there could be some
geographical characteristics not controlled for that are correlated both to the emergence of free
city states in the Middle Ages and to higher level of civic capital today.
To assess this possibility, we investigate the factors that facilitated the creation of free
city states. Historians (among others, Reynolds, 1997; Milani, 2005; Jones, 1997; Tabacco, 1987;
Pirenne, 1956) claim that the presence of a bishop in town fostered the formation of a free city-
state. This effect, however, can only be present in the North. At the beginning of the second
millennium, the South of Italy was more developed and prosperous than the North (see De Long
and Shleifer, 1993), yet free city-states could not develop there because of the strong central
power exerted by the Normans (Putnam, 1993). Consistently, we find that the presence of a
bishop is correlated with higher civic capital in the North but not in the South. We also find that
this correlation does not exist among Northern cities that became bishop seats after 1400.
While these findings do not completely rule out the geography hypothesis, they provide
further evidence that civic capital is correlated with a pre-existent condition that facilitated
independence only when this condition actually led to the transformative experience of the free
city-state.
5

Having identified this robust correlation, we try to explain how such an historically
remote experience can leave a legacy after over 500 years. As the epigraph suggests,
Banfield (1958) attributes the typical attitude of Southern Italians to a feeling of lack of
empowerment (la miseria) or -- as modern psychology labels it – lack of self-efficacy, the
belief a person holds regarding his or her power to affect positively situations (Bandura, 1977;
1997). Can a positive or negative historical experience affect an entire population’s sense of
empowerment? Can such an attitude be handed down for generations and generations? Is this
diffuse sense of helplessness related to civic capital, as Banfield’s evidence seems to suggest?
To build this connection we extend Bandura’s theory of self-efficacy from the
realm of individual experiences to that of collective ones, i.e. historical shock. Psychologists
(e.g. Maddux, 2009) perceive the development of self-efficacy beliefs as the result of direct
and vicarious individual experience. We extend this idea to collective historical experience.
We measure self-efficacy attitude with the way people explain to themselves why they
experience a particular event, either positive or negative (Abrahamson, Seligman and Teasdale,
1978). As research in psychology shows (Seligman et al., 1984; Dweck et al., 1978), this
attitude is transmitted through education and socialization. Thus we can measure the cultural
transmission of an historical event by looking at differences in self-efficacy of young children
in similar geographical areas that have had different histories. Because children self-efficacy
is mostly the reflection of their parents’ and teachers’ influence, it is particularly useful to
isolate the culturally transmitted component of self-efficacy.
We find that eighth-graders in Northern cities that did have the free city-state
historical experience display a higher degree of self-efficacy than their peers living in
Northern cities that were not communes.
In the logical chain between past historical shocks and today’s civic capital, the
remaining missing link is the relation between self-efficacy beliefs and civic capital. Team effort
is intrinsically subject to a problem of attribution (Alchian and Demsetz, 1972). Individuals
6

with stronger self-efficacy beliefs expect their own effort to have higher chances of paying off
(both directly and indirectly) increasing their willingness to contribute. Hence, cooperative
behavior is more likely to occur among people with a higher self-efficacy, whereas societies in
which lack of self-efficacy is pervasive will tend to have lower levels of civic capital.
We use our data to test this hypothesis and we find that towns exhibiting a higher self-
efficacy measure have also higher civic capital. Overall, these correlations are consistent with the
free city states experience fostering the formation of a different culture, which persisted to these
days and still affects the level of civic capital.
There is a growing literature on the persistence of cultural attitudes over long periods of
time both theoretical (Bisin and Verdier, 2000; 2001; Guiso et al., 2008) and empirical.5 Nunn
and Wanchekon (2011), for instance, show the long-term persistence of the effects of the slave
trade on Africa’s level of trust today. Similarly, Voigtländer and Voth (2012) document a very
strong correlation between the level of German anti-Semitism in 1350 and its level in the 1920s
and 1930s. Other works demonstrate how cultures functional to a given technology may survive
many centuries after that technology’s disappearance. Grosjean (2011), for instance, studies a
culture of violence functional to a pastoral society; Alesina et al. (2013) examine the diffusion of
the plow in agriculture (which gave a comparative advantage to men over women in some
geographical areas).
All these papers present evidence of a negative shock, which persisted through centuries.
By contrast, we provide evidence of a positive lasting shock, which provides some hints on how
civic capital can be enhanced. We also highlight and test a possible mechanism which may
generate this persistence.
5 There is also a growing literature on cultural persistence over shorter periods of time; see Algan and
Cahuc (2010), Giuliano (2007), Guiso, Sapienza and Zingales (2006), Fernandez et al. (2004), Fisman and
Miguel (2007), and Tabellini (2008).
7

Our paper is also related to the parallel literature that studies which current cultural traits
affect economic outcomes (see Guiso, Sapienza and Zingales, 2006 for a review). Tabellini
(2010) and Gorodnichenko and Roland (2014) stress the importance of individualism for
promoting private innovation and growth. Our paper shows that shared beliefs of individual self-
determination can promote civic engagement and cooperation.
The rest of the paper proceeds as follows. Section 2 provides a brief primer on Italian
medieval history. Section 3 describes the data. Section 4 analyses of the effect of the free city-
state experience within the North. Section 5 shows the robustness of our results to
endogenizing the emergence of free-city states. Section 6 extends Bandura (1995) self-
efficacy theory to an entire society to provide the logical connection between political
independence and civic capital. Section 7 concludes.
2. A primer in Italian medieval history
2.1 The rise of free city-states
At the end of the first millennium the North Italian regions were part of the Holy Roman
Empire, which was on the way to disintegration. Between 1061 and 1091 the Normans invaded
the Southern part of Italy and formed a strong state, which guaranteed order and stability. By
contrast, in the North the vacuum created by the demise of the imperial authority led to the
emergence of a number of independent city-states.6
The first nucleus in the emergence of these city-states was the establishment of a “sworn
pact” (patto giurato) in which a town’s inhabitants agreed to provide mutual help and collaborate
to solve problems of common interest (Prodi, 1992). In some cases these pacts were enforced by
6 Within the North the only region in which free cities did not develop is Lazio where the Papal influence
prevented independence.
8

the threat of exclusion from trade (Milani, 2005), a very costly punishment at a time when trade
opportunities were very profitable.
The pre-eminent common interest was defense against the Emperor’s claim to exert
power over the city. This battle culminated in 1176 when a league of free-cities (communes) in
the North of Italy, the Lombard League, defeated Emperor Fredrick I in the Battle of Legnano.
Unlike the Norman kingdom, located in the South of Italy, the communes made their
rules, laws, and formal decisions in the name of the people, because political power was said to
derive from the people, not from some religious authority or divine right. While the medieval
communes should not be equated with modern democracies, they did introduce many aspects of
the system that today goes under the name of “rule of law”. For example, government officials’
actions were subjected to the control of new institutions, including courts of law to which citizens
could appeal (Galizia, 1951).
2.2. From the Commune to the Signoria: evolution of the Italian city-states
In the course of the fifteenth century, Italian communes began to confer life-long power
on a single person – the Lord or Signore, hence the name Signoria. In several cases the Signoria
retained the fundamental institutions of the commune, including the principle that power
originated from the people and was to be exercised in the people’s name. In cities such as
Florence and Genoa, the Signoria also preserved the political institutions and the personal
liberties that had characterized the commune period. In this sense the Signoria was a continuation
and transformation of the commune (as is maintained by Prezzolini, 1948 and Chittolini, 1999).
2.3 Civic capital and the free city-state experience
The term “social capital” has been used to indicate several often quite divergent concepts.
Following Putnam et al. (1993) and Fukuyama (1995), we focus on “those persistent and shared
9

beliefs and values that help a group overcome the free rider problem in the pursuit of socially
valuable activities” (Guiso, Sapienza and Zingales, 2011) and label it “civic capital”.
If, as conjectured by Putnam, the regional differences in civic capital are due to the free
city-state experience, then civic capital today should be higher in cities that were free cities in the
Middle Ages. Furthermore, this difference should be more pronounced the longer the
independence of the city lasted.
3. The Data
In this section we describe how we collected the data. A synthetic description of each variable is
contained in Table 1, while the Online Appendix contains a more detailed description of the
sources and methodologies used. In total, our sample contains 5,372 cities located in the North.
For a small part of the analysis we will compare the North and the South. Our sample of Southern
cities contains 2,175 observations.
3.1 Identifying the communes
As observed above, free cities could emerge only in the parts of Italy that were under the
Empire at the beginning of the second millennium (see Figure A1 in the Online Appendix). We
focus on this area, which comprises twelve of Italy’s present-day regions.7
Historians appear to agree that a commune, properly so called, needs to meet four
criteria: it should have consuls as part of its institutions; it should have its own institutions to
administer justice; it should have some military power and military activity; and finally, it should
7Piedmont, Valle D’Aosta, Liguria, Lombardy, Trentino, Veneto, Friuli-Venezia Giulia, Emilia-Romagna,
Tuscany, Umbria, Marche, and Lazio. Since Sardinia was neither part of the Holy Roman Empire, nor
under Norman domination, we have excluded it from the sample altogether. We also excluded Rome, given
its truly unique history, as an exceptional case.
10

have its own rural territory (the contado) to administer (Milani, 2005). As far as we know, there is
no comprehensive history of Italian communes. Thus, verifying these conditions in all the Italian
cities existing today during three centuries is extremely difficult.
We chose instead to start from the sample of free cities identified by a prominent
historical atlas (De Agostini, 2007). To validate this source we also consulted several additional
historical sources (see Online Appendix) to verify that the towns identified as communes by the
Atlas met the four historical criteria. This check did not eliminate any of the city states in the map.
This methodology may underestimate the number of free cities, biasing against finding any effect.
Using several historical sources we also constructed a measure of duration of independence and
an indicator for whether or not a Commune evolved into a Signoria (see the Online Appendix for
more details).
Since the status of independence changes over time, we chose to focus on two historical
moments: the first, 1176, is when the Northern communes organized into the Lombard League
defeated Emperor Frederick I (see Figure A1 in the Online Appendix); the second is 1300 CE,
when the free city-state movement was at its height before the emergence of the Signoria (Figure
A2). Our first definition of free cities includes all the cities that were independent in 1176. Our
second definition includes cities that were listed as independent at least one time according to the
historical documents, either in 1176 or in 1300.
As we can see, communes were spread all over the North, but the phenomenon was more
intense in certain regions (Tuscany and Emilia) than in others (such as Lazio or Marche). One
controversial case is Venice. While clearly independent, Venice is not classified as a commune
because it was an oligarchy, with a different set of institutions. To be consistent with our criterion,
we classified Venice as a “non-city-state”, but our results are robust to treating it as a commune
(unreported regressions).
3.2. Measures of Civic Capital
11

Putnam et al. (1993) takes the presence of non-profit associations as the main indicator of civic
capital. We follow suit and, as first measure, we use a town’s total number of non-profit
associations in 2000. Since this information comes from the 2001 census, it has the great
advantage of counting all non-profit organizations (excluding Church-based voluntary
organizations). 8 On average, there are 6.4 non-profit associations per thousand people in the
North (Table 2, Panel A) and 3.5 in the South (Table 2, Panel G).
As we noted in Guiso et al. (2011), for an outcome-based measure to qualify as a reliable
indicator of civic capital, the relationship between the input (civic capital) and the measured
output should be stable and not affected by other factors, such as legal enforcement. These
conditions are not generally found, but there are some particular situations in which they are
likely to be met.
One such instance is donation of blood or organs. Since there is no economic payoff to
either type of donation and no legal obligation to donate, the decision to donate can be seen as a
direct measure of individuals’ internalization of the common good. Donating organs and/or blood
provides insurance to others, with no direct compensation for the person providing it. Guiso,
Sapienza and Zingales (2004) uses blood donation data at the provincial level. But at town level
these data are subject to some problems. First, in some regions (e.g., Tuscany) there are several
voluntary organizations of blood donors, which do not keep the same quality records as Italy’s
principal donors’ organization, Associazione Volontari Italiani Sangue (AVIS). Their activity is
negligible at the provincial level, but not at the municipal level, particularly in smaller towns
where they compete with AVIS. Second, people may donate blood where they work and not
necessarily where they live, which clouds the town-level measure. Accordingly, we have replaced
this measure with an indicator for the existence in the town of an organ donation association
8 This feature is particularly important in smaller towns where, given fixed costs of establishment, only
certain types of organization might be present.
12

(AIDO, 2014). This measure has the same virtue as blood donation but is less subject to errors
since in Italy there is only one organ donation association, Associazione Italiana Donatori Organi
(AIDO). The Online Appendix provides additional details on how these variables are constructed
and their sources. There is an organ donor association in 4.4% of Italian North municipalities and
4.2% in the South.
Another example of a legitimate outcome-based measure of civic capital is Fisman and
Miguel’s (2007) number of parking violations by United Nations officials in Manhattan. Until
2002, diplomatic immunity protected U.N. diplomats from enforcement, so only cultural norms
prevented them from parking illegally. Building on this idea, we use the pervasiveness of
cheating on a national math test. Since 2008 Italian eighth-graders have taken a national
standardized test in reading and math conducted by Istituto Nazionale per la Valutazione del
Sistema educativo di Istruzione e formazione (INVALSI). The test is administered to more than
half a million students in 6,000 schools in 3,400 cities. The data released by INVALSI include a
measure of cheating: the estimated probability that an observed score is due to cheating.9 We
average the 2008-2009 INVALSI measure at the city level and divide it by its standard deviation
to obtain a standardized measure of cheating. On average this measure in the Northern cities is
2.1.10
3.3 Other historical variables and city controls
We have also gathered a number of additional historical variables that we use as controls in our
regressions. First, we use data from Bairoch et al. (1988) for city size. Since population data for
9 This estimate is based on the concentration of similar wrong answers in a class in the presence of very low
variation across answers and very high average scores. The actual method used is a fuzzy c-means
clustering (Dunn 1973; Bezdek 1981). For details see INVALSI (2014).
10 We focus on the level of cheating in math because on average it is higher, but the results we obtain using
cheating in reading tests are similar.
13

1000 CE are very scarce, we use those for 1300 CE – earliest data available for a large enough
number of towns.
Other important historical characteristics are whether a town was located at a Roman
crossroad. Roman roads are identified from the Touring Club Historical Atlas of Italy and the
“Reference Map of Ancient Italy”. We then map ancient cities into today location by using
Google Maps. We use the Treccani (2007) to identify the cities with a bishop seat. We use the
same source to identify the presence of a marquis. At the time of Charlemagne the North of Italy
was divided into marches, so the survival of strong marches represents the persistence of imperial
power.
Finally, all the other variables (including the average elevation, other geographic
controls, population, per capita income and per capita wealth) are from Ancitel (2003), a database
assembled by the association of municipal administrations, which reports over 320 variables at
municipal level for the period 2003-04.
3.4 Self-efficacy Measures
As part of the 2008-2009 INVALSI national test, eighth graders also filled a survey
which elicited pupils’ attitudes in interpreting positive and negative events. The questionnaire
asks students to interpret eight different situations, five positive events (successes) and three
negative (failures). All these situations relate to tasks that the students perform at school. The
wording of all the questions is given in the Online Appendix. In Section 6 we show in detail
how we use these answers to construct a measure of self-efficacy at the individual and city level.
Table 2 shows summary statistics for all our variables. Table A1 in the Online Appendix
presents summary statistics for commune and non-commune cities and tests of differences in
means.
14

4. Empirical analysis
4.1 Basic specification
Our first measure of civic capital is the number of non-profit organizations divided by the 2001
population (Table 3, Panel A). In column I, we regress this measure on a simple indicator of
whether a town was a free city in 1176 and several demographic and geographical controls. To
control for mountain location we insert the average elevation. To control for geographically-
driven differences in the cost of interaction, we insert the maximum elevation difference within
the municipality’s territory. We also control for coastal location (i.e. on the coast of within five
kilometers of the sea). Finally, as a measure of size, we control for the number of inhabitants
(millions of people) in 2001. Since we are unsure how population affects civic capital, we insert
both population and population squared. Since the measures of civic capital tend to be noisier for
smaller towns, we use the weighted least squared method, weighted by the population in 2001.
The impact of the free city-state experience is large and statistically significant at the 1%
level. Towns that were communes have two more associations per thousand inhabitants (30%
more than the average). Though this estimate is obtained using only variation within the North, its
magnitude is half of the difference in civic capital between North and South.
Another known determinant of civic capital (Alesina and La Ferrara, 2002) is income
inequality. For this reason, column II adds two Gini measures of inequality: in land ownership
and in pre-tax income. These additions run the risk of over-controlling, since inequality could be
an effect rather than a cause of persistently low civic capital. Surprisingly, greater income
inequality correlates with more civic capital, as measured by the number of non-profit
associations per capita, but this effect is due to the lack of a control for per capita income. When
we introduce this control (column V) the effect vanishes. Regardless, the impact of once having
been a commune remains unchanged.
15

While we control for population and population squared, it is still possible that our
estimated effect may only reflect some non-linearity between city size and civic capital. For this
reason, in column III we exclude from the sample the largest towns (more than 120,000
inhabitants in 2001). The effect of the free city-state experience remains unchanged.
Two thirds of the medieval city-states are provincial capitals today. This administrative
role could confer a different status on the city, possibly affecting the level of civic capital. For
example, associations might find it convenient to be located near the local administration. For this
reason, in column IV we exclude all provincial capitals from the regression. The effect of the
commune experience is undiminished.
Glaeser et al. (2002) show that individual investment in social interaction increases with
per capita income. Since towns that became independent in the Middle Ages were likely to be
richer, the free city-state experience might be a proxy for unobserved characteristics that make for
prosperity.11 To address this issue we would like to be able to factor in per capita income in 1100
CE. Unfortunately, no such measure is available, so we have to resort to today’s per capita
income. This specification will clearly underestimate the impact of the free city-state experience
because, as Knack and Keefer (1997) show, civic capital itself fosters growth, so that the greater
civic capital generated by the city-state experience translates into higher per capita income.
As column V shows, wealthier towns do in fact display a higher level of civic capital, so,
as expected, the insertion of this variable reduces the impact of the free city-state experience on
today’s level of civic capital. The effect of the communal experience, however, remains positive
and economically and statistically significant. In addition, in an unreported regression we control
also for a city-level measure of human capital: the average math score of local pupils. Since Italy
11 Of course the fact that some very wealthy towns in the South, such as Salerno and Palermo, even richer
than Northern towns, did not become free cities suggests that what was driving independence was not
linked to unobserved economic prosperity.
16

has a national curriculum, this score reflects the average quality of local schools and teachers and
thus the average level of human capital in the area. This control does not have any effect on our
first two measures of civic capital. It does have an effect on the third, reducing the coefficient and
reducing the statistical significance just above the 10% level (p=10.6). Yet, this is hardly
surprising, since in places where scores are naturally high it is more difficult to detect cheating.
Finally, in column VI we add four area dummies (Northeast, Northwest, Center-North,
and Center) to capture possible unobserved heterogeneity in civic capital across regions. These
dummies (not reported) are all statistically significant, but inserting them does not change the
impact of the free city-state experience on civic capital. Results are invariant to using much finer
geographical controls (11 regional dummies out of the 12 regions in the North), instead of the
three areas dummies (Online Appendix, Table A2, Panel D).
In the first three columns of Table 3, Panel B, we repeat the estimation using our second
measure of civic capital, the presence of an organ donation association. Again the effect of the
city-state experience is positive and statistically significant in all the specifications. Having been
an independent city-state increases the probability of having an organ donation association by
41%.
In the last three columns of Table 3, Panel B, we estimate the same specification by
using our measure of cheating as left hand side variable. Here the effect is negative and
statistically significant in all specifications. Having been a free city-state decreases our
standardized measure of cheating by 13% of the mean.
The concentration of free city-states among the larger cities suggests the possibility that
our sample is too heterogeneous and that even controlling for population size and population size
squared, the coefficient of our explanatory variable might be a spurious effect. Accordingly, we
select the 400 largest cities. To minimize possible survivorship bias we select them according to
the earliest Census data available (immediately after national unification in 1861). Table 4, Panel
A, shows the results using this smaller sample. The first three columns of Table 4, Panel A show
17
the results using the controls in the specification in the second column of Table 3, Panel A (the
other specifications are reported in the Online Appendix – Table A2, Panel A). The effect is
roughly halved when the sample is restricted to these cities, but it still remains both quantitatively
meaningful and statistically significant.12
The advantage of this reduced sample is the availability of more sophisticated controls for
the towns’ history: a dummy for having belonged to a marquis (which might have retarded the
formation of a free-city state); a dummy of whether the city was located on a relevant Roman
road, or at the intersection of Roman roads; and two dummies for medium and large size in 1300.
When we introduce these controls, the effect of the free city-state variable on all three measures
of civic capital is unchanged (columns IV, V, and VI of Table 4, Panel A report the estimated
coefficients of the main explanatory variables and the above-mentioned additional controls; for
detailed estimation results see columns IV, V and VI of Table A2, Panel A in the Online
Appendix).
As an additional robustness test (Table 4, Panel B), we report the main specification for
each measure of civic capital estimated by Ordinary rather than Weighted Least Squares. The
results are substantially the same, except that the city-state experience is not statistically
significant for the civic capital measure based on cheating. This difference in significance is
probably due to the large amount of noise in this measure (especially for small towns). Table A2,
Panel B of the Online Appendix reports the estimated coefficients for all the control variables
included in the analyses.
12 In another robustness exercise we restrict the whole sample to cities with current population above the
90th percentile. Results are invariant (Online Appendix, Table A2, Panel E). The same is true if we further
exclude cities with more than 300,000 people (Table A2, Panel F), except for the third measure of civic
capital.
18

In Table 4, Panel C, we check the robustness of the result to the definition of the set of
free cities using our second definition of free city-states. The results are substantially unchanged
(for the complete list of estimated results, see Table A2, Panel C of the Online Appendix).
In Table 4 Panel D, we look at the earliest measure of civic capital at the city level we
could find: the level of participation to the Resistance against the Nazi-Fascist at the end of World
War II. While we do not have any official statistics, the towns that distinguished themselves for
heroism during this period were awarded a Medal of Honor (the exact name in Italian is
“Medaglia d’Oro alla Resistenza” or Resistance Gold Medal). In the North, 20 towns received
this award. When we regress the probability of receiving the medal on the free city-state dummy,
we find that this has a positive and statistically significant effect, even after controlling for our
standard set of variables.
Finally, we find that results extend to a traditional measure of civic capital - participation
in referenda. Because this information is only available for the largest 400 cities we do not
include it in the main analysis but report it in the Online Appendix (Table A2, Panel G).
4.2 More detailed history
Thus far, we have treated all the free city-state experiences as similar. For a number of
reasons, however, this approach is inadequate. First, the length of the period of independence
varied considerably. Second, the towns’ history after the end of the city-state differed: some were
dominated by neighboring towns; others were transformed from commune into Signoria, a
political structure that retained the fundamental characteristics of the commune, including the
principle that power originated from the people and was to be exercised in people’s name. Finally,
the quality and degree of autonomy of the free institutions were very different from place to place.
In this section, we explore whether these variations in the quality and length of independence
affect the various municipalities’ civic capital many centuries later.
19

Table 5 starts by analyzing the effect of the duration of independence (Panel A). This
measure is very noisy, insofar as the exact date of independence is often a matter of judgment.
Since many of the factors that determined the formation of the city-states also determined the
duration of independence, in order to isolate the effect of the latter we use a two-step Heckman
estimator.13
The first column shows the results of the estimates when the measure of civic capital is
the number of non-profit organizations. The duration of independence has a positive and
statistically significant effect on the number of non-profit organizations. However, the effect is
small: starting with 206 years of independence (the sample mean) and increasing it by one
standard deviation (about additional 100 years) raises the number of non-profit organizations by
2.3% of the average among the formerly independent cities. Given that this measure is quite noisy,
it is possible that our estimates are biased downwards and are actually a lower bound of the true
effect.
The second column uses organ donation as a measure of civic capital. The length of
independence has a positive and statistically significant effect on the probability of having an
organ donation: 100 years more of independence raises the probability by 4.5 percentage points.
The duration of independence also predicts the probability that students will cheat (third
column): 100 year more of independence decreases the probability of cheating by 2.75% of the
sample mean.
In Panel B we study the effect of having become a Signoria after being a free commune.
The cities that did not evolve into a Signoria were more likely to lose their independence to
13 As we shall explain in section 5, the local presence of a bishop helped to overcome the initial
coordination problem (and thus the transformation into a free city-state). Thus, assuming that the bishop
presence affects only the probability of becoming a free city-state and its ability to remain independent, we
use it as our identifying restriction.
20
another commune or Signoria, which entailed the demolition of the local communal institutions
and the abrogation of many of the associated rights. We expect that communes that did not evolve
into a Signoria show lower levels of civic capital.
Having experienced a period of Signoria adds to the level of civic capital (column I). Ex-
Signoria towns have 1.2 more associations per thousand inhabitants than other former free city-
states, practically doubling the effect of the latter. The same holds when civic capital is measured
by organ donation (column II), but we do not find a significant impact on cheating in the math
test (column III).
In Panel C the variable considered is the degree of independence, notoriously hard to
measure. As a proxy we use the side that a city took in the struggle against Emperor Frederick I in
the middle of the twelfth century. In 1158 Frederick claimed direct Imperial control over Italy.
Twenty-four cities in the North formed the Lombard League to challenge him. We take a city’s
active participation in the Lombard League as an indicator of the strength of that city’s
independence. This comparison is especially meaningful when is done with other free city-states
located in the North that chose to ally with the Emperor. Finally, twenty-five city-states (mostly
located towards the center of Italy and thus somewhat more sheltered from the Imperial threat)
chose to remain neutral. Panel C decomposes the free city-states in these three groups.
When we measure civic capital as number of non-profit organizations (column I), the
positive effect of the free city is strongest for Lombard League towns, second for neutral towns,
third for Imperial allies. When using organ donations as LHS variable the pattern is similar
(column II). In fact, the effect of cities that were part of the Lombard League is 28% larger than
that of neutral city-states and almost twice as large as that of the Emperor’s allied states. However,
when we measure civic capital with cheating (column III) the largest effect in absolute value is
produced by the neutral cities.
21
5. Why Only Some Cities Became Free States?
5.1 The origin of free city-states
Our geographical controls mitigate the concern that we are capturing a spurious
correlation between the free city experience and civic capital. Yet, it is still possible that the
emergence of a free city-state, since it is not random, is correlated with some characteristics
(other than cultural) that persist to this day and sustain a greater level of civic capital.
To address this concern we resort to the historians’ analysis of the origins of free city-
states. Since the strong central power exerted by the Norman Kingdom in the South did not allow
the formation of free cities, we can design a counterfactual. If the observed correlation is driven
by geographical or historical characteristics that favored both the formation of free city states and
the accumulation of civic capital, then these characteristics should have the same correlation with
civic capital in the South, where free city-states could not emerge. Vice versa, if it is the specific
free city-state experience to drive the correlation, then these factors should not be correlated with
civic capital in the South, where this experience did not occur.
As explained in Section 2.1, the first nucleus of most communes was a sworn pact among
prominent citizens. When present, the city bishop was often acting as guarantor of this pact. His
presence, thus, added an enforcement mechanism otherwise not available: the threat of exclusion
from religious communion (Tabacco, 1987). Hence, the presence of a bishop in a town should
decrease coordination costs and facilitate the formation of a free-city.14 In the Online Appendix
14 Belloc et al (2014) argue that earthquakes strengthen the power of bishops regarding the formation of
free cities. They study the effect of exogenous changes in religiosity within bishop-seat cities, while we
study the between variation of cities with bishop seat and cities without. Thus, the two results are not in
contradiction. Furthermore, it is not obvious that their effect does not transit through the fact that
earthquakes can have on self-efficacy and thus on civic participation.
22

(Table A4) we document that indeed towns that were a bishop seat by year 1000 were more likely
to become a free city state.
The first three columns of Table 6, Panel A, present the correlation between the bishop-
seat variable (ease of coordination) and civic capital in the North. Not surprisingly, the presence
of a bishop has a positive and significant correlation with the level of civic capital, measured by
our three proxies.
To verify that this effect is not spurious, we replicate the same regression specification
with the sample of Southern cities (last three columns of Table 6, Panel A). If bishop seats were
chosen in the same way in the North and in the South and the correlation between civic capital
and bishop seat were spurious, then we should find the same correlation with civic capital also in
the Southern sample. By contrast, we find that being a bishop seat has an insignificant correlation
with the presence of non-profit organizations and with frequency of children’s cheating on a
national math test, while it has a positive correlation, albeit smaller than in the North sample, with
the presence of an organ donor association.
In other words, when historical conditions prevent the formation of free city-states, being
a bishop seat is not associated with higher levels of civic capital, as measured by two of the three
proxies. This result suggests that the correlations observed in Tables 3 to 5 are not driven by the
presence of the bishop itself, but by the role played by bishops in reducing coordination costs in
the formation of free city-states.
This test is valid only if bishop-seat cities have the same characteristics in the North and
the South. To address this concern and provide one further, less objectionable, validity check
against the presence of spurious correlation, we study the correlation between Northern dioceses
created after the period in which the free city-state experience took place (i.e., towns that were
assigned a bishop seat after 1400) and civic capital. Sixty-three cities in the North became
dioceses after 1400. As Table 6, Panel B shows, the assignment of a bishop seat after 1400 has a
23

negative and significant correlation with civic capital, measured by the presence of non-profit
organization. This result rules out that the presence of a bishop, in itself, is conducive to greater
civic capital. Columns II and III of Table 6, Panel B show that there is no correlation with
dioceses formed after 1400 and the presence of organ donor associations and the frequency of
cheating in math tests.
All this evidence suggests that, while the free city-state is not a random occurrence, the
initial characteristics that facilitated independence are linked to higher civic capital only through
the transformative city-state experience. In other regions in Italy, where the same initial
conditions existed but could not deliver free city-states, or in subsequent periods where the initial
conditions could not spur independence, we do not find a positive correlation with civic capital.
Having singled out an important historical determinant of the emergence of a free city-
state we can use it as an instrument. Table 6, Panel C reports the IV estimates (first stage
estimates are in the Online Appendix, Table A4). They confirm previous conclusions and
strengthen the economic effect of having been a Commune on today’s measures of civic capital.
As usual, there is a concern about the validity of the instrument’s exclusion restriction: i.e.
that the presence of a bishop has an impact on civic capital only through its effect on the
probability a city will become independent, and not directly. Our analysis on the effect of bishop
seats in the South and of bishop seats created after 1400 suggests this is not a valid concern.
Another possible objection is that the presence of a bishop is simply a proxy for being an
important city in 1100 and the variable bishop seat is capturing this effect and not ease of
coordination in forming a commune. Again, the evidence in the South seems to suggest that this
is not the case, since in the South cities that were important in 1100 (and thus had a bishop seat)
do not exhibit higher civic capital today.
6. Transmission Mechanism
24

Besides all the econometric analysis, it is difficult to interpret a correlation without a theory. How
can an historical experience permanently affect a community’s civic capital? Putnam’s conjecture
was that the formation of free city states fostered civic engagement. Yet, how did this pattern of
civic engagement survive all those years, centuries after the free city states’ legal institutions
disappear? One hypothesis is that informal institutions created during the free city state
experience – like artisans’ guilds and associations – survived the disappearance of free-city states
and kept the civic engagement spirit alive. Indeed, some of these associations are still present in
several cities, albeit they are only historical fictions, emptied of any economic and political
significance.
Another hypothesis, more in line with Banfield (1958), is that an historical experience
affected the attitude of the local population and this attitude survived to this day. Yet, to explain
the observed correlation we have to identify which is this attitude, how did it survive over
centuries, and how it is related to today’s civic capital.
6.1 Self-efficacy as a Cultural Trait
In describing the attitudes prevailing in the Italian South (la miseria), Banfield (1958)
talks about the helpless feeling of the typical peasant (see the initial quote).15 Banfield refers to
15 Banfield gives the Montegranesi (the inhabitants of the small town in Southern Italy he analyzes) a
Thematic Appreciation Test. The TAT shows subjects a series of 20 pictures and asks them to make up
stories about these pictures in the spur of the moment. 64% of the stories told by the Montegranesi end in
calamity or misfortunes versus only 24% of respondents from Northern Italy and 16% of respondents from
rural Kansas. Banfield attributes both the economic backwardness and the lack of civil engagement of
Montegrano (and the Italian South) to the fatalistic and pessimistic attitudes of its inhabitants: “in such a
fearful world a parent cannot count on achieving anything by his own effort and enterprise … The idea that
one’s welfare depends crucially upon conditions beyond one’s control -- upon luck or the caprice of a saint
– and that one can at best only improve upon good fortune, not create it - this idea must certainly be a
25

what modern psychologists label self-efficacy, which Bandura (1995) defines as "the belief in
one’s capabilities to organize and execute the courses of action required to manage prospective
situations."
The relation between individual experience and self-efficacy is well understood in
psychology. Starting with infancy and continuing throughout life, self-efficacy beliefs develop
as a result of direct and vicarious experience and verbal persuasion (Maddux, 2009). Some
psychologists have also recognized that there may be a relationship between collective
experiences (such as an oppressive dictatorship) and individual attitudes (Oettingen and
Seligman, 1990). We extend this idea to a positive experience that can affect self-efficacy. In
addition, we raise the possibility that this effect is made persistent by the combination of
intergenerational transmission and socialization, strengthened by the self-fulfilling nature of
these beliefs.
Educational transmissions of these beliefs has been shown by Dweck et al. (1978), who
document that that young students’ attributions about their classroom performance are correlated
with their teachers’ attributions about performance. Similarly, Seligman et al. (1984) compared
the attributional styles of mothers with those of their children and found that attribution for
negative events was correlated at 0.39.
Intergenerational transmission and education can be strengthened and amplified by social
transmission. If an entire town is affected by the same shock, all its inhabitants will transmit the
same beliefs to their children. Not only will children be raised with a different attributional style,
they will be socialized into it as well.
check on the initiative. Its influence on economic life is obvious: one who lives in so capricious a world is
not likely to save and invest in the expectation of ultimate gain. In politics too, it must have an effect. Where
everything depends upon luck or Divine intervention, there is no point in community action. The community,
like the individual, may hope or pray, but it is not likely to take its destiny into its own hands.” (Banfield,
1958: p. 112 and p. 114).
26

Finally, self-efficacy also has a self-fulfilling dimension. Weak self-efficacy beliefs
prevent people from trying, making failure all but certain. Thus, weak self-efficacy beliefs will
lead to less cooperation and worse institutions, which will further exacerbate the sense of
impotence in the face of negative events. This vicious circle from weak self-efficacy beliefs to
backwardness to even weaker self-efficacy beliefs is precisely what Banfield (1958) calls “la
miseria.”
Not only these beliefs are taught (voluntarily or involuntarily) from parents to children
and they are learned through socialization, they also become embedded into the local traditions
and culture. The memory of a victorious battle, repeated in the oral and written tradition,
cultivates a sense of self-efficacy among the inhabitants of those cities who participated. This
tradition is so strong that today in Italy there is a political party that derives its name and symbol
from the Lombard League that defeated the Emperor in 1176.
Trace of these different beliefs between the North and the South can be found also in the
Italian literature. Compare the two major Italian novels of the nineteenth century: “The
Betrothed”, written by a Northerner (Alessandro Manzoni), and “I Malavoglia”, written by a
Southerner (Giovanni Verga). While both novels center on the role of Divine Providence in
coping with the struggle of life, the view they transmit is completely different. In “The Betrothed”
the main characters feel empowered and thus persist in their effort and are eventually able, albeit
with the help of God, to overcome their adversities. In “I Malavoglia”, the main characters not
only fail miserably but they are also blamed for trying to improve their human condition. The two
novels differ in their degree of optimism about the human condition as well as in the level of self-
reliance. In the Northern “The Betrothed”, there is a sense of self-efficacy, in the Southern “I
Malavoglia” a sense of self-defeat.
6.2 Measuring self-efficacy
27

A way to formalize these ideas in economic terms is by mapping self-efficacy into the
perceived connection between effort and success. Assume an individual can choose how much
costly effort to exert in an activity. With low effort, the probability of success is 𝑝𝑝(𝐿𝐿) ≤ 12
; with
higher level of effort the probability is 𝑝𝑝(𝐻𝐻) > 12. In this framework, we can define self-efficacy
as the difference 𝑝𝑝(𝐻𝐻) − 𝑝𝑝(𝐿𝐿) , i.e. the difference between the subjective beliefs of success if
effort is high versus when it is low.
If effort costs are randomly distributed in the population, ceteris paribus people with high
self-efficacy (a high (𝐻𝐻) − 𝑝𝑝(𝐿𝐿) ) are more likely to exert effort. As a consequence, ex post,
people with high self-efficacy are more likely to attribute success to effort and failure to bad lack
(as 𝑝𝑝(𝐻𝐻) > 12). By contrast, people with low self-efficacy exert little effort and will attribute
success to luck and failure to lack of effort. Therefore, a person’s self-efficacy can be inferred
from how they rationalize success and failure.
Luckily, the INVALSI questionnaire provides a convenient source of data to measure the
way children rationalize success and failure. A typical question in the domain of failures is “Your
teacher asks to do a project for Christmas. Your performance is so bad that you have to do the
assignment over. How do you explain this?” The possible explanations from which the student
has to choose are: “a” No one helped me; “b” I was unlucky; “c” It was difficult; “d” I lack
ability; “e” I did not put effort on it. A corresponding question in the success domain is: “Your
teacher has asked to make a drawing. You do it very well. How did you do? The possible answers
are: “a” I received help; “b” I was lucky; “c” it was easy; “d” I am clever; “e” I put effort.
We can interpret answers “a”, “b” and “c” as attributing success and failures to luck;
while answer “e” to effort. Hence, our measure of self-efficacy in the domain of successes
(SEsuccess) is given by the number of answers of type “e” for questions in the success domain and
self-efficacy in the domain of failures (SEfailure) by the number of answers of type “a”, “b” or “c”
for questions in the failure domain. Because there are five questions in the domain of success and
28

three in the domain of failures, to compute the overall self-efficacy score we weight the two
measures appropriately. Thus, our overall measure of self-efficacy is S = 0.6×SEsuccess +0.4×
SEfailure .
We first compute the self-efficacy score for each of the 275,186 students in our sample
and then collapse the score at the city level, obtaining an average self-efficacy measure for each
of the cities covered by the INVALSI test.16 Table 2, panel H shows summary statistics of the
overall score for the Northern and Southern cities. Table A5 and Figure A3 in the Online
Appendix report the distribution of the scores for the individuals in the sample and for the
collapsed data.
6.3 The Free City State Experience and Today Self-Efficacy
Now that we have a city-level measure of self-efficacy, we can test whether former free
city-states exhibit a higher level of self-efficacy than similar towns that did not face this
experience. Table 7, first column presents the results of this test in the Northern Italy sample, by
employing the same specifications used in Table 3 for civic capital.
We find that in former free cities eighth-grade students exhibit stronger self-
efficacy; that is, they are more likely to ascribe success to their own effort and to attribute
failures to causes that are external to them and over which they have no control. This result is
unchanged if we control (unreported) for several demographic characteristics of pupils’ parents.
In magnitude, the difference is large. The free-city dummy increases self-efficacy by 13% of its
standard deviation.
16 We also compute an alternative measure by first running a regression of the individual measure of self-
efficacy on a set of family controls and individual students characteristics and then averaging out across
cities.
29

The second column of Table 7 presents the regression for the whole sample including
cities in the South. Since the free city variable is meaningless in the South, we replace it with a
South dummy as a way of validating our measure of self-efficacy. Consistent with the idea that a
past long history of self-determination in the North has endowed individuals with stronger self-
efficacy beliefs, we find that on average Northern pupils exhibit higher levels of self-efficacy than
Southern ones. The difference is as much as 45% of the cross sectional standard deviation.
6.4 Self-Efficacy and Civic Capital
To establish the plausibility of our mechanism, we need to explain why self-efficacy
beliefs could lead to higher civic capital and to show empirically that indeed cities with a more
self-empowering attitude have higher levels of civic capital today.
If self-efficacy is a measure of an individual’s perception of the impact of his effort,
people with stronger self-efficacy beliefs should contribute more to the public good because they
think that their impact is greater. Psychology research seems to support this prediction. For
example, De Cremer and Van Vugt (1998) find that stronger perceptions of self-efficacy are
related with higher levels of contributions to a public good game. Therefore, in communities with
above average self-efficacy, the level of civic behavior should be higher.
While we cannot test causality, we can at least test whether there is a correlation between
self-efficacy beliefs and today’s civic capital. This is what we do in Table 8. The first two
columns use the number of non-profit associations as a measure of civic capital. Our measure of
self-efficacy is positively and significantly correlated with the level of civic capital. This result
holds whether self-efficacy is the only explanatory variable or it is inserted with the controls used
in Table 3. A one standard deviation increase in self-efficacy is associated to an increase in the
number of non-profit associations per inhabitant by 0.3, or 5% of the sample mean.
The same is true for the second measure of civic capital: the presence of an organ
donation organization. A one standard deviation increase in self-efficacy increases the probability
30

of having an organ-donation organization by 10 percentage points, more than double the sample
mean. Finally, self-efficacy has a negative effect on cheating in math. A one standard deviation
increase in self-efficacy decreases the measure of cheating by half of percentage points of its
sample mean.
In sum, our conjecture seems to hold. The positive historical experience of cooperation
represented by the free city-state period is associated with higher levels of self-efficacy today,
which in turn are associated with higher levels of civic capital.
7. Conclusion
Acemoglu and Robinson (2012) claim that shocks to institutions can affect outcomes over
prolonged periods of time. Yet, they do not distinguish whether this impact is the direct effect of
formal institutions’ persistence or the indirect effect produced by institutional shocks on people’s
psyche and culture. In other terms is culture or are formal institutions the source of long term
persistence? In this paper we try to disentangle the two by looking at an institutional change
whose formal institutions are long gone. We find that Italian towns that during the Middle Ages
were free city-states exhibit higher levels of civic capital today. The duration and degree of
independence of the historical free city-states also affect today’s civic capital positively.
Having identified a long term persistence that cannot be attributed to institutional
survival, we try to uncover the mechanism that generates this persistence. Based on Banfield
(1958), we conjecture that the sense of self-efficacy is the cultural trait fostered by the free city-
state experience. After all, Putnam (2000) and Ostrom (1990) claim that direct participation to
public life (like in the commune) empowers individuals by boosting their sense of self-efficacy.
This attitude is then transmitted through informal education inside the family, formal education,
and socialization.
31
Consistent with this conjecture, we find that pupils of free city-states exhibit a higher
self-efficacy score than pupils of similar towns within the North of Italy who did not share the
same historical experience. Similarly, pupils in Northern cities exhibit a higher self-efficacy score
than pupils in the Southern ones.
While far from definitive, this evidence opens an interesting area of research: linking a
nation’s psyche to important historical events. An event affects the attitudes of its contemporaries
and these attitudes shape a culture, which is transmitted throughout the centuries via education
and socialization. Future research will have to determine the extent and the importance of this
new channel in explaining the success of nations around the world. At the moment we can only
say that it seemed to have played a role in Italy.
32

Table 1. Variables description
The table provides a summary description of the variables. Details on the definitions and sources are available in the online Appendix.
Variable name Description Source Number of non-profit organizations Total number of non-profit organizations (sum of voluntary associations, social
cooperatives and foundations, excluding church based organizations) in the city scaled by population in the city.
ISTAT (National Statistical Institute), 2001 census
Presence of an organ donation organization
Indicator of existence of an organ donation organization in the city http://www.aido.it/
Cheating in math Mean index of cheating in the city standardized with its standard deviation. Based on the city-level indicator of cheating in math computed by INVALSI (a government agency for the evaluation of public schools) for the 2009 INVALSI test among the population of grade 8 Italian students.
INVALSI (2014), 2009 grade 8 test
Commune (free city-state) Indicator variable equal to 1 if the town was a commune based on two maps (see Online
Appendix, Figures A1 and A2). The first reports the list of communes, around the time of the war between the communal cities and Emperor Frederick I (year 1167), the second around year 1300, at the pick of the communal experience.
De Agostini (2007)
Length of independence Difference between the year independence was lost and the year it was first acquired. Treccani (1949); when not available, we relied on the Touring Club Italiano (2000) and the historical summary on the official web page of the various cities.
Signoria Identifier = 1if a commune became a Signoria. Treccani (1949). City belonged to the Lombard League
Identifier = 1 for a commune that belonged to the Lombard League; see Figure A1 De Agostini (2007)
City allied to the Emperor Identifier = 1 for a commune that was allied to the Emperor Frederick I; see Figure A1 De Agostini (2007) Ease of coordination Indicator = 1 when the city was a seat of a Bishop before 1000 C.E.
Treccani (2007), Volume I, maps n. 152, 153, 154, 155
New seat of a Bishop after 1400 C.E.
This variable is equal to 1 if a city has become a bishop city after year 1400, roughly after the end of the communal experience.
Identified from the full list of the Italian Bishop cities as listed in the following link http://it.wikipedia.org/wiki/Elenco_delle_diocesi_italiane
Size of city in year 1300 C.E. Indicators for city size around year 1300; Large is a dummy equal to 1 if the city population exceeds 10,000 people; Medium is a dummy variable equal to 1 if the city population is between 1,000 and 10,000 people.
Bairoch, Batou and Chevre (1988, pp. 40-49)
City located at an intersection of Roman roads
Indicator equal to 1 if the city is located on a relevant Roman road or at the intersection between two or more Roman roads.
Authors calculations. Roman roads are identified from the Touring Club Italiano (1994). Current location of Roman cities is obtained comparing today location of the city using Google Maps with the map of the Roman cities.
City belonged to a marches Indicator =1 if city was part of a marches –Center- North Italy regional organization at the time of Charlemagne.
Treccani (2007)
Medal of honor Indicator = 1 if the city has been awarded a gold medal for the heroism of its population in ANPI,Resistenzaitaliana.it,
33

fighting against the Nazi-Fascists in the 1943-1945 period. http://www.storiaxxisecolo.it/documenti/documenti12.html
City on the coast City on the coast of within five kilometers of the sea Ancitel (2003). City elevation Measured in meters from the sea level. Ancitel (2003). Max difference in elevation Difference between the altitude of highest and lowest point in the city territory, in meters. Ancitel (2003). Current Population Number of inhabitants in the city according to the 2001 census Ancitel (2003). Gross per capita disposable income Disposable income per capita: euros in year 2000. Ancitel (2003). Gini income inequality index Computed using data on the pre-tax income distribution in year 2000 based on information
from the 2001 census Ancitel (2003).
Gini land ownership inequality index
Computed using data on the size distribution of agricultural firms in year 2000 based on information from the 2001 census.
Ancitel (2003).
.
34

Table 2. Summary Statistics
The table shows summary statistics for the variables used in the estimation. For the definitions of these variables see Table 1
Panel A. Civic capital measures (Center-North sample; N = 5,372) Mean Median Standard
deviation 1st percentile
99th
percentile Number of non-profit organizations (per 1,000 people) 6.39 4.82 14.15 1.30 26.60 City has an organ donation association? (Yes = 1) 0.044 0 0.20 0 1 Cheating in math 2.05 1.22 7.50 0.36 11.47 Medal of honor 0.0036 0 0.06 0 1 Self-efficacy 2.53 2.53 0.24 2 3.13
Panel B. Historical variables (Center-North sample; N = 5,372) Mean Median Standard
deviation 1st
percentile 99th
percentile Commune at time of war against Frederick I (1167 C.E.) 0.012 0 0.11 0 1 Commune: combined definition 0.014 0 0.12 0 1 City was an independent Signoria 0.011 0 0.105 0 1 Year independence was acquired (only for communes) 1,130 1,150 62 950 1,300 Year independence was lost (only for communes) 1,327 1,315 79 1,216 1,650 Length of independence (# of years – only for communes) 196 175 100 47 488 Log length of independence (only for communes) 0.73 0 1.81 0 5.91 Free cities belonged to the Lombard League (only for communes) 0.34 0 0.48 0 1 Free cities allied to the Emperor Frederick I (only for communes) 0.22 0 0.42 0 1
Panel C. City geography (Center-North sample; N = 5,372)
Mean Median Standard deviation
1st percentile
99th percentile
Elevation (thousand meters) 0.34 0.27 0.30 0.003 1.36 Max difference in elevation within city territory (thousand 0.66 0.34 0.72 0.004 2.74
35

meters) Province capital (indicator) 0.012 0 0.11 0 1 City located on the coast 0.03 0 0.18 0 1 Population after unification in 1871 (in millions) 0.002 0.003 0.009 0.0003 0.026 Current Population 2001 (in millions)
0.0062 0.0023 0.027 0.00013 0.061
Panel D. Economic Variables (Center-North sample; N = 5,372) Mean Median Standard
deviation 1st
percentile 99th
percentile Disposable income per capita (‘000 euros) 13.26 13.24 2.30 8.05 18.95 Gini land ownership inequality index 0.56 0.58 0.18 0.12 0.94 Gini income inequality index 0.38 0.38 0.04 0.30 0.50 Panel E. Historical variables that predict Commune (Center-North sample; N = 5,372) Mean Median Standard
deviation 1st percentile 99th percentile
Ease of coordination 0.033 0 0.18 0 1 City population above 10,000 in 1300 C.E.? (Yes = 1) 0.006 0 0.08 0 0 City population btw 1,000 and 10,000 in 1300 C.E.? (Yes = 1) 0.004 0 0.06 0 0 New seat of a Bishop after 1400 C.E. (Yes = 1) 0.006 0 0.08 0 0 Panel F. Summary statistics for the sample of largest Center-North 400 cities at unifications (N = 400) Mean Median Standard
deviation 1st percentile
99th percentile
Number of non-profit organizations (per 1,000 people) 5.58 4.29 11.86 0.95 22.3 City has an organ donation association? (Yes = 1) 0.04 0 0.20 0 1 Cheating in math 2.34 1.22 9.00 0.37 21.2 Free city 0.15 0 0.35 0 1 Elevation (thousands of meters) 0.35 0.29 0.30 0.004 2.63 Max difference in elevation within city territory
36

(thousands of meters) City located on the coast 0.08 0.00 0.27 0 1 City located at intersection of Roman roads 0.108 0.00 0.31 0 1 Current Population 2001 (million people) 0.007 0.002 0.028 0.00014 0.068 Gini land ownership inequality index 0.60 0.60 0.17 0.15 0.94 Gini income inequality index 0.38 0.37 0.04 0.28 0.49 City belonged to a marches 0.21 0.00 0.09 0 1 City population above 10,000 in 1300 C.E.? (Yes = 1) 0.006 0.00 0.076 0 0 City population between 1,000 and 10,000 people in 1300 C.E.? (Yes=1)
0.006 0.00 0.08 0 0
Panel G. The South sample (N = 2,175) Mean Median Standard
deviation 1st
percentile 99th
percentile Number of non-profit organizations (per 1,000 people) 3.49 3.08 2.02 0.64 10.38 City has organ donation association? (Yes = 1) 0.042 0.00 0.20 0.00 1.0 Cheating in math 2.58 1.14 10.87 0.43 24.16 Elevation 0.40 0.39 0.28 0.004 1.17 Max difference in elevation within city territory 0.70 0.62 0.51 0.013 2.29 Ease of coordination 0.07 0.00 0.25 0.00 1 City population above 10K in 1300 C.E.? (Yes = 1) 0.006 0.00 0.08 0.00 0 City population btw 1,000 and 10,000 in 1300 C.E.? (Yes = 1) 0.019 0.00 0.14 0.00 1 City is on the coast 0.177 0.00 0.38 0.00 1 Current population 2001 (million people) 0.008 0.003 0.03 0.00 0.08 Gini income inequality index 0.366 0.369 0.04 0.27 0.45 Gini inequality index of land ownership 0.635 0.635 0.15 0.24 0.94 Panel H. Self-Efficacy in the Whole Sample (City Level, N = 3,155) Mean Median Standard
deviation 1st
percentile 99th
percentile Self-Efficacy 2.49 2.49 0.24 1.88 3.08 Self-Efficacy (Positive Domain) Self-Efficacy (Negative Domain)
2.74 0.84
2.74 0.84
0.32 0.23
1.91 0.29
3.51 1.39
37

Panel H1. Self-Efficacy in the North Sample (City Level, N = 1,804) Mean Median Standard
deviation 1st
percentile 99th
percentile Self-Efficacy 2.53 2.53 0.24 2 3.13 Self-Efficacy (Positive Domain) Self-Efficacy (Negative Domain)
2.78 0.86
2.78 0.86
0.29 0.21
2 0.35
3.42 1.39
Panel H2. Self-Efficacy in the South Sample (City Level, N = 1,351) Mean Median Standard
deviation 1st
percentile 99th
percentile Self-Efficacy 2.42 2.4 0.24 1.8 3.02 Self-Efficacy (Positive Domain) Self-Efficacy (Negative Domain)
2.69 0.81
2.67 0.8
0.36 0.24
1.83 0.25
3.6 1.38
38

Table 3. Effect of communal history on civic capital
The table shows OLS estimates of the effect of having been an independent city on measures of civic capital in the sample of all Italian cities in the Center-North.
In Panel A the left hand side variable is the number of non-profit organizations per inhabitant in the city; in Panel B it is an indicator of cheating in math among the
grade 8 students in the city; in Panel C it is a dummy for the existence of an organ donation organization (AIDO) in the city. Regressions are weighted using city
population. Regressions are run on the whole sample of cities located in the Center-North of Italy. ***significant at less than 1%; ** significant at 5%; * significant
at 10%. Robust standard errors are reported in parentheses.
Panel A: Number of non-profit organizations
I Whole sample
II Whole sample
III No large towns
IV No provincial
capitals
V Whole sample
VI Whole sample
Commune 2.04*** 1.84*** 1.77*** 1.86*** 1.53*** 1.84*** (0.34) (0.33) (0.37) (0.42) (0.28) (0.26)
Elevation 1.94*** 1.97*** 1.65*** 1.64*** 2.36*** 3.21*** (0.51) (0.50) (0.51) (0.55) (0.45) (0.54) Max difference in elevation 1.43*** 1.39*** 1.54*** 1.51*** 1.35*** 1.19*** (0.24) (0.24) (0.21) (0.24) (0.22) (0.23) City is on the coast 0.34 0.25 0.35 0.69*** 0.61** 0.60** (0.33) (0.31) (0.24) (0.23) (0.24) (0.27) City more than 5km from the coast 0.96 1.08* 1.22** 1.34** 1.50** 0.97 (0.63) (0.64) (0.62) (0.61) (0.62) (0.64) Current Population 2001 -3.49 -4.22* -59.86*** -63.42*** -6.93*** -4.10** (2.73) (2.47) (9.85) (8.25) (1.84) (1.88) Current Population squared 1.43 1.41 622.40*** 441.95*** 3.11** 1.73 (2.05) (1.83) (110.56) (90.54) (1.37) (1.39) Gini inequality index of Land ownership
0.65 0.34 0.23 1.22** -0.01
(0.55) (0.38) (0.33) (0.48) (0.46) Gini income inequality index 10.02*** 9.61*** 7.63*** 0.56 9.58*** (2.22) (1.75) (1.50) (2.24) (1.91) Income per capita 0.35*** (0.04)
39

Area dummies NO NO NO NO NO YES R-squared 0.08 0.08 0.09 0.08 0.10 0.10 Observations 5,360 5,360 5,341 5,298 5,360 5,360
Panel B: Existence of organ donation organization and Cheating in math
Existence of organ donation organization Cheating in math (I)
Whole sample (II)
Whole sample (III)
Whole sample (IV)
Whole sample (V)
Whole sample (VI)
Whole sample Commune 0.41*** 0.37*** 0.39*** -0.23*** -0.19** -0.30***
(0.06) (0.06) (0.06) (0.085) (0.10) (0.10) Elevation -0.28*** -0.23*** -0.25*** 0.97** 0.90** 1.33** (0.07) (0.07) (0.08) (0.453) (0.45) (0.60) Max difference in elevation 0.03 0.03 0.03 0.22 0.23 0.20 (0.03) (0.03) (0.03) (0.148) (0.15) (0.16) City is on the coast 0.04 0.09 0.04 -0.09 -0.16 -0.05 (0.06) (0.05) (0.06) (0.133) (0.15) (0.18) City more than 5km from the coast 0.05 0.10 0.05 -0.16 -0.24 -0.16 (0.07) (0.07) (0.07) (0.217) (0.24) (0.23) Current Population 1.60*** 1.26*** 1.65*** -2.66*** -2.24*** -2.38*** (0.46) (0.40) (0.44) (0.715) (0.63) (0.72) Current Population squared -1.25*** -1.03*** -1.26*** 2.48*** 2.20*** 2.41*** (0.34) (0.30) (0.33) (0.620) (0.54) (0.59) Gini inequality index of land own. 0.20* 0.27*** 0.15 -0.15 -0.27 -0.48 (0.10) (0.09) (0.10) (0.451) (0.41) (0.47) Gini income inequality index 2.48*** 1.27*** 2.51*** -9.80*** -8.02*** -9.59*** (0.42) (0.34) (0.42) (2.52) (1.82) (2.47) Income per capita 0.04*** -0.06 (0.01) (0.04) Areas dummies NO NO YES NO NO YES R-squared 0.53 0.56 0.53 0.02 0.02 0.02 Observations 5,372 5,372 5,372 1,890 1,890 1,890
40

Table 4: Robustness
Panel A reports regressions of the effects of free cities on civic capital on the sample of the largest 400 cities in the Center-North of Italy (as of 1871) using standard controls (first three
columns) and expanding the set of historical controls (remaining columns); Panel B shows non-weighted OLS estimates of the effect of having been an independent city on measures of civic
capital today. Panel C shows the estimates on the total sample of Center-North cities for a Commune identifier obtained as the union of the free cities in 1167 C.E. and in 1300 C.E. Panel C
shows the estimates using as a historical measure of civic capital: an indicator =1 if the city has been awarded a honor medal during the resistance war against Fascism. “Standard controls” are
those used in Table 3A, second column. Robust standard errors are reported in parentheses. *** significant at less than 1%; ** significant at 5%; * significant at 10%.
A. Sample of 400 largest northern cities
(I) Non-profit org.
(II) Organ donation org.
(III) Cheating in math
(IV) Non-profit org
(V) Organ donation org.
(VI) Cheating in math
Commune 1.10** 0.13** -0.21*** 1.17*** 0.12** -0.15*** (0.33) (0.06) (0.05) (0.390) (0.060) (0.055)
At cross with Roman roads 0.68** -0.03 0.08 (0.322) (0.05) (0.05) City belongs to a marquis 1.17*** 0.09* 0.03 (0.301) (0.05) (0.06) City size in 1300: medium 0.40 0.16 -0.15** (0.450) (0.103) (0.06) City size in 1300: large 0.18 0.02 -0.08** (0.358) (0.05) (0.04) STANDARD CONTROLS YES YES YES YES YES YES Observations 400 400 379 400 400 379 R-squared 0.27 0.25 0.21 0.37 0.26 0.22
B. OLS non-weighted regressions (I)
Non-profit organizations
(II) Organ donation
organization
(III) Cheating in math
Commune 2.91** 0.31*** 0.01 (0.44) (0.07) (0.20)
STANDARD CONTROLS YES YES YES (2.30) (0.01) (0.99) Observations 5,360 5,538 1,912 R-squared 0.04 0.30 0.01
41

C. Alternative definition of commune (combined definition)
(I) Non-profit
organizations
(II) Organ donation
organization
(III) Cheating in math
Commune: combined definition 2.18*** 0.45*** -0.31*** (0.27) (0.06) (0.08)
STANDARD CONTROLS YES YES YES Observations 5,360 5,372 1,890 R-squared 0.09 0.55 0.02
D. Historical measure of civic capital: medal of honor to the city
(I) Whole Center-North sample
(II) Whole Center-North Sample,
No province capitals
(III) Sample 400 largest northern
cities Commune 0.24*** 0.16** 0.22*** (0.075) (0.083) (0.075) STANDARD CONTROLS YES YES YES Observations 5,372 5,310 403 R-squared 0.724 0.167 0.724
42

Table 5: Digging deeper into history
Panel A shows the second stage results of a two-step Heckman estimates of the effect of the length of independence of free cities on civic capital today. The first stage uses an
indicator for whether the city was the seat of a bishop to achieve identification. The Mill’s ratio is obtained from the first-step probit regression. In Panel B we insert an indicator
variable for whether the city evolved into an independent Signoria as an additional regressor. In Panel C we decompose the commune indicator variable depending on whether the
commune was “neutral,” “allied with the Emperor” or “belonging to the Lombard League” in the war for independence against Emperor Frederick I. Regressions are run on the
sample of all cities located in the Center-North. All regressions include the standard controls of Table 3, Panel A, second column. For brevity they are not reported. The regressions
with all controls are reported in Appendix, Table A3, Panel A, B and C respectively. Robust standard errors are reported in parentheses. *** significant at less than 1%; **
significant at 5%; * significant at 10%.
Panel A. Effect of the length of independence on civic capital
(I) Non-profit organiz.
(II) Organ donation organiz.
(III) Cheating in math
Log of length of independence 0.23** 0.09*** -0.11*** (0.09) (0.02) (0.03) STANDARD CONTROLS YES YES YES (1.57) (0.35) (0.53) Mill’s ratio -0.89*** 0.01 0.12 (0.29) (0 .07) (0.10) F-test for the exclusion restriction in selection equation 99.8 100.8 95.7 Observations 5,353 5,519 5,519
Panel B: The role of Signoria
(I) Non-profit organiz.
(II) Organ donation organiz.
(III) Cheating in math
Commune 1.48*** 0.36*** -0.19** (0.32) (0.07) (0.08)
Signoria 1.21*** 0.14** 0.01 (0.31) (0.07) (0.11) STANDARD CONTROLS YES YES YES Observations 5,344 5,538 1,911 R-squared 0.09 0.54 0.02
43
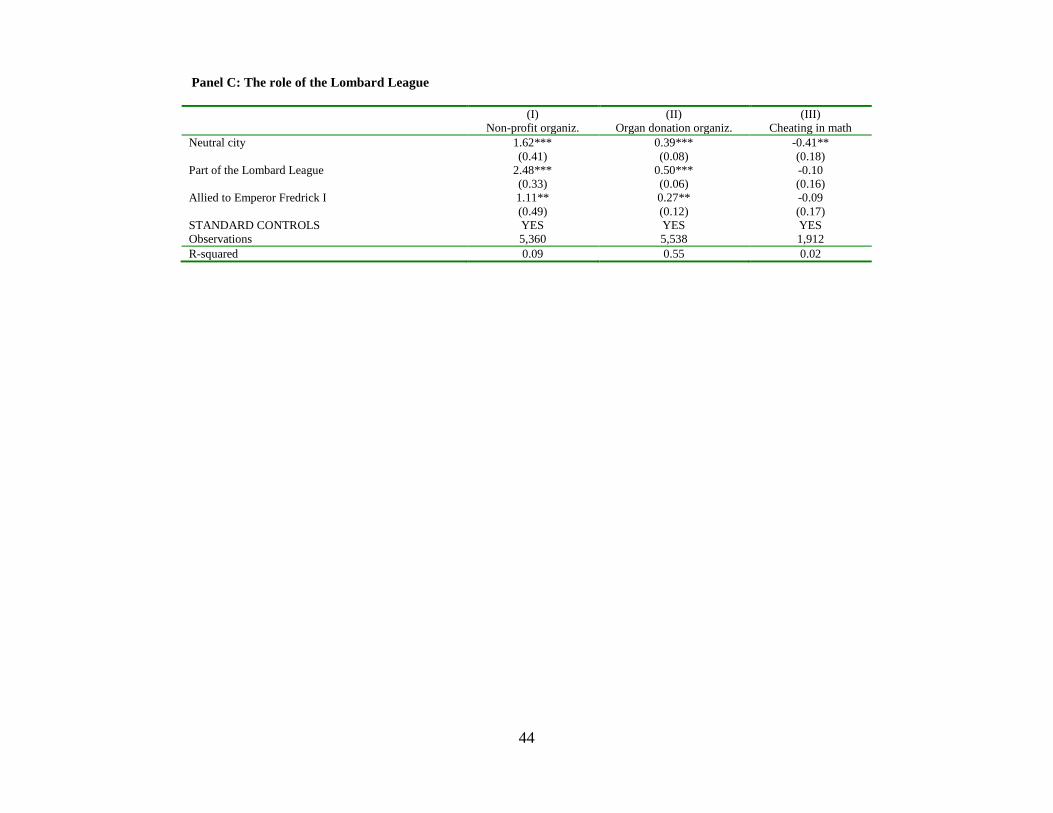
Panel C: The role of the Lombard League
(I) Non-profit organiz.
(II) Organ donation organiz.
(III) Cheating in math
Neutral city 1.62*** 0.39*** -0.41** (0.41) (0.08) (0.18) Part of the Lombard League 2.48*** 0.50*** -0.10 (0.33) (0.06) (0.16) Allied to Emperor Fredrick I 1.11** 0.27** -0.09 (0.49) (0.12) (0.17) STANDARD CONTROLS YES YES YES Observations 5,360 5,538 1,912 R-squared 0.09 0.55 0.02
44

Table 6: Validating the instrument
Panel A shows regressions of civic capital in the Center-North (first three columns) and in the South (last four columns) controlling for a proxy for ease of coordination (cities with a bishop seat at the
time of the communes); Panel B reports estimates of civic capital in the Center-North sample controlling for cities that became seat of a bishop after 1400 C.E. Post medieval bishop city is equal to 1 if a
bishop city was created after 1400 C.E. and zero otherwise. Panel C shows IV estimates when the instrument for civic capital is ease of coordination. Robust standard errors in parentheses. ***
significant at less than 1%; ** significant at 5%; * significant at 10%.
A. Regressions of civic capital in the Center-North and in the South
Center-North sample South sample (I) (II) (III) (IV) (V) (VI)
Non-profit org. Organ donation org.
Cheating in math Non-profit org. Organ donation org.
Cheating in math
Ease of coordination 1.61** 0.47*** -0.62*** 0.18 0.19*** -0.04 (0.219) (0.047) (0.097) (0.137) (0.065) (0.309) Elevation 1.93*** -0.25*** 0.92** 1.43*** -0.04 0.72 (0.475) (0.062) (0.433) (0.257) (0.083) (0.541) Max difference in elevation 1.35*** 0.01 0.26* -0.08 -0.05* 0.06 (0.219) (0.026) (0.144) (0.084) (0.029) (0.145) City is on the coast -0.27 -0.08* 0.02 0.23** -0.02 0.13 (0.264) (0.046) (0.118) (0.115) (0.044) (0.108) City more than 5km 1.10* 0.07 -0.21 0.02 -0.03 1.46 from the coast (0.634) (0.072) (0.228) (0.143) (0.048) (1.098) Current Population -3.38*** 1.48*** -1.68*** -9.11*** 1.10* -3.50 (1.886) (0.290) (0.454) (2.242) (0.582) (2.849) Current Populations squared 1.03 -1.12*** 1.75*** 6.23*** -0.86* 4.47 (1.423) (0.218) (0.418) (1.924) (0.469) (2.816) Gini income inequality index 0.08 0.04 0.04 3.49** 2.05*** -21.66*** (0.449) (0.076) (0.437) (1.505) (0.547) (5.646) Gini inequality index of 9.83*** 2.17*** -8.51*** 1.61*** 0.35*** 1.75 land own. (1.883) (0.377) (2.305) (0.351) (0.098) (1.330) Observations 5,357 5,535 1,911 2,175 2,178 1,210 R-squared 0.083 0.587 0.023 0.329 0.574 0.027
45

B. Regressions in the Center-North controlling for bishop cities established after 1400 C.E.
(I) Non-profit organizations:
North sample
(II) Organ donation organization: North sample
(III) Cheating in math:
North sample
Ease of coordination 1.62*** 0.46*** -0.59*** (0.234) (0.050) (0.091) New seat of a Bishop after 1400 C.E. -1.19*** -0.02 -0.11 (0.391) (0.074) (0.081) Elevation 1.68*** -0.29*** 0.84** (0.474) (0.065) (0.396) Max difference in elevation 1.40*** 0.02 0.26* (0.221) (0.027) (0.143) City is on the coast -0.30 -0.07 0.03 (0.259) (0.045) (0.110) City more than 5km from the coast 0.66 -0.02 -0.22 (0.600) (0.082) (0.199) Current Population -3.57* 1.52*** -1.84*** (1.905) (0.306) (0.474) Current Population squared 1.17 -1.15*** 1.87*** (1.428) (0.228) (0.430) Gini inequality index of land own. 0.27 0.05 0.06 (0.451) (0.076) (0.440) Gini income inequality index 9.65*** 2.19*** -8.54*** (1.883) (0.375) (2.270) Observations 5,382 5,560 1,935 R-squared 0.080 0.579 0.024
46
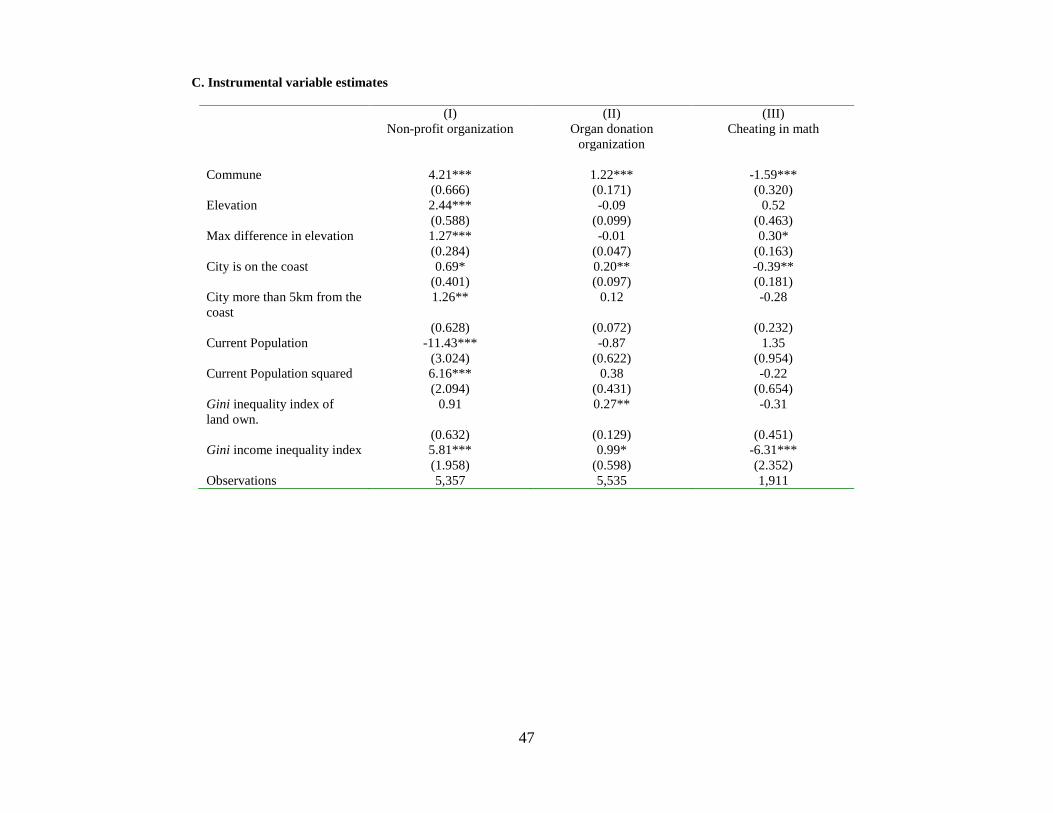
C. Instrumental variable estimates
(I) Non-profit organization
(II) Organ donation
organization
(III) Cheating in math
Commune 4.21*** 1.22*** -1.59*** (0.666) (0.171) (0.320) Elevation 2.44*** -0.09 0.52 (0.588) (0.099) (0.463) Max difference in elevation 1.27*** -0.01 0.30* (0.284) (0.047) (0.163) City is on the coast 0.69* 0.20** -0.39** (0.401) (0.097) (0.181) City more than 5km from the coast
1.26** 0.12 -0.28
(0.628) (0.072) (0.232) Current Population -11.43*** -0.87 1.35 (3.024) (0.622) (0.954) Current Population squared 6.16*** 0.38 -0.22 (2.094) (0.431) (0.654) Gini inequality index of land own.
0.91 0.27** -0.31
(0.632) (0.129) (0.451) Gini income inequality index 5.81*** 0.99* -6.31*** (1.958) (0.598) (2.352) Observations 5,357 5,535 1,911
47

Table 7. City Level averages of Self-efficacy
The table shows OLS estimates of the effect of having been an independent city on measures of self-efficacy in the sample of all Italian cities. Both columns show
Self-efficacy score as the left hand side. Regressions are weighted using city population. In the first column the regression is run on the sample of cities located in
the Center-North of Italy, in the second column the sample includes all cities. ***significant at less than 1%; ** significant at 5%; * significant at 10%. Robust
standard errors are reported in parentheses.
(I) North Sample
(II) Whole Sample
Commune 0.0303** (0.0149) South Dummy -0.108*** (0.00804) Elevation -0.0758* -0.0303 (0.0441) (0.0246) Max difference in elevation 0.0334*** 0.0171*** (0.00839) (0.00658) City is on the coast -0.0241 0.00506 (0.0149) (0.00962) City more than 5km from the coast -0.0110 -0.0109 (0.0191) (0.0134) Current Population -0.0998 -0.0276 (0.0683) (0.0269) Current Population squared 0.0257 -0.00743 (0.0490) (0.0101) Gini inequality index of land own. -0.0244 0.0171 (0.0372) (0.0266) Gini income inequality index 0.00833 0.0294 (0.143) (0.0959) Constant 2.545*** 2.507*** (0.0614) (0.0395)
48

Observations 1,800 3,155 R-squared 0.021 0.106
49

Table 8. Self-efficacy and Civic Capital
The table shows OLS regressions of measures of civic capital in the cities in the Center/North as LHS on self-efficacy in the city and controls as RHS. The left hand side variable in the first two
columns is the number of voluntary association per capita, in column three and four a dummy for the presence of an organ donation organization, and in the last two columns the average cheating.
Estimates are run on the whole sample of cities located in the Center-North of Italy. Robust standard errors are reported in parentheses. *** significant at less than 1%; ** significant at 5%; *
significant at 10%
(I) Number of
associations p.c.
(II) Number of
associations p.c.
(III) Organ Donation
(IV) Organ Donation
(V) Cheating in math
(VI) Cheating in math
Self-efficacy 1.511*** 1.203*** 0.304 0.418** -0.0345*** -0.0348*** (0.326) (0.310) (0.244) (0.169) (0.00862) (0.00837) Elevation -0.269 -0.438* 0.0271** (0.700) (0.226) (0.0122) Max difference in elevation 1.182*** -0.209** 0.00180 (0.260) (0.0935) (0.00351) City is on the coast -0.206 -0.233* 0.0103* (0.351) (0.125) (0.00582) City more than 5km from the coast 0.571 -0.462*** 0.0101 (0.832) (0.147) (0.00965) Current Population 2.250 0.701 -0.00690 (2.249) (0.621) (0.0328) Current Population squared -2.647 -0.689* -0.000552 (1.670) (0.401) (0.0258) Gini inequality index of land own. 0.488 0.620 0.0223** (0.849) (0.395) (0.0109) Gini income inequality index 10.57** 5.097*** 0.0194 (5.056) (1.180) (0.0349) Constant 0.753 -3.581* -0.0921 -2.780*** 0.125*** 0.0979*** (0.825) (2.170) (0.639) (0.745) (0.0222) (0.0270)
50

Observations 1,803 1,803 378 378 1,715 1,715 R-squared 0.011 0.115 0.005 0.302 0.014 0.035
51
References
Abrahamson, Lyn Y., Martin E. Seligman, and John D. Teasdale. "Learned Helplessness in Humans: Critique and Reformulation." Abnormal Psychology, 87.1
(1978): 49–74.
Acemoglu, Daron, Simon Johnson, and James A. Robinson. “The Colonial Origins of Comparative Development: An Empirical Investigation.” American
Economic Review, 91.5 (2010): 1369-1401.
Acemoglu, Daron, and James A. Robinson. Why Nations Fail: the origins of power, prosperity and poverty. Vol. 4. New York: Crown Business, 2012.
Alchian, Armen A., and Harold Demsetz. "Production, information costs, and economic organization." American Economic Review (1972): 777-795.
Alesina, Alberto, Paola Giuliano, and Nathan Nunn. “On the Origin of Gender Roles: Women and the Plough.” Quarterly Journal of Economics, 128.2 (2013):
469-530.
Alesina, Alberto and Eliana La Ferrara. “Who Trusts Others?” Journal of Public Economics, 85.2 (2002): 207-234.
Algan, Yann, and Pierre Cahuc. "Inherited Trust and Growth." American Economic Review, 100.5 (2010): 2060-92. 52

Ancitel. “Le Misure dei Comuni.” 2003-04 Edition. http://www.ancitel.it/miscom/misure.cfm, Web 19 May 2014.
Bairoch, Paul, Jean Batou, and Pierre Chevre. The Population of European Cities from 800 to 1850. Geneva: Centre of International Economic History, Geneva
University, 1988.
Bandura, Albert. “Self-efficacy: Toward a Unifying Theory of Behavioral Change.” Psychological Review, 4.2 (1977): 191-215.
Bandura, Albert. Self Efficacy in Changing Societies. New York: Cambridge University Press, 1995.
Bandura, Albert. Self-Efficacy: The Exercise of Control. New York: Freeman, 1997.
Banfield, Edward C. The Moral Basis of a Backward Society. New York: Free Press, 1958.
Belloc, Marianna, Francesco Drago, and Roberto Galbiati. “Earthquakes, Religion and Transition to Self-Government in Italian Cities.” Science Po Working
Paper, 2014.
Bezdek, James C. Pattern Recognition with Fuzzy Objective Function Algoritms. New York: Plenum Press, 1981.
53

Bisin, Alberto, and Thierry Verdier. “Beyond the Melting Pot: Cultural Transmission, Marriage, and the Evolution of Ethnic and Religious Traits.” Quarterly
Journal of Economics, 115.3 (2000): 955-988.
Bisin, Alberto, and Thierry Verdier. “The Economics of Cultural Transmission and the Evolution of Preferences.” Journal of Economic Theory, 97.1 (2001): 298-
319.
Brill’s New Pauly. “Coloniae.” Antiquity volumes edited by Hubert Cancik and Helmuth Schneider. Vol. 3. Lieden-Boston: Brill, 2003: 546-554.
Chittolini, Giorgio. Il Comune e la signoria. Bergamo: G. Chittolini editore, 1999.
De Agostini, Nuovo Atlante Storico. Novara: Istituto Geografico De Agostini, 2007: 61-62.
De Cremer, David and Mark Van Vugt. “Collective Identity and Cooperation in a Public Goods Dilemma: A Matter of Trust or Self-Efficacy?” Current Research
in Social Psychology. Vol 3.1, Apr 1998: 1-11.
De Long, J. Bradford, and Andrei Shleifer. "Princes and Merchants: European City Growth before the Industrial Revolution." Journal of Law and Economics,
University of Chicago Press, 36.2 (1993): 671-702.
Diocesi italiane. http://it.wikipedia.org/wiki/Elenco_delle_diocesi_italiane, Web 19 May 2014.
54

Dunn, Joseph C. “A Fuzzy Relative of the ISODATA Process and Its Use in Detecting Compact Well-Separated Clusters.” Journal of Cybernetics, 3.3 (1973):
32-57.
Dweck, Carol S., et al. "Sex differences in learned helplessness: II. The contingencies of evaluative feedback in the classroom and III. An experimental
analysis." Developmental psychology, 14.3 (1978): 268.
Fernandez, Raquel, Alessandra Fogli, and Claudia Olivetti. “Mothers and Sons: Preference Formation and Female Labor Force Dynamics.” Quarterly Journal of
Economics, 119.4 (2004): 1249-1299.
Fisman, Ray, and Edward Miguel. “Corruption. Norms and Legal Enforcement: Evidence from Diplomatic Parking Tickets.” Journal of Political Economy, 115.6
(2007): 1020-1048.
Fukuyama, Francis. Trust: The Social Virtues and the Creation of Prosperity. New York: Free Press, 1995.
Galizia, Mario. La teoria della sovranità dal medio evo alla rivoluzione francese. Milan: Giuffre’ Ed,, 1951.
Giuliano, Paola. "Living Arrangements in Western Europe: Does Cultural Origin Matter?" Journal of the European Economic Association, 5.5 (2007): 927-952.
55
Glaeser, Edward L., Rafael La Porta, Florencio Lopez-de-Silanes, and Andrei Shleifer. "Do Institutions Cause Growth?" Journal of Economic Growth, 9.3
(2004): 271-303.
Glaeser, Edward, Bruce Sacerdote, and David Laibson. “An Economic Approach to Social Capital." Economic Journal, 112.483 (2002): 437-458.
Gorodnichenko, Yuri, and Gerard Roland. “Culture, Institutions and the Wealth of Nations.” Review of Economics and Statistics, 2014 forthcoming.
Grosjean, Pauline. "A History of Violence: The Culture of Honor as a Determinant of Homicide in the US South." Discussion Papers 2011-13, School of
Economics, The University of New South Wales, 2011.
Guide Rosse d’Italia, Regioni Italiane. Milano: Touring Club Italiano, 2000.
Guiso, Luigi, Paola Sapienza, and Luigi Zingales. “The Role of Social Capital in Financial Development.” American Economic Review, 94.3 (2004): 526-556.
Guiso, Luigi, Paola Sapienza, and Luigi Zingales. “Does Culture Affect Economic Outcomes?” Journal of Economic Perspectives, 20.2 (2006): 23-48.
Guiso, Luigi, Paola Sapienza, and Luigi Zingales. “Alfred Marshall Lecture Social Capital as Good Culture.” Journal of the European Economic Association,
6.2-3 (2008): 295-320.
56

Guiso, Luigi, Paola Sapienza, and Luigi Zingales. “Civic Capital as the Missing Link.” in Social Economics Handbook edited by Jess Benhabib, Alberto Bisin,
Matthew O. Jackson. Amsterdam: North-Holland, 2011.
INVALSI. “La Prova Nazionale al Termine del Primo Ciclo, A.S. 2008-09.” http://www.invalsi.it/esamidistato0809/ , Web 19 May 2014.
ISTAT. “14° Censimento Generale della Popolazione delle Abitazioni (2001 National Census).” http://dawinci.istat.it/MD/ , Web 21 May 2014.
Jones, Philip. The Italian City-state. From Commune to Signoria. (1997) Oxford: Clarendon Press, 1997.
Knack, Stephen, and Philip Keefer. “Does Social Capital have an Economic Pay-off? A Cross Country Investigation.” Quarterly Journal of Economics, 112.4
(1997): 1251-1288.
Maddison, Angus. “The World Economy: A Millennial Perspective.” OCED, 2001.
Maddux, James E. “Self-Efficacy: The Power of Believing You Can.” in Oxford Handbook of Positive Psychology, Shane J. Lopez and C.R. Snyder eds. Oxford
University Press, 2009.
Milani, Giuliano. I Comuni Italiani. Bari: Editori Laterza, 2005.
57

Ministero del Lavoro. Registri delle Associazioni Provinciali. Roma, 2005.
Nunn, Nathan, and Leonard Wantchekon. “The Slave Trade and the Origins of Mistrust in Africa.” American Economic Review, 101.7 (2011): 3221–3252.
Oettingen, Gabriele, and Martin E.P. Seligman. “Pessimism and behavioural signs of depression in East versus West Berlin.” European Journal of Social
Psychology, 20.3 (1990): 207-220.
Ostrom, Elinor. Governing the Commons: The Evolution of Institutions for Collective Action. Cambridge: Cambridge University Press, 1990.
Pirenne, Henri. The Medieval City. Princeton: Princeton University Press, 1956.
Prezzolini, Giuseppe. The Legacy of Italy. New York: S.F. Vanni Editore, 1948.
Prodi, Paolo. Il Sacramento del Potere. Il Giuramento Politico nella Storia Costituzionale dell'Occidente. Bologna: Il Mulino, 1992.
Putnam, Robert. Bowling Alone: The Collapse and Revival of American Community. New York: Simon & Schuster, 2000.
Putnam, Robert, Robert Leonardi, and Raffaella Nanetti. Making Democracy Work: Civic Traditions in Modern Italy. New York: Simon & Schuster, 1993.
58

Reynolds, Susan. Kingdoms and Communities in Western Europe 900-1300. Second ed. Oxford: Clarendon Press, 1997.
Seligman, M.E.P., Peterson, C., Kaslow, N.J., Tanenbaum, R.L., Alloy, L.B., and Abramson, L.Y. (1984), “Attributional style and depressive symptoms among
children”, Journal of Abnormal Psychology, 93, 235-238.
Tabacco, Giovanni. “La Città Vescovile nell'Alto Medioevo.” in Modelli di città. Strutture e funzioni politiche. Edited by P. Rossi. Torino: Edizioni Comunità,
1987.
Tabellini, Guido. “The Scope of Cooperation: Values and Incentives.” Quarterly Journal of Economics, 123.3 (2008): 905-950.
Tabellini, Guido. “Culture and Institutions: Economic Development in the Regions of Europe.” Journal of the European Economic Association, 8.4 (2010): 1542-
4774.
Touring Club Italiano, Atlante Storico. Milano: Touring Club Italiano, 1994.
Treccani, Atlante Storico. Roma: Istituto della Enciclopedia italiana, 2007.
Treccani, Enciclopedie. Roma: Istituto della Enciclopedia italiana, 1949.
59

Voigtländer, Nico, and Hans-Joachim Voth. “Persecution Perpetuated: The Medieval Origins of Anti-Semitic Violence in Nazi Germany.” Quarterly Journal of
Economics, 127.3 (2012): 1339-1392.
Williamson, Olivier. “The New Institutional Economics: Taking Stock, Looking Ahead.” Journal of Economic Literature, 38.3 (2000): 595-613.
60