long-term perimetric fluctuation in patients with
TRANSCRIPT

HAL Id: hal-00560856https://hal.archives-ouvertes.fr/hal-00560856
Submitted on 31 Jan 2011
HAL is a multi-disciplinary open accessarchive for the deposit and dissemination of sci-entific research documents, whether they are pub-lished or not. The documents may come fromteaching and research institutions in France orabroad, or from public or private research centers.
L’archive ouverte pluridisciplinaire HAL, estdestinée au dépôt et à la diffusion de documentsscientifiques de niveau recherche, publiés ou non,émanant des établissements d’enseignement et derecherche français ou étrangers, des laboratoirespublics ou privés.
Long-term perimetric fluctuation in patients withdifferent stages of glaucoma
Paolo Fogagnolo, Chiara Sangermani, Francesco Oddone, Paolo Frezzotti,Michele Iester, Michele Figus, Antonio Ferreras, Simona Romano, Stefano
Gandolfi, Marco Centofanti, et al.
To cite this version:Paolo Fogagnolo, Chiara Sangermani, Francesco Oddone, Paolo Frezzotti, Michele Iester, et al.. Long-term perimetric fluctuation in patients with different stages of glaucoma. British Journal of Ophthal-mology, BMJ Publishing Group, 2010, 95 (2), pp.189. �10.1136/bjo.2010.182758�. �hal-00560856�
1
Long-term perimetric fluctuation in patients with different stages of glaucoma 1
2
Paolo Fogagnolo, MD,1 Chiara Sangermani, MD,2 Francesco Oddone, MD,1 Paolo Frezzotti, 3
MD,3 Michele Iester, MD,4 Michele Figus, MD, PhD,5 Antonio Ferreras, MD, PhD,6 Simona 4
Romano, MD,7 Stefano Gandolfi, MD,2 Marco Centofanti, MD, PhD,1 Luca Rossetti, MD,7 Nicola 5
Orzalesi, MD.7 6
7
1G. B. Bietti Foundation - IRCCS, Rome, Italy; 2 Eye Clinic, University of Parma, Parma, Italy; 8
3Dipartimento di Scienze oftalmologiche e Neurochirurgiche, Universita' degli Studi di Siena, Siena, 9
Italy; 4 Clinica Oculistica, Università di Genova, Genova, Italy; 5 Eye Clinic, Department of 10
Neuroscience, University of Pisa, Pisa, Italy; 6Department of Ophthalmology, Miguel Servet 11
University Hospital, University of Zaragoza, Zaragoza, Spain; 7Eye Clinic, Department of Medicine, 12
Surgery and and Dentistry, San Paolo Hospital, University of Milan, Milano, Italy. 13
14
Preliminary results presented at ARVO, Fort Lauderdale, USA, May 2007. 15
Corresponding author: Paolo Fogagnolo, MD 16
Eye Clinic, San Paolo Hospital, Via di Rudini’ 8, 20142 Milano, Italy 17
t +390281844301; f +390250323150; e-mail: [email protected] 18
Running title: Long-term fluctuation and GSS 19
Keywords: primary open-angle glaucoma (POAG); perimetry; visual field; long-term fluctuation; 20
long-term variability; progression; glaucoma staging system. 21
Word count: abstract: 234; manuscript: 2246. 22
Licence for Publication. The Corresponding Author has the right to grant on behalf of all authors 23
and does grant on behalf of all authors, an exclusive licence (or non exclusive for government 24
employees) on a worldwide basis to the BMJ Publishing Group Ltd to permit this article (if 25
accepted) to be published in BJO and any other BMJPGL products and sublicences such use and 26
exploit all subsidiary rights, as set out in our licence ( 27
http://group.bmj.com/products/journals/instructions-for-authors/licence-forms ). 28

2
Competing Interest: None declared. 29
30
31

3
ABSTRACT 32
Purpose: To evaluate the long-term perimetric fluctuation (LF) in patients with different stages of 33
glaucoma according to the Glaucoma Staging System 2 (GSS2). 34
Methods: This multicenter retrospective study included 161 eyes of 161 stable glaucoma patients 35
undergoing 4 visual field tests (Humphrey SITA-Standard program over the central 24° or 30°) over 36
a 2-year period. For each patient, the stage of the disease was classified according to GSS2. LF 37
was then calculated as the mean of the standard deviations of point-to-point threshold sensitivities 38
in the four repetitions. LF in GSS2 stages was compared using t-test. 39
Results: LF progressively increased from stage 0 to stage 4, and then decreased at stage 5. Stage 40
4 had a peak of 3.19±0.94 dB, with statistically significant differences compared with all the other 41
stages. The lowest LF (1.65±0.60 dB) was found for normal subjects, whereas similar data were 42
found for borderline patients and those at stages 1 and 5 (2.09±0.58, 2.13±0.57, and 2.22±0.89 43
dB, respectively; P>0.13). Visual fields with generalized defects had lower LF (1.90±0.81) than 44
those with mixed (2.84±0.87, P=0.0003) and localized (2.63±0.72, P=0.004) defects. 45
Conclusions: In this study we showed that the lower was the visual field defect the lower was LF, 46
except at stage 5 of GSS2. As test-retest changes exceeding LF could represent a sign of 47
progression, we suggest to clinicians using this classification system to calculate LF,in order to 48
better differentiate true progression from variability. 49
50
51

4
INTRODUCTION 52
The analysis of changes in standard automated perimetry (SAP) over time is a key element to 53
detect glaucoma progression. Four main approaches to evaluate perimetric progression are 54
available: clinical judgment of a series of tests, classification systems, event analysis, and trend 55
analysis. All these approaches are limited by the “noise” of variability, which is the result of 56
changes in the nature of the visual system, the testing situation, the features of the perimetric 57
program, and the condition of the patient.1 58
In a regression model of any perimetric parameter over time, regression line represents the 59
expected change, whereas long-term fluctuation (LF) is an area of uncertainty both below 60
(apparent worsening) and above (apparent improvement) this line. In the clinical practice, 61
improvement of results due to LF has limited relevance (this is clearly an artefact because 62
glaucoma cannot improve by definition), whereas worsening of results due to fluctuation is 63
extremely important because LF can mask progression or even mimic glaucomatous 64
deterioration.1 65
Several mathematical models have been proposed for measuring LF;1-3 studies of normal 66
subjects, suspect glaucoma, and glaucoma patients have also shown that LF is predictable on the 67
basis of mean defect (MD).1-6 68
Among the strategies used to evaluate the amount of visual field defect and its changes 69
over time, the Glaucoma Staging System (GSS) is gaining popularity due to its simplicity of use. By 70
plotting MD against the pattern standard deviation (PSD) or the corrected PSD (CPSD), GSS 71
classifies visual field results into 6 stages (from 0 to 5) and three types of defects (localized, mixed, 72
generalized).7 Recently, the system has been implemented (GSS2) by introducing a borderline 73
stage between stages 0 and 1.8 74
Although GSS2 may be useful in evaluating glaucoma changes at follow-up,9 currently 75
there are no studies measuring LF at different stages of GSS2, which is the aim of this multicenter 76
study. 77
78

5
MATERIALS AND METHODS 79
This retrospective study involved seven University Eye Clinics: Genoa, Milan (San Paolo Hospital), 80
Parma, Pisa, Roma (G.B. Bietti Foundation), Siena (Italy) and Zaragoza (Spain). It was in 81
adherence to the tenets of the Declaration of Helsinki; patients were informed about the study and 82
gave informed consent for data treatment. 83
Patient selection 84
This study included patients with ocular hypertension (OH) or primary open-angle glaucoma 85
(POAG), pseudoexfoliative glaucoma (PEG) or pigmentary glaucoma (PG) who fulfilled inclusion 86
and exclusion criteria. Each of the 7 centers recruited 25 cases. One eye per subject was randomly 87
selected if both eyes met the inclusion criteria. 88
The inclusion criteria were: 18 years of age or older; patients with OH, POAG, PEG, PG; 89
stability of the disease during the study period (see below for definition); visual fields performed 90
using the Humphrey Field Analyzer (HFA) II 750 (Zeiss Humphrey Systems, Dublin, Ca, USA) 24-2 91
or 30-2 test with Standard Swedish Interactive Threshold Algorithm (SITA) strategy; presence of at 92
least 4 reliable tests (<25% false-positive responses, <25% false-negative responses, and <25% 93
fixation losses) over a 2-year period. The exclusion criteria were: normal tension glaucoma; 94
secondary glaucomas; the development of cataract or any pathology affecting visual acuity and 95
visual field at any time during the study period; any change in the program used to test the patient 96
at follow-up; learning effect at visual field during the study period; neurological disorders; systemic 97
and ophthalmic disorders affecting SAP results or reliability. Diagnosis was based on chart review 98
of medical history, biomicroscopy, gonioscopy, Goldmann applanation tonometry, and indirect 99
fundus ophthalmoscopy. 100
POAG eyes were defined as having intraocular pressure (IOP) higher than 21 mmHg prior 101
medication, glaucomatous optic neuropathy (diffuse neuroretinal rim narrowing with concentric 102
enlargement of the optic cup, localized notching, or both)10 and repeatable abnormal results at 103
SAP. OH were defined as having an IOP > 21 mmHg prior medication, no ocular pathologies and 104
normal optic nerve head appearance and visual field results. 105
Stability of the disease 106

6
To be included, patients had to have no changes in mean IOP, medical regimen, optic 107
nerve head appearance at ophthalmoscopy and SAP for the duration of the study. IOP was 108
arbitrarily considered stable if changes of less than 20% in mean value (obtained from office-hour 109
curves, i.e. 4 measurements between 8 AM and 4 PM) occurred compared with the first visit. 110
A battery of visual fields was considered stable if the first and the last tests showed 111
absence of: 1) the development of a new scotoma (defined as three or more contiguous points with 112
P <5%, or two or more contiguous points with P <1%); 2) the expansion of an existing scotoma into 113
previously normal regions (defined as three or more contiguous points with P <5%, or two or more 114
contiguous points with P <1%); 3) the deepening of an existing scotoma (defined as a decrease in 115
the probability value or a reduction in sensitivity of at least 5 dB in three or more contiguous points, 116
or 10 dB or more in at least two contiguous points11); and 4) a worsening probability value for any 117
perimetric index. Any change occurring in the second and third test was considered as variability.1 118
Being stability a key point for a correct study conduction, all SAP were reviewed by an independent 119
evaluator (PF), and 5 cases were excluded for progression. 120
The stage of the disease was classified according to the GSS2 using the mean of MD and 121
PSD of the four tests. For each patient, all four tests were plotted into GSS2, and cases with 122
borderline stage (ie. two tests falling into different stages) were excluded, a fact which occurred in 123
9 cases (Figure 1). 124
Statistical analysis. 125
LF was calculated as the mean of the standard deviations of point-to-point threshold 126
sensitivities in the four repetitions using the following formula: 127
∑∑
=
=
−
−=
r
i
n
jj
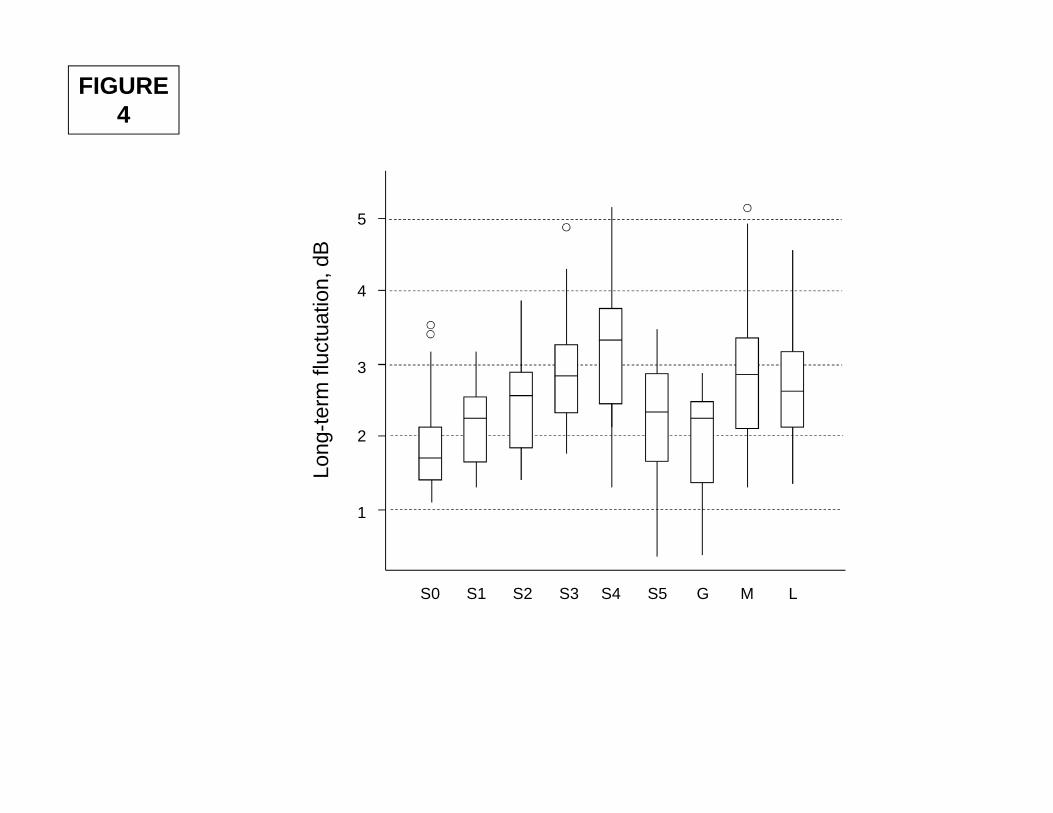
n
xx
rLF
1
1
2
1
)(1
128
where i (ranging from 1 to r, which was 54 for 24-2 program and 76 for 30-2 program) 129
identifies the locations of the test, and j (ranging from 1 to n) is the number of tests per patient. 130
7
LF was then plotted against MD and PSD for each patient, Regression analysis was 131
performed and correlation was calculated for the whole dataset. Thereafter, mean LF, standard 132
deviation, and confidence intervals were calculated for each stage. 133
The analysis was performed with SPSS (version 13.0; SPSS Science Inc., Chicago, IL, 134
USA). The t-test was used for comparisons; P≤0.05 was considered significant. Models of linear 135
and second-degree regression were also used to inspect data associations. 136
137
RESULTS 138
The study was conducted on 161 Caucasian patients, whose demographics and perimetric data 139
are given in Tables 1 and 2. The populations in the 7 sites had similar characteristics (similar age, 140
MD, PSD, LF; P>0.10). 141
MD was similar in patients with generalized and mixed defects (P=0.65) and lower in 142
patients with localized defects (P<0.001). PSD was similar in patients with mixed and localized 143
defects (P=0.39) and lower in patients with generalized (P<0.001, Table 2). 144
LF was plotted against MD and PSD. As shown by regression analyses in Figures 1 and 2, 145
the best fitting curves for these variables were quadratic. LF had a trough of about 1.5 dB at MD of 146
about +2 dB, it progressively increased to 3 dB, reaching a plateau for MD of about -12/-15 dB, 147
and it progressively decreased to 1.5 dB when MD worsened up to -30 dB (y = -0.0065x2 - 0.1719x 148
+ 1.9054; R2 = 0.30). Similar findings were shown for PSD: LF had a trough of 1.5 dB for null PSD; 149
it increased to 3 dB for PSD of 10 dB, and it progressively decreased to about 2 dB (y = -0.0159x2 150
+ 0.3214x + 1.3256; R2 = 0.26). 151
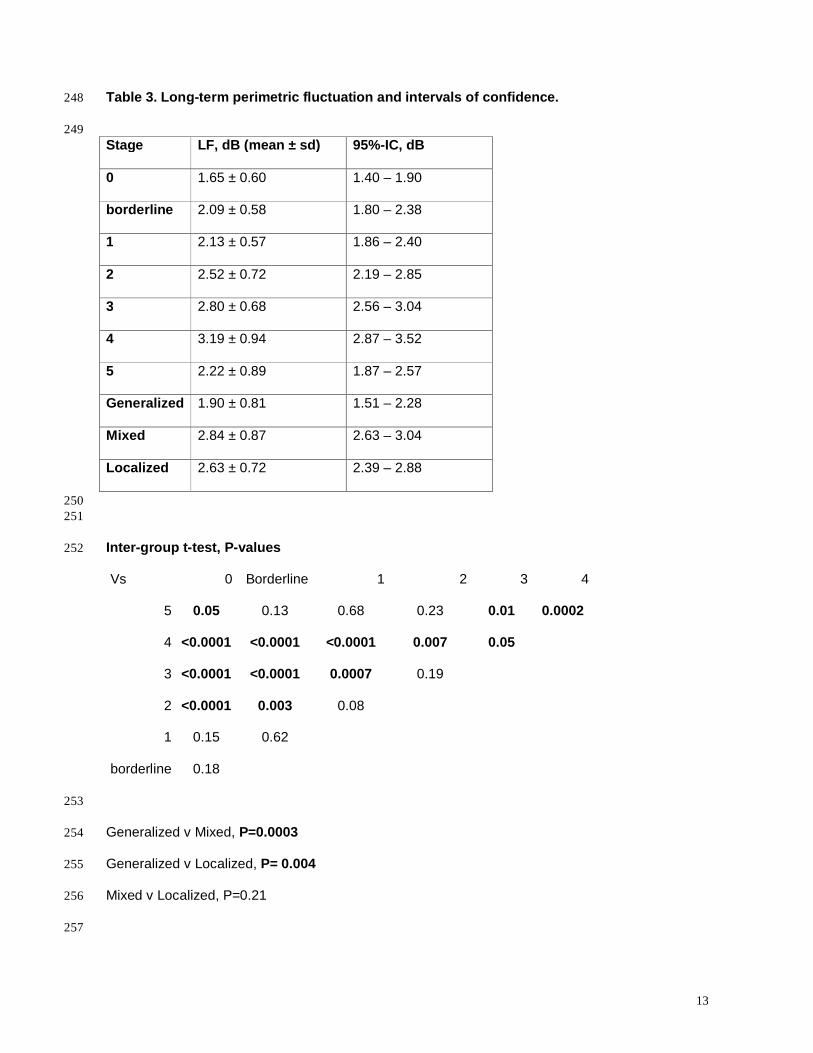
LF mean values and 95% intervals of confidence are given in Table 3, box plot diagrams 152
are given in Figure 4. LF progressively increased from stage 0 to stage 4, and then decreased at 153
stage 5. Stage 4 had a peak of 3.19 ± 0.94 dB, with statistically significant differences compared 154
with all the other stages (P<0.05). Visual fields with generalized defects had lower LF (1.90 ± 0.81) 155
than those with mixed (2.84 ± 0.87, P=0.0003) and localized (2.63 ± 0.72, P=0.004) defects. Table 156
4 also reports the details of LF for stage and type of defects; at each stage, mixed defects had the 157
highest LF values. 158
8
159
DISCUSSION 160
Many strategies have been developed over the last years with the aim of providing an early and 161
accurate diagnosis of functional progression of glaucoma, but this task still remains tricky in a 162
number of cases due to the inability to distinguish true change from fluctuation. This clinical 163
problem is very relevant, as shown in the rigorous settings of a multicenter randomized study such 164
as the Normal Tension Glaucoma Study, on which a false call of progression of more than 50% 165
was found.12 166
LF is inborn on a psychophysical test such as perimetry, and it is therefore impossible to 167
get over it even at optimal clinical conditions. Mathematical models to soften the effect of LF and to 168
stabilize a series of visual fields have been recently reported,13 but the best way to reduce 169
variability is to reduce the clinical sources of the problem. Efforts should focus on adopting ideal 170
testing conditions (calm and comfortable room, mild illumination, use of standard operating 171
procedures) and the same perimetric strategy over time (LF largely varies between perimetric 172
strategies14). 173
Our study aimed at calculating the amount of LF in glaucoma patients with different GSS2 174
stages, which is, to the best of our knowledge, an unexplored issue. In theory, clinicians using this 175
classification system would found our data helpful to discriminate early glaucoma progression to 176
fluctuation.1 177
As expected, patients with normal fields had low LF values (CIs ranging from 1.40 to 1.90 178
dB), with small overlap with borderline cases (inferior CIs of 1.80 dB) and glaucoma cases at stage 179
1 (1.86 dB). 180
An interesting finding of our paper was that borderline patients had MD similar to normal 181
subjects (Stage 0), and LF comparable with stage 1 (Table 3), despite a difference of more than 2 182
dB in MD and of more than 0.5 dB in PSD (Table 2). In other words, high LF values might be used 183
to predict the presence of early disease in borderline cases with normal MD. This finding needs 184
verification by properly designed studies. 185
9
Our paper confirmed that the relation between MD and LF is curvilinear and not linear 186
(Figure 2).2,15 LF progressively increased from stage 0 to stage 4, it reached a plateau for MD of 187
about -13 dB,,and then decreased when glaucoma defect became more diffuse (stage 5 had 188
intervals of confidence similar to stage 1). This curve resembles the curvilinear relation between 189
MD and PSD described by Pearson et al.,16 because they share at least two common determining 190
factors. 191
The first factor is the asymmetry of the Bebie curve, which increases as long as the 192
glaucoma defect becomes more localized, and progressively decreases in more advanced stages 193
of the disease, when both hemifields are involved. PSD is a direct measure of the asymmetry of 194
the hill of vision with respect to normal, age-matched fields. As locations on the edge of the defect 195
have higher variability,17 when a localized defect enlarges, the edge of the scotoma becomes 196
larger and LF increases, as shown by several studies.2,3,5,15,18-20 197
When the defects involve both hemifields, the edge of the scotomas becomes even larger, 198
and one would therefore expect LF to increase. Actually, based on our data, LF progressively 199
decreases, probably because the effect of the enlargement of the absolute scotoma (which 200
fluctuates less than a relative scotoma17) is prevalent as both hemifields progressively deteriorate. 201
The second factor is a limitation of perimetry for high MD values. At the “bottom of the 202
scale”, very deep scotomas may be judged absolute by the perimeter; this is due to insufficient 203
stimulus size and luminance to stimulate the damaged ganglion cells. As a consequence, the 204
corresponding points can fluctuate only above their average sensitivity but not below it (inferior 205
fluctuation is not tested being sensitivity null for the perimeter). Also for this reason, both LF and 206
PSD get reduced for high MD values. 207
Caution is required when using our data in the clinical settings. Although our dataset was 208
clinical-based (the study was a retrospective analysis of data collected in glaucoma patients 209
undergoing routine visits and visual field tests every 6 months), a fixed number of tests was 210
chosen. Different LF values would be found if a variable number of tests was considered. Also, we 211
excluded patients with different GSS2 stages at the beginning and the end of the study, although 212
changes of type and stage can occur even in stable patients. Subgroup analysis was of limited 213
10
relevance due to the small number of cases (n<5) falling in stages 1L, 2G, 3G, 4G, 5L. Our study is 214
not informative on patients with normal tension glaucoma or secondary glaucoma, although GSS2 215
is useful also to monitor these patients. 216
A strength of the study was the multicenter design; tests were double-checked to exclude 217
progression and similar inter-site demographics, perimetric and variability data were found. As 218
opposite to other studies on perimetric fluctuation which used computer-simulated dataset or visual 219
fields obtained over a short period of time, in our study routine intervals of time of 6 months were 220
maintained between tests repetitions. 221
In summary, LF is a key-point to ascertain perimetric stability or progression, regardless of 222
the strategy used to analyze visual field tests. This parameter can be easily calculated for each 223
patient and it may provide useful information in a number of cases. We suggest to clinicians using 224
GSS2 to calculate LF at least in patients with suspect progression, in order to obtain an earlier and 225
more accurate diagnosis. 226
227
228
229
11
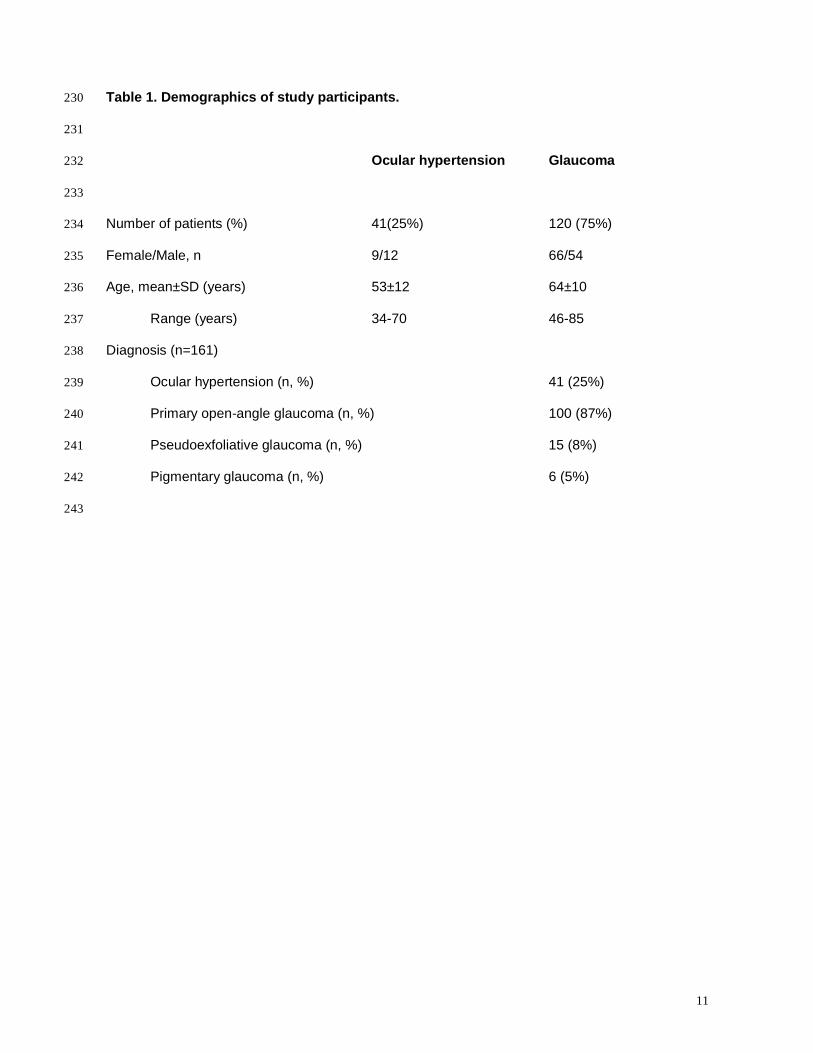
Table 1. Demographics of study participants. 230
231
Ocular hypertension Glaucoma 232
233
Number of patients (%) 41(25%) 120 (75%) 234
Female/Male, n 9/12 66/54 235
Age, mean±SD (years) 53±12 64±10 236
Range (years) 34-70 46-85 237
Diagnosis (n=161) 238
Ocular hypertension (n, %) 41 (25%) 239
Primary open-angle glaucoma (n, %) 100 (87%) 240
Pseudoexfoliative glaucoma (n, %) 15 (8%) 241
Pigmentary glaucoma (n, %) 6 (5%) 242
243
12
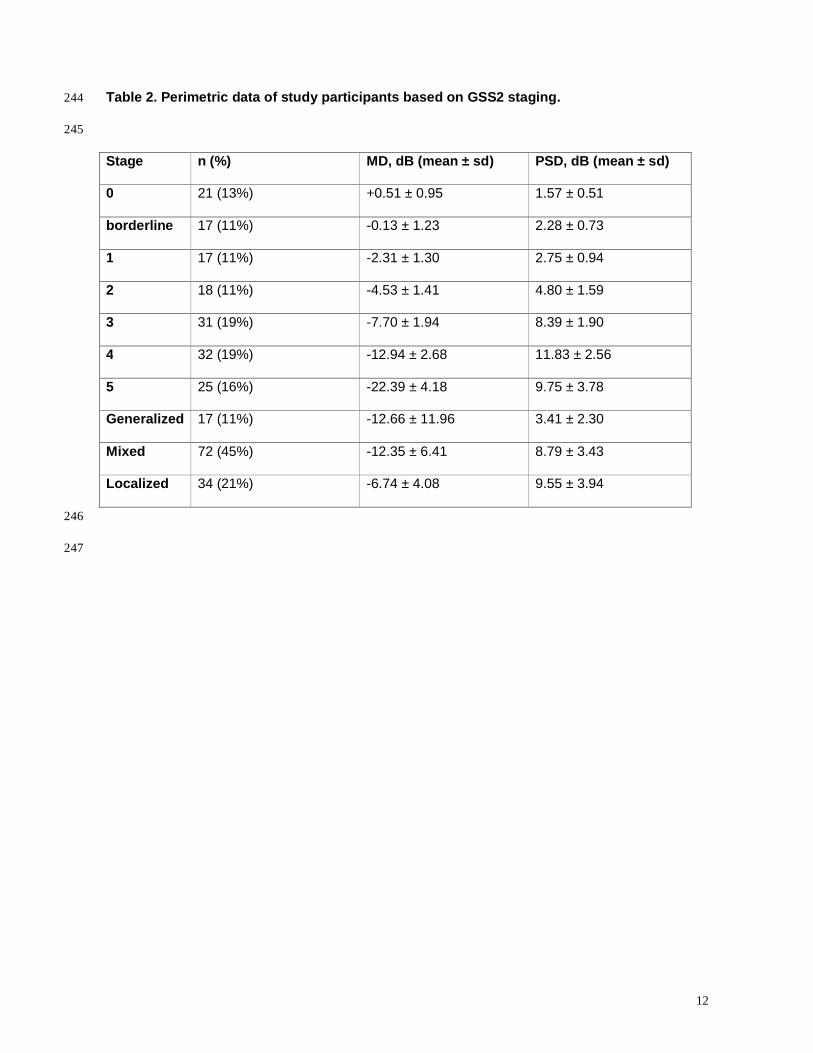
Table 2. Perimetric data of study participants based on GSS2 staging. 244
245
Stage n (%) MD, dB (mean ± sd) PSD, dB (mean ± sd)
0 21 (13%) +0.51 ± 0.95 1.57 ± 0.51
borderline 17 (11%) -0.13 ± 1.23 2.28 ± 0.73
1 17 (11%) -2.31 ± 1.30 2.75 ± 0.94
2 18 (11%) -4.53 ± 1.41 4.80 ± 1.59
3 31 (19%) -7.70 ± 1.94 8.39 ± 1.90
4 32 (19%) -12.94 ± 2.68 11.83 ± 2.56
5 25 (16%) -22.39 ± 4.18 9.75 ± 3.78
Generalized 17 (11%) -12.66 ± 11.96 3.41 ± 2.30
Mixed 72 (45%) -12.35 ± 6.41 8.79 ± 3.43
Localized 34 (21%) -6.74 ± 4.08 9.55 ± 3.94
246
247
13
Table 3. Long-term perimetric fluctuation and intervals of confidence. 248
249 Stage LF, dB (mean ± sd) 95%-IC, dB
0 1.65 ± 0.60 1.40 – 1.90
borderline 2.09 ± 0.58 1.80 – 2.38
1 2.13 ± 0.57 1.86 – 2.40
2 2.52 ± 0.72 2.19 – 2.85
3 2.80 ± 0.68 2.56 – 3.04
4 3.19 ± 0.94 2.87 – 3.52
5 2.22 ± 0.89 1.87 – 2.57
Generalized 1.90 ± 0.81 1.51 – 2.28
Mixed 2.84 ± 0.87 2.63 – 3.04
Localized 2.63 ± 0.72 2.39 – 2.88
250 251
Inter-group t-test, P-values 252
Vs 0 Borderline 1 2 3 4
5 0.05 0.13 0.68 0.23 0.01 0.0002
4 <0.0001 <0.0001 <0.0001 0.007 0.05
3 <0.0001 <0.0001 0.0007 0.19
2 <0.0001 0.003 0.08
1 0.15 0.62
borderline 0.18
253
Generalized v Mixed, P=0.0003 254
Generalized v Localized, P= 0.004 255
Mixed v Localized, P=0.21 256
257

14
Table 4. Test-retest perimetric variability for stage and type of defects. 258
259
Stage n LF, dB (mean ± sd)
1 localised 4 1.68 ± 0.58
mixed 5 2.43 ± 0.60
generalised 8 2.16 ± 0.44
2 localised 7 2.55 ± 0.71
mixed 9 2.58 ± 0.73
generalised 2 2.15 ± 1.03
3 localised 12 2.70 ± 0.47
mixed 18 2.88 ± 0.81
generalised 1 2.49
4 localised 10 3.07 ± 0.69
mixed 22 3.25 ± 1.05
generalised 0 n/a
5 localised 1 1.81
mixed 18 2.53 ± 0.66
generalised 6 1.37 ± 1.03
260

15
LEGENDS TO FIGURES 261
262
Figure 1. Study flow. Gray box, patients excluded from the study. 263
Figure 2. Regression analysis of mean defect vs long-term fluctuation. 264
Figure 3. Regression analysis of pattern standard deviation vs long-term fluctuation. 265
Figure 4. Box plot diagrams of long-term fluctuation for different GSS2 stages. G, generalized 266
defects; M, mixed defects; L, localized defects; circles, ourliers. 267
268

16
REFERENCES 269
1. Flammer J, Drance SM, Zulauf M. Differential light threshold. Short- and long-term fluctuation in 270
patients with glaucoma, normal controls, and patients with suspected glaucoma. Arch Ophthalmol 271
1984;102:704-6. 272
2. Fogagnolo P, McNaught A, Centofanti M, Rossetti L, Orzalesi N. The effects of intraocular 273
pressure reduction on perimetric variability in glaucomatous eyes. Invest Ophthalmol Vis Sci. 274
2007;48:4557-63. 275
3. Hutchings N, Wild JM, Hussey MK, Flanagan JG, Trope GE. The long-term fluctuation of the 276
visual field in stable glaucoma. Invest Ophthalmol Vis Sci. 2000;41:3429–3436. 277
4. Heijl A, Lindgren A, Lindgren G. Test-retest variability in glaucomatous visual fields. Am J 278
Ophthalmol. 1989;108(2):130-5. 279
5. Henson DB, Chaudry S, Artes PH, Faragher EB, Ansons A. Response variability in the visual 280
field: comparison of optic neuritis, glaucoma, ocular hypertension, and normal eyes. Invest 281
Ophthalmol Vis Sci. 2000;41:417-21. 282
6. Kwon YH, Park HJ, Jap A, Ugurlu S, Caprioli J. Test-retest variability of blue-on-yellow perimetry 283
is greater than white-on-white perimetry in normal subjects. Am J Ophthalmol 1998;126:29-36. 284
7. Brusini P. Clinical use of a new method for visual field damage classification in glaucoma. Eur J 285
Ophthalmol. 1996;6:402-7. 286
8. Brusini P, Filacorda S. Enhanced Glaucoma Staging System (GSS 2) for classifying functional 287
damage in glaucoma. J Glaucoma. 2006;15:40-6. 288
9. Koçak I, Zulauf M, Hendrickson P, Stümpfig D. Evaluation of the Brusini glaucoma staging 289
system for follow-up in glaucoma. Eur J Ophthalmol. 1997;7:345-50. 290
10. Tuulonen A, Airaksinen PJ. Initial glaucomatous optic disk and retinal nerve fiber layer 291
abnormalities and their progression. Am J Ophthalmol 1991;111:485-90. 292
11. Caprioli, J. Automated perimetry in glaucoma. In Walsh, T. J., Visual fields: examination and 293
interpretation. Ophthalmology Monographs (pp. 71-105). San Francisco: American Academy of 294
Ophthalmology, 1990. 295

17
12. Schulzer M. Errors in the diagnosis of visual field progression in NTG. Ophthalmology. 296
1994;101:1589-94. 297
13. Gonzalez de la Rosa M, Gonzalez-Hernandez M, Diaz Aleman T, Sanchez Mendez M. 298
Stabilization and comparison of TOP and Bracketing perimetric strategies using a threshold spatial 299
filter. Graefes Arch Clin Exp Ophthalmol. 2007;245:1303-9. 300
14. Bengtsson B, Heijl A, Olsson J.Evaluation of a new threshold visual field strategy, SITA, in 301
normal subjects Acta Ophthalmol Scand.1998;76:165–169. 302
15. Boeglin RJ, Caprioli J, Zulauf M. Long-term fluctuation of the visual field in glaucoma. Am J 303
Ophthalmol. 1992;113:396-400. 304
16. Pearson PA, Baldwin LB, Smith TJ. The relationship of mean defect to corrected loss variance 305
in glaucoma and ocular hypertension. Ophthalmologica. 1990;200:16-21. 306
17. Haefliger IO, Flammer J. Fluctuation of the differential light threshold at the border of absolute 307
scotomas. Comparison between glaucomatous visual field defects and blind spots. Ophthalmology. 308
1991;98:1529-32. 309
18. Smith SD, Katz J, Quigley HA. Analysis of progressive change in automated visual fields in 310
glaucoma. Invest Ophthalmol Vis Sci. 1996;37:1419–1428. 311
19. Tattersall CL, Vernon SA, Menon GJ. Mean deviation fluctuation in eyes with stable Humphrey 312
24-2 visual fields. Eye. 2007;21:362-6. 313
20. Werner EB, Petrig B, Krupin T, Bishop KI. Variability of automated visual fields in clinically 314
stable glaucoma patients. Invest Ophthalmol Vis Sci. 1989;30;1083–1089. 315
316
317
318

18
ACKNOWLEDGEMENTS 319
We are very grateful to Dr. Paolo Brusini and Dr. Marco Zeppieri for their valuable suggestions in 320
study design. 321
322
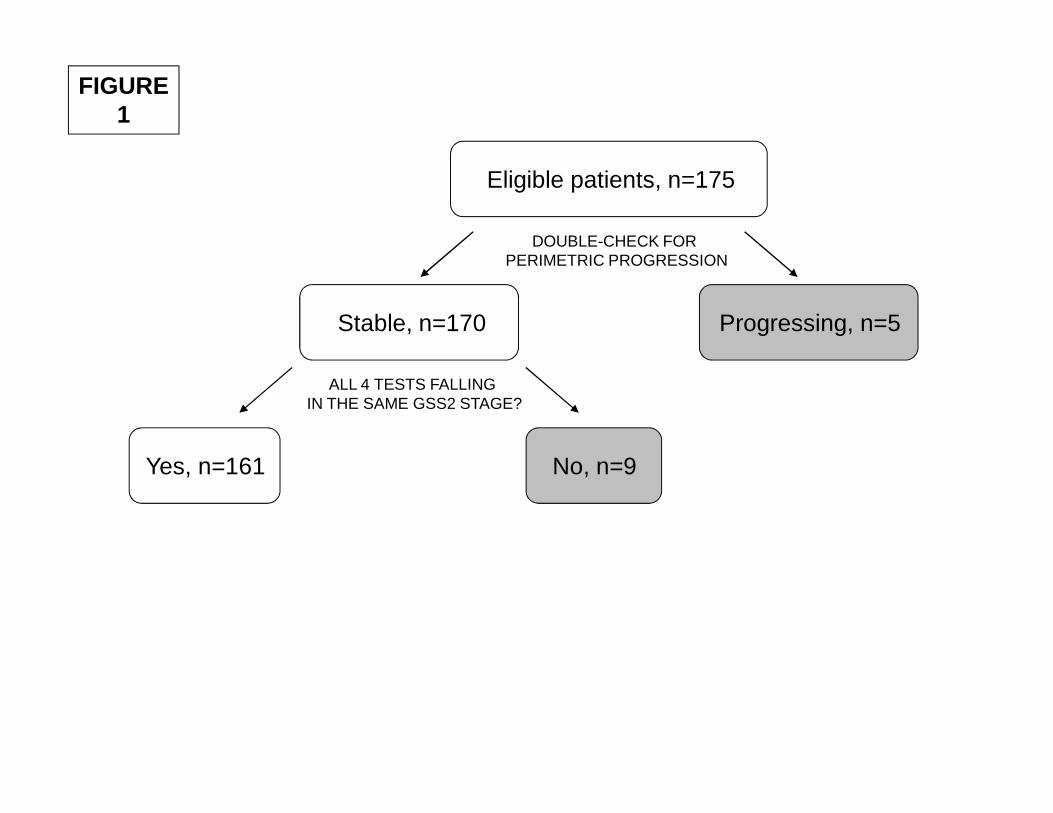
FIGURE1
Eligible patients, n=175
Stable, n=170 Progressing, n=5
DOUBLE-CHECK FOR PERIMETRIC PROGRESSION
Yes, n=161 No, n=9
ALL 4 TESTS FALLING IN THE SAME GSS2 STAGE?

y = -0.0065x2 - 0.1719x + 1.9054
R2 = 0.30
0
1
2
3
4
5
6
-35 -30 -25 -20 -15 -10 -5 0 5
Mean defect, dB
Long
-ter
m fl
uctu
atio
n, d
B
FIGURE2
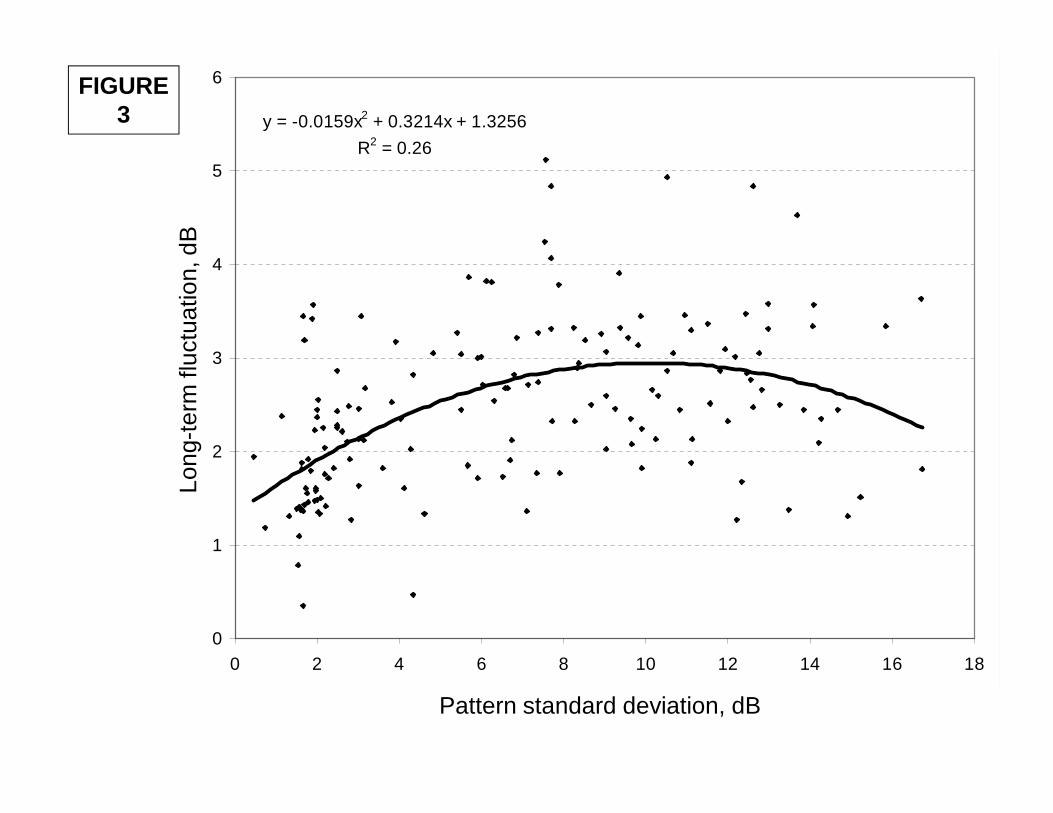
y = -0.0159x2 + 0.3214x + 1.3256
R2 = 0.26
0
1
2
3
4
5
6
0 2 4 6 8 10 12 14 16 18
Long
-ter
m fl
uctu
atio
n, d
B
FIGURE3
Pattern standard deviation, dB
Long
-ter
m f
luct
uatio
n, d
B
FIGURE4
S0 S1 S2 S3 S4 S5 G M L
5
4
3
2
1