long-term mortality in hospitalized patients with
TRANSCRIPT

Long-term mortality in hospitalized patients with
community-acquired pneumonia.
Supervised by:
Alberto Capelastegui Sáiz
Jose María Quintana López
Ane Uranga Echeverría
2016
PhD Thesis
(c)2017 ANE URANGA ECHEVERRIA
brought to you by COREView metadata, citation and similar papers at core.ac.uk
provided by Archivo Digital para la Docencia y la Investigación


Nire bizitzari zentzua ematen dion pertsonari, Xarles. Ezagutu nizun momentu horretan maite izan nizulako, gaur
maite zaitudalako eta beti maite izango zaitudalako.


“La alegría está en la lucha, en el esfuerzo, en el sufrimiento
que supone la lucha y no en la victoria”
Mahatma Gandhi


ACKNOWLEDGMENT Me gustaría agradecer en primer lugar al Dr. Alberto Capelastegui, al que considero
mi mentor en medicina, por enseñarme, entenderme e inspirarme cada día, lo que sin
duda motiva mi admiración por su persona y por lo que siempre me sentiré en deuda
con él.
Mi más sincero agradecimiento al Dr. Jose María Quintana por su tiempo, dedicación
y rigor académico. A él le debo mi desarrollo y formación como profesional
investigador. A Urko Aguirre he de agradecer y reconocer su empeño, tiempo y
esfuerzo en este trabajo.
A mis compañeros de trabajo del Hospital de Galdakao-Usansolo, a todo ellos, por su
colaboración y trabajo en equipo. Me gustaría hacer una mención especial al Dr.
España, por sus contribuciones, dedicación y por adentrarme en el mundo de las
infecciones.
A Isabel Urrutia y Silvia Pascual, por ser como sois, estar ahí y formar parte de mi
vida.
To Louisville team, for guiding me in my research. Your ideas, help and
encouragement have been absolutely invaluable.
A Xarles, por inflar globos conmigo cada día. Por todo el tiempo que esta tesis nos ha
robado y el que nos queda por compartir.
A toda mi familia, la peña txoko, por haberme apoyado siempre. A mi padre, por
consolarme en los malos momentos y exigirme en los buenos. A mi madre, por
preocuparse, sufrir y disfrutar con mis logros. A mis hermanas, amigas a las que
quiero, admiro y adoro. A tia Bego y Emilio, por ser parte de nuestra pequeña familia.
A mi kuadri, por hacerme reír y haberme enseñado el sentido de la amistad. A mis
amigas del alemán, por quererme pase lo que pase y por todas esas conversaciones
interminables.


ABBREVIATIONS
AC Alcohol consumption
ATS/IDSA American Thoracic Society and Infections Diseases Society of America
AUC Area under the curve
BT Body temperature
BUN Blood urea nitrogen
CAP Community-acquired pneumonia
CAD Coronary artery disease
CHF Congestive heart failure
CI Confidence intervals
COPD Chronic pulmonary obstructive disease
CPR Clinical prediction rules
CRP C-reactive protein
CURB-65 Confusion, urea, respiratory rate, blood pressure and age ≥ 65
CVD Cerebrovascular disease
DBP Diastolic blood pressure
HCAP Healthcare associated pneumonia
HR Heart rate
HR Hazard ratio
ICU Intensive care unit
IRCU Intermediate Respiratory Care Unit
OR Odds ratio
PCT Procalcitonin
ProADM Proadrenomedullin
PSI Pneumonia severity index
RR Respiratory rate
SCAP Severe community-acquired pneumonia index
SEPAR Spanish Pulmonology and Thoracic Surgery Society
SBP Systolic blood pressure


CONTENTS
1. ABSTRACT 1 1.1 Laburpena 7 1.2 Resumen 13
2. INTRODUCTION 19 2.1 Definition 21 2.2 Epidemiology 23 2.3 Long-term prognosis of community-acquired pneumonia 24
2.3.1 Magnitude of the problem 24 2.3.2 Causes of mortality 28 2.3.3 Predictive factors of mortality 29
2.4 Biomarkers 34 2.4.1 Introduction 34 2.4.2 Etiology and adjustment of antibiotic treatment 38 2.4.3 Severity and prognosis 40
2.5 Clinical prediction rules 43 2.5.1 Introduction 43 2.5.2 CPR for assessment of CAP severity. 45
3. JUSTIFICATION 49
4. HYPOTHESES AND OBJECTIVES 53 4.1 Hypotheses 55 4.2 Objectives 56
5. METHODS 57 STUDY I. ONE-YEAR MORTALITY PREDICTION AMONG HOSPITALIZED PATIENTS
WITH CAP IN GALDAKAO-USANSOLO HOSPITAL. 59 5.1. Study design 59 5.2. Setting and study population 59 5.3 Patient selection criteria 60 5.4 Sample size estimation 60 5.5 Missing data 61 5.6 Data collection 61 5.7 Ethics and confidentiality issues 61 5.8 Definitions of variables 62 5.9 Statistical analysis 65

STUDY II. ROLE OF BIOMARKERS FOR ONE-YEAR MORTALITY PREDICTION AMONG
HOSPITALIZED PATIENTS WITH CAP IN GALDAKAO-USANSOLO HOSPITAL. 67 5.1. Study design 67 5.2. Setting and study population 67 5.3 Patient selection criteria 67 5.4 Sample size estimation 68 5.5 Missing data 69 5.6 Data collection 69 5.7 Ethics and confidentiality issues 69 5.8 Definitions of variables 70 5.9 Statistical analysis 70
STUDY III. ONE-YEAR MORTALITY PREDICTION AMONG HOSPITALIZED PATIENTS
WITH CAP IN THE VETERANS AFFAIRS MEDICAL CENTER OF LOUISVILLE,
KENTUCKY. 72 5.1. Study design 72 5.2. Setting and study population 72 5.3 Patient selection criteria 73 5.4 Missing data 74 5.5 Data collection 74 5.6 Ethics and confidentiality issues 75 5.7 Definitions of variables 75 5.8 Statistical analysis 76
6. RESULTS 79 STUDY I. ONE-YEAR MORTALITY PREDICTION AMONG HOSPITALIZED PATIENTS
WITH CAP IN GALDAKAO-USANSOLO HOSPITAL. 81 6.1 Descriptive statistics. 81 6.2 Univariate analysis 87 6.3 Multivariate analysis 91 6.4 Score development 92 6.5 Validation, discrimination, calibration and classification measures 95 6.6 Comparison with other scores 97
STUDY II. ROLE OF BIOMARKERS FOR ONE-YEAR MORTALITY PREDICTION AMONG
HOSPITALIZED PATIENTS WITH CAP IN GALDAKAO-USANSOLO HOSPITAL. 107 6.1 Descriptive statistics 107 6.2 Biomarkers and risk scores predictive accuracy for one-year mortality, after the
exclusion of deaths within 15 days 113

6.3 Biomarkers and risk scores predictive accuracy for one-year mortality, with the
inclusion of all deaths within one year 116 6.4 Role of serial biomarkers levels in one-year mortality prediction 119
STUDY III. ONE-YEAR MORTALITY PREDICTION AMONG HOSPITALIZED PATIENTS
WITH CAP IN THE VETERANS AFFAIRS MEDICAL CENTER OF LOUISVILLE,
KENTUCKY. 122 6.1 Descriptive statistics 122 6.2 Univariate analysis 125 6.3 Multivariate analyses and score development 127
7. DISCUSSION 131 7.1 Overall interpretation of results 133 7.2. Comparison with the literature 135 7.3 Strengths and limitations 151 7.4 Potential clinical use and future research 152
8. CONCLUSIONS 153 STUDY I. One-year mortality prediction among hospitalized patients with CAP in Galdakao-
Usansolo Hospital. 154 STUDY II. Role of biomarkers in one-year mortality prediction among hospitalized patients
with CAP in Galdakao-Usansolo Hospital. 156 STUDY III. One-year mortality prediction among hospitalized patients with CAP in the
Veterans Affairs Medical Center of Louisville, Kentucky. 157
9. REFERENCES 159
10. APPENDIX 175 10.1 PSI score. 177 10.2 CURB65 score. 179 10.3 SCAP score. 180


1
1. ABSTRACT


Abstract
3
Community-acquired pneumonia (CAP) is a major problem of public health with high
morbimortality. The annual incidence ranges between two and eight cases per
thousand inhabitants. Together with influenza, it was the seventh cause of mortality in
the United States in 2008. Short-term mortality rates are high in patients admitted for
CAP. It is even higher in those admitted to intensive care units, and up to 50% if there
is a need for vasopressors. On the other hand, long-term mortality rates remain high,
with 8%, 21%, and 36% within 90 days, one year, and five years, respectively.
Several authors have created severity scores in order to predict short-term mortality.
Fifteen-day mortality after diagnosis has been related to acute episodes. However, the
relationship between pneumonia and long-term mortality is controversial. Patients
admitted for pneumonia have exhibited higher long-term mortality rates than those
admitted for other reasons. In addition, various studies have tried to identify predictive
factors for long-term mortality. To date, severity scores for predicting one-year
mortality in these patients have not been created. The main goal of this thesis was to
assess one-year mortality in patients admitted for CAP. To that end, three studies
were conducted with three different cohorts, and one-year mortality was the common
independent variable in all those cases.
Firstly, a cohort of patients aged over 18 years admitted for CAP to the Galdakao-
Usansolo Hospital was assessed from January 2001 to July 2009. One-year mortality
after diagnosis was assessed using the computer support of the Public Health System
of the Basque country. In this sense, since it was long-term mortality and, in order to
alleviate the impact of the factors associated with short-term mortality, patients who
had died up to 15 days after diagnosis were excluded from the study.
A total of 2,351 patients were included and divided into two cohorts, a derivation
cohort with 1,208 patients and a validation cohort with 1,143 patients. After one year,
250 (10.63%) patients had died. Clinically relevant variables that could be related to
one-year mortality were assessed, and those that were statistically significant in the
univariate analysis were included in the multivariate analysis.
Age >80 years, heart failure, dementia, respiratory rate ≥30 breaths per minute, and
blood urea nitrogen (BUN) >30 mg/dL were significantly related to one-year mortality.

LONG‐TERM MORTALITY IN HOSPITALIZED PATIENTS WITH COMMUNITY‐ACQUIRED PNEUMONIA
4
A predictive model was created with a weighted score (one-year CAPSI) including five
variables in order to predict one-year mortality. Patients aged over 80 years received
four points, heart failure two points, dementia six points, respiratory rate ≥30breaths
per minute two points, and BUN >30 mg/dL three points. Considering one-year CAPSI
as a continuous variable, the C-index was 0.76 in the derivation cohort and 0.77 in the
validation cohort. Thus, for each increase of one unit on the score, patients exhibited a
hazard ratio of 1.24 for one-year mortality. When the score was categorized into three
classes, patients of the derivation cohort that had between four and five points
exhibited a hazard ratio for one-year mortality of 3.19, whereas those with more than
five points exhibited a hazard ratio of 9.91. The existing scores for short-term mortality
risk were compared with the new one-year CAPSI model for the prediction of one-year
mortality. This new model showed better predictive ability than CURB65 and SCAP
score.
In the second section of the present study, the role of some biomarkers for prediction
of one-year mortality were assessed. In addition, the values of serial measurement of
biomarkers for this prediction were assessed. Systemic inflammation in pneumonia
has been discussed in recent years and the role of biomarkers has been crucial in
these studies. It seems clear that patients with severe pneumonia exhibit higher levels
of biomarkers at the time of diagnosis. These biomarkers can be used to identify those
patients with high probability of developing complications or even dying. However,
some biomarkers go beyond and are useful to even identify long-term mortality.
231 patients admitted for CAP between June 2008 and July 2009 were included and
blood tests were obtained to study the biomarkers at the time of diagnosis and after 3-
5 days when possible. The biomarkers assessed were C-reactive protein,
procalcitonin, and proadrenomedullin (proADM). In the same way as in the previous
study, those patients who had died within 15 days after diagnosis were excluded from
the study (one-year mortality rate of 10.39%). High proADM levels at the time of
diagnosis were significantly related to severity of the disease measured by means of
the different prediction scores. Risk scores showed a high predictive accuracy for one-
year mortality. However, biomarkers showed poor predictive accuracy for one-year

Abstract
5
mortality and were not able to improve the prediction ability of risk scores for one-year
mortality when added to the scores.
In a subanalysis carried out including all deaths up to one year, proADM showed the
best predictive ability for one-year mortality (C-index 0.71) and, when added to the
one-year CAPSI, the prediction ability of the score was significantly improved. On the
other hand, the role of changes in proADM values from admission to 3-5 days was
assessed. Once it was adjusted by proADM value at baseline, a decrease in proADM
from the first 24 hours to 3-5 days was associated with a significantly reduced risk of
death at one year. However, once it was also adjusted by severity of disease and
proADM baseline value, only when all deaths within one year were analyzed was
associated with a significantly reduced risk of death at one year, meaning that, based
on our sample, its predictive ability is mainly for short-term mortality.
Finally, one-year mortality was assessed in an external cohort of patients with
pneumonia. To that end, I spent three months in a center of international reference for
pneumonia in the "Division of Infectious Diseases at the University of Louisville School
of Medicine". There, I assessed retrospectively one-year mortality from a cohort of
patients admitted for CAP at the “Louisville Veterans Affairs Medical Center” from
June 2001 to November 2006. Since this cohort of patients consisted of war veterans
with very particular characteristics, it was not possible to apply the score used in the
first study and I carried out a specific analysis in this cohort.
455 patients admitted for CAP at the Louisville Veterans Affairs Medical Center were
included in the analysis and the clinically relevant variables and their relationship with
one-year mortality was assessed. A genetic algorithm was used to identify the best
predictive model for one-and five-year mortality. It was found that 121 (27%) patients
had died within one year, whereas 265 (58%) had died after five years. A model with
the inclusion of the variables age greater than 75 years, cancer, heart failure, albumin
below 3.5 mg/dL, <100,000/L or >400,000/L platelets, and dementia exhibited a
predictive power of 0.77 (AUC) for one-year mortality. However, that same model
showed little predictive power for five-year mortality.

LONG‐TERM MORTALITY IN HOSPITALIZED PATIENTS WITH COMMUNITY‐ACQUIRED PNEUMONIA
6
In summary, short-term mortality in hospitalized patients with CAP has been widely
assessed while less is known about long-term prognosis. The aim of this thesis was to
assess one-year mortality in hospitalized patients with CAP. An easy-to-use risk score
(one-year CAPSI) for one-year mortality was created based on the presence of five
variables with a high predictive accuracy. On the other hand, proADM was useful,
based on our sample, for the prediction of one-year mortality; though mainly explain
by short-term mortality. In addition, a decrease in proADM from the first 24 hours to 3-
5 days, adjusted by proADM value at baseline, was associated with a significantly
reduced risk of death at one year. Finally, a specific score for one-year mortality was
created for a cohort of patients admitted for CAP at the Louisville Veterans Affairs
Medical Center. Future research should focus on the impact of inflammation on CAP
prognosis at long-term follow-up.

7
1.1 LABURPENA

Abstract
9
Komunitatean hartutako pneumonia (KHP) erikortasun eta hilkortasun handiko osasun
publiko arazo garrantzitsua da. Urteko inzidentzia bi eta zortzi 1000 biztanlekoa da.
Estatu Batuetan, gripearekin batera, zazpigarren heriotza kausa izan zen 2008an. Epe
laburreko hilkortasuna KHP daukaten paziente ospitaleratuetan altua da eta are
gehiago zainketa intentsiboko unitate batean ospitaleratzean, droga basoaktiboen
beharra dagoenean hilkortasun tasa %50 igotzen delarik. Epe luzeko hilkortasuna ere,
altua izaten jarraitzen du %8, %21 eta %36a, 90 egun ondoren, urte batera eta bost
urtetara, hurrenez hurren.
Hainbat autorek larritasun eskalak garatu dituzte epe laburreko hilkortasunerako.
Zentzu berean, lehengo 15 egunetan ematen diren heriotzak prosezu akutuarekin
erlazionatu dira. Hala ere, pneumonia eta epe luzeko hilkortasunaren arteko erlazioa
ez dako batere argi. Badirudi, pneumoniagatik ospitaleratutako pazienteek, hilkortasun
tasa handiagoa dutela beste arazoengatik ospitaleratutakoak baino. Badira egile
batzuk, epe luzeko hilkortasun aurresaleak identifikatzen saitu direnak. Hala ere,
urtebeteko hilkortasuna aurreikusteko eskala espezifikoak ez dira garatu orain arte.
Tesi honen helburu nagusia KHP daukaten paziente ospitaleratuetan urtebeteko
hilkortasuna aztertzea izan zen. Horretarako, hiru azterketa desberdin garatu ziren,
hiruretan urtebeteko hilkortasuna aldagai independientea izanik.
Lehenengo eta behin, 18 urte baino gehiagoko KHP zuten paziente ospitaleratuak
urtarrileko 2001tik uztaileko 2009ra aztertu ziren. Urtebeteko hilkortasuna zehaztu zen
ordenagailu bidezko euskal sistemaren bidez. Prozesu akutuak hilkortasunaren gain
duen eragina ekiditziko, lehenego 15 egunetan eman ziren heriotza guztiak baztertu
egin ziren.
2.351 paziente sartu ziren eta lagina bitan zatitu zen, 1.208 paziente deribazio
laginean eta 1.143 paziente balidazio laginean hain zuzen ere. 250 (10.63%) paziente
urtebeteko epean hil ziren. Klinikoki urtebeteko hilkortasunarekin garrantzia zuten
aldagaiak aztertu ziren eta estadistikoki signifikatiboak izan zirenak, analisi
multibariantean sartu ziren.
Adina > 80 urte, bihotz-gutxiegitasuna, dementzia, arnas tasa ≥ 30 arnas minutuko eta
BUN > 30 mg/dL urtebeteko hilkortasunarekin estadistikoki erlazionatu zen. Bost

LONG‐TERM MORTALITY IN HOSPITALIZED PATIENTS WITH COMMUNITY‐ACQUIRED PNEUMONIA
10
aldagaietan oinarritutako urtebeteko hilkortasunerako eredu iragarpen bat garatu zen
(one-year CAPSI). 80 urte baino gehiago zutenek lau puntu jasotzen zituzten, bihotz-
gutxiegitasuna zutenek puntu bi, dementzia zutenek 6, arnas tasa ≥ 30 arnas
minutuko zuetenek bi puntu eta BUN > 30 mg/dL zutenek berriz, hiru puntu. One-year
CAPSI, etengabeko aldagaia bezela hartuta, C-indexa 0.76 izan zen deribazio
laginean eta 0.77 balidazioan. Eskala puntu gehikuntza bakoitzeko, urtebeteko
hilkortasun arriskua 1.24 (HR) zen. Eskala hiru zatitan banatzerakoan, hiru eta bost
puntu arteko puntuazioa jasotzen zuten pazienteen urtebeteko hilkortasun arriskua
3.19 (HR) zen, bost puntu baino gehiago jasotzen zutenenen arriskua berriz, 9.91(HR)
zen. One-year CAPSI, egungo eskalekin konparatu egin zen eta CURB65 eta SCAP
eskalak baino iragarpen ahalmen handiagoa erakutsi zuen urtebeteko
hilkortasunerako.
Bigarren atal honetan, biomarkadore batzuk aztertu ziren urtebeteko iragarpenean.
Azkenengo boladan, pneumonian ematen den inflamazioa asko neurtu da eta
biomarkadoreak garrantzi handikoak bilakatzen ari dira arlo honetan. Biomarkadoreen
erabilera gaixotasunaren larritasuna neurtzeko eta epe laburreko konplikazioak
iragartzeko argi dago. Gainera, badira biomarkadoreak epe luzeko pronostikoan ere
erabilgarriak direnak.
Ekainaren 2008tik uztailaren 2009ra odol laginak lortu ahal izan ziren eta KHP zuten
231 paziente ospitaleratuak aztertu ziren. Odol laginak diagnostikoaren momentuan
lortzen ziren eta hirugarren eta bostgarren egunen artean ere ahal izanez gero.
Aztertutako biomarkadoreak proteina C erreaktiboa, prokaltzitonina eta
proadrenomedulian (proADM) izan ziren. Lehenengo estudioan bezala, lehenengo 15
egunetako heriotzak analisitik kanpo geratu ziren (10.39%).
ProADM balio altuak gaixotasunaren larritasunarekin, larritasun eskalen bidez neurtua
erlazionatu zen. Larritasun eskalak urtebaterako iragarpen balio handia erakutsi
zuten. Biomarkadoreak, aldiz, iragarpen baxua izan zuten urtebeterako, gauza bera
gertatzen zelarik behin biomarkadoreak eskalei gehituta. Aldi berean, beste analisi bat
egin zen diagnostiko momentutik urtebeterarte heriotza guztiak barne hartuta.
ProADM urtebeterako iragarpen altua izan zuen C-index 0.71rekin eta are gehiago,

Abstract
11
one-year CAPSIri gehitzean, eskalaren iragarpen balioa handitu egin zen. Beste alde
batetik, proADMren aldaketak aztertu ziren diagnostiko momentutik hiru-bostgarren
egunera. Behin ProADM lehendabiziko balioagatik egokituta, proADM murrizketa
diagnostikoko momentutik hirugarren-bostgarren egunera, urtebeteko hilkortasunaren
murrizketarekin estadistikoki erlazionatu zen. Hala ere, lehendabiziko balioagatik
aparte gaixotasunaren larritasunagatik egokitzerakoan, urtebeteko hilkortasunaren
murrizketa heriotza guztiak barne zituen analisian bakarrik frogatu ahal izan zen.
Ondorioz, behintzat gure paziente laginean, proADMak urtebeteko iragarpen balioa
dauka baina batez ere, epe laburreko hilkortasuna dela-eta.
Azkenik, KHP zuten ospitaleratutako pazienteen urtebeteko hilkortasuna kanpoko
lagin batean aztertu zen. Horretarako, hiru hile egon nintzen pneumonia arloan
internazionalki ezaguna den zentru batean, Division of Infectious Diseases at the
University of Louisville School of Medicine. Han nengoela, erretrospektiboki aztertu
genituen 2001eko ekainatik 2006ko azarorarte KHPgatik ospitaleratutako pazienteak
Louisvilleko Veterans Affairs Medical Centereko ospitalean. One-year CAPSI lagin
honetan erabilia izan zenean, huts egin zuen urtebeteko iragarpenean, batez ere,
laginen arteko desberdintasunengatik. Izan ere, guda zibilean izandako
pertsonentzako ospitalea da eta horrek, ezaugarri espezifikoak izatea eragiten bait du.
KHP rekin Kentuckyn, Louisvilleko Veterans Affairs Medical Centerean
ospitaleratutako 455 paziente aztertu ziren. Algoritmo genetiko bat erabili zen
urtebeteko eta bost urteko hilkortasunerako eredu iragarpen onenak zehazteko. 121
(%27) eta 265 (%58) paziente hil ziren urtebetera eta bost urtetara, hurrenez hurren.
Adina > 75 urte, minbizia, bihotz-gutxiegitasuna, dementzia, albumina <3.5 mg/dL eta
plaketak <100,000/L o >400,000/L kontuan hartutako ereduak, iragarpen balio handia
izan zuen, 0.77 (AUC). Hala ere, eredu berak huts egin zuen bost urteko hilkortasuna
iragartzeko erabilia izan zenean.
Laburbilduz, epe laburreko hilkortasuna luze eta zabal ikertu da, epe luzeko
hilkortasunari buruz, berriz, gutxiago dakigu. Tesi honen helburu nagusia KHPgatik
opstaleratutako pazienteetan urtebeteko hilkortasuna aztertzea izan zen. Horretarako,
errez erabiltzeko eta bost aldagietan oinarritutako potentzia handiko iragarpen eredu
bat garatu zen. Beste alde batetik, proADM erabilgarria izan zen urtebeteko
hilkortasuneko iragarpenean, batez ere, epe laburreko hilkortasunagatik azalduta.

LONG‐TERM MORTALITY IN HOSPITALIZED PATIENTS WITH COMMUNITY‐ACQUIRED PNEUMONIA
12
ProADM murrizketa diagnostikoaren momentutik hirugarren-bostgarren egunera,
behin proADM hasierako balioagatik egokituta, urtebeteko hilkortasunaren
murrizketarekin erlazionatu zen. Bukatzeko, urtebeterako iragarpen eredu espezifikoa
garatu zen Kentucky, Louisvilleko Veterans Affairs Medical Centerean. Etorkizuneko
ikerketek inflamazioaren eragina pneumoniaren epe luzeko pronostikoarengan aztertu
behar zuketeen.

13
1.2 RESUMEN


Abstract
15
La neumonía adquirida en la comunidad (NAC) es un importante problema de salud
pública con una elevada morbi-mortalidad. La incidencia anual oscila entre dos y ocho
por cada 1000 habitantes. En Estados Unidos, junto con la gripe, fue la séptima causa
de mortalidad en 2008. La mortalidad a corto plazo de los pacientes ingresados por
NAC es elevada siendo aún mayor en aquellos pacientes que requieren un ingreso en
una unidad de cuidados intensivos y de hasta un 50 % en los que necesitan drogas
vasoactivas. Más allá, la mortalidad a largo plazo persiste siendo elevado a los 90
días, al cabo de uno y cinco años con tasas del 8%, 21% y 36%, respectivamente.
Diversos autores han elaborado escalas de gravedad para mortalidad a corto plazo.
En este sentido, la mortalidad a 15 días tras el diagnóstico se ha relacionado con el
episodio agudo. Sin embargo, la relación entre la neumonía y la mortalidad a largo
plazo no está del todo esclarecida. Los pacientes ingresados por neumonía padecen
una mortalidad a largo plazo mayor que aquellos ingresados por otros motivos.
Algunos autores han tratado de identificar los factores predictores de mortalidad a
largo plazo. Sin embargo, hasta la fecha, no se han elaborado escalas de predicción
específicas para la mortalidad a un año en estos pacientes. El principal objetivo de
esta tesis fue evaluar la mortalidad a un año en pacientes ingresados por NAC. Para
ello, se llevaron a cabo tres estudios en tres diferentes cohortes siendo la mortalidad
a un año la variable independiente en todos los casos.
En primer lugar, se evaluó una muestra de pacientes mayores de 18 años ingresados
por NAC desde enero de 2001 hasta julio de 2009. Se determinó la mortalidad a un
año mediante el soporte informático del sistema vasco de salud. Al tratarse de
mortalidad a largo plazo y tratando de evitar el impacto del episodio de agudo sobre la
mortalidad, se excluyeron los muertos de los 15 primeros días desde el diagnóstico.
Se incluyeron un total de 2.351 pacientes dividiéndose la muestra en dos, una
muestra derivación con 1.208 paciente y otra validación con 1.143. 250 (10.63%)
pacientes fallecieron al cabo de un año. Se evaluaron las variables clínicamente
relevantes que pudieran estar asociadas con la mortalidad a un año y aquellas que
resultaron estadísticamente significativas en el análisis univariante se incluyeron en el
análisis multivariante.

LONG‐TERM MORTALITY IN HOSPITALIZED PATIENTS WITH COMMUNITY‐ACQUIRED PNEUMONIA
16
La edad >80 años, la insuficiencia cardíaca, la demencia, la frecuencia respiratoria
≥30 respiraciones por minuto y el BUN>30 mg/dL se relacionaron de forma
significativa con la mortalidad a un año. Se elaboró un modelo de predicción para la
mortalidad a un año mediante una escala ponderada (one-year CAPSI) basada en
cinco variables. Aquellos pacientes mayores de 80 años obtenían cuatro puntos, la
insuficiencia cardíaca dos puntos, la demencia seis puntos, la la frecuencia
respiratoria ≥30 respiraciones por minuto dos puntos y el BUN>30 mg/dL tres puntos.
Considerando one-year CAPSI en su forma continua, presentó un C-index de 0.76 en
la muestra derivación y de 0.77 en la muestra validación. Por cada incremento en un
punto en la escala, los pacientes presentaban un hazard ratio de 1.24 para la
mortalidad a un año. Al categorizar la escala en tres clases, aquellos pacientes de la
muestra derivación que obtenían entre tres y cinco puntos, presentaban un una
probabilidad 3.19 (HR) veces mayor de muerte al cabo de un año, mientras que en
aquellos con más de cinco puntos era 9.91(HR) veces mayor. Se comparó one-year
CAPSI con las escalas existentes en la actualidad en su poder predictivo para la
mortalidad a un año, siendo one-year CAPSI superior que las escalas CURB65 y
SCAP.
En la segunda parte de este trabajo, se evaluó el papel de algunos biomarcadores
para la predicción de mortalidad a un año. Además, se pudo evaluar el valor de los
biomarcadores obtenidos en el seguimiento para la mortalidad a un año.
Recientemente, se ha estudiado la inflamación sistémica en la neumonía con un
papel primordial de los biomarcadores. Parece claro que niveles elevados de ciertos
biomarcadores se relacionan con una mayor gravedad de la neumonía y de ahí su
utilidad para la detección de complicaciones o la muerte. Sin embargo, algunos
biomarcadores van más allá pudiendo incluso predecir la mortalidad a largo plazo.
Se analizaron 231 pacientes con diagnóstico de NAC entre junio de 2008 y julio de
2009 en los que se pudo obtener muestras sanguíneas para el análisis de
biomarcadores en el momento del diagnóstico y a los tres cinco días en algunos de
ellos. Los biomarcadores analizados fueron la proteína C reactiva, la procalcitonina y
al proadrenomedulina (proADM). De la misma manera que en el primer estudio, se

Abstract
17
excluyeron los pacientes fallecidos en los 15 primeros días desde el diagnóstico
(10.39%).
Niveles elevados de proADM se relacionaron de forma significativa con la gravedad
en el momento del diagnostico medido por las escalas de gravedad. Las escalas de
gravedad mostraron una elevada capacidad predictiva para la mortalidad a un año.
Sin embargo, los biomarcadores presentaron un escaso poder predictiva para la
mortalidad a un año y tras añadir la proADM a las escalas, la capacidad predictiva no
mejoró. En un subanálisis realizado incluyendo todos los muertes desde el
diagnóstico hasta el año, la proADM fue el biomarcador que mejor predijo la
mortalidad a un año con un C-index de 0.71. Asimismo, al añadirlo a one-year CAPSI
la capacidad predictiva mejoró significativamente. Por otro lado, se evaluó el papel del
cambio de los niveles de proDAM desde el momento del diagnóstico a los 3-5 días.
Tras ajustar por el valor de proADM en el momento del diagnóstico, una reducción de
los niveles de proADM desde el diagnóstico a los 3-5 días se asoció de forma
significativa con una reducción de la mortalidad a un año. Sin embargo, tras ajustar
por gravedad de la enfermedad además de por el valor basal de proADM, únicamente
cuando todos los muertos fueron incluidos se asoció con una disminución de la
mortalidad a un año. Por lo tanto, basándose en nuestra muestra, la capacidad
predictiva de mortalidad de la proADM consiste principalmente en la predicción a
corto plazo.
Por último, se evaluó la mortalidad a un año en una muestra externa de pacientes con
NAC. Para ello, realicé una estancia de tres meses en un centro de referencia
internacional en neumonías, Division of Infectious Diseases at the University of
Louisville School of Medicine. Una vez allí, evalué de forma retrospectiva la
mortalidad a un año de una muestra de pacientes ingresados por NAC desde junio de
2001 a noviembre de 2006, en el hospital “Veterans Affairs Medical Center of
Louisville”, en Louisville, Kentucky. Se trató de replicar one-year CAPSI en dicha
muestra sin éxito por tratarse de una muestra muy peculiar con pacientes veteranos
de guerra con características sociodemográficas y clínicas muy específicas.
Se analizaron 455 pacientes ingresados por NAC en Veterans Affairs Medical Center
de Louisville, Kentucky, y se evaluaron las variables clínicamente relevantes con la

LONG‐TERM MORTALITY IN HOSPITALIZED PATIENTS WITH COMMUNITY‐ACQUIRED PNEUMONIA
18
mortalidad a un año. Se utilizó un algoritmo genético para determinar el mejor modelo
predictivo de mortalidad a uno y cinco años. 121 (27%) pacientes fallecieron a un año
y 265 (58%) a los cinco años. Un modelo incluyendo la edad mayor de 75 años, el
cáncer, la insuficiencia cardiaca, demencia, albumina <3.5 mg/dL y plaquetas
<100,000/L o >400,000/L presentaron una capacidad predictiva de 0.77 (AUC). Sin
embargo, el mismo modelo presentó una débil capacidad predictiva para la mortalidad
a los cinco años.
En resumen, la mortalidad a corto plazo en pacientes ingresados por NAC ha sido
ampliamente estudiada mientras que el pronóstico a largo plazo no está del todo
establecido. El objetivo de esta tesis fue evaluar la mortalidad a un año en pacientes
ingresados por NAC. Para ello, se elaboró una escala de fácil implementación basada
en cinco variables con un elevado poder predictivo. Por otro lado, a proADM fue de
utilidad para la predicción de mortalidad a un año aunque principalmente explicado
por la mortalidad a corto plazo. Asimismo, un descenso de los niveles de proADM
desde el momento del diagnóstico a los 3-5 días, ajustado pro el valor basal de la
proADM, se asoció con una reducción de la mortalidad a un año. Finalmente, se
elaboró una escala específica para la mortalidad a un año en una muestra de
pacientes ingresados por NAC en Veterans Affairs Medical Center de Louisville,
Kentucky. Las investigaciones futuras deberían centrar sus esfuerzos en el impacto
de la inflamación en el pronóstico a largo plazo de la NAC.

19
2. INTRODUCTION


Introduction
21
2.1 Definition The term “infection” comes from the vernacular language of the Romans: "in-fec" =
enter, mix; and "tion(em)" = action. Derived from the verb "inficere" (stain, corrupt), its
pathological value was used for the first time in medieval Latin. The word “pneumonia”
is a medieval term and comes from the Greek pneumonia or pleumonia. This term
was not used by the Greek physicians but by Plutarch in the second century AD, and
subsequently used in English in 1603.
Pneumonia is defined as an infection of the pulmonary parenchyma associated with
infiltrates on chest radiograph, which did not exist previously, and the presence of two
or more breathing symptoms, such as fever, cough, expectoration, dyspnea, and
pleuritic pain (1). Pneumonia can be caused by different microorganisms giving place
to entities with different physiopathology, clinical picture, and prognosis, which in
addition require specific treatments. Because of the disparity between the different
forms, there are multiple classifications which give rise to a more global view and a
better understanding of the disease (2).
Pneumonia can be classified according to the type of host and can affect
immunocompetent or immunocompromised patients. On the one hand, the underlying
etiologic agent is completely different and factors such as the type of
immunosuppression or its intensity help in the etiologic diagnosis of presumed
pneumonia. Each entity requires a different management with specific therapeutic
attitudes and different prognosis.
When the disease affects the general population, it is called community-acquired
pneumonia (CAP) and differs from that found in patients admitted to hospitals who, in
the majority of cases, have a worse prognosis. The latter is defined as one that
develops in patients hospitalized for more than 48 hours and that was not incubating
at the time of admission. The American guidelines for nosocomial pneumonia
incorporated the term healthcare-associated-pneumonia (HCAP) (3). Risk factors of
this type of pneumonia include pathogens which are multidrug-resistant due a prior
contact with healthcare and that may occur inside or outside hospitals. These risk
factors include patients admitted in the last 90 days, those admitted to nursing homes

LONG‐TERM MORTALITY IN HOSPITALIZED PATIENTS WITH COMMUNITY‐ACQUIRED PNEUMONIA
22
or other centers for chronic disease care, those receiving intravenous treatment at
home, patients on chronic dialysis, and patients in contact with a family member with a
multidrug-resistant pathogen. However, drug resistant pathogens can arise either in
CAP or HCAP and it can be predicted by taking into account the cumulative number of
the risk factors (4).
Another factor to take into account is anatomical involvement, which can be
characterized by lobar pneumonia, bronchopneumonia, necrotizing pneumonia, lung
abscess, or interstitial pneumonia. On the other hand, pneumonia can be classified by
the causal agent. However, in the great majority of cases, the pathogen is not known
at the time of diagnosis, what makes this classification little feasible in the clinical
practice.
Finally, CAP has been classically catalogued as typical or atypical pneumonia
according to the clinical picture and radiological findings. The atypical form usually
emerges in a subtle manner, with little fever, non-productive cough. and with
segmental and interstitial patchy infiltrates. The typical CAP is characterized by the
presence of fever, involvement of the general state, and symptoms attributable to the
respiratory system, such as cough, expectoration, dyspnea, and pleuritic chest pain.
In the same way, bacteria have been defined as typical and atypical. Among others,
Streptococcus pneumoniae, Haemophilus influenza, and Moraxella catarrhalis were
included in the first group. On the other hand, Legionella pneumophila, Mycoplasma
pneumonia, and Chlamydia pneumoniae were included in the atypical group, even
though this classification is in disuse. In addition, most of the time, it is not possible to
identify the etiologic agent. Despite the microbiological definition of CAP, it is usually a
syndromic diagnosis with the presence of a compatible clinical picture and a
pulmonary infiltrate observed on the chest radiograph.
Under normal conditions, there is a balance between the host-microorganism
interaction and, when it is disrupted, the infection occurs with the consequent
activation of defense mechanisms, whose main function is to reduce the damage and
restore homeostasis. Recently, new definitions have been published by "The Third
International Consensus Definitions for Sepsis and Septic Shock", understanding the

Introduction
23
concept of sepsis as the dysfunction of an organ that threatens life as a result of an
aberrant or unregulated host response to the infection (5). In clinical practice, organ
dysfunction can be measured through the Sequential Organ Failure Assessment with
excess mortality greater than 10% in those patients with scoring over 2 points. When
sepsis is combined with vasopressor requirement to maintain a mean arterial pressure
of 65 mmHg or greater and a serum lactate level greater than 2 mmol/L (>18 mg/dL)
in the absence of hypovolemia, it is called septic shock, and the combination of both
conditions is associated with in-hospital mortality greater than 40%.
The severity of these patients has been discussed in the last decade. When CAP is
severe, there is a critical situation characterized by a high short-term mortality rate,
which, in addition, persists with a high long-term mortality rate (5). The early
identification of severe patients with high probability of suffering complications, even in
the long term, is fundamental for the implementation of strategies to improve their
prognosis.
2.2 Epidemiology The incidence ranges between two and eight cases per 1,000 inhabitants a year,
although its real estimate is difficult due to the variability of the information obtained
from studies (7). This incidence increases at the end of life of individuals with
comorbidities and is slightly higher in men (8).
In the United States, the annual incidence in adult patients admitted for CAP was 248
cases for 100,000 inhabitants between 2010 and 2012. This incidence increased with
age, i.e., 630 cases per 100,000 inhabitants (65-79 years) and 1,640 cases per
100,000 inhabitants (≥80 years) (9). A retrospective study conducted in Spain
between 2003 and 2007 with hospitalized patients aged 50 years or older, and
information retrieved from the Minimum Basic Dataset showed an annual incidence of
627 cases per 100,000 inhabitants (10).
CAP is responsible for 5 to 12% of respiratory infections and represents the first
infectious cause that explains hospital admission. At the same time, it is an issue of

LONG‐TERM MORTALITY IN HOSPITALIZED PATIENTS WITH COMMUNITY‐ACQUIRED PNEUMONIA
24
great relevance due to the high direct and indirect costs that it generates (8,10).
Admission rates varies by country, study period time and study design. A study
conducted in Biscay, in the reference area of the Galdakao-Usansolo hospital
covering 300,000 inhabitants, estimated a CAP incidence of 3.1 per 1,000 adults per
year, whereas 43.5% of patients attending the Emergency Department required
hospital admission (11).
Recently, Huang et al. (12) published the cost and use of health resources in the
United States. The study was conducted between 2004 and 2005 and assessed data
of pneumococcal disease in both hospitalized patients and outpatients. The authors
observed four million cases of pneumococcal disease with a direct cost of 2.5 billion
dollars. The greatest severity and, accordingly, the highest cost were observed in
patients aged over 65 years. However, when the authors assessed the loss of work
days and productivity (indirect cost) among patients aged 18 to 50 years, the cost was
equal to that of patients aged over 65 years.
Similarly, a study conducted in Spain showed that the average direct cost for the
treatment of hospitalized patients was 2,332 Euros, whereas for outpatients the
average cost was 698 Euros (13).
2.3 Long-term prognosis of community-acquired pneumonia
2.3.1 Magnitude of the problem CAP is considered a major problem of public health due to its high morbimortality (14).
According to data of the National Statistical Institute, 4,254 men and 3,998 women
died from pneumonia in 1999 in Spain. The mortality rate in 2002 was 19.5 per
100,000 inhabitants, ranking as the ninth cause of death in Spain (15). In 2008,
together with influenza, pneumonia was the seventh cause of mortality in the United
States with 59,000 deaths in that year (16).
To a large extent, mortality depends on the place where the patients are treated. In
outpatients, the rate is less than 3%, in patients admitted to a conventional unit, the

Introduction
25
rate ranges from 5 to 10%, whereas in those patients who require admission to an
intensive care unit amounts to 25% if they require orotracheal intubation and up to
50% if they require vasopressors (17).
Patients with pneumonia have a high risk of complications during the episode, such as
requiring mechanical ventilation and vasopressors, or developing multiorgan failure.
Most studies published to date have studied the relationship between pneumonia and
short-term mortality. This way, some authors affirm that death related to the
pneumonia episode mostly occurs within the first 15 days (18,19).
There are various factors associated with short-term mortality. The most accepted are
etiology, comorbidities and the form of the disease. In most cases, the etiologic
diagnosis is unknown. However, there are factors that can influence in a predominant
manner on the appearance of the microorganism, such as geographic areas, age,
residing in nursing homes, and comorbidities. This way, in those patients with
Pseudomonas aeruginosa pneumonia, mortality ranges around 61%, whereas in
pneumonia caused by enterobacteria mortality will be 35% and in pneumonia
produced by Legionella or Streptococcus pneumoniae 15% (17). However, the most
frequent germ in all series and areas is Streptococcus pneumoniae and, in this case,
severity is influenced by factors such as bacteremia, bacterial load, serotypes,
antimicrobial resistances, and comorbidities (20).
The incidence and severity of CAP is greater in patients with chronic respiratory
diseases, since their capacity to respond to external aggressions is decreased (21).
Similarly, there are various diseases that increase the probability of suffering from
CAP, and some have been associated with a worse prognosis, such as cancer,
neurological diseases, and diabetes mellitus (21).
The factors associated with increased short-term mortality due to pneumonia are
multiple. A meta-analysis conducted by Fine et al. (17) included 33.148 patients and
identified 11 variables associated with increased mortality, namely: male individuals;
advanced age; neurological diseases; neoplasms; diabetes mellitus; hypothermia;
tachypnea; hypotension; leucopenia; bacteremia; and multilobar involvement on chest
radiograph. The global mortality of these patients was 13.7%, and the variables were:

LONG‐TERM MORTALITY IN HOSPITALIZED PATIENTS WITH COMMUNITY‐ACQUIRED PNEUMONIA
26
age; comorbidities; and clinical, analytical, and radiological findings. All these factors
were included in the severity score known as Pneumonia Severity Index (PSI).
Therefore, the short-term prognosis for CAP seems to be well established. However,
there are data indicating that patients who survive a pneumonia episode have a high
mortality rate, even in the medium and long term, with figures of 8, 21, and 36% after
90 days, one year, and five years, respectively (22). Despite the improvement in the
diagnostic methods and the use of new and more effective broad-spectrum antibiotics,
the picture does not seem to have changed substantially.
Often, an acute condition in older adults that requires hospitalization implies a
subsequent clinical worsening. Recently, the need for hospital admission has been
related to a higher mortality rate after one year in patients admitted for any reason. In
this sense, Walter et al. (23) published a study in The Journal of the American Medical
Association in 2001 in which they created an easy procedure to stratify individuals
aged over 70 years into risk groups according to the risk of death after being admitted
to hospital by any cause. The authors assessed a cohort of 3,163 patients and
identified six variables (sex, congestive heart failure, cancer, previous functional state,
creatinine, and albumin) as predictors of one-year mortality with an area under curve
(AUC) of 0.75 in the derivation cohort and 0.79 in the validation cohort. Therefore,
both were over the scores already known and well established for the prediction of
one-year mortality, as the Charlson Index Score or Acute Physiology and Chronic
Health Evaluation (APACHE), with AUC of 0.68 and 0.59, respectively.
Levine et al. (24) created and validated a similar prognostic index without the need for
complementary evidence and using only data obtained from computer support with
similar results, although with lower AUC values. Some authors have gone beyond
creating scores to even predict 4-year mortality in outpatients and obtained good
results.
Kaplan et al. (25) assessed patients admitted for pneumonia and found that in-hospital
mortality rate was the half in the control group compared with the CAP group. One-
year mortality after hospital discharge and adjusted for comorbidities was 33.6%
among those patients who had been discharged with a diagnosis of CAP versus

Introduction
27
24.9% in the control group without CAP (p = 0.001). In the control group, mortality
increased with age and comorbidities; however, mortality in the CAP group persisted
and was significantly more elevated. Bourdon et al. (2010) conducted a 7-year follow-
up assessing 6,971 admitted patients retrospectively, of which 624 had diagnosis of
CAP. Patients admitted for CAP were 40% more likely to die than those admitted for
other reasons with a hazard ratio of 1.4.
Mortensen et al. (22) conducted a study included in the Patient Outcomes in Renal
Transplantation (PORT) study and assessed admitted patients and outpatients (n =
1,555) with a diagnosis of CAP and a 5.9-year follow-up. The authors compared long-
term mortality among those who had survived after 90 days of the episode with a
control group of similar age. They observed that patients with CAP died more
frequently and with significant differences. A recent study assessed a German cohort
and described mortality after a CAP episode within one, five, and seven years with 17,
43, and 53%, respectively, compared with 4, 19, and 24% in a reference cohort with
similar age and sex (26).
In the same vein, Yende et al. (27) assessed patients aged 70 to 79 years admitted to
hospital for various reasons. The authors described that one third of patients admitted
for CAP died after five years. In addition, they observed one-and five-year mortality,
which was similar to mortality in those patients admitted for heart failure,
cerebrovascular disease, or fracture; however, those rates were lower than mortality in
patients admitted for cancer. The authors found an association between admission for
CAP and 5-year mortality, independent of previous comorbidities.
A comprehensive Finnish study conducted during 12 years found that the mortality
rate in survivors to CAP episodes was the double compared to mortality in those
patients who had not suffered pneumonia, and it was even more elevated if the
patients had suffered pneumococcal pneumonia (28).
More recently, Eurich et al. (29) compared 6,078 patients with CAP with 29,402
control patients matched for age, sex and site of treatment with a 10-year follow-up in
Canada. The authors observed a greater mortality rate in the group with pneumonia,

LONG‐TERM MORTALITY IN HOSPITALIZED PATIENTS WITH COMMUNITY‐ACQUIRED PNEUMONIA
28
even when they assessed admitted patients and outpatients with CAP separately and
having excluded patients deceased until the first 90 days.
Therefore, these results make it clear that patients with CAP have increased mortality
rates, also in the long term. However, the influence that the interaction between acute
episodes and the various comorbidities and conditions may exert should be assessed
carefully. Therefore, this disease is considered a major problem of public health and
should be the subject of further investigations in order to optimize its management
and, undoubtedly, improve its prognosis.
2.3.2 Causes of mortality Mortensen et al. (30) reported 208 (9%) deaths after 90 days in a cohort of more than
2,000 patients with CAP from the PORT study. The most frequent intermediate cases
were respiratory failure, cardiac conditions, and infectious diseases in decreasing
order. On the other hand, once the underlying causes of death were assessed,
neurological conditions, malignancies, and cardiac conditions were the most frequent
in decreasing order. Moreover, the authors found that age and aspirations were
predictors of the two types of mortality.
Bruns et al. (26) conducted a prospective observational study assessing patients with
CAP and identified neoplasia as the most frequent cause of death (27%), followed by
chronic obstructive pulmonary disease (19%), and cardiovascular disease (16%).
Indeed, when compared to the general Dutch population, not only patients with CAP
had higher mortality rates after one, five and seven years, but also had four times
increased risk to have chronic obstructive pulmonary disease as their cause of death.
Nevertheless, the fact that patients with chronic obstructive pulmonary disease have a
higher incidence of CAP may lead to bias. In contrast, cardiovascular events have
been postulated to contribute to more tan 30% of deaths in patients with CAP in the
long term (31).
More recently, Adamuz et al. (32) assessed 1,284 patients discharged after a CAP
episode and 7.2% of them died within a year. The authors found that comorbidity

Introduction
29
conditions, rehospitalization within 30 days after discharge, and nursing home
residence were independently associated with one-year mortality after hospital
discharge. More interestingly, they determined causes of death and observed that
infectious diseases were the main reason for one-year mortality, followed by acute
cardiovascular events. Moreover, the mortality rate caused by infectious diseases was
higher during the first six months and decreased progressively after that moment while
cardiovascular events were stable throughout the follow-up.
Therefore, several authors suggest that high long-term mortality rate in patients with
CAP could be due to a persistent inflammatory response after hospital discharge or
even cardiovascular or neoplastic diseases that were not previously known and
emerged after the episode.
2.3.3 Predictive factors of mortality
Age
The number of individuals aged over 65 years has increased in recent years and that
number is expected to rise from 12% in 2000 to 20% in 2030, and even reaching the
double in 2050 (33). In general, the older adult population suffers from a greater
number of comorbidities and the functional status is often poor.
Hedlund et al. (34) suggested that the mortality rate increased after three years of a
CAP episode and was even higher in patients aged over 50 years. However, Bracanti
et al. (35) published a study with 141 patients admitted for CAP comparing different
age groups with the group aged between 18 and 44 years. The differences found for
2-year mortality were not significant. The authors concluded that age was not
associated with mortality and that the important factor was not the chronological age,
but the physiological age.
Numerous articles published afterwards differ from Bracanti’s findings and highlight
age as one of the main predictors of mortality. What still remains to be clarified is the
cut-off point at which age begins to be a risk factor. Some studies use 50 years,

LONG‐TERM MORTALITY IN HOSPITALIZED PATIENTS WITH COMMUNITY‐ACQUIRED PNEUMONIA
30
whereas authors such as Sligl et al. (36) have used 70 years as a cut-off point. In a
Canadian group, in which the authors compared a CAP group with a control group,
they described a lowest absolute rate difference for mortality among patients aged
<25 years, whereas patients aged >80 years had the highest absolute rate difference
(29). However, the hazard ratio was higher in the first group (2.40 vs. 1.42).
Sex and race Most studies point out that the male sex is associated with higher mortality rates
(25,22,37). Similarly, some authors found an alarming difference regarding race, with
increased 2-year mortality rate in black individuals compared with white individuals. In
addition, this difference remained when the reason for admission was another, such
as heart failure or cerebrovascular accident, among others (38).
Healthcare-associated-pneumonia (HCAP) The definition of HCAP includes: patients hospitalized in an acute care hospital for two
or more days within 90 days of infection; resided in a nursing home or long-term care
facility; received recent intravenous antibiotic therapy, chemotherapy or wound care
within the past 30 days of the current infection; attended a hospital or a hemodialysis
clinic; or had a family member with a drug resistant pathogen. Nursing homes and
long-term care facilities have been assessed as risk factors for drug-related problems.
An increasing prevalence of pneumonia caused by drug-related problems have been
identified. The guidelines provided by the American Thoracic Society (ATS) and the
Infectious Diseases Society of America (IDSA) in 2005 proposed a HCAP model in
order to identify the increased risk of drug-related problems in patients from the
community (3). These patients are known to have a worse prognosis, mostly due to
poor functional status and treatment restrictions (39). Patients residing in nursing
homes and long-term care facilities have an increased risk of death due to advanced
age, high number of comorbidities, and poor functional status. Solh et al. (40)
assessed 88 nursing home patients with severe pneumonia confirmed by culture and
showed that both previous use of antibiotics and poor functional status were risk
factors for drug-related problems. In that study, S. aureus was the predominant
isolated pathogen (31%), followed by enteric gram-negative bacilli (28%), and S.

Introduction
31
pneumoniae (25%). Nevertheless, other authors have described similarities in
pathogen distribution between nursing home-acquired pneumonia and CAP (41). Part
of the explanation for this heterogeneity may be the differences found when nursing
homes or skilled nursing facilities are assessed in different countries.
In addition, the definition of HCAP has shown several limitations to identify drug-
related problems in patients with CAP, especially outside the USA. Therefore the
characteristics and functional status of patients classified as "nursing home residents"
may be very different from one country to another.
In order to identify the factors associated with mortality and compare the differences
between CAP and HCAP, Cecere et al. (42) conducted a study with 486 patients
admitted for the two pathologies. Survival after two years was lower in patients aged
under 65 years with HCAP than in patients aged over 65 years with CAP.
Disease severity The majority of the scores created to date were intended to measure short-term
complications. The CURB65 (confusion, urea, respiratory rate, blood pressure, and
age >65) and the PSI score have proven to be useful in the prediction of 30-day
mortality. At the time of making a long-term prognosis, authors such as Sligl and
Johnstone (36,37) identified that those patients with higher PSI scores had greater
one-and five-day mortality rates, respectively. This result may be due to the fact that,
unlike the CURB65, the PSI score includes comorbidities such as heart failure,
cancer, liver disease, kidney disease, and cerebrovascular disease among its
variables. However, the CURB65 and the PSI scores have been recently assessed for
long-term mortality in a 6-year follow-up study conducted with patients with CAP and
the two scores exhibited excellent predictive accuracy, PSI being the best one though
(43). It is worth noting that the two scores include blood urea nitrogen (BUN) among
their variables. BUN has been associated with increased mortality among critically ill
patients, independently of serum creatinine (44). Currently, BUN has not only been
incorporated to risk scores for predicting pneumonia, but also to models for predicting
myocardial infarction (45).

LONG‐TERM MORTALITY IN HOSPITALIZED PATIENTS WITH COMMUNITY‐ACQUIRED PNEUMONIA
32
Capelastegui et al. (46) created a 90-day mortality prognostic index based on pre-
illness functional status measured by Katz index, comorbid conditions measured by
Charlson Index Score, and disease severity measured by CURB65 without
considering age as a variable. Mortensen et al. (22) assessed long-term mortality
among patients included in the Pneumonia Patient Outcomes Research Team (PORT)
cohort study after excluding deaths up to 90 days after occurrence of CAP. The
authors found that age, nursing home residence, and comorbid conditions were more
strongly associated with long-term mortality rather than acute physiologic or laboratory
findings. However, PSI risk classes were significantly associated with decreased long-
term survival in this cohort with 5.9-year follow-up.
Recently, easy-to-use scores such as CURB65 and CRB65 have been compared with
Charlson comorbidity index for one-year mortality prediction after a CAP episode with
disappointing results (47). All the receiver operating characteristic (ROC) curve
analyses showed a weak and comparable performance of the three indexes (AUC
<0.70). However, it is worth noting that these two easy-to-use indexes showed similar
predictive accuracy than the complex comorbidity index.
Other analyses have been proposed to be associated with long-term mortality after a
CAP episode. Bracanti et al. (35) published a study conducted with 141 patients
admitted for CAP and found that hematocrits and comorbidities were predictive factors
of 2-year mortality. This way, it seems that not only comorbidities have an impact on
long-term mortality, but also disease severity per se may have a role in long-term
prognosis.
Comorbidities Multiple comorbidities, such as cerebrovascular disease, cardiovascular disease,
neoplasms, HIV, chronic obstructive respiratory disease, and deterioration of the
functional state, have been associated with increased mortality in patients with CAP
(25,27,37). Koskela et al. (48) assessed 245 patients with CAP of which 152 survived
after 30 days and were followed up for five years. These authors found that patients
suffering from diabetes died less frequently compared to those without diabetes with

Introduction
33
new postprandial hyperglycemia and those without diabetes with no postprandial
hyperglycemia (p <0.001).
The previous functional state seems to significantly influence on the mortality of these
patients. Authors such as Sligl (36) related previous functional state to one-year
mortality and Waterer (49) related it to 3-year mortality. Moreover, Mortensen et al.
(22) considered the previous functional state as a risk factor for six-year mortality.
Dementia and cerebrovascular disease have also been considered risk factors by
numerous studies (28,36). Bordon et al. (50) observed a shorter survival rate in
patients aged over 65 years with cancer, dementia, and liver disease that had been
admitted for CAP. The group of Edinburgh carried out an observational study with
1,348 patients admitted for CAP and observed that patients with poorer long-term
outcome could be identified by using risk factors to identify risk of aspiration
pneumonia (51). Similarly, neoplasia has been associated with a high mortality rate. In
addition, a recent study showed that at least 10% of patients with a CAP episode are
diagnosed with lung cancer or pulmonary metastases during the years following
hospital admission.
Cardiovascular diseases seem to have elicited greater interest. A recent review
suggested a higher incidence of cardiac complications after a CAP episode (52). In
this sense, Dr Aliberti and Dr Ramírez (31) conducted a review in which they found an
increased incidence of cardiovascular events, such as myocardial infarction,
arrhythmias, and heart failure, in patients suffering from pneumonia. Systemic
inflammation, coronary artery inflammation, platelet activation and thrombosis,
endothelial dysfunction, and effects of CAP on the heart have been suggested as
possible mechanisms for increased cardiovascular events following respiratory
infections (52).
Corrales et al. (53) assessed 5,613 older adults enrolled at the Cardiovascular Health
Study conducted between 1989 and 1994 in four communities of the United States.
Patients with previous diagnosis of heart failure were excluded and participants were
followed up until 2010. Of those older adults assessed, 1,315 developed pneumonia
during follow-up and 652 were still alive and free of heart failure after 30 days of

LONG‐TERM MORTALITY IN HOSPITALIZED PATIENTS WITH COMMUNITY‐ACQUIRED PNEUMONIA
34
discharge. The authors described an association between admission for pneumonia
and increased risk of new-onset heart failure in the intermediate and long-term follow-
up. This association remained significant even after adjusting for traditional risk factors
including coronary heart disease. An Italian group studied 301 patients admitted for
CAP with 17-month follow-up and compared patients who suffered cardiac
complications during hospitalizations with those who did not (54). The authors
observed a higher incidence of cardiovascular events as well as higher long-term
mortality rate among patients who suffered in-hospital cardiac complications.
2.4 Biomarkers
2.4.1 Introduction Bacterial products such as lipopolysaccharides or peptidoglycans play a primary role
in the inflammatory response produced in the lower respiratory tract, because they
stimulate the alveolar macrophages producing cytokines such as interleukins (IL-1, IL-
6, IL-8) and tumor necrosis factor-alpha (55). These cytokines have been tested in
order to measure the inflammatory response, but their detection in serum has been
unhelpful due to their short half-life and their predominantly pulmonary production
reaching low values in serum (56).
More emphasis has been placed in studies of acute phase reactant proteins that occur
as a result of these cytokines stimulation. The measurement of these inflammatory
mediators in serum is easier, because they have a longer half-life. Generally, plasma
levels of inflammatory mediators seem to correlate with the severity of infectious
diseases such as pneumonia.
C-reactive protein It is worth mentioning that these mediators include the C-reactive protein (CRP), which
is the most used in routine clinical practice. It was first described in 1930 at Oswald
Avery’s laboratory, when they tried to identify a protein capable of precipitating C-

Introduction
35
polysaccharide of the pneumococcal cell wall in the serum of patients infected with
Streptococcus pneumoniae. It is an acute phase protein as well as a non-specific
inflammatory biomarker, but sensitive to systemic inflammation and tissue damage. Its
main function is the activation of the complement system and other pro-inflammatory
processes. Its synthesis occurs almost exclusively in hepatocytes mainly regulated by
cytokines (IL-6 and IL-1). Extrahepatic synthesis in neurons, atheroma plaques,
monocytes, and lymphocytes has been described. IL-6 is a very sensitive biomarker
due to its rapid rise in infections; however, its low specificity, short half-life, low
biostability, and high analytical cost make its clinical application limited (57).
In healthy young individuals, the average serum concentration of CRP is 0.8mg/L, but,
in the acute phase, it can increase 500 and even up to 1000 times its baseline value,
whether due to infection or inflammation. CRP synthesis begins immediately after an
inflammatory stimulus achieving an increase in serum concentrations after
approximately six hours. However, the maximum value is obtained after 48 hours, due
to which, at an early infection stage, values can be relatively low. Its half-life is 19
hours and constant in healthy individuals.
It is a very sensitive marker, but with low specificity. This way, values between 3 and
10 mg/L may reflect various non-specific inflammation conditions, such as diabetes
mellitus, obesity, smoking, low physical activity, alcohol consumption, and depression,
among others (58).
It has been observed that CRP has anti-inflammatory and pro-inflammatory action.
The first occurs by inducing the expression of the IL-1 receptor antagonist, increasing
the release of IL-10, and inhibiting the IFN-gamma synthesis. The second occurs by
activating the complement and increasing the release of IL-1, IL-6 and TNF-alpha,
among others (58).
The most important factor for CRP concentration is its synthesis, which, in turn, is
influenced by the degree of pathological stimulus. CRP acts in the defense
mechanisms of the body and inhibits the harmful effects of an exacerbated
inflammatory reaction.

LONG‐TERM MORTALITY IN HOSPITALIZED PATIENTS WITH COMMUNITY‐ACQUIRED PNEUMONIA
36
Procalcitonin Procalcitonin (PCT) is the propeptide of synthesized calcitonin hormone in thyroid C-
cells and encoded by the CALC-I gene on chromosome 11. It is known as "hormokine"
due to its production in the typical form of hormone by neuroendocrine cells of thyroid
C-cells or K cells in the lungs, and in the form of cytokine by several parenchymatous
cells (59).
In healthy individuals, PCT serum levels are undetectable and they increase
significantly in different situations. The production of this glycoprotein during
pathological processes occurs in extrathyroidal tissues, without leading to the increase
of calcitonin and serum calcium. In fact, it has been found that its level also increases
in thyroidectomized patients and septic situations.
Its origin in pathological circumstances is uncertain. Its release during infection is
directly induced by bacterial toxins (endotoxins), or indirectly by humoral factors (IL-
1B, IL-6 and tumor necrosis factors) and cells of the monocyte/macrophage system.
The induction can be attenuated by cytokines released during viral infections
(interferon-gamma) (60, 61).
Elevated PCT levels can be detected after two hours of bacterial infectious
stimulation. Its increase is greater than that of CRP, but not as accelerated as the
increase accomplished by other cytokines such as, for example, IL-6. PCT is very
stable, even at room temperature, and it has a half-life of approximately 24 hours (62).
New biomarkers
Recently, data from a study on new biomarkers with cardiovascular profile, such as
arginine vasopressin (AVP), have been published (63). AVP is a hormone produced in
the paraventricular nucleus of the hypothalamus and is subsequently stored in the
pituitary gland. The main function of AVP is the regulation of cardiovascular and
osmotic homeostasis. In severe diseases, such as sepsis or cardiogenic shock, there
is an imbalance in the regulation of water and AVP production is augmented by
osmotic and hemodynamic stimuli.

Introduction
37
AVP, also known as antidiuretic hormone, is attached to the platelets in more than
90%, which makes it very difficult to be measured. In addition, its half-life of 24
minutes and its inability to remain stable in plasma has made it necessary to develop
a new technique for the measurement of a new fragment of the biomarker. C-terminal
proAVP fragment, also known as copeptin, is a glycoprotein of 39 amino acids whose
function is not accurately known. However, given its greater ex vivo stability and
longer half-life, it could be used as an indirect measure of AVP in selected patients.
Elevated levels of copeptin have been associated with acute and chronic heart failure.
In addition, Kruger et al. (63) identified copeptin as an independent factor for mortality
in patients with CAP.
Brain natriuretic peptide is a polypeptide of 32 amino acids that has been widely used
for discriminating the cardiac origin of dyspnea. Natriuretic peptides inhibit the renin-
angiotensin system that leads to increased natriuresis, dieresis, and vasodilation.
Their production mainly occurs during stress of the transmural wall of the heart, due to
increased volume or cardiac pressure. However, proinflammatory cytokines and the
sympathetic nervous system have been identified as the stimulators of their secretion
(64).
Brain natriuretic peptide and N-terminal pro-brain natriuretic peptide are widely
established in routine clinical practice and included in international guidelines for heart
failure. However, elevated levels of these biomarkers have been described in septic
processes. According to Chrits Crain et al. (65), brain natriuretic peptide predicted
mortality and therapeutic failure in patients with CAP after the exclusion of patients
with history of heart failures and ischemic and hypertensive heart disease. Therefore,
the cardiac pathology could not explain the results obtained and, thus, the increase in
its levels could be related to the severity of pneumonia.
Proadrenomedullin (proADM) is the most stable fragment of adrenomedullin (ADM)
degradation. ADM is a peptide of 52 amino acids and, similarly as PCT, belongs to the
CALC gene family being encoded by the CALC-V gene. Its expression has been
detected in numerous tissues; however, the highest levels have been observed in the
adrenal medulla, ventricles, kidneys, and lungs. Normal values range from 2 to 3.5
ng/mL. However, the union of ADM to its receptor immediately after its production and

LONG‐TERM MORTALITY IN HOSPITALIZED PATIENTS WITH COMMUNITY‐ACQUIRED PNEUMONIA
38
its short half-life (approximately 22 minutes) hinder its direct measurement; therefore,
the measurement of its more stable fragment is very useful. ProADM is a potent
vasodilator and has bactericidal properties in addition to its action in the modulation of
the immune response (66).
Despite the cost of biomarkers, their complementary use has been proposed as a way
to improve etiologic identification and treatment optimization, as well as to estimate
clinical severity, evolution, and prognosis in patients (67).
2.4.2 Etiology and adjustment of antibiotic treatment Usually, despite proper techniques, it is only possible to obtain an etiological diagnosis
in 50% of cases. The most common pathogen described in the majority of published
studies has been Streptococcus pnenumoniae (68). The discrimination between
typical and atypical bacteria that cause pneumonia is an important step for choosing a
treatment of CAP. However, specific microbiological diagnosis has become
complicated in the routine clinical practice. The radiological presentation has been
used to discern between bacteria and viruses, but the results have not been
conclusive. Since the etiologic agent is usually unknown, empirical antibacterial
treatment based on the most likely causal pathogens is prescribed.
There is a variation in the antibacterial recommendations provided by guidelines for
the management of CAP, and the need for specific coverage of atypical
microorganisms is a key difference. Narrow-spectrum antibiotics are often as effective
as broad-spectrum antibiotics and cause fewer adverse side effects. However, despite
significant progress in recent years, the current methods for the identification of causal
pathogens still have limitations.
As already explained by Prat et al. (69), CRP increases in the acute inflammatory
response, including viral and bacterial infections, whereas PCT is a sensitive and
specific marker for the diagnosis of systemic bacterial infection. However, its
usefulness in localized infections and empyema is limited. For example, Masia et al.
(70) observed that a biomarker such as PCT may play a role in the prediction of

Introduction
39
microbial behavior in patients with low PSI scores; but this fact was not observed in
patients with higher PSI scores. Kruger et al. (71) found significantly higher levels of
PCT and CRP in patients with classic bacterial etiologies in comparison with those
with atypical bacteria.
On the other hand, Niederman et al. (72) suggested that the combination of PCT and
molecular testing with polymerase chain reaction for respiratory virus in patients with
CAP could identify individuals that may be treated without antibiotics or with antiviral
drugs, if the results showed a low PCT level and a positive polymerase chain reaction
test for the virus.
Also, the prognostic value of proADM has been assessed based on the etiology, but
the results were little satisfactory. Bello et al. (73) conducted a prospective study of
patients with CAP classifying the etiology into three groups; typical bacteria; atypical
bacteria (including viruses); and mixed bacteria. The authors found that this biomarker
had a high predictive value of mortality, independently of the CAP etiology. This way,
PCT was the best biomarker in discriminating between pneumonia by typical bacteria,
atypical bacteria, or virus when compared with CRP and proADM.
During recent decades, strategies of early initiation and early switch to oral therapy
have been thoroughly assessed. However, the optimal duration of antimicrobial
therapy has not been well established. In this sense, the ProHOSP study assessed a
control group and an intervention group using different cut-off points for PCT to decide
whether the administration of antibiotics was required. Precisely, they observed that
the use of PCT reduced the duration of antibiotic treatment from 12 to five days and
with no significant differences in the onset of complications between the two groups
(74).
However, in 2007, the IDSA/ATS provided recommendations for the duration of
antibiotic treatment based on the stability criteria proposed by Halm et al (75). The
guidelines suggested a minimum of 5-day treatment, patients’ achievement of an
afebrile state for 48 to 72 hours, and meeting no more than one CAP-associated
instability criteria before therapy discontinuation (76). Most guidelines showed a weak
evidence of current recommendations mainly based on expert opinions (77-79). It

LONG‐TERM MORTALITY IN HOSPITALIZED PATIENTS WITH COMMUNITY‐ACQUIRED PNEUMONIA
40
seems that there is an agreement on an individualized approach, though arbitrary
longer treatments remain prevalent. A recent clinical trial indicated that discontinuing
antibiotic treatment based on clinical stability criteria after a minimum of five-day
appropriate treatment did not show less clinical success than traditional treatment
schedules (80).
2.4.3 Severity and prognosis
In the infectious process of CAP, between 5.7 and 14% of patients who require
hospital admission will die, and this figure can raise up to a 50% in patients admitted
to intensive care units (17). Also, medium- and long-term mortality rates remain high,
with values of 8 and 21% within 90 days and one year, respectively (6).
Furthermore, it seems that patients admitted for a CAP episode have higher mortality
rates―even in the long term―than those admitted for any other reason, as previously
explained. The prognostic factors for mortality have been related to the germ-host
interaction. Despite the growing emergence of germs that are resistant to antibiotics,
such as Streptococcus pneumoniae, studies have statistically demonstrated that
mortality is more associated with factors that depend on the patients than with
resistance of germs.
Severity prognostic scores are static clinical score and lack information on the host
inflammatory response. The concomitant use of certain biomarkers could provide
objective criteria to make decisions with respect to these patients. Biomarkers are
becoming the way to improve the predictive ability of clinical scores.
PCT and CRP are biomarkers that have been most frequently used and assessed in
CAP (81-86). In this sense, Muller et al. (60) found a significant increase in PCT levels
among patients of the group with PSI risk class V. However, the role of CRP seems to
correlate with the presence of pneumonia, but not with its severity. In fact, some
authors have stated that only very high CRP values can be used as indicators of the
presence of CAP (81).

Introduction
41
Most of the studies of biomarkers conducted to date in patients with CAP have
assessed their ability to predict short-term mortality. Huang at al. (87) conducted a
study in 28 different centers with 1,651 patients and demonstrated that PCT
<0.1ng/mL was associated with a better prognosis, even in high-risk patients
according to the PSI score. Interestingly, Menéndez et al. (88) observed that the
addition of PCT levels to the PSI score did not improve predictive ability for 30-day
mortality, though it improved the prediction by adding the CRP to the PSI and
CURB65 scores. The German group observed that the PCT levels―but not the CRP
levels―significantly increased with the severity of CAP measured by the CRB-65
score (63). In that same study, low PCT levels were associated with low mortality for
all the risk classes of the CRB-65. There are studies that have indicated discrete
differences in PCT levels between survivors and non-survivors. It seems that this
diagnostic marker is useful for both adjustment of antibiotic treatment and as a
prognostic marker (89).
To date, biomarkers alone had not demonstrated superiority on the scores to predict
complications. In the last years, studies have been conducted with biomarkers of more
cardiovascular profiles and found that proADM started gaining greater relevance. Pro-
ADM has demonstrated superiority over CRP and PCT to predict the mortality of these
patients more accurately (66). This fact could be due to the cardiovascular activity of
this biomarker in addition to its immunomodulatory and antimicrobial effects.
There are several studies that have highlighted the improvement in prognostic value of
risk scores with pro-ADM. For example, Huang et al. (90) found that high pro-ADM
levels exhibited an additional stratified risk to the high risk class measured by the PSI
score. In another study, Chirst Crain et al. (91) described that the combination of
proADM and the PSI score improved the prediction of mortality. Albrich et al. (92)
showed that a new index, such as the CURB65-A based on the combination of the
CURB65 score and pro-ADM, could accurately predict 30-day mortality, as well as
adverse effects defined as death from any cause, intensive care unit admission, or
any disease complication within 30 days. Other authors have assessed the addition of
proADM in different severity scores with satisfactory results for both severe
complications and short-term mortality (93).
LONG‐TERM MORTALITY IN HOSPITALIZED PATIENTS WITH COMMUNITY‐ACQUIRED PNEUMONIA
42
The role of biomarkers in short-term prediction seems to be more clear. However,
long-term mortality is more difficult to predict. Recently, the red blood cell
distribution―a determination that measures the heterogeneity of erythrocyte
volume―has been associated with increased 30-day morbimortality (94).
Furthermore, Bello et al. (95) observed that from a cut-off point of 14, it had a higher
predictive power for mortality than other predictive biomarkers and, in addition, the
prediction improved in the long term.
However, the biomarker that has proven to be better than the rest for predicting long-
term mortality in these patients was proADM. The German group CAPNEZT has
assessed the role of biomarkers, both in the short and long term (71). They observed
the validity of proADM as a predictive marker of survival within 28 and 180 days,
comparable with the CRB-65 score. In addition, the predictive ability of the CRB65
score improved significantly when proADM was added. Furthermore, some authors
have described improvement such as longer-term predictive ability for mortality (6
years) by adding proADM to the PSI and CURB65 scores (43).
Guertler et al. (96) obtained biomarkers at days three, five, and seven, as well as on
the day of discharge, among patients with CAP included in a multicenter trial with 18-
month follow-up after hospital discharge. The authors found that the male sex, chronic
obstructive pulmonary disease, neoplastic disease, and the highest quartile of peak
proADM level were independent risk factors for long-term mortality. Interestingly, initial
presentation with temperature >38.7 °C, chills, and the highest quartile of CRP were
independent protective factors. Without a doubt, proADM seems to have gained the
first place in the prediction of long-term mortality in CAP patients.
As mentioned earlier, it is worth noting the transcendent role of cardiovascular
diseases as main cause of medium-and long-term mortality in these patients.
Biomarkers can be of great utility to identify a persistent chronic inflammation state
initiated after a CAP episode, which can lead to the development of cardiovascular
diseases (97,98).

Introduction
43
2.5 Clinical prediction rules
2.5.1 Introduction Clinical prediction rules (CPR) were firstly developed to improve physicians’ decision-
making as they are a powerful tool to provide an outcome, hence, to estimate the
probability that a certain outcome is present or will occur in an individual. These
prediction rules, also known as risk scores, usually combine patient characteristics,
physical examination data or laboratory data. They aim to standardize clinical data
interpretation, trying to avoid medical errors and minimizing the use of costly
diagnostic testing. An example would be prediction rules for diagnosis of pulmonary
embolism, which actually avoid many computed tomographic. Clinical judgment is the
first step when assessing a patient, however, clinical prediction rules provide more
accurate and less variable estimates.
CPR have been developed for many conditions, for instance, to determine the
likelihood of death within 4 years in patients with coronary artery disease, to identify
children with increase probability for urinary tract infections or to identify patients who
are likely to develop postoperative vomiting after anesthesia. Moreover, they can help
physicians not only assessing patient prognosis, but also guiding treatment location
and strategies. Once we focused on CAP, the initial evaluation leads to assess
severity of disease in order to predict the likely clinical outcomes of the patient. This
information can be used to help clinical decision-making in terms of site of care, extent
of laboratory work-up, and therapeutic interventions. Clinical judgment has shown a
poor predictive value to predict clinical outcomes, thus, CPR were developed to
support physician in the approach of assessing severity and outcomes. More
interestingly, they use the diagnostic properties of sensitivity, specificity, and positive
and negative likelihood ratios leading to a more practical use, readily applied to
individual patients.
In the last decades, an increasing number of papers have been published concerning
prediction rules. Indeed, 6,744 papers were published in 1995 compared to 15,662 in
2005. There is an overwhelming number of prediction rules for the same outcome,

LONG‐TERM MORTALITY IN HOSPITALIZED PATIENTS WITH COMMUNITY‐ACQUIRED PNEUMONIA
44
especially in some specific topics, such as, over 100 prognostic models for predicting
outcome after brain trauma (99), over 100 models for prostate cancer (100), or 45
models for cardiovascular events after being diagnosed with diabetes (101). However,
most articles are focused on the development of the rule and little is known concerning
other methodological issues. Many reviews have suggested limitations in reporting
data quality from the development of prediction rules (102,103). In a recent review of
predictive models, performance measures, i.e., calibration and discrimination were
only reported in 12% and 27% of studies, respectively (102). Rigorous methodoly
should be used when elaborating CPR.
In this sense, in an attempt to improve quality of reported data, The Transparent
Reporting of a multivariable prediction model for Individual Prognosis Or Diagnosis
(TRIPOD) Initiative developed a set of recommendations for the reporting of studies
developing, validating, or updating a prediction model, whether for diagnostic or
prognostic purposes (104). The TRIPOD Statement is a checklist of 22 items,
developed essentially for transparent reporting of a prediction model study (105).
As explained in the TRIPOD statement, the derivation of a prediction model should
start by selecting predictors and combining them into a multivariable model. For short-
term prognosis logistic regression is commonly used while Cox regression is used for
long-term prognostic outcomes. These studies should always include some form of
internal validation to quantify any optimism in the predictive performance of the
developed model and adjust the model for overfitting. External validation tipically use
the same predictor but tested in a different setting by other investigators. It is
important to specifically report all methodological issues in order to accurately
replicate the performed model.
There are two important aspects for the performance of a model that should be always
reported. The first one is discrimination, which refers to the ability of the score to
differentiate between patients who do and do not experience the outcome event. For
survival models is measured by the concordance index (C-index), which equals the
area under the receiver- operating characteristic curve for logistic prediction models.
The second one is calibration, which reflects the agreement between predictions from
the model and observed outcomes. In addition other measures of overall performance

Introduction
45
can be reported, such as, explained variation (R2) and the Brier score. Finally, all
developed prediction model should be compared to already published models, ideally
in a quantitative manner.
2.5.2 CPR for assessment of CAP severity. In order to establish the severity of CAP, different authors and scientific societies have
created a series of rules or severity scores that allow predicting short-term evolution in
patients. The best-known prognostic scores are the PSI, created by Fine et al. (106),
and the CURB-65 created by Lim at al. (107). These scores are very useful in the
optimization of antibiotic treatment, as well as in the decision-making for admissions.
In addition, the implementation of the severity scores has shown a reduction in the
number of hospital admissions of patients with CAP.
The PSI score was created with a large cohort of patients and validated in another
cohort. This score is based on 20 variables related to age, comorbidity, clinical and
radiological signs, and analytical data. Depending on the punctuation obtained, the
patients are classified into five groups according to the increase in risk of 30-day
mortality, namely: group 1 will include patients aged under 50 years, without
comorbidities and with normal physical condition, corresponding to the risk class I,
without the need for analytical determinations and with a mortality rate between 0.1
and 2.8%; group 2 would obtain less than 70 points; group 3 from 71 to 90; group 4
from 91 to 130; and group 5 would obtain more than 130 points.
This way, patients of low risk classes (I-III) could be treated as outpatient patients and
the rest would require hospital admission. Specifically, the patients of risk class III
could be treated at home or require a short length of hospital stay. Patients of group 4
would have a probability of mortality between 8.2 and 9.3%, and group 5 would exhibit
a high mortality rate (31 to 37%). This is a good severity score, since subsequent
works have validated its prognostic reliability.
The British Thoracic Society initially created the CURB (108) and, subsequently, Lim
at al.(107) modified it by incorporating age and using the acronym CURB-65. This

LONG‐TERM MORTALITY IN HOSPITALIZED PATIENTS WITH COMMUNITY‐ACQUIRED PNEUMONIA
46
score uses five variables and stratifies the patients according to the score with
probability of mortality between 0.7% if they obtain 0, and 40% if they obtain 4 points
or more.
However, the two scores have limitations. The first underestimates severity, especially
in young patients without comorbidities, and the second does not include blood
oxygen saturation among its variables. The two scores have a high negative predictive
value to identify the patients who will develop complications. On the other hand, their
positive predictive value is unsatisfactorily low to prescribe admission to intensive care
units. Usually, these patients tend to be younger and exhibit less number of
comorbidities, due to which it is not surprising that, when age is included as one of the
important criteria, the results obtained by these scores are worse for predicting
intensive care unit admissions.
The IDSA/ATS created a new score to predict which patients should be treated in
intensive care units (76). It contains two major criteria (invasive mechanical ventilation
and septic shock requiring vasopressor drugs) and eight minor criteria (respiratory rate
>30 breaths per minute; PaO2/FiO2 <250 mmHg; multilobar infiltrates observed on the
chest radiograph; confusion/disorientation; uremia >20 mg/dL; leukopenia <4,000
leukocytes/mm3; thrombocytopenia <100,000 platelets/mm3; hypothermia <36 ºC and
hypotension requiring aggressive fluid therapy). The presence of one major criterion or
the sum of at least three minor criteria will indicate the need for admission to intensive
care units or those with intensive monitoring. However, the obviousness of the major
criteria limits the operation of this score, even though it has a validated predictive
ability.
Charles et al. (109) created the SMART-COP (systolic blood pressure, multilobar
chest radiography involvement, albumin level, respiratory rate, tachycardia, confusion,
oxygenation, and arterial pH) score with the purpose of establishing the need for
intensive respiratory or vasopressor support. It consists of eight clinical and analytical
variables with different cut-off points according to age. The patients were classified
into four risk groups on the basis of the need for mechanical ventilation. España et al.
(110) created a new prognostic score (CAP-SCAP), to predict in-hospital mortality
and/or the need for mechanical ventilation and/or onset of septic shock during hospital
Introduction
47
admission in patients with CAP. This score consists of eight variables measured at the
time of diagnosis, namely: pH <7.30 and systolic blood pressure <90, as major criteria,
and confusion; respiratory rate >30 breaths/min; urea nitrogen >30; multilobar
radiographic infiltrates, PaO2/FiO2 <250; and age >80, as minor criteria. From a cut-
off point (>9 points would be equivalent to two minor criteria or one major criterion), it
is recommended that patients are monitored or admitted to intermediate respiratory
care units/intensive care units, whereas those with a score less than nine are
classified as low risk and can be treated as outpatients.
The objectives of stratifying patients with CAP in groups are multiple. On the one
hand, defining what type of patients can be treated as outpatients, and on the other
hand, identifying those patients that require greater control or being monitored in
intermediate respiratory care units/intensive care units. All these prognostic models
predict the probability of mortality in percentage terms and help decide which patients
require hospitalization and who can be treated as outpatients. However, the
heterogeneity of CAP limits their predictive ability. This limitation implies the need of
using "clinical judgment", which is certainly difficult to define in objective terms.
In addition, the scores are not able to measure the mechanisms of the inflammatory
response of the organ affected against the microorganism, nor can predict the
individual responses of the patients to the established treatments. They only predict
short-term mortality and, to date, scores to predict long-term mortality after a CAP
episode have not been created.

LONG‐TERM MORTALITY IN HOSPITALIZED PATIENTS WITH COMMUNITY‐ACQUIRED PNEUMONIA
48

49
3. JUSTIFICATION


Justification
51
CAP continues to be a leading cause of morbidity and mortality worldwide (14). The
annual incidence of CAP ranges from 5 to 11 cases per 1000 adults and accounts for
considerable healthcare costs (7,8). The severity of illness has been a matter of
concern in recent decades since it has been related to short-term prognosis. In this
sense, different CAP guidelines have suggested different risk scores in order to
predict 30-day mortality.
Recently, increasing interest has emerged concerning long-term prognosis. Despite
current evidence about risk factors for one-year mortality after CAP, it seems that
predicting long-term prognosis after an episode of CAP remains challenging. To date,
no risk scores have been developed in order to predict one-year mortality in
hospitalized patients with CAP.
In addition, the utility of biomarkers has been widely evaluated to predict poor
outcomes in CAP. Most researchers have focused on short-term outcomes. However,
several authors have suggested that a few biomarkers could also be useful to predict
long-term prognosis. Little is known about how the addition of biomarkers could
improve long-term prediction.
In an attempt to clarify this issue, three different cohorts were assessed in this study.
The first one was evaluated in order to develop a one-year prediction score among
hospitalized patients with CAP from January 2001 to July 2009 at the Hospital of
Galdakao-Usansolo.
The second one was tested in hospitalized patients with CAP in which blood samples
were obtained from June 2008 to July 2009 at the Hospital of Galdakao-Usansolo, to
assess whether biomarkers are useful for predicting one-year mortality. Finally, a third
cohort was assessed to investigate long-term prognosis among hospitalized patients
with CAP from June 2001 to November 2006 in the Veterans Affairs Medical Center of
Louisville, Kentucky.

LONG‐TERM MORTALITY IN HOSPITALIZED PATIENTS WITH COMMUNITY‐ACQUIRED PNEUMONIA
52

53
4. HYPOTHESES AND OBJECTIVES


Hypotheses and objectives
55
4.1 Hypotheses Study I. One-year mortality prediction among hospitalized patients with CAP in Galdakao-Usansolo Hospital 1. In patients admitted for CAP, it is possible to identify clinical variables relating to
one-year mortality after hospital admission.
2. Depending on the variables previously identified, it is possible to create a prognostic
index that can help in the stratification of one-year mortality prediction in patients
admitted for CAP.
3. A prognostic index specifically created for the prediction of one-year mortality may
have greater predictive ability than usual risk scores in patients admitted for CAP.
Study II. Role of biomarkers for one-year mortality prediction among hospitalized patients with CAP in Galdakao-Usansolo Hospital 1. The severity at the time of clinical diagnosis measured by biomarkers or risk scores
may be associated with one-year mortality in patients admitted for CAP.
2. The incorporation of inflammatory response biomarkers to risk scores could
improve the ability for predicting one-year mortality.
3. The decrease in levels of inflammation biomarkers from the time of diagnosis until
three to five days could help in predicting one-year mortality in patients admitted for
CAP.
Study III. One-year mortality prediction among hospitalized patients with CAP in the Veterans Affairs Medical Center of Louisville, Kentucky, USA 1. The variables of patients admitted for CAP to a Veterans Hospital in the United
States will differ from the sample of study I.
2. The creation of a prognostic index for long-term mortality in patients of an American
cohort admitted for CAP to a Veterans Hospital could help professional health teams
to better identify the patients with high mortality risk in order to perform enhanced
monitoring.

LONG‐TERM MORTALITY IN HOSPITALIZED PATIENTS WITH COMMUNITY‐ACQUIRED PNEUMONIA
56
4.2 Objectives
Primary Study I. One-year mortality prediction among hospitalized patients with CAP in Galdakao-Usansolo Hospital 1. To assess the factors associated with one-year mortality in patients admitted after a
CAP episode.
2. To create and validate a prognostic index for one-year mortality in patients admitted
after a CAP episode.
3. To compare the predictive ability of existing severity scores and the new prognostic
index for one-year mortality.
Secondary: Study II. Role of biomarkers for one-year mortality prediction among hospitalized patients with CAP in Galdakao-Usansolo Hospital 1. To assess the relationship between severity scores and levels of biomarkers of
systemic inflammation (CRP, proADM, and PCT) obtained at the time of diagnosis and
one-year mortality in patients admitted for CAP.
2. To determine the predictive ability of biomarkers and prognostic scores and
associate them in order to improve the predictive value.
3. To assess the relationship between the evolution of biomarkers levels from
admission to three to five days and one-year mortality in patients admitted for CAP.
Study III. One-year mortality prediction among hospitalized patients with CAP in the Veterans Affairs Medical Center of Louisville, Kentucky, USA 1. To assess the differences between the variables of a sample from a Veterans
Hospital in the United States and the variables of study I.
2. To create a predictive score for long-term mortality in an American cohort of
patients admitted for CAP to a Veterans Hospital.

57
5. METHODS


Methods
59
STUDY I. ONE-YEAR MORTALITY PREDICTION AMONG HOSPITALIZED PATIENTS WITH CAP IN GALDAKAO-USANSOLO HOSPITAL.
5.1. Study design
This was an observational, prospective study of adults aged ≥18 years admitted to the
Hospital of Galdakao-Usansolo, from January 2001 to July 2009 with a diagnosis of
CAP. The entire cohort was divided into two parts in order to develop a one-year
mortality predictive model in the first cohort (the derivation cohort) that was validated
using the second cohort (the validation cohort).
Firstly, a subset of variables considered clinically important to predict one-year
mortality were selected. Secondly, the relationships between those variables and one-
year mortality was assessed and statistically significant variables were considered in a
multivariate analysis. Once the predictive variables were identified, a weighted score
was developed and validated in the validation cohort. At the same time, the score was
divided into three categories: mild, moderate and high risk groups. Finally, the
predictive accuracy of the score was compared to other risk scores.
5.2. Setting and study population
The study was carried out at the Hospital of Galdakao-Usansolo (Galdakao, Spain), a
400-bed teaching hospital in the Basque Country (northern Spain) that serves a
population of 300,000 inhabitants. This medical institution belongs to the network of
public hospitals of the Basque Health Care Service, which provides free unrestricted
care to nearly 100% of the population.
The Pneumology Department staff is composed of full-time physicians qualified in
standardized national residency programs. Since 2000, the team has developed a
consolidated line of research with a clear influence on science confirmed by loads of
publications. The Infections Division of the Pneumology Department has developed a
clinical guideline for CAP management that is still working and that has led to many
publications. It should be highlighted that this team developed a specific score to
predict severe CAP, the SCAP score, with a clear impact on the literature.

LONG‐TERM MORTALITY IN HOSPITALIZED PATIENTS WITH COMMUNITY‐ACQUIRED PNEUMONIA
60
5.3 Patient selection criteria
5.3.1. Diagnosis definition Pneumonia was defined as pulmonary infiltrate on chest X-ray not seen previously
plus at least one symptom compatible with pneumonia such as cough, fever, dyspnea,
and/or chest pain (106).
5.3.2 Inclusion criteria Hospitalized patients diagnosed with CAP were recruited from January 2001 to July
2009. Eligible patients were ≥18 years old, hospitalized with a diagnosis of CAP.
5.3.3 Exclusion criteria . Death within the first 15 days from diagnosis.
. Had been discharged from an acute care hospital, an onsite subacute care unit, or a
palliative care unit within the previous 14 days.
. Infected with the human immunodeficiency virus.
. Chronically immunosuppressed, defined as:
. Solid organ transplantation
. Post-splenectomy
. Receiving ≥10 mg/day prednisone or equivalent for more than 30 days
. Being on other immunosuppressive agents
. Having neutropenia, i.e., <1.0 x10⁹/L neutrophils
5.4 Sample size estimation
Studies of predictive model development indicate that it is necessary to include at
least 10 events of the dependent variable of interest (in this case: mortality, major
complications, relapses, or readmissions) for each independent variable included in
the multivariate logistic regression model [111,112]. Therefore, we estimated that at
least 100 events of the dependent variable in the sample are required in order to

Methods
61
ensure that the regression model would adequately converge. Previous data indicate
that the number of events of the dependent variable mortality would be >15% of
patients operated on in the first year, higher that the expected percentages of other
parameters. We therefore estimated that more than 300 events of any of the
dependent variables of interest should be included. Thus, we consecutively collected
all new cases until the sample size was achieved.
5.5 Missing data
No assumptions were made for missing data, analyzing only the available data.
5.6 Data collection
At baseline, the demographic and clinical data for each patient were collected from
medical records, including comorbidities, physical examination, radiological
presentation, analytics as well as complications during hospitalizations. Antibiotic
treatment was assessed according to Spanish Pulmonology and Thoracic Surgery
Society (SEPAR) guidelines (113).
Disease severity was determined with the PSI, CURB65, and SCAP scores,
calculated within the first 24 hours after diagnosis (106,107,110). One-year mortality
was retrospectively assessed by the computer system support of the Basque Health
Care Service.
5.7 Ethics and confidentiality issues
All participants provided signed informed consent before their inclusion in the study
and after being informed and having discussed the goals, risks, and potential benefits
of the study. Patient rights were protected in line with the Declaration of Helsinki. The
project was approved by the hospitals’ ethical review boards.

LONG‐TERM MORTALITY IN HOSPITALIZED PATIENTS WITH COMMUNITY‐ACQUIRED PNEUMONIA
62
In order to preserve patient data confidentiality, restricted access to the database was
limited to a single person, with a user name and password. Similarly, patient
identifying information was managed separately from the rest of the study information.
5.8 Definitions of variables
● Primary outcome was one-year mortality after admission for CAP.
Patients who died within the first 15 days after diagnosis were excluded in order to
avoid the impact of severity of illness on mortality.
● Secondary outcomes
- Patient condition at the time of diagnosis
Demographics, comorbidities, physical examination, radiological presentation and
analytics.
. Alcohol consumption: More than 80 g/day of alcohol intake.
. Nursing home: Being a nursing home resident.
. Aspiration: Suspicion of aspiration at diagnosis, usually seen in patients with
difficulties swallowing.
. Diabetes mellitus: Patients with diabetes under treatment with oral antidiabetic
agents or insulin therapy.
. COPD: Chronic pulmonary obstructive disease including chronic bronchitis and
emphysema.
. Cancer: History of cancer.
. CHF: Patients with exertional dyspnea, paroxysmal nocturnal dyspnea and
responding symptomatically or in a physical examination to treatment with digitalis,
diuretics or afterload reducers drugs. Patients without symptomatic improvement after
medication or those without improvement in physical examination were not included.
. CAD: Patients with a history of acute or chronic coronary artery disease.

Methods
63
. CVD: Patients with a clinical or radiological diagnosis of cerebrovascular accident or
transient ischemic attack.
. Dementia: Chronic cognitive impairment.
. Renal failure: Chronic kidney disease or abnormal blood levels of creatinine.
. Confusion: Altered mental status, previously not reported disorientation of place, time
or person.
. Pleural effusion (X-ray): Pleural effusion on the X-ray at diagnosis.
. Bilateral/multilobar (X-ray): Bilateral or multilobar involvement on the X-ray at
diagnosis.
. Mixed radiological pattern: Both alveolar and interstitial pattern on the X-ray.
● Treatment administration
. Previous antibiotic treatment.
. Antibiotic according to SEPAR guidelines.
. Time until first antibiotic dose.
. Corticosteroids administration: systemic corticosteroids administration during
hospitalization.
● Complications during hospitalization
. Intensive Care Unit (ICU) admission: ICU admission during hospitalization.
. Intermediate Respiratory Care Unit (IRCU) admission: IRCU admission during
hospitalization.
. Mechanical ventilation: Need for invasive mechanical ventilation.
. Septic shock: Sepsis-induced hypotension despite adequate fluid resuscitation along
with the presence of perfusion abnormalities that may include but are not limited to
lactic acidosis, oliguria, or an acute alteration in mental status. Patients receiving

LONG‐TERM MORTALITY IN HOSPITALIZED PATIENTS WITH COMMUNITY‐ACQUIRED PNEUMONIA
64
inotropic or vasopressor agents may not be hypotensive at the time that perfusion
abnormalities are measured (114).
. Need for vasopressors: Need for vasopressor agents.
. Respiratory failure: Presence of pO2/FiO2 <300.
. Renal failure: Abnormal blood levels of creatinine, not previously reported.
. Pleural effusion: Development of pleural effusion not reported at the time of
diagnosis.
. Empyema: Pus in the pleural space.
. Antibiotic adverse events: appearance of symptoms such as diarrhea attributable to
antibiotics.
. Embolism: Pulmonary embolism diagnosis by computerized tomography.
. Deep vein thrombosis diagnosis by ultrasonography.
. Decompensated comorbidities: Exacerbation of previously diagnosed diabetes
mellitus, asthma, COPD, heart disease, neurological disease, or renal failure.
● Severity of illness at the time of diagnosis
PSI, CURB65 and SCAP scores were used to assess the severity of illness at
admission. The PSI and CURB65 were both developed and validated for 30-day
mortality while the SCAP score was developed and validated for in-hospital mortality
and/or need for mechanical ventilation and/or septic shock.
The PSI score was elaborated in the USA by Fine et al. (106) and is based on 20
weighted variables including, age, sex, comorbidities, vital signs, analytical data, and
radiological presentation. Patients are stratified into five risk categories depending on
30-day mortality risk. In the original study, mortality rates were 0.1%, 0.6%, 0.9%,
9.3%, and 27% for risk classes I, II, III, IV, and V, respectively.
The CURB65 score was elaborated by the British Thoracic Society and designed by
Lim et al. (107). It is composed of five variables, with one point for each: confusion,

Methods
65
urea 7 mmol/L, respiratory rate >30/min, low systolic (<90 mm Hg) or diastolic (<60
mm Hg) blood pressure, and age >65 years. Scores ranged from 0 to 5 points based
on 30-day mortality risk (score 0, 0.7%; score 1, 2.1%; score 2, 9.2%; scores 3-5, 15-
40%).
The SCAP score was elaborated by España et al. (110), based on two major criteria
(pH <7.30 and systolic blood pressure <90 mmHg) and six minor criteria (confusion,
respiratory rate >30 breaths/min, BUN >30 mg/dL, multilobar/bilateral X-ray,
PaO2/FiO2 <250 mmHg, and age >80 years). Based on eight weighted variables,
patients are stratified into mild (0-9 points), moderate (10-19 points), and high (>20
points) risk groups.
5.9 Statistical analysis
Descriptive statistics included frequency tables and means and standard deviations
(SD) or medians and interquartile ranges (IQRs). No assumptions were made in
relation to missing values.
The entire cohort was split randomly into derivation (50%) and validation (50%) sets.
To assess the homogeneity of both samples, categorical variables were compared
with the chi-squared and Fisher’s exact tests, and continuous variables with Student’s
t-tests or non-parametric Wilcoxon tests.
A univariate analysis using the chi-squared/Fisher’s exact test (categorical variables)
or t-test (continuous effects) was performed to identify the variables related to one-
year mortality. Variables with statistically significant results at p <0.20 were entered
into the multivariate model.
Firstly, a logistic regression model to select the variables for the prediction rule was
performed. The model was replicated in the validation cohort. The area under the
curve (AUC) of the model (AUC ≥0.80 means a good discrimination) and the odds
ratios (OR) and 95% confidence intervals (CI) of all selected variables were provided.
For the assessment of the goodness-of-fit of the model, the Hosmer-Lemeshow test
was performed (a p-value ≥0.05 represents good calibration of the model).

LONG‐TERM MORTALITY IN HOSPITALIZED PATIENTS WITH COMMUNITY‐ACQUIRED PNEUMONIA
66
Secondly, a survival multivariate model was carried out with the selected variables.
The hazard ratios (HR) and 95% confidence intervals (CI) of all selected variables
were provided. The beta coefficients from the survival model were used to weight the
relative importance of each variable for the calculation of the prediction score. For
weights, the beta coefficient for each predictor variable in the model was divided by
the variable with the lowest beta coefficient and rounded to the nearest whole number.
This produced a “relative weight” of each variable in relation to its ability to predict
each outcome. The model was replicated in the validation cohort.
Thirdly, the weights of the variables for each patient were added together to produce
the prediction scores for each patient and three categories were established (low,
moderate, and high) based on predicted versus observed one-year mortality. Risk
categories were replicated in the validation cohort.
Fourthly, the associations between PSI, CURB65, SCAP, and one-year CAPSI were
assessed by hazard ratios (HR) and 95% confidence intervals (CI) in the derivation
and the validation cohorts. Kaplan-Meier survival curves were used to assess
operating severity scores for one-year mortality.
Fifthly, the predictive accuracy of the different risk scores was assessed in the
derivation and the validation cohorts by the C-index. Akaike information criteria (AIC)
and R-squared (R2) were provided in both cases. To assess the ability of the model to
match predicted and observed one-year mortality rates in all developed survival
models, the Greenwood-Nam D’Agostino (GND) method was used.
All effects were considered significant at p<0.05, unless otherwise stated. All statistical
analysis was performed using SAS for Windows, version 9.4 (SAS Institute, Cary,
NC). Figures were prepared using R version 3.3.0.

Methods
67
STUDY II. ROLE OF BIOMARKERS FOR ONE-YEAR MORTALITY PREDICTION AMONG HOSPITALIZED PATIENTS WITH CAP IN GALDAKAO-USANSOLO HOSPITAL.
5.1. Study design
This was an observational, prospective study of adults aged ≥18 years admitted to
Hospital of Galdakao-Usansolo, from June 2008 to July 2009 with a diagnosis of CAP
and in whom blood samples could be obtained for biomarker analysis at the time of
diagnosis as well as after 3-5 days when possible. The predictive accuracy of the risk
scores and biomarkers at diagnosis was assessed for one-year mortality. In addition,
the evolution of biomarker levels between time points was evaluated for the one-year
mortality prediction.
5.2. Setting and study population
The study was carried out at the Hospital of Galdakao-Usansolo (Galdakao, Spain), a
400-bed teaching hospital in the Basque Country (northern Spain) that serves a
population of 300,000 inhabitants. This medical institution belongs to the network of
public hospitals of the Basque Health Care Service, which provides free unrestricted
care to nearly 100% of the population.
5.3 Patient selection criteria
4.3.1. Diagnosis definition Pneumonia was defined as pulmonary infiltrate on chest X-ray not seen previously
plus at least one symptom compatible with pneumonia such as cough, fever, dyspnea,
and/or chest pain (106).
5.3.2 Inclusion criteria Hospitalized patients diagnosed with CAP were recruited from January 2001 to July
2009. Eligible patients were ≥18 years old, hospitalized with a diagnosis of CAP.

LONG‐TERM MORTALITY IN HOSPITALIZED PATIENTS WITH COMMUNITY‐ACQUIRED PNEUMONIA
68
5.3.3 Exclusion criteria . Death within the first 15 days from diagnosis.
. Had been discharged from an acute care hospital, an onsite subacute care unit, or a
palliative care unit within the previous 14 days.
. Infected with the human immunodeficiency virus.
. Chronically immunosuppressed, defined as:
. Solid organ transplantation
. Post-splenectomy
. Receiving ≥10 mg/day prednisone or equivalent for more than 30 days
. Being on other immunosuppressive agents
. Having neutropenia, i.e., <1.0 x10⁹/L neutrophils
5.4 Sample size estimation
Studies of predictive model development indicate that is necessary to include at least
10 events of the dependent variable of interest (in this case: mortality, major
complications, relapses, or readmissions) for each independent variable included in
the multivariate logistic regression model (111,112). Therefore, we estimated that at
least 100 events of the dependent variable in the sample are required in order to
ensure that the regression model would adequately converge. Previous data indicate
that the number of events of the dependent variable mortality would be >15% of
patients operated on in the first year, higher that the expected percentages of other
parameters. We therefore estimated that more than 300 events of any of the
dependent variables of interest should be included. Thus, we consecutively collected
all new cases until the sample size was achieved.

Methods
69
5.5 Missing data
No assumptions were made for missing data, analyzing only the available data.
5.6 Data collection
At baseline, the demographic and clinical data for each patient were collected from
medical records, including comorbidities, physical examination, radiological
presentation, analytics as well as complications during hospitalization. Antibiotic
treatment was assessed according to Spanish Pulmonology and Thoracic Surgery
Society (SEPAR) guidelines (113). Disease severity was determined with the PSI,
CURB65, and SCAP scores, calculated within the first 24 hours after diagnosis
(106,107,110). Blood samples were obtained at diagnosis as well as 3-5 days later
when possible in order to analyze CRP, PCT, and proADM levels. All patients were
evaluated at day 30 in a medical consultation. One-year mortality was retrospectively
assessed by the computer system support of the Basque Health Care Service.
CRP was quantified by immunoturbidimetry with an analytical sensitivity of 1 mg/L.
PCT was analyzed by electrochemiluminescence with an analytical sensitivity of 0.02
ng/mL. PADM was analyzed by a sandwich immunoassay using TRACE technology
(time-resolved amplified cryptate emission) with a sensitivity of 0.05 nmol analytical/L.
5.7 Ethics and confidentiality issues
All participants provided signed informed consent before their inclusion in the study
and after being informed and having discussed the goals, risks, and potential benefits
of the study. Patient rights were protected in line with Declaration of Helsinki. The
project was approved by the hospitals’ ethical review boards.
In order to preserve patient data confidentiality, restricted access to the database was
limited to a single person, with a user name and password. Similarly, patient
identifying information was managed separately from the rest of the study information.

LONG‐TERM MORTALITY IN HOSPITALIZED PATIENTS WITH COMMUNITY‐ACQUIRED PNEUMONIA
70
5.8 Definitions of variables
● Primary outcome was one-year mortality after admission for CAP.
Patients who died within the first 15 days after diagnosis were excluded in order to
avoid the impact of severity of illness on mortality.
● Secondary outcomes: See section I for definitions.
- Patient conditions at the time of diagnosis.
- Treatment administration.
- Complications during hospitalization.
- Severity of illness at the time of diagnosis measured by risk scores.
- Biomarker levels at the time of diagnosis (CRP, PCT, and proADM).
- Biomarker levels at 3-5 days (CRP, PCT, and proADM).
5.9 Statistical analysis
Descriptive statistics included frequency tables and means and standard deviations
(SD) or medians and interquartile ranges (IQRs). No assumptions were made in
relation to missing values. Biomarker values were compared between risk score
levels: PSI (I-III vs. IV-V), CURB65 (0-1 vs. ≥2), SCAP (0-1 vs. ≥2), and one-year
CAPSI (≤3 vs.>3), by non-parametric Wilcoxon tests. In addition, the predictive
accuracy of one-year mortality for each biomarker was assessed by a survival model.
The hazard ratios (HR) and 95% confidence intervals (CI) of all selected variables
were provided. Similarly, the predictive accuracy of one-year mortality for each risk
score was assessed and compared to PSI, CURB65, SCAP, and one-year CAPSI.
Finally, whether the inclusion of biomarkers significantly increased the predictive
ability of risk scores was assessed by comparing the C-index of the nested survival
models. Thus, the model including the risk score with the biomarker was compared to
the model with the risk score itself.

Methods
71
In addition, the above mentioned analyses were performed including all deaths within
one year.
ProADM changes were calculated by subtracting the biomarker value at 3-5 days from
the baseline value so that a positive difference meant an improvement. The hazard
ratios (HR) and 95% confidence intervals (CI) of ProADM changes were provided,
adjusted by PSI, SCAP, CURB65, and one-year CAPSI as well as proADM baseline
values. Predictive accuracies were assessed by the C-index. The same analyses were
performed after the inclusion of all deaths within one year and after the exclusion of
those patients who died from 15 days to one year.
All effects were considered significant at p<0.05, unless otherwise stated. All statistical
analysis was performed using SAS for Windows, version 9.4 (SAS Institute, Cary,
NC).

LONG‐TERM MORTALITY IN HOSPITALIZED PATIENTS WITH COMMUNITY‐ACQUIRED PNEUMONIA
72
STUDY III. ONE-YEAR MORTALITY PREDICTION AMONG HOSPITALIZED PATIENTS WITH CAP IN THE VETERANS AFFAIRS MEDICAL CENTER OF LOUISVILLE, KENTUCKY.
5.1. Study design
This was a retrospective, observational study of a cohort of adult patients admitted to
the Veterans Affairs Medical Center of Louisville, Kentucky, from June 2001 to
November 2006 with a diagnosis of CAP. One-year and five-year mortality was
obtained in order to develop one-year and five-year prediction scores.
5.2. Setting and study population
The Division of Infectious Diseases at the University of Louisville School of Medicine is
a nationally and internationally recognized clinical research program in infectious
disease under the direction of Dr. Julio Ramirez. It is dedicated to excellence in patient
care, teaching and research with Dr. Paula Peyrani as director of the Clinical
Research Unit.
Numerous manuscripts have been published by members of the team as well as a
large number of presentations at national and international conferences. There are
different areas of research, mostly focused on pneumonia, HIV/AIDS, influenza,
antimicrobial stewardship, multidrug-resistant organisms, disease surveillance, and
statistical process control. All research activities are supported by a Computational
Epidemiology Unit, which takes care of all the analysis.
The division is the headquarters of the Community-Acquired Pneumonia Organization
(CAPO) with a database including over 7,000 patients from 15 countries. In addition, a
funded project was carried out on the incidence of influenza and other viruses in
Kentucky. The group recently carried out a randomized clinical trial, Rapid Empiric
Treatment with Oseltamivir Study (RETOS), in nine hospitals in the city of Louisville.
At the moment, there are other two studies that are actively enrolling patients. The first
study is a population-based study to define the clinical and economic burden of
pneumococcal pneumonia in hospitalized adult patients in Jefferson County, Kentucky

Methods
73
(HAPPI). The second one is a funded study on Streptococcus pneumoniae serotypes
in adults 18 years and older with radiographically confirmed CAP.
Jefferson County was founded in 1780 and is one of 120 counties of the state of
Kentucky in the USA. In 2007, the county had a population of 709,264 inhabitants and
a population density of 695 inhabitants/km². The county seat is Louisville. There are
nine hospitals in Jefferson County and, at the moment, the Division of Infectious
Diseases has more than 50 research associates engaged in screening, enrollment,
and data collection from patients with CAP in those hospitals. A total of 89,363
patients were hospitalized in Jefferson County from May 2014 to April 2015. A total of
4,578 patients were hospitalized with CAP in Jefferson County from May 2014 to April
2015.
One of those hospitals is The Veterans Affairs Medical Center. Services are available
to more than 150,000 veterans living in a 35-county area of the Kentuckiana area.
Robley Rex Veterans Affairs Medical Center provides a continuum of care through an
integrated health care delivery system. Today’s Veterans Health Administration (VHA)
originated during the Civil War as the first federal hospitals and domiciliary ever
established for the nation’s volunteer forces. The VHA is the largest of three
administrations that comprise the U.S. Department of Veterans Affairs. The VHA’s
primary mission is to provide medical care and services to America’s military veterans.
5.3 Patient selection criteria
5.3.1. Diagnosis definition A CAP diagnosis was made if patients met the following criteria:
The presence of a new pulmonary infiltrate on chest radiograph or CT scan at the time
of hospitalization, plus at least one of the following three criteria (76):
- New or increased cough
- Abnormal temperature (<35.6°C or >37.8°C)
- Abnormal serum leukocyte count (leukocytosis, left shift, or leukopenia) as defined
by local laboratory values.

LONG‐TERM MORTALITY IN HOSPITALIZED PATIENTS WITH COMMUNITY‐ACQUIRED PNEUMONIA
74
5.3.2 Inclusion criteria Hospitalized patients diagnosed with a diagnosis of CAP from June 2001 to November
2006.
5.3.3. Exclusion criteria . Death within the first 15 days from diagnosis.
. Had been discharged from an acute care hospital, an onsite subacute care unit, or a
palliative care unit within the previous 14 days.
. Infected with the human immunodeficiency virus.
. Chronically immunosuppressed, defined as:
. Solid organ transplantation
. Post-splenectomy
. Receiving ≥10 mg/day prednisone or equivalent for more than 30 days
. Being on other immunosuppressive agents
. Having neutropenia, i.e., <1.0 x10⁹/L neutrophils
5.4 Missing data
No assumptions were made for missing data, analyzing only the available data.
5.5 Data collection
At baseline, the demographic and clinical data for each patient were collected from
medical records, including comorbidities, physical examination, radiological
presentation, analytics as well as complications during hospitalizations.

Methods
75
5.6 Ethics and confidentiality issues
This study was approved by the Veterans Affairs Medical Center Institutional Review
Board. For several years, the Human Subjects Protection Program Office has offered
an in-service education program for all researchers, coordinators and administrators
associated with the University of Louisville and its affiliated institutions. The Offices of
the Executive Vice President for Research and the Executive Vice President for
Health Affairs have mandated that all researchers, including study coordinators and all
other key study personnel, attend human subject protections training. Beginning July 1
2000, the Human Subjects Protection Program Office no longer considers initial or
continuing reviews of protocols without certification of participation in such a course. It
is obvious to the Institutional Review Board that the efficient approval and continuing
review of protocols is enhanced if the researchers are better acquainted with the basic
principles, standards and requirements of human subject protections as they pertain to
local institutions.
For the reasons mentioned above, I carried out the Collaborative Institutional Training
Initiative (CITI) program before reviewing the database. A description of the courses is
provided below:
- Human subjects and HIPAA – Research-Biomedical Research.
- Human subjects and HIPAA – Research-Social, Behavioral or Educational Research.
- HIPAA Privacy - covers Component Workforce Members with access to PHI.
- Institutional Compliance – funded researcher
- Institutional Compliance – U of L general population
- Same as curriculum group
- Conflict of interest
5.7 Definitions of variables
● Primary outcomes were one-year and five-year mortality after admission for CAP.

LONG‐TERM MORTALITY IN HOSPITALIZED PATIENTS WITH COMMUNITY‐ACQUIRED PNEUMONIA
76
Patients who died within the first 15 days after diagnosis were excluded in order to
avoid the impact of severity of illness on mortality.
● Secondary outcomes: See section 1 for definitions.
- Patient condition at the time of diagnosis.
Demographics, comorbidities, physical examination, and analytics.
. Hypertension: patients with elevated blood pressure on drug treatment.
. Liver disease: cirrhosis or other chronic liver disease such as active chronic hepatitis.
5.8 Statistical analysis
Categorical variables were compared with those from study I with the chi-squares and
Fisher’s exact tests, and continuous variables with Student’s t-tests or non-parametric
Wilcoxon tests. One-year CAPSI was assessed for the study II sample by the C-index.
Prediction scores for one-year and five-year mortality were created. For each
outcome, the same methods were utilized. First, a clinically meaningful subset of
variables was selected based on physician input. Second, multicollinearity was
assessed using variance inflation factor (VIF) values. Variables with a VIF>10 were
considered collinear and were either evaluated in combination or dropped. Third, a
genetic algorithm (R package “glmulti”) was used to select the best-fit model based on
the Akaike information criterion (AIC) (115). The beta coefficients from the logistic
regression models were used to weight the relative importance of each variable for the
calculation of the prediction score. For weights, the beta coefficient for each predictor
variable in the model was divided by the variable with the lowest beta coefficient. This
produced a “relative weight” of each variable in relation to its ability to predict each
outcome. The weights of the variables for each patient were added together to
produce the prediction scores for each patient.
Receiver operating characteristic (ROC) curves were used to calculate the
discriminatory ability of each score in the prediction of each outcome. One score was
created for one-year mortality and was assessed via the area under the ROC curve

Methods
77
(AUC). The same score was evaluated for predicting five-year mortality. A new score
was created with a subset of variables selected specifically to predict five-year
mortality. R version 3.1.2 (R Foundation for Statistical Computing, Vienna, Austria)
was used for all analyses.

LONG‐TERM MORTALITY IN HOSPITALIZED PATIENTS WITH COMMUNITY‐ACQUIRED PNEUMONIA
78

79
6. RESULTS


Results
81
STUDY I. ONE-YEAR MORTALITY PREDICTION AMONG HOSPITALIZED PATIENTS WITH CAP IN GALDAKAO-USANSOLO HOSPITAL.
6.1 Descriptive statistics. A total of 2,351 patients, with 1,208 and 1,143 in the derivation and validation cohorts,
respectively, were included. Baseline characteristics and comorbidities are shown in
Table 1. The mean age (SD) of the entire cohort was 69 (16.58) years, with 784
(33.35%) ≥80 years old. Both cohorts were similar except for the COPD rate, which
was more frequent in the validation cohort.
Table 1. Baseline characteristics and comorbidities of hospitalized patients with CAP
in the derivation cohort, the validation cohort, and the entire cohort.
Derivation (n=1208)
Validation (n=1143)
Entire cohort (n=2351)
p-value
Age, mean (SD) 69.68 (16.51) 69.94 (16.66) 69.81 (16.58) 0.58 Age, n (%) 0.73 ≥80 years 407 (33.69%) 377 (32.98%) 784 (33.35%) <80 years 801 (66.31%) 766 (67.02%) 1567 (66.65%) Sex, n (%) Male 788 (65.23%) 752 (65.79%) 1540 (65.50%) 0.79 Female 420 (34.77%) 391 (34.21%) 811 (34.50%) 0.79
AC, n (%) 63 (5.23%) 52 (4.59%) 115 (4.92%) 0.50
Nursing home, n (%) 86 (7.12%) 68 (5.95%) 154 (6.55%) 0.28
Aspiration 44 (3.64%) 36 (3.15%) 80 (3.40%) 0.57
Comorbidities, n (%)
Diabetes mellitus 191 (15.92%) 171 (15.13%) 362 (15.54%) 0.61
COPD 278 (23.11%) 335 (29.54%) 613 (26.23%) 0.0004
Cancer 76 (6.29%) 54 (4.72%) 130 (5.53%) 0.10
CHF 81 (6.71%) 99 (8.66%) 180 (7.66%) 0.09
CAD 119 (9.88%) 105 (90.74%) 224 (9.58%) 0.62
CVD 105 (8.69%) 94 (8.22%) 199 (8.46%) 0.71
Dementia 123 (10.18%) 107 (9.36%) 230 (9.84%) 0.58
Renal failure 87 (7.20%) 89 (7.79%) 176 (7.49%) 0.64
Data are presented as n (%). AC: Alcohol consumption; COPD: Chronic obstructive pulmonary disease; CHF; Congestive heart failure; CAD; Coronary artery disease; CVD; Cerebrovascular disease.

LONG‐TERM MORTALITY IN HOSPITALIZED PATIENTS WITH COMMUNITY‐ACQUIRED PNEUMONIA
82
Table 2 shows the physical examination and radiological presentation data. Both the
derivation and validation cohorts were similar, with a predominantly alveolar pattern
and about 23% presenting multilobar and or bilateral involvement.
Table 2. Physical examination and radiological presentation of hospitalized patients
with CAP in the derivation cohort, the validation cohort, and the entire cohort.
Derivation
(n=1208)
Validation
(n=1143)
Entire cohort
(n=2351)
p-value
Confusion, n (%) 131 (10.84%) 116 (10.15%) 247(10.51%) 0.59
HR ≥125 beats/min, n (%) 116 (9.60%) 117 (10.24%) 233 (9.91%) 0.63
RR ≥30 breaths/min, n (%) 175 (14.49%) 179 (15.66%) 354 (15.06%) 0.45
SBP <90 mmHg, n (%) 52 (4.30%) 45 (3.94%) 97 (4.13%) 0.68
DBP <60 mmHg, n (%) 207 (17.29%) 200 (17.68%) 407 (17.48%) 0.83
BT ≥40°C, n (%) 4 (0.33%) 7 (0.61%) 11 (0.47%) 0.37
X-ray, n (%)
Pleural effusion 123 (10.18%) 112 (9.80%) 235 (10%) 0.78
Bilateral/multilobar 266 (22.07%) 264 (23.14%) 530 (22.59%) 0.55
Radiological pattern, n (%) 0.58
Alveolar 1188 (98.75) 1129 (99.04%) 2317 (98.81%)
Interstitial 13 (1.08%) 9 (0.79%) 22 (0.94%)
Mixed 4 (0.33%) 2 (0.18%) 6 (0.26%)
Data are presented as n (%). HR: Heart rate; RR: Respiratory rate; SBP: Systolic blood pressure; DBP: Diastolic blood pressure; BT: Body temperature.
Table 3 shows the analytical data with almost half of the population presenting with
respiratory insufficiency while one third showed a BUN >30 mg/dL. Nearly 80% of
patients in both groups received adherent antibiotic treatment according to SEPAR
guidelines within the first 8 hours. In addition, corticosteroid administration was slightly
more frequent in the validation cohort (Table 4).

Results
83
Table 3. Analytical data of hospitalized patients with CAP in the derivation cohort, the
validation cohort, and the entire cohort.
Derivation
(n=1208)
Validation
(n=1143)
Entire cohort
(n=2351)
p-value
Glucose ≥250 mg/dL, n (%) 102 (8.44%) 95 (8.31%) 197 (8.38%) 0.94
BUN >30 mg/dL, n (%) 333 (27.57%) 328 (28.70%) 661 (28.12%) 0.55
Sodium <130 mmol/L, n (%) 79 (6.54%) 73 (6.39%) 152 (6.47%) 0.93
Hematocrit <30%, n (%) 32 (2.65%) 25 (2.19%) 57 (2.42%) 0.50
PaO2 <60 mmHg, n (%) 534 (44.21%) 490 (42.87%) 1024 (43.56%) 0.53
pH <7.35, n (%) 56 (4.64%) 48 (4.20%) 104 (4.42%) 0.62
Data are presented as n (%). BUN: Blood urea nitrogen.
Table 4. Antibiotic and systemic corticosteroid treatment of hospitalized patients with
CAP in the derivation cohort, the validation cohort, and the entire cohort.
Derivation
(n=1208)
Validation
(n=1143)
Entire cohort
(n=2351)
p-value
Antibiotic, n (%)
Previous antibiotic 269 (22.31%) 263 (23.09%) 532 (22.69%) 0.66
Antibiotic according to SEPAR guidelines
964 (79.80%) 929 (81.35%) 1893 (80.55%) 0.35
Antibiotic within first 4 h 705 (60.62%) 667(60.53%) 1372 (60.57%) 0.96
Antibiotic within first 8 h 966 (83.06%) 933 (84.66%) 1899 (83.84%) 0.30
Corticosteroids, n (%) 327 (27.07%) 357 (31.23%) 684 (29.09%) 0.03
Data are presented as n (%). SEPAR: Spanish Pulmonology and Thoracic Surgery Society.
There were no statistical differences in terms of complications among the derivation
and validations cohorts. However, COPD exacerbations and decompensated
neurological diseases were significantly more frequent in the validation cohort(table 5).

LONG‐TERM MORTALITY IN HOSPITALIZED PATIENTS WITH COMMUNITY‐ACQUIRED PNEUMONIA
84
Table 5. Complications during hospitalization among hospitalized patients with CAP in
the derivation cohort, the validation cohort, and the entire cohort.
Derivation (n=1208)
Validation (n=1143)
Entire cohort (n=2351)
p-value
ICU admission, n (%) 54 (4.47%) 52 (4.55%) 106 (4.51%) >.99IRCU admission, n (%) 55 (4.55%) 51 (4.46%) 106 (4.51%) 0.92 Need for IMV, n (%) 18 (1.49%) 14 (1.22%) 32 (1.36%) 0.60 Shock, n (%) 49 (4.06%) 42 (3.67%) 91 (3.87%) 0.67 Need for vasopressors, n (%) 36 (3.64%) 31 (3.40%) 67 (3.52%) 0.80 Respiratory failure, n (%) 560 (46.36) 523 (45.76%) 1083 (46.07%) 0.77 Renal failure, n (%) 100 (8.28%) 98 (8.57%) 198 (8.42%) 0.82 Pleural effusion, n (%) 54 (4.47%) 60 (5.25%) 114 (4.85%) 0.39 Empyema, n (%) 8 (0.66%) 5 (0.44%) 13 (0.55%) 0.58 Antibiotic AE, n (%) 99 (8.20%) 77 (6.74%) 176 (7.49%) 0.18 Embolism, n (%) 6 (0.50%) 5 (0.44%) 11 (0.47%) >.99 DVT, n (%) 4 (0.33%) 3 (0.26%) 7 (0.30%) >.99 Decompensated comorbidities, n (%)
Diabetes mellitus 62 (5.13%) 41 (3.59%) 103 (4.38%) 0.07 Asthma 19 (1.57%) 22 (1.92%) 41 (1.74%) 0.53 COPD 43 (3.56%) 64 (5.60%) 107 (4.55%) 0.02 Heart disease 44 (3.64%) 38 (3.32%) 82 (3.49%) 0.74 Neurological disease 9 (0.75%) 19 (1.66%) 28 (1.19%) 0.05 Renal failure 28 (2.32%) 22 (1.92%) 50 (2.13%) 0.57
Data are presented as n (%). ICU: Intensive care unit; IRCU: Intermediate respiratory care unit; IMV: Invasive mechanical ventilation; AE: Adverse events; DVT: Deep vein thrombosis; COPD: Chronic obstructive pulmonary disease.
Table 6 shows baseline severity measured by risk scores. The mean PSI (SD) score
was 91.39 (32.73) and 91.58 (31.65) in the derivation and the validation cohorts,
respectively (p = 0.88). The mean CURB65 (SD) score was 1.63 (1.06) and 1.67
(1.05) in the derivation and the validation cohorts, respectively (p = 0.88). The mean
SCAP (SD) score was 7.67 (7.58) and 7.71 (7.26) in the derivation and the validation
cohorts, respectively (p = 0.90). About 50% of the cohort was defined as severe by the
PSI score, 20% by the CURB65 score, and 40% by SCAP score.

Results
85
Table 6. Baseline severity of hospitalized patients with CAP in the derivation cohort,
the validation cohort, and the entire cohort, measured by risk scores.
Derivation (n=1208)
Validation (n=1143)
Entire cohort (n=2351)
p-value
PSI mean (SD) 91.39 (32.73) 91.58 (31.65) 91.48 (32.20) 0.88
PSI, n (%) 0.40
I 158 (13.08%) 148 (12.95%) 306 (13.02%)
II 157 (13%) 128 (11.20%) 285 (12.12%)
III 298 (24.67%) 268 (23.45%) 566 (24.07%)
IV 464 (38.41%) 481 (42.08%) 945 (40.20%)
V 131 (10.84%) 118 (10.32%) 249 (10.59%)
PSI, n (%) 0.13
I-III 613 (50.75%) 544 (47.59%) 1157 (49.21%)
IV-V 595 (49.25%) 599 (52.41%) 1194 (50.79%)
CURB65 mean (SD) 1.63 (1.06) 1.67 (1.04) 1.65 (1.05) 0.88
CURB65, n (%) 0.66
0 213 (17.63%) 186 (16.27%) 399 (16.97%)
1 302 (25%) 287 (25.11%) 589 (25.05%)
2 450 (37.25%) 422 (36.92%) 872 (37.09%)
3 207 (17.14%) 215 (18.81%) 422 (17.95%)
4 32 (2.65%) 32 (2.80%) 64 (2.72%)
5 4 (0.33%) 1 (0.09%) 5 (0.21%)
CURB65, n (%) 0.36
0-2 965 (79.88%) 895 (78.30%) 1860 (79.12%)
3-5 243 (20.12%) 248 (21.70%) 491 (20.88%)
SCAP mean (SD) 7.67 (7.58) 7.71 (7.26) 7.69 (7.43) 0.90 SCAP, n (%) 0.19 0 369 (30.55%) 313 (27.38%) 682 (29.01%) 1 349(28.89%) 371 (32.46%) 720 (30.63%) 2 387 (32.04%) 367 (32.11%) 754 (32.07%)
3 87 (7.20%) 83 (7.26%) 170 (7.23%)
4 16 (1.32%) 9 (0.79%) 25 (1.06%)
SCAP, n (%) 0.87
0-1 718 (59.44%) 684 (59.84%) 1402 (59.63%)
2-4 490 (40.56%) 459 (40.16%) 949 (40.37%)
Data are presented as n (%) or mean (SD). PSI: Pneumonia severity index; CURB65: Confusion, urea, respiratory rate, blood pressure, age >65. SCAP: Severe community acquired pneumonia.

LONG‐TERM MORTALITY IN HOSPITALIZED PATIENTS WITH COMMUNITY‐ACQUIRED PNEUMONIA
86
In total, 208 (7.99%) patients died during hospitalization, while 251 patients died
before 15 days from diagnosis. After deaths before 15 days were excluded, one-year
mortality was 10.63%, respectively. No differences were observed between the
derivation and the validation cohorts in terms of mortality (Table 7).
Table 7. Mortality rates of hospitalized patients with CAP in the derivation cohort, the
validation cohort, and the entire cohort, after the exclusion of deaths before 15 days
from diagnosis.
Derivation
(n=1208)
Validation
(n=1143)
Entire cohort
(n=2351)
p-value
30-day mortality, n (%) 23 (1.90%) 16 (1.40%) 39 (1.66%) 0.42
45-day mortality, n (%) 30 (2.48%) 27 (2.36%) 57 (2.42%) 0.89
90-day mortality, n (%) 60 (4.97%) 51 (4.46%) 111 (4.72%) 0.63
180-day mortality, n (%) 88 (7.28%) 77 (6.74%) 165 (7.02%) 0.63
One-year mortality, n (%) 131 (10.84%) 119 (10.41%) 250 (10.63%) 0.74
Data are presented as n (%).

Results
87
6.2 Univariate analysis In order to identify possible predictors of one-year mortality we first performed
univariate analysis, taking into account the variables more likely associated with that
outcome.
Table 8 shows the baseline characteristics and comorbidities among survivors and
non-survivors. The mean (SD) age in survivors was 68.46 years (16.71) and 79.71
years (10.23) in non-survivors (p <0.0001). Compared with survivors at one year, non-
survivors were older and were more frequently nursing home residents. Once
comorbidities were analyzed, there were no statistical differences in diabetes mellitus,
COPD, or CAD. However, cancer, congestive heart failure, cerebrovascular disease,
and dementia were more common in people who died within one year of CAP
diagnosis.
Table 8. Baseline characteristics and comorbidities of survivors and non-survivors at
one year in the derivation cohort.
Alive (n=1077)
Dead (n=131)
p-value
Age, mean (SD) 68.46 (16.71) 79.71 (10.23) <0.0001 Age ≥80 years, n (%) 323 (79.36%) 84 (20.64%) <0.0001 Sex, n (%) 0.44 Male 698 (64.81%) 90 (68.70%) Female 379 (35.19%) 41 (31.30%) AC, n (%) 58 (5.40%) 5 (3.88%) 0.67 Nursing home, n (%) 56 (5.20%) 30 (22.90%) <0.0001 Aspiration 27 (61.36%) 17 (38.64%) <0.0001 Comorbidities, n (%) Diabetes mellitus 166 (15.50%) 25 (19.38%) 0.25 COPD 249 (23.18%) 29 (22.48%) 0.91 Cancer 59 (5.48%) 17 (12.98%) 0.0033 CHF 65 (6.04%) 16 (12.21%) 0.01 CAD 101 (9.40%) 18 (13.95%) 0.12 CVD 80 (7.43%) 25 (19.08%) <0.0001 Dementia 81 (7.53%) 42 (32.56%) <0.0001 Renal failure 72 (6.69%) 15 (11.45%) 0.07
Data are presented as n (%) or mean (SD). AC: Alcohol consumption; COPD: Chronic obstructive pulmonary disease; CHF; Congestive heart failure; CAD; Coronary artery disease; CVD; Cerebrovascular disease.

LONG‐TERM MORTALITY IN HOSPITALIZED PATIENTS WITH COMMUNITY‐ACQUIRED PNEUMONIA
88
Table 9 shows the physical examination, radiological presentation and analytics data
among survivors and non-survivors. Non-survivors presented more frequently
confusion and a respiratory rate ≥30 breaths/min compared to survivors. In terms of
analytics, people who died presented more commonly BUN >30 mmol/L, hematocrit
<30%, and respiratory insufficiency.
Table 9. Physical examination, radiological presentation, analytics and treatment of
survivors and non-survivors at one year in the derivation cohort.
Alive (n=1077)
Dead (n=131)
p-value
Physical examination, n (%) Confusion 96(8.91%) 35 (26.72%) <0.0001 HR ≥125 beats/min 108 (10.03%) 8 (6.11%) 0.21 RR ≥30 breaths/min 144 (13.37%) 31 (23.66%) 0.0035 SBP <90 mmHg 46 (4.27%) 6 (4.58%) 0.82 DBP <60 mmHg 181 (16.93%) 26 (20.31%) 0.32 BT ≥40°C 4 (0.37%) 0 (0%) >.99 X-ray, n (%) Pleural effusion 114 (10.58%) 9 (6.87%) 0.22 Multilobar/bilateral 233 (21.67%) 33 (25.38%) 0.37 Radiological pattern, n (%) 0.68 Alveolar 1060 (98.60%) 128 (98.46%) Interstitial 11 (1.02%) 2 (1.54%) Mixed 4 (0.37%) 0 (0%) Analytics, n (%) Glucose ≥250 mg/dL 91 (8.45%) 11 (8.40%) >.99 BUN >30 mg/dL 270 (25.07%) 63 (48.09%) <0.0001 Sodium <130 mmol/L 69 (6.41%) 10 (7.63%) 0.57 Hematocrit <30% 24 (2.23%) 8 (6.11%) 0.02 PaO2 <60 mmHg 458 (42.53%) 76 (58.02%) 0.0010 pH <7.35 47 (4.36%) 9 (6.87%) 0.19 Treatment, n (%) Previous antibiotic 242 (22.51%) 27 (20.61%) 0.66 Antibiotic according to SEPAR guidelines
862 (80.04%) 102 (77.86%) 0.56
Antibiotic within first 4 h 618 (59.71%) 87 (67.97%) 0.08 Antibiotic within first 8 h 861 (83.19%) 105 (82.03%) 0.71 Corticosteroids 282 (26.18%) 45 (34.35%) 0.06
Data are presented as n (%). HR: Heart rate; RR: Respiratory rate; SBP: Systolic blood pressure; DBP: Diastolic blood pressure; BT: Body temperature; BUN: Blood urea nitrogen; SEPAR: Spanish Pulmonology and Thoracic Surgery Society.

Results
89
Severe sepsis was observed more commonly in non-survivors, as were respiratory
insufficiency and renal failure. Compared with survivors at one year, non-survivors
more frequently developed decompensations from previous cardiac and neurologic
diseases (Table 10).
Table 10. Complications during hospitalization of survivors and non-survivors at one
year in the derivation cohort.
Alive (n=1077)
Dead (n=131)
p-value
ICU admission, n (%) 53 (4.92%) 1 (0.76%) 0.02 IRCU admission, n (%) 52 (4.83%) 3 (2.29%) 0.26 Need for IMV, n (%) 18 (1.67%) 0 (0%) 0.25 Shock, n (%) 44 (4.09%) 5 (3.82%) >.99 Need for vasopressors, n (%) 36 (4.06%) 0 (0%) 0.03 Respiratory failure, n (%) 480 (44.57%) 80 (61.07%) 0.0003 Renal failure, n (%) 85 (7.89%) 15 (11.45%) 0.18 Pleural effusion, n (%) 47 (4.36%) 7 (5.34%) 0.65 Antibiotic AE, n (%) 90 (8.36%) 9 (6.87%) 0.73 Embolism, n (%) 4 (0.37%) 2 (1.53%) 0.13 DVT, n (%) 3 (0.28%) 1 (0.76%) 0.37 Decompensated comorbidities, n (%)
Diabetes mellitus 55 (5.11%) 7 (5.34%) 0.83 Asthma 19 (1.76%) 0 (0%) 0.25 COPD 35 (3.25%) 8 (6.11%) 0.13 Heart disease 35 (3.25%) 9 (6.87%) 0.0467 Neurological disease 5 (0.46%) 4 (3.05%) 0.01 Renal failure 22 (2.04%) 6 (4.58%) 0.11
Data are presented as n (%). ICU: Intensive care unit; IRCU: Intermediate respiratory care unit; IMV: Invasive mechanical ventilation; AE: Adverse events; DVT: Deep vein thrombosis; COPD: Chronic obstructive pulmonary disease.
Table 11 shows severity of illness among survivors and non-survivors. Patients who
died within one year were more severely ill at the time of diagnosis or at the index
admission, as evidenced by higher risk scores.

LONG‐TERM MORTALITY IN HOSPITALIZED PATIENTS WITH COMMUNITY‐ACQUIRED PNEUMONIA
90
Table 11. Severity of illness measured by risk scores of survivors and non-survivors at
one year in the derivation cohort.
Alive (n=1077)
Dead (n=131)
p-value
PSI mean (SD) 88.23 (31.60) 117.35 (30.36) <0.0001
PSI, n (%) <0.0001
I 157 (14.58%) 1 (0.76%)
II 150 (13.93%) 7 (5.34%)
III 282 (26.18%) 16 (12.21%)
IV 400 (37.14%) 64 (48.85%)
V 88 (8.17%) 43 (32.82%)
PSI, n (%) <0.0001
I-III 589 (54.69%) 24 (18.32%)
IV-V 488 (45.31%) 107 (81.68%)
CURB65 mean (SD) 1.55 (1.03) 2.31 (1.03) <0.0001
CURB65, n (%) <0.0001
0 206 (19.13%) 7 (5.34%)
1 285 (26.46%) 17 (12.98%)
2 399 (37.05%) 51 (38.93%)
3 166 (15.41%) 41(31.30%)
4 18 (1.67%) 14 (10.69%)
5 3 (0.28%) 1 (0.76%)
CURB65, n (%) <0.0001
0-2 890 (82.64%) 75 (57.25%)
3-5 187 (17.36%) 56 (42.75%)
SCAP mean (SD) 7.05 (7.30) 12.77 (7.93) <0.0001
SCAP, n (%) <0.0001
0 357 (33.15%) 12 (9.16%)
1 324 (30.08%) 25 (19.08%)
2 320 (29.71%) 67 (51.15%)
3 63 (5.85%) 24 (18.32%)
4 13 (1.21%) 3 (2.29%)
SCAP, n (%) <0.0001
0-1 681 (63.23%) 37 (28.24%)
2-4 396 (36.77%) 94 (71.76%)
Data are presented as n (%) or mean (SD). PSI: Pneumonia severity index; CURB65: Confusion, urea, respiratory rate, blood pressure, age>65. SCAP: Severe community acquired pneumonia.
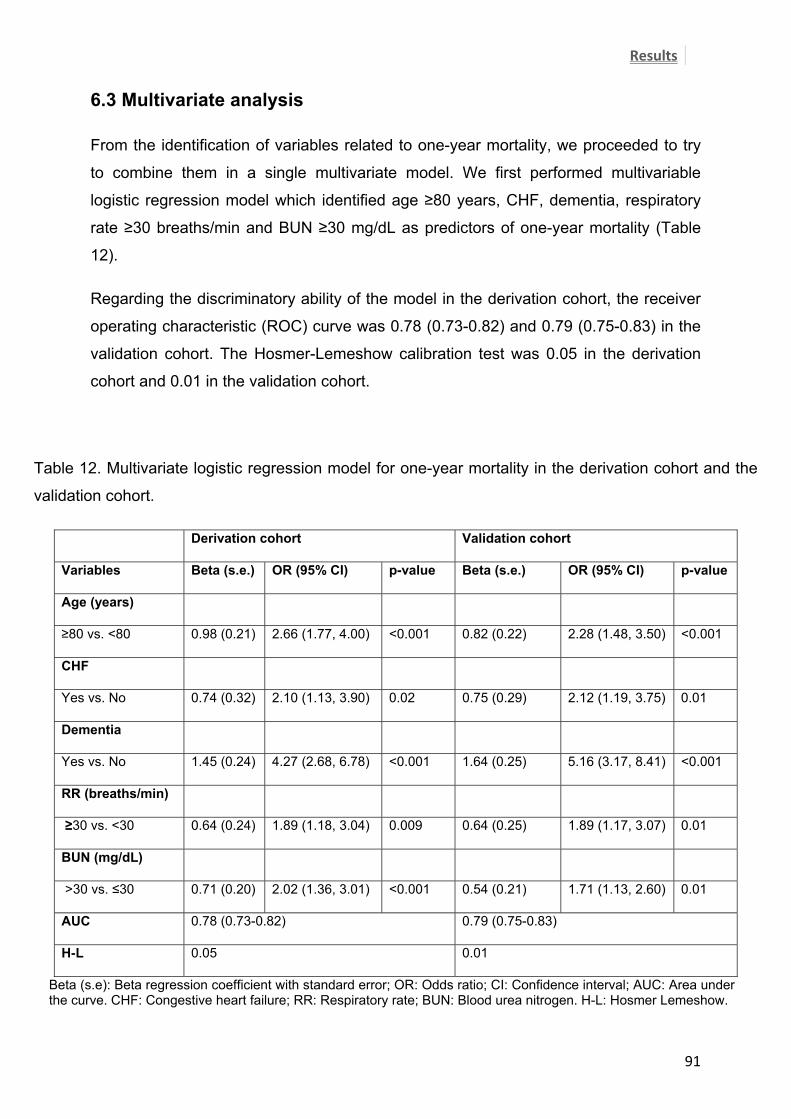
Results
91
6.3 Multivariate analysis From the identification of variables related to one-year mortality, we proceeded to try
to combine them in a single multivariate model. We first performed multivariable
logistic regression model which identified age ≥80 years, CHF, dementia, respiratory
rate ≥30 breaths/min and BUN ≥30 mg/dL as predictors of one-year mortality (Table
12).
Regarding the discriminatory ability of the model in the derivation cohort, the receiver
operating characteristic (ROC) curve was 0.78 (0.73-0.82) and 0.79 (0.75-0.83) in the
validation cohort. The Hosmer-Lemeshow calibration test was 0.05 in the derivation
cohort and 0.01 in the validation cohort.
Table 12. Multivariate logistic regression model for one-year mortality in the derivation cohort and the
validation cohort.
Derivation cohort Validation cohort
Variables Beta (s.e.) OR (95% CI) p-value Beta (s.e.) OR (95% CI) p-value
Age (years)
≥80 vs. <80 0.98 (0.21) 2.66 (1.77, 4.00) <0.001 0.82 (0.22) 2.28 (1.48, 3.50) <0.001
CHF
Yes vs. No 0.74 (0.32) 2.10 (1.13, 3.90) 0.02 0.75 (0.29) 2.12 (1.19, 3.75) 0.01
Dementia
Yes vs. No 1.45 (0.24) 4.27 (2.68, 6.78) <0.001 1.64 (0.25) 5.16 (3.17, 8.41) <0.001
RR (breaths/min)
≥30 vs. <30 0.64 (0.24) 1.89 (1.18, 3.04) 0.009 0.64 (0.25) 1.89 (1.17, 3.07) 0.01
BUN (mg/dL)
>30 vs. ≤30 0.71 (0.20) 2.02 (1.36, 3.01) <0.001 0.54 (0.21) 1.71 (1.13, 2.60) 0.01
AUC 0.78 (0.73-0.82) 0.79 (0.75-0.83)
H-L 0.05 0.01
Beta (s.e): Beta regression coefficient with standard error; OR: Odds ratio; CI: Confidence interval; AUC: Area under the curve. CHF: Congestive heart failure; RR: Respiratory rate; BUN: Blood urea nitrogen. H-L: Hosmer Lemeshow.

LONG‐TERM MORTALITY IN HOSPITALIZED PATIENTS WITH COMMUNITY‐ACQUIRED PNEUMONIA
92
6.4 Score development The logistic regression model was satisfactorily replicated in the multivariable survival
analysis with similar p-values (Table 13). In order to develop a one-year mortality CAP
severity index, now called the one-year CAPSI (community acquired pneumonia
severity index), a prediction score was developed using the beta coefficients to weight
the relative importance of the categories of each variable. Dementia being weighted
with 6 points, followed by age ≥80 scored with 4 points, BUN >30 mg/dL scored with 3
points, and CHF and respiratory rate ≥30 breaths/min, both scored with 2 points. The
prediction score distribution for each patient in the derivation and the validation cohort
is shown in Figure 1.
Table 13. Multivariate survival analysis for one-year mortality in the derivation cohort and the validation
cohort, i.e. one-year CAPSI.
Derivation cohort Validation cohort
Variables Beta (s.e.) HR (95% CI) p-value Weight Beta (s.e.) HR (95% CI) p-value
Age (years) 4
≥80 vs. <80 0.87 (0.20) 2.39 (1.63,3.50) <0.001 0.74 (0.21) 2.10 (1.40,3.15) 0.0003
CHF 2
Yes vs. No 0.57 (0.27) 1.78 (1.05,3) 0.0331 0.52 (0.24) 1.68 (1.04,2.72) 0.03
Dementia 6
Yes vs. No 1.20 (0.20) 3.33 (2.25,4.91) <0.001 1.38 (0.21) 3.98 (2.64,5.99) <0.001
RR (breaths/min) 2
≥30 vs. <30 0.49 (0.21) 1.63 (1.09,2.45) 0.018 0.49 (0.21) 1.63 (1.08,2.47) 0.02
BUN (mg/dL) 3
>30 vs. ≤30 0.66 (0.18) 1.93 (1.35,2.75) <0.0003 0.44 (0.19) 1.55 (1.07,2.24) 0.02
GND test 0.03 0.23
Beta (s.e): Beta regression coefficient with standard error; HR: Hazard ratio; CI: Confidence interval. CHF: Congestive heart failure; RR: Respiratory rate; BUN: Blood urea nitrogen. GND test: Greenwood-Nam-D'agostino calibration test for the one-year CAPSI as a continuous variable.

Results
93
Figure 1. One-year CAPSI distribution in the derivation cohort and validation cohort.
For each unit increase in the score, the one-year mortality risk increased by 24% (1.24
(1.19, 1.28), HR (95%CI)). The one-year CAPSI was then categorized into three risk
groups: low, moderate, and high risk, according to the one-year CAPSI risk score
(Table 14). One-year mortality risk ranged from 3.35% in the lowest group to 28.38%
in the highest group in the derivation cohort.
Similarly, one-year mortality risk ranged from 4.21% in the lowest group to 25% in the
highest group in the validation cohort. Therefore, an 82-year-old patient with dementia
would have 9.91 (6.30, 15.59) (HR (95%CI)) times higher probability of dying one year
after an admission for CAP. At the same time, a 50-year-old patient with congestive
heart failure and a respiratory rate of 32 breaths/min would have a 3.19 (1.75, 5.83)
(HR (95%CI)) times higher probability of dying one year after an admission for CAP.
Score punctua on
Derivation
Validation Mortality %

LONG‐TERM MORTALITY IN HOSPITALIZED PATIENTS WITH COMMUNITY‐ACQUIRED PNEUMONIA
94
Table 14. Multivariate survival analysis for one-year mortality in the derivation cohort and the validation
cohort by risk stratification groups.
HR: Hazard ratio; CI: Confidence interval. GND test: Greenwood-Nam-D'agostino calibration test for the one-year CAPSI as categorical variable. *Hazard risk of each increase in one unit in the one-year CAPSI.
Derivation cohort Validation cohort
Variables Dead/exposed HR (95% CI) p-value Dead/exposed HR (95% CI) p-value
One-year CAPSI*
- 1.24 (1.19, 1.28) <0.001 1.21 (1.17, 1.26) <0.001
One-year CAPSI
0-3 24/717 (3.35%) Reference 29/689 (4.21%) Reference
4-5 19/184 (10.33%) 3.19 (1.75, 5.83) 0.0002 21/168 (12.5%) 3.03 (1.73, 5.32) <0.001
>5 86/303 (28.38%) 9.91 (6.30, 15.59) <0.001 69/276 (25%) 5.95 (3.86, 9.19) <0.001
GND test 0.98 0.93

Results
95
6.5 Validation, discrimination, calibration and classification measures The C-index of the one-year CAPSI as a continuous variable in the derivation cohort
was 0.76 (0.024), the AIC was 1707.43, and R2 was 8.8%. In the validation cohort, the
C-index of the one-year CAPSI as a continuous variable was 0.77 (0.025), the AIC
was 1589.23, and R2 was 8.5%. When the one-year CAPSI was measured as a
categorical variable, i.e. the one-year CAPSI risk score, the C-index of the derivation
cohort was 0.72 (0.021), the AIC was 1715.30 and R2 was 8.2%. In the validation
cohort, the C-index of the one-year CAPSI as a categorical variable was 0.70 (0.023),
the AIC was 1589.23 and R2 was 6.3%.
Table 15 shows the statistical measures of performance with different cut-offs of the
one-year CAPSI. For a cut-off point of four for the one-year CAPSI, the results of the
statistical measures of performance were sensitivity 81.40%, specificity 64.47%,
positive predictive value (PPV) 21.56%, and negative predictive value (NPV) 96.65%
with an accuracy of 66.28% for the derivation cohort. In the validation cohort,
sensitivity was 75.63%, specificity 65.09%, PPV 20.27%, and NPV 95.79% with an
accuracy of 66.20%.
For a cut-off of six for the one-year CAPSI, sensitivity was 66.67%, specificity 79.81%,
PPV 28.38%, and NPV 95.23% with an accuracy of 78.41% in the derivation cohort. In
the validation cohort, sensitivity was 57.98%, specificity 79.59%, PPV 25%, and NPV
94.17% with an accuracy of 77.32%.
For a cut-off of eight for the one-year CAPSI, sensitivity was 39.53%, specificity
90.70%, PPV 33.77%, and NPV 95.59% with an accuracy of 85.22% in the derivation
cohort. In the validation cohort, sensitivity was 40.34%, specificity 90.83%, PPV
34.04%, and NPV 92.84% with an accuracy of 85.53%.
The Greenwood-Nam-D'agostino (GND) calibration test for survival models for the
multivariate model was 0.002 and 0.49 in the derivation and the validation cohorts,
respectively. The GND calibration test for the survival model for the one-year CAPSI
as a continuous variable was 0.03 and 0.23 in the derivation and the validation
cohorts, respectively.

LONG‐TERM MORTALITY IN HOSPITALIZED PATIENTS WITH COMMUNITY‐ACQUIRED PNEUMONIA
96
Finally, the GND calibration test for the survival model for one-year CAPSI as a
categorical variable, i.e. the one-year CAPSI risk score, was 0.98 and 0.93 in the
derivation and the validation cohorts, respectively.
Table 15. Statistical measures of performance with different cut-offs for one-year
CAPSI.
Sensitivity (%)
(95%CI)
Specificity (%)
(95% CI)
PPV (%)
(95%CI)
NPV (%)
(95%CI)
Accuracy (%)
(95%CI)
Derivation
≥4 81.40 (73.59-87.70) 64.47 (61.52-67.33) 21.56 (17.99-25.48) 96.65 (95.06-97.84) 66.28 (63.53-68.95)
≥6 95.23 (93.63-96.52) 78.41 (75.97-80.70) 66.67 (57.83-74.72) 79.81 (77.29-82.18) 28.38 (23.37-33.82)
≥8 39.53 (31.04-48.52) 90.70 (88.80-92.37) 33.77 (26.29-41.91) 92.59 (90.84-94.10) 85.22 (83.08-87.17)
Validation
≥4 75.63 (66.91-83.03) 65.09 (62.06-68.02) 20.27 (16.63-24-32) 95.79 (94.01-97.16) 66.20 (63.36-68.95)
≥6 57.98 (48.59-66.97) 79.59 (76.97-82.03) 25 (20-30.54) 94.17 (92.38-95.64) 77.32 (74.77-79.73)
≥8 40.34 (31.45-49.72) 90.83 (88.88-92.53) 34.04 (26.28-42.49) 92.84 (91.06-94.37) 85.53 (83.3487.52)
PPV: Positive predictive value; NPV: Negative predictive value; CI: Confidence interval.

Results
97
6.6 Comparison with other scores The association between the severity of illness, measured by different risk scores, and
one-year mortality in the derivation is shown in Table 16. Higher scores on PSI,
CURB65, SCAP, and one-year CAPSI were associated with a higher risk of one-year
mortality (Figures 2-5).
Table 16. Hazard ratios for the association between the severity of illness measured
by risk scores and one-year mortality in the derivation cohort.
One-year mortality Beta (s.e.) HR (95% CI) p-value
PSI 0.91 (0.11) 2.49 (2.02,3.06) <0.0001
PSI
I-III Reference
IV-V 1.61 (0.23) 4.99 (3.21,7.77) <0.0001
CURB65 0.67 (0.08) 1.95 (1.66,2.30) <0.0001
CURB65
≤2 Reference
>2 1.20 (0.18) 3.31 (2.34,4.68) <0.0001
SCAP 0.67 (0.08) 1.95 (1.66,2.30) <0.0001
SCAP
<2 Reference
≥2 1.41 (0.19) 4.09 (2.79, 5.98) <0.0001
One-year CAPSI 0.21 (0.02) 1.24 (1.19,1.28) <0.0001
One-year-CAPSI
≤3 Reference
>3 1.97 (0.23) 7.17 (4.62,11.74) <0.0001
Beta (s.e): Beta regression coefficient with standard error; HR: Hazard ratio; CI: Confidence interval. PSI: Pneumonia severity index; CURB65: Confusion, urea, respiratory rate, blood pressure, age>65; SCAP: Severe community-acquired pneumonia; one-year CAPSI: one-year community-acquired severity index.

LONG‐TERM MORTALITY IN HOSPITALIZED PATIENTS WITH COMMUNITY‐ACQUIRED PNEUMONIA
98
Figure 2. Kaplan-Meier survival curve for the derivation cohort, stratified by PSI risk
groups.
Figure 3. Kaplan-Meier survival curve for the derivation cohort, stratified by CURB65
risk groups.
0.0 0.2 0.4 0.6 0.8 1.0
0.0
0.2
0.4
0.6
0.8
1.0
Time
Sur
viva
l Pro
babi
lity
PSIIV-VI-II-III
One-year mortality for PSI risk scale groups in the derivation sample
0.0 0.2 0.4 0.6 0.8 1.0
0.0
0.2
0.4
0.6
0.8
1.0
Time
Sur
viva
l Pro
babi
lity
CURB65III-IV-V0-I-II
One-year mortality for CURB65 risk scale groups in the derivation sample

Results
99
0.0 0.2 0.4 0.6 0.8 1.0
0.0
0.2
0.4
0.6
0.8
1.0
Time
Sur
viva
l Pro
babi
lity
SCAP>=2<2
One-year mortality for SCAP risk scale groups in the derivation sample
Figure 4. Kaplan-Meier survival curve for the derivation cohort, stratified by SCAP risk
groups.
Figure 5. Kaplan-Meier survival curve for the derivation cohort, stratified by one-year
CAPSI risk groups.
0.0 0.2 0.4 0.6 0.8 1.0
0.0
0.2
0.4
0.6
0.8
1.0
Time
Sur
viva
l Pro
babi
lity
1-year CAPSI>3<=3
One-year mortality for 1-year CAPSI risk scale groups in the derivation sample

LONG‐TERM MORTALITY IN HOSPITALIZED PATIENTS WITH COMMUNITY‐ACQUIRED PNEUMONIA
100
Table 17 shows the association between the severity of illness, measured by risk
scores, and one-year mortality in the validation cohort. Higher scores on PSI,
CURB65, SCAP, and one-year CAPSI were associated with a higher risk of one-year
mortality (Figures 6-9).
Table 17. Hazard ratios for the association between the severity of illness measured by
risk scores and one-year mortality in the validation cohort.
One year mortality
Beta (s.e.) HR (95% CI) p-value
PSI 1.10 (0.12) 3.00 (2.35,3.83) <0.0001
PSI
I-III
IV-V 2.38 (0.33) 10.82 (5.66, 20.68) <0.0001
CURB65 0.72 (0.09) 2.08 (1.74, 2.49) <0.0001
CURB65
≤2 Reference
>2 1.17 (0.18) 3.22 (2.24,4.61) <0.0001
SCAP 0.69 (0.09) 2.00 (1.66,2.41) <0.0001
SCAP
<2 Reference
≥2 1.39 (0.20) 4.03 (2.71, 6.00) <0.0002
One-year CAPSI 0.20 (0.02) 1.23 (1.18,1.28) <0.0001
One-year CAPSI
≤3 Reference
>3 1.67 (0.21) 5.29 (3.48,8.05) <0.0001
Beta (s.e): Beta regression coefficient with standard error HR: Hazard ratio; CI: Confidence interval. PSI: Pneumonia severity index; CURB65: Confusion, urea, respiratory rate, blood pressure, age>65. SCAP: Severe community acquired pneumonia; one-year CAPSI: one-year community-acquired severity index.

Results
101
Figure 6. Kaplan-Meier survival curve for the validation cohort, stratified by PSI risk
groups.
Figure 7. Kaplan-Meier survival curve for the validation cohort, stratified by CURB65
risk groups.
0.0 0.2 0.4 0.6 0.8 1.0
0.0
0.2
0.4
0.6
0.8
1.0
Time
Sur
viva
l Pro
babi
lity
PSIIV-VI-II-III
One-year mortality for PSI risk scale groups in the validation sample
0.0 0.2 0.4 0.6 0.8 1.0
0.0
0.2
0.4
0.6
0.8
1.0
Time
Sur
viva
l Pro
babi
lity
CURB65III-IV-V0-I-II
One-year mortality for CURB65 risk scale groups in the validation sample

LONG‐TERM MORTALITY IN HOSPITALIZED PATIENTS WITH COMMUNITY‐ACQUIRED PNEUMONIA
102
Figure 8. Kaplan-Meier survival curve for the validation cohort, stratified by SCAP risk
groups.
Figure 9. Kaplan-Meier survival curve for the validation cohort, stratified by one-year
CAPSI risk groups.
0.0 0.2 0.4 0.6 0.8 1.0
0.0
0.2
0.4
0.6
0.8
1.0
Time
Sur
viva
l Pro
babi
lity
SCAP>=2<2
One-year mortality for SCAP risk scale groups in the validation sample
0 2 4 6 8
0.0
0.2
0.4
0.6
0.8
1.0
Time
Sur
viva
l Pro
babi
lity
1-year CAPSI>3<=3
One-year mortality for 1-year CAPSI risk scale groups in the validation sample

Results
103
Table 18 shows the predictive accuracy of different risk scores as continuous
variables for one-year mortality in the derivation and the validation cohorts. One-year
CAPSI showed the best predictive accuracy in the derivation cohort with a C-index of
0.76, followed by PSI with a C-index of 0.73 (p=0.18), CURB65 0.69 (p=0.009) and
SCAP 0.70 (p=0.025). Likewise, one-year CAPSI showed the best predictive accuracy
in the validation cohort with a C-index of 0.77, followed by PSI with a C-index of 0.75
(p=0.39), CURB65 0.71 (p=0.03), and SCAP 0.70 (p=0.01). The p values refer to
statistical differences between one-year CAPSI C-index with other prediction scores.
Table 18. Predictive accuracy and goodness of fit for one-year mortality of continuous
risk scores.
Derivation Validation
C-index AIC R2 C-index AIC R2
PSI 0.73 (0.024) 1750.74 7.6% 0.75 (0.025) 1556.01 9.1%
CURB65 0.69 (0.024) 1782.87 5.2% 0.71 (0.025) 1598.38 5.7%
SCAP 0.70 (0.024) 1784.05 5.1% 0.70 (0.025) 1608.79 4.8%
One-year CAPSI 0.76 (0.024) 1707.43 8.8% 0.77 (0.025) 1562.67 8.5%
AIC: Akaike information criterion; R2: R-square. PSI: Pneumonia severity index; CURB65: Confusion, urea, respiratory rate, blood pressure, age>65. SCAP: Severe community acquired pneumonia; one-year CAPSI: one-year community-acquired severity index.
Table 19 shows the predictive accuracy of different risk scores as categorical
variables for one-year mortality in the derivation and the validation cohorts. One-year
CAPSI showed the best predictive accuracy in the derivation cohort with a C-index of
0.72, followed by PSI with a C-index of 0.67 (p=0.065), CURB65 0.62 (p<0.001) and
SCAP 0.67 (p=0.065). Likewise, one-year CAPSI showed the best predictive accuracy
in the validation cohort with a C-index 0.70, followed by PSI with a C-index of 0.71
(p=0.519), CURB65 0.62 (p=0.02), and SCAP 0.67 (p=0.36). The p values refer to
statistical differences between one-year CAPSI C-index with other prediction rules.

LONG‐TERM MORTALITY IN HOSPITALIZED PATIENTS WITH COMMUNITY‐ACQUIRED PNEUMONIA
104
0.0 0.2 0.4 0.6 0.8 1.0
0.0
0.2
0.4
0.6
0.8
1.0
ROC Curve analysis for continuous risk scores in the derivation sample
1-Specificity
Sen
sitiv
ity
PSISCAPCURB651-year CAPSI
Table 19. Predictive accuracy and goodness of fit for one-year mortality of categorical
risk scores.
Derivation Validation
C-index AIC R2 C-index AIC R2
PSI 0.67 (0.022) 1780.09 5.4% 0.71 (0.023) 1569.64 8%
CURB65 0.62 (0.017) 1805.63 3.3% 0.62 (0.019) 1628.26 3.2%
SCAP 0.67 (0.021) 1787.01 4.8% 0.67 (0.012) 1611.58 4.6%
one-year CAPSI 0.72 (0.021) 1715.30 8.2% 0.70 (0.023) 1589.23 6.3%
AIC: Akaike information criterion; R2: R-square. PSI: Pneumonia severity index; CURB65: Confusion, urea, respiratory rate, blood pressure, age>65. SCAP: Severe community acquired pneumonia.
Figures 10 and 11 show the ROC analysis for continuous risk scores in the derivation
and validation cohorts. Figures 12 and 13 show ROC analysis for categorical risk
scores in the derivation and validation cohorts.
Figure 10. ROC curve analysis for continuous risk scores in the derivation cohort.

Results
105
0.0 0.2 0.4 0.6 0.8 1.0
0.0
0.2
0.4
0.6
0.8
1.0
ROC Curve analysis for categorical risk scores in the derivation sample
1-Specificity
Sen
sitiv
ity
PSISCAPCURB651-year CAPSI
Figure 11. ROC curve analysis for continuous risk scores in the validation cohort.
Figure 12. ROC curve analysis for categorical risk scores in the derivation cohort.
0.0 0.2 0.4 0.6 0.8 1.0
0.0
0.2
0.4
0.6
0.8
1.0
ROC Curve analysis for continuous risk scores in the validation sample
1-Specificity
Sen
sitiv
ity
PSISCAPCURB651-year CAPSI

LONG‐TERM MORTALITY IN HOSPITALIZED PATIENTS WITH COMMUNITY‐ACQUIRED PNEUMONIA
106
Figure 13. ROC curve analysis for categorical risk scores in the validation cohort.
0.0 0.2 0.4 0.6 0.8 1.0
0.0
0.2
0.4
0.6
0.8
1.0
ROC Curve analysis for categorical risk scores in the validation sample
1-Specificity
Sen
sitiv
ity
PSISCAPCURB651-year CAPSI

Results
107
STUDY II. ROLE OF BIOMARKERS FOR ONE-YEAR MORTALITY PREDICTION AMONG HOSPITALIZED PATIENTS WITH CAP IN GALDAKAO-USANSOLO HOSPITAL.
6.1 Descriptive statistics For this second study, 231 patients in whom blood samples could be obtained were
included after the exclusion of deaths within 15 days of diagnosis. Of these patients,
38.10% were ≥80 years old, male sex was more frequent and 21.21% had been on
previous antibiotic treatment. COPD was the most frequent comorbidity, with diabetes
mellitus and CVD being the second and third, respectively (Table 20).
Table 20. Baseline characteristics and comorbidities of hospitalized patients with CAP
in which blood samples were obtained.
n=231
Age
<80 years 143 (61.9%)
≥80 years 88 (38.10%)
Sex
Male 154 (66.67%)
Female 77 (33.33%)
Previous antibiotic 49 (21.21%)
Comorbidities
Diabetes mellitus 40 (17.32%)
COPD 56 (24.24%)
Cancer 12 (5.19%)
Liver disease 7 (3.03%)
CHF 19 (8.23%)
CVD 28 (12.12%)
Dementia 28 (12.12%)
Renal failure 22 (9.52%)
Data are presented as n (%). COPD: Chronic obstructive pulmonary disease; CHF; Congestive heart failure; CVD; Cerebrovascular disease.

LONG‐TERM MORTALITY IN HOSPITALIZED PATIENTS WITH COMMUNITY‐ACQUIRED PNEUMONIA
108
Table 21 shows the physical examination and radiological presentation data. Around
20% of the patients presented with confusion, diastolic blood pressure less than 60
mmHg and bilateral and or multilobar involvement at diagnosis.
Table 21. Physical examination and radiological presentation of hospitalized patients
with CAP in which blood samples were obtained.
n=231
Physical examination, n (%)
Confusion 46 (19.91%)
HR ≥125 beats/min 31 (13.42%)
RR ≥30 breaths/min 17 (7.36%)
SBP <90 mmHg 4 (1.73%9
DBP <60 mmHg 44 (19.05%)
BT ≥40°C 1 (0.43%)
X-ray, n (%)
Pleural effusion 24 (10.39%)
Bilateral/multilobar 43 (18.61%)
Radiological pattern, n (%)
Alveolar 227 (98.27%)
Interstitial 3 (1.30%)
Mixed 1 (0.43%)
Data are presented as n (%). HR: Heart rate; RR: Respiratory rate; SBP: Systolic blood pressure; DBP: Diastolic blood pressure; BT: Body temperature.
Table 22 shows the analytical data with 43.72% suffering from respiratory
insufficiency, almost 30% presenting with a BUN higher than 30 mg/dL and 6.9%
presenting with glucose >250 mg/dL. More than 80% of patients received adherent
antibiotic treatment according to SEPAR guidelines and within the first 8 hours. In
addition, nearly 40% received corticosteroids during hospitalization (Table 23).

Results
109
Table 22. Analytical data of hospitalized patients with CAP in which blood samples
were obtained.
n=231
Analytics, n (%)
Glucose >250 mg/dL 16 (6.93%)
BUN >30 mg/dL 67 (29%)
Sodium <130 mmol/L 13 (5.63%)
Hematocrit <30 11 (4.76%)
PaO2 <60 mmHg 101 (43.72%)
pH arterial <7.35 13 (5.63%)
Data are presented as n (%). BUN: Blood urea nitrogen.
Table 23. Antibiotic and systemic corticosteroid treatment of hospitalized patients with
CAP in which blood samples were obtained.
n=231
Antibiotic, n (%)
Previous antibiotic 49 (21.21%)
Antibiotic according to
SEPAR guidelines
193 (83.91%)
Antibiotic within first 4 h 164 (73.54%)
Antibiotic within first 8 h 202 (90.58%)
Corticosteroids, n (%) 91 (39.39%)
Data are presented as n (%). SEPAR: Spanish Pulmonology and Thoracic Surgery Society.
Table 24 shows complications during hospitalization, the most frequent one being
respiratory failure. Of these patients, 15.58% required admission to the IRCU and
5.19% admission to the ICU. However, only eight patients required vasopressors and
only one patient needed invasive ventilation.

LONG‐TERM MORTALITY IN HOSPITALIZED PATIENTS WITH COMMUNITY‐ACQUIRED PNEUMONIA
110
Table 24. Complications during hospitalization among hospitalized patients with CAP
in which blood samples were obtained.
n=231
ICU admission, n (%) 12 (5.19%)
IRCU admission, n (%) 36 (15.58%)
Need for IMV, n (%) 1 (0.43%)
Severe sepsis, n (%) 103(44.59%)
Need for vasopressors, n (%) 8 (3.46%)
Respiratory failure, n (%) 98 (42.42%)
Renal failure, n (%) 31 (13.42%)
Pleural effusion, n (%) 21 (9.09%)
Antibiotic AE, n (%) 10 (4.33%)
Embolism, n (%) 1 (0.43%)
DVT, n (%) 2 (0.87%)
Decompensated comorbidities, n (%)
Diabetes mellitus 14 (6.06%)
Asthma 9 (3.90%)
COPD 10 (4.33%)
Heart disease 10 (4.33%)
Neurological disease 10 (4.33%)
Renal failure 8 (3.46%)
Data are presented as n (%). ICU: Intensive care unit; IRCU: Intermediate respiratory care unit; IMV: Invasive mechanical ventilation; AE: Adverse events; DVT: Deep vein thrombosis; COPD: Chronic obstructive pulmonary disease.
Table 25 shows the severity of illness at diagnosis. The mean PSI (SD) score was
93.30 (36.14), the mean CURB65 (SD) score was 1.71 (1.09), and the mean SCAP
score was 7.79 (7.57). About 50% of the cohort was defined as severe by the PSI
score, 23% by the CURB65 score and 42% by the SCAP score.

Results
111
Table 25. Baseline severity of hospitalized patients with CAP in which blood samples
were obtained.
Data are presented as n (%) or mean (SD). PSI: Pneumonia severity index; CURB65: Confusion, urea, respiratory rate, blood pressure, age >65. SCAP: Severe community acquired pneumonia.
n=231
PSI mean (SD) 93.30 (36.14)
PSI, n (%)
I 32 (13.85%)
II 26 (11.26%)
III 54 (23.38%)
IV 86 (37.23%)
V 33 (14.29%)
PSI, n (%)
I-III 112 (48.48)
IV-V 119 (51.52%)
CURB65 mean (SD) 1.71 (1.09)
CURB65, n (%)
0 39 (16.88%)
1 52 (22.51%)
2 86 (37.23%)
3 44 (19.05%)
4 10 (4.33%)
5 -
CURB65, n (%)
0-2 177 (76.62%)
3-5 54 (23.38%)
SCAP mean (SD) 7.79 (7.57) SCAP, n (%) O 68 (29.44%) 1 65 (28.14%) 2 75 (32.47%)
3 21 (9.09%)
4 2 (0.87%)
SCAP, n (%)
0-1 133 (57.58%)
2-4 98 (42.42%)
One-year CAPSI mean (SD) 3.43 (3.69)
One-year CAPSI, n (%)
≤3 129 (55.84%)
>3 102 (44.16%)

LONG‐TERM MORTALITY IN HOSPITALIZED PATIENTS WITH COMMUNITY‐ACQUIRED PNEUMONIA
112
Table 26 shows the mortality rate excluding deaths within the first 15 days as well as
including all deaths up to one year. Within one year, 51 (19.78%) patients died
including all deaths, 20 patients during hospitalization, 7 after discharge up to 15 days
after diagnosis, and 24 patients 15 days after diagnosis up to one year. After the
exclusion of 27 patients who died within 15 days of diagnosis, 24 (10.39%) died within
one year.
Table 26. Mortality rates of hospitalized patients with CAP in whom blood samples
could be obtained (n=231).
Including all deaths within one year N= 258
In-hospital mortality, n (%) 20 (7.75%)
15-day mortality1, n (%) 27 (10.47%)
One-year mortality2, n (%) 51 (19.78%)
Excluding deaths within 15 days N= 231
One-year mortality, n (%) 24 (10.39%)
1Including in-hospital mortality, 2Including all deaths within one year. Data are presented as n (%).

Results
113
6.2 Biomarkers and risk scores predictive accuracy for one-year mortality, after the exclusion of deaths within 15 days Table 27 shows the relationship between biomarker levels obtained at the time of
diagnosis and severity of illness, measured by risk scores after the exclusion of deaths
within the first 15 days. More severe patients measured by PSI, CURB65, SCAP, and
one-year CAPSI had significantly higher levels of proADM. In addition, more severe
patients measured by the one-year CAPSI had significantly lower levels of CRP.
Table 27. Relation between biomarkers and severity of illness, measured by risk
scores1.
CRP PCT ProADM
PSI
I-III (n=112) 218.7 (97-323) 0.49 (0.10-2.41) 1.00 (0.77-1.37)
IV-V (n=119) 177.4 (62.10-285.6) 0.36 (0.15-2.56) 1.64 (1.14-2.41)
p-value 0.14 0.99 <0.0001
CURB65
≤2 (n=177) 182.2 (81-305.3) 0.37 (0.10-2.09) 1.16 (0.83-1.62)
>2 (n=54) 198.25 (73-341.9) 0.87 (0.20-3.68) 1.97 (1.31-2.67)
p-value 0.36 0.08 <0.0001
SCAP
<2 (n=133) 210.55 (89.6-289.6) 0.52 (0.12-2.41) 1.01 (0.80-1.40)
≥2 (n= 98) 176.1 (64.0-341.9) 0.35 (0.14-2.13) 1.68 (1.23-2.41)
p-value 0.24 0.73 <0.0001
One-year CAPSI
≤3 (n=129) 243.7 (91-353.3) 0.64 (0.12-2.75) 1.05 (0.78-1.56)
>3 (n=102) 147.85 (62.1-256.9) 0.3 (0.13-1.44) 1.58 (1.14-2.05)
p-value 0.0025 0.08 <0.0001
1After exclusion of deaths within 15 days. Data are presented as median (IQR) of each biomarker. CRP: C reactive protein; PCT: Procalcitonin; ProADM: Proadrenomedullin; PSI: Pneumonia severity index. CURB65: Confusion, Urea, Respiratory rate, Blood pressure, age>65. SCAP: Severe community-acquired. Pneumonia; one-year CAPSI: one-year community-acquired pneumonia severity index.

LONG‐TERM MORTALITY IN HOSPITALIZED PATIENTS WITH COMMUNITY‐ACQUIRED PNEUMONIA
114
Table 28 shows the Cox regression model with the predictive ability of biomarkers for
one-year mortality as continuous variables showing a poor predictive accuracy with a
C-index of 0.57 for CRP (p=0.11), 0.51 for PCT (p value=0.55), and 0.64 for proADM
(p=0.39).
Table 28. Survival models of the predictive accuracy of biomarkers for one-year
mortality, as continuous variables1.
One-year mortality HR (95% CI) C-index AIC R2 p-value
CRP 0.99 (0.99,1.00) 0.57 (0.05) 257.91 1.2% 0.11
PCT 0.98 (0.91,1.05) 0.51 (0.06) 225.04 0.2% 0.55
proADM* 1.01 (0.99,1.04) 0.64 (0.06) 259.04 0.3% 0.39
1After exclusion of deaths within 15 days. *for 0.1- nmol/L increment. HR: Hazard ratio; CI: Confidence interval; AIC: Akaike information criterion; R2: R-square. CRP: C reactive protein; PCT: Procalcitonin; ProADM: Proadrenomedullin.
Table 29 shows the Cox regression model with the predictive ability of risk scores for
one-year mortality. All the scores demonstrated a high predictive capacity, with a C-
index of 0.78 (0.05) for one-year CAPSI (p=<0.001).
Table 29. Predictive accuracy of risk scores for one-year mortality, as continuous
variables1.
One-year mortality HR (95% CI) C-index AIC R2 p-value
PSI 4.20 (2.28, 7.72) 0.80 (0.06) 226.00 13.8% <0.001
CURB65 1.96 (1.32, 2.90) 0.70 (0.06) 247.43 5.8% <0.001
SCAP 2.64 (1.76, 3.96) 0.77 (0.06) 236.95 9.6% <0.001
one-year CAPSI 1.21 (1.11,1.32) 0.75 (0.06) 243.18 7% <0.001
1After exclusion of deaths within 15 days. HR: Hazard ratio; CI: Confidence interval; AIC: Akaike information criterion; R2: R-square. PSI: Pneumonia Severe Index. CURB65: Confusion, Urea, Respiratory rate, Blood pressure, age>65. SCAP: Severe Community Acquired Pneumonia; one-year CAPSI: one-year community-acquired pneumonia severity index.

Results
115
Table 30 shows risk scores prediction ability for one-year mortality once proADM was added.
In all cases, proADM failed to improve the predictive accuracy. The C-index values were PSI
+ proADM 0.82 (0.06), CURB65 + proADM 0.70 (0.06), SCAP + proADM 0.77 (0.06), and
one-year CAPSI + proADM 0.75 (0.06) (p values= 0.05, 0.42, 0.38, 0.83, respectively).
Table 30. Nested model comparison to assess risk scores ability with the proADM
value added1.
One-year mortality C-index AIC p-value
PSI 0.80 (0.06) 226.00 Ref.
PSI + ProADM 0.82 (0.06) 224.04 0.05
CURB65 0.70 (0.06) 247.43 Ref.
CURB65 + ProADM 0.70 (0.06) 248.77 0.42
SCAP 0.77 (0.06) 236.95 Ref.
SCAP + ProADM 0.77 (0.06) 238.17 0.38
One-year CAPSI 0.75 (0.06) 243.18 Ref.
One-year CAPSI + ProADM 0.75 (0.06) 245.14 0.83
1After exclusion of deaths within 15 days. AIC: Akaike information criterion; R2: R-square. P-value indicate the statistical significance comparing with the same model without the biomarker. ProADM: Proadrenomedullin; PSI: Pneumonia Severe Index. CURB65: Confusion, Urea, Respiratory rate, Blood pressure, age>65. SCAP: Severe Community Acquired Pneumonia; one-year CAPSI: one-year community-acquired pneumonia severity index.

LONG‐TERM MORTALITY IN HOSPITALIZED PATIENTS WITH COMMUNITY‐ACQUIRED PNEUMONIA
116
6.3 Biomarkers and risk scores predictive accuracy for one-year mortality, with the inclusion of all deaths within one year In order to assess the impact of short-term mortality, a similar analysis was carried out
including all deaths. Table 31 shows the relationships between biomarker levels
obtained at the time of diagnosis and the severity of illness, measured by risk scores
including all deaths up to one year. Similarly, more severe patients measured by PSI,
CURB65, SCAP, and one-year CAPSI had significantly higher levels of proADM. In
addition, more severe patients, measured by one-year CAPSI, had significantly lower
levels of CPR at diagnosis.
Table 31. Relation between biomarkers and severity of illness, measured by risk
scores1.
CRP PCT ProADM PSI
I-III (n=113) 219.3 (103-328) 0.48 (0.09-2.41) 1.00 (0.77-1.38)
IV-V (n=145) 177.4 (72.6-279.1) 0.43 (0.15-2.99) 1.68 (1.17-2.51)
p-value 0.11 0.75 <0.0001
CURB65
≤2 (n=187) 181.1 (81-297.6) 0.36 (0.09-2.09) 1.17 (0.83-1.67)
>2 (n=71) 200.3 (90.3-355.5) 0.93 (0.2-3.87) 2.06 (1.49-2.93)
p-value 0.65 0.01 <0.0001
SCAP
<2 (n=135) 211 (89.6-289.6) 0.52 (0.12,2.41) 1.01 (0.80-1.43)
≥2 (n=123) 174 (73-341.9) 0.43 (0.15-2.98) 1.74 (1.27-2.54)
p-value 0.34 0.96 <0.0001
One-year CAPSI
≤3 (n=130) 244.35 (91-353.3) 0.66 (0.13-1.81) 1.06 (0.78-1.56)
>3 (n=128) 149.7 (65.5,257.85) 0.31 (0.14-1.81) 1.67 (1.18-2.28)
p-value 0.0038 0.13 <0.0001 1Including all deaths within one year. Data are presented as median (IQR).CRP: C reactive protein; PCT: Procalcitonin; ProADM: Proadrenomedullin. PSI: Pneumonia Severe Index; CURB65: Confusion, Urea, Respiratory rate, Blood pressure, age>65; SCAP: Severe Community Acquired Pneumonia; one-year CAPSI: one-year community-acquired pneumonia severity index.

Results
117
Table 32 shows the Cox regression models with the predictive ability of biomarkers for
one-year mortality including all deaths within one year. ProADM showed a high
predictive accuracy for one-year mortality with a C-index of 0.71 (0.04), (p<0.001).
However, both CRP and PCT showed a low predictive accuracy for one-year mortality
(C-index 0.54 (0.04), p=0.24; C-index 0.53 (0.04), p=0.47). All risk scores showed a
high predictive accuracy for one-year mortality when all deaths were included (Table
33).
Table 32. Predictive accuracy of biomarkers for one-year mortality.
One-year mortality HR (95% CI) C-index AIC R2 p-value
PCR 1.00 (0.99,1.00) 0.54 (0.04) 556.52 0.6% 0.24
PCT 1.01 (0.98,1.04) 0.53 (0.04) 485.71 0.2% 0.47
PROADM* 1.03 (1.02, 1.04) 0.71 (0.04) 518.52 5.8% <0.001
1Including all deaths within one year. HR: Hazard ratio; CI: Confidence interval; AIC: Akaike information criterion; R2: R-square. CRP: C reactive protein; PCT: Procalcitonin; ProADM: Proadrenomedullin. *for 0.1-unit increment
Table 34 shows the risk scores when the proADM value was added when all deaths
within one year were included in the analysis. ProADM failed to improve the predictive
accuracy of the PSI score for one-year mortality 0.79 (0.04), p=0.15. The predictive
ability of CURB65 significantly improved when proADM was added, i.e. 0.74 (0.04),
p=0.0498. ProADM failed to improve the predictive accuracy of the SCAP score for
one-year mortality, i.e. 0.80 (0.04), p= 0.21. Finally, the predictive accuracy of the one-
year CAPSI improved up to 0.83 (0.04) when proADM was added, p=0.010.

LONG‐TERM MORTALITY IN HOSPITALIZED PATIENTS WITH COMMUNITY‐ACQUIRED PNEUMONIA
118
Table 33. Predictive accuracy of risk scores for one-year mortality1.
One-year mortality HR (95% CI) C-index AIC R2 p-value
PSI 3.27 (2.20,4.85) 0.77 (0.04) 481.37 18.8% <0.001
CURB65 2.15 (1.64,2.83) 0.71 (0.04) 500.70 12.3% <0.001
SCAP 2.95 (2.23,3.92) 0.79 (0.04) 473.09 21.4% <0.001
one-year CAPSI 1.27 (1.20,1.35) 0.81 (0.04) 474.91 20.9% <0.001
1Including all deaths within one year. HR: Hazard ratio; CI: Confidence interval; AIC: Akaike information criterion; R2: R-square. PSI: Pneumonia Severe Index. CURB65: Confusion, Urea, Respiratory rate, Blood pressure, age>65. SCAP: Severe Community Acquired Pneumonia; one-year CAPSI: one-year community-acquired pneumonia severity index.
Table 34. Nested model comparison to assess the predictive accuracy of risk scores
when the proADM value was added1.
One-year mortality C-index AIC p-value
PSI 0.77 (0.04) 481.37 Ref.
PSI + ProADM 0.79 (0.04) 481.34 0.15
CURB65 0.71 (0.04) 500.70 Ref.
CURB65 + ProADM 0.74 (0.04) 498.75 0.0498
SCAP 0.79 (0.04) 473.09 Ref.
SCAP + ProADM 0.80 (0.04) 473.54 0.21
One-year CAPSI 0.81 (0.04) 474.91 Ref.
One-year CAPSI + ProADM
0.83 (0.04) 470.61 0.010
1Including all deaths within one year. AIC: Akaike information criterion; R2: R-squared. ProADM: Proadrenomedullin; PSI: Pneumonia Severe Index. CURB65: Confusion, Urea, Respiratory rate, Blood pressure, age>65. SCAP: Severe Community Acquired Pneumonia; one-year CAPSI: one-year community-acquired pneumonia severity index.

Results
119
6.4 Role of serial biomarkers levels in one-year mortality prediction Descriptive values of biomarker levels at diagnosis, at 3-5 days and changes from the
first 24 hours to 3-5 days are shown in Table 35. Biomarker changes was calculated
by subtracting the biomarker value at 3-5 days from the baseline value. In an attempt
to assess the predictive accuracy of biomarkers over time, blood samples were
obtained from 117 patients at 3-5 days.
Table 35. Biomarker levels at diagnosis and at 3-5 days.
Biomarker 24 hours 3-5 days Change*
CRP 200.3 (81,353.3) 78 (44,148) 94 (-2.5, 212.2)
PCT 0.52 (0.15,2.36) 0.32 (0.13,0.88) 0.19 (0.001,1.7)
ProADM 1.28 (0.92,1.82) 0.86 (0.651.14) 0.32 (0.10,0.78)
*Change was calculated by subtracting the biomarker value at 3-5 days from the baseline value. Data are presented as median (IR)
Taking into account that proADM showed better predictive accuracy for one-year
mortality than the other biomarkers, a subanalysis was carried out with this specific
biomarker. ProADM change was obtained by subtracting the proADM value at 3-5
days from the proADM value at the time of diagnosis.
Table 36 shows the predictive accuracy of proADM changes for one-year mortality
among three different samples adjusted by proADM value at baseline: after the
exclusion of deaths within 15 days from diagnosis, including all deaths within one
year, and excluding patients who died from 15 days to one year. In all cases, proADM
changes showed a statistically significant predictive accuracy for one-year mortality.
Hence, for each 0.1-nmol/L decrease in proADM from admission to 3-5 days, mortality
rate decreases 8% for one-year mortality, excluding deaths within 15 days from
diagnosis.

LONG‐TERM MORTALITY IN HOSPITALIZED PATIENTS WITH COMMUNITY‐ACQUIRED PNEUMONIA
120
Table 36. Predictive accuracy of proADM change for one-year mortality�
One-year mortality HR (95% CI) C-index AIC R2 p-value
ProADMchange1 0.92 (0.84,1.00) 0.72 (0.08) 143.23 3.4% 0.04
ProADMchange2 0.88 (0.83,0.93) 0.78 (0.06) 193.80 15.2% <0.001
ProADMchange3 0.87 (0.78,0.92) 0.92 (0.11) 50.48 15.5% <0.001
� Adjusted by proADM value at baseline.1Excluding deaths within 15 days of diagnosis, 2Including all deaths within one year, 3Excluding patients who died from 15 days after diagnosis to one year. The p values refer to the proADMchanges. HR: Hazard ratio; CI: Confidence interval; AIC: Akaike information criterion; R2: R-square.ProADM difference: obtained by subtracting the proADM value at 3-5 days from proADM value at the time of diagnosis;
Table 37 shows the predictive accuracy of the proADM change for one-year mortality
after the exclusion of deaths within 15 days, adjusted by risk scores and the proADM
value at baseline. In this case, ProADM changes failed to predict one-year mortality.
The same analysis was carried out including all deaths within one year, as shown in
table 38. For each 0.1-nmol/L decrease in proADM from admission to 3-5 days, the
mortality rate decreased by 9% when adjusted by the one-year CAPSI and proADM
baseline value.
Table 37. Predictive accuracy of proADM change for one-year mortality among different
risk scores, after the exclusion of deaths ≤ 15 days�.
One-year mortality HR (95% CI) C-index AIC R2 p-value
ProADMchange* (PSI) 1.02 (0.91, 1.13) 0.70 (0.08) 129.35 5.6% 0.76
ProADMchange* (SCAP) 0.94 (0.84, 1.04) 0.76 (0.08) 137.79 8.9% 0.24
ProADMchange* (CURB65) 0.93 (0.84,1.02) 0.70 (0.08) 142.40 5.6% 0.13
ProADMchange*(one-year CAPSI) 0.95 (0.86, 1.05) 0.75 (0.08) 141.76 6% 0.32
�Adjusted by severity and proADM value at baseline, *for each 0.1-nmol/L increment. The p values refer to the proADMchanges. HR: Hazard ratio; CI: Confidence interval; AIC: Akaike information criterion; R2: R-square. ProADM difference: obtained by subtracting PRADM value at 3-5 days from proADM value at the time of diagnosis; PSI: Pneumonia Severe Index. CURB65: Confusion, Urea, Respiratory rate, Blood pressure, age>65. SCAP: Severe Community Acquired Pneumonia; one-year CAPSI: one-year community-acquired pneumonia severity index.

Results
121
Table 38. Predictive accuracy of proADM difference for one-year mortality among
different risk scores, including all deaths within one year1.
One-year mortality HR (95% CI) C-index AIC R2 p-value
ProADMchange* (PSI) 0.92 (0.86,0.98) 0.83 (0.06) 187.09 20.5% 0.007
ProADMchange* (SCAP) 0.88 (0.83,0.94) 0.79 (0.06) 187.81 20.1% <0.001
ProADMchange* (CURB65) 0.87 (0.82,0.93) 0.78 (0.06) 189.74 18.9% <0.001
ProADMchange*(one-year CAPSI) 0.91 (0.85,0.96) 0.80 (0.06) 188.20 19.9% 0.0015
1Adjusted by severity and proADM value at baseline,*for each 0.1-nmol/L increment. HR: Hazard ratio; CI: Confidence interval; AIC: Akaike information criterion; R2: R-square. ProADM difference: obtained by subtracting PRADM value at 3-5 days from ProADM value at the time of diagnosis; PSI: Pneumonia Severe Index. CURB65: Confusion, Urea, Respiratory rate, Blood pressure, age>65. SCAP: Severe Community Acquired Pneumonia; one-year CAPSI: one-year community-acquired pneumonia severity index.
In addition, the same analysis was carried out after excluding patients who died between 15
days from diagnosis and one year (Table 39). ProADM changes adjusted by severity showed
a high predictive accuracy with a C-index of 0.94 (0.11) for one-year CAPSI. For each 0.1-
nmol/L decrease in proADM from admission to 3-5 days, the mortality rate decreased by
11% when adjusted by the one-year CAPSI and proADM value at baseline.
Table 39. Predictive accuracy of the proADM difference for one-year mortality among
different risk scores, excluding patients who died between 15 days after diagnosis and
one year1.
One-year mortality HR (95% CI) C-index AIC R2 p-value
ProADMchange* (PSI) 0.86 (0.79,0.93) 0.92 (0.11) 51.23 16.04% 0.0003
ProADMchange* (SCAP) 0.84 (0.77,0.92) 0.90 (0.11) 49.02 17.9% <0.0001
ProADMchange* (CURB65) 0.79 (0.71,0.90) 0.94 (0.11) 43.92 21.4% 0.0001
ProADMchange*(one-year CAPSI) 0.89 (0.82,0.96) 0.94 (0.11) 44.99 20.70% 0.004
1Adjusted by severity and proADM value at baseline, *for each 0.1-nmol/L increment. HR: Hazard ratio; CI: Confidence interval; AIC: Akaike information criterion; R2: R-square. ProADM difference: obtained by subtracting PRADM value at 3-5 days from ProADM value at the time of diagnosis; PSI: Pneumonia Severe Index. CURB65: Confusion, Urea, Respiratory rate, Blood pressure, age>65. SCAP: Severe Community Acquired Pneumonia; one-year CAPSI: one-year community-acquired pneumonia severity index.

LONG‐TERM MORTALITY IN HOSPITALIZED PATIENTS WITH COMMUNITY‐ACQUIRED PNEUMONIA
122
STUDY III. ONE-YEAR MORTALITY PREDICTION AMONG HOSPITALIZED PATIENTS WITH CAP IN THE VETERANS AFFAIRS MEDICAL CENTER OF LOUISVILLE, KENTUCKY.
6.1 Descriptive statistics A total of 455 patients were included in the analysis. Of these, 121 (27%) patients died
within one year while 265 (58%) of patients died within five years. All patients were
male, 39.56% were older than 75, and almost half of the cohort were current smokers.
Hypertension, COPD, and CAD were the most frequent comorbidities. In addition,
almost half of the cohort had an albumin <3.5 and a BUN >20 mg/dL (Tables 40 and
41).
Table 40. Baseline characteristics and comorbidities of hospitalized patients with CAP.
n=455
Age ≥75 years 180 (39.56%)
Sex (male) 455 (100%)
Current smoker 191 (42.26%)
BMI <21 40 (8.93%)
Nursing home resident 17 (3.74%)
Suspicion of aspiration 18 (4.25%)
Hypertension 320 (70.33%)
Diabetes 157 (34.51%)
COPD 227 (49.89%)
Cancer 58 (12.75%)
CHF 117 (25.71%)
CAD 198 (43.52%)
CVD 57 (12.53%)
Dementia 39 (9.21%)
Renal disease 67 (14.73%)
Liver disease 15 (3.3%) Data are presented as n (%). BMI: Body mass index; COPD: Chronic obstructive pulmonary disease; CHF: Congestive heart failure; CAD: Coronary artery disease; CVA: Cerebrovascular disease.

Results
123
Table 41. Physical examination and analytics of hospitalized patients with CAP.
n=455
Respiratory rate >30 breaths/min 44 (9.67%)
BUN >20 mg/dL 237 (52.43%)
Albumin <3.5 mg/dL 216 (47.47%)
Hematocrit <30% 26 (5.71%)
Platelets <100x109/L or >400x109/L, n (%) 78 (17.18%)
Data are presented as n (%). BUN: blood urea nitrogen.
Patient sociodemographic characteristic and comorbidities were compared between
study I and study III (Table 42). Patients in study III were all men, were significantly
younger, and more frequently presented diabetes mellitus, COPD, cancer, CHF, CAD,
CVD, and renal failure. In addition, patients in study III were more severe at
admission, measured by PSI, and more frequently had a respiratory rate ≥30
breaths/min, BUN >30 mg/dL, and hematocrit <30% compared with patients in study I.
From the initial 2351 patients at Galdakao-Usansolo Hospital, 250 (10.63%) patients
died within one year after the exclusion of deaths within the first 15 days, while 120
(27.71%) patients died in the sample of patients hospitalized at the Veterans Affairs
Medical Center in Louisville, Kentucky.
One-year CAPSI was applied to this sample and it failed to properly validate the
previous results with a C-index of 0.62 (0.03), AIC of 1405.44, and R2 5.1%.

LONG‐TERM MORTALITY IN HOSPITALIZED PATIENTS WITH COMMUNITY‐ACQUIRED PNEUMONIA
124
Table 42. Comparison of patient sociodemographic characteristics and comorbidities
between study I and study III.
STUDY I STUDY III p-value
Age, n (%) 0.0001
≥80 years 784 (33.35%) 115 (24.42%)
<80 years 1567 (66.65%) 356 (75.58%)
Sex, n (%) <0.0001
Male 1540 (65.50%) 471 (100%)
Female 811 (34.50%) 0 (0%)
Nursing home, n (%) 154 (6.55%) 20 (4.25%) 0.05
Aspiration 80 (3.40%) 20 (4.28%) 0.33
Comorbidities, n (%)
Diabetes mellitus 362 (15.54%) 160 (33.97%) <0.0001
COPD 613 (26.23%) 235 (49.89%) <0.0001
Cancer 130 (5.53%) 69 (14.65%) <0.0001
CHF 180 (7.66%) 120 (25.48%) <0.0001
CAD 224 (9.58%) 198 (42.04%) <0.0001
CVD 199 (8.46%) 55 (11.68%) 0.03
Dementia 230 (9.84%) 48 (10.28%) 0.79
Renal failure 176 (7.49%) 70 (14.86%) <0.0001
Respiratory rate ≥30 breaths/min
354 (15.06%) 48 (10.19%) 0.005
BUN >30 mg/dL 661 (28.12%) 116 (24.63%) 0.12
Hematocrit <30% 57 (2.42%) 31 (6.58%) <0.0001
PSI mean (SD) 91.48 (32.20) 97.23 (37.24) 0.0019
PSI, n (%) 0.0063
I-III 1157 (49.21%) 199 (42.25%)
IV-V 1194 (50.79%) 272 (57.75%)
Data are presented as n (%) or mean (SD); COPD: Chronic obstructive pulmonary disease; CHF: Congestive heart failure; CAD: Coronary artery disease; CVA: Cerebrovascular disease; BUN: Blood urea nitrogen.

Results
125
6.2 Univariate analysis Table 43 shows the patient characteristics among survivors and non-survivors at one
year. Compared to those who survived at one year, non-survivors were older, were
more frequently nursing home residents, and more frequently had cancer, COPD,
CVD, and dementia. In addition, non-survivors presented with lower levels of albumin
and hematocrit and more frequently had BUN >20 mg/dL and platelet counts
<100,000 or >400,000/L.
Table 43. Characteristics among survivors and non-survivors at one year.
Variable
Alive Dead p-value
Age, median (IQR) 70 (22) 75 (12) <0.001 Age ≥75 years, n (%) 118 (35) 62 (51) 0.002 Current smoker, n (%) 146 (44) 45 (37) 0.198 BMI <21, n (%) 26 (8) 14 (12) 0.259 Nursing home resident, n (%) 5 (1) 12 (10) <0.001 Suspicion of aspiration, n (%) 10 (3) 8 (7) 0.179 Hypertension, n (%) 231 (69) 89 (74) 0.417 Diabetes, n (%) 113 (34) 44 (36) 0.656 COPD, n (%) 167 (50) 60 (50) >0.999 Cancer, n (%) 15 (4) 43 (36) <0.001 CHF, n (%) 83 (25) 34 (28) 0.544 CAD, n (%) 140 (42) 58 (48) 0.285 CVD, n (%) 32 (10) 24 (20) 0.006 Dementia, n (%) 19 (6) 20 (17) 0.002 Renal disease, n (%) 48 (14) 19 (16) 0.765 Liver disease, n (%) 9 (3) 6 (5) 0.241 Respiratory rate >30 breaths/min, n (%) 30 (9) 14 (12) 0.472 BUN >20 mg/dL, n (%) 164 (49) 73 (61) 0.033 Albumin <3.5 mg/dL, n (%) 148 (44) 68 (56) 0.026 Hematocrit <30%, n (%) 9 (3) 17 (14) <0.001 Platelets <100x109/L or >400x109/L, n (%) 44 (13) 34 (28) <0.001 pO2/FiO2 <250 mmHg, n (%) 85 (46) 31 (43) 0.78
Data are presented as n (%) and median (IQR). BMI: Body mass index; COPD: Chronic obstructive pulmonary disease; CHF: Congestive heart failure; CAD: Coronary artery disease; CVA: Cerebrovascular accident; BUN: blood urea nitrogen.

LONG‐TERM MORTALITY IN HOSPITALIZED PATIENTS WITH COMMUNITY‐ACQUIRED PNEUMONIA
126
Those patients who died within five years were also older, were more frequently
nursing home residents, and more frequently had cancer, COPD, CVD, and dementia.
Similarly, non-survivors at five years presented with lower levels of albumin and
hematocrit and more frequently had BUN >20 mg/dL and platelet counts <100,000 or
>400,000/L (Table 44).
Table 44. Characteristics among survivors and non-survivors at five years.
Variable
Alive Dead p-value
Age, median (IQR) 66 (20.8) 74 (17) <0.001 Age ≥75 years, n (%) 55 (29) 125 (47) <0.001 Current smoker, n (%) 84 (45) 107 (40) 0.384 BMI <21, n (%) 12 (6) 28 (11) 0.133 Nursing home resident, n (%) 2 (1) 15 (6) 0.011 Suspicion of aspiration, n (%) 4 (3) 14 (5) 0.218 Hypertension, n (%) 130 (68) 190 (72) 0.468 Diabetes, n (%) 67 (35) 90 (34) 0.842 COPD, n (%) 82 (43) 145 (55) 0.017 Cancer, n (%) 8 (4) 50 (19) <0.001 CHF, n (%) 40 (21) 77 (29) 0.064 CAD, n (%) 71 (37) 127 (48) 0.028 CVD, n (%) 18 (9) 38 (14) 0.148 Dementia, n (%) 7 (4) 32 (12) 0.009 Renal disease, n (%) 25 (13) 42 (16) 0.503 Liver disease, n (%) 4 (2) 11 (4) 0.292 Respiratory rate >30 breaths/min, n (%) 15 (8) 29 (11) 0.335 BUN >20 mg/dL, n (%) 88 (47) 149 (57) 0.036 Albumin <3.5 mg/dL, n (%) 78 (41) 138 (52) 0.022 Hematocrit >30%, n (%) 3 (2) 23 (9) 0.001 Platelets <100x109/L or >400x109/L, n (%) 21 (11) 57 (22) 0.004 pO2/FiO2 <250 mmHg, n (%) 47 (47) 69 (44) 0.798
Data are presented as n (%) and median (IQR). BMI: Body mass index; COPD: Chronic obstructive pulmonary disease; CHF: Congestive heart failure; CAD: Coronary artery disease; CVA: Cerebrovascular accident; BUN: blood urea nitrogen.

Results
127
6.3 Multivariate analyses and score development Table 45 shows the one-year prediction score. A score based on age ≥75 years,
cancer, CHF, dementia, albumin <3.5mg/dL and platelets <100.000 or >400.000/L
could predict one-year mortality with an AUC of 0.77. When the same score was used
to predict five-year mortality, the AUC was 0.70. Representation of the score for one-
year and five-year mortality is shown in Figure 14.
Table 45. One-year mortality prediction score.
Variable Beta (se) Statistic p-value Weight
Intercept -2.28 (0.26) -8.78 <0.001
Age ≥75 years 0.65 (0.26) 2.51 0.01 2
Cancer 2.52 (0.34) 7.29 <0.001 7
CHF 0.40 (0.28) 1.44 0.15 1
Dementia 1.25 (0.37) 3.38 <0.0001 4
Albumin <3.5 mg/dL 0.55 (0.25) 2.18 0.03 2
Platelets<100x109/Lor>400x109/L 0.72 (0.31) 2.32 0.02 2
ONE YEAR AUC 0.77
FIVE YEARS AUC 0.70
Beta (s.e): Beta regression coefficient with standard error; AUC: Area under the curve; BMI: Body mass index; CHF: Congestive heart failure;
Table 46 shows the five-year prediction score. Age ≥75 years old, aspiration, being
nursing home resident, cancer, CHF, underweight, and platelets <100,000 or
>400,000/L could predict five-year mortality with an AUC of 0.69. Representation of
this second score for five-year mortality is shown in Figure 15.

LONG‐TERM MORTALITY IN HOSPITALIZED PATIENTS WITH COMMUNITY‐ACQUIRED PNEUMONIA
128
Table 46. Five-year mortality prediction score.
Variable Beta (s.e) Statistic p-value Weight
Intercept -0.42 (0.17) -2.50 0.01
Age ≥75 0.95 (0.23) 4.05 <0.001 2
BMI <21 0.92 (0.44) 2.08 0.04 2
Nursing home 1.94 (1.06) 1.82 0.07 3
Aspiration 0.85 (0.60) 1.40 0.16 2
Cancer 1.4 (0.41) 3.41 0.0006 2
CHF 0.80 (0.27) 2.94 0.003 2
Platelets <100x109/L or >400x109/L 0.75 (0.31) 2.41 0.02 1
AUC 0.69
Beta (s.e): Beta regression coefficient with standard error; AUC: Area under the curve; BMI: Body mass
index; CHF: Congestive heart failure
Figure 14. Representation of the initial score to predict one-year and five-year
mortality.

Results
129
Figure 15. Representation of the second score to predict five-year mortality.

LONG‐TERM MORTALITY IN HOSPITALIZED PATIENTS WITH COMMUNITY‐ACQUIRED PNEUMONIA
130

131
7. DISCUSSION

Discussion
133
7.1 Overall interpretation of results
There are three major issues in this study:
1. This study indicates that long-term mortality in hospitalized patients with CAP is
high. An easy-to-use score with five variables can help physicians identify those
patients with CAP at high risk of death within one year of an index admission. A
weighted score, called the one-year CAPSI, constructed by age ≥80, CHF, dementia,
BUN >30 mg/dL and a respiratory rate of ≥30 breaths/min can predict one-year
mortality with a high predictive accuracy. Indeed, one-year CAPSI showed significantly
better predictive accuracy than CURB65 and SCAP.
2. In recent decades, increasing interest has emerged concerning biomarkers. In this
sense, this study demonstrates that proADM is associated with the severity of disease
measured by severity scores. Hence, patients with more severe disease at diagnosis
present higher levels of proADM. After the exclusion of deaths within 15 days, only 24
patients died within one year. Biomarkers showed poor predictive accuracy for one-
year mortality and were not able to improve the prediction ability of risk scores for one-
year mortality when added to the scores. In a subanalysis carried out including all
deaths up to one year, proADM showed the best predictive ability for one-year
mortality and, when added to the one-year CAPSI, the prediction ability of the score
was significantly improved.
On the other hand, a decrease in proADM from the first 24 hours to 3-5 days, adjusted
by proADM value at baseline, was associated with a significantly reduced risk of death
at one year. However, once it was adjusted by severity of disease and proADM
baseline value, only when all deaths within one year were analyzed was associated
with a significantly reduced risk of death at one year, meaning that, based on our
sample, its predictive ability is mainly for short-term mortality.

LONG‐TERM MORTALITY IN HOSPITALIZED PATIENTS WITH COMMUNITY‐ACQUIRED PNEUMONIA
134
3. Long-term mortality was assessed in an external cohort at the Veterans Affairs
Medical Center of Louisville, Kentucky. Patients from this study differed from the
patients in study I in terms of sociodemographics and comorbidities. Hence, the one-
year CAPSI failed to properly validate previous results when applied to this sample.
Thus, a specific cohort with different variables from one-year CAPSI was developed
for one-year mortality with a high predictive accuracy and based on age ≥75 years,
cancer, CHF, dementia, albumin <3.5mg/dL and platelets <100,000 109/L or >400,000
109/L. However, it seems that predicting mortality on a longer time prediction model is
more difficult. In fact, the same score was tested for five-year mortality with a
decrease in predictive ability. Another specific score was developed for five-year
mortality but the predictive accuracy was not as high as expected.

Discussion
135
7.2. Comparison with the literature
7.2.1. STUDY I: This study indicates that long-term mortality in hospitalized patients with CAP is high. An easy-to-use score with five variables can help physicians identify those patients with CAP at high risk of death within one year of an index admission. A weighted score, called the one-year CAPSI, constructed by age ≥80, CHF, dementia, BUN >30 mg/dL and a respiratory rate of ≥30 breaths/min can predict one-year mortality with a high predictive accuracy. Indeed, one-year CAPSI showed significantly better predictive accuracy than CURB65 and SCAP.
Despite advances in supportive care, CAP continues to be a leading cause of
morbidity and mortality worldwide (14). Along with influenza, is currently the eighth
leading overall cause of death in the United States (116). However, this mortality is
only related to short-term mortality. Most researchers have focused their interest on
the first months after an episode of pneumonia. It has been postulated that deaths
within 15 days of a pneumonia diagnosis are related to the acute episode.
Consequently, those patients were excluded from the present study in order to avoid
the immediate impact of pneumonia on mortality. Increasing interest is emerging
concerning the long-term prognosis after pneumonia, with mortality rates between 10-
20% in the literature (6,14). However, predicting long-term mortality remains
challenging.
In the present study and coinciding with literature, the one-year mortality rate in the
entire cohort after the exclusion of deaths within 15 days of diagnosis was as high as
10%. This increased risk has been found to be independent of previous comorbid
diseases (27). However, the impact on prognosis of the interaction between an acute
episode and comorbidities should be cautiously assessed. It has been suggested that
patients hospitalized with CAP have higher long-term mortality rates. Furthermore, it
seems that the mortality rate is even higher than those patients hospitalized for other
reasons. In this sense, Bordon et al. (50) identified a 40% higher risk of death within 7
years after a hospitalization for CAP when compared to patients hospitalized for other
reasons. Recently, a German study compared mortality rates after an episode of CAP
with a control group and observed 17%, 43%, and 53% mortality rates at 2, 5 and, 7

LONG‐TERM MORTALITY IN HOSPITALIZED PATIENTS WITH COMMUNITY‐ACQUIRED PNEUMONIA
136
years, respectively, among patients with CAP versus 4%, 19%, and 24% in the control
group (71).
In this sense, specific prognostic indices for one-year mortality after hospitalization for
any reason have been developed (23,24,117). Walter et al. (23) identified that male
sex, functional status, CHF, cancer, creatinine, and low albumin are risk factors for
one-year mortality in older adults after a hospitalization. However, the authors limited
their analysis to patients over 70 years of age and to all patients discharged from a
general medical service at a tertiary care hospital. The prognostic index developed in
the present study focused on patients with CAP. Moreover, all age groups were
considered, which actually makes it more useful due to the similarity to real life, as in
daily clinical practice.
The one-year CAPSI is a one year prognostic index that weights dementia with 6
points, age ≥80 with 4 points, BUN >30 mg/dL with 3 points, and 2 points for both RR
≥30 breaths/min and CHF. Therefore, an 82-year-old patient with congestive heart
failure would have a 9.91 (6.30,15.59), HR (95%CI) times higher probability of dying
one year after an admission for CAP. At the same time, a 50-year-old patient with a
respiratory rate of 32 breaths/min and 50 mg/dL of BUN would have a 3.19 (1.75,
5.83), HR (95%CI)) times higher probability of dying one year after an admission for
CAP.
Dementia was the best predictor of one-year mortality in hospitalized patients with
CAP. Dementia is defined as chronic cognitive impairment; its origin is usually due to
cerebrovascular disease, which is closely related to inflammation (28,36). Patients
with CAP suffer an inflammatory storm during the acute episode, which could lead to a
worsening of previously existing inflammation. Chronic persistent inflammation after
an acute episode with CAP could lead to the high long-term mortality of these patients.
There are other variables usually related to dementia in clinical practice, such as being
a nursing home resident, having poor functional status, and aspiration. Being a
nursing home resident is included in the HCAP concept. The definition of HCAP was
developed and published in the 2005 ATS/IDSA guidelines, in order to identify an
increased risk of drug resistant pathogens in patients coming from the community
(76). The HCAP concept included any patient who was hospitalized in an acute care
hospital for two or more days within 90 days of the infection, who resided in a nursing

Discussion
137
home or long-term care facility, received recent intravenous antibiotic therapy,
chemotherapy or wound care within the past 30 days of the current infection, attended
a hospital or hemodialysis clinic, or who had a family member infected with a drug-
resistant pathogen. Patients with HCAP are known to have a worse prognosis, mostly
due to poor functional status and treatment restrictions (39). Moreover, Cecere et al.
(42) described high long-term mortality among patients with HCAP, i.e. even higher
than those patients with CAP. However, HCAP was not assessed as a different entity
in this study and only 6% of the population lived in a nursing home. In addition,
functional status measured by the Katz index was postulated to be a 90-day mortality
predictor after an episode of CAP by Capelastegui et al. (46). However, previous
functional status could not be assessed in the present study.
Patients suffering from dementia usually have problems related to swallowing, which
leads to aspiration. As reported by Lanspa et al. (118), a clinical diagnosis of
aspiration pneumonia is associated with confusion, nursing home residence, and
cerebrovascular disease. However, these authors observed a 2.3 odds ratio for
mortality, after adjusting for age, disease severity, and comorbidities. Nevertheless,
clinician-diagnosed aspiration was assessed in this study and only dementia was
significantly associated with one-year mortality in the multivariate analysis, probably
underlying the poor functional status of these patients. In addition, there is a problem
with definitions in studies assessing aspiration, and it usually becomes difficult to
differentiate aspiration pneumonitis from aspiration pneumonia (119).
The second most powerful predictor of one-year mortality was age ≥80. Sir William
Osler stated that “Pneumonia may well be called the friend of the aged”. However,
doubts have arisen in the last decades about pneumonia being limited to an acute
episode. Several studies have identified increasing age as a risk factor for long-term
mortality after an episode of pneumonia, which is more frequent at the extremes of
life. The impact of an aging population has become a major issue of concern. The
proportion of US elderly patients is expected to increase from 12% in 2000 to almost
20% in 2030. Immunosenescence is a term to describe a series of physiological
changes associated with aging which cause progressive deterioration of the immune
system (120).

LONG‐TERM MORTALITY IN HOSPITALIZED PATIENTS WITH COMMUNITY‐ACQUIRED PNEUMONIA
138
Due to the growing elderly population, the number of patients being admitted to
hospitals has notably increased. In addition, these patients usually have more
comorbidities and a poor functional status. It has been suggested that one out of ten
hospitalized patients with CAP between 60-79 years of age have an increased risk of
mortality. In a recent paper, which CAP patients were compared with a control group,
the lowest absolute rate difference for mortality was observed among patients <25
years old while patients >80 years old had the highest absolute rate difference (29).
However, the starting risk age is controversial, ranging from 50 years proposed by
Hedlund et al. (34) to 70 years proposed by Sligl et al. (36) or 80 proposed in the one-
year CAPSI.
The severity of illness has demonstrated an impact on long-term prognosis. Scores
such as, PSI, CURB65, or SCAP, initially developed for short-term prognosis, have
been also used to assess long-term mortality. All these scores include data from a
physical examination and analytics, with two variables that were also included in the
one-year CAPSI: BUN >30 mg/dL was weighted with 3 points and RR ≥30 breaths/min
with 2 points.
BUN is an important biochemical parameter determined by the complex balance
between urea production, urea metabolism, and urea excretion. In addition, BUN can
be influenced by several renal and non-renal dependent factors such as glomerular
filtration, tubular reabsorbtion of urea, dietary protein intake, parenteral
hyperalimentation therapy, catabolism of endogenous proteins, exogenous
glucocorticoid dependent catabolism, volume status, and upper gastrointestinal
bleeding. BUN levels are well-known to increase with the severity of renal disease.
However, increased levels can be also observed in other illnesses, such as
pneumonia, myocardial infarction, bone marrow transplant, and esophagectomy
(106,121,122,123). Long-term regulation of the urea cycle occurs during adaptation to
chronic increases in enteral or parenteral protein intake or to other protein catabolic
states, such as starvation or critical illness (124). Whether elevated levels of BUN with
normal values of creatinine impact on prognosis have been a matter of concern.
Recently, Beier et al. (44) conducted a multicenter observational study among critically
ill patients with one year follow-up and concluded that elevated levels of BUN are
associated with increased long-term mortality, independent of serum creatinine.

Discussion
139
Few authors have tried to explain the relationship between mortality and high BUN
levels. The neurohumoral response to arterial underfilling may be responsible for this
association. This response involves AVP, the renin-angiotensin-aldosterone system
and the sympathetic nervous system (125). High plasma AVP concentrations can
result in increased urea reabsorption in the collecting duct, resulting in increased BUN
(126). Angiotensin and adrenergic stimulation increase proximal tubular sodium and
water reabsorption, decreasing distal fluid delivery, which increases flow-dependent
urea reabsorption (127). Such arterial underfilling states are common in cardiac failure
and sepsis (128). High BUN levels indicate renal hypoperfusion, and patients with
pneumonia are usually dehydrated resulting from increased levels of BUN excretion
from the kidneys. Elevations in BUN independent of creatinine may impact on
mortality due to the extent of catabolism. Protein catabolism and net negative nitrogen
balance are common features of critical illness, and persistent hypercatabolism in
critical illness results in decreased immune function (129), which could explain higher
long-term mortality. Recently, a new index, named UBMo, was created for in-hospital
and one-year mortality among very elderly patients with CAP, by multiplying the
uremia by the NT-proBNP plasmatic rate, divided by the monocyte count (130).
It may be more difficult to explain how an acute parameter like RR ≥30 breaths/min
was also associated with one-year mortality after a hospitalization for CAP. A high
respiratory rate reflects the severity of disease and has been frequently associated
with a worse short-term prognosis in patients suffering from CAP. Mortensen et al.
(22) assessed long-term mortality among patients enrolled in the PORT cohort after
excluding deaths up to 90 days from CAP presentation. The authors identified that the
PSI risk class was significantly associated with decreased long-term survival in this
cohort with 5.9 years of follow-up. Similarly, Capelastegui et al. (46) showed that the
severity of illness measured by CURB was also associated with 90-day mortality after
an episode of CAP. Both CURB65 and PSI have been recently assessed for long-term
mortality in a six-year follow-up study in patients with CAP (43). Both PSI, which
includes comorbidities, and CURB65 showed excellent predictive accuracy. Actually,
both scores include RR >30 breaths/min; thus, the impact of a high RR may reflect the
impact of severity of illness on long-term prognosis.
Of note, contradictory data have been published concerning the utility of current risk
scores for long-term mortality prediction in CAP. Both PSI and CURB65 have been

LONG‐TERM MORTALITY IN HOSPITALIZED PATIENTS WITH COMMUNITY‐ACQUIRED PNEUMONIA
140
assessed for long-term mortality, PSI showing the best predictive accuracy (36,37,43).
This may be due to the fact that PSI includes comorbidities into the score. However, in
the present study, many comorbidities were assessed, and only CHF and dementia
showed a great influence on mortality. Recently, other scores such as CURB65 and
CRB65 have been compared with the Charlson comorbidity index for one-year
mortality prediction after an episode of CAP (50). All the ROC analysis showed a weak
and comparable performance leading to the idea that these two easy-to-use indices
showed a similar predictive accuracy to a complex comorbidity index. Thus, it seems
that CURB65 could be useful in predicting one-year mortality, despite demonstrating a
lower predictive accuracy.
In the last decade, substantial evidence has accumulated concerning the association
between cardiovascular diseases and pneumonia. Firstly, patients suffering from CAP
present higher rates of cardiac complications during hospitalization for CAP, such as
acute myocardial infarction, heart failure, or arrhythmia (31,131). This idea was
strengthened by Dong et al. (132) in a meta-analysis showing that acute respiratory
infections were associated with a higher rate of acute coronary syndromes. Secondly,
it has been postulated that suffering from pneumonia increases the risk of developing
new-onset heart failure and other cardiovascular diseases in late follow-up (53).
Thirdly, patients with CAP that suffer intra-hospital cardiac complications have greater
long-term mortality (54).
CHF is included in the one-year CAPSI, and actually has a considerable impact on
long-term mortality. Pneumonia leads to an inflammatory storm and factors such as
systemic inflammation, coronary artery inflammation, platelet activation and
thrombosis, endothelial dysfunction, and the effects of CAP on the heart have been
suggested as possible mechanisms for increased cardiovascular events following
respiratory infections (133). Thus, pneumonia may reflect an acute state of
inflammation while CHF leads to chronic inflammation. Hence, pneumonia may lead to
chronic state of inflammation, triggering the onset of new cardiovascular events or an
impairment of a previously present inflammatory state.
Cardiovascular diseases have been suggested as causes of long-term mortality after
an episode of CAP (30). In fact, cardiovascular events have been postulated to
contribute to more than 30% of deaths in long-term follow-up in patients with CAP

Discussion
141
(31). More recently, Adamuz et al. (32) determined the causes of death of 1,284
patients discharged after an episode of CAP and observed that infectious diseases
were the main reason for one-year mortality, followed by acute cardiovascular events.
Moreover, mortality from infectious diseases was higher during the first six months
and decreased progressively after that point while cardiovascular causes were stable
throughout the follow-up period, which reinforces the idea of chronic persistent
inflammation after an episode of CAP. Unfortunately, causes of death could not be
obtained in the present study.
Identifying the best prognostic index in any disease is difficult. A good prognostic
score should be easily performed in clinical practice. In this sense, it should be taken
into account that one-year CAPSI is an easy-to-use index specifically developed to
predict one-year mortality among patients admitted for CAP and is based on five easy
to remember variables, while PSI is a laborious index, which requires a complex
computer program in order to be implemented.
Specific issues should be discussed from the univariate analysis. Not only previously
mentioned variables, but also cancer, CVD, confusion, a low hematocrit, a low pO2,
and the use of corticosteroids were significantly associated with one-year mortality in
the univariate analysis. Cancer is a clear variable that could impact on mortality. In
fact, it has been recently demonstrated that ≤10% of patients hospitalized with CAP
are diagnosed with either a primary lung cancer or pulmonary metastasis within
several years of admission (134). It should be emphasized that immunosuppressed
patients were excluded from the present study and only those with a history of cancer
were taken into account. In addition, around 5% of the population had a history of
cancer, while more than 10% had a history of cancer in Louisville cohort, as will be
discussed later on. Several parameters from the physical examination and analytics
have been postulated as risk factors for mortality. It should be mentioned that
confusion and dementia are different parameters, the first being of new onset and the
latter a chronic cognitive impairment. Low hematocrit has already been described as a
risk factor for long-term mortality by Brancati et al. (35) and more recently by Waterer
et al. (49). A low hematocrit or albumin usually reflects a poor nutritional status, which
could actually mask other diseases.

LONG‐TERM MORTALITY IN HOSPITALIZED PATIENTS WITH COMMUNITY‐ACQUIRED PNEUMONIA
142
Another interesting point is the effect of corticosteroids on CAP. The impact of
corticosteroids on pneumonia prognosis is controversial. Since it was first suggested
in the TORCH study, a higher incidence of pneumonia among patients on inhaled
corticosteroids has been published many papers, mostly focusing on short-term
prognosis. Recently, in a meta-analysis published in 2015 among hospitalized adults
with CAP, systemic corticosteroid therapy turned out to may reduce mortality by
approximately 3% and the need for mechanical ventilation by approximately 5% (135).
In the present study, non-survivors received corticosteroids more frequently during
hospitalization (p=0.06). However, this association did not achieve statistical
significance.
Finally, it should be highlighted that TRIPOD statements were used for transparent
reporting of the prediction model (105). The score has shown good statistical
properties in terms of discrimination, calibration and internal validation Discrimination
was measured by the C-index, resulting in 0.75 and 0.72 in the derivation and
validation cohorts, respectively, for the one-year CAPSI risk score. Calibration was
measured by the GND calibration test for the survival model, and was 0.98 for the
derivation cohort and 0.93 for the validation cohort for the one-year CAPSI risk score.

Discussion
143
7.2.2. STUDY II: In recent decades, increasing interest has emerged concerning biomarkers. In this sense, this study demonstrates that proADM is associated with the severity of disease measured by severity scores. Hence, patients with more severe disease at diagnosis present higher levels of proADM. After the exclusion of deaths within 15 days, only 24 patients died within one year. Biomarkers showed poor predictive accuracy for one-year mortality and were not able to improve the prediction ability of risk scores for one-year mortality when added to the scores. In a subanalysis carried out including all deaths up to one year, proADM showed the best predictive ability for one-year mortality and, when added to the one-year CAPSI, the prediction ability of the score was significantly improved.
On the other hand, a decrease in proADM from the first 24 hours to 3-5 days, adjusted by proADM value at baseline, was associated with a significantly reduced risk of death at one year. However, once it was adjusted by severity of disease and proADM baseline value, only when all deaths within one year were analyzed was associated with a significantly reduced risk of death at one year, meaning that, based on our sample, its predictive ability is mainly for short-term mortality.
Current risk scores have demonstrated utility for the management of CAP; however,
they have several limitations. Firstly, they are vulnerable to bias as they are
dependent on differences in terms of the definition of variables. Secondly, they have
shown poor predictive accuracy in predicting patients at high risk of dying; hence, they
have a high negative predictive value and a low positive predictive value. Thirdly,
different scores have used different endpoints like 30-day mortality or ICU admission.
Fourthly, scores do not work as well in elderly people. For example, PSI clearly
overestimates age, with older people obtaining higher scores while young people are
underestimated. Due to the limitations of risk scores, a more accurate approach has
been encouraged in order to identify worse outcomes in CAP. In this sense, multiple
biomarkers have been studied with good results in the short- and long-term.
Considerable efforts have been undertaken in order to assess biomarkers alone or
included in current scores. All the scores measure the effect of infection in the host at

LONG‐TERM MORTALITY IN HOSPITALIZED PATIENTS WITH COMMUNITY‐ACQUIRED PNEUMONIA
144
the time of diagnosis, but not the inflammatory response mechanisms to the injury,
which is undoubtedly crucial to the outcome. The routine use of these biomarkers still
remains challenging, probably due to the high cost.
Biomarkers have been assessed for different utilities, such as the severity of disease,
etiology, or duration of antibiotic treatment. CRP is a biomarker that has shown benefit
in the diagnosis of acute inflammatory responses, including viral and bacterial
infections, while PCT is a sensitive and specific marker for the diagnosis of systemic
bacterial infection (136). Both biomarkers have demonstrated established evidence in
terms of identifying low risk patients, which allow clinicians to send patients home
safely. Moreover, increasing interest has emerged concerning the duration of antibiotic
treatment (137). A clinical trial carried out by a Swiss group showed that the duration
of antibiotic treatment could be safely reduced from 12 days to 5 days using a PCT-
guided protocol (74). However, a more recent clinical trial has suggested that
treatment reduction could be safely implemented based only on clinical stability criteria
(138). Menendez et al. (139) suggested that clinical stability is usually achieved by day
three, hence, taking into account IDSA/ATS guidelines, antibiotic treatment could be
limited to five days in most patients.
Recently, new cardiovascular biomarkers have been developed with promising results.
ProADM is the most stable fragment of adrenomedullin degradation. The importance
of this biomarker is mostly focused on its activity as a potent vasodilator and the
immunomodulatory regulation of inflammatory processes. It has been promoted as a
prognostic biomarker in sepsis as well as a useful marker for risk stratification in
patients with CAP (140). However, in terms of discriminating etiology, it has been
described as a weak biomarker (73).
In a prospective observational study conducted among 228 patients with CAP, the
authors found significantly higher levels of proADM, PCT and CRP as well as higher
PSI and CURB65 scores in patients with complications during hospitalization (73). The
CAPNETZ group assessed new biomarkers, not only for short-term mortality, but also
for 180-day mortality; the authors concluded that proADM was the best predictor of
both short- and long-term mortality (71). Bello et al. (73) assessed different biomarkers
and showed that proADM was the only one able to distinguish between survivors and
non-survivors at one year after an episode of CAP. Of note, the authors did not

Discussion
145
exclude in-hospital mortality from analysis, which actually could have had a significant
influence on the results.
In our study, three different biomarkers were assessed for one-year mortality, and only
proADM showed significantly higher levels among more severe patients, as measured
by different risk scores. Surprisingly, patients with higher scores on the one-year
CAPSI showed lower levels of CRP, which would support the previously published
idea of CRP high levels being protective against complications in patients with CAP
(96).
All biomarkers failed to predict one-year mortality. However, it should be taken into
account that deaths up to 15 days from diagnosis were excluded; thus, only 24
patients died within one year. Due to the small sample size after the exclusion of
deaths within 15 days, a subanalysis was carried out including all deaths up to one
year; proADM showed a high predictive ability for one-year mortality. Deaths around
the acute episode of CAP could have a great influence when assessing long-term
mortality and, ideally, should be excluded from the analysis. However, in this study,
proADM was a good predictor of one-year mortality only once all deaths were
included. In this sense, future research should focus on obtaining a larger sample size
for the study of biomarkers and long-term mortality prediction after a CAP episode,
excluding short-term mortality.
Another matter of concern is how much a biomarker could improve the mortality
prediction ability of a risk score. España et al. (141) measured proADM levels on
admission in a prospective cohort of 491 patients with CAP and observed a significant
correlation with severity scores and an improvement in the predictive ability for
adverse events when the biomarker was added to the severity score, thus providing
an additional margin of safety. In another study carried out among an already well-
characterized cohort of patients with CAP from the ProHOSP study, which was first
developed to assess antibiotic stewardship, patients were prospectively followed for
six years (74). The authors observed a high mortality rate of almost 50% after
hospitalization. More interestingly, they described a high predictive accuracy of risk
scores, which was actually improved when biomarkers were added.
In our study, the addition of biomarkers failed to improve the predictive accuracy of the
scores for mortality. As previously explained, in the subanalysis carried out including

LONG‐TERM MORTALITY IN HOSPITALIZED PATIENTS WITH COMMUNITY‐ACQUIRED PNEUMONIA
146
all deaths up to one year, proADM significantly improved the predictive accuracy of
one-year CAPSI and CURB65. It would be of great interest to assess this in a bigger
cohort, i.e. whether proADM improves the prediction ability of risk scores.
Serial biomarker levels have been assessed by different authors with different aims. A
PCT-guided protocol with serial PCT measures carried out in a clinical trial could
safely reduce the duration of antibiotic treatment from 12 days to 5 days (84). In our
study, the main outcome was one-year mortality, and we strongly believe that
inflammation and cardiovascular diseases are related to the increased long-term
mortality that patients suffer after an episode of CAP. Hence, we decided to assess
serial proADM levels in relation to one-year mortality due to its activity as a potent
vasodilator and immunomodulatory regulator of inflammatory processes. Measuring
serial proADM levels at follow-up after an episode of CAP could support the
hypotheses of chronic persistent inflammation.
In the present study, we could not obtain blood samples at late follow-up, but we were
able to obtain biomarkers at 3-5 days after diagnosis. In order to assess the impact of
serial biomarker levels on one-year mortality, the proADM changes was estimated by
subtracting the proADM value at 3-5 days from the proADM value at the time of
diagnosis. ProADM changes failed to significantly predict mortality when deaths within
first 15 days were excluded but not when all deaths up to one year were included.
Moreover, when patients who died between 15 days and up to one year were
excluded, decreases in proADM values were associated with significantly decreased
one-year mortality, leading to the idea that, at least in this sample, proADM is related
to short-term mortality.
Later on, proADM changes were estimated after adjustment by severity scores and,
similarly, proADM changes failed to be protective of one-year mortality. However,
when the same analysis was conducted including all deaths up to one year, for each
0.1 nmol/L decrease in proADM, a decrease of 9% in one-year mortality was
observed, adjusted by one-year CAPSI. Hence, the greater the reduction in biomarker
levels over time, the greater the reduction in one-year mortality. Further analysis
excluding those patients who died after 15 days and up to one year showed that
decreases in proADM failed to be protective, again leading to the idea that, at least in
this sample, proADM is related to short-term mortality. It is of special interest to

Discussion
147
measure biomarker levels at admission as well as at follow-up in order to know
whether the absence of a decrease is related not only with to increased mortality rate
but also to an increased rate of cardiovascular events.
Despite the limitations of the current study results, it seems clear that proADM showed
a correlation with the severity of disease. ProADM has been widely studied for long-
term mortality, probably due to its cardiovascular effect. As previously mentioned,
patients suffering from CAP have a greater probability of suffering from cardiovascular
events in the follow-up; moreover, these cardiovascular events seem to be related to
the increased mortality rates that these patients suffer at late follow-up. Chronic
persistent inflammation could be the underlying issue.

LONG‐TERM MORTALITY IN HOSPITALIZED PATIENTS WITH COMMUNITY‐ACQUIRED PNEUMONIA
148
7.2.3. STUDY III: Long-term mortality was assessed in an external cohort at the Veterans Affairs Medical Center of Louisville, Kentucky. Patients from this study differed from the patients in study I in terms of sociodemographics and comorbidities. Hence, the one-year CAPSI failed to properly validate previous results when applied to this sample. Thus, a specific cohort with different variables from one-year CAPSI was developed for one-year mortality with a high predictive accuracy and based on age ≥75 years, cancer, CHF, dementia, albumin <3.5mg/dL and platelets <100,000 109/L or >400,000 109/L. However, it seems that predicting mortality on a longer time prediction model is more difficult. In fact, the same score was tested for five-year mortality with a decrease in predictive ability. Another specific score was developed for five-year mortality but the predictive accuracy was not as high as expected.
In an attempt to assess mortality in an external cohort, 455 patients from the Veterans
Affairs Medical Center of Louisville, Kentucky were analyzed. This is a particular
cohort including American military veterans. Thus, all patients were male, 70% of
patients were hypertensive, and almost half of the cohort were current smokers and
suffered from COPD. Despite excluding mortality within 15 days from diagnosis, the
one-year mortality rate was as twice high as the one observed in our cohort. One-year
CAPSI was applied to this sample and it failed to properly validate the previous
results, due to the differences in the sociodemographic and clinical characteristics
between both cohorts. Hence, a specific prediction score was developed for one-year
mortality.
Under these circumstances, a weighted prediction score was developed based on age
≥75 years, cancer, CHF, dementia, albumin <3.5 and platelets <100,000 or >400,000.
Similarly to our cohort, age, CHF, and dementia were included in the score. Moreover,
dementia was the second most important variable with 4 points. The most powerful
variable was cancer, weighted with 7 points. Although immunosuppressed patients
were excluded, still, 12.75% of the cohort had suffered from cancer, while only 5.53%
of patients from the Galdakao-Usansolo Hospital had cancer. In addition, low albumin
and platelet levels have been related to a poor nutritional status, which actually had a
considerable impact on mortality, as previously explained. However, in the Galdakao-

Discussion
149
Usansolo Hospital cohort, with a long inclusion period, neither albumin nor platelets
could be obtained during the study; thus, these parameters could not be analyzed.
The one-year prediction score showed acceptable prediction accuracy. Nevertheless,
when the same score was used to assess five-year mortality, accuracy declined.
Five-year mortality was 58% (265 deaths) and a specific prediction score was
developed including age, BMI <21, nursing home residence, aspiration, cancer, CHF,
and platelets <100x109/L or >400x109/L; however, a worse predictive accuracy was
shown (AUC 0.69). As explained before, patients with BMI <21, nursing home
residence, and aspiration are usually included in HCAP, which had already been
suggested as a poor prognosis.
Therefore, it seems that predicting one-year mortality is more feasible than predicting
five-year mortality. In this sense, biomarkers could actually become crucial. The
addition of cardiovascular biomarkers such as proADM to risk scores has been
postulated to improve the predictive accuracy for short- and long-term mortality. On
the other hand, it should be taken into account that whenever a score is validated in
an external sample, patient similarities in terms of sociodemographics and
comorbidities should be tested first. In this study, the sample characteristics differ
greatly from those of the first study sample; hence, a specific score was developed for
this specific sample.
On the other hand, several issues concerning methodology used for the study carried
out in the Veterans Affairs Medical Center of Louisville, Kentucky should be
highlighted. Instead of choosing variables significantly related to one-year mortality, an
“automatic selection” regression model was used. In order to assess the best fit of the
regression model compared to models with different variables, a genetic algorithm
was used to identify a best-fit model somewhat automatically using the AIC. This
algorithm creates thousands of different regression models, logistic regression in this
case, and assesses the model fit based on AIC. This is called an optimization
algorithm because it optimizes the model fit given thousands and thousands of
different potential variable combinations. When the fit no longer improves by changing
the variables around, the algorithm stops and the best model is shown. The genetic
algorithm lets us automate much of this process by looking at thousands of models
with different variables included and evaluating the AIC of each and comparing them

LONG‐TERM MORTALITY IN HOSPITALIZED PATIENTS WITH COMMUNITY‐ACQUIRED PNEUMONIA
150
until it finds an optimum set of variables that minimizes the AIC. This model is then
used to weight the variables and create the score.
A key point of this methodology is the fact that the variables included in the score were
not necessarily independently associated with the outcome at the p-value cutoff of
0.05. The important thing to consider here is that the objective was not to identify
independent predictors of long-term mortality in hospitalized patients with CAP.
Indeed, we tried to identify a model that fit the data the best in order to create a
composite score that could be able to discriminate between patients who died and
those who did not die at one and five years. The fact that some variables were not
independently associated with the outcome is not relevant in this situation, as they are
to be combined at the end into one variable that then independently predicts the
outcome.

Discussion
151
7.3 Strengths and limitations This study has several strengths. The first one is the large sample size of the
Galdakao-Usansolo Hospital prospective cohort. More than 2,000 patients with CAP
were assessed during hospitalization. In addition, vital status could be obtained from
all of them. Deaths within 15 days from diagnosis were excluded in order to avoid the
impact an acute episode could have on mortality.
Another strength is that the one-year CAPSI is an easy-to-use score that can
accurately predict one-year mortality. Compared to the PSI score, which is complex
and difficult to implement in daily clinical practice, the one-year CAPSI includes five
easy to determine variables that can easily identify patients at a high risk of death.
Furthermore, biomarkers could be assessed, showing a clear correlation with the
severity of disease. Biomarker levels could be also assessed at follow-up, which
provides a new perspective on the utility of biomarkers. Moreover, a key point of this
study is that long-term mortality could be assessed in an external cohort of
hospitalized patients with CAP, which strengthens the quality of the scientific research.
This study has also several limitations. Firstly, causes of death could not be obtained
in any case, which could have added important information. Secondly, several
variables such as tobacco use, albumin, or platelets could not be assessed at the
Galdakao-Usansolo Hospital cohort due to missing data. Thirdly, the sample size was
notably reduced once deaths within 15 days of diagnosis were excluded, which had a
considerable impact, especially in the cohort of section II when biomarkers were
analyzed. Hence, due to the small sample size, these data should be cautiously
interpreted. Fourthly, when assessing an external cohort, the peculiarities of patients
from the Veterans Affairs Medical Center of Louisville, Kentucky limited the results.
Fifthly, the study design was retrospective in study III, which could add a limitation.
Finally, immunosuppressed patients, those infected by the human immunodeficiency
virus, as well as those who had been discharged from an acute care hospital, an
onsite subacute care unit, or a palliative care unit within the previous 14 days were
excluded from this study. Thus, the data cannot be extrapolated to these patients.

LONG‐TERM MORTALITY IN HOSPITALIZED PATIENTS WITH COMMUNITY‐ACQUIRED PNEUMONIA
152
7.4 Potential clinical use and future research The impact of an aging population has become a major issue of concern. Future
research in the area of inflammation is needed. Indeed, inflammation among elderly
people should be assessed independently as it probably has a distinctive role. In
addition, it seems that persistent chronic inflammation after an episode of CAP could
lead to higher long-term mortality rates. Future research should include an
assessment of cardiovascular events after hospitalization for CAP, not only at short-
term follow-up, but also at long-term. In this sense, it would be of special interest to
evaluate in a larger cohort cardiovascular biomarkers levels in the follow-up after
hospitalization with CAP in order to demonstrate if patients with less significant
decreases over time have higher mortality rates. This would support the idea that
persistently elevated levels of biomarkers are associated with an increased risk of
cardiovascular events. Moreover, this inflammation could lead to endothelial
dysfunction or to a prothrombotic state and, consequently, to a higher rate of
cardiovascular events. Indeed, cardiovascular diseases have been postulated as
possibly causative of increased mortality in these patients.
This inflammatory storm could lead to the development of new cardiovascular
diseases as well as to already established but undiagnosed cardiovascular diseases.
Therefore, close monitoring should be encouraged among these patients at high risk
of death in order to make an early diagnosis and for the treatment optimization of
comorbidities. Additionally, future research should address whether treatment with
specific drugs to overcome inflammation favorably impacts long-term mortality.
In conclusion, CAP is an important problem with high morbidity and mortality. In
addition, an easy-to use score based on age ≥80, CHF, dementia, BUN >30 mg/dL,
and a respiratory rate ≥30 breaths/min can predict one-year mortality with a high
predictive accuracy, better than widely known severity scores. Future research should
be conducted to clarify the impact of inflammation on CAP prognosis.

153
8. CONCLUSIONS

Conclusions
155
STUDY I. One-year mortality prediction among hospitalized patients with CAP in Galdakao-Usansolo Hospital.
1. In this study, 2,351 patients were evaluated to identify one-year mortality predictors,
with 250 (10.63%) patients dying within one year. Several variables were identified as
predictors of one-year mortality, but five of them could be combined in a single model
consisting of age ≥80, CHF, dementia, BUN >30 mg/dL, and a respiratory rate ≥30
breaths/min. Dementia and age ≥80 were the most powerful variables weighted with 6
and 4 points, respectively. BUN >30 mg/dL was weighted with 3 points while CHF and
a respiratory rate ≥30 breaths/min were both weighted with 2 points. Recognizing
these five variables may be useful for identifying patients with a high probability of
dying after an episode of CAP.
2. With these five weighted variables, a new score called the one-year CAPSI was
developed to predict one-year mortality among hospitalized patients with CAP. The
score showed good statistical properties in terms of discrimination, calibration, and
internal validation. Considering one-year CAPSI as a continuous variable, the C-index
was 0.76 in the derivation cohort and 0.77 in the validation cohort. In addition, the
GND calibration test for the one-year CAPSI was 0.03 for the derivation cohort and
0.23 for the validation cohort.
The previous continuous score was categorized into three risk groups, i.e. minor,
moderate, and severe, and was called the one-year CAPSI risk score. This risk score
had a C-index of 0.72 and 0.70 in the derivation and validation cohorts, respectively.
The GND calibration test for the one-year CAPSI was 0.98 for the derivation cohort
and 0.93 for the validation cohort.
For a cut-off point of four on the one-year CAPSI, the results of the statistical
measures of performance were: sensitivity 81.40%, specificity 64.47%, PPV 21.56%,
and NPV 96.65%, with an accuracy of 66.28% for the derivation cohort. In the
validation cohort, sensitivity was 75.63%, specificity 65.09%, PPV 20.27%, and NPV
95.79%, with an accuracy of 66.20%.

LONG‐TERM MORTALITY IN HOSPITALIZED PATIENTS WITH COMMUNITY‐ACQUIRED PNEUMONIA
156
3. The one-year CAPSI showed a higher predictive ability than CURB65 and SCAP. In
the derivation cohort, the C-index for the one-year CAPSI was 0.76 while for PSI it
was 0.73, for CURB65 0.69, and for SCAP 0.70. In the validation cohort, the C-index
for the one-year CAPSI was 0.77, while the C-index for PSI was 0.75, for CURB65
0.71, and for SCAP 0.70. Hence, the one-year CAPSI appears to be more useful than
current risk scores for the prediction of one-year mortality after a hospitalization for
CAP.
STUDY II. Role of biomarkers in one-year mortality prediction among hospitalized patients with CAP in Galdakao-Usansolo Hospital.
1. In this second study, risk scores as well as three biomarkers were assessed for
one-year mortality, including CRP, PCT, and proADM. ProADM was the only
biomarker with significantly higher levels at admission among more severe patients,
while lower levels of CRP were observed among more severe patients measured by
the one-year CAPSI. In addition, risk scores showed a high predictive accuracy for
one-year mortality. However, biomarkers failed to predict one-year mortality when
excluding deaths within 15 days from admission, with a C-index for proADM of 0.64.
Once all deaths within one year were included in the analysis, proADM showed a high
predictive accuracy for one-year mortality with a C-index of 0.71; based on our
sample, its predictive ability is mainly for short-term mortality.
2. Risk scores were able to predict one-year mortality, but not biomarkers. However,
as proADM was the only biomarker correlated with the severity of disease, it was
added to the current risk scores. ProADM failed to improve the prediction ability of
these scores when excluding deaths within 15 days. Once all deaths within one year
were included in the analysis, the addition of proADM significantly improved the
prediction ability for one-year mortality of CURB65 and one-year CAPSI.

Conclusions
157
3. When we assessed the role of changes in proADM values from admission to 3-5
days, adjusted by proADM basal values and the risk scores, proADM changes predict
one-year mortality; though mainly explain by short-term mortality (<=15 days).
Additionally, when proADM changes were adjusted by the one-year CAPSI, a
decrease of 0.1 nmol/L in proADM from admission to 3-5 days was associated with a
9% decrease in one-year mortality. Limited sample size and the distribution of the
outcome may have influenced the results.
STUDY III. One-year mortality prediction among hospitalized patients with CAP in the Veterans Affairs Medical Center of Louisville, Kentucky.
1. Patients hospitalized for CAP at the Veterans Affairs Medical Center of Louisville,
Kentucky differed from patients hospitalized for CAP at the Galdakao-Usansolo
Hospital, in terms of sociodemographics and comorbidities. In addition, when the one-
year CAPSI was applied to this sample, it failed to properly validate the previous
results, due to the differences in the sociodemographic and clinical characteristics of
the two cohorts.
2. Taking into account the specific peculiarities of the sample from the Veterans Affairs
Medical Center of Louisville, Kentucky, a specific score was developed by a genetic
algorithm for one-year mortality. The final multivariate score included age ≥75 years
weighted with 2 points, cancer with 7 points, CHF with 1 point, dementia with 4 points,
albumin <3.5mg/dL with 2 points, and platelets <100,000 109/L or >400,000 109/L with
2 points, with an AUC of 0.77. The same score was tested for five-year mortality with a
poorer predictive accuracy (AUC 0.70). Thus, predicting long-term mortality after an
episode of CAP remains challenging.

LONG‐TERM MORTALITY IN HOSPITALIZED PATIENTS WITH COMMUNITY‐ACQUIRED PNEUMONIA
158

159
9. REFERENCES

References
161
1. Rozman C (2004). Infecciones del aparato respiratorio. Farreras; Medicina interna.
(p795). Madrid: Elsevier.
2. Álvarez CJ. Neumonías: concepto, clasificación y diagnóstico diferencial.
Monografías neumomadrid. Neumonías. 2005. p9-14.
3. American Thoracic S, Infectious Diseases Society of A. Guidelines for the
management of adults with hospital-acquired, ventilator-associated, and healthcare-
associated pneumonia. American journal of respiratory and critical care medicine.
2005;171(4):388-416.
4. Shindo Y, Ito R, Kobayashi D, Ando M, Ichikawa M, Shiraki A, et al. Risk factors for
drug-resistant pathogens in community-acquired and healthcare-associated
pneumonia. American journal of respiratory and critical care medicine.
2013;188(8):985-95.
5. Singer M, Deutschman CS, Seymour CW, Shankar-Hari M, Annane D, Bauer M, et
al. The Third International Consensus Definitions for Sepsis and Septic Shock
(Sepsis-3). Jama. 2016;315(8):801-10.
6. Restrepo MI, Faverio P, Anzueto A. Long-term prognosis in community-acquired
pneumonia. Current opinion in infectious diseases. 2013;26(2):151-8.
7. Almirall J, Bolibar I, Vidal J, Sauca G, Coll P, Niklasson B, et al. Epidemiology of
community-acquired pneumonia in adults: a population-based study. The European
respiratory journal. 2000;15(4):757-63.
8. Welte T, Torres A, Nathwani D. Clinical and economic burden of community-
acquired pneumonia among adults in Europe. Thorax 2012;67(1):71-79.
9. Jain S, Self WH, Wunderink, RG, Fakhran S, Balk R, Bramley AM, et al.
Community-Acquired Pneumonia req.uiring hospitalization among U.S. adults. N Engl
J Med 2015; 373:415-27.
10. Gil-Prieto R, Garcia-Garcia L, Alvaro-Meca A, Mendez C, Garcia A, de Miguel AG.
The burden of hospitalisations for community-acquired pneumonia (CAP) and
pneumococcal pneumonia in adults in Spain (2003-2007). Vaccine. 2011;29(3):412-6.
11. Capelastegui A, Espana PP, Bilbao A, Gamazo J, Medel F, Salgado J, et al. Study
of community-acquired pneumonia: incidence, patterns of care, and outcomes in
primary and hospital care. The Journal of infection. 2010;61(5):364-71.
12. Huang SS, Johnson KM, Ray GT, Wroe P, Lieu TA, Moore MR, et al. Healthcare
utilization and cost of pneumococcal disease in the United States. Vaccine.
2011;29(18):3398-412.

LONG‐TERM MORTALITY IN HOSPITALIZED PATIENTS WITH COMMUNITY‐ACQUIRED PNEUMONIA
162
13. Sicras-Mainar A, Ibanez-Nolla J, Cifuentes I, Guijarro P, Navarro-Artieda R,
Aguilar L. Retrospective epidemiological study for the characterization of community-
acquired pneumonia and pneumococcal pneumonia in adults in a well-defined area of
Badalona (Barcelona, Spain). BMC infectious diseases. 2012;12:283.
14. Mortensen EM, Metersky ML. Long-term mortality after pneumonia. Seminars in
respiratory and critical care medicine. 2012;33(3):319-24.
15. European Lung White Book. European Respiratory Society and European Lung
Foundation, The First Comprehensive Survey on Respiratory Health in Europe. En:
Loddenkemper R, Gibson GJ, Sibille Y, editors. Bruselas: ERSJ Ltd.; 2003.
16. World Health Organization. The Top Ten Causes of Death.
www.who.int/mediacentre/factsheets/fs331.pdf. Last updated: May 2014. [Accessed
16 December, 2015]
17. Fine MJ, Smith MA, Carson CA, Mutha SS, San- key SS, Weissfeld LA, et al.
Prognosis and outcomes of patients with community-acquired pneumonia. A meta-
analysis. JAMA 1996;275(2):134-41.
18. Marrie TJ, Carriere KC, Jin Y, Johnson DH. Factors associated with death among
adults <55 years of age hospitalized for community-acquired pneumonia. Clin Infect
Dis. 2003;36(4):413-21.
19. Singer M, Nambiar S, Valappil T, Higgins K, Gitterman S. Historical and regulatory
perspectives on the treatment effect of antibacterial drugs for community-acquired
pneumonia. Clin Infect Dis. 2008;47 Suppl 3:S216-24.
20. Woodhead M. Community-acquired pneumonia in Europe: causative pathogens
and resistance patterns. Eur Respir J 2002;20:20s-27s.
21. Torres A, Peetermans WE, Viegi G, Blasi F. Risk factors for community-acquired
pneumonia in adults in Europe: a literature review. Thorax. 2013;68(11):1057-65.
22. Mortensen EM, Kapoor WN, Chang CC, Fine MJ. Assessment of mortality after
long-term follow-up of patients with community-acquired pneumonia. Clin Infect Dis.
2003;37(12):1617-24.
23. Walter LC, Brand RJ, Counsell SR, Palmer RM, Landefeld CS, Fortinsky RH, et al.
Development and validation of a prognostic index for 1-year mortality in older adults
after hospitalization. Jama. 2001;285(23):2987-94.
24. Levine SK, Sachs GA, Jin L, Meltzer D. A prognostic model for 1-year mortality in
older adults after hospital discharge. The American journal of medicine.
2007;120(5):455-60.

References
163
25. Kaplan V, Clermont G, Griffin MF, Kasal J, Watson RS, Linde-Zwirble WT, et al.
Pneumonia: still the old man's friend? Archives of internal medicine. 2003;163(3):317-
23.
26. Bruns AH, Oosterheert JJ, Cucciolillo MC, El Moussaoui R, Groenwold RH, Prins
JM, et al. Cause-specific long-term mortality rates in patients recovered from
community-acquired pneumonia as compared with the general Dutch population. Clin
Microbiol Infect. 2011;17(5):763-8.
27. Yende S, Angus DC, Ali IS, Somes G, Newman AB, Bauer D, et al. Influence of
comorbid conditions on long-term mortality after pneumonia in older people. Journal of
the American Geriatrics Society. 2007;55(4):518-25.
28. Koivula I, Sten M, Makela PH. Prognosis after community-acquired pneumonia in
the elderly: a population-based 12-year follow-up study. Archives of internal medicine.
1999;159(14):1550-5.
29. Eurich DT, Marrie TJ, Minhas-Sandhu JK, Majumdar SR. Ten-Year Mortality after
Community-acquired Pneumonia. A Prospective Cohort. American journal of
respiratory and critical care medicine. 2015;192(5):597-604.
30. Mortensen EM, Coley CM, Singer DE, Marrie TJ, Obrosky DS, Kapoor WN, et al.
Causes of death for patients with community-acquired pneumonia: results from the
Pneumonia Patient Outcomes Research Team cohort study. Archives of internal
medicine. 2002;162(9):1059-64.
31. Aliberti S, Ramirez JA. Cardiac diseases complicating community-acquired
pneumonia. Current opinion in infectious diseases. 2014;27(3):295-301.
32. Adamuz J, Viasus D, Jimenez-Martinez E, Isla P, Garcia-Vidal C, Dorca J, et al.
Incidence, timing and risk factors associated with 1-year mortality after hospitalization
for community-acquired pneumonia. The Journal of infection. 2014;68(6):534-41.
33. Sligl WI, Eurich DT, Marrie TJ, Majumdar SR. Age still matters: prognosticating
short- and long-term mortality for critically ill patients with pneumonia. Critical care
medicine. 2010;38(11):2126-32.
34. Hedlund JU, Ortqvist AB, Kalin ME, Granath F. Factors of importance for the long
term prognosis after hospital treated pneumonia. Thorax. 1993;48(8):785-9.
35. Brancati FL, Chow JW, Wagener MM, Vacarello SJ, Yu VL. Is pneumonia really
the old man's friend? Two-year prognosis after community-acquired pneumonia.
Lancet. 1993;342(8862):30-3.

LONG‐TERM MORTALITY IN HOSPITALIZED PATIENTS WITH COMMUNITY‐ACQUIRED PNEUMONIA
164
36. Sligl WI, Eurich DT, Marrie TJ, Majumdar SR. Only severely limited, premorbid
functional status is associated with short- and long-term mortality in patients with
pneumonia who are critically ill: a prospective observational study. Chest.
2011;139(1):88-94.
37. Johnstone J, Eurich DT, Majumdar SR, Jin Y, Marrie TJ. Long-term morbidity and
mortality after hospitalization with community-acquired pneumonia: a population-
based cohort study. Medicine. 2008;87(6):329-34.
38. Polsky D, Jha AK, Lave J, Pauly MV, Cen L, Klusaritz H, et al. Short- and long-
term mortality after an acute illness for elderly whites and blacks. Health services
research. 2008;43(4):1388-402.
39. Hsu JL, Siroka AM, Smith MW, Holodniy M, Meduri GU. One-year outcomes of
community-acquired and healthcare-associated pneumonia in the Veterans Affairs
Healthcare System. International journal of infectious diseases : IJID : official
publication of the International Society for Infectious Diseases. 2011;15(6):e382-7.
40. El-Solh AA, Pietrantoni C, Bhat A, Bhora M, Berbary E. Indicators of potentially
drug-resistant bacteria in severe nursing home-acquired pneumonia. Clin Infect Dis
2004;39:474-80.
41. Polverino E, Torres A, Menendez R, Cilloniz C, Valles JM, Capelastegui A, et al.;
HCAP Study investigators. Microbial aetiology of healthcare associated pneumonia in
Spain: A prospective, multicentre, case-control study. Thorax 2013;68:1007-14.
42. Cecere LM, Rubenfeld GD, Park DR, Root RK, Goss CH. Long-term survival after
hospitalization for community-acquired and healthcare-associated pneumonia.
Respiration; international review of thoracic diseases. 2010;79(2):128-36.
43. Alan M, Grolimund E, Kutz A, Christ-Crain M, Thomann R, Falconnier C, et al.
Clinical risk scores and blood biomarkers as predictors of long-term outcome in
patients with community-acquired pneumonia: a 6-year prospective follow-up study.
Journal of internal medicine. 2014.
44. Beier K, Eppanapally S, Bazick HS, Chang D, Mahadevappa K, Gibbons FK, et al.
Elevation of blood urea nitrogen is predictive of long-term mortality in critically ill
patients independent of "normal" creatinine. Critical care medicine. 2011;39(2):305-13.
45. Luria MH, Knoke JD, Margolis RM, Hendricks FH, Kuplic JB. Acute myocardial
infarction: prognosis after recovery. Annals of internal medicine. 1976;85(5):561-5.
46. Capelastegui A, Espana PP, Quintana JM, Bilbao A, Menendez R, Zalacain R, et
al. Development of a prognostic index for 90-day mortality in patients discharged after

References
165
admission to hospital for community-acquired pneumonia. Thorax. 2009;64(6):496-
501.
47. Wesemann T, Nullmann H, Pflug MA, Heppner HJ, Pientka L, Thiem U.
Pneumonia severity, comorbidity and 1-year mortality in predominantly older adults
with community-acquired pneumonia: a cohort study. BMC infectious diseases.
2015;15:2.
48. Koskela HO, Salonen PH, Romppanen J, Niskanen L. Long-term mortality after
community-acquired pneumonia--impacts of diabetes and newly discovered
hyperglycaemia: a prospective, observational cohort study. BMJ open.
2014;4(8):e005715.
49. Waterer GW, Kessler LA, Wunderink RG. Medium-term survival after
hospitalization with community-acquired pneumonia. American journal of respiratory
and critical care medicine. 2004;169(8):910-4.
50. Bordon J, Wiemken T, Peyrani P, Paz ML, Gnoni M, Cabral P, et al. Decrease in
long-term survival for hospitalized patients with community-acquired pneumonia.
Chest. 2010;138(2):279-83.
51. Taylor JK, Fleming GB, Singanayagam A, Hill AT, Chalmers JD. Risk factors for
aspiration in community-acquired pneumonia: analysis of a hospitalized UK cohort.
The American journal of medicine. 2013;126(11):995-1001.
52. Singanayagam A, Singanayagam A, Elder DH, Chalmers JD. Is community-
acquired pneumonia an independent risk factor for cardiovascular disease? The
European respiratory journal. 2012;39(1):187-96.
53. Corrales-Medina VF, Taljaard M, Yende S, Kronmal R, Dwivedi G, Newman AB, et
al. Intermediate and long-term risk of new-onset heart failure after hospitalization for
pneumonia in elderly adults. American heart journal. 2015;170(2):306-12.
54. Cangemi R, Calvieri C, Falcone M, Bucci T, Bertazzoni G, Scarpellini MG, et al.
Relation of Cardiac Complications in the Early Phase of Community-Acquired
Pneumonia to Long-Term Mortality and Cardiovascular Events. The American journal
of cardiology. 2015;116(4):647-51.
55. Dinarello CA. Proinflammatory Cytokines. Chest 2000; 118: 503-508.
56. Yende S, D'Angelo G, Kellum JA, Weissfeld L, Fine J, Welch RD, et al.
Inflammatory markers at hospital discharge predict subsequent mortality after
pneumonia and sepsis. American journal of respiratory and critical care medicine.
2008;177(11):1242-7.

LONG‐TERM MORTALITY IN HOSPITALIZED PATIENTS WITH COMMUNITY‐ACQUIRED PNEUMONIA
166
57. Christ-Crain M, Muller B. Biomarkers in respiratory tract infections: diagnostic
guides to antibiotic prescription, prognostic markers and mediators. The European
respiratory journal. 2007;30(3):556-73.
58. Seligman R, Ramos-Lima LF, Oliveira VA, Sanvicente C, Pacheco EF, Rosa KD.
Biomarkers in community-acquired pneumonia: A state-of-the-art review. Clinics.
2012;67(11):1321-5.
59. Joyce CD, Fiscus RR, Wang X, Dries DJ, Morris RC, Prinz RA. Calcitonin gene-
related peptide levels are elevated in patients with sepsis. Surgery. 1990;108(6):1097-
101.
60. Muller B, Becker KL, Schachinger H, Rickenbacher PR, Huber PR, Zimmerli W, et
al. Calcitonin precursors are reliable markers of sepsis in a medical intensive care
unit. Critical care medicine. 2000;28(4):977-83.
61. Boussekey N, Leroy O, Alfandari S, Devos P, Georges H, Guery B. Procalcitonin
kinetics in the prognosis of severe community-acquired pneumonia. Intensive care
medicine. 2006;32(3):469-72.
62. Muller B, White JC, Nylen ES, Snider RH, Becker KL, Habener JF. Ubiquitous
expression of the calcitonin-i gene in multiple tissues in response to sepsis. The
Journal of clinical endocrinology and metabolism. 2001;86(1):396-404.
63. Kruger S, Ewig S, Kunde J, Hartmann O, Suttorp N, Welte T, et al. Pro-atrial
natriuretic peptide and pro-vasopressin for predicting short-term and long-term
survival in community-acquired pneumonia: results from the German Competence
Network CAPNETZ. Thorax. 2010;65(3):208-14.
64. Mueller C, Scholer A, Laule-Kilian K, Martina B, Schindler C, Buser P, et al. Use of
B-type natriuretic peptide in the evaluation and management of acute dyspnea. The
New England journal of medicine. 2004;350(7):647-54.
65. Christ-Crain M, Breidthardt T, Stolz D, Zobrist K, Bingisser R, Miedinger D, et al.
Use of B-type natriuretic peptide in the risk stratification of community-acquired
pneumonia. Journal of internal medicine. 2008;264(2):166-76.
66. Cavallazzi R, El-Kersh K, Abu-Atherah E, Singh S, Loke YK, Wiemken T, et al.
Midregional proadrenomedullin for prognosis in community-acquired pneumonia: a
systematic review. Respiratory medicine. 2014;108(11):1569-80.
67. Torres A, Ramirez P, Montull B, Menendez R. Biomarkers and community-
acquired pneumonia: tailoring management with biological data. Seminars in
respiratory and critical care medicine. 2012;33(3):266-71.

References
167
68. Mandell LA. Epidemiology and etiology of community- acquired pneumonia. Infect
Dis Clin North Am 2004;18:761-776.
69. Prat C, Domı́nguez J, Rodrigo C, Giménez M, Azuara M, Jiménez O, et al.
Procalcitonin, C-reactive protein and leu- kocyte count in children with lower res-
piratory tract infection. Pediatr Infect Dis J 2003; 22: 963-8.
70. Masia M, Gutierrez F, Shum C, Padilla S, Navarro JC, Flores E, et al. Usefulness
of procalcitonin levels in community-acquired pneumonia according to the patients
outcome research team pneumonia severity index. Chest. 2005;128(4):2223-9.
71. Kruger S, Ewig S, Giersdorf S, Hartmann O, Suttorp N, Welte T, et al.
Cardiovascular and inflammatory biomarkers to predict short- and long-term survival in
community-acquired pneumonia: Results from the German Competence Network,
CAPNETZ. American journal of respiratory and critical care medicine.
2010;182(11):1426-34.
72. Niederman MS. Biological markers to determine eligibility in trials for community-
acquired pneumonia: a focus on procalcitonin. Clinical infectious diseases : an official
publication of the Infectious Diseases Society of America. 2008;47 Suppl 3:S127-32.
73. Bello S, Lasierra AB, Minchole E, Fandos S, Ruiz MA, Vera E, et al. Prognostic
power of proadrenomedullin in community-acquired pneumonia is independent of
aetiology. The European respiratory journal. 2012;39(5):1144-55.
74 Christ-Crain M, Stolz D, Bingisser R, Muller C, Miedinger D, Huber PR, et al.
Procalcitonin guidance of antibiotic therapy in community-acquired pneumonia: a
randomized trial. American journal of respiratory and critical care medicine.
2006;174(1):84-93.
75. Halm EA, Fine MJ, Marrie TJ, Coley CM, Kapoor WN, Obrosky DS, et al. Time to
clinical stability in patients hospitalized with community-acquired pneumonia:
implications for practice guidelines. Jama. 1998;279(18):1452-7.
76. Mandell LA, Wunderink RG, Anzueto A, Bartlett JG, Campbell GD, Dean NC,
Dowell SF, File TM, Musher DM, Niederman MS,Torres A, Whitney CG. Infectious
Diseases Society of America/American Thoracic Society consensus guidelines on the
management of community-acquired pneumonia in adults. Clin Infect Dis 2007;44:27-
72.
77. Woodhead M, Blasi F, Ewig S, Garau J, Huchon G, Leven M, et al; Joint Taskforce
of the European Respiratory Society and European Society for Clinical Microbiology

LONG‐TERM MORTALITY IN HOSPITALIZED PATIENTS WITH COMMUNITY‐ACQUIRED PNEUMONIA
168
and Infectious Diseases. Guidelines for the management of adult lower respiratory
tract infections: summary. Clin Microbiol Infect. 2011;17:1-24. Medline:21951384
78. Pinzone MR, Cacopardo B, Abbo L, Nunnari G. Duration of antimicrobial therapy
in community acquired pneumonia: less is more. Sci World J. 2014;759138:8.
79. Aliberti S, Blasi F, Zanaboni AM, Peyrani P, Tarsia P, Gaito S, et al. Duration of
antibiotic therapy in hospitalised patients with community-acquired pneumonia. Eur
Respir J 2010;36:128-134.
80. Uranga A, Espana PP, Bilbao A, Quintana JM, Arriaga I, Intxausti M, et al.
Duration of Antibiotic Treatment in Community-Acquired Pneumonia: A Multicenter
Randomized Clinical Trial. JAMA internal medicine. 2016.
81. Muller B, Harbarth S, Stolz D, Bingisser R, Mueller C, Leuppi J, et al. Diagnostic
and prognostic accuracy of clinical and laboratory parameters in community-acquired
pneumonia. BMC infectious diseases. 2007;7:10.
82. Blasi F, Stolz D, Piffer F. Biomarkers in lower respiratory tract infections.
Pulmonary pharmacology & therapeutics. 2010;23(6):501-7.
83. Chalmers JD, Singanayagam A, Hill AT. C-reactive protein is an independent
predictor of severity in community-acquired pneumonia. Am J Med. 2008;121(3):219-
25.
84. Schuetz P, Briel M, Christ-Crain M, Stolz D, Bouadma L, Wolff M, et al.
Procalcitonin to guide initiation and duration of antibiotic treatment in acute respiratory
infections: an individual patient data meta-analysis. Clinical infectious diseases : an
official publication of the Infectious Diseases Society of America. 2012;55(5):651-62.
85. Schuetz P, Suter-Widmer I, Chaudri A, Christ-Crain M, Zimmerli W, Mueller B, et
al. Prognostic value of procalcitonin in community-acquired pneumonia. The European
respiratory journal. 2011;37(2):384-92.
86. Hedlund J, Hansson LO. Procalcitonin and C-reactive protein levels in community-
acquired pneumonia: correlation with etiology and prognosis. Infection. 2000;28(2):68-
73.
87. Huang DT, Weissfeld LA, Kellum JA, Yealy DM, Kong L, Martino M, et al. Risk
prediction with procalcitonin and clinical rules in community-acquired pneumonia.
Annals of emergency medicine. 2008;52(1):48-58 e2.
88. Menendez R, Martinez R, Reyes S, Mensa J, Filella X, Marcos MA, et al.
Biomarkers improve mortality prediction by prognostic scales in community-acquired
pneumonia. Thorax. 2009;64(7):587-91.
References
169
89. Kolditz M, Ewig S, Hoffken G. Management-based risk prediction in community-
acquired pneumonia by scores and biomarkers. The European respiratory journal.
2013;41(4):974-84.
90. Huang DT, Angus DC, Kellum JA, Pugh NA, Weissfeld LA, Struck J, et al.
Midregional proadrenomedullin as a prognostic tool in community-acquired
pneumonia. Chest. 2009;136(3):823-31.
91. Christ-Crain M, Morgenthaler NG, Stolz D, Muller C, Bingisser R, Harbarth S, et al.
Pro-adrenomedullin to predict severity and outcome in community-acquired
pneumonia [ISRCTN04176397]. Critical care. 2006;10(3):R96.
92. Albrich WC, Ruegger K, Dusemund F, Schuetz P, Arici B, Litke A, et al.
Biomarker-enhanced triage in respiratory infections: a proof-of-concept feasibility trial.
The European respiratory journal. 2013;42(4):1064-75.
93. Albrich WC, Dusemund F, Ruegger K, Christ-Crain M, Zimmerli W, Bregenzer T,
et al. Enhancement of CURB65 score with proadrenomedullin (CURB65-A) for
outcome prediction in lower respiratory tract infections: derivation of a clinical
algorithm. BMC infectious diseases. 2011;11:112.
94. Braun E, Kheir J, Mashiach T, Naffaa M, Azzam ZS. Is elevated red cell
distribution width a prognostic predictor in adult patients with community acquired
pneumonia? BMC infectious diseases. 2014;14:129.
95. Bello S, Fandos S, Lasierra AB, Minchole E, Panadero C, Simon AL, et al. Red
blood cell distribution width [RDW] and long-term mortality after community-acquired
pneumonia. A comparison with proadrenomedullin. Respiratory medicine.
2015;109(9):1193-206.
96. Guertler C, Wirz B, Christ-Crain M, Zimmerli W, Mueller B, Schuetz P.
Inflammatory responses predict long-term mortality risk in community-acquired
pneumonia. The European respiratory journal. 2011;37(6):1439-46.
97. Mortensen EM. Potential causes of increased long-term mortality after pneumonia.
The European respiratory journal. 2011;37(6):1306-7.
98. Griffin AT, Wiemken TL, Arnold FW. Risk factors for cardiovascular events in
hospitalized patients with community-acquired pneumonia. International journal of
infectious diseases : IJID : official publication of the International Society for Infectious
Diseases. 2013;17(12):e1125-9.
99. Perel P, Edwards P, Wentz R, Roberts I. Systematic review of prognostic models
in traumatic brain injury. BMC Med Inform Decis Mak. 2006;6:38.

LONG‐TERM MORTALITY IN HOSPITALIZED PATIENTS WITH COMMUNITY‐ACQUIRED PNEUMONIA
170
100. Shariat SF, Karakiewicz PI, Margulis V, Kattan MW. Inventory of prostate cancer
predictive tools. Curr Opin Urol. 2008;18:279-96. [PMID: 18382238]
101. Van Dieren S, Beulens JW, Kengne AP, Peelen LM, Rutten GE, Woodward M, et
al. Prediction models for the risk of cardiovascular disease in patients with type 2
diabetes: a systematic review. Heart. 2012;98:360-9. [PMID: 22184101]
102. Bouwmeester W, Zuithoff NPA, Mallett S, Geerlings MI, Vergouwe Y, et al.
Reporting and Methods in Clinical Prediction Research: A Systematic Review. PLoS
Me 2012;9(5): e1001221. doi:10.1371/journal.pmed.1001221
103. Laupacis A, Sekar N, Stiell IG: Clinical prediction rules. A review and suggested
modifications of methodological standards. JAMA. 1997;277:488-494.
104. Moons KGM, Altman DG, Reitsma JB, Ioannidis JPA, Macaskill P, Steyerberg
EW, et al. Annals of Internal medicine research and reporting methods. transparent
reporting of a multivariable prediction model for individual prognosis or diagnosis
(TRIPOD): Explanation and Elaboration. Ann Intern Med. 2015;162:W1-W73.
105. Collins GS, Reitsma JB, Altman,DG, Moons KGM. Transparent Reporting of a
multivariable prediction model for Individual Prognosis Or Diagnosis (TRIPOD): The
TRIPOD Statement. Ann Intern Med. 2015;162:55-63. doi:10.7326/M14-0697
106. Fine MJ, Auble TE, Yealy DM, Hanusa BH, Weissfeld LA, Singer DE, et al. A
prediction rule to identify low-risk patients with community-acquired pneumonia. New
Engl J Med 1997;336:243-250.
107. Lim WS, Baudouin SV, George RC, Hill AT, Jamieson C, Le JeuneI, et al. BTS
guidelines for the management of community acquired pneumonia in adults: update
2009. Thorax 2009;64:1-55.
108. Neill AM, Martin IR, Weir R, Anderson R, Chereshsky A, Epton MJ, et al.
Community-acquired pneumonia aetiologia and usefulness of severity criteria on
admission. Thorax. 1996;51:1010–6.
109. Charles PG, Wolfe R, Whitby M, Fine MJ, Fuller AJ, Stirling R, et al. SMART-
COP: a tool for predicting the need for intensive respiratory or vasopressor support in
community-acquired pneumonia. Clinical infectious diseases : an official publication of
the Infectious Diseases Society of America. 2008;47(3):375-84.
110. Espana PP, Capelastegui A, Gorordo I, Esteban C, Mikel Oribe M, Ortega M, et
al. Development and Validation of a Clinical Prediction Rule for Severe Community-
acquired Pneumonia. Am J Respir Crit Care Med 2006;174:1249-1256.

References
171
111. Vittinghoff E, McCulloch CE: Relaxing the rule of ten events per variable in
logistic and Cox regression. Am J Epidemiol. 2007;165:710-718.
112. Vincent Calcagno (2013). glmulti: Model selection and multimodel inference
made easy. R package version 1.0.7. http://CRAN.R-project.org/package=glmulti.
113. Menéndez R, Torres A, Aspa J, Capelastegui A, Prat C, Rodríguez de Castro F.
Community Acquired Pneumonia. New Guidelines of the Spanish Society of Chest
Diseases and Thoracic Surgery (SEPAR). Arch Bronconeumol. 2010;46:543–558.
114. LevyMM, FinkMP, Marshall JC, etal; International Sepsis Definitions Conference.
International Sepsis Definitions Conference. Intensive Care Med. 2003; 29(4):530-
538.
115. Vincent Calcagno (2013). glmulti: Model selection and multimodel inference
made easy. R package version 1.0.7. http://CRAN.R-project.org/package=glmulti.
116. National Center for Health Statistics. Health United States. 2015 Table
19.http://www.cdc.gov/nchs/fastats/leading-causes-of-death.htm
117. Lee SJ, Lindquist K, Segal MR, Covinsky KE. Development and validation of a
prognostic index for 4-year mortality in older adults. Jama. 2006;295(7):801-8.
118. Lanspa MJ, Peyrani P, Wiemken T, Wilson EL, Ramirez JA, Dean NC.
Characteristics associated with clinician diagnosis of aspiration pneumonia: a
descriptive study of afflicted patients and their outcomes. Journal of hospital medicine.
2015;10(2):90-6.
119. Marik PE. Aspiration pneumonitis and aspiration pneumonia. The New England
journal of medicine. 2001;344(9):665-71.
120. Yang Zhou. inmunosenescence: Mechanisms, clinical impacts, and therapuetic
Strategies. cid. 2013;56(4):618-619.
121. Filippatos G, Rossi J, Lloyd-Jones DM, Stough WG, Ouyang J, Shinn DD, et al.
Prognostic value of blood urea nitrogen in patients hospitalized with worsening heart
failure: insights from the Acute and Chronic Therapeutic Impact of a Vasopressin
Antagonist in Chronic Heart Failure (ACTIV in CHF) study. J Card Fail. 2007; 13:360–
364.
122. Bacigalupo A, Oneto R, Bruno B, Soracco M, Lamparelli T, Gualandi F, et al.
Early predictors of transplant-related mortality (TRM) after allogeneic bone marrow
transplants (BMT): blood urea nitrogen (BUN) and bilirubin. Bone Marrow Transplant.
1999; 24:653–659.

LONG‐TERM MORTALITY IN HOSPITALIZED PATIENTS WITH COMMUNITY‐ACQUIRED PNEUMONIA
172
123. Bailey SH, Bull DA, Harpole DH, Rentz JJ, Neumayer LA, Pappas TN, et al.
Outcomes after esophagectomy: a ten-year prospective cohort. Ann Thorac Surg.
2003; 75:217–222.
124. Faisst M, Wellner UF, Utzolino S, Hopt UT, Keck T. Elevated blood urea nitrogen
is an independent risk factor of prolonged intensive care unit stay due to acute
necrotizing pancreatitis. J Crit Care. 2010 Mar;25(1):105-11.
125. Schrier RW, Berl T, Anderson RJ. Osmotic and nonosmotic control of
vasopressin release. Am J Physiol. 1979; 236:F321–F332
126. Conte G, Dal Canton A, Terribile M, Cianciarusi B, Di Minno G, Pannain M, et al.
Renal handling of urea in subjects with persistent azotemia and normal renal function.
Kidney Int. 1987; 32:721–727.
127. Schrier RW. Blood urea nitrogen and serum creatinine: not married in heart
failure. Circ Heart Fail. 2008;1:2–5.
128. Schrier RW, Wang W. Acute renal failure and sepsis. N Engl J Med. 2004;
351:159–169.
129. Casaer MP, Mesotten D, Schetz MR. Bench-to-bedside review: metabolism and
nutrition. Crit Care. 2008; 12:222.
130. Putot A, Tetu J, Perrin S, Bailly H, Piroth L, Besancenot JF, et al. A New
Prognosis Score to Predict Mortality After Acute Pneumonia in Very Elderly Patients.
Journal of the American Medical Directors Association. 2016.
131. Corrales-Medina VF, Alvarez KN, Weissfeld LA, Angus DC, Chirinos JA, Chang
CC, et al. Association between hospitalization for pneumonia and subsequent risk of
cardiovascular disease. Jama. 2015;313(3):264-74.
132. Dong M, Liu T, Li G. Association between acute infections and risk of acute
coronary syndrome: a meta-analysis. International journal of cardiology.
2011;147(3):479-82.
133. Corrales-Medina VF, Alvarez KN, Yende S. Hospitalization for pneumonia and
risk of cardiovascular disease--reply. Jama. 2015;313(17):1753-4.
134. Mortensen EM, Copeland LA, Pugh MJ, Fine MJ, Nakashima B, Restrepo MI, et
al. Diagnosis of pulmonary malignancy after hospitalization for pneumonia. The
American journal of medicine. 2010;123(1):66-71.
135. Torres A, Sibila O, Ferrer M, Polverino E, Menendez R, Mensa J, et al. Effect of
corticosteroids on treatment failure among hospitalized patients with severe
References
173
community-acquired pneumonia and high inflammatory response: a randomized
clinical trial. Jama. 2015;313(7):677-86.
136. Menendez R, Sahuquillo-Arce JM, Reyes S, Martinez R, Polverino E, Cilloniz C,
et al. Cytokine activation patterns and biomarkers are influenced by microorganisms in
community-acquired pneumonia. Chest. 2012;141(6):1537-45.
137. Aliberti S, Giuliani F, Ramirez J, Blasi F, Group DS. How to choose the duration
of antibiotic therapy in patients with pneumonia. Current opinion in infectious diseases.
2015;28(2):177-84.
138. Uranga A, Espana PP, Bilbao A, Quintana JM, Arriaga I, Intxausti M, et al.
Duration of Antibiotic Treatment in Community-Acquired Pneumonia: A Multicenter
Randomized Clinical Trial. JAMA internal medicine. 2016.
139. Menendez R, Martinez R, Reyes S, Mensa J, Polverino E, Filella X, et al. Stability
in community-acquired pneumonia: one step forward with markers? Thorax.
2009;64(11):987-92.
140. Christ-Crain M, Morgenthaler NG, Struck J, Harbarth S, Bergmann A, Muller B.
Mid-regional pro-adrenomedullin as a prognostic marker in sepsis: an observational
study. Critical care. 2005;9(6):R816-24.
141. Espana PP, Capelastegui A, Mar C, Bilbao A, Quintana JM, Diez R, et al.
Performance of pro-adrenomedullin for identifying adverse outcomes in community-
acquired pneumonia. The Journal of infection. 2015;70(5):457-66.

LONG‐TERM MORTALITY IN HOSPITALIZED PATIENTS WITH COMMUNITY‐ACQUIRED PNEUMONIA
174

175
10. APPENDIX


Appendix
177
10.1 PSI score.

LONG‐TERM MORTALITY IN HOSPITALIZED PATIENTS WITH COMMUNITY‐ACQUIRED PNEUMONIA
178

Appendix
179
10.2 CURB65 score.

LONG‐TERM MORTALITY IN HOSPITALIZED PATIENTS WITH COMMUNITY‐ACQUIRED PNEUMONIA
180
10.3 SCAP score.
