long term homelessness among individuals and families in ... · long term homelessness among...
TRANSCRIPT

Long term homelessness among individuals and families in Minnesota in 2006 September 2007
Prepared by:
Wilder Research 1295 Bandana Boulevard North, Suite 210 Saint Paul, Minnesota 55108 651-647-4600 www.wilder.org

Long-term homelessness Wilder Research, September 2007
Contents Definition ........................................................................................................................ 1
Background ..................................................................................................................... 1
Overview of tables .......................................................................................................... 2
Section 1: Numbers of long-term homeless people in Minnesota, 2006 ........................ 3
Section 2: Characteristics of long-term homeless people, by household type and housing setting ................................................................................................................ 4
Section 3: Characteristics of long-term homeless people, statewide and by metro and greater Minnesota areas ................................................................................................ 20
Section 4: Transitional housing residents who may not be receiving the services they need ....................................................................................................................... 29
Comparison to 2003 ...................................................................................................... 32

Long-term homelessness Wilder Research, September 2007
Figures 1a. People in emergency settings, including unsheltered ................................................. 3
1b. People in transitional housing ..................................................................................... 3
1c. Total ............................................................................................................................ 3
2a. Adults in emergency settings, including unsheltered ................................................. 4
2b. Unaccompanied youth in emergency settings, including unsheltered ........................ 6
2c. Parents in emergency settings, including unsheltered ................................................ 8
2d. Adults in transitional housing ................................................................................... 10
2e. Unaccompanied youth in transitional housing .......................................................... 12
2f. Parents in transitional housing .................................................................................. 14
2g. Summary for all household types and all housing settings ....................................... 16
2h. Long-term homeless compared to those not chronically homeless .......................... 18
3a. Statewide ................................................................................................................... 20
3b. 7-county Twin Cities metropolitan area ................................................................... 23
3c. Greater Minnesota ..................................................................................................... 26
4a. Adults ........................................................................................................................ 29
4b. Unaccompanied youth .............................................................................................. 30
4c. Parents ....................................................................................................................... 31
5. Adults who were homeless for a year or longer, by year and shelter type ............... 33

Long-term homelessness Wilder Research, September 2007 1
Definition
This report summarizes information from Wilder Research’s 2006 homeless survey about families and individuals who could be considered “long-term homeless.” These people were identified from survey data based on a combination of their current and prior experiences of homelessness. Those identified as “long-term homeless” were living in emergency shelters, transitional housing programs, outdoors, or in other emergency arrangements, and were:
Homeless for at least one year during the current episode, or
Homeless for less than one year in the current episode, but homeless at least four times in the previous three years.
Background
This report represents a special analysis of the 2006 Wilder Homeless Study. The study uses a survey weighting technique that describes the characteristics of virtually all shelter program residents based on interviews with approximately 60 percent of all homeless adults and unaccompanied youth in shelters and transitional housing programs. Because different weights are used based on the characteristics of all people at a given site, the following variations may occur:
1. Similar categories with small numbers of cases may round differently or have differing percentages based on the weights of cases.
2. Category totals may not exactly equal the sum of cases in each cell because of rounding error (for example, “1.3 + 1.4 = 2.7” would round to “1 + 1 = 3”).
Finally, readers will note that all figures in this report are point in time counts and not annual estimates. Wilder has adopted a conservative and simple approach to developing annual estimates. The point in time counts are multiplied by two based on the assumption that there are approximately twice as many long-term homeless individuals over the course of a year as are found during a single night count.

Long-term homelessness Wilder Research, September 2007 2
Overview of tables
Section 1 shows a summary of the numbers of long-term homeless people in 2006.
Section 2 presents information about characteristics of homeless people separately for the two homeless patterns described above as well as for both combined. The tables in this section show information separately for two different housing settings: emergency settings (emergency shelters and non-shelter arrangements) and transitional housing; and for three different household types:
Adults (men and women age 18 or older with no children with them)
Unaccompanied youth (male and female youth age 17 or younger with no children with them)
Parents (adults and unaccompanied youth who have at least one child of their own with them)
The last table in Section 2 summarizes these figures for people in all housing settings and household types combined.
Section 3 presents characteristics of long-term homeless adults and parents, separately for emergency settings (including unsheltered) and transitional housing, including separate tables for:
The 7-county Twin Cities metropolitan area
The 80 counties of greater Minnesota
Section 4 presents what is known from the survey about three major problems that many homeless people face (serious mental illness, substance abuse disorders, and chronic health conditions and what is known about the care they are currently receiving for these conditions. The tables in this section show how many transitional housing residents have each of these three conditions, and how many are not receiving care for them and thus may be in need of further assistance.

Long-term homelessness Wilder Research, September 2007 3
Section 1: Numbers of long-term homeless people in Minnesota, 2006
1a. People in emergency settings, including unsheltered
Homeless at
least one year
Homeless less than one year, but at least 4 times in last 3 years Total
Adults without children 1,152 234 1,386 Unaccompanied youth (without children) 24 26 50 Parents with children 98 41 139 Total adults and unaccompanied youth 1,274 301 1,575 Total children with parents 183 75 258 Total individuals 1,457 376 1,833
1b. People in transitional housing
Homeless at
least one year
Homeless less than one year, but at least 4
times in last 3 years Total Adults without children 532 46 578 Unaccompanied youth (without children) 2 1 3 Parents with children 454 37 491 Total adults and unaccompanied youth 988 84 1,072 Total children with parents 1,033 94 1,127 Total individuals 2,021 178 2,199
1c. Total
Homeless at
least one year
Homeless less than one year, but at least 4 times in last 3 years Total
Total adults and unaccompanied youth 2,262 385 2,647 Total children with parents 1,216 168 1,384 Total individuals 3,478 553 4,031
Long-term homelessness Wilder Research, September 2007 4
Section 2: Characteristics of long-term homeless people, by household type and housing setting
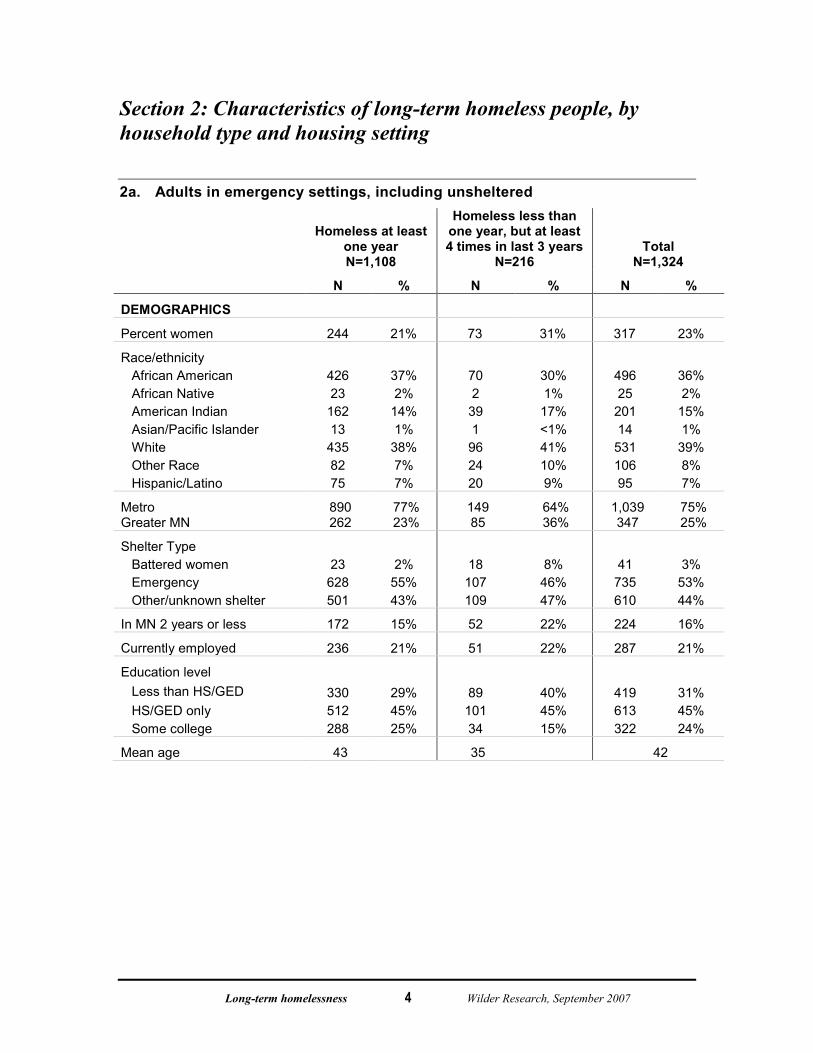
2a. Adults in emergency settings, including unsheltered
Homeless at least one year N=1,108
Homeless less than one year, but at least 4 times in last 3 years
N=216 Total
N=1,324
N % N % N %
DEMOGRAPHICS
Percent women 244 21% 73 31% 317 23%
Race/ethnicity African American African Native American Indian Asian/Pacific Islander White Other Race Hispanic/Latino
426 23 162 13 435 82 75
37% 2%
14% 1%
38% 7% 7%
70 2 39 1 96 24 20
30% 1% 17% <1% 41% 10% 9%
496 25 201 14 531 106 95
36% 2%
15% 1%
39% 8% 7%
Metro Greater MN
890 262
77% 23%
149 85
64% 36%
1,039 347
75% 25%
Shelter Type Battered women Emergency Other/unknown shelter
23 628 501
2%
55% 43%
18 107 109
8% 46% 47%
41 735 610
3%
53% 44%
In MN 2 years or less 172 15% 52 22% 224 16%
Currently employed 236 21% 51 22% 287 21%
Education level Less than HS/GED HS/GED only Some college
330 512 288
29% 45% 25%
89 101 34
40% 45% 15%
419 613 322
31% 45% 24%
Mean age 43 35 42

Long-term homelessness Wilder Research, September 2007 5
2a. Adults in emergency settings, including unsheltered (continued)
Homeless at least one year N=1,152
Homeless less than one year, but at least 4 times in last 3 years
N=234 Total
N=1,386
N % N % N %
CHARACTERISTICS Serious mental illness 607 53% 140 60% 747 54% Substance abuse disorder 393 34% 86 37% 479 35% Chronic health condition * 611 53% 129 55% 740 53%
# with none of above 3 303 26% 52 22% 355 26% Recent criminal history 442 38% 93 40% 535 39%
# with none of above 4 218 19% 36 15% 254 18% Dual diagnosis (MI & CD) 281 24% 65 28% 346 25% Work limitation (kind or amount) 544 48% 113 50% 657 49% Limitations in daily activities 192 17% 37 16% 229 17% Often confused 456 40% 106 46% 562 41% Possible brain injury 444 39% 97 41% 541 39% Women fleeing domestic violence 89 36% 29 40% 118 37%
SERVICE USE/NEED Detox in last 2 years 264 23% 45 20% 309 23% ER in last 6 months 477 42% 103 45% 580 42%
Total # uses, 6 months 1,316 visits
2.8 mean
276 visits
2.7 mean
1,593 visits
2.8 mean
Housing size needed 0 bedrooms 844 77% 158 70% 1,002 76% 1 bedroom 186 17% 38 17% 224 17% 2 bedrooms 57 5% 23 10% 80 6% 3 bedrooms 12 1% 5 2% 17 1% 4 bedrooms 2 <1% 1 <1% 3 <1% 5 bedrooms 0 - 0 - 0 -
MA or other public medical benefit in past year 670 59% 140 61% 810 59% SSI in past year 131 12% 49 21% 180 13% MFIP in past year 32 3% 18 8% 50 4% Currently employed 236 21% 51 22% 287 21% Veteran 214 19% 13 6% 227 17% Average # of housing barriers 1,152 4.7 234 4.0 1,386 4.6
* “Chronic health conditions” include asthma, other chronic lung or respiratory problems, high blood pressure, chronic heart or circulatory problems, diabetes, TB, hepatitis, or HIV/AIDS.

Long-term homelessness Wilder Research, September 2007 6
2b. Unaccompanied youth in emergency settings, including unsheltered
Homeless at least one year
N=2
Homeless less than one year, but at least 4 times in last 3 years
N=26 Total N=50
N % N % N %
DEMOGRAPHICS
Percent women 12 50% 18 69% 30 60%
Race/ethnicity African American African Native American Indian Asian/Pacific Islander White Other Race Hispanic/Latino
8 2 3 0 6 5 1
33% 8%
13% -
25% 21% 4%
8 2 6 0 7 2 2
32% 8% 24%
- 28% 8% 8%
16 4 9 0
13 7 3
33% 8%
18% -
27% 14% 6%
Metro Greater MN
16 8
67% 33%
12 14
46% 54%
28 22
56% 44%
Shelter Type Battered women Emergency Street/unsheltered
0 8
16
-
33% 67%
0 17 9
-
65% 35%
0
25 25
-
50% 50%
In MN 2 years or less 5 21% 3 12% 8 16%
Currently employed 2 9% 3 12% 5 10%
Education level Less than HS/GED HS/GED only Some college
24 0 0
100%
- -
26 0 0
100%
- -
50 0 0
100%
- -
Mean age 16.6 15.5 16.1

Long-term homelessness Wilder Research, September 2007 7
2b. Unaccompanied youth in emergency settings, including unsheltered (continued)
Homeless at least
one year N=24
Homeless less than one year, but at least 4 times in last 3 years
N=26 Total N=50
N % N % N %
CHARACTERISTICS Serious mental illness 14 58% 17 65% 31 62% Substance abuse disorder 5 21% 4 15% 9 18% Chronic health condition * 12 50% 17 65% 29 58%
# with none of above 3 9 29% 4 15% 11 22% Recent criminal history 5 21% 11 42% 16 32%
# with none of above 4 7 29% 1 4% 8 16% Dual diagnosis (MI & CD) 3 13% 3 12% 6 12% Work limitation (kind or amount) 4 17% 3 12% 7 15% Limitations in daily activities 1 4% 1 4% 2 4% Often confused 6 26% 7 27% 13 27% Possible brain injury 9 38% 3 12% 12 24% Women fleeing domestic violence 5 42% 5 28% 10 33%
SERVICE USE/NEED Detox in last 2 years 2 9% 0 - 2 4% ER in last 6 months 12 52% 10 38% 22 45% Total # uses, 6 months 81
visits 6.8
mean 15
visits 1.5
mean 96
visits 4.4
mean Housing size needed
0 bedrooms 14 74% 10 50% 24 62% 1 bedroom 3 16% 4 20% 7 18% 2 bedrooms 2 11% 4 20% 6 15% 3 bedrooms 0 - 1 5% 1 3% 4 bedrooms 0 - 0 - 0 - 5 bedrooms 0 - 1 5% 1 3%
MA or other public medical benefit in past year 12 52% 11 48% 23 50% SSI in past year 0 - 1 4% 1 2% MFIP in past year 1 4% 1 4% 2 4% Currently employed 2 9% 3 12% 5 10% Veteran 0 - 0 - 0 - Average # of housing barriers 24 4.4 26 3.3 50 3.8 * “Chronic health conditions” include asthma, other chronic lung or respiratory problems, high blood pressure, chronic
heart or circulatory problems, diabetes, TB, hepatitis, or HIV/AIDS.
Long-term homelessness Wilder Research, September 2007 8
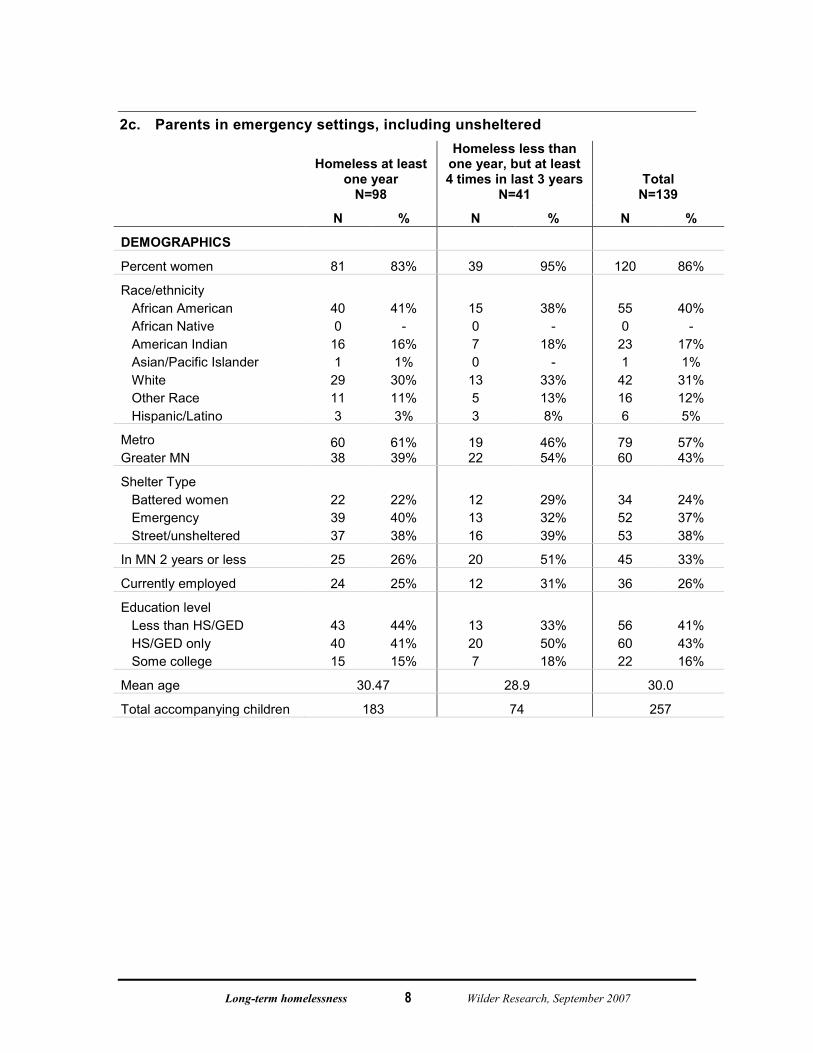
2c. Parents in emergency settings, including unsheltered
Homeless at least one year
N=98
Homeless less than one year, but at least 4 times in last 3 years
N=41 Total
N=139
N % N % N %
DEMOGRAPHICS
Percent women 81 83% 39 95% 120 86%
Race/ethnicity African American African Native American Indian Asian/Pacific Islander White Other Race Hispanic/Latino
40 0
16 1
29 11 3
41%
- 16% 1%
30% 11% 3%
15 0 7 0 13 5 3
38%
- 18%
- 33% 13% 8%
55 0
23 1
42 16 6
40%
- 17% 1%
31% 12% 5%
Metro Greater MN
60 38
61% 39%
19 22
46% 54%
79 60
57% 43%
Shelter Type Battered women Emergency Street/unsheltered
22 39 37
22% 40% 38%
12 13 16
29% 32% 39%
34 52 53
24% 37% 38%
In MN 2 years or less 25 26% 20 51% 45 33%
Currently employed 24 25% 12 31% 36 26%
Education level Less than HS/GED HS/GED only Some college
43 40 15
44% 41% 15%
13 20 7
33% 50% 18%
56 60 22
41% 43% 16%
Mean age 30.47 28.9 30.0
Total accompanying children 183 74 257
Long-term homelessness Wilder Research, September 2007 9
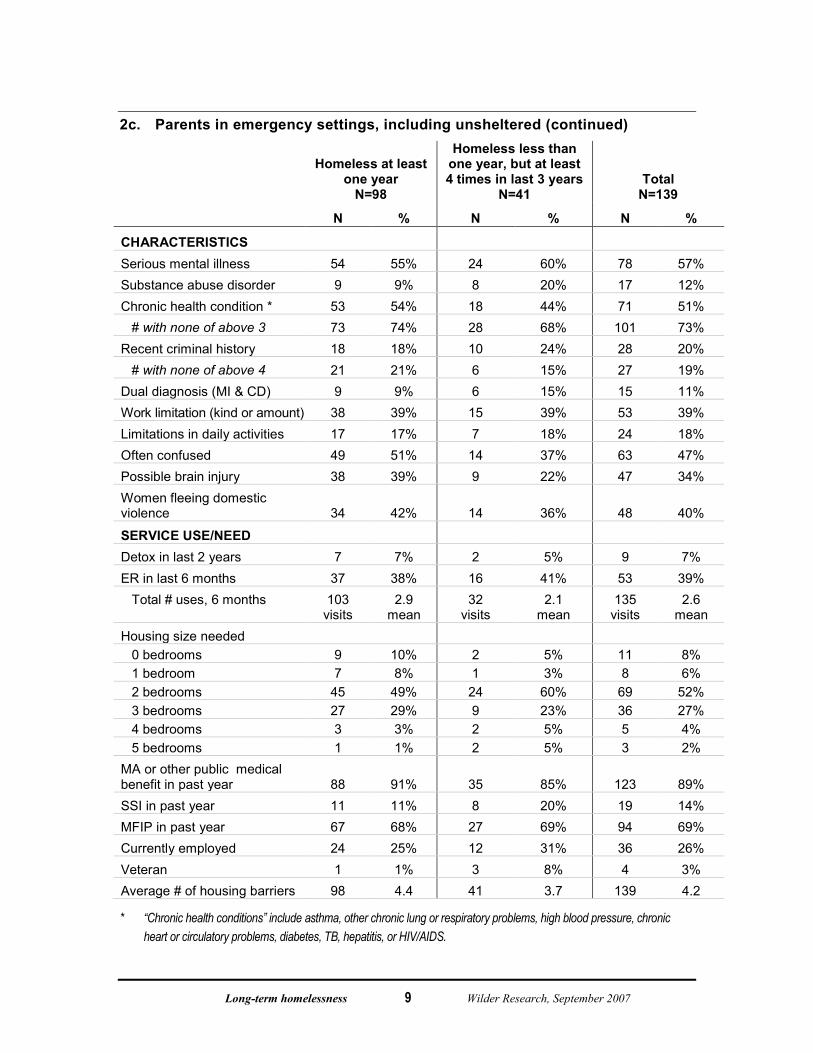
2c. Parents in emergency settings, including unsheltered (continued)
Homeless at least one year
N=98
Homeless less than one year, but at least 4 times in last 3 years
N=41 Total
N=139
N % N % N %
CHARACTERISTICS Serious mental illness 54 55% 24 60% 78 57% Substance abuse disorder 9 9% 8 20% 17 12% Chronic health condition * 53 54% 18 44% 71 51%
# with none of above 3 73 74% 28 68% 101 73% Recent criminal history 18 18% 10 24% 28 20%
# with none of above 4 21 21% 6 15% 27 19% Dual diagnosis (MI & CD) 9 9% 6 15% 15 11% Work limitation (kind or amount) 38 39% 15 39% 53 39% Limitations in daily activities 17 17% 7 18% 24 18% Often confused 49 51% 14 37% 63 47% Possible brain injury 38 39% 9 22% 47 34% Women fleeing domestic violence 34 42% 14 36% 48 40%
SERVICE USE/NEED Detox in last 2 years 7 7% 2 5% 9 7% ER in last 6 months 37 38% 16 41% 53 39%
Total # uses, 6 months 103 visits
2.9 mean
32 visits
2.1 mean
135 visits
2.6 mean
Housing size needed 0 bedrooms 9 10% 2 5% 11 8% 1 bedroom 7 8% 1 3% 8 6% 2 bedrooms 45 49% 24 60% 69 52% 3 bedrooms 27 29% 9 23% 36 27% 4 bedrooms 3 3% 2 5% 5 4% 5 bedrooms 1 1% 2 5% 3 2%
MA or other public medical benefit in past year 88 91% 35 85% 123 89% SSI in past year 11 11% 8 20% 19 14% MFIP in past year 67 68% 27 69% 94 69% Currently employed 24 25% 12 31% 36 26% Veteran 1 1% 3 8% 4 3% Average # of housing barriers 98 4.4 41 3.7 139 4.2
* “Chronic health conditions” include asthma, other chronic lung or respiratory problems, high blood pressure, chronic heart or circulatory problems, diabetes, TB, hepatitis, or HIV/AIDS.

Long-term homelessness Wilder Research, September 2007 10
2d. Adults in transitional housing
Homeless at least one year
N=532
Homeless less than one year, but at least 4 times in last 3 years
N=46 Total
N=578
N % N % N %
DEMOGRAPHICS
Percent women 211 40% 16 35% 227 39%
Race/ethnicity African American African Native American Indian Asian/Pacific Islander White Other Race Hispanic/Latino
156 14 36 8
285 31 27
29% 3% 7% 2%
54% 6% 5%
16 0 8 0 13 3 4
40%
- 20%
- 33% 8% 10%
172 14 44 8
298 34 31
30% 2% 8% 1%
52% 6% 6%
Metro Greater MN
431 101
81% 19%
26 20
57% 43%
457 121
79% 21%
In MN 2 years or less 97 18% 8 17% 105 18%
Currently employed 185 35% 13 28% 198 35%
Education level Less than HS/GED HS/GED only Some college
90 273 162
17% 52% 31%
6 28 12
13% 61% 26%
96 301 174
17% 53% 30%
Mean age 40.7 32.2 40.0

Long-term homelessness Wilder Research, September 2007 11
2d. Adults in transitional housing (continued)
Homeless at least one year
N=532
Homeless less than one year, but at least 4 times in last 3 years
N=46 Total
N=578
N % N % N %
CHARACTERISTICS Serious mental illness 392 74% 31 67% 423 73% Substance abuse disorder 280 53% 25 54% 305 53% Chronic health condition * 301 57% 26 57% 327 57%
# with none of above 3 55 10% 6 13% 61 11% Recent criminal history 178 33% 10 22% 188 33%
# with none of above 4 44 8% 6 13% 50 9% Dual diagnosis (MI & CD) 203 38% 17 37% 220 38% Work limitation (kind or amount) 306 59% 24 52% 330 59% Limitations in daily activities 104 20% 14 30% 118 21% Often confused 192 37% 9 20% 201 35% Possible brain injury 170 32% 18 39% 188 33% Women fleeing domestic violence 38 18% 4 27% 42 19%
SERVICE USE/NEED Detox in last 2 years 80 15% 7 16% 87 15% ER in last 6 months 191 37% 24 52% 215 38%
Total # uses, 6 months 415 visits
2.2 mean
100 visits
4.2 mean
515 visits
2.4 mean
Housing size needed 0 bedrooms 312 61% 29 64% 341 61% 1 bedroom 142 28% 8 18% 150 27% 2 bedrooms 51 10% 3 7% 54 10% 3 bedrooms 8 2% 5 11% 13 2% 4 bedrooms 0 - 0 - 0 - 5 bedrooms 0 - 0 - 0 -
MA or other public medical benefit in past year 408 78% 39 85% 447 78% SSI in past year 63 12% 5 11% 68 12% MFIP in past year 24 5% 3 7% 27 5% Currently employed 185 35% 13 28% 198 35% Veteran 115 22% 3 7% 118 21% Average # of housing barriers 532 4.9 46 3.8 578 4.8%
* “Chronic health conditions” include asthma, other chronic lung or respiratory problems, high blood pressure, chronic heart or circulatory problems, diabetes, TB, hepatitis, or HIV/AIDS.

Long-term homelessness Wilder Research, September 2007 12
2e. Unaccompanied youth in transitional housing
Homeless at least one year
N=2
Homeless less than one year, but at least 4 times in last 3 years
N=1 Total N=3
N % N % N %
DEMOGRAPHICS
Percent women 2 67%
Race/ethnicity African American African Native American Indian Asian/Pacific Islander White Other Race Hispanic/Latino
0 0 1 0 0 2 2
- -
33% - -
67% 67%
Metro Greater MN
1 2
33% 67%
In MN 2 years or less 0 -
Currently employed 1 33%
Education level Less than HS/GED HS/GED only Some college
3 0 0
100%
- -
Mean age 16
Note. Because of small numbers, figures are not shown separately by homeless pattern.

Long-term homelessness Wilder Research, September 2007 13
2e. Unaccompanied youth in transitional housing (continued)
Homeless at least one year
N=2
Homeless less than one year, but at least 4 times in last 3 years
N=1 Total N=3
N % N % N %
CHARACTERISTICS Serious mental illness 2 67% Substance abuse disorder 1 33% Chronic health condition * 0 -
# with none of above 3 1 33% Recent criminal history 2 67%
# with none of above 4 1 33% Dual diagnosis (MI & CD) 0 - Work limitation (kind or amount) 0 - Limitations in daily activities 0 - Often confused 0 - Possible brain injury 0 - Women fleeing domestic violence 0 -
SERVICE USE/NEED Detox in last 2 years 0 - ER in last 6 months 1 33%
Total # uses, 6 months 1 visit 1 mean Housing size needed
0 bedrooms 0 - 1 bedroom 2 100% 2 bedrooms 0 - 3 bedrooms 0 - 4 bedrooms 0 - 5 bedrooms 0 -
MA or other public medical benefit in past year 1 50% SSI in past year 1 50% MFIP in past year 0 - Currently employed 1 33% Veteran 0 - Average # of housing barriers 3 3.7%
* “Chronic health conditions” include asthma, other chronic lung or respiratory problems, high blood pressure, chronic heart or circulatory problems, diabetes, TB, hepatitis, or HIV/AIDS.
Note: Because of small numbers, figures are not shown separately by homeless pattern.

Long-term homelessness Wilder Research, September 2007 14
2f. Parents in transitional housing
Homeless at least one year
N=454
Homeless less than one year, but at least 4 times in last 3 years
N=37 Total
N=491
N % N % N %
DEMOGRAPHICS
Percent women 406 89% 34 94% 440 90%
Race/ethnicity African American African Native American Indian Asian/Pacific Islander White Other Race Hispanic/Latino
187 11 48 7
151 39 34
42% 2%
11% 2%
34% 9% 8%
15 0 6 0 14 2 0
41%
- 16%
- 38% 5%
-
202 11 54 7
165 41 34
42% 2%
11% 1%
34% 9% 7%
Metro Greater MN
334 120
74% 26%
23 14
62% 38%
357 134
73% 27%
In MN 2 years or less 101 22% 11 31% 112 23%
Currently employed 186 41% 17 46% 203 41%
Education level Less than HS/GED HS/GED only Some college
134 187 129
30% 42% 29%
19 12 6
51% 32% 16%
153 199 135
31% 41% 28%
Mean age 31.1 27.5 30.8
Total accompanying children 1,033 94 1,127

Long-term homelessness Wilder Research, September 2007 15
2f. Parents in transitional housing (continued)
Homeless at least one year
N=454
Homeless less than one year, but at least 4 times in last 3 years
N=37 Total
N=491
N % N % N %
CHARACTERISTICS Serious mental illness 226 50% 13 36% 239 49% Substance abuse disorder 50 11% 4 11% 54 11% Chronic health condition * 175 39% 9 24% 184 37%
# with none of above 3 133 29% 15 42% 148 30% Recent criminal history 49 11% 1 3% 50 10%
# with none of above 4 127 28% 15 42% 142 29% Dual diagnosis (MI & CD) 36 8% 2 5% 38 8% Work limitation (kind or amount) 152 35% 13 36% 165 35% Limitations in daily activities 65 14% 1 3% 66 13% Often confused 158 35% 8 22% 166 34% Possible brain injury 328 72% 29 78% 357 73% Women fleeing domestic violence 110 27% 10 29% 120 27%
SERVICE USE/NEED Detox in last 2 years 13 3% 2 5% 15 3% ER in last 6 months 167 37% 17 46% 184 38%
Total # uses, 6 months 359 visits
2.2 mean
34 visits
2.1 mean
393 visits
2.2 mean
Housing size needed 0 bedrooms 9 2% 0 - 9 2% 1 bedroom 18 4% 2 6% 20 4% 2 bedrooms 213 48% 13 39% 226 47% 3 bedrooms 142 32% 13 39% 155 32% 4 bedrooms 45 10% 3 9% 48 10% 5 bedrooms 21 5% 2 6% 23 5%
MA or other public medical benefit in past year 415 92% 35 97% 450 93% SSI in past year 57 13% 2 6% 59 12% MFIP in past year 335 75% 32 86% 367 76% Currently employed 186 41% 17 46% 203 41% Veteran 12 3% 0 - 12 2% Average # of housing barriers 454 4.3 37 2.8 491 4.2
* “Chronic health conditions” include asthma, other chronic lung or respiratory problems, high blood pressure, chronic heart or circulatory problems, diabetes, TB, hepatitis, or HIV/AIDS.

Long-term homelessness Wilder Research, September 2007 16
2g. Summary for all household types and all housing settings
Homeless at least one year N=2,262
Homeless less than one year, but at least 4 times in last 3 years
N=385 Total
N=2,647
N % N % N %
DEMOGRAPHICS
Percent women 956 42% 179 47% 1,135 43%
Race/ethnicity African American African Native American Indian Asian/Pacific Islander White Other Race Hispanic/Latino
818 50 264 29 907 170 141
37% 2%
12% 1%
41% 8% 6%
125 4 66 1
143 37 29
33% 1% 18% <1% 38% 10% 8%
943 54 330 30
1,050 207 170
36% 2%
13% 1%
40% 8% 7%
Metro Greater MN
1,731 530
77% 23%
228 156
59% 41%
1,959 686
74% 26%
Shelter Type Battered women Emergency Transitional Housing Street/unsheltered
44 676 988 554
2%
30% 44% 24%
30 137 84 134
8% 36% 22% 35%
74 813
1,072 688
3%
31% 40% 26%
In MN 2 years or less 400 18% 94 25% 494 19%
Currently employed 633 28% 96 25% 729 28%
Education level Less than HS/GED HS/GED only Some college
624
1,011 595
28% 45% 27%
154 161 60
41% 43% 16%
778
1,172 655
30% 45% 25%
Mean age 39.2 32.1 38.2
Total accompanying children 1,216 168 1,384

Long-term homelessness Wilder Research, September 2007 17
2g. Summary for all household types and all housing settings (continued)
Homeless at least one year N=2,262
Homeless less than one year, but at least 4 times in last 3 years
N=385 Total
N=2,647
N % N % N %
CHARACTERISTICS Serious mental illness 1,294 57% 227 59% 1,521 57% Substance abuse disorder 737 33% 128 33% 865 33% Chronic health condition * 1,082 48% 167 43% 1,249 47%
# with none of above 3 524 23% 91 24% 615 23% Recent criminal history 693 31% 127 33% 820 31%
# with none of above 4 417 18% 65 17% 482 18% Dual diagnosis (MI & CD) 531 23% 92 24% 623 24% Work limitation (kind or amount) 1,044 47% 168 45% 1,212 47% Limitations in daily activities 379 17% 60 16% 439 17% Often confused 861 39% 144 38% 1,005 39% Possible brain injury 787 35% 135 35% 922 35% Women fleeing domestic violence 275 29% 62 34% 337 30%
SERVICE USE/NEED Detox in last 2 years 366 16% 57 15% 423 16% ER in last 6 months 883 40% 170 45% 1,053 40%
Total # uses, 6 months 2,275 visits
2.6 mean
459 visits
2.7 mean
2,733 visits
2.7 mean
Housing size needed 0 bedrooms 1,189 55% 199 54% 1,388 55% 1 bedroom 357 16% 55 15% 412 16% 2 bedrooms 368 17% 66 18% 434 17% 3 bedrooms 190 9% 34 9% 224 9% 4 bedrooms 51 2% 7 2% 58 2% 5 bedrooms 22 1% 5 1% 27 1%
MA or other public medical benefit in past year 1,593 71% 261 69% 1,854 71% SSI in past year 261 12% 67 18% 328 13% MFIP in past year 459 21% 81 21% 540 21% Currently employed 633 28% 96 25% 729 28% Veteran 342 15% 19 5% 361 14% Average # of housing barriers 2,261 4.6 384 3.8 2,646 4.5
* “Chronic health conditions” include asthma, other chronic lung or respiratory problems, high blood pressure, chronic heart or circulatory problems, diabetes, TB, hepatitis, or HIV/AIDS.

Long-term homelessness Wilder Research, September 2007 18
2h. Long-term homeless compared to those not chronically homeless Long-term
homeless N=2,646
All others N=2,286
Total N=4,932
N % N % N %
DEMOGRAPHICS
Percent women 1,136 43% 1,220 53% 2,356 48%
Race/ethnicity African American African Native American Indian Asian/Pacific Islander White Other Race Hispanic/Latino
942 54 331 31
1,051 207 170
36% 2%
13% 1%
40% 8% 7%
796 28 220 73 940 201 171
35% 1% 10% 3% 42% 9% 8%
1,738
82 551 104
1,991 408 341
36% 2%
11% 2%
41% 8% 7%
Metro Greater MN
1,959 686
74% 26%
1,471 815
64% 36%
3,430 1,501
70% 30%
Shelter Type Battered women Emergency Transitional Housing Street/unsheltered
74 812
1,071 688
3%
31% 40% 26%
192 758 829 508
8% 33% 36% 22%
266
1,570 1,900 1,196
5%
32% 39% 24%
In MN 2 years or less 494 19% 637 28% 1,131 23%
Currently employed 730 28% 631 28% 1,361 28%
Education level Less than HS/GED HS/GED only Some college
779
1,172 655
30% 45% 25%
604
1,010 612
27% 45% 27%
1,383 2,182 1,267
29% 45% 26%
Mean age 38.2 35.4 36.9
Total accompanying children 1,385 1,759 3,144

Long-term homelessness Wilder Research, September 2007 19
2h. Long-term homeless compared to those not chronically homeless (continued)
Long-term homeless N=2,646
All others N=2,286
Total N=4,932
N % N % N %
CHARACTERISTICS Serious mental illness 1,521 57% 1,026 45% 2,547 52 Substance abuse disorder 865 33% 468 20% 1,333 27% Chronic health condition * 1,397 53% 1,388 61% 2,785 56%
# with none of above 3 615 23% 774 34% 1,389 28% Recent criminal history 820 31% 504 22% 1,324 27%
# with none of above 4 482 18% 657 29% 1,139 23% Dual diagnosis (MI & CD) 623 24% 291 13% 914 19% Work limitation (kind or amount) 1,212 47% 774 35% 1,986 41% Limitations in daily activities 439 17% 268 12% 707 15% Often confused 1,005 39% 592 26% 1,597 33% Possible brain injury 922 35% 549 24% 1,471 30% Women fleeing domestic violence 337 30% 405 33% 742 32%
SERVICE USE/NEED Detox in last 2 years 423 16% 218 10% 641 13% ER in last 6 months 1,054 40% 824 37% 1,878 39%
Total # uses, 6 months 2,733 visits
2.7 mean
2,022 visits
2.5 mean
4,756 visits
2.6 mean
Housing size needed 0 bedrooms 1,388 55% 953 43% 2,341 49% 1 bedroom 412 16% 341 15% 753 16% 2 bedrooms 434 17% 508 23% 942 20% 3 bedrooms 223 9% 317 14% 540 11% 4 bedrooms 57 2% 74 3% 131 3% 5 bedrooms 27 1% 10 <1% 37 1%
MA or other public medical benefit in past year 1,854 71% 1,552 69% 3,406 70% SSI in past year 328 13% 295 13% 623 13% MFIP in past year 540 21% 588 26% 1,128 23% Currently employed 730 28% 631 28% 1,361 28% Veteran 361 14% 264 12% 625 13% Average # of housing barriers 2,646 4.5 2,286 3.0 4,932 3.8
* “Chronic health conditions” include asthma, other chronic lung or respiratory problems, high blood pressure, chronic heart or circulatory problems, diabetes, TB, hepatitis, or HIV/AIDS.

Long-term homelessness Wilder Research, September 2007 20
Section 3: Characteristics of long-term homeless people, statewide and by metro and greater Minnesota areas
3a. Statewide Emergency
settings, incl. unsheltered
Transitional housing Total
N % N % N % ADULTS WITHOUT CHILDREN N=1,386 N=578 N=1,964 Percent women 317 23% 227 39% 544 28% Race/ethnicity
African American African Native American Indian Asian/Pacific Islander White Other Race Hispanic/Latino
496 25 200 14 531 106 95
36% 2%
15% 1%
39% 8% 7%
172 14 44 8
299 35 31
30% 2% 8% 1% 52% 6% 6%
668 39 244 22 830 141 126
34% 2%
13% 1%
43% 7% 7%
In MN 2 years or less 224 16% 104 18% 328 17% Currently employed 287 21% 198 35% 485 25% Education level
Less than HS/GED HS/GED only Some college
419 613 322
31% 45% 24%
97 300 174
17% 53% 30%
516 913 496
27% 47% 26%
Mean age 41.7 40.0 41.2
PARENTS WITH CHILDREN N=139 N=491 N=630 Percent women 120 86% 440 90% 560 89% Race/ethnicity
African American African Native American Indian Asian/Pacific Islander White Other Race Hispanic/Latino
56 0
23 1
43 17 6
40%
- 16% 1%
31% 12% 5%
202 11 54 7
165 41 34
42% 2% 11% 1% 34% 9% 7%
258 11 77 8
208 58 40
42% 2%
12% 1%
34% 9% 7%
In MN 2 years or less 45 33% 113 23% 158 25% Currently employed 36 26% 203 41% 239 38% Education level
Less than HS/GED HS/GED only Some college
57 60 22
41% 43% 16%
153 198 136
31% 41% 28%
210 258 158
34% 41% 25%
Mean age 30.0 30.8 30.7 Total accompanying children 257 1,127 1,384

Long-term homelessness Wilder Research, September 2007 21
3a. Statewide (continued) Emergency
settings, incl. unsheltered
Transitional housing Total
N % N % N % ADULTS WITHOUT CHILDREN N=1,386 N=578 N=1,964
CHARACTERISTICS Serious mental illness 747 54% 423 73% 1,170 60% Substance abuse disorder 479 35% 305 53% 784 40% Chronic health condition * 646 47% 327 57% 973 50%
# with none of above 3 355 26% 62 11% 417 21% Recent criminal history 535 39% 189 33% 724 37%
# with none of above 4 254 18% 50 9% 304 15% Dual diagnosis (MI & CD) 346 25% 220 38% 566 29% Possible brain injury 541 39% 188 33% 729 37%
SERVICE USE/NEED Detox in last 2 years 309 23% 87 15% 396 21% ER in last 6 months 581 43% 214 38% 795 41%
Total # uses, 6 months 1,593 visits
2.8 mean
515 visits
2.4 mean
2,108 visits
2.7 mean
Needs just 0 or 1 bedroom 1,225 93% 492 88% 1,717 91% MA or other public medical benefit in past year 810 59% 447 78% 1,257 65% SSI in past year 181 13% 68 12% 249 13% Veteran 227 17% 118 21% 345 18%
* “Chronic health conditions” include asthma, other chronic lung or respiratory problems, high blood pressure, chronic heart or circulatory problems, diabetes, TB, hepatitis, or HIV/AIDS.

Long-term homelessness Wilder Research, September 2007 22
3a. Statewide (continued) Emergency
settings, incl. unsheltered
Transitional housing Total
N % N % N % PARENTS WITH CHILDREN N=139 N=491 N=630
CHARACTERISTICS Serious mental illness 79 57% 239 49% 318 51% Substance abuse disorder 16 12% 54 11% 70 11% Chronic health condition * 69 50% 307 63% 376 60%
# with none of above 3 37 27% 148 30% 185 29% Recent criminal history 28 20% 50 10% 78 12%
# with none of above 4 27 19% 142 29% 169 27% Dual diagnosis (MI & CD) 14 10% 38 8% 52 8% Possible brain injury 47 34% 134 27% 181 29%
SERVICE USE/NEED Detox in last 2 years 9 7% 16 3% 25 4% ER in last 6 months 53 39% 183 38% 236 38%
Total # uses, 6 months 135 visits
2.6 mean
393 visits
2.2 mean
529 visits
2.3 mean
Needs just 0 or 1 bedroom 19 14% 30 6% 49 8% MA or other public medical benefit in past year 122 89% 451 93% 573 92% SSI in past year 18 13% 559 12% 77 12% Veteran 4 3% 12 2% 16 3%
* “Chronic health conditions” include asthma, other chronic lung or respiratory problems, high blood pressure, chronic heart or circulatory problems, diabetes, TB, hepatitis, or HIV/AIDS.

Long-term homelessness Wilder Research, September 2007 23
3b. 7-county Twin Cities metropolitan area Emergency
settings, incl. unsheltered
Transitional housing Total
N % N % N % ADULTS WITHOUT CHILDREN N=1,039 N=457 N=1,496 Percent women 227 22% 187 41% 414 28% Race/ethnicity
African American African Native American Indian Asian/Pacific Islander White Other Race Hispanic/Latino
468 23 120 10 321 85 82
46% 2%
12% 1%
31% 8% 8%
160 11 31 5
218 31 25
35% 2% 7% 1% 48% 7% 6%
628 34 151 15 539 116 107
42% 2%
10% 1%
36% 8% 7%
In MN 2 years or less 174 17% 88 19% 262 18% Currently employed 217 21% 156 35% 373 25% Education level
Less than HS/GED HS/GED only Some college
322 450 246
32% 44% 24%
81 240 130
18% 53% 29%
403 690 376
27% 47% 26%
Mean age 41.9 40.4 41.4
PARENTS WITH CHILDREN N=78 N=357 N=435 Percent women 69 88% 326 91% 395 91% Race/ethnicity
African American African Native American Indian Asian/Pacific Islander White Other Race Hispanic/Latino
48 0 3 1
18 9 2
61% -
4% 1%
23% 11% 3%
190 5 24 7 94 30 22
54% 1% 7% 2% 27% 9% 6%
238 5
27 8
112 39 24
55% 1% 6% 2%
26% 9% 6%
In MN 2 years or less 32 41% 90 25% 122 28% Currently employed 13 17% 129 36% 142 33% Education level
Less than HS/GED HS/GED only Some college
37 25 17
47% 32% 22%
119 144 92
34% 41% 26%
156 169 109
36% 39% 25%
Mean age 30.9 30.7 30.8 Total accompanying children 167 824 991

Long-term homelessness Wilder Research, September 2007 24
3b. 7-county Twin Cities metropolitan area (continued) Emergency
settings, incl. unsheltered
Transitional housing Total
N % N % N % ADULTS WITHOUT CHILDREN N=1,039 N=457 N=1,496
CHARACTERISTICS Serious mental illness 547 53% 328 72% 875 58% Substance abuse disorder 346 33% 236 52% 582 39% Chronic health condition * 493 47% 259 57% 752 50%
# with none of above 3 276 27% 51 11% 327 22% Recent criminal history 395 38% 131 29% 526 35%
# with none of above 4 200 19% 42 9% 242 16% Dual diagnosis (MI & CD) 244 23% 165 36% 409 27% Possible brain injury 404 39% 158 35% 562 38%
SERVICE USE/NEED Detox in last 2 years 216 21% 66 15% 282 19% ER in last 6 months 450 44% 171 38% 621 42%
Total # uses, 6 months 1,282 visits
2.9 mean
381 visits
2.3 mean
1,664 visits
2.7 mean
Needs just 0 or 1 bedroom 925 94% 392 88% 1,317 92% MA or other public medical benefit in past year 616 60% 357 79% 973 66% SSI in past year 129 13% 63 14% 192 13% Veteran 156 15% 85 19% 241 16%
* “Chronic health conditions” include asthma, other chronic lung or respiratory problems, high blood pressure, chronic heart or circulatory problems, diabetes, TB, hepatitis, or HIV/AIDS.

Long-term homelessness Wilder Research, September 2007 25
3b. 7-county Twin Cities metropolitan area (continued) Emergency
settings, incl. unsheltered
Transitional housing Total
N % N % N % PARENTS WITH CHILDREN N=78 N=357 N=435
CHARACTERISTICS Serious mental illness 45 58% 179 50% 224 51% Substance abuse disorder 4 5% 32 9% 36 8% Chronic health condition * 47 59% 140 39% 187 43%
# with none of above 3 13 17% 101 28% 114 26% Recent criminal history 12 15% 39 11% 51 12%
# with none of above 4 68 87% 259 73% 327 75% Dual diagnosis (MI & CD) 3 4% 24 7% 27 6% Possible brain injury 50 64% 262 73% 312 72%
SERVICE USE/NEED Detox in last 2 years 3 4% 12 3% 15 3% ER in last 6 months 26 34% 137 39% 163 38%
Total # uses, 6 months 79 visits
3.1 mean
266 visits
2.0 mean
345 visits
2.2 mean
Needs just 0 or 1 bedroom 12 16% 20 6% 32 7% MA or other public medical benefit in past year 69 90% 325 92% 394 92% SSI in past year 11 14% 50 14% 61 14% Veteran 1 1% 8 2% 9 2%
* “Chronic health conditions” include asthma, other chronic lung or respiratory problems, high blood pressure, chronic heart or circulatory problems, diabetes, TB, hepatitis, or HIV/AIDS.

Long-term homelessness Wilder Research, September 2007 26
3c. Greater Minnesota Emergency
settings, incl. unsheltered
Transitional housing Total
N % N % N % ADULTS WITHOUT CHILDREN N=347 N=121 N=468 Percent women 256 74% 82 68% 338 72% Race/ethnicity
African American African Native American Indian Asian/Pacific Islander White Other Race Hispanic/Latino
28 2
80 4
211 21 13
8% 1%
23% 1%
61% 6% 4%
12 3 13 3 81 4 5
10% 3% 11% 3% 70% 3% 4%
40 5
93 7
292 25 18
9% 1%
20% 2%
63% 5% 4%
In MN 2 years or less 50 15% 16 13% 66 14% Currently employed 69 20% 42 34% 111 24% Education level
Less than HS/GED HS/GED only Some college
97 163 76
29% 49% 23%
16 60 44
13% 50% 37%
113 223 120
25% 49% 26%
Mean age 40.9 38.8 40.4
PARENTS WITH CHILDREN N=61 N=134 N=195 Percent women 51 84% 115 86% 166 85% Race/ethnicity
African American African Native American Indian Asian/Pacific Islander White Other Race Hispanic/Latino
8 0
20 0
25 8 4
13%
- 33%
- 41% 13% 7%
12 5 29 0 71 11 11
9% 4% 23%
- 55% 9% 9%
20 5
49 0
96 19 15
11% 3%
26% -
51% 10% 8%
In MN 2 years or less 12 21% 23 17% 35 18% Currently employed 23 39% 74 55% 97 50% Education level
Less than HS/GED HS/GED only Some college
20 35 6
33% 57% 10%
35 54 44
26% 41% 33%
55 89 50
28% 46% 26%
Mean age 28.9 31.1 30.4 Total accompanying children 90 304 393

Long-term homelessness Wilder Research, September 2007 27
3c. Greater Minnesota (continued) Emergency
settings, incl. unsheltered
Transitional housing Total
N % N % N % ADULTS WITHOUT CHILDREN N=347 N=121 N=468
CHARACTERISTICS Serious mental illness 200 58% 95 79% 295 63% Substance abuse disorder 132 38% 70 57% 202 43% Chronic health condition* 154 44% 68 56% 222 47%
# with none of above 3 80 23% 11 9% 91 19% Recent criminal history 140 40% 57 47% 197 42%
# with none of above 4 54 16% 8 7% 62 13% Dual diagnosis (MI & CD) 102 29% 55 45% 157 34% Possible brain injury 137 40% 30 25% 167 36%
SERVICE USE/NEED Detox in last 2 years 94 28% 21 17% 115 25% ER in last 6 months 130 38% 44 36% 174 38%
Total # uses, 6 months 310 visits
2.5 mean
133 visits
3.1 mean
444 visits
2.6 mean
Needs just 0 or 1 bedroom 301 89% 101 88% 402 89% MA or other public medical benefit in past year 194 56% 90 75% 284 61% SSI in past year 52 15% 5 4% 57 12% Veteran 71 20% 33 27% 104 22%
* “Chronic health conditions” include asthma, other chronic lung or respiratory problems, high blood pressure, chronic heart or circulatory problems, diabetes, TB, hepatitis, or HIV/AIDS.

Long-term homelessness Wilder Research, September 2007 28
3c. Greater Minnesota (continued) Emergency
settings, incl. unsheltered
Transitional housing Total
N % N % N % PARENTS WITH CHILDREN N=61 N=134 N=195
CHARACTERISTICS Serious mental illness 34 56% 60 45% 94 48% Substance abuse disorder 12 20% 22 16% 34 18% Chronic health condition * 37 62% 90 67% 127 65%
# with none of above 3 24 39% 47 35% 71 36% Recent criminal history 16 26% 11 8% 27 14%
# with none of above 4 17 28% 45 33% 62 32% Dual diagnosis (MI & CD) 11 18% 13 10% 24 12% Possible brain injury 19 31% 39 29% 58 30%
SERVICE USE/NEED Detox in last 2 years 6 10% 3 2% 9 5% ER in last 6 months 27 45% 46 35% 73 38%
Total # uses, 6 months 56 visits
2.1 mean
128 visits
2.8 mean
183 visits
2.6 mean
Needs just 0 or 1 bedroom 7 12% 9 7% 16 9% MA or other public medical benefit in past year 54 89% 126 94% 180 92% SSI in past year 7 11% 9 7% 16 8% Veteran 3 5% 4 3% 7 4%
* “Chronic health conditions” include asthma, other chronic lung or respiratory problems, high blood pressure, chronic heart or circulatory problems, diabetes, TB, hepatitis, or HIV/AIDS.

Long-term homelessness Wilder Research, September 2007 29
Section 4: Transitional housing residents who may not be receiving the services they need
4a. Adults
Homeless at least one year
N=532
Homeless less than one year, but at least 4 times in last 3 years
N=46 Total
N=578
N % N % N %
Serious mental illness 392 74% 31 67% 423 73% No recent inpatient or outpatient care 57 15% 9 29% 66 16%
Substance abuse disorder 280 53% 25 54% 305 53% No recent inpatient or outpatient care 44 16% 8 32% 52 17%
Chronic health condition* 231 43% 20 43% 251 43% No recent care for the condition(s) 43 14% 4 15% 47 14%
Any of the above problems 476 90% 39 87% 515 89% Any of the above problems is unaddressed 128 27% 21 53% 149 29%
* “Chronic health conditions” include asthma, other chronic lung or respiratory problems, high blood pressure, chronic heart or circulatory problems, diabetes, TB, hepatitis, or HIV/AIDS.

Long-term homelessness Wilder Research, September 2007 30
4b. Unaccompanied youth
Homeless at least one year
N=2
Homeless less than one year, but at least 4 times in last 3 years
N=1 Total N=3
N % N % N %
Serious mental illness 1 50% 1 100% 2 67% No recent inpatient or outpatient care 0 - 0 - 0 -
Substance abuse disorder 0 - 1 100% 1 33% No recent inpatient or outpatient care - - 0 - 0 -
Chronic health condition* 0 - 0 - 0 - No recent care for the condition(s) - - - - - -
Any of the above problems 1 50% 1 100% 2 67% Any of the above problems is unaddressed 0 - 0 - 0 -
* “Chronic health conditions” include asthma, other chronic lung or respiratory problems, high blood pressure, chronic heart or circulatory problems, diabetes, TB, hepatitis, or HIV/AIDS.
Long-term homelessness Wilder Research, September 2007 31
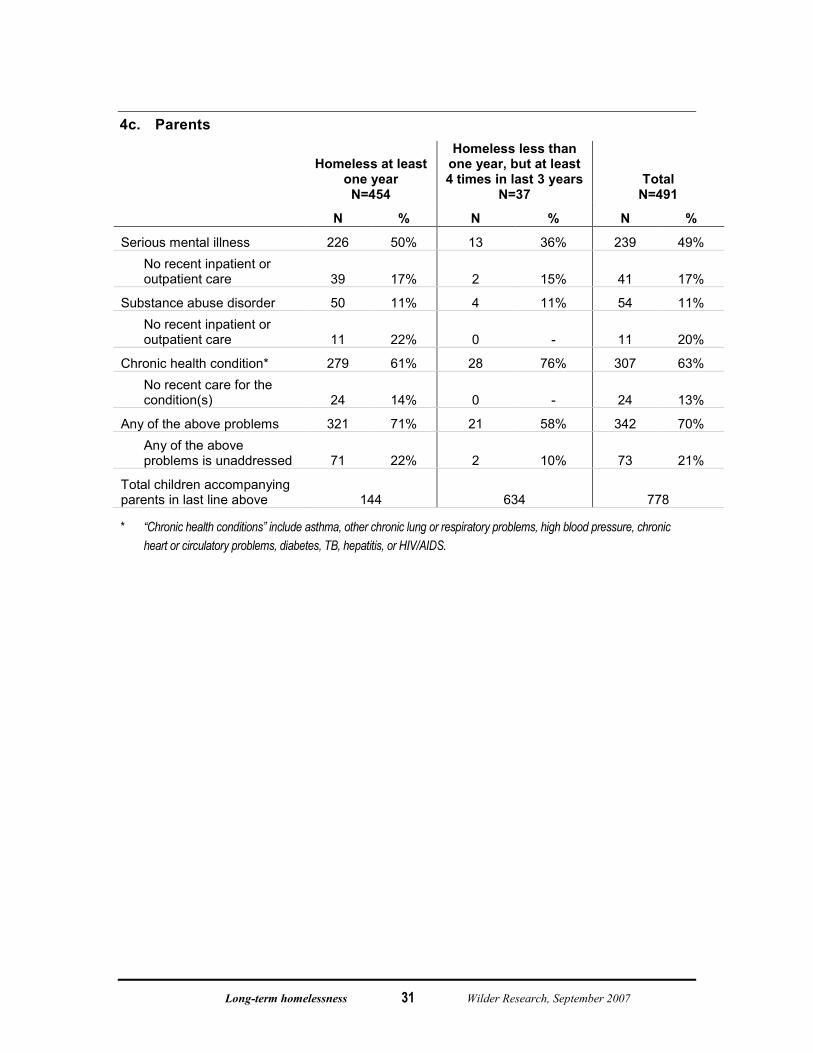
4c. Parents
Homeless at least one year
N=454
Homeless less than one year, but at least 4 times in last 3 years
N=37 Total
N=491
N % N % N %
Serious mental illness 226 50% 13 36% 239 49% No recent inpatient or outpatient care 39 17% 2 15% 41 17%
Substance abuse disorder 50 11% 4 11% 54 11% No recent inpatient or outpatient care 11 22% 0 - 11 20%
Chronic health condition* 279 61% 28 76% 307 63% No recent care for the condition(s) 24 14% 0 - 24 13%
Any of the above problems 321 71% 21 58% 342 70% Any of the above problems is unaddressed 71 22% 2 10% 73 21%
Total children accompanying parents in last line above 144 634 778
* “Chronic health conditions” include asthma, other chronic lung or respiratory problems, high blood pressure, chronic heart or circulatory problems, diabetes, TB, hepatitis, or HIV/AIDS.

Long-term homelessness Wilder Research, September 2007 32
Comparison to 2003
This report replicates the format and calculation methods of a 2003 report on the same subject. However, the numbers and percentages are not entirely comparable to those in the 2003 report for two reasons:
1. In the 2006 statewide survey, the Continuum of Care partners carried out a significantly more thorough outreach effort to locate and survey homeless persons in non-sheltered locations. As a result, the 2006 study includes more interviews with this group of people, a relatively high proportion of whom are long-term homeless. However, there is no evidence to suggest that the actual number of non-sheltered homeless adults was any higher in 2006 than in 2003, simply that improved outreach resulted in better representation of this group in 2006.
2. In the 2006 interview, questions about episodes of homelessness were asked in a slightly different sequence than in 2003. As a result, while the 2006 data better represent the actual experiences of homeless persons, the number of people reporting multiple episodes is slightly higher than in 2003.
It is possible to directly compare one component of long-term homelessness: the proportion of sheltered adults who report that their current episode has lasted for a year or longer. In 2006, 25.0 percent of all sheltered homeless adults (911 persons out of a shelter population of 3,643) had been homeless for a year or longer, compared to 22.8 percent (946 adults out of a shelter population of 4,150) in 2003. Note that although the percentage increased from 2003 to 2006, the overall shelter population decreased, and thus the number of sheltered individuals who were homeless for a year or longer was smaller in 2006.
Among homeless adults not using formal shelter programs at the time of the study, the proportion who reported being homeless for a year or longer remained essentially unchanged at 47 percent. However, because of the improved outreach efforts, a larger number of these individuals were found in 2006 than in 2003.
These comparisons are shown in the table below, including sub-totals by shelter type.

Long-term homelessness Wilder Research, September 2007 33
5. Total homeless adults and adults who were homeless for a year or longer, by year and shelter type
2003 2006
N % N %
Total sheltered adults(a) 4,150 100% 3,643 100%
Adults homeless a year or longer and in emergency or battered women’s shelters
670 16.1% 712 19.5%
Adults homeless a year or longer and in transitional housing
1,117 26.9% 983 27.0%
Adults homeless a year or longer, in transitional housing, and
276
with at least one chronic health condition that is not being treated
6.7% 199 5.5%
Total number of adults interviewed in non-shelter locations(b)
672 100% 1,138 100%
Adults homeless a year or longer and not in a shelter program
317 47.2% 536 47.1%
(a) The actual number of adults in shelters is a known number, which is shown in the table.
(b) The actual number of unsheltered adults is not known; the number shown in the table is the number who were interviewed.