long term financial plan - city of burnside · financial management aimed to uphold and maintain...
TRANSCRIPT
Page | 0
+
sustainable
City of Burnside
Long Term Financial Plan
2017/18 – 2026/27
www.burnside.sa.gov.au 401 Greenhill Rd, Tusmore SA 5065 PO Box 9, Glenside SA 5065 Ph: (08) 8366 4200

Page | 1
Table of Contents
Executive Summary ................................................................................................ 2
Strategic Context ..................................................................................................... 3
Key Influences and Risks ....................................................................................... 4
Basis of Preparation ............................................................................................... 5
1.1 Key Economic Assumptions .................................................................... 6
1.1.1 Cost Index .................................................................................................. 6
1.1.2 Salaries and Wages ................................................................................... 7
1.1.3 Rates .......................................................................................................... 8
1.1.4 Capital Works ............................................................................................ 8
1.1.5 Debt levels ................................................................................................. 8
1.1.6 Council subsidiaries ................................................................................. 9
1.1.7 Other Projects ........................................................................................... 9
Key Outcomes ....................................................................................................... 11
1.2 Financial Indicators ................................................................................. 11
Key Financial Statements ..................................................................................... 13
1.3 Statement of Comprehensive Income .................................................... 13
1.4 Balance Sheet .......................................................................................... 14
1.5 Statement of Cash Flows ........................................................................ 15
1.6 Statement of Changes in Equity ............................................................. 16
1.7 Uniform Presentation of Finances ......................................................... 17
1.8 Key Financial Indicators ......................................................................... 18
Page | 2
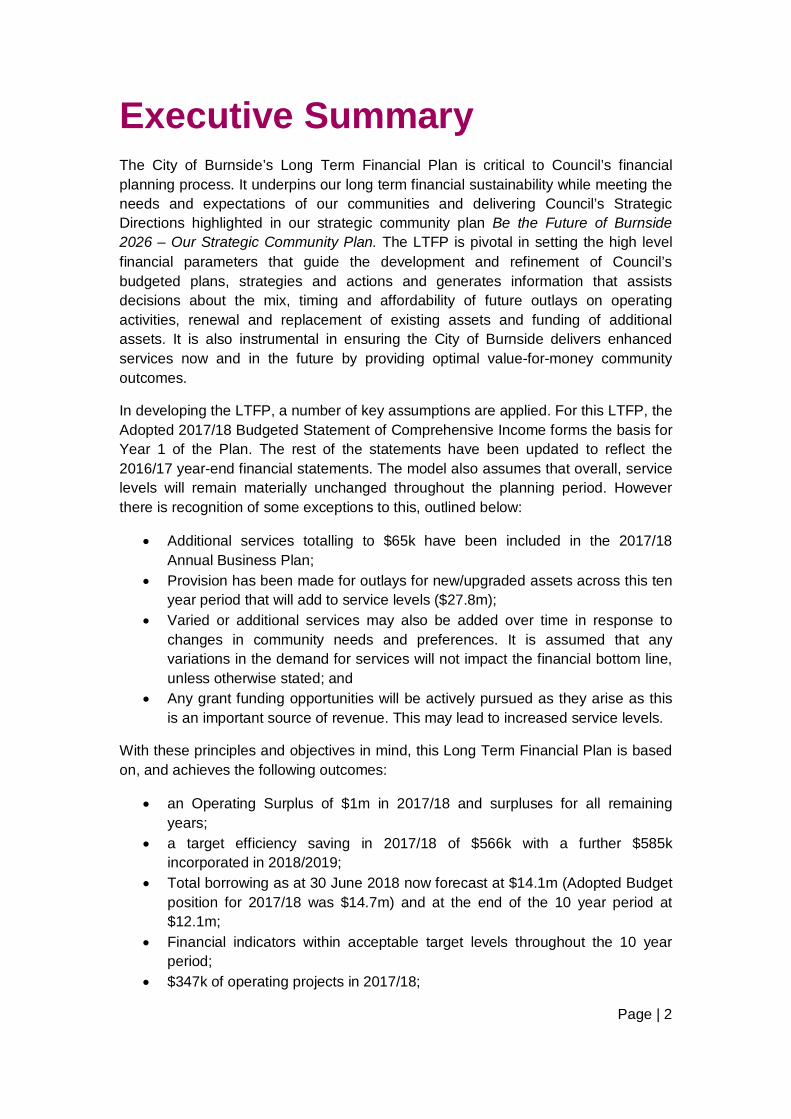
Executive Summary The City of Burnside’s Long Term Financial Plan is critical to Council’s financial planning process. It underpins our long term financial sustainability while meeting the needs and expectations of our communities and delivering Council’s Strategic Directions highlighted in our strategic community plan Be the Future of Burnside 2026 – Our Strategic Community Plan. The LTFP is pivotal in setting the high level financial parameters that guide the development and refinement of Council’s budgeted plans, strategies and actions and generates information that assists decisions about the mix, timing and affordability of future outlays on operating activities, renewal and replacement of existing assets and funding of additional assets. It is also instrumental in ensuring the City of Burnside delivers enhanced services now and in the future by providing optimal value-for-money community outcomes.
In developing the LTFP, a number of key assumptions are applied. For this LTFP, the Adopted 2017/18 Budgeted Statement of Comprehensive Income forms the basis for Year 1 of the Plan. The rest of the statements have been updated to reflect the 2016/17 year-end financial statements. The model also assumes that overall, service levels will remain materially unchanged throughout the planning period. However there is recognition of some exceptions to this, outlined below:
• Additional services totalling to $65k have been included in the 2017/18 Annual Business Plan;
• Provision has been made for outlays for new/upgraded assets across this ten year period that will add to service levels ($27.8m);
• Varied or additional services may also be added over time in response to changes in community needs and preferences. It is assumed that any variations in the demand for services will not impact the financial bottom line, unless otherwise stated; and
• Any grant funding opportunities will be actively pursued as they arise as this is an important source of revenue. This may lead to increased service levels.
With these principles and objectives in mind, this Long Term Financial Plan is based on, and achieves the following outcomes:
• an Operating Surplus of $1m in 2017/18 and surpluses for all remaining years;
• a target efficiency saving in 2017/18 of $566k with a further $585k incorporated in 2018/2019;
• Total borrowing as at 30 June 2018 now forecast at $14.1m (Adopted Budget position for 2017/18 was $14.7m) and at the end of the 10 year period at $12.1m;
• Financial indicators within acceptable target levels throughout the 10 year period;
• $347k of operating projects in 2017/18;

Page | 3
• $65k of new and enhanced services in 2017/18; • Renewal and Replacement of existing assets equalling a net $9.9m in
2017/18 and totalling $108.5m across the 10 year period; and • New and Upgraded assets equalling a net $4.1m in 2017/18 and totalling
$27.8m across the 10 year period.
Strategic Context The LTFP is a strategic component of Council’s Strategic Management Framework and supports the delivery of the Strategic Community Plan. The Strategic Framework illustrated below outlines our organisational planning framework and highlights the importance of community feedback into this process.
The LTFP is integral to Council’s suite of Strategic Management Plans providing the critical link between the:
• Strategic Community Plan; • Asset Management Plans and; • Annual Business Plan and Budget.
It translates the objectives and strategies outlined in the Strategic Community Plan and Asset Management Plans (AMP) into financial outcomes for analysis and community consultation. Optimising the integration between these strategic intentions ensures Council develops and implements a robust and transparent system of financial management aimed to uphold and maintain Council’s long term financial sustainability.
Strategic Community Plan - Be the Future 2026
Asset Management
Plans (Reviewed
every 4 years)
Long Term Financial Plan
– 10 years (annual review)
Elected Member and Community Feedback
Annual Community
Survey
Council Resolutions
Annual Business Plan & Budget
Operating Budget Capital Budget

Page | 4
Key Influences and Risks This Long Term Financial Plan generates information which is used to guide decisions about Council operations into the future. However, as with any long term plan, the accuracy of this LTFP is subject to many inherent influences. These variables and risks can be divided into three main groups:
i. External Influences – items outside of Council’s control: • Unforeseen economic changes or circumstances such as:
Interest rates fluctuations; Localised economic growth – residential development & new
business; Consumer Price Index (All Adelaide); Local Government Price Index (LGPI); and Specific program Federal Assistance Grants.
• Unforeseen political changes or circumstances such as: Changes to Levies and their conditions (e.g. Environment
Protection Authority (SA) Waste Levy); Cost of natural resources such as fuel and water; A change in the level of legislative compliance; and Cost shifting (i.e. Increased Emergency Services Levy).
• Variable Climatic Conditions such as: Storm or Force Majeure Events (i.e. Storm Event of Feb 2014
and 2016) Flooding; Bushfire; and Drought.
ii. Internal Influences – items that Council can control:
Agreed service level review outcomes; Infrastructure Asset Management; Depreciation (valuations can be considered an external
influence) ; Rate increases and other financial influences; Performance Management; Efficiencies in service delivery and administrative support; and Salaries and Wages.
iii. Community Drivers:
Community needs and expectations; Strategic Community Plan – Be the Future of Burnside 2025; Other Key Strategies.
The 2017/18 draft LTFP currently does not include any impacts from the proposed introduction of Rate Capping. The introduction of Rate Capping would expose the

Page | 5
City of Burnside to considerable political and financial risk. However, the extent of this is not known at this stage.
In order to minimise the inherent risks of long term financial planning, Council reviews and updates its Long Term Financial Plan on a regular basis and ensures that the most recent economic data and forecasts are being used as the basis for developing Council’s Long Term Financial Plan.
Basis of Preparation The LTFP is key to establishing funding requirements of Council’s Asset Management Plans and other strategic community planning and implementation, ensuring we continue to operate sustainably. It enables Council to effectively and equitably manage service levels, asset funding and revenue raising decisions, balanced with achieving its financial strategy and key performance indicators.
In developing the LTFP, key financial principles are established that underpins Council’s forecast financial performance and position over a 10-year time frame. The LTFP incorporates a number of statutory and discretionary reports and assumptions as part of a statutory requirement (within the Local Government Act 1999). Due to the variable nature of the assumptions focusing on changes in the economy, an annual review of the LTFP provides the Council with the opportunity to review the financial principles to easily adapt to these external influences, changes in proposed service levels or projects. This involves concerted input from Council, the Audit Committee and Administration.
The financial projections contained within the LTFP, provide an indication of Council’s direction and financial capacity into the future and are intended to be viewed as a guide to future actions or opportunities. This is in turn encourages Council to analyse the future effects and impacts of current decisions made by Council.
For this LTFP, the Adopted 2017/18 Budgeted Statement of Comprehensive Income forms the basis for Year 1 of the Plan. The rest of the statements have been updated to reflect the 2016/17 year-end financial statements.
Finance Strategy
The City of Burnside continues to employ a strategic approach to our financial planning that is influenced by the current and predicted economic environment, our financial position and the impacts on the organisation both internally and externally. Employing this strategic approach is designed to ensure:
• Support of the achievement of the Strategic Community Plan – Be the Future 2026
• Our long term financial sustainability; • Intergenerational equity; • Needs and expectations of the Burnside community are met;

Page | 6
• Delivery of appropriate, targeted, effective and efficient services; and • Responsible rate increases.
This leads to Council achieving:
• Continued funding to ensure Councils infrastructure is replaced and maintained when required (includes roads, footpaths, Council owned properties and open spaces);
• Commitment to major projects which span more than one year; • Council continues to fund the full life-cycle costs of any new or enhanced
services or construction of new assets through savings, rate increases or grant funding;
• Maintaining existing services at current service levels.
1.1 Key Economic Assumptions It is important that Council’s Long Term Financial Plan reflects the most recent economic data and forecasts available. A review is conducted each year to ensure that the underlying parameters and assumptions are reasonable given the current economic conditions and expectations. The key economic indicators and drivers used in this Plan are summarised in the Table 1 below.
Table 1: Key Drivers and Assumptions
Cost Index Wages Rates exc Growth Growth
2018 Year 1 1.6% 2.0% 2.3% 0.5%
2019 Year 2 2.5% 2.0% 2.5% 1.0%
2020 Year 3 2.7% 2.0% 2.7% 1.0%
2021 Year 4 3.0% 3.0% 3.0% 1.0%
2022 Year 5 3.0% 3.5% 3.0% 1.0%
2023 Year 6 3.0% 3.5% 3.0% 1.0%
2024 Year 7 3.0% 3.5% 3.0% 1.0%
2025 Year 8 3.0% 3.5% 3.0% 0.5%
2026 Year 9 3.0% 3.5% 3.0% 0.5%
2027 Year 10 3.0% 3.0% 3.0% 0.5%
1.1.1 Cost Index
The Consumer Price Index (CPI) is regarded as Australia’s key measure of inflation for household consumables. It is designed to provide a general measure of price

Page | 7
inflation for the Australian household sector as a whole. Whilst the CPI drives non-rates income, expenditure on materials is based on the Local Government Price Index (LGPI). Whilst the CPI is regarded as a key measure of household expenditure inflation and is designed to provide a general measure of price inflation for household purchases, the LGPI is considered more suitable for measuring the inflation of Local Government sector services.
Year 1 of this Long Term Financial Plan is based on the Dec 2016 LGPI of 1.60%. The comparative Adelaide CPI for the Dec quarter was 1.30%. The South Australian Centre for Economic Studies does not currently project LGPI. As such, Trading Economics has been used which projects CPI as being 2.20% in 2020. The differential between CPI and LGPI over the past ten years has been noted as 0.50% on average. As a result, the projections for cost indices used in the LTFP are essentially based on the projected CPI plus a differential of 0.5%. The CPI forecast for 2020 is 2.20% and as such the cost index used in this LTFP is 2.70%. For Years 3-10, CPI has been assumed as being 2.50% and hence the cost index used is 3.0%.
Table 2: Differential between CPI and LGPI
Financial Year LGPI (% change from previous year)
CPI - Adelaide (% change from previous year)
Difference Between LGPI and CPI (%)
2016/17 1.8 1.5 0.3 2015/16 0.9 0.9 0 2014/15 1.7 1.6 0.1 2013/14 2.3 2.6 -0.3 2012/13 2.8 2 0.8 2011/12 3.7 2.6 1.1 2010/11 3.5 3.2 0.3 2009/10 2.8 2.2 0.6 2008/09 4.5 3.2 1.3 2007/08 3.8 3.3 0.5
10 Year Average 0.5
The LTFP revenue increases have been calculated to closely match projected expenditure increases. This strategy is both prudent and essential in order to produce a balanced and financially sustainable LTFP.
1.1.2 Salaries and Wages
Staff costs for Years 1-3 are dependent on the Enterprise Bargaining outcomes and have been assumed at 2% (including increments). For years 4-10, a cost index of between 3.0% - 3.5% has been assumed which is in line with the projected LGPI. However, from Year 5 onwards, there is an additional impact from the increase in the

Page | 8
superannuation guarantee which was announced as part of the 2014 Federal Budget (as amended).
This LTFP assumes that the superannuation will increase progressively from 9.5% to 12.0% by 2025/26. Any future changes to the superannuation legislation outside of the current projected trajectory to 12.0% has the potential to impact the Plan and Council’s financial position. The staffing levels have been maintained at 160.9 Full Time Equivalents (compared to 163.9 FTE for the 2015/16 year).
1.1.3 Rates
The LTFP has used the adopted rates increase of 2.30% for the 2017/18 financial year. In line with Audit Committee recommendation, rates for years 2-10 of this LTFP have been tied to projected LGPI.
Natural growth is projected to increase at a steady historical rate of 0.5% pa except for in years 2-7 which factors in additional growth of 0.5% per year to account for the Glenside Development.
There have been no changes in policy including in this LTFP with regards to rates. The current practice of differentially rating Vacant Land has been maintained and all other land use codes have been maintained as being rated at residential rates.
1.1.4 Capital Works
The City of Burnside is responsible for the management, operation and maintenance of a diverse asset portfolio that provides services and facilities for our community.
Council has indicated a preference to purchase capital expenditure items through the use of Council borrowings. This iteration of the LTFP has been prepared based on the most up to date capital expenditure forecasts at this time and includes:
• Renewal and Replacement of existing assets totalling $108.5m across the 10 year period; and
• Spending of $27.8m on New and Upgraded assets across the 10 year period.
1.1.5 Debt levels
A major component of services Council provides are asset intensive which often requires a large investment, initially for acquisition of assets and ongoing as a result of maintenance and renewal of those assets. Without the use of debt it is very difficult for Council to finance the acquisition of new assets, while at the same time finance planned and requisite asset renewals. In the absence of adequate debt, Council would have to charge current ratepayers a high charge relative to the benefit derived. This would also lead to issues with intergenerational equity since Council would charge current ratepayers high rates whilst future ratepayers would continue to derive the benefit of the assets. Using debt, when done equitably and responsibly, will help alleviate these issues of intergenerational equity.
This current LTFP builds in $108.5m in asset renewal and replacement and $27.8m in new and upgraded assets over the 10 year period. A net of $1.8m of debt has

Page | 9
been built into this LTFP based on a treasury management position of drawing down on loans when required and repaying loans when excess cash is available. The debt projections shown below show a peak in year 4 of $20.5m and then a reduction in debt levels to $12.1m by Year 10.
Year Debt Level ($’m)
2018 14.1
(Adopted Budget position for 2017/18 was $14.7m)
2019 16.0
2020 19.0
2021 20.5
2022 20.0
2023 19.9
2024 18.3
2025 16.4
2026 14.5
2027 12.1
Borrowings have been assumed at a 4.50% - 4.80% interest rate over a 20 year period, which is a conservative and reasonable timeframe for Council to aim at repayment of its debt. In spite of this level of debt, Council maintains a Net Financial Liability Ratio between 28% - 51% across this 10 year period. This is significantly lower than the LGA recommended target of less than 100% of Operating Revenue. This demonstrates the affordability of the capital investments currently budgeted for over the next 10 years.
In addition, the ‘Debt to Total Income’ Ratio is maintained at between 19% - 38% across this 10 year period, with an average of 32%. This ratio is lower compared to the Adopted 2016/17 LTFP which projected an average Debt to Income Ratio of 42%. Whilst the NFL ratio includes trade payables, provisions as well as debt, the Debt to Income Ratio solely focuses on measuring debt as a proportion of income.
This LTFP will be updated periodically to ensure that the most up to date capital projections are being captured and accounted for over the 10 year period.
1.1.6 Council subsidiaries
The 2017/18 LTFP is based on the 2017/18 Adopted Budget with regards to the net gain /loss from Council subsidiaries. The Equity and Liability components related to these subsidiaries have been amended in line with the 2016/17 year-end financial statements.

Page | 10
This 2017/18 LTFP also does not include any capital contributions towards ERA Water, on the basis that ERA borrows its own funds guaranteed by the constituent Councils. There are however some minor connection costs included within the LTFP ($140k in 2018/19).
1.1.7 Other Projects
In addition to the factors discussed above, there are also some other projects which impact or have the potential to impact Council in the future. These have been detailed below:
Brownhill Keswick Creek Stormwater Project
The Stormwater Management Authority (SMA) exercised its power under Schedule 1A of the Local Government Act 1999 (the Act) to order the five catchment councils (Cities of Adelaide, Burnside, Mitcham, Unley and West Torrens) to develop a catchment based stormwater management plan (SMP) for the Brown Hill Keswick Creek (BHKC) flood plain. The purpose of the SMP is to mitigate and manage flood risk in the Brown Hill and Keswick Creek catchments and to achieve storm water reuse where feasible and economical.
The five catchment Councils have complied with the order and submitted a SMP to the SMA for review, comment and endorsement. The SMP was endorsed and subsequently gazetted on 7 March 2017.
The forecast cost of the Brown Hill and Keswick Creeks Stormwater Management Plan is estimated to be in the order of $147m, with implementation planned over a 10-20 year period. In February 2017, the South Australian Government (State Government) has committed to providing funding assistance to the project totalling 50 per cent of the project (estimated at $70M) over a 20 year period.
The State Government and the BHKC Project Steering Group continue to seek funding from the Commonwealth Government.
Based on the estimated costs and cost sharing arrangements approved under the Stormwater Management Plan (SMP 2012), the City of Burnside’s share of the local government contribution is set at 12%, which equates to an indicative cost of between $8.0m and $10.0m depending on project funding support ultimately received. This plan includes $9.0m towards BHKC over the next 10 years and is based on a financial model of 6 year construction, 10 year funding and 10 year payback.
The BHKC Steering Group is still reviewing the alternative financial models and depending on the model chosen, there might be a financial impact on Council.
At this stage, the Project (catchment Councils) does not own any assets and a Regional Subsidiary is due to be formed in early 2018. On the establishment of a Regional Subsidiary, it is expected that Council will recognise its share of equity in this Regional Subsidiary.

Page | 11
Glenside Development
The Glenside development site is located on Fullarton Road, south-east of the Adelaide CBD, adjoining the Adelaide Parklands between Glen Osmond and Greenhill roads. This Project aims at building up to 1000 homes on the vacant land surrounding the Glenside Hospital.
This project is still in its construction phase and it is expected that sales will commence early 2018 and this project will be phased over 8-10 years in total. As a result, this LTFP includes an additional 0.5% growth per year for years 2-7. The LTFP will continue to be updated as the full impact of this project is determined.
Key Outcomes This Long Term Financial Plan is based on, and achieves the following outcomes:
• an Operating Surplus of $1m in 2017/18 and surpluses for all remaining years;
• a target efficiency saving in 2017/18 of $566k with a further $585k incorporated in 2018/2019;
• Total borrowing as at 30 June 2018 now forecast at $14.1m (Adopted Budget position for 2017/18 was $14.7m) and at the end of the 10 year period at $12.1m;
• Financial indicators within acceptable target levels throughout the 10 year period;
• $347k of operating projects in 2017/18; • $65k of new and enhanced services in 2017/18; • Renewal and Replacement of existing assets equalling a net $9.9m in
2017/18 and totalling $108.5m across the 10 year period; and • New and Upgraded assets equalling a net $4.1m in 2017/18 and totalling
$27.8m across the 10 year period.
1.2 Financial Indicators Council has adopted a suite of Key Financial Indicators that are primarily based on those included in the Model Financial Statements and recommended by the Australian Local Government Association as appropriate for measuring financial sustainability. The following tables provide a summary of Council’s financial indicators and provide the industry accepted approach to analysing and comparing Council’s performance from year to year.

Page | 12
Table 3: Key Financial Indicators Ratio 2016/17 LTFP 2017/18 LTFP LGA Target
Audit Committee Recommendation
Operating Surplus Ratio - %
Between 1% - 3.1 %
Between 1.15% - 3.12 %
Average of 0 – 10% Below 5.0%
Net Financial Liabilities Ratio - %
Between 40% - 59%
Between 28% - 51%
Between 0 - 100% No Recommendation
Interest Cover Ratio - %
Under 1.88% Under 1.16% No Recommendation
Below 2.0%
Asset Sustainability Ratio
90% - 110% 90% - 106% Greater than 90% but less than 110%
No Recommendation
Debt Repayment Term
20 Years 20 Years No Recommendation
20 Years
Debt to Income Ratio
42% average across 10 years
32% average across 10 years
No recommendation
Below 50%
Table 4: Key Financial Indicator Commentary Financial Indicator (Ratio) Name
Key Financial Indicator Commentary
Net Operating Result The LTFP currently indicates that an operating surplus will be achieved and maintained throughout the 10 years and will be maintained below the 5.0% threshold recommended by the Audit Committee.
Net Financial Liabilities Council’s projected ratio is comfortably below the LGA recommended maximum target of the value of rates generated. While Council’s objective is to minimise its net financial liabilities position, Council is positioned to borrow funds for capital expenditure where required.
Net Financial Liabilities Ratio
Council’s ratios across this 10 year plan are comfortably below the LGA recommended maximum target of 100 per cent.
Asset Sustainability Ratio This Ratio is currently calculated based on depreciation. Once the AMP funding requirements have been adopted, the calculation will be based on the AMP requirements. Council’s aim is to achieve a target within the recommended range of 90-110 per cent. Council’s ratios over this 10 year plan are within this range.
Interest Cover Ratio The LTFP currently indicates that the Interest Cover Ratio will be maintained across the 10 year period well below the target of 2%.
Debt to Income Ratio
Ratio introduced to measure Council’s proportion of debt compared to its income. This LTFP has been based on an average of 36% across the 10 years.

Page | 13
Key Financial Statements 1.3 Statement of Comprehensive Income
Year Ended 30 June: 2017 2018 2019 2020 2021 2022 2023 2024 2025 2026 2027Actuals Adopted Budget Plan Plan Plan Plan Plan Plan Plan Plan Plan
Year 1 Year 2 Year 3 Year 4 Year 5 Year 6 Year 7 Year 8 Year 9 Year 10$(000) $(000) $(000) $(000) $(000) $(000) $(000) $(000) $(000) $(000) $(000)
INCOMERates 36,561 37,700 39,021 40,465 42,083 43,767 45,518 47,339 48,996 50,711 52,486 Statutory Charges 1,163 1,172 1,201 1,233 1,270 1,307 1,346 1,385 1,427 1,469 1,513 User Charges 1,718 1,686 1,729 1,775 1,829 1,884 1,940 1,998 2,058 2,120 2,185 Grants, subsidies, contributions 4,472 3,959 3,698 3,798 3,912 4,029 4,150 4,275 4,403 4,535 4,671 Investment Income 36 31 31 31 31 31 31 31 31 31 31 Reimbursements 343 267 274 282 290 299 308 317 326 335 345 Other Income 478 395 405 416 428 441 454 468 482 496 511 Gain - Equity Accounted Council Bus. 277 31 321 330 340 350 361 372 383 394 406 Total Revenues 45,048 45,241 46,680 48,330 50,183 52,108 54,108 56,185 58,106 60,091 62,148 EXPENSESEmployee costs 15,636 15,955 16,196 16,520 17,015 17,610 18,228 18,865 19,525 20,208 20,815 Materials, contracts & other expenses 17,668 18,397 19,188 20,312 20,903 21,510 22,135 22,780 23,442 24,123 24,827 Depreciation 9,290 9,340 9,783 10,107 10,748 11,038 12,180 12,456 12,720 13,547 13,859 Finance Costs 375 491 339 394 537 606 582 513 485 391 301 Loss - Joint Ventures 160 46 198 200 202 204 206 208 210 212 214 Total Expenses 43,129 44,229 45,704 47,533 49,405 50,968 53,331 54,822 56,382 58,481 60,016
OPERATING SURPLUS/(DEFICIT) BEFORE CAPITAL AMOUNTS (Including subsidiaries) 1,919 1,012 976 797 778 1,140 777 1,363 1,724 1,610 2,132 Net gain/(loss) on disposal or revaluations (188) 30 - - - - - - - - - Amounts specifically for new assets 147 150 193 195 197 199 201 203 205 207 209 Physical resources free of charge 550 200 - - - - - - - - -
NET SURPLUS/(DEFICIT) (including subsidiaries) 2,428 1,392 1,169 992 975 1,339 978 1,566 1,929 1,817 2,341 Other Comprehensive IncomeChanges in revaluation surplus - IPP&E 50,742 - - 32,562 - 31,066 - - 44,026 - 38,600 Movements in Other Reserves - - - - - - - - - - - Share of Other Comprehensive Income - Equity Accounted Co 2,459 - - - - - - - - - - Total Other Comprehensive Income 53,201 - - 32,562 - 31,066 - - 44,026 - 38,600 TOTAL COMPREHENSIVE INCOME 55,629 1,392 1,169 33,554 975 32,405 978 1,566 45,955 1,817 40,941

Page | 14
1.4 Balance Sheet
City of BurnsideLong Term Financial Plan 2017/18 2,211 2,285 2,377 2,470 2,548 2,667 2,741 2,819 2,924 3,001 ESTIMATED BALANCE SHEET
Year Ended 30 June: 2017 2018 2019 2020 2021 2022 2023 2024 2025 2026 2027Actuals Amended Plan Plan Plan Plan Plan Plan Plan Plan Plan
Year 1 Year 2 Year 3 Year 4 Year 5 Year 6 Year 7 Year 8 Year 9 Year 10$(000) $(000) $(000) $(000) $(000) $(000) $(000) $(000) $(000) $(000) $(000)
ASSETSCurrent AssetsCash & Equivalent Assets 1,398 - - - - - - - - - - Trade & Other Receivables 1,198 1,422 1,452 1,486 1,524 1,563 1,605 1,648 1,688 1,730 1,773 Inventories 23 23 23 23 23 23 23 23 23 23 23 Total Current Assets 2,619 1,445 1,475 1,509 1,547 1,586 1,628 1,671 1,711 1,753 1,796 Non-Current AssetsOther Financial Assets 201 201 201 201 201 201 201 201 201 201 201 Equity Accounted Investments in Council Businesses 3,238 3,269 3,590 3,920 4,260 4,610 4,971 5,343 5,726 6,120 6,526 Infrastructure, Property, Plant & Equipment 571,470 578,577 581,040 617,830 620,102 652,067 652,793 652,749 696,682 696,581 735,001 Other Non-Current Assets 963 - - - - - - - - - - Total Non-Current Assets 575,872 582,047 584,831 621,951 624,563 656,878 657,965 658,293 702,609 702,902 741,728 Total Assets 578,491 583,492 586,306 623,460 626,110 658,464 659,593 659,964 704,320 704,655 743,524 LIABILITIESCurrent LiabilitiesTrade & Other Payables 3,009 4,263 3,710 4,071 4,002 4,094 4,105 4,159 4,191 4,234 4,273 Borrowings 290 290 294 409 485 508 1,555 1,945 1,845 2,422 720 Provisions 2,039 2,167 2,144 2,198 2,230 2,290 2,344 2,403 2,462 2,525 2,583 Other Current Liabilities - - - - - - - - - - -
Sub-total 5,338 6,720 6,148 6,678 6,717 6,892 8,004 8,507 8,498 9,181 7,576 Liabilities Relating to Non-Current Assets held for sale - - - - - - - - - - - Total Current Liabilities 5,338 6,720 6,148 6,678 6,717 6,892 8,004 8,507 8,498 9,181 7,576 Non-Current LiabilitiesTrade & Other Payables 19 9 14 12 13 13 13 13 13 13 13 Borrowings 11,420 13,792 15,691 18,591 19,965 19,509 18,295 16,350 14,505 12,083 11,363 Provisions 418 237 352 324 383 409 456 495 540 585 624 Other Non-Current Liabilities 1,934 1,980 2,178 2,378 2,580 2,784 2,990 3,198 3,408 3,620 3,834 Total Non-Current Liabilities 13,791 16,018 18,235 21,305 22,941 22,715 21,754 20,056 18,466 16,301 15,834 Total Liabilities 19,129 22,738 24,383 27,983 29,658 29,607 29,758 28,563 26,964 25,482 23,410
NET ASSETS 559,362 560,754 561,923 595,477 596,452 628,857 629,835 631,401 677,356 679,173 720,114 EQUITYAccumulated Surplus 222,106 223,498 224,667 225,659 226,634 227,973 228,951 230,517 232,446 234,263 236,604 Asset Revaluation Reserve 336,827 336,827 336,827 369,389 369,389 400,455 400,455 400,455 444,481 444,481 483,081 Other Reserves 429 429 429 429 429 429 429 429 429 429 429 TOTAL EQUITY 559,362 560,754 561,923 595,477 596,452 628,857 629,835 631,401 677,356 679,173 720,114

Page | 15
1.5 Statement of Cash Flows
Year Ended 30 June: 2017 2018 2019 2020 2021 2022 2023 2024 2025 2026 2027Actuals Amended Plan Plan Plan Plan Plan Plan Plan Plan Plan
Year 1 Year 2 Year 3 Year 4 Year 5 Year 6 Year 7 Year 8 Year 9 Year 10$(000) $(000) $(000) $(000) $(000) $(000) $(000) $(000) $(000) $(000) $(000)
CASH FLOWS FROM OPERATING ACTIVITIESReceiptsRates 36,615 37,684 39,002 40,445 42,060 43,743 45,493 47,313 48,973 50,687 52,461 Statutory Charges 1,163 1,172 1,201 1,233 1,270 1,307 1,346 1,385 1,427 1,469 1,513 User Charges 1,874 1,675 1,719 1,763 1,816 1,871 1,925 1,983 2,043 2,104 2,169 Grants, subsidies, contributions 4,472 3,977 3,738 3,783 3,926 4,025 4,155 4,276 4,406 4,537 4,673 Investment Income 36 31 30 29 29 29 29 29 29 29 29 Reimbursements 343 267 274 282 290 299 308 317 326 335 345 Other Income 3,456 395 405 416 428 441 454 468 482 496 511 Gain - Equity Accounted Council Bus. 321 330 340 350 361 372 383 394 406
PaymentsEmployee costs (15,656) (15,834) (16,089) (16,496) (16,915) (17,525) (18,122) (18,765) (19,418) (20,097) (20,715) Materials, contracts & other expenses (22,366) (17,971) (19,593) (19,736) (20,792) (21,209) (21,928) (22,521) (23,206) (23,873) (24,579) Finance Costs (375) (390) (339) (394) (537) (606) (582) (513) (485) (391) (301) Net Cash provided by (or used in) Operating Activities 9,562 11,006 10,470 11,455 11,713 12,521 13,233 14,136 14,750 15,478 16,298 CASH FLOWS FROM INVESTING ACTIVITIESReceiptsAmounts Specifically for New/Upgraded Assets 146 150 193 195 197 199 201 203 205 207 209 Sale of Renewed/Replaced Assets 265 116 - - - - - - - - - Repayments of Loans by Community Groups 51 - - - - - - - - - - Distributions Received from Associated Entities - - - - - - - - - - - PaymentsExpenditure on Renewal/Replacement of Assets (10,059) (9,894) (10,512) (10,195) (9,650) (9,972) (11,007) (11,183) (11,410) (12,190) (12,495) Expenditure on New/Upgraded Assets (1,899) (4,096) (4,490) (4,470) (3,710) (2,315) (2,260) (1,600) (1,600) (1,650) (1,590) Loans Made to Community Groups (17) - - - - - - - - - - Capital Contributed to Associated Entities (145) - - - - - - - - - - Net Cash Provided by (or used in) Investing Activities (11,658) (13,724) (14,809) (14,470) (13,163) (12,088) (13,066) (12,580) (12,805) (13,633) (13,876) CASH FLOWS FROM FINANCING ACTIVITIESReceiptsProceeds from Borrowings 3,029 2,826 4,489 3,309 1,859 52 341 - - - - PaymentsRepayments of Borrowings (118) (1,507) (150) (294) (409) (485) (508) (1,555) (1,945) (1,845) (2,422) Net Cash provided by (or used in) Financing Activities 2,911 1,319 4,339 3,015 1,450 (433) (167) (1,555) (1,945) (1,845) (2,422)
Net Increase/(Decrease) in cash held 815 (1,398) - - - - - - - - - Opening cash, cash equivalents or (bank overdraft) 583 1,398 - - - - - - - - - Closing cash, cash equivalents or (bank overdraft) 1,398 - - - - - - - - - -
Page | 16
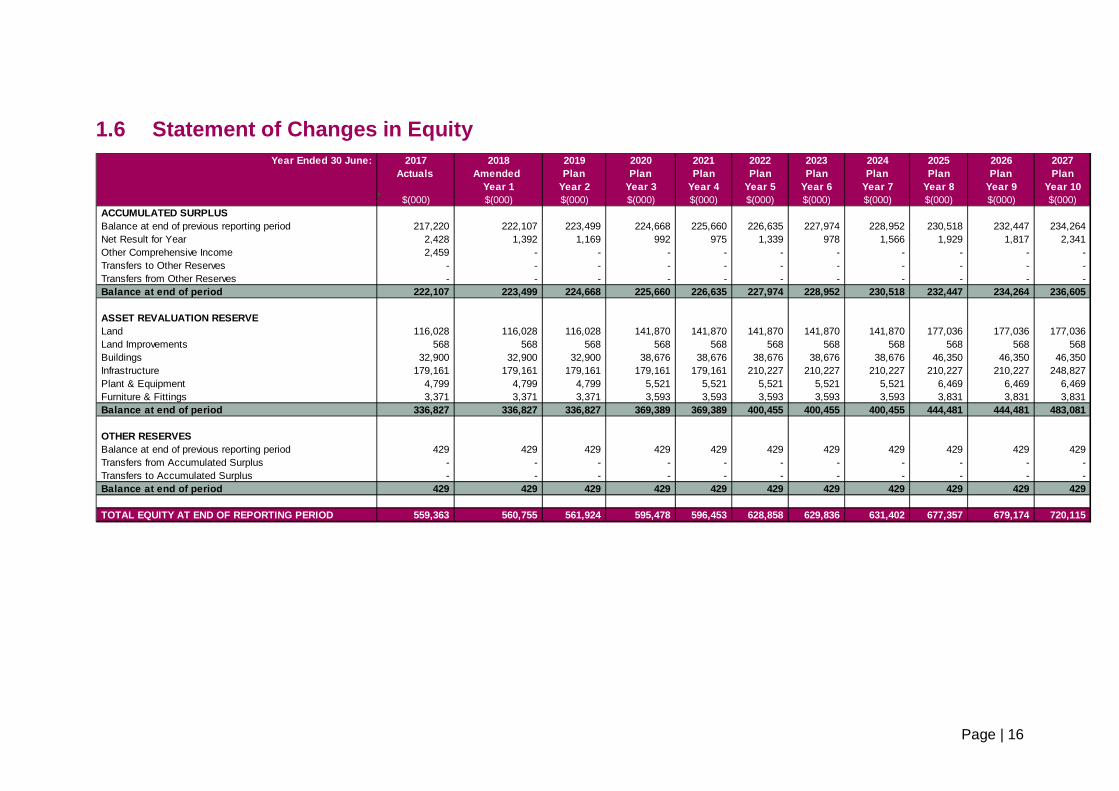
1.6 Statement of Changes in Equity
Year Ended 30 June: 2017 2018 2019 2020 2021 2022 2023 2024 2025 2026 2027Actuals Amended Plan Plan Plan Plan Plan Plan Plan Plan Plan
Year 1 Year 2 Year 3 Year 4 Year 5 Year 6 Year 7 Year 8 Year 9 Year 10$(000) $(000) $(000) $(000) $(000) $(000) $(000) $(000) $(000) $(000) $(000)
ACCUMULATED SURPLUSBalance at end of previous reporting period 217,220 222,107 223,499 224,668 225,660 226,635 227,974 228,952 230,518 232,447 234,264 Net Result for Year 2,428 1,392 1,169 992 975 1,339 978 1,566 1,929 1,817 2,341 Other Comprehensive Income 2,459 - - - - - - - - - - Transfers to Other Reserves - - - - - - - - - - - Transfers from Other Reserves - - - - - - - - - - - Balance at end of period 222,107 223,499 224,668 225,660 226,635 227,974 228,952 230,518 232,447 234,264 236,605
ASSET REVALUATION RESERVELand 116,028 116,028 116,028 141,870 141,870 141,870 141,870 141,870 177,036 177,036 177,036 Land Improvements 568 568 568 568 568 568 568 568 568 568 568 Buildings 32,900 32,900 32,900 38,676 38,676 38,676 38,676 38,676 46,350 46,350 46,350 Infrastructure 179,161 179,161 179,161 179,161 179,161 210,227 210,227 210,227 210,227 210,227 248,827 Plant & Equipment 4,799 4,799 4,799 5,521 5,521 5,521 5,521 5,521 6,469 6,469 6,469 Furniture & Fittings 3,371 3,371 3,371 3,593 3,593 3,593 3,593 3,593 3,831 3,831 3,831 Balance at end of period 336,827 336,827 336,827 369,389 369,389 400,455 400,455 400,455 444,481 444,481 483,081
OTHER RESERVESBalance at end of previous reporting period 429 429 429 429 429 429 429 429 429 429 429 Transfers from Accumulated Surplus - - - - - - - - - - - Transfers to Accumulated Surplus - - - - - - - - - - - Balance at end of period 429 429 429 429 429 429 429 429 429 429 429
TOTAL EQUITY AT END OF REPORTING PERIOD 559,363 560,755 561,924 595,478 596,453 628,858 629,836 631,402 677,357 679,174 720,115

Page | 17
1.7 Uniform Presentation of Finances
City of BurnsideLong Term Financial Plan 2017/18 SUMMARY STATEMENT INCLUDING FINANCING TRANSACTIONS
Year Ended 30 June: 2017 2018 2019 2020 2021 2022 2023 2024 2025 2026 2027Actuals Amended Plan Plan Plan Plan Plan Plan Plan Plan Plan
Year 1 Year 2 Year 3 Year 4 Year 5 Year 6 Year 7 Year 8 Year 9 Year 10$(000) $(000) $(000) $(000) $(000) $(000) $(000) $(000) $(000) $(000) $(000)
Operating Revenues 45,048 45,241 46,680 48,330 50,183 52,108 54,108 56,185 58,106 60,091 62,148 less Operating Expenses 43,129 44,229 45,704 47,533 49,405 50,968 53,331 54,822 56,382 58,481 60,016 Operating Surplus/(Deficit) before Capital Amounts 1,919 1,012 976 797 778 1,140 777 1,363 1,724 1,610 2,132
Less: Net Outlays on Existing AssetsCapital Expenditure on Renewal/Replacement of Existing Ass 10,069 9,894 10,512 10,195 9,650 9,972 11,007 11,183 11,410 12,190 12,495 less Depreciation, Amortisation & Impairment 9,306 9,340 9,783 10,107 10,748 11,038 12,180 12,456 12,720 13,547 13,859 less Proceeds from Sale of Replaced Assets 123 116 - - - - - - - - -
640 438 729 88 (1,098) (1,066) (1,173) (1,273) (1,310) (1,357) (1,364)
Less: Net Outlays on New and Upgraded AssetsCapital Expenditure on New/Upgraded Assets 1,899 4,096 4,490 4,470 3,710 2,315 2,260 1,600 1,600 1,650 1,590 less Amounts Specifically for New/Upgraded Assets 147 150 193 195 197 199 201 203 205 207 209 less Proceeds from Sale of Surplus Assets - - - - - - - - - - -
1,752 3,946 4,297 4,275 3,513 2,116 2,059 1,397 1,395 1,443 1,381
Net Lending / (Borrowing) for Financial Year (473) (3,372) (4,050) (3,566) (1,637) 90 (109) 1,239 1,639 1,524 2,115
New Borrowings 1,631 2,827 4,489 3,309 1,859 52 341 - - - - Repayment of Principal on Borrowings 104 1,507 150 294 409 485 508 1,555 1,945 1,845 2,422 (Increase)/Decrease in Cash and Cash Equivalents (815) 1,398 - - - - - - - - - (Increase)/Decrease in Receivables 167 (224) (30) (34) (38) (39) (42) (43) (40) (42) (43) Increase/(Decrease) in Payables & Provisions (2,224) 1,191 (456) 385 23 178 112 152 136 151 136 Other – Including the Movement in Inventories 1,610 (3,327) (102) (387) (615) (766) (810) (2,903) (3,680) (3,478) (4,630) Financing Transactions 473 3,372 4,050 3,566 1,637 (90) 109 (1,239) (1,639) (1,524) (2,115)
In any one year, the above financing transactions are associated with either applying surplus funds stemming from a net lending result or accommodating the funding requirement stemming from a net borrowing result.

Page | 18
1.8 Key Financial Indicators
Year Ended 30 June: 2017 2018 2019 2020 2021 2022 2023 2024 2025 2026 2027Key Financial Indictors Actuals Amended Plan Plan Plan Plan Plan Plan Plan Plan Plan
Year 1 Year 2 Year 3 Year 4 Year 5 Year 6 Year 7 Year 8 Year 9 Year 10$(000) $(000) $(000) $(000) $(000) $(000) $(000) $(000) $(000) $(000) $(000)
Operating Surplus Ratio - % 4.26% 2.24% 1.83% 1.38% 1.28% 1.91% 1.15% 2.13% 2.67% 2.38% 3.12%Net Financial Liabilities - $'000 14,398 19,135 20,552 23,918 25,353 25,059 24,962 23,516 21,667 19,931 17,602 Net Financial Liabilities Ratio - % 32% 42% 44% 49% 51% 48% 46% 42% 37% 33% 28%Debt to Total Income Ratio - % 23% 31% 34% 39% 41% 38% 37% 33% 28% 24% 19%Interest Cover Ratio - % 0.83% 1.09% 0.73% 0.82% 1.07% 1.16% 1.08% 0.91% 0.84% 0.65% 0.48%Asset Sustainability Ratio - % 105% 106% 107% 101% 90% 90% 90% 90% 90% 90% 90%