long-term consequences of adhd medication use for children...
TRANSCRIPT
Long-term Consequences of ADHD Medication Use
for Children‟s Human Capital Development
Søren Dalsgaard
National Center for Register-
based Research
Aarhus University
Helena Skyt Nielsen
Department of Economics
and Business
Aarhus University
Marianne Simonsen
Department of Economics
and Business
Aarhus University
Draft, April 2013
Abstract:
This paper estimates effects of ADHD medication use on core human capital outcomes for children
diagnosed with ADHD while using rarely available register based data on diagnoses and
prescription drug purchases. Our main identification strategy exploits plausible exogenous
assignment of children to specialist physicians, while our analysis of health outcomes also allows
for an individual level panel data strategy. We find that the behavior of specialist physicians varies
considerably across wards and that the prescribing behavior does affect the probability that a given
child is treated. Results show that children diagnosed with ADHD in pharmacological treatment
have fewer hospital contacts if treated and that treatment to some extent protects against criminal
behavior. We do not, on the other hand, find improvements in terms of the likelihood to complete
secondary exam.
Acknowledgements: We thank Anette Primdal Kvist, Niels Gregersen, and Kathrine Sørensen for excellent research
assistance and the Danish Psychiatric Central Register for access to data. Financial support from the Danish Council for
Independent Research (Sapere Aude Starting Grant, 10-079597), the Danish Council for Strategic Research (Grant 09-
070295; CSER) and Slagtermester Wörzners Mindelegat is gratefully acknowledged. We appreciate comments from
Sandra Black, Joseph Doyle, Tarjei Havnes, Juanna Joensen, Edwin Leuven, Emilia Simeonova and Jeff Smith and
from participants at the EALE conference 2011 and the 2013 Workshop on the Economics of Successful Children along
with seminar participants at Statistics Norway, the University of Southern Denmark, IFAU, the Tinbergen Institute, and
Tilburg University.

2
“TO date, no study has found any long-term benefit of attention-deficit medication on academic
performance, peer relationships or behavior problems, the very things we would most want to improve. Until
recently, most studies of these drugs had not been properly randomized, and some of them had other
methodological flaws.”
- Professor Emeritus of Psychology, L. Alan Sroufe, Minnosota: “Ritalin Gone
Wrong”, New York Times, January 12, 2012.
I. Introduction
One of the most publicly debated new medical technologies is pharmacological treatment of
children diagnosed with Attention-Deficit/Hyperactivity-Disorder (henceforth ADHD). There are
concerns, even among some professionals in the field, that children are over-diagnosed with
ADHD; that we know too little about effects of ADHD medication and that children are, in fact,
over-treated with ADHD medication. This is the first paper to investigate longer-run effects of
pharmacological treatment of ADHD on a series of key human capital variables such as health,
crime and schooling. More generally, our paper speaks to the literature on the impacts of early
health interventions.
ADHD is one of the most common chronic mental health problems among young children. ADHD
is estimated to affect about 3-7 % of all children (The Danish Association for Child and Adolescent
Psychiatry, 2008; American Psychiatric Association, 2000) or on average one child – more often a
boy than a girl – in every classroom. Core symptoms associated with ADHD are attention
deficiencies, hyperactivity and impulsiveness and children often simultaneously suffer from other
behavioral problems along with depression and anxiety. Hence, ADHD is likely to affect not only
one‟s overall human capital but also one‟s tendency to engage in risky health behaviors.
Children with ADHD grow up in relatively disadvantaged families and have – even when in
pharmacological treatment – much worse long-term outcomes than others who are comparable in
terms of age and gender (Dalsgaard et al. (2002); Mannuzza and Klein (2000)) and also when
compared to siblings without ADHD (Currie and Stabile (2006); Fletcher and Wolfe (2008)). And
although a series of randomized controlled studies show that treatment with central nervous system
3
stimulants1 is effective in terms of reducing ADHD core symptoms and improving social behavior
(van der Oord et al. (2008)), most studies only have very short follow up periods of up to three
years after randomization implying that we effectively know very little about the longer-run
consequences of treating children pharmacologically. Because these studies rely on surveys with
relatively small samples sizes and since attrition has shown to be a real concern in the follow-up
studies already carried out, alternative evaluation methods are called for; the seminal Multimodal
Treatment Study of Children with ADHD (henceforth MTA), for example, initially included 144
treated children and some studies use as little as ten children in treatment; see van der Oord et al
(2008)).
We propose to exploit variation in access to pharmacological treatment generated by variation in
specialist physicians‟ propensity to prescribe to estimate effects of treatment; see for example
Duggan (2005) who uses the same type of variation to investigate effects of second-generation
antipsychotics on spending on other types of medical care and Doyle (2007, 2008) who uses
variation in investigator assignment to estimate causal effects of foster care. Such variation may
stem from ward level differences in treatment culture and because of knowledge spillovers; see
Coleman, Katz and Menzel (1957) and Soumerai et al. (1998).
A concern with the more standard instrument exploiting treatment tendencies associated with other
children at the ward level is so-called treatment by indication: physicians who are observed to treat
more might just do so because they meet children who suffer from more severe ADHD. We
therefore test the robustness of our main results to using an alternative instrument that attempts to
hold fixed the severity of the disorder, namely the share of treated among other children with less
severe ADHD as approximated by a low number of pre-treatment injuries.
Our analysis of effects on health outcomes allows for a complementary identification strategy:
specifically, since a diagnosis is rarely established and treatment initiated before the age of five, we
compare outcomes of treated children prior to (age four and three) and after treatment (age 10 +)
with untreated diagnosed children before and after. This identification strategy allows for non-
1 Methylphenidate is the most common pharmacological treatment for ADHD, better known under the brand name
Ritalin. A more recent development is Concerta; a once daily extended release formulation of methylphenidate. Another
commonly used agent is dexamphetamine, however no extended-release formulations of this are available in Denmark
and the use therefore very limited.
4
random selection into treatment based on, for instance, severity of symptoms or parental
backgrounds as long as these mechanisms are constant over time.
We use a combination of Danish registers that apart from rich socio-economic background variables
include the following key information: 1) psychiatric history and diagnoses for children and their
parents including information about the ward where a diagnosis was first established, 2) the history
of prescription drug usage for children and their parents, and 3) health, schooling, and criminal
outcomes.
We find that the behavior of specialist physicians varies considerably across wards and that the
prescribing behavior does affect the probability that a given child is treated. Results show that
children diagnosed with ADHD on the margin of receiving pharmacological treatment have fewer
hospital contacts if treated, are less likely to be charged with crime but less likely to complete
secondary school exams. That is, children seem to benefit from treatment with regards to outcomes
that only depend directly on the child‟s own behavior and are within his control, whereas they
perform worse in terms of outcomes that may be mediated by others such as school teachers,
principals, and parents. This is consistent with a hypothesis of social stigma associated with
medication. In fact, results from a teacher survey show that teachers are highly likely to be informed
if children in their classroom are treated for ADHD and teachers self-report that they have
substantial influence on the decision to let a child enter secondary exams.
In the analysis of health outcomes, we have sufficient data to meaningfully distinguish between
birth cohorts. We document that effects are smaller in later cohorts where more children are
diagnosed and treated pharmacologically before the age of ten. There are still significant gains from
treatment in the later cohorts, but the results support a hypothesis of diminishing returns to
broadening the group of treated.
The paper is structured as follows: Section II discusses causes of ADHD and links between ADHD
and human capital, Section III presents the empirical framework, and Section III the background for
the analysis. Section IV shows the data, Section V the results and Section VI concludes.
II. Causes of ADHD and Links between ADHD and Human Capital
Recently, a series of papers such as Cunha et al. (2006), Currie (2011), and Currie and Almond
(2010) have emphasized the importance of investing early in particularly vulnerable children.
5
Moreover, Cunha and Heckman (2007) show theoretically that early investments not only have a
large potential pay-off, they are also efficient in the sense that an equity-efficiency trade-off does
not exist, which is the case for later investments. The reasons are that skills acquired in one period
persist into future periods and that skills produced at one stage raise the productivity of investment
at subsequent stages. Importantly, skills are multidimensional and are likely to complement each
other. The group of children with ADHD is a prime example for which we would expect early
investments with immediate effects on health capital in general to also have long-term
consequences for later health and human capital attainment. This paper investigates investments via
pharmacological treatment. Early take-up of pharmacological treatment may have long-term effects
on human capital simply because it improves behavior and therefore the likelihood of future
treatment but also because of dynamic complementarities: treatment may improve cognitive skills2
including less impulsive behavior and more awareness of the consequences of one‟s actions that
feed back on outcomes.
To set the scene, we sketch a simple model for the production of skills during childhood. We follow
Heckman (2008) and co-authors. The model consists of three periods, t = 1,2,3, corresponding to
early and late childhood and early youth. Parents invest in their children in period one and two and
the investments of interest for this paper are ADHD related interventions in period one, I1. The
technology of skill production for a given child in period t can be summarized in the following way:
,
where O is a vector of outcomes, f is the production function, h measures initial conditions such as
birth weight, mental health (ADHD) and parental abilities, and I indicates parental investments such
as pharmacological treatment.3
Given the production function, it is clearly critical to be aware of the causes of ADHD since they
may be correlated with initial conditions that determine later outcomes. Though not perfectly
described, it is well known that genetic factors are very important (Faraone and Doyle (2001)), but
also premature birth, birth complications, maternal smoking and alcohol use during pregnancy are
associated with ADHD (Linnet et al. (2003)). In our sensitivity section we will therefore investigate
2 IQ, for example, is malleable up until the age of 10, see Cunha et al. (2006)
3 Here we ignore the fact that seeking the actual diagnosis may be affected by parental background or the peer group,
see e.g. Elder and Lubotsky (2009).
Ot1 ft h,Ot,It
6
whether effects of treatment vary with health at birth and maternal smoking during pregnancy.
Children with ADHD are also more likely than others to have language, cognitive and memory
problems (e.g. Jensen et al. (2001) and Frazier et al. (2004)). To address this, we investigate the
extent to which results are affected by children with mental retardation (11% in our sample).
The existing literature only considers the direct link between ADHD and measures of human capital
(educational outcomes) and not to what degree (or whether at all) pharmacological treatment may
serve as a remedy. Currie and Stabile (2006) find that ADHD symptoms at ages 5-12 worsen
learning outcomes as measured by short-run educational attainment at ages 9-16.4 They conclude
that mental disorders are much more important for average learning outcomes than physical
disorders. Inclusion of siblings fixed effects does not change the results. Fletcher and Wolfe (2008)
confirm Currie and Stabiles‟ findings for short-run educational outcomes and find similarly strong
effects on long-run educational outcomes. However, they do find that accounting for family fixed
effects makes most of the negative long-run effects disappear. By controlling for ADHD symptoms
of siblings they show that rather than reflecting the fact that families learn how to compensate for
the ADHD symptoms, a child with ADHD symptoms indeed affects siblings negatively; in other
words, negative effects extend beyond those on the individual himself. In fact, for many learning
outcomes, the effect of ADHD on siblings‟ human capital accumulation is as high as the effect of
own ADHD on human capital accumulation. For instance, for outcomes such as years of education,
school drop-out, college enrolment, and school suspension, the effect of siblings‟ ADHD on human
capital accumulation is significant and of the same order of magnitude for the sibling as for the
child him- or herself. On the other hand, for outcomes such as grade repetition, special education
and GPA, the effect of ADHD on siblings‟ outcomes is insignificant and negligible in size.
A series of papers (Ding et al. (2009) and Fletcher and Lehrer (2009, 2011)) instrument for poor
mental health (including ADHD) using genetic markers and investigate the effects of poor mental
health on academic performance. They find some evidence that inattentiveness is associated with
lower academic achievement. The inherent problem, of course, is that there is no knowledge about
direct effects of gene composition on educational outcomes. The authors have access to a series of
instruments, which do pass conventional F-tests for over-identification.
4 In their samples from Canada and the US in 1994, only 7-10 % of children with a high hyperactivity score were in
drug therapy. These numbers are similar to the 12% reported by Mannuzza and Klein (2000).
7
As mentioned above, it is well-documented that treatment with central nervous system stimulants is
effective in terms of reducing the number and impact of ADHD core symptoms.5 This evidence is
based on a series of randomized controlled trials. In the seminal Multimodal Treatment Study of
Children with ADHD (henceforth MTA), 579 children aged 7-9.9 years suffering from ADHD were
assigned to different types of treatment for a period of 14 months. Of these, 144 children were
assigned to pharmacological treatment. Within the 14-month period careful medication
management with or without behavioral treatment was shown to be superior to routine community
care or behavioral treatment in terms of reducing core symptoms, see MTA (1999). In follow-up
studies considering children three years after randomization, the difference in symptom relief
diminishes over time and eventually disappears (see MTA (2004) and Molina et al. (2009)). These
studies find no impact of medication management on functioning outcomes such as social skills,
relations or reading achievement.
While being informative about symptom relief, these studies cannot stand alone when it comes to
determining the long-term consequences of pharmacological treatment of ADHD. Unfortunately,
the MTA study, as well as other randomized controlled trials, suffers from serious problems, the
most important being selection into (or out of) the experiment; in the case of the MTA study only
13 % of the children initially screened ended up participating. Children were for example excluded
if they had low IQ, if they were hospitalized or were otherwise ill, if their primary care-taker was
non-English speaking, or if there was no phone in the household. Similarly, a large share of parents
refused to let their child enroll into experimental treatment. All of these factors are unlikely to be
uncorrelated with gains from treatment. Other problems include Hawthorne effects, attrition and
small sample sizes; some studies had as little as ten treated children (see van der Oord et al (2008)).
In addition, absent register-based outcome measures, studies rely on test scores or self-reported
outcomes collected among non-blinded respondents in follow-up evaluations. Furthermore, random
controlled trials only ever measure the intention to treat (ITT) among those who choose to
participate, which may be very different from the average treatment effect on the treated (ATET) in
the population if persistent individual factors such as own preference for treatment or physician‟s
prescription practices influence the take up of pharmacological treatment. And ultimately, we know
5 The information is surveyed and incorporated in national treatment guidelines e.g. The Danish Association for Child
and Adolescent Psychiatry (2008) for Denmark and Paykina and Greenhill (2008) for the US.

8
little from the existing randomized controlled trials about the longer-term effects of
pharmacological treatment on human capital accumulation in general.
There is some evidence of favorable long-term consequences of pharmacological treatment of
ADHD on human capital accumulation based on observational methods. In a survey, Paykina and
Greenhill (2008) report less school disruption, anti-social behavior and academic failure following
pharmacological treatment, while others raise doubt about such effects (e.g. Mendez et al. (2011)).
Regarding accumulation of health capital more specifically, we are aware of only one study by
Marcus et al. (2008) that considers the link between pharmacological treatment and health. Their
study uses a duration model to investigate the association between compliance in pharmacological
treatment and injuries for a group of children in treatment. They find that children treated with high
intensity had a non-significantly lower risk of injury than those treated with low intensity.
Regarding crime outcomes, a recent study by Lichtenstein et al (2012) uses Swedish register-based
data to document the association between treatment receipt in adulthood and crime for individuals
with ADHD while exploiting that some individuals periodically drop out of treatment.
III. Empirical Framework
III.A IV strategies
The key problem when evaluating the effects of ADHD and its treatment on human capital
formation is how to identify relevant counterfactuals. For every child in pharmacological treatment
for ADHD, we would ideally like to know his or her outcome in the absence of treatment. Since this
is never observed, we instead ask the question: how do we find a non-treated candidate who is
similar in terms of observable and unobservable characteristics except for the fact the he is not
being treated? In order to credibly identify causal effects, we exploit plausible exogenous variation
in access to pharmacological treatment generated by variation in psychiatrists‟ propensity to
prescribe: imagine two children, both diagnosed with ADHD and with the same characteristics; one
will be treated but only because he meets a psychiatrist with preferences for using pharmacological
treatment while the other does not. This strategy is inspired by Duggan (2005) and Doyle (2007,
2008) as described above.
9
Let Y indicate a human capital outcome such as criminal behavior. X is a set of observable
characteristics that determines both the propensity to receive pharmacological treatment and the
outcome. PH is an indicator for receiving pharmacological treatment for ADHD.
Consider now a random coefficient model a la Björklund and Moffit (1987):
(1) iiiii PHXY
or alternatively
(2) iiiiii PHPHXY )( ,
where the term in the squared brackets is the error term. Clearly, PH may be correlated with ε if, for
example, an omitted variable such as parental preference leads to an increased likelihood of
pharmacological treatment. Also, PH may be correlated with α if pharmacological treatment is
based on expected (and foreseeable) gains. To solve this, we implement an instrumental variables
strategy that exploits psychiatrists‟ propensities to prescribe.
Observable and unobservable child and parental characteristics (X and θ) may affect whether the
child with ADHD receives pharmacological treatment (PH = 1), yet the prescribing specialist
physicians are instrumental in making the decision; see details below. Let Z be a measure of the
physician‟s propensity to prescribe. A model of pharmacological treatment could be:
(3)
Had we had a binary instrument (some physicians have a high propensity to prescribe, whereas
others have a low propensity), the IV analysis would provide us with the Local Average Treatment
Effect (LATE) while assuming that the physician‟s propensity to prescribe positively affects the
likelihood that a given child diagnosed with ADHD receives pharmacological treatment. This is
clearly testable (formally, we test the null γ = 0). A second, un-testable, identifying assumption is
that physicians do not affect children‟s outcomes beyond their choice of treatment. Therefore, it is
crucial that individuals are not selective in their choice of physician; see discussion below. A final
assumption (already imposed in (3) via the common coefficient γ) is monotonicity: if child i
receives pharmacological treatment when met with a physician with a low propensity to prescribe,
then child i must also receive treatment if met with a physician with a high propensity to prescribe.
10
Our instrument is, however, continuous rather than binary. With the IV strategy we therefore
identify an Average Marginal Treatment Effect (MTE) rather than the usual LATE. This parameter
is the average treatment effect for children on the margin of receiving pharmacological treatment.
A concern with our main instrument that exploits variation in the tendency to treat other children at
the ward is so-called treatment by indication: physicians who are observed to treat more just do so
because they meet children who suffer from more severe ADHD. We therefore test the robustness
of our main results to using an alternative and novel instrument, namely the share of treated among
other children with weak symptoms as proxied by a low number of pre-treatment injuries. This is
precisely an attempt to hold fixed the severity of ADHD.
III.B Individual level panel data strategy
In practice treatment for 6 months or more per year is rarely initiated before the age of five and
never before the age of four.6 For health outcomes, where we have access to individual level panel
data, we therefore also employ a difference-in-differences strategy, comparing outcomes for treated
children prior to (age 4) and after treatment (in our main analysis age 10 +) with untreated
diagnosed children before and after, corresponding to a fixed effects or first difference analysis; see
Blundell and Costa Dias (2009). In a world with heterogeneous treatment effects, this will provide
estimates of the average treatment effect on the treated (ATET). See Lechner (2011) for an
extensive discussion of strengths and weaknesses associated with difference-in-differences
strategies.
This identification strategy allows for selection into treatment based on, for instance, severity of
symptoms or parental characteristics as long as these influences are constant over time. Thus, if
particularly attentive parents are systematically more (or less) likely to engage in pharmacological
treatment and more (or less) likely to use health care services at any time, this does not violate the
identifying assumptions. However, if attentive parents are more (or less) likely to engage in
pharmacological treatment but only more (or less) likely to use health care services when children
are below 5, this would indeed violate the identifying assumptions.
6 We exclude one child treated before the age of five.
11
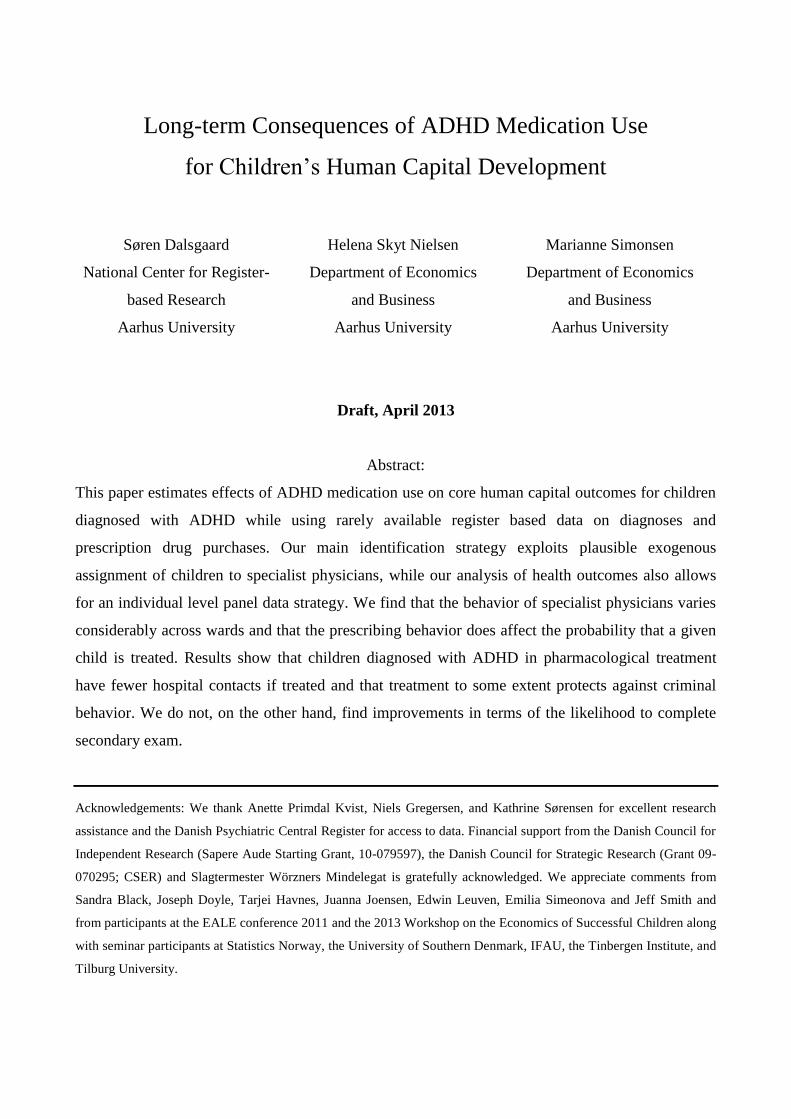
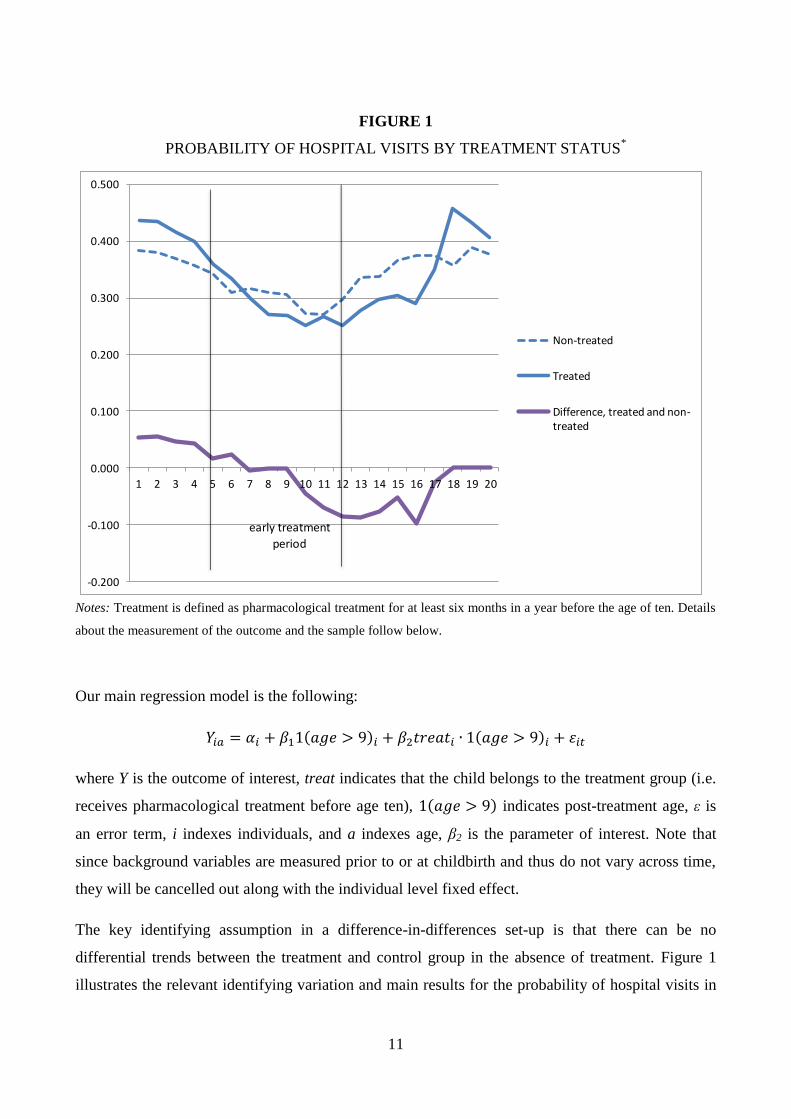
FIGURE 1
PROBABILITY OF HOSPITAL VISITS BY TREATMENT STATUS*
-0.200
-0.100
0.000
0.100
0.200
0.300
0.400
0.500
1 2 3 4 5 6 7 8 9 10 11 12 13 14 15 16 17 18 19 20
Non-treated
Treated
Difference, treated and non-treated
early treatment
period
Notes: Treatment is defined as pharmacological treatment for at least six months in a year before the age of ten. Details
about the measurement of the outcome and the sample follow below.
Our main regression model is the following:
where Y is the outcome of interest, treat indicates that the child belongs to the treatment group (i.e.
receives pharmacological treatment before age ten), indicates post-treatment age, ε is
an error term, i indexes individuals, and a indexes age, β2 is the parameter of interest. Note that
since background variables are measured prior to or at childbirth and thus do not vary across time,
they will be cancelled out along with the individual level fixed effect.
The key identifying assumption in a difference-in-differences set-up is that there can be no
differential trends between the treatment and control group in the absence of treatment. Figure 1
illustrates the relevant identifying variation and main results for the probability of hospital visits in
12
a given year.7 The figure demonstrates that treated children have a higher probability of interacting
with general hospitals prior to diagnosis and treatment than non-treated children, but that (except
for the year of birth when children are very rarely exposed to injury) the development is otherwise
parallel. After the diagnosis is established and treatment is initiated), this tendency is reversed,
however. After the age of seven, treated children – who were initially more disadvantaged –
perform better than non-treated children.
IV. Institutional Set-up
This section describes the decision stages and agents involved in diagnosing and treating ADHD.
We consider three stages: The first step involves the seeking of a referral for evaluation at the
specialist-level, the second step the establishment of a diagnosis, and the final step the treatment
decision.
III.A Seeking of a diagnosis and physician assignment
Parents – and if not parents then in some cases teachers or school nurses – decide whether to seek a
referral for evaluation in the first place. Typically, this involves a visit to the family‟s general
practitioner (GP) who serves as a gatekeeper for specialist treatment. The GP can then – if he agrees
with the indications – provide parents with a referral to a specialist, either employed at a child and
adolescent psychiatric outpatient clinic at general hospitals or at a private clinic. In the vast majority
of cases, relevant specialist physicians are child and adolescent psychiatrists, but pediatricians and
neurologists also do assessments and diagnose.
In Denmark, consultations with the GP are free of charge (for the parents) as are those with
specialist physicians when equipped with a referral from the GP. Whether patients end up with a
specialist employed at general hospitals or at private clinics depends on the available specialist
services in the area and whether the child and adolescent psychiatric outpatient clinic at the local
general hospital is overbooked. Patients are assigned an available relevant physician at the
psychiatric hospital or ward. It is possible to consult with a specialist at a private clinic without a
GP reference, but parents must then pay the costs themselves.
7 The picture is similar if we consider other outcomes. Contacts with general hospitals are shown in Figure A2 in the
Appendix.
13
III.B Diagnoses
In Denmark, the International Classification of Diseases (ICD) diagnostic manual developed by
WHO is used for diagnostic purposes.8 Recently, the Danish Association for Child and Adolescent
Psychiatry has published a so-called reference program for ADHD that examines the current
evidence for diagnostic tools and treatment practices; see the Danish Association for Child and
Adolescent Psychiatry (2008). Measurements of psychopathology such as the Child Behavior
Checklist (CBCL) has been standardized in Danish (Bilenberg, 1999) and has been part of the
standard clinical assessment in most child and adolescent psychiatric clinics in Denmark since the
early 1990‟ies. Multi-informants are always used in the assessment of children at hospital-based
child and adolescent psychiatric units and a standard assessment often includes a direct observation
of the child by a trained psychiatric nurse at the day-care/school and at home with the family is
often part of the assessment and also a test of the cognitive level by a psychologist.
III.C Pharmacological treatment
Given an ADHD diagnosis, the specialist may recommend pharmacological treatment. This
typically implies treatment with Methylphenidate and is the case for 98% of the children in our
sample with an ADHD diagnosis established and in treatment before the age of ten.
Methylphenidate is almost exclusively used to treat ADHD symptoms.9 Medications used in the
treatment of ADHD all act to increase brain catecholamine level. Although Methylphenidate has
been used therapeutically for more than 60 years, the precise prefrontal cortical and subcortical
mechanisms of action are poorly understood, but are associated with its ability to block the
dopamine and norepinephrine re-uptake transporters (Solanto (1998)). It is well-known, however,
that dopamine increases attention, interest and motivation. Common side effects are insomnia,
headaches, decreased appetite, increased blood pressure and heart rate, and symptoms of depression
and anxiety.
Parents may, of course, refuse pharmacological treatment. Thus, both the specialist a child meets,
the severity of early symptoms, and parental preferences may impact on the likelihood of being
8 ADHD is classified as an F90 diagnosis. This covers hyperkinetic disorders, activity and attention disorders, other
hyperkinetic behavioral disorders, and hyperkinetic behavioral disorders without further specification. See WHO
(1993).
9 It may, however, also be used to treat the rare condition of narcolepsy.
14
treated. Regardless of the choice of pharmacological treatment and the severity of the condition, the
reference program advises that children with an ADHD diagnosis are offered social skills training.
V. Data
Our starting point is the population of Danish children born in the period from 1990-1999. The
main data stem from the Danish Psychiatric Central Register; see Munk-Jørgensen and Mortensen
(1997) for a detailed description. These data include information about psychiatric history and
diagnoses for parents and children diagnosed with Danish general hospitals. The data cover the
period from 1960-2010 for the adult population but before 1994, information about children‟s
psychiatric diagnoses was not available. Because it is extremely rare that children are diagnosed
before age 4, we include children born as early as 1990.
The psychiatric registers are not constructed for research, but for administrative purposes.
Diagnoses are therefore clinical diagnoses, not the result of a systematic well-described uniform
psychiatric assessment. The validity of the diagnoses of ADHD in the Danish Psychiatric Central
Register has previously been shown to be good, however. The agreement percentage on a full
diagnosis of ADHD according to the American Diagnostic and Statistical Manual of Mental
Disorders, Fourth Edition (DSM-IV) was 89%, while the remaining 11% lacked only 1 symptom to
fulfill the ADHD diagnosis (Linnet et al. (2009)).
Via unique personal identifiers, the information from the Danish Psychiatric Central Register is
merged with registers containing rich socio-economic background variables (from 1980-2007), in-
patient somatic disease histories (from 1980-2010), and prescription drug usage including data for
both parents and children (from 1997-2010). Finally, we have educational information including
indicators for whether children take course specific exams after 9th
grade and the associated test
scores up until 2010 in addition to information about individual level criminal behavior. Our crime
data stem from two sources: a) the official crime register that records charges from the age of 15
(the age of criminal responsibility) up until 2011 and b) national police records of all interactions
regardless of the age of the involved parties up until 2012.
V.A Variables and samples
15
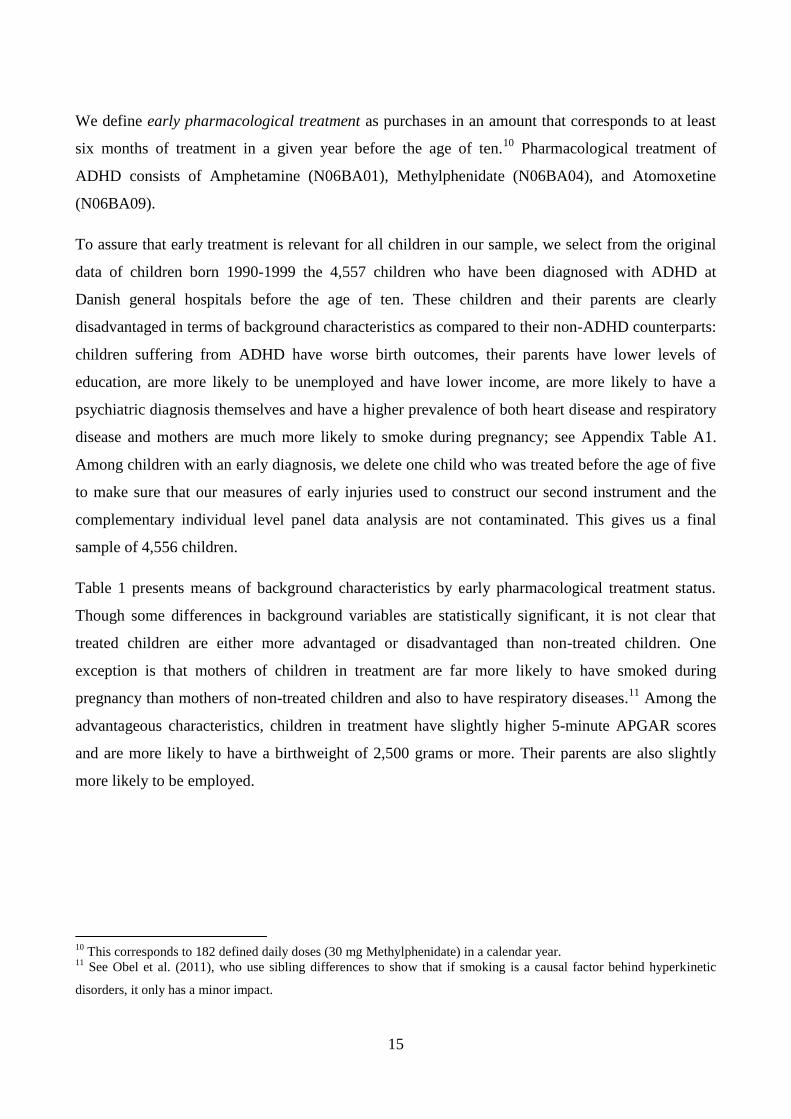
We define early pharmacological treatment as purchases in an amount that corresponds to at least
six months of treatment in a given year before the age of ten.10
Pharmacological treatment of
ADHD consists of Amphetamine (N06BA01), Methylphenidate (N06BA04), and Atomoxetine
(N06BA09).
To assure that early treatment is relevant for all children in our sample, we select from the original
data of children born 1990-1999 the 4,557 children who have been diagnosed with ADHD at
Danish general hospitals before the age of ten. These children and their parents are clearly
disadvantaged in terms of background characteristics as compared to their non-ADHD counterparts:
children suffering from ADHD have worse birth outcomes, their parents have lower levels of
education, are more likely to be unemployed and have lower income, are more likely to have a
psychiatric diagnosis themselves and have a higher prevalence of both heart disease and respiratory
disease and mothers are much more likely to smoke during pregnancy; see Appendix Table A1.
Among children with an early diagnosis, we delete one child who was treated before the age of five
to make sure that our measures of early injuries used to construct our second instrument and the
complementary individual level panel data analysis are not contaminated. This gives us a final
sample of 4,556 children.
Table 1 presents means of background characteristics by early pharmacological treatment status.
Though some differences in background variables are statistically significant, it is not clear that
treated children are either more advantaged or disadvantaged than non-treated children. One
exception is that mothers of children in treatment are far more likely to have smoked during
pregnancy than mothers of non-treated children and also to have respiratory diseases.11
Among the
advantageous characteristics, children in treatment have slightly higher 5-minute APGAR scores
and are more likely to have a birthweight of 2,500 grams or more. Their parents are also slightly
more likely to be employed.
10
This corresponds to 182 defined daily doses (30 mg Methylphenidate) in a calendar year. 11
See Obel et al. (2011), who use sibling differences to show that if smoking is a causal factor behind hyperkinetic
disorders, it only has a minor impact.

16
TABLE 1
OBSERVABLE CHARACTERISTICS AT CHILDBIRTH, 4,556 CHILDREN BORN 1990-1999
WITH AN ADHD DIAGNOSIS ESTABLISHED BEFORE THE AGE OF TEN
Variable
Mean Std. Dev. Mean Std. Dev.
Child:
Boy (0/1) 0.86 0.35 0.83 0.37
5-minute APGAR score 9.78 0.86 9.71 1.20
Birthweight less than 1,500 grams (0/1) 0.02 0.12 0.02 0.14
Birthweight, 1,500-2,500 grams (0/1) 0.06 0.23 0.07 0.26
Birthweight, above 2,500 grams (0/1) 0.93 0.3 0.91 0.29
Complications at birth (0/1) 0.32 0.47 0.27 0.44
Gestation length (weeks) 39.28 2.53 39.17 2.53
Mental retardation (0/1) 0.12 0.33 0.11 0.31
Mother:
Age at childbirth 27.93 4.85 28.24 5.28
High school or less (0/1) 0.50 0.50 0.53 0.50
Length of education (years) 11.40 2.31 11.41 2.30
Unemployed less than 13 weeks (0/1) 0.82 0.38 0.79 0.41
Unemployed 13-26 weeks (0/1) 0.12 0.33 0.14 0.35
Unemployed more than 26 weeks (0/1) 0.06 0.24 0.07 0.25
Employed in November (0/1) 0.54 0.50 0.50 0.50
Gross income (2004 prices) 176823 69947 172928 76761
Psychiatric diagnosis (0/1) 0.10 0.30 0.10 0.30
Heart disease (0/1) 0.03 0.18 0.03 0.17
Respiratory disease (0/1) 0.21 0.41 0.18 0.38
Smoker (0/1) 0.24 0.43 0.16 0.36
Father:
Age at child birth 30.99 6.06 31.34 6.34
High school or less (0/1) 0.44 0.50 0.44 0.50
Length of education (years) 11.29 2.31 11.34 2.39
Unemployed less than 13 weeks (0/1) 0.86 0.35 0.84 0.37
Unemployed 13-26 weeks (0/1) 0.08 0.27 0.08 0.27
Unemployed more than 26 weeks (0/1) 0.06 0.24 0.09 0.28
Employed in November (0/1) 0.86 0.35 0.84 0.37
Gross income (2004 prices) 264250 128305 256665 152014
Psychiatric diagnosis (0/1) 0.08 0.27 0.08 0.26
Heart disease (0/1) 0.04 0.20 0.04 0.19
Respiratory disease (0/1) 0.14 0.35 0.13 0.34
No treatment
before age 10
Treatment
before age 10
Notes: Bold indicates that mean for treated children is significantly different from the mean for non-treated children at
the 5 % level. With the exception of mental retardation, which is diagnosed in connection with the ADHD diagnosis, all
variables are measured in the year just prior to the birth of the child or in connection with childbirth. One child is
excluded because of treatment before age 5.

17
Our sample corresponds to about 0.6 % of the children in the relevant cohorts. The share of a cohort
diagnosed with ADHD before the age of ten has been increasing from 0.3 % in the 1990 cohort to
1.2 % in the 1999 cohort and boys are almost four times more likely than girls to receive an ADHD
diagnosis; see Appendix Table A2. Similarly, among children diagnosed early, the share in early
treatment increases across cohorts from 19 % in the 1990 cohort to 43 % in the 1999 cohort; see
Appendix table A3.
Treated children may, of course, continue in treatment and also non-treated children may receive
treatment later in life. This is important to be aware of when interpreting our formal results below.
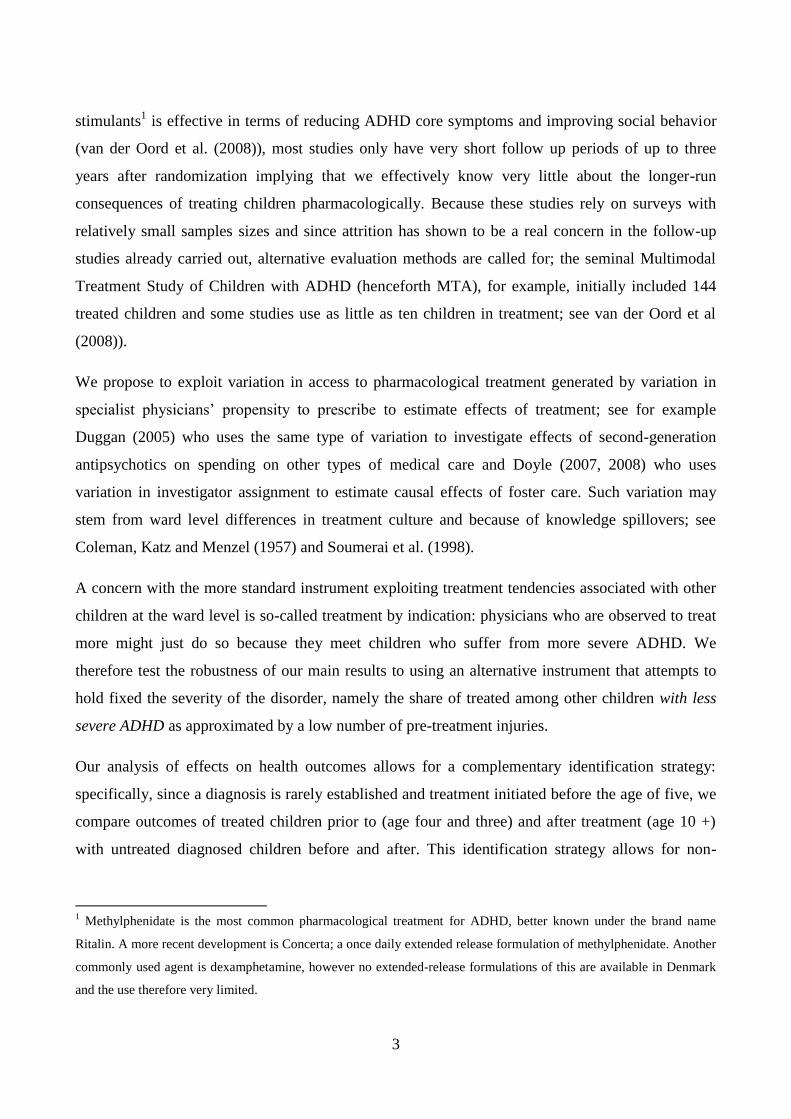
Figure 2 shows the share of children receiving any pharmacological treatment for ADHD at age ten
or later by their early treatment status. We see that most children in early treatment continue after
the age of nine but the share is declining with age. Children who are treated for less than six months
before the age of ten (our non-treated children) also receive some pharmacological treatment at age
ten and later but are much less likely to do so. Again, the share decreases with age. Strictly
speaking, therefore, we measure the effects of early treatment initiation including the effects of
continuing.
FIGURE 2
PROBABILITY OF RECEIVING TREATMENT FOR AT LEAST 6 MONTHS
AT A GIVEN AGE, 4,556 CHILDREN BORN 1990-1999 WITH AN ADHD DIAGNOSIS
ESTABLISHED BEFORE THE AGE OF TEN.
0.0
0.1
0.2
0.3
0.4
0.5
0.6
0.7
0.8
0.9
10 11 12 13 14 15 16 17 18
Treated
Non-treated
Notes: Treatment status is defined as pharmacological treatment for at least six months in a year before the age of ten.
One child excluded because of treatment before age 5.

18
While there were no large differences in background characteristics for the groups of treated and
non-treated children, as seen in Figure 1 above treated children do exhibit more risky health
behavior prior to treatment than non-treated children in that they have more contacts with general
hospitals. Table 2 documents that treated children also have more early injuries than non-treated
children.
TABLE 2
RELATIONSHIP BETWEEN PRE-TREATMENT INJURIES AND
EARLY TREATMENT RECEIPT, 4,556 CHILDREN BORN 1990-1999 WITH
AN ADHD DIAGNOSIS ESTABLISHED BEFORE THE AGE OF TEN
Variable Mean Standard error Mean Standard error
At least one injury
- at age 0 0.023 0.004 0.023 0.003
- at age 1 0.162 0.010 0.120 0.006
- at age 2 0.218 0.012 0.192 0.008
- at age 3 0.238 0.012 0.209 0.008
- at age 4 0.231 0.012 0.203 0.008
ADHD medication
before age ten before age ten
No ADHD medication
Notes: Bold (italic) indicates that means are significantly different at the 5 % (10 %) level.
We interpret this type of early health behavior as a proxy for the severity of ADHD in a child and
we exploit this directly in the construction of the instrument based on psychiatrists‟ propensity to
treat other children with less severe ADHD in the formal analysis below. Section VI.A will explain
the instrument in details. Of course, it will also be important to control for early symptoms at the
individual level.
Our estimations will consider three types of outcomes: health outcomes (one or more contacts with
general hospitals at age 10, number of contacts with general hospitals at age 10; one or more
contacts with the emergency ward at age 10; number of contacts with the emergency ward at age
10), 12
crime outcomes (one or more interactions and number of interactions with the police at ages
12-15 15; at least one charge at ages 16 and 17), and schooling outcomes (whether the child took 9th
grade exam in Danish, the associated standardized exam grade, and the standardized end-of-year
12
Excluding hospital visits associated with the treatment of ADHD
19
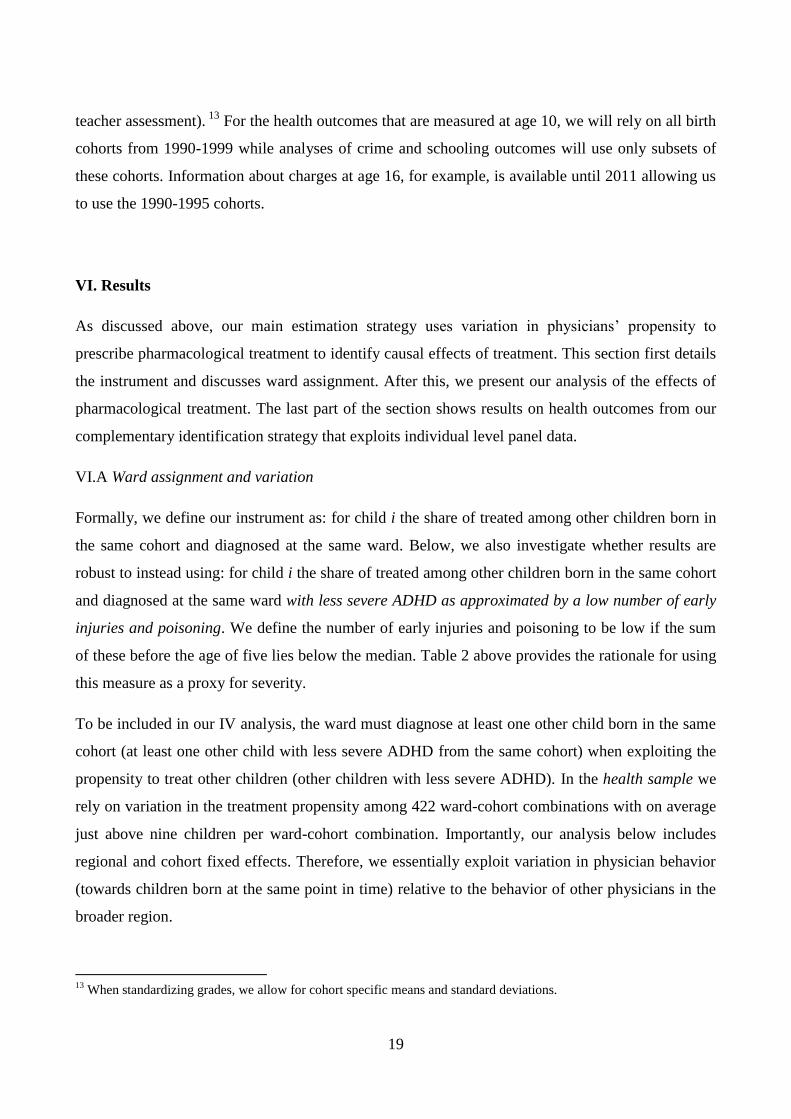
teacher assessment). 13
For the health outcomes that are measured at age 10, we will rely on all birth
cohorts from 1990-1999 while analyses of crime and schooling outcomes will use only subsets of
these cohorts. Information about charges at age 16, for example, is available until 2011 allowing us
to use the 1990-1995 cohorts.
VI. Results
As discussed above, our main estimation strategy uses variation in physicians‟ propensity to
prescribe pharmacological treatment to identify causal effects of treatment. This section first details
the instrument and discusses ward assignment. After this, we present our analysis of the effects of
pharmacological treatment. The last part of the section shows results on health outcomes from our
complementary identification strategy that exploits individual level panel data.
VI.A Ward assignment and variation
Formally, we define our instrument as: for child i the share of treated among other children born in
the same cohort and diagnosed at the same ward. Below, we also investigate whether results are
robust to instead using: for child i the share of treated among other children born in the same cohort
and diagnosed at the same ward with less severe ADHD as approximated by a low number of early
injuries and poisoning. We define the number of early injuries and poisoning to be low if the sum
of these before the age of five lies below the median. Table 2 above provides the rationale for using
this measure as a proxy for severity.
To be included in our IV analysis, the ward must diagnose at least one other child born in the same
cohort (at least one other child with less severe ADHD from the same cohort) when exploiting the
propensity to treat other children (other children with less severe ADHD). In the health sample we
rely on variation in the treatment propensity among 422 ward-cohort combinations with on average
just above nine children per ward-cohort combination. Importantly, our analysis below includes
regional and cohort fixed effects. Therefore, we essentially exploit variation in physician behavior
(towards children born at the same point in time) relative to the behavior of other physicians in the
broader region.
13
When standardizing grades, we allow for cohort specific means and standard deviations.

20
In this section, we conservatively present the results for the instruments while relying on the larger
health sample. Our conclusions do not change when considering the smaller estimation samples; in
fact because of the smaller sample size, the set of tests that we apply to our instruments to render
probable that the identifying assumptions are not violated obviously have less power with fewer
observations.
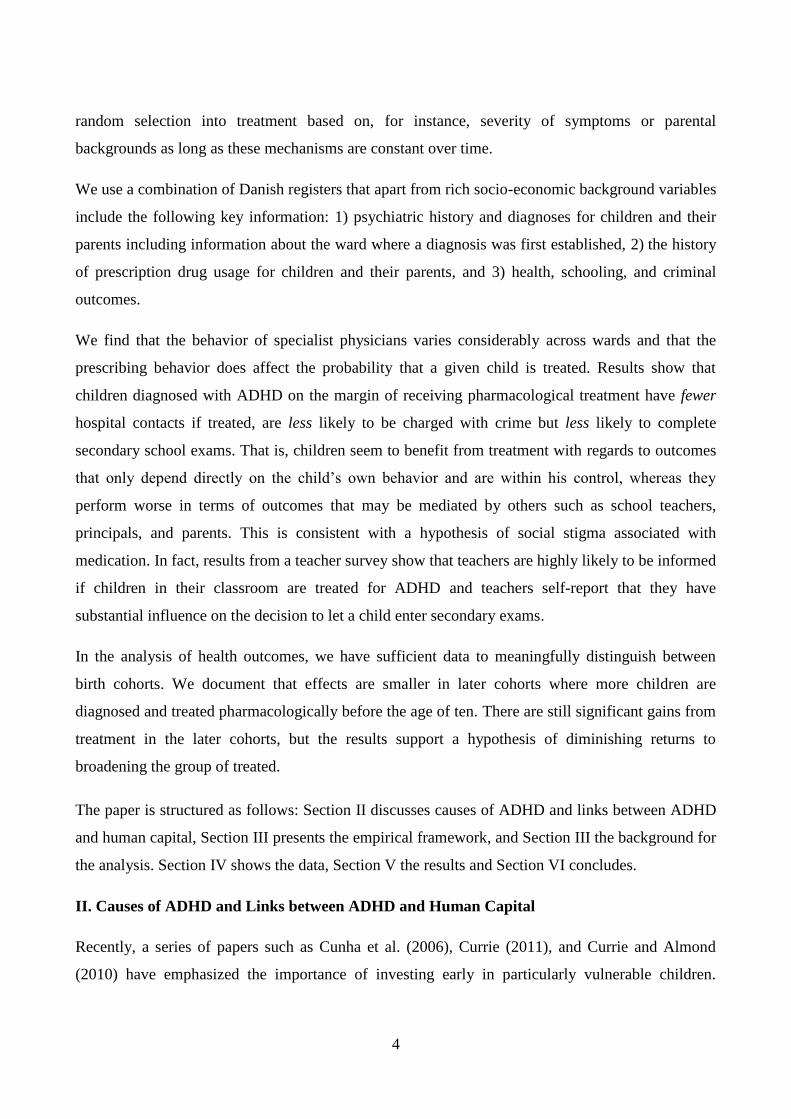
Figure 3 shows the distributions of the propensity to prescribe. Clearly, there is very little support
above values of 0.6. In practice, we will rely on variation in the instrument that lies strictly within
the area of support and the results should be interpreted accordingly.
FIGURE 3
DISTRIBUTION OF PHYSICIANS‟ PROPENSITY TO PRESCRIBE (HOSPITAL LEVEL)
Notes: The propensity to prescribe is defined as the share of other children born in the same cohort and diagnosed at the
same ward.
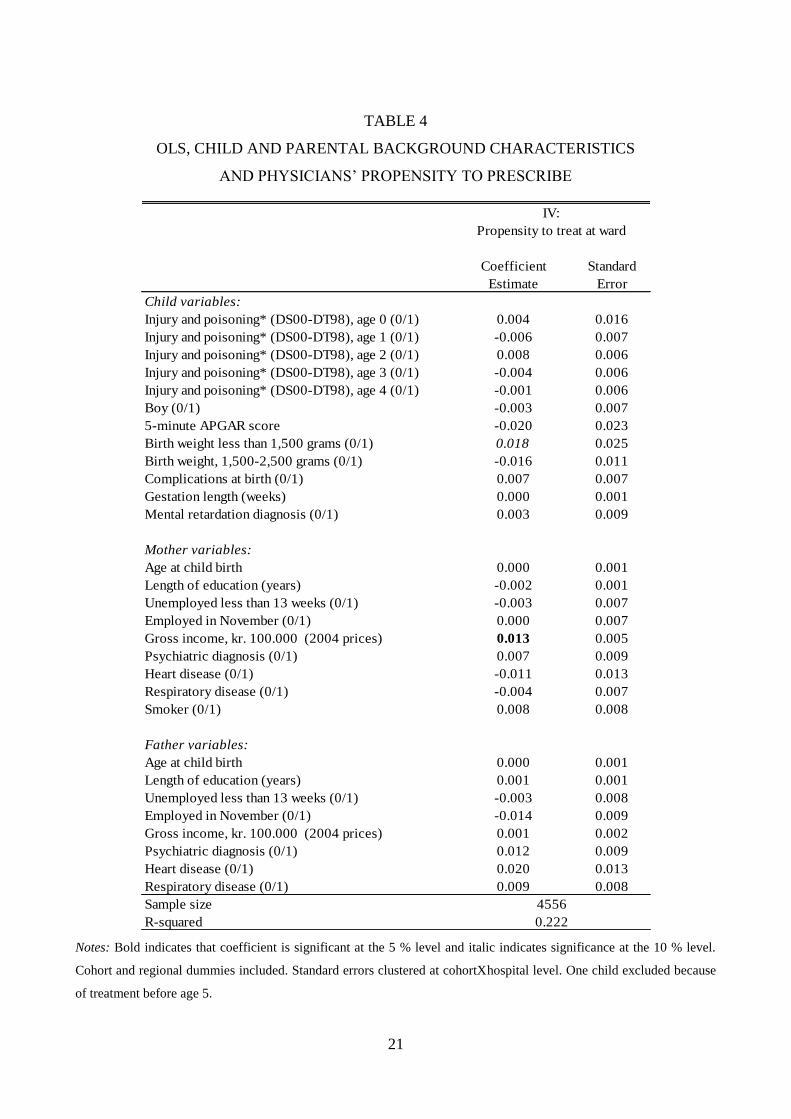
Table 4 shows how the instrument relates to background characteristics of the child and his family
(and simple hospital characteristics). We simply regress the treatment propensity (at the child level)
on the set of background variables and report the coefficient estimates. Standard errors are clustered
at the cohort-ward level to allow for correlation between children diagnosed at the same ward and
born in the same cohort. We find that although a few coefficients are statistically significant, most
are small in size.
0
.02
.04
.06
.08
.1
Fra
ction
0 .2 .4 .6 .8 1Propensity to prescribe
21
TABLE 4
OLS, CHILD AND PARENTAL BACKGROUND CHARACTERISTICS
AND PHYSICIANS‟ PROPENSITY TO PRESCRIBE
Coefficient Standard
Estimate Error
Child variables:
Injury and poisoning* (DS00-DT98), age 0 (0/1) 0.004 0.016
Injury and poisoning* (DS00-DT98), age 1 (0/1) -0.006 0.007
Injury and poisoning* (DS00-DT98), age 2 (0/1) 0.008 0.006
Injury and poisoning* (DS00-DT98), age 3 (0/1) -0.004 0.006
Injury and poisoning* (DS00-DT98), age 4 (0/1) -0.001 0.006
Boy (0/1) -0.003 0.007
5-minute APGAR score -0.020 0.023
Birth weight less than 1,500 grams (0/1) 0.018 0.025
Birth weight, 1,500-2,500 grams (0/1) -0.016 0.011
Complications at birth (0/1) 0.007 0.007
Gestation length (weeks) 0.000 0.001
Mental retardation diagnosis (0/1) 0.003 0.009
Mother variables:
Age at child birth 0.000 0.001
Length of education (years) -0.002 0.001
Unemployed less than 13 weeks (0/1) -0.003 0.007
Employed in November (0/1) 0.000 0.007
Gross income, kr. 100.000 (2004 prices) 0.013 0.005
Psychiatric diagnosis (0/1) 0.007 0.009
Heart disease (0/1) -0.011 0.013
Respiratory disease (0/1) -0.004 0.007
Smoker (0/1) 0.008 0.008
Father variables:
Age at child birth 0.000 0.001
Length of education (years) 0.001 0.001
Unemployed less than 13 weeks (0/1) -0.003 0.008
Employed in November (0/1) -0.014 0.009
Gross income, kr. 100.000 (2004 prices) 0.001 0.002
Psychiatric diagnosis (0/1) 0.012 0.009
Heart disease (0/1) 0.020 0.013
Respiratory disease (0/1) 0.009 0.008
Sample size
R-squared
4556
0.222
IV:
Propensity to treat at ward
Notes: Bold indicates that coefficient is significant at the 5 % level and italic indicates significance at the 10 % level.
Cohort and regional dummies included. Standard errors clustered at cohortXhospital level. One child excluded because
of treatment before age 5.

22
TABLE 5
PROBIT, PROPENSITY TO DIAGNOSE AND PROPENSITY
TO PRESCRIBE (COUNTY LEVEL)
Variable Marginal effect Standard error
Propensity to prescribe 0.0014 0.0011
Controls
Sample size
YES
714677
Notes: Bold indicates that coefficient is significant at the 5 % level and italic indicates significance at the 10 % level.
Conditioning set corresponds to the variables in Table 4 above. Cohort and regional dummies included. Standard errors
clustered at cohortXcounty level.
As discussed above, one issue is treatment by indication. An indirect test of this phenomenon is to
consider the relationship between the instrument and the propensity to diagnose at the population
level: if living in an area where wards treat more heavily also implies that a child from the overall
population is, for example more (or less) likely to be diagnosed in the first place, we would worry
that high treatment wards see different types of children. Table 5 investigates this relationship. We
estimate a probit for diagnosis receipt and condition on the full set of background variables in
addition to the propensity to prescribe at the wards within the county (i.e. the wards a child living
within the county would have a risk of meeting) and conclude that there is little relationship
between the risk of receiving a diagnosis and the original instrument. The results imply that if the
propensity to treat in county increases by 10 percentage points (relative to a mean of 0.32), this will
increase the number of diagnoses relative to the mean with 0.00017/0.006= 2.8 %.
Another issue is whether wards that treat more early also differ in terms of other practices. We saw
above that children who are treated early are also more likely to receive treatment later in their life.
Table 6 documents that wards with a high propensity to prescribe also continue treatment longer.
Table 7, on the other hand, documents that the instruments are not strongly associated with the use
of the five most common other nervous system drugs. One coefficient is significant at the 5 % level
and all are small size.14
In the same way, we also investigate whether our instruments are associated
with age at diagnosis and find no significant effects: an increase in age at diagnosis of one year is
associated with a reduction in the overall propensity to prescribe of 0.002. Strictly speaking,
therefore, our instruments measure the propensity to prescribe more early and to continue longer but 14
Results are robust to excluding children who are treated with these five other types of nervous system drugs.
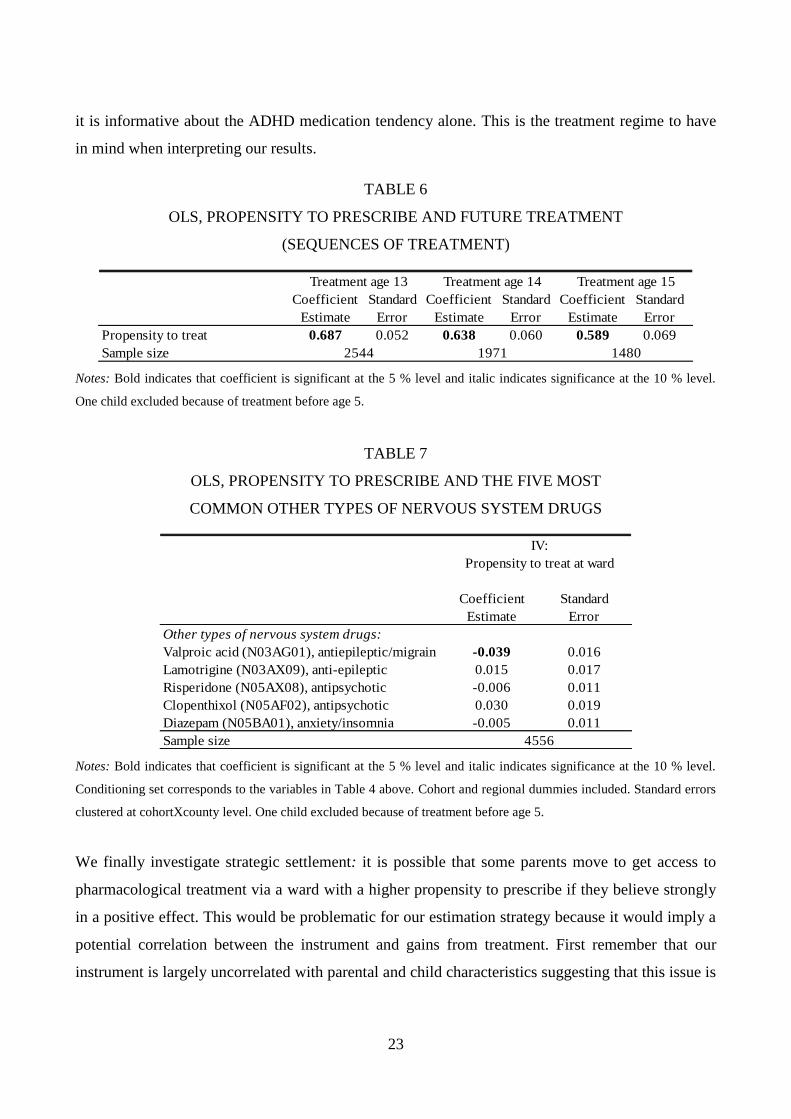
23
it is informative about the ADHD medication tendency alone. This is the treatment regime to have
in mind when interpreting our results.
TABLE 6
OLS, PROPENSITY TO PRESCRIBE AND FUTURE TREATMENT
(SEQUENCES OF TREATMENT)
Coefficient Standard Coefficient Standard Coefficient Standard
Estimate Error Estimate Error Estimate Error
Propensity to treat 0.687 0.052 0.638 0.060 0.589 0.069
Sample size
Treatment age 14 Treatment age 15
2544 1971 1480
Treatment age 13
Notes: Bold indicates that coefficient is significant at the 5 % level and italic indicates significance at the 10 % level.
One child excluded because of treatment before age 5.
TABLE 7
OLS, PROPENSITY TO PRESCRIBE AND THE FIVE MOST
COMMON OTHER TYPES OF NERVOUS SYSTEM DRUGS
Coefficient Standard
Estimate Error
Other types of nervous system drugs:
Valproic acid (N03AG01), antiepileptic/migrain -0.039 0.016
Lamotrigine (N03AX09), anti-epileptic 0.015 0.017
Risperidone (N05AX08), antipsychotic -0.006 0.011
Clopenthixol (N05AF02), antipsychotic 0.030 0.019
Diazepam (N05BA01), anxiety/insomnia -0.005 0.011
Sample size 4556
Propensity to treat at ward
IV:
Notes: Bold indicates that coefficient is significant at the 5 % level and italic indicates significance at the 10 % level.
Conditioning set corresponds to the variables in Table 4 above. Cohort and regional dummies included. Standard errors
clustered at cohortXcounty level. One child excluded because of treatment before age 5.
We finally investigate strategic settlement: it is possible that some parents move to get access to
pharmacological treatment via a ward with a higher propensity to prescribe if they believe strongly
in a positive effect. This would be problematic for our estimation strategy because it would imply a
potential correlation between the instrument and gains from treatment. First remember that our
instrument is largely uncorrelated with parental and child characteristics suggesting that this issue is
24
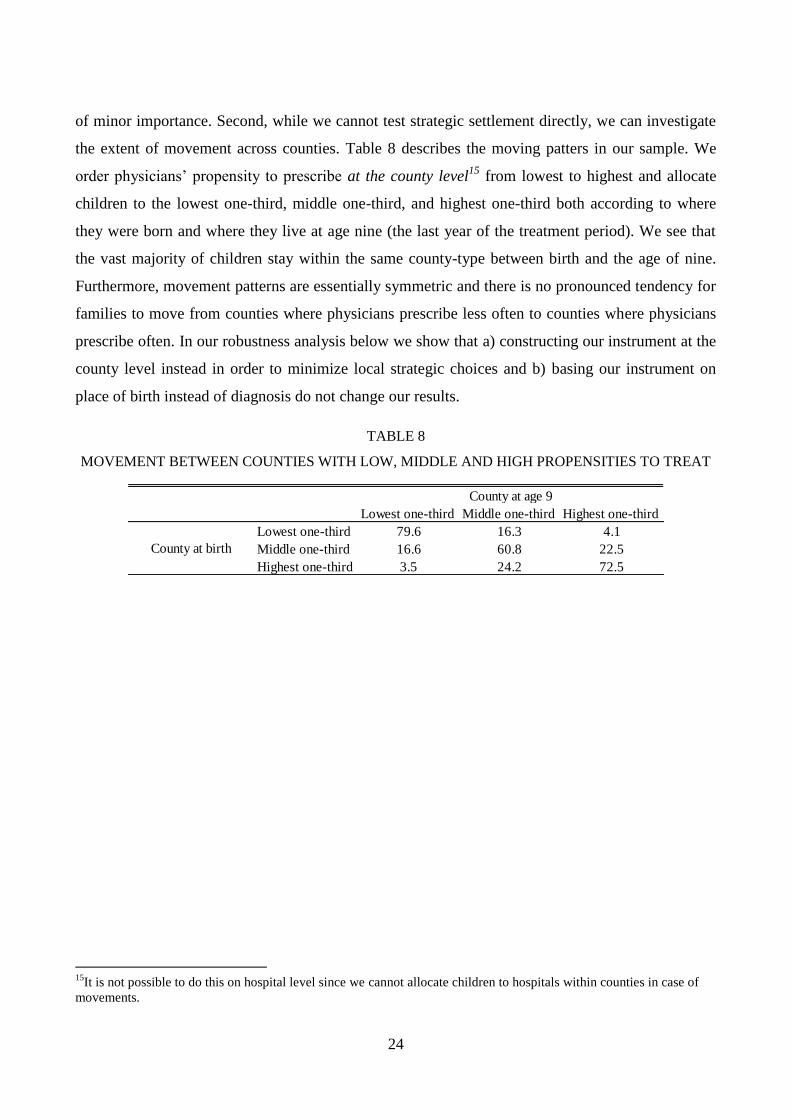
of minor importance. Second, while we cannot test strategic settlement directly, we can investigate
the extent of movement across counties. Table 8 describes the moving patters in our sample. We
order physicians‟ propensity to prescribe at the county level15
from lowest to highest and allocate
children to the lowest one-third, middle one-third, and highest one-third both according to where
they were born and where they live at age nine (the last year of the treatment period). We see that
the vast majority of children stay within the same county-type between birth and the age of nine.
Furthermore, movement patterns are essentially symmetric and there is no pronounced tendency for
families to move from counties where physicians prescribe less often to counties where physicians
prescribe often. In our robustness analysis below we show that a) constructing our instrument at the
county level instead in order to minimize local strategic choices and b) basing our instrument on
place of birth instead of diagnosis do not change our results.
TABLE 8
MOVEMENT BETWEEN COUNTIES WITH LOW, MIDDLE AND HIGH PROPENSITIES TO TREAT
Lowest one-third Middle one-third Highest one-third
Lowest one-third 79.6 16.3 4.1
Middle one-third 16.6 60.8 22.5
Highest one-third 3.5 24.2 72.5
County at birth
County at age 9
15
It is not possible to do this on hospital level since we cannot allocate children to hospitals within counties in case of
movements.
25
TABLE 9
FIRST STAGE RESULTS, HEALTH SAMPLE
Coef. Std. Coef. Std.
Est. Err. Est. Err.
Instruments:
Propensity to treat 0.485 0.054 0.329 0.067
Hospital variables:
Big hospital (0/1) 0.011 0.014
A hospital treating only mild cases of ADHD (0/1) 0.016 0.029
Child variables:
Injury and poisoning* (DS00-DT98), age 0 (0/1) -0.028 0.045
Injury and poisoning* (DS00-DT98), age 1 (0/1) 0.047 0.021
Injury and poisoning* (DS00-DT98), age 2 (0/1) 0.000 0.018
Injury and poisoning* (DS00-DT98), age 3 (0/1) 0.007 0.017
Injury and poisoning* (DS00-DT98), age 4 (0/1) 0.033 0.018
Boy (0/1) 0.053 0.019
5-minute APGAR score -0.013 0.059
Birth weight less than 1,500 grams (0/1) -0.128 0.061
Birth weight, 1,500-2,500 grams (0/1) -0.060 0.033
Complications at birth (0/1) 0.009 0.017
Gestation length (weeks) -0.006 0.004
Mental retardation diagnosis (0/1) 0.034 0.022
Mother variables:
Age at child birth -0.003 0.002
Length of education (years) -0.002 0.004
Unemployed less than 13 weeks (0/1) -0.003 0.032
Unemployed 13-26 weeks (0/1) -0.028 0.036
Employed in November (0/1) 0.025 0.021
Gross income, kr. 100.000 (2004 prices) 0.008 0.013
Psychiatric diagnosis (0/1) -0.002 0.022
Heart disease (0/1) 0.034 0.037
Respiratory disease (0/1) 0.029 0.017
Smoker (0/1) 0.041 0.023
Father variables:
Age at child birth -0.002 0.001
Length of education (years) -0.002 0.004
Unemployed less than 13 weeks (0/1) 0.019 0.029
Unemployed 13-26 weeks (0/1) 0.015 0.038
Employed in November (0/1) 0.020 0.026
Gross income, kr. 100.000 (2004 prices) 0.007 0.006
Psychiatric diagnosis (0/1) 0.013 0.027
Heart disease (0/1) 0.017 0.041
Respiratory disease (0/1) 0.005 0.024
Sample size
R-squared 0.0520.027
4287
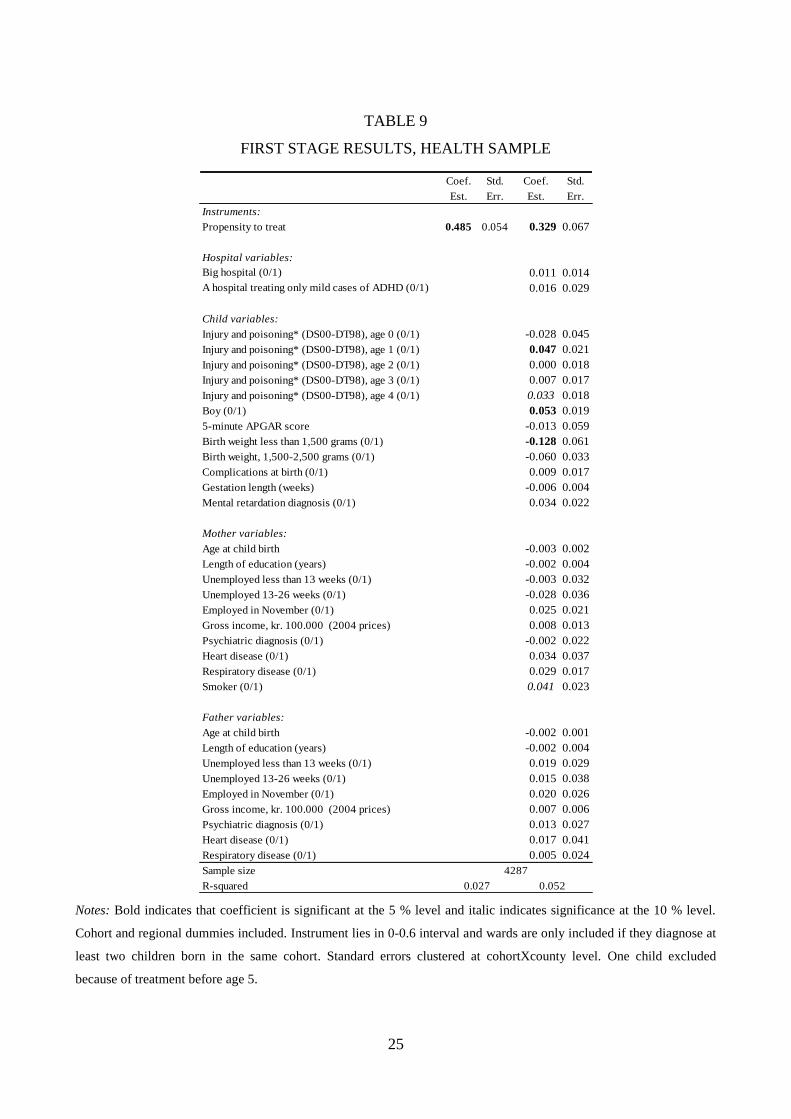
Notes: Bold indicates that coefficient is significant at the 5 % level and italic indicates significance at the 10 % level.
Cohort and regional dummies included. Instrument lies in 0-0.6 interval and wards are only included if they diagnose at
least two children born in the same cohort. Standard errors clustered at cohortXcounty level. One child excluded
because of treatment before age 5.
26
VI.B First stage results
Table 9 shows the first stage results for the health sample. We see that the relationship between the
probability of treatment receipt and the instrument is positive: being exposed to a high-intensity
treatment regime increases the probability that a given child is treated. Results are robust to
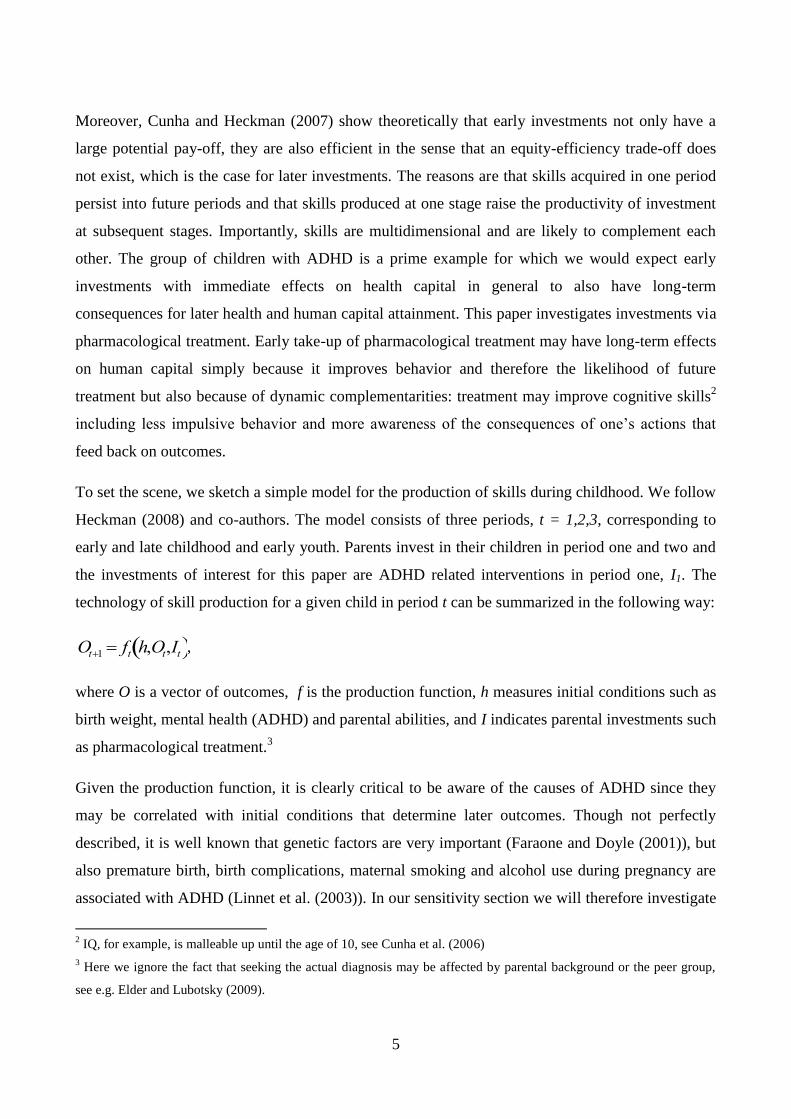
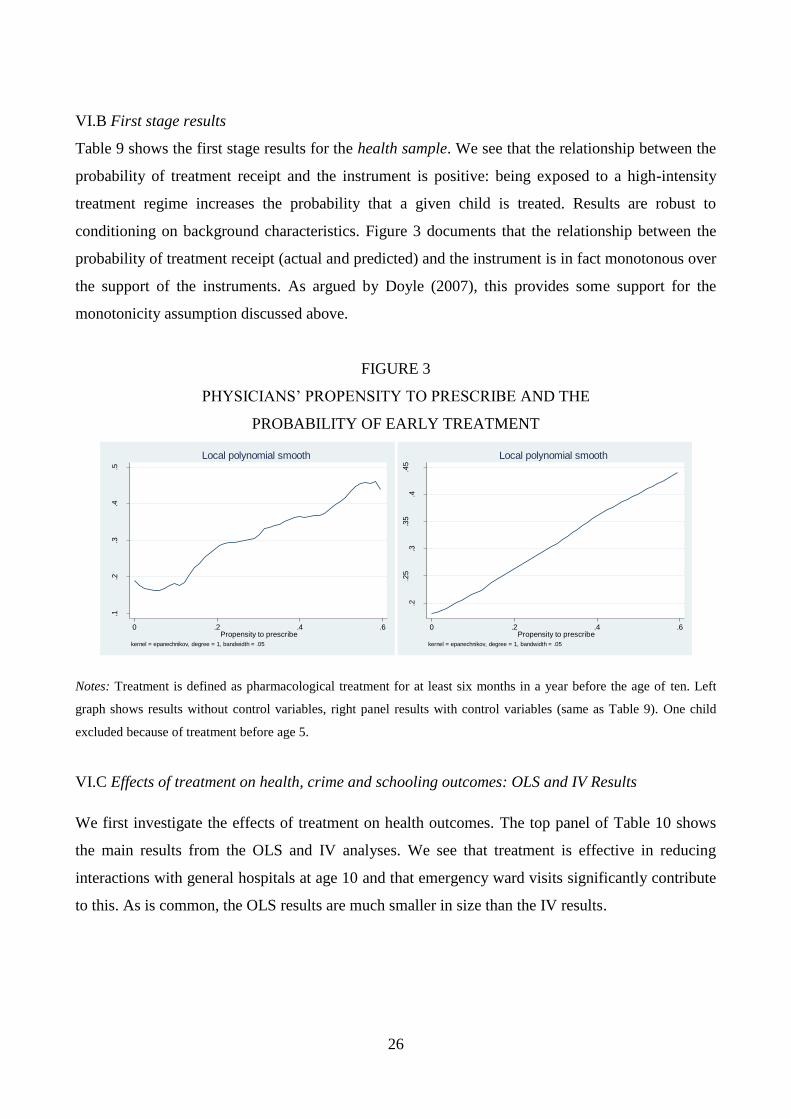
conditioning on background characteristics. Figure 3 documents that the relationship between the
probability of treatment receipt (actual and predicted) and the instrument is in fact monotonous over
the support of the instruments. As argued by Doyle (2007), this provides some support for the
monotonicity assumption discussed above.
FIGURE 3
PHYSICIANS‟ PROPENSITY TO PRESCRIBE AND THE
PROBABILITY OF EARLY TREATMENT
Notes: Treatment is defined as pharmacological treatment for at least six months in a year before the age of ten. Left
graph shows results without control variables, right panel results with control variables (same as Table 9). One child
excluded because of treatment before age 5.
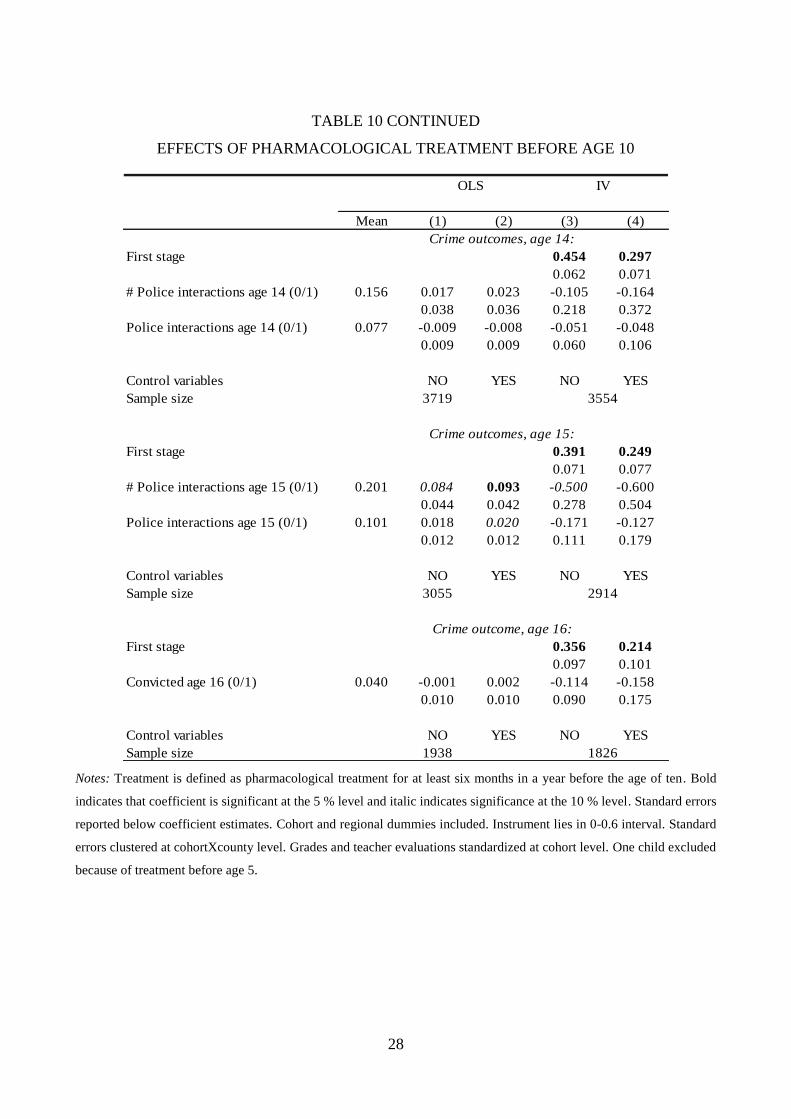
VI.C Effects of treatment on health, crime and schooling outcomes: OLS and IV Results
We first investigate the effects of treatment on health outcomes. The top panel of Table 10 shows
the main results from the OLS and IV analyses. We see that treatment is effective in reducing
interactions with general hospitals at age 10 and that emergency ward visits significantly contribute
to this. As is common, the OLS results are much smaller in size than the IV results.
.1.2
.3.4
.5
Pharm
acolo
gic
al T
reatm
ent
0 .2 .4 .6Propensity to prescribe
kernel = epanechnikov, degree = 1, bandwidth = .05
Local polynomial smooth
.2.2
5.3
.35
.4.4
5
P(P
harm
acolo
gic
al T
reatm
ent|X
)
0 .2 .4 .6Propensity to prescribe
kernel = epanechnikov, degree = 1, bandwidth = .05
Local polynomial smooth

27
TABLE 10
EFFECTS OF PHARMACOLOGICAL TREATMENT BEFORE AGE 10
Mean (1) (2) (3) (4)
First stage 0.485 0.329
0.054 0.066
# Hospital contacts, age 10 0.498 -0.026 -0.027 -0.651 -0.800
0.014 0.014 0.290 0.441
Hospital contacts, age 10 (0/1) 0.278 -0.070 -0.074 -0.134 -0.166
0.034 0.033 0.091 0.156
# Emergency ward visits, age 10 0.233 -0.034 -0.030 -0.285 -0.280
0.018 0.018 0.119 0.203
Emergency ward visits, age 10 (0/1) 0.181 -0.016 -0.014 -0.150 -0.109
0.013 0.013 0.077 0.131
Control variables NO YES NO YES
Sample size
First stage 0.485 0.329
0.054 0.066
# Police interactions age 12 (0/1) 0.041 0.006 0.004 -0.048 -0.171
0.009 0.009 0.056 0.083
Police interactions age 12 (0/1) 0.033 0.002 0.001 -0.054 -0.122
0.006 0.006 0.038 0.065
Control variables NO YES NO YES
Sample size
First stage 0.485 0.329
0.054 0.066
# Police interactions age 13 (0/1) 0.080 0.030 0.029 -0.032 -0.322
0.030 0.029 0.146 0.172
Police interactions age 13 (0/1) 0.045 0.003 0.002 -0.021 -0.144
0.008 0.008 0.041 0.072
Control variables NO YES NO YES
Sample size
Crime outcomes, age 12:
4556 4287
4556 4287
Crime outcomes, age 13:
4556 4287
OLS IV
Health outcomes, age 10:
Notes: Treatment is defined as pharmacological treatment for at least six months in a year before the age of ten. Bold
indicates that coefficient is significant at the 5 % level and italic indicates significance at the 10 % level. Standard errors
reported below coefficient estimates. Cohort and regional dummies included. Instrument lies in 0-0.6 interval. Standard
errors clustered at cohortXcounty level. One child excluded because of treatment before age 5.
28
TABLE 10 CONTINUED
EFFECTS OF PHARMACOLOGICAL TREATMENT BEFORE AGE 10
Mean (1) (2) (3) (4)
First stage 0.454 0.297
0.062 0.071
# Police interactions age 14 (0/1) 0.156 0.017 0.023 -0.105 -0.164
0.038 0.036 0.218 0.372
Police interactions age 14 (0/1) 0.077 -0.009 -0.008 -0.051 -0.048
0.009 0.009 0.060 0.106
Control variables NO YES NO YES
Sample size
First stage 0.391 0.249
0.071 0.077
# Police interactions age 15 (0/1) 0.201 0.084 0.093 -0.500 -0.600
0.044 0.042 0.278 0.504
Police interactions age 15 (0/1) 0.101 0.018 0.020 -0.171 -0.127
0.012 0.012 0.111 0.179
Control variables NO YES NO YES
Sample size
First stage 0.356 0.214
0.097 0.101
Convicted age 16 (0/1) 0.040 -0.001 0.002 -0.114 -0.158
0.010 0.010 0.090 0.175
Control variables NO YES NO YES
Sample size
Crime outcomes, age 14:
OLS IV
1938 1826
Crime outcomes, age 15:
3719 3554
3055 2914
Crime outcome, age 16:
Notes: Treatment is defined as pharmacological treatment for at least six months in a year before the age of ten. Bold
indicates that coefficient is significant at the 5 % level and italic indicates significance at the 10 % level. Standard errors
reported below coefficient estimates. Cohort and regional dummies included. Instrument lies in 0-0.6 interval. Standard
errors clustered at cohortXcounty level. Grades and teacher evaluations standardized at cohort level. One child excluded
because of treatment before age 5.
29
TABLE 10 CONTINUED
EFFECTS OF PHARMACOLOGICAL TREATMENT BEFORE AGE 10
Mean (1) (2) (3) (4)
First stage 0.373 0.229
0.097 0.103
Exam 9th grade, Danish (0/1) 0.379 -0.101 -0.081 -0.601 -0.293
0.028 0.027 0.240 0.374
Control variables NO YES NO YES
Sample size
Exam grade, 9th grade, Danish 0.017 0.126 0.160
0.113 0.123
Teacher evaluation, 9th grade, 0.026 -0.017 -0.026
Danish 0.104 0.107
Control variables NO YES NO YES
Sample size 670
1735 1638
School outcomes:
N/A
OLS IV
Notes: Treatment is defined as pharmacological treatment for at least six months in a year before the age of ten. Bold
indicates that coefficient is significant at the 5 % level and italic indicates significance at the 10 % level. Standard errors
reported below coefficient estimates. Cohort and regional dummies included. Instrument lies in 0-0.6 interval. Standard
errors clustered at cohortXcounty level. Grades and teacher evaluations standardized at cohort level. One child excluded
because of treatment before age 5.
The next set of results concern criminal convictions. The OLS results suggest no or even increases
in criminal behavior due to treatment. This pattern is reversed in the IV analyses; here we find large
and significant gains from treatment at ages 12-13. Parameter estimates are similar at older ages
though, possibly because of smaller samples, primarily insignificant.
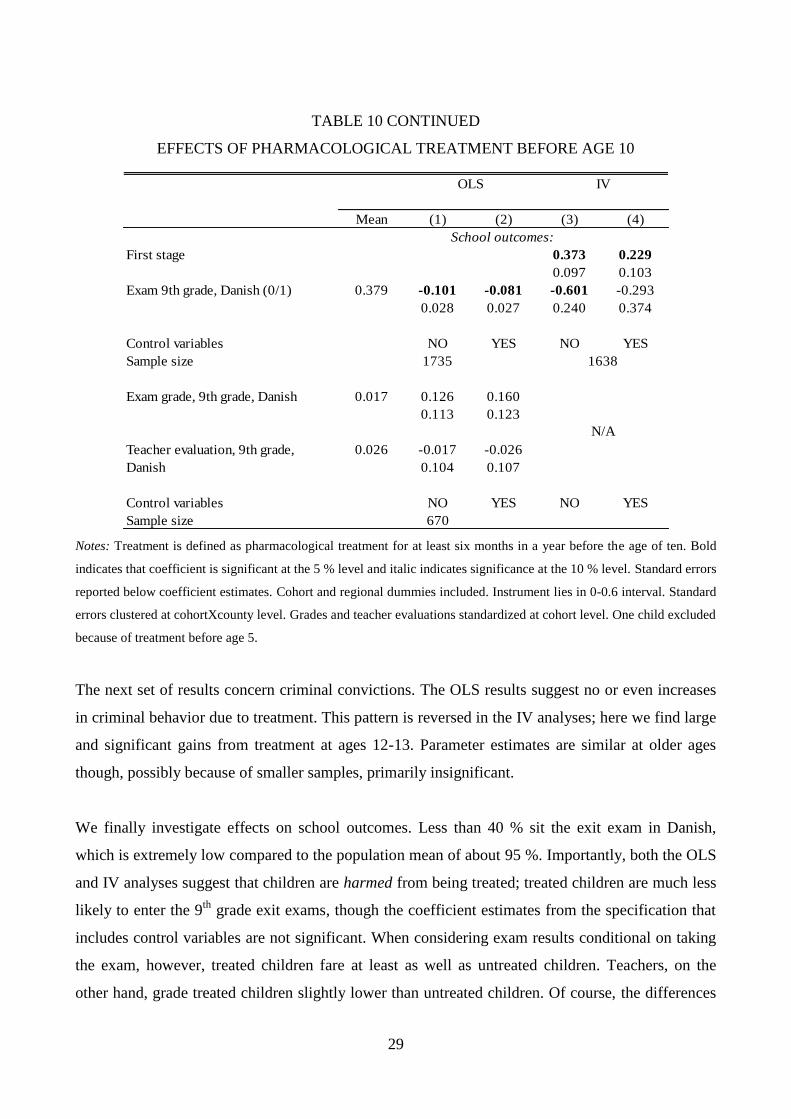
We finally investigate effects on school outcomes. Less than 40 % sit the exit exam in Danish,
which is extremely low compared to the population mean of about 95 %. Importantly, both the OLS
and IV analyses suggest that children are harmed from being treated; treated children are much less
likely to enter the 9th
grade exit exams, though the coefficient estimates from the specification that
includes control variables are not significant. When considering exam results conditional on taking
the exam, however, treated children fare at least as well as untreated children. Teachers, on the
other hand, grade treated children slightly lower than untreated children. Of course, the differences

30
between the coefficients associated with exam grades and teacher evaluations are not significantly
different. Unfortunately, since a very low share of children diagnosed with ADHD take 9th
grade
exams, our IV strategies fail in these cases. Despite this, our results at least suggest that more
treated children could take a 9th
grade exam while still keeping the average test score among the
treated at least as high as that for the untreated children.
To sum up, children seem to benefit from treatment with regards to outcomes such as hospital visits
and crime that depend directly on the child‟s own behavior and are within his control, whereas they
perform worse in terms of outcomes that are likely to be mediated by others such as school teachers
and principals.
TABLE 11
SELF-REPORTED TEACHER INFORMATION AND INFLUENCE
Are there children in your classroom with ADHD?(N=46)
Yes 0.370
No 0.630
Do you expect to be infored if one of your pupils
has an ADHD diagnosis? (N=46)
Yes, definitely 0.717
Yes, that would be natural 0.283
Maybe 0.000
No, not necessarily 0.000
No, definitely not 0.000
Do you expect to be informed if one of your pupils
is in pharmacological treatment for his ADHD? (N=45)
Yes, definitely 0.622
Yes, that would be natural 0.378
Maybe 0.000
No, not necessarily 0.000
No, definitely not 0.000
Is your recommendation important for whether a
child takes exam after 9th grade? (N=44)
Yes 0.409
Yes, partly 0.455
No 0.136
Notes: Teacher survey sent out to 99 schools in our local area (all school in the municipalities: Aalborg, Aarhus,
Viborg, and Hedensted).
31
To learn more about teachers‟ level of information and their potential influence on our particular
school outcome, we have carried out a teacher survey. As documented by Table 11, teachers self-
report that they would usually be informed about ADHD diagnoses and pharmacological treatment
and that they would have considerable influence on the decision of whether a given child should
take the exam after 9th
grade.
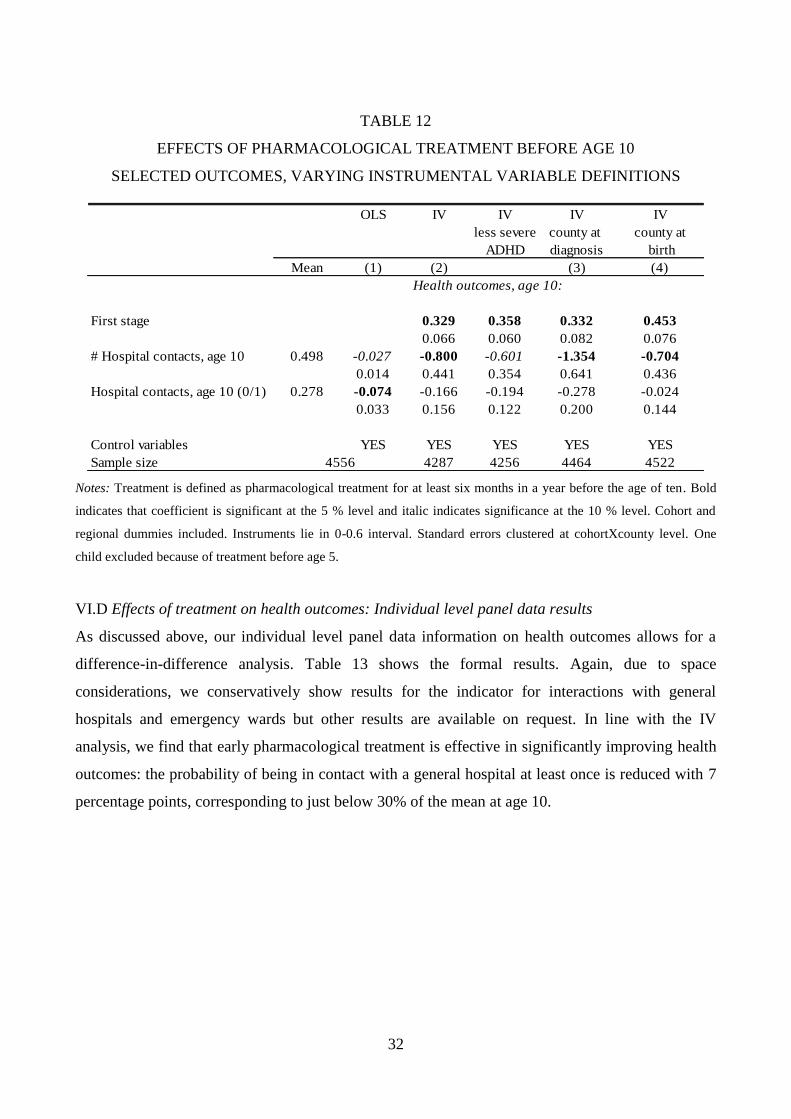
Threats to validity in the IV strategy
We documented above that our instrument measures propensities to prescribe more early and to
continue longer but it is informative about the ADHD medication tendency alone. We also saw that
there is little tendency for families to move to counties where wards treat more intensively. We
formally address issues of treatment by indication and strategic settlement in this section. Due to
space considerations, we restrict ourselves to the main health outcomes. The full set of results is
available on request. First, we use our alternative instrument based on the propensity to treat
children with less severe ADHD. Results are shown in column 3 in Table 12. Second, we address
potential selection of wards within a county by defining our instrument at the county level instead
of at the ward level. In this analysis, county is defined at the time of diagnosis (column 4). Finally,
we investigate strategic settlement in the time between the birth of the child and the actual diagnosis
by using variation in treatment propensities in the birth county (column 5). Results vary a little
between the main specification and the three additional robustness analyses but the overall
conclusion is the same.
32
TABLE 12
EFFECTS OF PHARMACOLOGICAL TREATMENT BEFORE AGE 10
SELECTED OUTCOMES, VARYING INSTRUMENTAL VARIABLE DEFINITIONS
OLS IV IV IV IV
less severe county at county at
ADHD diagnosis birth
Mean (1) (2) (3) (4)
First stage 0.329 0.358 0.332 0.453
0.066 0.060 0.082 0.076
# Hospital contacts, age 10 0.498 -0.027 -0.800 -0.601 -1.354 -0.704
0.014 0.441 0.354 0.641 0.436
Hospital contacts, age 10 (0/1) 0.278 -0.074 -0.166 -0.194 -0.278 -0.024
0.033 0.156 0.122 0.200 0.144
Control variables YES YES YES YES YES
Sample size 4287 4256 4464 45224556
Health outcomes, age 10:
Notes: Treatment is defined as pharmacological treatment for at least six months in a year before the age of ten. Bold
indicates that coefficient is significant at the 5 % level and italic indicates significance at the 10 % level. Cohort and
regional dummies included. Instruments lie in 0-0.6 interval. Standard errors clustered at cohortXcounty level. One
child excluded because of treatment before age 5.
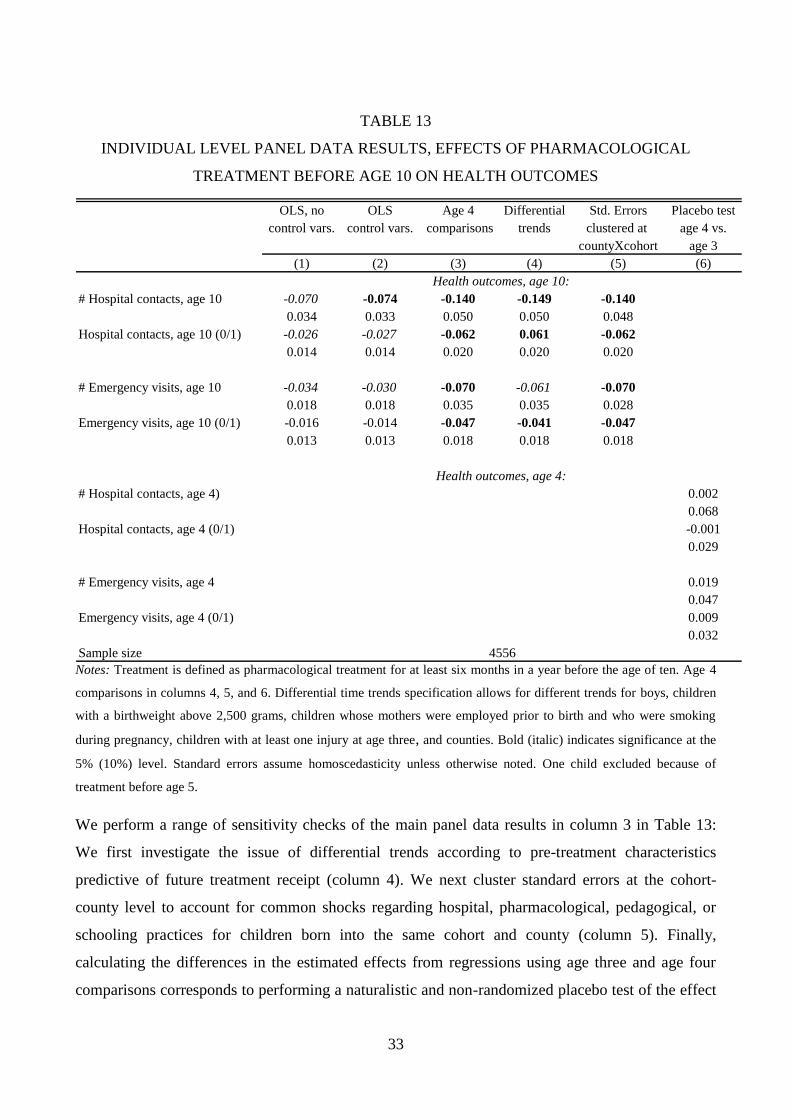
VI.D Effects of treatment on health outcomes: Individual level panel data results
As discussed above, our individual level panel data information on health outcomes allows for a
difference-in-difference analysis. Table 13 shows the formal results. Again, due to space
considerations, we conservatively show results for the indicator for interactions with general
hospitals and emergency wards but other results are available on request. In line with the IV
analysis, we find that early pharmacological treatment is effective in significantly improving health
outcomes: the probability of being in contact with a general hospital at least once is reduced with 7
percentage points, corresponding to just below 30% of the mean at age 10.
33
TABLE 13
INDIVIDUAL LEVEL PANEL DATA RESULTS, EFFECTS OF PHARMACOLOGICAL
TREATMENT BEFORE AGE 10 ON HEALTH OUTCOMES
OLS, no OLS Age 4 Differential Std. Errors Placebo test
control vars. control vars. comparisons trends clustered at age 4 vs.
countyXcohort age 3
(1) (2) (3) (4) (5) (6)
# Hospital contacts, age 10 -0.070 -0.074 -0.140 -0.149 -0.140
0.034 0.033 0.050 0.050 0.048
Hospital contacts, age 10 (0/1) -0.026 -0.027 -0.062 0.061 -0.062
0.014 0.014 0.020 0.020 0.020
# Emergency visits, age 10 -0.034 -0.030 -0.070 -0.061 -0.070
0.018 0.018 0.035 0.035 0.028
Emergency visits, age 10 (0/1) -0.016 -0.014 -0.047 -0.041 -0.047
0.013 0.013 0.018 0.018 0.018
# Hospital contacts, age 4) 0.002
0.068
Hospital contacts, age 4 (0/1) -0.001
0.029
# Emergency visits, age 4 0.019
0.047
Emergency visits, age 4 (0/1) 0.009
0.032
Sample size 4556
Health outcomes, age 10:
Health outcomes, age 4:
Notes: Treatment is defined as pharmacological treatment for at least six months in a year before the age of ten. Age 4
comparisons in columns 4, 5, and 6. Differential time trends specification allows for different trends for boys, children
with a birthweight above 2,500 grams, children whose mothers were employed prior to birth and who were smoking
during pregnancy, children with at least one injury at age three, and counties. Bold (italic) indicates significance at the
5% (10%) level. Standard errors assume homoscedasticity unless otherwise noted. One child excluded because of
treatment before age 5.
We perform a range of sensitivity checks of the main panel data results in column 3 in Table 13:
We first investigate the issue of differential trends according to pre-treatment characteristics
predictive of future treatment receipt (column 4). We next cluster standard errors at the cohort-
county level to account for common shocks regarding hospital, pharmacological, pedagogical, or
schooling practices for children born into the same cohort and county (column 5). Finally,
calculating the differences in the estimated effects from regressions using age three and age four
comparisons corresponds to performing a naturalistic and non-randomized placebo test of the effect
34
of treatment on age four outcomes using age three outcomes as pre-treatment comparison (column
6). In addition to the sensitivity tests shown in Table 13, we have also investigated more thoroughly
treatment initiation prior to the age of ten. In particular, we considered the effects of treatment
initiation prior to the age of 7 (8 and 9) on outcomes measured at age 7 (8 and 9). This sensitivity
analysis naturally leads to further placebo-type analyses where we exploit that treatment initiation
after the age of 7 (8 and 9) must not affect previous outcomes. All sensitivity checks support our
main results and the latter additional analysis is available on request.
V. Heterogeneity in Results
We finally investigate whether results vary across subgroups. We have performed analyses for
boys, children born to mothers with more than a high school degree, children without a mental
retardation diagnosis, children with a birthweight above 3,000 grams, children born to mothers who
did not smoke during pregnancy, and children who are not in treatment with the five most common
other types of nervous system drugs. Table A4 in Appendix shows the results for the main health
outcomes. Our main conclusions are robust to these exercises and the full set of results is available
on request. As pointed out above, many more children are diagnosed early and treated
pharmacologically in the later cohorts. Two competing hypotheses may explain this development.
First of all, it is possible that diagnostic tools have improved in recent years and that diagnosed
cases born in later cohorts suffer from ADHD to the same extent as children born in earlier cohorts.
In this case we will expect the effects of pharmacological treatment to be the same in early and late
cohorts. Secondly, it is possible that the group of treated has been broadened to include children
with less severe symptoms. In this case we will expect the effects of pharmacological treatment to
decline in late cohorts. Table 14 investigates this for the larger health sample. We distinguish
between the 1990-1994 cohorts and the 1995-1999 cohorts from the original sample. We see that
estimated effects are smaller among later cohorts and significantly so in the panel data analysis.
There are still significant gains from treatment in the later cohorts, but the results are at least in line
with diminishing returns to broadening the group of treated.

35
TABLE 14
EFFECTS OF PHARMACOLOGICAL TREATMENT BEFORE
AGE 10 ON HEALTH OUTCOMES IN EARLY AND LATER BIRTH COHORTS
OLS IV Panel
data analysis
Mean (1) (2) (3)
First stage 0.214
0.101
# Hospital contacts, age 10 0.499 -0.213 -3.965 -0.254
0.060 2.761 0.091
Hospital contacts, age 10 (0/1) 0.277 -0.067 -0.531 -0.122
0.027 0.571 0.040
Control variables YES YES YES
Sample size 1470 1385 1470
First stage 0.366
0.096
# Hospital contacts, age 10 0.497 -0.021 -0.272 -0.112
0.040 0.404 0.057
Hospital contacts, age 10 (0/1) 0.278 -0.010 -0.045 -0.046
0.016 0.175 0.024
Control variables YES YES YES
Sample size 3086 2902 3086
Health outcomes, age 10, 1995-1999 birth cohorts:
Health outcomes, age 10, 1990-1994 birth cohorts:
Notes: Treatment is defined as pharmacological treatment for at least six months in a year before the age of ten. Age 4
comparisons in column 3. Bold (italic) indicates significance at the 5% (10%) level. Standard errors clustered at
cohortXcounty. One child excluded because of treatment before age 5.
VI. Conclusion
This paper investigates the effect of early pharmacological treatment of ADHD on children‟s
human capital development while relying on register-based data on diagnoses and treatment for
children born in 1990-1999. Our main analysis exploits variation in psychiatrists‟ propensities to
prescribe treatment and a particular innovation of our paper is that we are to some extent able to
control the severity of ADHD for the purposes of constructing the instrumental variable. Our
36
analysis of effects on health outcomes allows for a complementary difference-in-difference analysis
where we compare outcomes of treated children prior to (age four) and after treatment (age 10 +)
with untreated diagnosed children before and after.
We find that the behavior of specialist physicians varies considerably across wards and that the
prescribing behavior does affect the probability that a given child is treated. Results show that
children diagnosed with ADHD on the margin of receiving pharmacological treatment have fewer
hospital contacts if treated and that treatment to some extent protects against criminal behavior. We
do not, on the other hand, find improvements in terms of the likelihood to complete secondary
exam. In fact, treated children are significantly less likely to complete secondary school exams even
though there is some evidence that they actually perform better when they take an exam when
compared to children who similar in terms of observable characteristics.16
That is, children seem to
benefit from treatment with regards to outcomes that only depend directly on the child‟s own
behavior and are within his control, whereas they perform worse in terms of outcomes that are
likely to be mediated by others such as school teachers and principals. This is consistent with a
hypothesis of social stigma associated with medication. In fact, our teacher survey confirms that
teachers (self-report that they) know whether children diagnosed with ADHD receive
pharmacological treatment and that they have substantial influence on the decision for a child to
complete secondary exams. Of course, this does not preclude parents – or the children themselves –
from affecting the decision.
We do find that estimated health effects are significantly smaller in later cohorts where more
children are diagnosed and treated pharmacologically before the age of ten. There are still
significant gains from treatment in the later cohorts, but these results are consistent with a
hypothesis of diminishing returns to broadening the group of treated.
From the point of view of the individual, the family and the society, the long-term benefits of
pharmacological treatment of ADHD extend beyond the relief of the symptoms related to the
syndrome. These benefits should be traded off against the (low) financial costs of the drugs
combined with the potential detrimental short- and long-term side effects of medication such as
insomnia, decreased appetite and increased blood pressure.
16
Unfortunately, since only 36 % of the children in our sample end up taking an exit exam, our IV strategy fails in this
case due to small sample sizes and we have to rely on OLS.
37
This paper is the first to document the longer-term consequences of pharmacological treatment of
ADHD on socioeconomic outcomes based on nationwide population registers for Denmark. Future
work will investigate whether not only the individual suffering from ADHD is affected by its
treatment; it may be that also parents, siblings, and peers in the classroom benefit.
Literature
Blundell and Costa Dias (2009) „Alternative Approaches to Evaluation in Empirical
Microeconomics.‟ Journal of Human Resources 44, 565-640.
Coleman, J., E. Katz and H. Menzel (1957), „The Diffusion of an Innovation Among Physicians.‟
Sociometry 20 (4): 253-270.
Cunha, F., J. Heckman, L. Lochner and D. Masterov (2006), „Interpreting the Evidence on Life
Cycle Skill Formation‟, in E. A. Hanushek and F. Welch (eds.), The Handbook of the Economics of
Education, New York, North Holland.
Cunha, F. and J. Heckman (2007), „The Technology of Skill Formation‟, The American Economic
Review (Papers and Proceedings) 97, 31-47.
Currie, J. (2011), „Inequality at Birth. Some Causes and Consequences‟, The American Economic
Review (Papers and Proceedings) 101, 1-22.
Currie, J. and D. Almond (2010), „Human Capital Development before Age Five‟, in O. Ashenfelter
and D. Card (eds.), The Handbook of Labor Economics Vol. 4b, Berkeley, Elsevier.
Currie, J. and M. Stabile (2006), „Child Mental Health and Human Capital Accumulation: The Case
of ADHD, Journal of Health Economics 25, 1094-1118.
Dalsgaard S., P.B. Mortensen, M. Frydenberg and P. H. Thomsen (2002), „Conduct problems,
gender and adult psychiatric outcome of children with attention-deficit hyperactivity disorder.‟
British Journal of Psychiatry 181: 416-21.
Dalsgaard, S., H.S. Nielsen and M. Simonsen (2012),‟Effects of Pharmacological Treatment of
ADHD on Children‟s Later Educational Success and Criminal Behavior‟, mimeo, Aarhus
University.
38
Ding, W., S. Lehrer, N. Rosenquist and J. Audrain-McGovern (2009), „The Impact of Poor Health
on Academic Performance: New Evidence Using Genetic Markers‟, Journal of Health Economics
28, 578-597.
Duggan, M. (2005), „Do New Prescription Drugs Pay for Themselves? The Case of Second-
Generation Antipsychotics.‟ Journal of Health Economics 24(1): -31.
Elder, T.E. and D.H. Lubotsky (2009), „Kindergarten Entrance Age and Children‟s Achievement –
Impact of State Policies, Family Background, and Peers.‟ Journal of Human Resources 44(3): 641-
683.
Faraone, S.V. and A.E. Doyle (2001), „The Nature and Heritability of Attention
Deficit/Hyperactivity Disorder‟, Child and Adolescent Psychiatric Clinics of North America 10,
299-309.
Fletcher, J. and B. Wolfe (2008), „Child Mental Health and Human Capital Accumulation: The
Case of ADHD Revisited‟, Journal of Health Economics 27, 794-800.
Fletcher, J. and S. Lehrer (2009), „The Effects of Adolescent Health on Educational Outcomes:
Causal Evidence Using Genetic Lotteries between Siblings‟, Forum for Health Economics & Policy
12, Article 8.
Fletcher, J. and S. Lehrer (2011), „Genetic lotteries within families‟, Journal of Health Economics
30: 647-659.
Frazier, T.W., H.A. Demaree and E.A. Youngstrom (2004), „Meta-analysis of Intellectual and
Neuropsychological Test Performance in Attention-Deficit/Hyperactivity Disorder‟,
Neuropsychology 18, 543-555.
Heckman, J. J. (2008), „Schools, Skills, and Synapses‟, Economic Inquiry 46(3): 289-324.
Heiervang E, E.M. Stormark and A.J. Lundervold et al. (2007), ”Psychiatric disorders in Norwegian
8- to 10-year-olds: an epidemiological survey of prevalence, risk factors, and service use.” J. Am.
Acad. Child Adolesc. Psychiatry 46(4):438-447.
39
Jensen, P.S. , S.P. Hinshaw and H.C. Kraemer et al. (2001), „ADHD Comorbidity Findings from the
MTA Study: Comparing Comorbid Subgroups‟ Journal of the American Academy of Child and
Adolescent Psychiatry 40, 147-158.
Jensen, P.S. and L. Kettle et al. (1999), „Are stimulants over-prescribed? Treatment of ADHD in
four U.S. communities.‟ Journal of the American Academy of Child and Adolescent Psychiatry 38,
797-805.
Kvist, A. P., H. S. Nielsen and M. Simonsen (2011), ”The Effects of Children‟s ADHD on Parents‟
Relationship Dissolution and Labor Supply.” IZA DP #6092.
Lechner, M. (2011), “The Estimation of Causal Effects by Difference-in-Difference Methods.”
Foundations and Trends in Econometrics 4(3), 165-224.
Lichtenstein, P., L. Halldner, J. Zetterqvist, A. Sjölander, E. Serlachius, S. Fazel, N. Långström, and
H. Larsson (2012), „Attention Deficit Hyperactivity Disorder Medication and Criminality.‟ New
England Journal of Medicine 367:2006-2014.
Linnet K.M., S. Dalsgaard and C. Obel et al. (2003) ‟Maternal lifestyle factors in pregnancy risk of
attention deficit hyperactivity disorder and associated behaviors: review of the current evidence. J.
Psychiatry. 160(6):1028-1040.
Linnet, K.M., K. Wisborg, N.J. Secher, P.H. Thomsen, C. Obel, S. Dalsgaard and T.B. Henriksen
(2009), “Coffee consumption during pregnancy and the risk of hyperkinetic disorder and ADHD: a
prospective cohort study.” Acta Paediatr.: 98(1):173-179.
Mannuzza, S. and R. Klein (2000), „Long-term prognosis in attention-deficit/hyperactivity
disorder.‟ Child and Adolescent Psychiatric Clinics of North America 9, 711-726.
Marcus, S.C., G.J. Wan, H.F. Zhang and M. Olfson (2008), „Injury Among Stimulant-Treated
Youth with ADHD.‟ Journal of Attention Disorders 12(1): 64-69.
Mendez, L., P. Singh, G. Harrison, Y.-S. Huang, X. Jin and S.C. Cho (2011), “Academic outcomes
in Asian children aged 8-11 years with attention-deficit/hyperactivity disorder treated with
atomoxetine hydrochloride.” International Journal of Psychiatry in Clinical Practice ; 15: 145–156.
40
Molina, B.S., S.P. Hinshaw, J.M. Swanson et al. (2009), „The MTA at 8 years: prospective follow-
up of children treated for combined-type ADHD in a multisite study.‟ Journal of the American
Academy of Child and Adolescence Psychiatry 48, 484-500.
MTA Cooperative Group (1999), „A 14-Month Randomized Clinical Trial of Treatment Strategies
for Attention-Deficit Hyperactivity Disorder‟, Arch Gen Psychiatry 56: 1073-1086.
MTA Cooperative Group (2004), „24-Month Outcomes of Treatment Strategies for Attention-
Deficit/Hyperactivity Disorder.‟ Pediatrics 113: 754-763.
Munk-Jørgensen, P. and P.B. Mortensen (1997), „The Danish Psychiatric Central Register‟, Danish
Medical Bulletin 44, 82-84.
Obel, C., J. Olsen and T. B. Henriksen et al. (2011), „Is maternal smoking during pregnancy a risk
factor for Hyperkinetci disorder? – findings from a sibling design.‟ International Journal of
Epidemiology 40: 338-345.
Paykina, N. and L. Greenhill (2008), „Attention deficit hyperactivity disorder.‟ In Findling R., ed.,
Clinical manual of child and adolescent psychopharmacology Washington, DC: American
Psychiatric Publishing.
Solanto, M.V. (1998), „Neuropsychopharmacological mechanisms of stimulant drug action in
attention-deficit hyperactivity disorder: a review and integration.‟ Behav. Brain Res 94(1): 127-152.
Soumerai, S. B., T. J. McLaughlin, J. H. Gurwitz, E. Guadagnoli, P. J. Hauptman, C. Borbas, N.
Morris, B. McLaughlin, X. Gao, D. J Wilson, R. Asinger and F. Gobel (1998), „Effect of local
medical opinion leaders on quality of care for acute myocardial infarction: a randomized controlled
trial.‟ Journal of the American Medical Association 6 (17): 1358-1363.
Sroufe, L. A. (2012), „Ritalin Gone Wrong‟ New York Times. January 29, 2012.
The Danish Association for Child and Adolescent Psychiatry (2008), „Reference Program for
Diagnosing and Treating Children and Adolescents with ADHD‟ (Referenceprogram for udredning
og behandling af børn og unge med ADHD).
41
Van der Oord S., P.J. Prins, J. Oosterlaan and P.M. Emmelkamp (2008), ‟Efficacy of
methylphenidate, psychosocial treatments and their combination in school-aged children with
ADHD: a meta analysis.‟ Clin. Psychol. Rev. 28(5): 783-800.
WHO (1993),‟The ICD-10 Classification of Mental and Behavioural Disorders: Diagnostic Criteria
for Research‟, World Health Organization.
Wittchen H.U, F. Jacobi and J. Rehm et al. (2011), „The size and burden of mental disorders and
other disorders of the brain in Europe 2010.‟ Eur Neuropsychopharmacol. 21(9): 655-679.
Yoon SY, Jain U, Shapiro C (2011). „Sleep in attention-deficit/hyperactivity disorder in children
and adults: Past, present, and future.‟ Sleep medicine reviews.

42
Appendix
TABLE A1
OBSERVABLE CHARACTERISTICS AT CHILDBIRTH, CHILDREN WITH
AND WITHOUT AN ADHD DIAGNOSIS BEFORE THE AGE OF TEN
Notes: Bold indicates that mean for children with an ADHD diagnosis before the age of ten is significantly different
from the mean for children without an ADHD diagnosis at the 5% level. With the exception of mental retardation,
which is diagnosed in connection with the ADHD diagnosis, all variables are measured in the year just prior to the birth
of the child or in connection with childbirth. Unemployed less than 13 weeks includes no unemployment.
Variable
# obs Mean Std. Dev. # obs Mean Std. Dev.
Child:
Boy (0/1) 710120 0.51 0.50 4557 0.84 0.37
5-minute APGAR score 654512 9.83 0.86 4331 9.73 1.10
Birthweight less than 1,500 grams (0/1)656115 0.01 0.08 4353 0.02 0.14
Birthweight, 1,500-2,500 grams (0/1)656115 0.04 0.20 4353 0.07 0.25
Birthweight, above 2,500 grams (0/1)656115 0.95 0.21 4353 0.91 0.28
Complications at birth (0/1) 710120 0.21 0.40 4557 0.29 0.45
Gestation length (weeks) 654637 39.59 1.92 4346 39.21 2.53
Mental retardation (0/1) 710120 0.00 0.06 4557 0.11 0.32
Mother:
Age at childbirth 707357 29.05 4.81 4553 28.14 5.15
High school or less (0/1) 648886 0.39 0.49 4358 0.52 0.50
Length of education (years) 648886 12.25 2.52 4358 11.41 2.30
Unemployed less than 13 weeks (0/1)664613 0.83 0.38 4431 0.80 0.40
Unemployed 13-26 weeks (0/1) 664613 0.11 0.32 4431 0.14 0.34
Unemployed more than 26 weeks (0/1)664613 0.06 0.23 4431 0.06 0.24
Employed in November (0/1) 664576 0.63 0.48 4431 0.51 0.50
Gross income (2004 prices) 664576 188327 109197 4431 174186 74643
Psychiatric diagnosis (0/1) 707736 0.04 0.19 4553 0.10 0.30
Heart disease (0/1) 707736 0.03 0.16 4553 0.03 0.17
Respiratory disease (0/1) 707736 0.11 0.31 4553 0.19 0.39
Smoker (0/1) 562081 0.08 0.27 3945 0.18 0.39
Father:
Age at child birth 684806 31.89 5.76 4277 31.23 6.25
High school or less (0/1) 632113 0.32 0.47 4064 0.44 0.50
Length of education (years) 632113 12.21 2.58 4064 11.33 2.37
Unemployed less than 13 weeks (0/1)651266 0.88 0.32 4197 0.84 0.36
Unemployed 13-26 weeks (0/1) 651266 0.06 0.23 4197 0.08 0.27
Unemployed more than 26 weeks (0/1)651266 0.06 0.24 4197 0.08 0.27
Employed in November (0/1) 651237 0.89 0.32 4197 0.84 0.36
Gross income (2004 prices) 651237 296103 199811 4197 259101 144851
Psychiatric diagnosis (0/1) 685964 0.03 0.18 4281 0.08 0.27
Heart disease (0/1) 685964 0.03 0.17 4281 0.04 0.20
Respiratory disease (0/1) 685964 0.09 0.29 4281 0.14 0.34
No ADHD diagnosis ADHD diagnosis before age 10
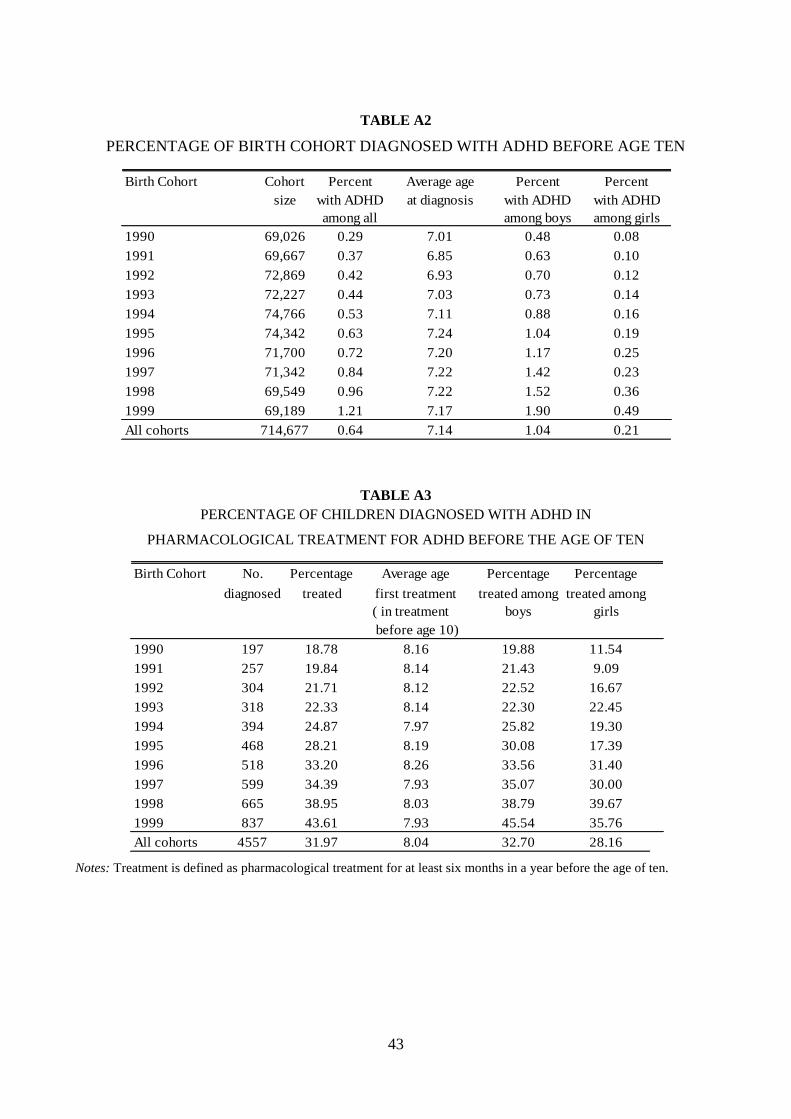
43
TABLE A2
PERCENTAGE OF BIRTH COHORT DIAGNOSED WITH ADHD BEFORE AGE TEN
TABLE A3
PERCENTAGE OF CHILDREN DIAGNOSED WITH ADHD IN
PHARMACOLOGICAL TREATMENT FOR ADHD BEFORE THE AGE OF TEN
Notes: Treatment is defined as pharmacological treatment for at least six months in a year before the age of ten.
Birth Cohort Cohort Percent Average age Percent Percent
size with ADHD at diagnosis with ADHD with ADHD
among all among boys among girls
1990 69,026 0.29 7.01 0.48 0.08
1991 69,667 0.37 6.85 0.63 0.10
1992 72,869 0.42 6.93 0.70 0.12
1993 72,227 0.44 7.03 0.73 0.14
1994 74,766 0.53 7.11 0.88 0.16
1995 74,342 0.63 7.24 1.04 0.19
1996 71,700 0.72 7.20 1.17 0.25
1997 71,342 0.84 7.22 1.42 0.23
1998 69,549 0.96 7.22 1.52 0.36
1999 69,189 1.21 7.17 1.90 0.49
All cohorts 714,677 0.64 7.14 1.04 0.21
Birth Cohort No. Percentage Average age Percentage Percentage
diagnosed treated first treatment treated among treated among
( in treatment boys girls
before age 10)
1990 197 18.78 8.16 19.88 11.54
1991 257 19.84 8.14 21.43 9.09
1992 304 21.71 8.12 22.52 16.67
1993 318 22.33 8.14 22.30 22.45
1994 394 24.87 7.97 25.82 19.30
1995 468 28.21 8.19 30.08 17.39
1996 518 33.20 8.26 33.56 31.40
1997 599 34.39 7.93 35.07 30.00
1998 665 38.95 8.03 38.79 39.67
1999 837 43.61 7.93 45.54 35.76
All cohorts 4557 31.97 8.04 32.70 28.16
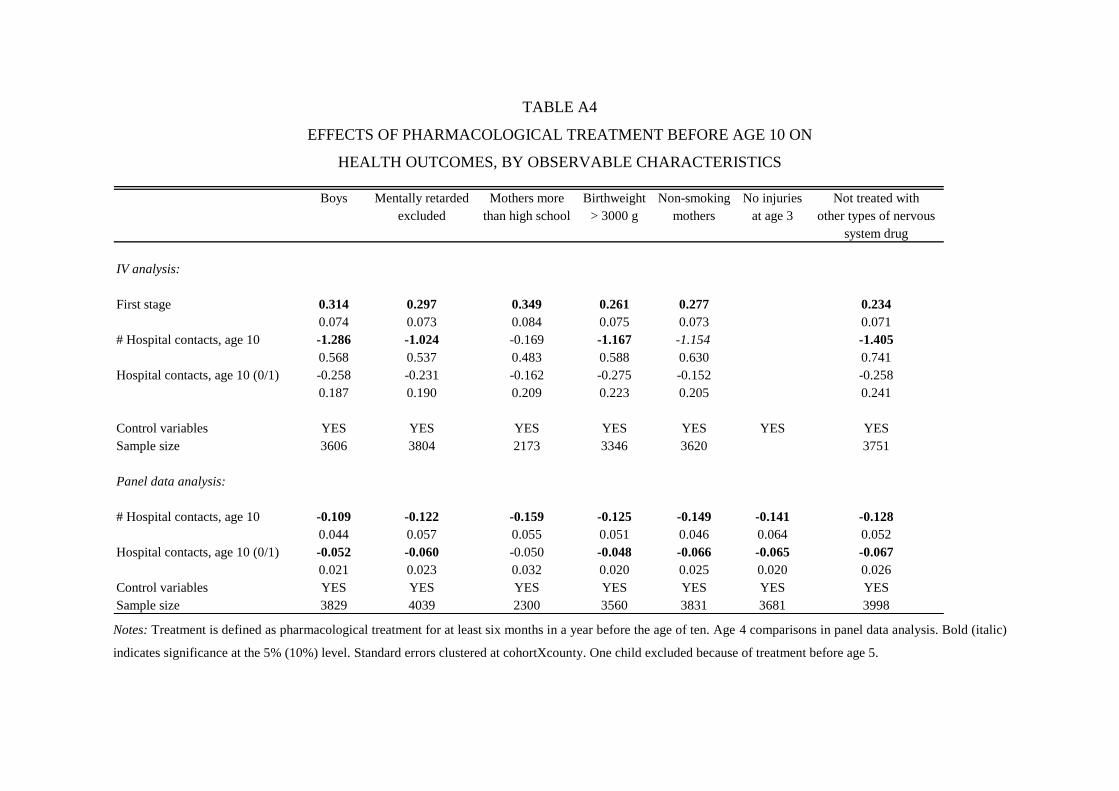
TABLE A4
EFFECTS OF PHARMACOLOGICAL TREATMENT BEFORE AGE 10 ON
HEALTH OUTCOMES, BY OBSERVABLE CHARACTERISTICS
Boys Mentally retarded Mothers more Birthweight Non-smoking No injuries Not treated with
excluded than high school > 3000 g mothers at age 3 other types of nervous
system drug
IV analysis:
First stage 0.314 0.297 0.349 0.261 0.277 0.234
0.074 0.073 0.084 0.075 0.073 0.071
# Hospital contacts, age 10 -1.286 -1.024 -0.169 -1.167 -1.154 -1.405
0.568 0.537 0.483 0.588 0.630 0.741
Hospital contacts, age 10 (0/1) -0.258 -0.231 -0.162 -0.275 -0.152 -0.258
0.187 0.190 0.209 0.223 0.205 0.241
Control variables YES YES YES YES YES YES YES
Sample size 3606 3804 2173 3346 3620 3751
Panel data analysis:
# Hospital contacts, age 10 -0.109 -0.122 -0.159 -0.125 -0.149 -0.141 -0.128
0.044 0.057 0.055 0.051 0.046 0.064 0.052
Hospital contacts, age 10 (0/1) -0.052 -0.060 -0.050 -0.048 -0.066 -0.065 -0.067
0.021 0.023 0.032 0.020 0.025 0.020 0.026
Control variables YES YES YES YES YES YES YES
Sample size 3829 4039 2300 3560 3831 3681 3998
Notes: Treatment is defined as pharmacological treatment for at least six months in a year before the age of ten. Age 4 comparisons in panel data analysis. Bold (italic)
indicates significance at the 5% (10%) level. Standard errors clustered at cohortXcounty. One child excluded because of treatment before age 5.