long-term care funding in england: an analysis of the · pdf [email protected] london...
TRANSCRIPT

f
University of Kent
University of Kent
Cornwallis Building
Canterbury
Kent
CT2 7NF
Tel: 01227 823963
London School of Economics
London School of Economics
LSE Health & Social Care
Houghton Street
London
WC2A 2AE
Tel: 020 7955 6238
Long-term care funding in
England: an analysis of the
costs and distributional
effects of potential reforms
Ruth Hancock1, Raphael Wittenberg2, Bo
Hu2, Marcello Morciano1 and Adelina
Comas-Herrera2
1. Health Economics Group, University of East Anglia
2. Personal Social Services Research Unit, London School of Economics
and Political Science
Personal Social Services Research Unit
PSSRU Discussion Paper 2857
April 2013
www.pssru.ac.uk
Personal Social Services Research Unit
Identifier (eg “PSSRU Discussion Paper 123”)

Long-term care funding in England
1
JEL classification: H75, I13, I18
Keywords: long-term care finance; older people; simulation models
Acknowledgements: We are grateful for funding from various sources for the research on which
this note is based: AXA Research Fund; the Economic and Social Research Council through the ESRC
Research Centre on Micro-social Change and the Department of Health who funded our original
research for the Commission on Funding Care and Support. Charlotte Davies and Lisa Irvine provided
valuable comments on an earlier draft of this paper.
This working paper is also issued as a University of East Anglia HEG working paper 13-01
Box 1: Details of the current means test for long-term care and reforms analysed in this paper
An individual’s entitlement to state help with the costs of long-term care depends on an assessment of
their care needs and on a means test
The current means test
• If the individual has capital above an ‘upper capital threshold’, currently £23,250, the individual pays the full cost of their care. For residential care, the value of the home is usually included in capital after the first 12 weeks.
• When capital is below £23,250, the state meets some of the cost depending on the individual’s assessable income.
• Assessable income includes a notional weekly income, known as ‘tariff income’ on capital between a ‘lower capital threshold’, currently £14,250 and the upper capital threshold. The current rate of tariff income is £1 for each £250 between the lower and upper capital thresholds. Capital up to the lower capital threshold, and any income from it, is ignored completely in the means test.
The Government’s announced reforms
• Once an individual has received ‘eligible care’ to the value of the lifetime cap, the state will meet their ‘eligible care costs’ Eligible care is the package of care that the individual has been assessed as needing; eligible care costs are the costs of that care calculated at the prices that the Local Authority pays. In residential care, eligible care excludes the general living costs element of care home fees sometimes known as ‘hotel costs’ – board, food, heating etc. The liftime cap is expected to be £75,000 in 2017.
• The upper capital threshold in residential care will be increased and is expected to be £123,000 in 2017.
• In residential care, hotel costs will remain means tested and are expected to be £12,000 in 2017.
Two variants on the Government’s announced reforms We examine two variations on the Government’s announced regforms. In addition to changes above, these would: • halve the rate of tariff income from £1 per £250 to £1 per £500 Or, at a similar cost • increase the lower capital threshold to £41,600 in 2017 prices.
The central recommendation of the Dilnot Commission on Funding Care and Support
• This is similar to the Government’s plans except that the recommended lifetime cap was £35,000 in 2010 prices, or about £43,000 in 2017 prices.

Long-term care funding in England
2
Summary
The UK Government recently announced plans to reform the system that determines how much the
state contributes to people’s long-term care costs. The reforms will start in 2016 and introduce a
lifetime cap on the costs an individual will need to pay towards ‘eligible’ care and support needs.
They will also increase the upper capital threshold above which care home residents are ineligible
for local authority help with their care home fees. This increase will extend the possibility of state
support to those care home residents who are currently excluded from state help because they have
capital, usually including the value of their home, above the current capital threshold of £23,250.
The lifetime cap is expected to be £75,000 in 2017 , and the upper capital threshold in residential
care will be increased to £123,000.
This paper examines projected costs and distributional effects of these plans compared with the
current system. It also contrasts these costs and distributional effects with the central
recommendation of the Commission on the Funding of Care and Support (Dilnot Commission) which
was set up by the Government and reported in 2011. The Commission’s central recommendation
was for a cap of £35,000 and upper capital threshold of £100,000 in 2010 prices. We also consider
two variants on the Government’s plans which would give additional help to recipients of residential
care with capital below the proposed higher capital threshold (see Box 1 for how these compare
with the current system, the Government’s plans and the recommendations of the Dilnot
Commission).
Our main findings are:
• Currently public expenditure in England on social care services for older people and on disability
benefits that older people use towards their care costs is estimated to be £12 billion in 2010.
We project that this will rise to more than double that by 2030 (£25.5 billion in 2010 prices). As
a percentage of Gross Domestic Product the rise is less steep; from just under 1% in 2010 to
1.3% by 2030.
• We project that the government plans would add £2 billion (2010 prices) to public expenditure
by 2030. This is in contrast to an extra £3.3 billion that we project would be the cost of the
central Dilnot recommendation by 2030.
• Halving the rate of tariff income from capital between the lower and upper thresholds in
residential care would add £0.15 billion to the cost of the Government’s plans by 2030. Raising
the lower capital threshold below which all capital is disregarded, to the equivalent of £40,000
in 2010 prices, would cost a similar amount.
• We project that under the government plans there would be some 115,000 more users of care
services receiving some public funding in 2030 than if the current system continued. This is in
contrast to our projection of around 185,000 more publicly funded users in 2030 under the
central Dilnot recommendation.
• The estimated weekly gains from all the reform options are greatest amongst care recipients in
the highest quintile (fifth) of the income distribution for people aged 85+. For example, in 2030,
the Government’s plans would be worth £52 per week (2010 prices) on average to care
recipients aged 85+ in the highest quintile compared with £20 for those in the lowest quintile.
Expressed as percentages of income the gains vary much less across the income distribution.

Long-term care funding in England
3
• Focussing on care home residents, both variants on the Government’s plans would be
particularly advantageous to lower income care home recipients. In 2030 the average gains of
care home residents aged 85+ in the lowest 3 income quintile would be about 16% higher under
these variants than under the proposed reforms. This compares with around 6% higher for the
upper two quintiles.
• These projections assume that the level of the cap is linked to real earnings growth indefinitely
but that capital thresholds are linked to real earnings growth only until 2017 and are held
constant in real terms thereafter. If capital thresholds were linked to real earnings indefinitely,
the public expenditure cost of the Government plans would be £2.23 billion in 2030 compared
with £1.96 billion if they were held constant after 2017.
Introduction
On 11th February the UK Government issued a policy statement on care and support funding
(Department of Health, 2013). The key features of its planned reforms are:
• a lifetime cap on the costs an individual will need to pay towards eligible care and support
needs , expected to be £75,000 when introduced in 2017 (£61,000 in 2010 prices);
• an increase in the residential care upper capital threshold above which there is no state help
towards care home fees; the threshold is expected to be £123,000 in 2017 (£100,000 in 2010
prices) compared with £23,250 now;
• for residential care, eligible care costs that count towards the cap are expected to be the
difference between the publicly-funded rate for care home fees and so-called ‘hotel costs’, set
at around £12,000 in 2017 (£10,000 in 2010 prices). Public help with hotel costs will remain
means tested.
Since then the Government has said that it will introduce these changes in 2016, with a cap of
around £72,000 and an upper capital threshold in residential care of £118,000 in 2016 prices
(Chancellor of the Exchequer 2013). Our interpretation is that this would not alter the levels of the
cap or upper threshold in 2017 i.e. in 2017 they would be £75,000 and £123,000 respectively.
The lifetime cap is higher than the £35,000 (2010 prices) recommended by the Commission on
Funding Care and Support (CFCS) chaired by Andrew Dilnot (CFCS, 2011). The increase in the capital
threshold and the level of hotel costs match the CFCS central recommendation.
We have previously analysed the CFCS recommendations (Wittenberg et al. 2011). Here we update
that analysis to take account of the Government’s recent policy statement, examining also two
variations on the Government’s planned reform. These variations illustrate the effect of providing a
little more state help to those with capital below the new higher threshold. For comparison we
compare our results with a cap of £35,000 (2010 prices) recommended by the CFCS which would be
around £43,000 in 2017 prices.
Long-term care funding in England
4
Two potential variations on the Government’s announced reforms
Under the existing means test for public support with care home fees, individuals with capital above
the upper threshold, currently £23,250, have to meet their care home fees in full without any state
help. The value of their home is usually included in capital. Those with capital below the upper limit
can be entitled to state help depending on their income. The first £14,250 of capital is disregarded
completely but capital between this lower threshold and the upper threshold is assumed to generate
a ‘tariff’ income of £1 for every £250 of capital. This tariff income is added to other sources of
income when applying the means test. The proposed increase in the upper threshold will extend the
range of capital on which this tariff income will be calculated and will offset the effect of that
increase – partially for those with capital well below the new upper threshold but potentially fully
for those with capital near the new upper threshold. We therefore examine two ways in which the
effect of this offset could be reduced:
1. A reduction in the tariff rate to £1 for every £500 of capital, which is the rate used in means-
tested social security benefits.
2. An increase in the lower capital threshold in residential care, thereby increasing the amount of
capital that is disregarded completely and hence entirely protected. We examine an increase in
the lower capital threshold to £40,000 in 2010 prices (or £41,600 in 2017 prices) since the cost
to the public purse would be close to the cost of reducing the tariff rate to £1 in £500.
Methods and assumptions
We use two linked simulation models: the Personal Social Services Research Unit’s (PSSRU)
aggregate long-term care projections model and the University of East Anglia’s CARESIM dynamic
micro-simulation. The current versions of the models have a base year of 2010 and incorporate the
2010-based official population projections (Office for National Statistics, 2011) and recent
projections of Gross Domestic Product (GDP) made by the Office for Budget Responsibility (2012).
These models allow us to make projections of the public costs of the current funding system for
long-term care for older people in England (the base case), and of potential reforms to it, along with
the distribution of gains from reforms according to care recipients’ income levels. More details on
the models’ methods, data sources and assumptions are given in Wittenberg et al. (2011). Key points
to note are:
• The results relate to England: since social care services are a devolved function the
Government’s plans relate specifically to England only.
• Our analysis relates to people aged 65+ only: since fewer younger people needing care are likely
to have substantial capital, the costs will relate mainly to older people.
• The base year for the projections is 2010 and all results are given in 2010 prices.
• Public expenditure on long-term care is defined to include not only expenditure on social care
services provided via Local Authorities but also expenditure on disability benefits that are used
by their recipients to fund social care.
• Patterns of care, such as the balance between formal and informal care and residential and
home-based care are held constant.
• Future unit costs of care are assumed to rise in line with real earnings growth .
Long-term care funding in England
5
• Real earnings growth is assumed to be zero until 2015 and 2% per annum thereafter.
• The lifetime cap and hotel costs are assumed to rise over time at the rate of real earnings
growth.
• All capital thresholds are assumed to stay constant in real terms under the current funding
system. Under the potential funding reforms they are assumed to rise at the rate of real
earnings growth until 2017 and to remain constant in real terms thereafter. In a sensitivity test
we assume that, under the potential reforms, capital thresholds and hotel costs rise by real
earnings indefinitely.
• The new scheme is assumed for this purpose to be mature by 2020: since in practice the new
scheme will not be mature for several years, our projections of the costs in 2020 are likely to be
over-estimates.
Results
Projections of public expenditure on long-term care
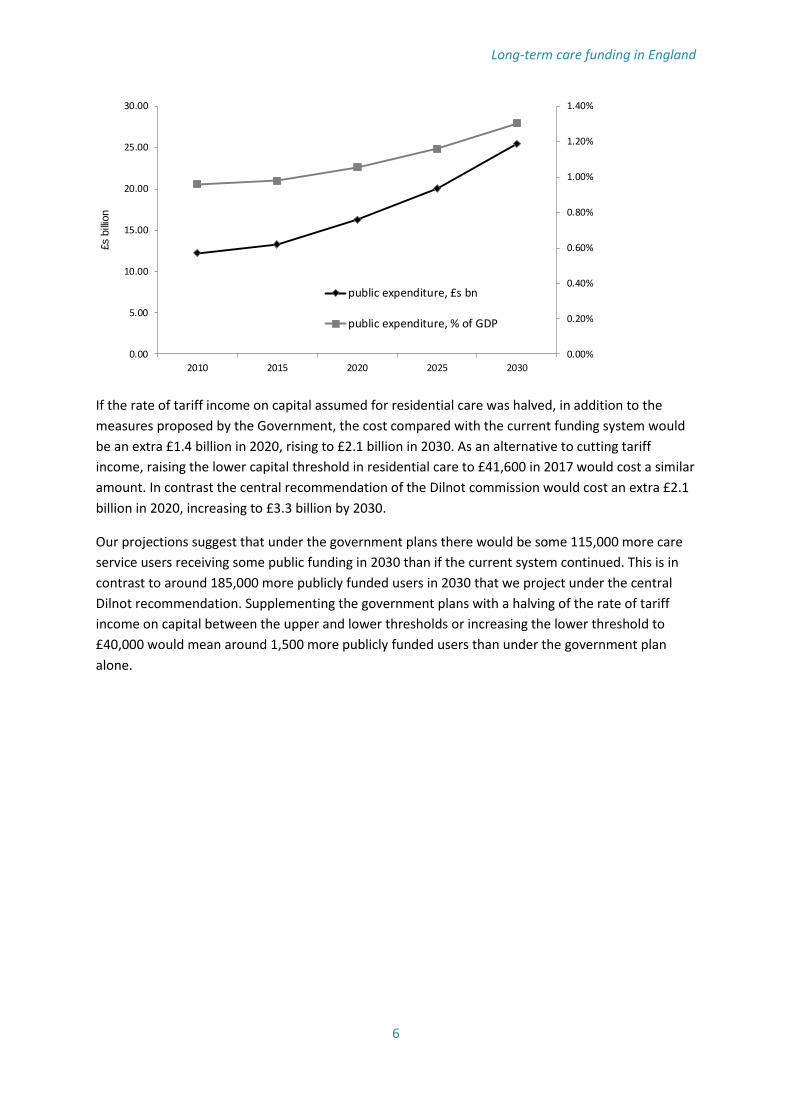
To set the scene, Figure 1 shows projected public expenditure, under the current funding system, on
social care for older people in England. The chart shows projected public expenditure in absolute
terms and as a percentage of GDP. In 2010, the base year for the projections, public expenditure is
estimated at just over £12 billion and projected to rise to £16.3 billion in 2020 and £25.5 billion in
2030 (in constant 2010 prices). Expressed as a percentage of GDP these correspond to just under 1%,
rising to 1.1% by 2020 and 1.3% by 2030.
Our modelling suggests that the Government’s announced plans would add an extra £1.3 billion to
public expenditure in 2020, rising to an extra £2 billion by 2030 (Figure 2). These public expenditure
costs are likely to be overestimates to the extent that the cap will not be applied in respect of care
received prior to 2016. It is not possible to compare this directly with the Government’s estimates of
costs, in part because of differences in the time periods to which the respective estimates relate and
in price bases; but subject to that caveat the estimates appear to be reasonably compatible with
those published in the Government’s 2012 progress report on funding reform (Her Majesty’s
Government, 2012)1.
Figure 1: Projected public expenditure on social care for older people in England
1 Figure 4 on page 34 on that report gives estimates of the cost for older people of a £75,000 cap and
a £100,000 upper capital threshold introduced in 2015/16 of £1.3 billion by 2025/6 in 2012/3 prices,
allowing fo savings on disability benefits. Note that estimates are also given of the assessment costs
associated with the cap. Our cost estimates do not include assessment costs.
Long-term care funding in England
6
If the rate of tariff income on capital assumed for residential care was halved, in addition to the
measures proposed by the Government, the cost compared with the current funding system would
be an extra £1.4 billion in 2020, rising to £2.1 billion in 2030. As an alternative to cutting tariff
income, raising the lower capital threshold in residential care to £41,600 in 2017 would cost a similar
amount. In contrast the central recommendation of the Dilnot commission would cost an extra £2.1
billion in 2020, increasing to £3.3 billion by 2030.
Our projections suggest that under the government plans there would be some 115,000 more care
service users receiving some public funding in 2030 than if the current system continued. This is in
contrast to around 185,000 more publicly funded users in 2030 that we project under the central
Dilnot recommendation. Supplementing the government plans with a halving of the rate of tariff
income on capital between the upper and lower thresholds or increasing the lower threshold to
£40,000 would mean around 1,500 more publicly funded users than under the government plan
alone.
0.00%
0.20%
0.40%
0.60%
0.80%
1.00%
1.20%
1.40%
0.00
5.00
10.00
15.00
20.00
25.00
30.00
2010 2015 2020 2025 2030
£s b
illio
n
public expenditure, £s bn
public expenditure, % of GDP
Long-term care funding in England
7
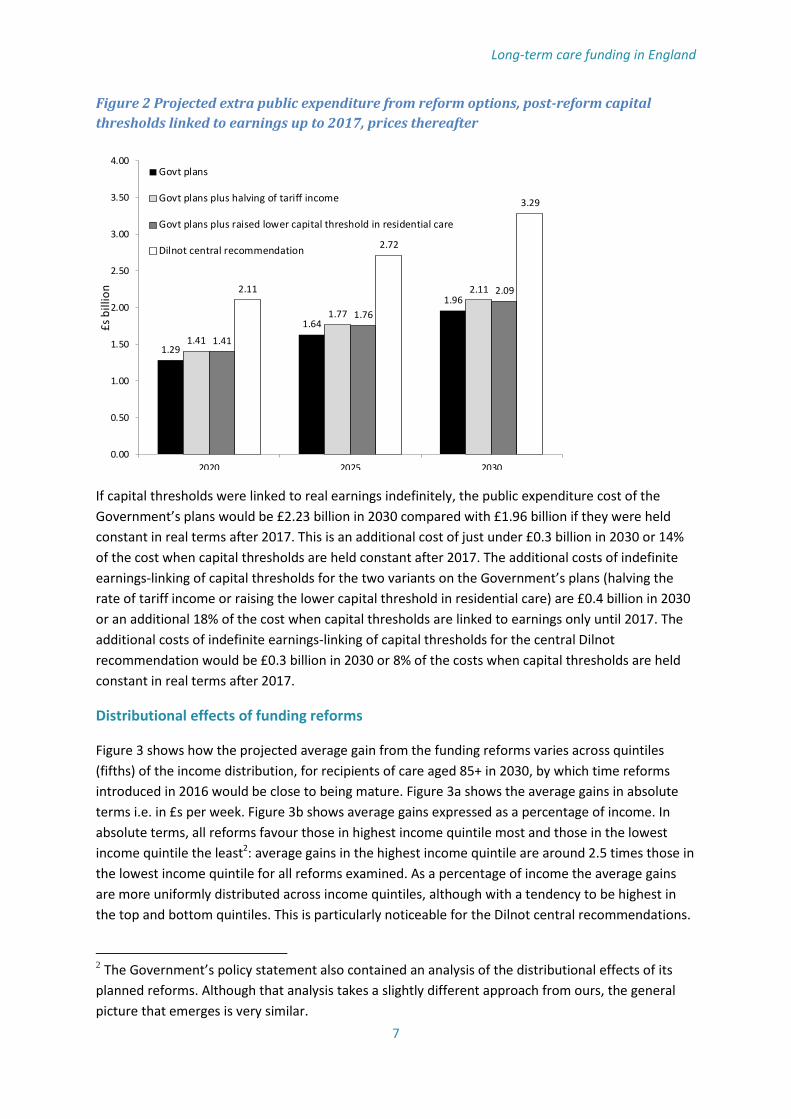
Figure 2 Projected extra public expenditure from reform options, post-reform capital
thresholds linked to earnings up to 2017, prices thereafter
If capital thresholds were linked to real earnings indefinitely, the public expenditure cost of the
Government’s plans would be £2.23 billion in 2030 compared with £1.96 billion if they were held
constant in real terms after 2017. This is an additional cost of just under £0.3 billion in 2030 or 14%
of the cost when capital thresholds are held constant after 2017. The additional costs of indefinite
earnings-linking of capital thresholds for the two variants on the Government’s plans (halving the
rate of tariff income or raising the lower capital threshold in residential care) are £0.4 billion in 2030
or an additional 18% of the cost when capital thresholds are linked to earnings only until 2017. The
additional costs of indefinite earnings-linking of capital thresholds for the central Dilnot
recommendation would be £0.3 billion in 2030 or 8% of the costs when capital thresholds are held
constant in real terms after 2017.
Distributional effects of funding reforms
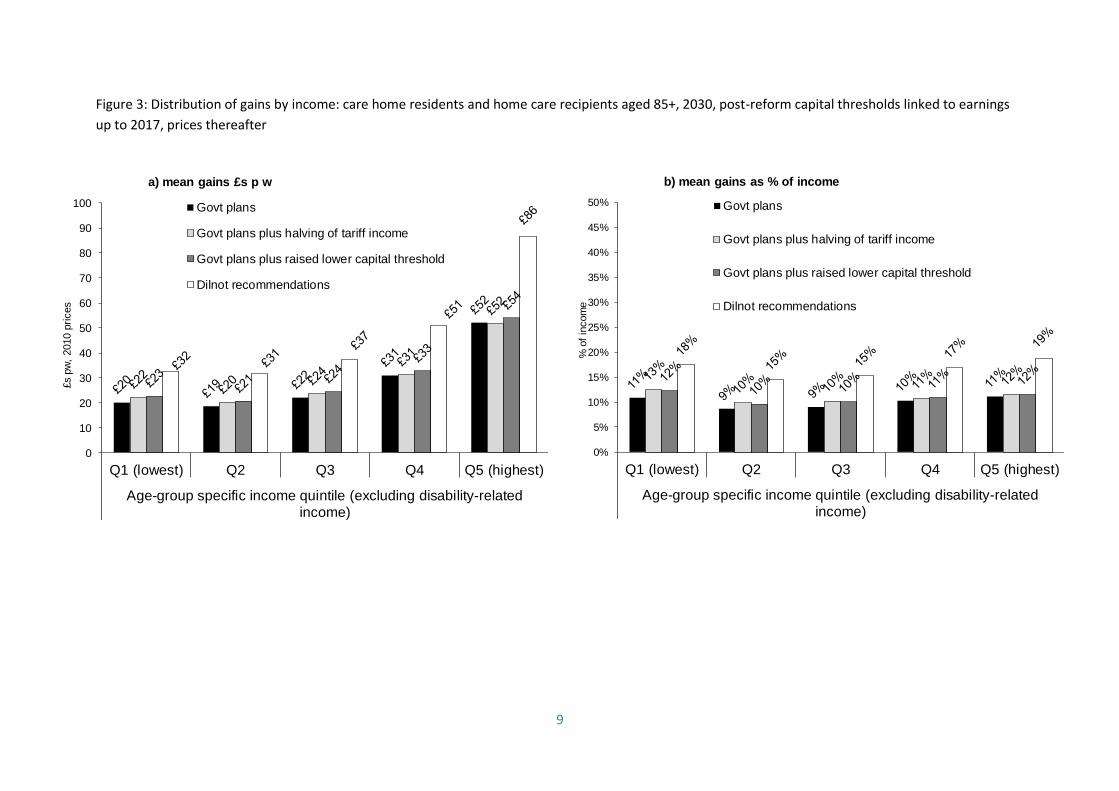
Figure 3 shows how the projected average gain from the funding reforms varies across quintiles
(fifths) of the income distribution, for recipients of care aged 85+ in 2030, by which time reforms
introduced in 2016 would be close to being mature. Figure 3a shows the average gains in absolute
terms i.e. in £s per week. Figure 3b shows average gains expressed as a percentage of income. In
absolute terms, all reforms favour those in highest income quintile most and those in the lowest
income quintile the least2: average gains in the highest income quintile are around 2.5 times those in
the lowest income quintile for all reforms examined. As a percentage of income the average gains
are more uniformly distributed across income quintiles, although with a tendency to be highest in
the top and bottom quintiles. This is particularly noticeable for the Dilnot central recommendations.
2 The Government’s policy statement also contained an analysis of the distributional effects of its
planned reforms. Although that analysis takes a slightly different approach from ours, the general
picture that emerges is very similar.
1.29
1.64
1.96
1.41
1.77
2.11
1.41
1.76
2.092.11
2.72
3.29
0.00
0.50
1.00
1.50
2.00
2.50
3.00
3.50
4.00
2020 2025 2030
£s b
illio
n
Govt plans
Govt plans plus halving of tariff income
Govt plans plus raised lower capital threshold in residential care
Dilnot central recommendation

Long-term care funding in England
8
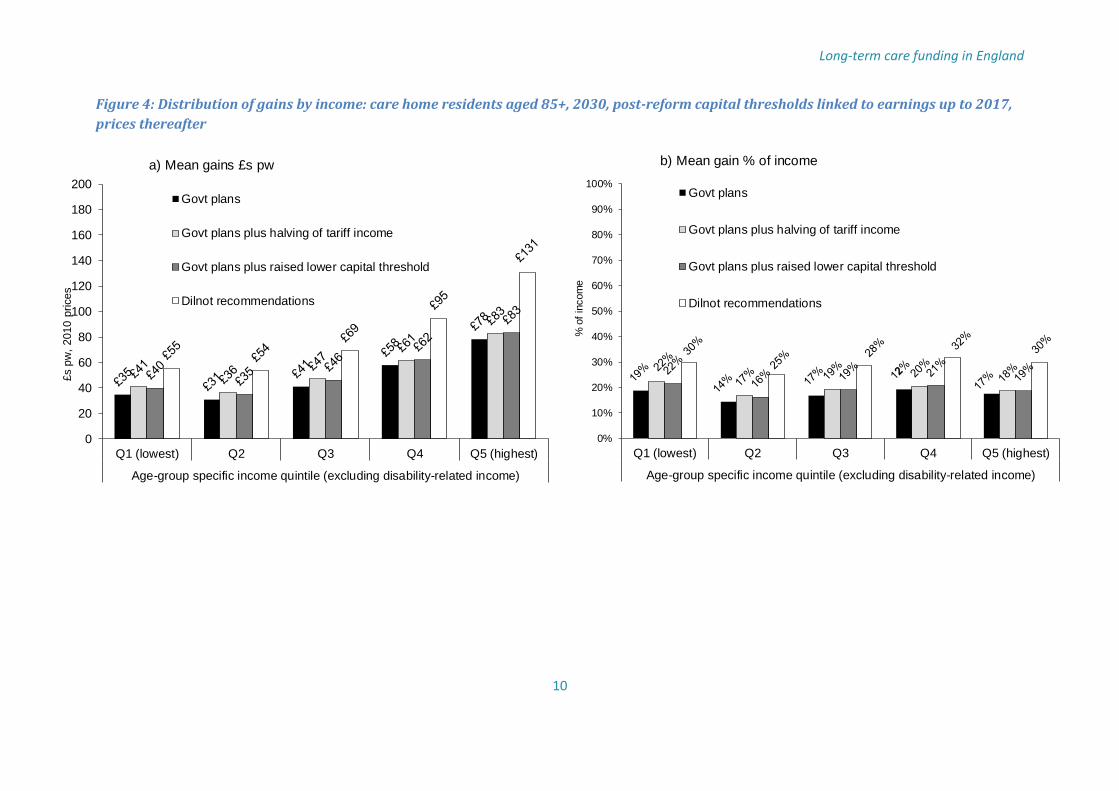
Since some aspects of the reforms – changes to the upper capital and, in the variants, changes to the
lower capital threshold or reduction in tariff income – affect only those in care homes, Figure 4
shows the distributional results for care home residents only. From these it can be seen that the
difference in absolute average gains between the Government’s plans and the two variants that we
have modelled is proportionately greater in the lower income quintiles than in the higher income
quintiles. For example, in the lowest income quintile, the average gain when a reduction in tariff
income is combined with the Government plans is £41 per week which is 17% higher than the
average gain (£35) if the rate of tariff income is unchanged. Corresponding comparisons for quintiles
2 and 3 are of similar size. However the comparison for the highest quintile is between £83 if tariff
income is reduced and £78 if it is not, a difference of just 6%. The distributional effects of the variant
in which the lower capital threshold is raised to £41,600 are remarkably similar to the variant in
which tariff income is halved. The adoption of one of the variants would thus render the impact of
reform more even across income groups.
9
0
10
20
30
40
50
60
70
80
90
100
Q1 (lowest) Q2 Q3 Q4 Q5 (highest)
Age-group specific income quintile (excluding disability-related
income)
£s
pw
, 2010 p
rices
a) mean gains £s p w
Govt plans
Govt plans plus halving of tariff income
Govt plans plus raised lower capital threshold
Dilnot recommendations
Figure 3: Distribution of gains by income: care home residents and home care recipients aged 85+, 2030, post-reform capital thresholds linked to earnings
up to 2017, prices thereafter
0%
5%
10%
15%
20%
25%
30%
35%
40%
45%
50%
Q1 (lowest) Q2 Q3 Q4 Q5 (highest)
Age-group specific income quintile (excluding disability-related
income)
% o
f in
com
e
b) mean gains as % of income
Govt plans
Govt plans plus halving of tariff income
Govt plans plus raised lower capital threshold
Dilnot recommendations
Long-term care funding in England
10
0
20
40
60
80
100
120
140
160
180
200
Q1 (lowest) Q2 Q3 Q4 Q5 (highest)
Age-group specific income quintile (excluding disability-related income)
£s p
w,
2010 p
rices
a) Mean gains £s pw
Govt plans
Govt plans plus halving of tariff income
Govt plans plus raised lower capital threshold
Dilnot recommendations
Figure 4: Distribution of gains by income: care home residents aged 85+, 2030, post-reform capital thresholds linked to earnings up to 2017,
prices thereafter
0%
10%
20%
30%
40%
50%
60%
70%
80%
90%
100%
Q1 (lowest) Q2 Q3 Q4 Q5 (highest)
Age-group specific income quintile (excluding disability-related income)
% o
f in
com
e
b) Mean gain % of income
Govt plans
Govt plans plus halving of tariff income
Govt plans plus raised lower capital threshold
Dilnot recommendations
11
Conclusion
In this paper we have assessed the public expenditure costs and the distributional effects of the
Government’s recently announced plans to reform the funding system for long-term care for older
people in England. We have contrasted theeffects of the planned reforms with the central
recommendations of the Dilnot Commission on Funding Care and Support and with two variants on
the Government’s plans which would give additional help to care home residents with capital below
the proposed higher capital threshold (£123,000 in 2017).
Our projections are that the Government’s plans would add just under £2 billion to public
expenditure on long-term care for older people by 2030 (at 2010 prices), compared with an extra
£3.3 billion for the central Dilnot recommendations. Combining the Government’s plans with a
halving of the rate of tariff income on capital between the lower threshold and the new higher upper
threshold would have a public expenditure cost of £2.1 billion by 2030. An alternative approach with
a similar cost would be to raise the lower capital threshold to around £40,000 in 2010 prices
(£41,600 in 2017 prices).
We project that under the government plans there would be some 115,000 more care service users
receiving some public funding in 2030 than if the current system continued. This is in contrast to
around 185,000 more publicly funded users in 2030 that we project under the central Dilnot
recommendation. Supplementing the government plans with a halving of the rate of tariff income on
capital between the upper and lower thresholds or increasing the lower threshold to £40,000 would
mean around 1,500 more publicly funded users than under the government plan alone.
The estimated weekly gains in absolute terms from all the reform options are greatest amongst care
recipients in the highest quintile (fifth) of the income distribution for older people. For example, in
2030, the Government’s plans would be worth £52 per week (2010 prices) on average to care
recipients aged 85+ in the highest quintile compared with £20 for those in the lowest quintile.
Expressed as percentages of income the gains vary much less across the income distribution.
Focussing on care home residents, both of the two variants on the Government’s plans would be
particularly advantageous, compared to the Government’s planned reform, to care home recipients
in the lowest three quintiles of the income distribution. In 2030 the average gains of care home
residents aged 85+ would be about 16% higher under these variants than under the proposed
reforms compared with around 6% higher for the upper two quintiles.
The system of financing long-term care in England is complex and will remain so after
implementation of the Government’s reform proposals. This makes it hard to assess the effects of
reforms without analysis such as we have presented in this paper. Our analyses have shown how
altering different parameters in this complex system affect the costs to public funds and the financial
benefits for older people in different parts of the income distribution.

Long-term care funding in England
12
References
Commission on Funding Care and Support (2011) Fairer Care Funding: The Report of the Commission
on Funding Care and Support, Department of Health, London. Available at:
https://www.wp.dh.gov.uk/carecommission/files/2011/07/Fairer-Care-Funding-Report.pdf.
Accessed 13/03/2013
Chancellor of the Exchequer (2013) Budget 2013 Statement. Available at: http://www.hm-
treasury.gov.uk/budget2013_statement.htm. Accessed 21/03/2013
Department of Health (2013) Policy Statement on Care and Support Funding Reform and Legislative
Requirements, Department of Health, London. Available at:
http://www.dh.gov.uk/health/files/2013/02/Policy-statement-on-funding-reform.pdf. Accessed
13/03/2103
Her Majesty’s Government (2012) Caring for our Future: Progress Report on Funding Reform, Cm
8381, TSO, London.
Office for Budget Responsibility (2012) Fiscal Sustainability Report, July 2012. Available at:
http://cdn.budgetresponsibility.independent.gov.uk/FSR2012WEB.pdf. Accessed 4/04/2013
Office for National Statistics (2011) National Population Projections, 2010-based Projections, Office
for National Statistics, London.
Wittenberg R, Hu B, Hancock R, Morciano M, Comas-Herrera A, Malley J, King D (2011) Projections of
Demand for and Costs of Social Care for Older People in England, 2010 to 2030, under Current and
Alternative Funding Systems: Report to the Commission on Funding of Care and Support, PSSRU
Discussion Paper 2811, Personal Social Services Research Unit, London.