long-term aging of nox sensors in heavy-duty engine exhaust · x sensors in heavy-duty engine...
TRANSCRIPT

Long-Term Aging of NOx Sensors in Heavy-Duty Engine Exhaust
byJohn OrbanDavid Wendt
(Battelle)
Presented at the 10th Diesel Engine Emissions Reduction (DEER) Conference
September 1, 2004Coronado, CA

7/22/04 2
APBF-DEC Participants
Automobile:DaimlerChryslerFordGMToyota
Engines:CaterpillarCummins Detroit DieselEMAInternational Truck
& EngineJohn DeereMack Trucks
Energy/Additives:American Chemistry
CouncilAPIBPCastrolChevron OroniteChevronTexacoCibaConoco-PhillipsCromptonErgonEthylExxonMobilInfineumLubrizolMarathon AshlandMotivaNPRAPennzoil-Quaker StateShell Global SolutionsValvoline
Government:CARB/SCAQMDDOEEPA NRELORNL
Emission Control:ArgillonArvinMeritorBentelerClean Diesel Tech.CorningDelphiDonaldson Co.EngelhardJohnson MattheyMECANGK InsulatorsRhodiaRobert Bosch Corp.STT Emtec ABTenneco Automotive3MUmicore
Technology:Battelle

7/22/04 3
Acknowledgements
Project Monitor• Ralph McGill (ORNL)
Technical Working Group• Eric Liang (Caterpillar), Co-Chair
Testing Lab Project Leaders• Magdi Khair (SwRI)• Chris Sharp (SwRI)
NOx Sensor Supplier• NGK Insulators

7/22/04 4
Study Objectives
Demonstrate the Performance and Durability of NOx Sensors During 6,000 Hours of Operation• Engine-Out (up to 600 ppm)• Post Catalyst (up to 250 ppm)• Steady-State (13 ESC modes)

7/22/04 5
Study Questions(NOx Sensor Study)
1. How well do the NOx sensor voltages correlate with the NOx analyzer readings?
2. What is the relationship between NOx sensor voltages and NOx analyzer readings at a given location? Does it change over time or by mode?
3. Are there systematic changes in sensor performance (overall or at a given sensor location)?
4. How often do sensors need to be recalibrated? 5. What is the expected lifetime of the NOx sensors? 6. Does the variability of the NOx sensors change over
time or by mode (after corrections for NOx analyzer readings)?
7/22/04 6
Study Questions(NOx Sensor Study)
1. How well do the NOx sensor voltages correlate with the NOx analyzer readings?
2. What is the relationship between NOx sensor voltages and NOx analyzer readings at a given location? Does it change over time or by mode?
3. Are there systematic changes in sensor performance (overall or at a given sensor location)?
4. How often do sensors need to be recalibrated? 5. What is the expected lifetime of the NOx sensors? 6. Does the variability of the NOx sensors change over
time or by mode (after corrections for NOx analyzer readings)?

7/22/04 7
Methods
25 Sensors• Engine-out (5 sensors)• Post DPF, pre SCR (10 sensors – 5 per leg)• Post clean-up catalyst (6+4 sensors)• 21 with lab-grade electronics, 4 w/ production-grade
Periodic Comparisons with Analyzer Readings• Measure at 13 ESC modes every 120 hours• 8 sets of comparisons every 1000 hours
Independent Calibration Every 2,000 hours

7/22/04 8
Engine
Turbo
CatalyzedDPFs (2)
UreaInjection
Systems (2)
SCR Catalysts(2)
CleanupCatalyst
NOx Sensor Position 3
(0-500ppm)
3-5
3-1
3-2
3-3
3-4
Flow
3-63-7C
3-9C3-8C
3-10C
n-5n-4n-3n-2n-1Flow
n = Location (see above)
Right
Left
NOx Sensor Position 2R(0-1500ppm)
NOx Sensor Position 2L(0-1500ppm)
NOx Sensor Position 1(0-1500ppm)
Detail for Positions 1, 2R, 2L
NOx CLA* Probe B1
NOx CLA* Probe B2
NOx CLA* Probe B3
NOx CLA* Probe A1
NOx CLA* Probe A2
NOx CLA* Probe A3
*CLA = Chemiluminescent AnalyzerNote: In each group of five, NOx sensors are spaced evenly around top of pipe between “10 o’clock and 2 o’clock” positions
Exhaust NOx Instrumentation Layout

7/22/04 9
Analysis Approach
Preliminary Analysis• Resolve data collection issues
Fit Simple Linear Regression Model• Sensor Voltage = a + b*(analyzer ppm)• Evaluate deviations
By sensor, by mode, versus timeFit Multiple Regression Model• Volt = a + b*ppm + (time, sensor, mode effects & interactions)• Estimate mode effects and rates of change by sensor
Confirm Results by Comparing Initial and 2,000-Hour Calibration Data

7/22/04 10
Overview of Findings- Durability Results
Voltages from Pre-Catalyst Sensors (100-600 ppm)• Most (12 of 15) degraded by 3% to 4%• Three degraded by 5% to 7%
Voltages from Post-Catalyst Sensors (10-200 ppm)• Most (8 of 10 sensors) had minimal degradation• One sensor (3-10C) did not operate properly (data not shown)• One (3-3) demonstrated low sensitivity at the start of testing and
significant degradation (30%) over 2000 hours Cause of Failures and Degradation Unknown at This Time• Sensor problem?• Electronics?• Misconnection?• Installation?

7/22/04 11
Sensor Position 1:Sensor Voltage vs. Analyzer ppm
By Sensor By Mode

7/22/04 12
Sensor Position 1:Residual (observed-predicted) vs. Time
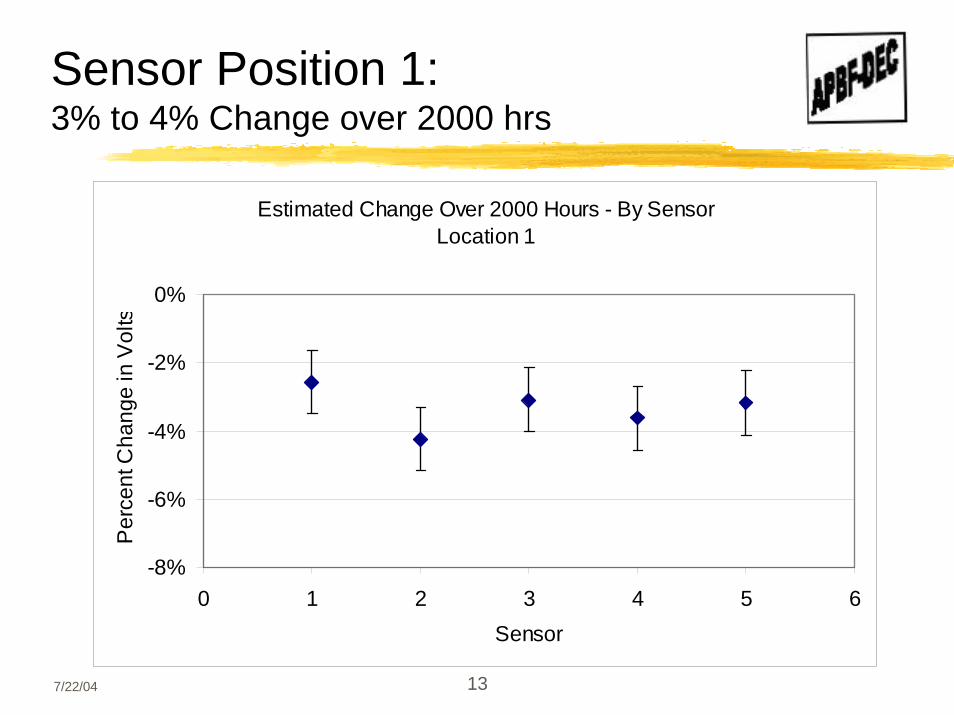
All sensors appear to degrade linearly• Approximately 4% change over 2,000 hours
Slight variations in rates of change by sensor• Sensor No. 2 changing more quickly
Residuals for Location 1
-0.04-0.03-0.02-0.01
00.010.020.030.04
0 500 1000 1500 2000
Hours
Obs
erve
d - P
redi
cted
(v
olts
)
1-11-21-31-41-5
Sensor
7/22/04 13
Sensor Position 1: 3% to 4% Change over 2000 hrs
Location 1Estimated Change Over 2000 Hours - By SensorLocation 1
-8%
-6%
-4%
-2%
0%
0 1 2 3 4 5 6Sensor
Per
cent
Cha
nge
in V
olts

7/22/04 14
Sensor Positions 2L, 2R:Residual (observed-predicted) vs. Time
Residuals for Location 2L
-0.04
-0.03-0.02
-0.010.00
0.01
0.020.03
0.04
0 500 1000 1500 2000
Hours
Obs
erve
d - P
redi
cted
(vol
ts)
2L-12L-22L-32L-42L-5
Residuals for Location 2R
-0.04
-0.03-0.02
-0.01
0.00
0.010.02
0.03
0.04
0 500 1000 1500 2000
HoursO
bser
ved
- Pre
dict
ed (v
olts
)
2R-12R-22R-32R-42R-5
Sensor
Sensor
Results generally similar to sensors in location 1• Approximately 4% change over 2,000 hours
Three sensors in location 2L show higher degradation• Between 5% and 7% change over 2,000 hours

7/22/04 15
Sensor Positions 2L, 2R:3% to 7% Change over 2000 hrs
Estimated Change Over 2000 Hours - By SensorLocation 2L
-8%
-6%
-4%
-2%
0%
0 1 2 3 4 5 6Sensor
Per
cent
Cha
nge
in V
olts
Estimated Change Over 2000 Hours - By SensorLocation 2R
-8%
-6%
-4%
-2%
0%
0 1 2 3 4 5 6Sensor
Per
cent
Cha
nge
in V
olts

7/22/04 16
Initial vs. 2000-hr. Calibrations(percent error from initial calibration)
Relative Calibration Error at Locations 1, 2L and 2R(Initial versus Final Calbration Data)
-25%
-20%
-15%
-10%
-5%
0%
5%
10%
0 200 400 600 800 1000 1200 1400 1600
Actual Concentrations (ppm)
Calib
ratio
n Er
ror (
%)
Initial Calibration Data 2000 Hour Calibration Data
Operating Range
2L-22L-5

7/22/04 17
Sensor Position 3:Residual (observed-predicted) vs. Time
Residuals for Location 3
-0.15-0.10
-0.050.000.05
0.100.15
0 500 1000 1500 2000Hours
Obs
erve
d - P
redi
cted
(Vol
ts)
3-13-23-33-43-53-6
Residuals for Location 3C
-0.15
-0.10-0.05
0.000.05
0.100.15
0 500 1000 1500 2000Hours
Obs
erve
d - P
redi
cted
(vol
ts)
3-7c3-8c3-9c
Sensor Sens
or
Most sensors in location 3 show no significant degradation One sensor (3-3) shows more variability and degradation

7/22/04 18
Sensor Position 3:No Change – Except Sensor 3-3
Estimated Change Over 2000 Hours - By SensorLocation 3
-50%
-40%
-30%
-20%
-10%
0%
10%
20%
0 1 2 3 4 5 6 7Sensor
Per
cent
Cha
nge
in V
olts
Estimated Change Over 2000 Hours - By SensorLocation 3C
-50%
-40%
-30%
-20%
-10%
0%
10%
20%
0 1 2 3 4Sensor
Per
cent
Cha
nge
in V
olts

7/22/04 19
Initial vs. 2000-hr. Calibrations(percent error from initial calibration)
Relative Calibration Error at Locations 3 and 3C(Initial versus Final Calbration Data)
-100%-80%-60%-40%-20%
0%20%
0 100 200 300 400 500
Actual Concentrations (ppm)
Calib
ratio
n Er
ror (
%)
Initial Calibration Data 2000 Hour Calibration Data
Sensor 3-3
Operating Range

7/22/04 20
Overview of Findings- Effects of Operating Mode
Effects of Operating Mode on Sensor Calibration• Relative error due to operating mode is less
than 4% at engine-out concentrations• Relative errors as high as 12% at lower
concentrations• Possible adjustments based on speed and
torque

7/22/04 21
Differences Among Modes – Relative to Calibration Curve
-6%
-4%
-2%
0%
2%
4%
6%
0 1 2 3 4 5 6 7 8 9 10 11 12 13 14
ESC Mode
Perc
ent D
evia
tion
1
-6%
-4%
-2%
0%
2%
4%
6%
0 1 2 3 4 5 6 7 8 9 10 11 12 13 14
ESC Mode
Perc
ent D
evia
tion
2L2R
-15%
-10%
-5%
0%
5%
10%
15%
0 1 2 3 4 5 6 7 8 9 1011 12 13 14
ESC Mode
Perc
ent D
evia
tion
33C
Location 1 Locations 2L and 2R
Locations 3 & 3C

7/22/04 22
Effects of Speed and Torque on Sensor Calibration
-6%
-4%
-2%
0%
2%
4%
6%
1200 1300 1400 1500 1600 1700 1800 1900Speed (rpm)
Per
cent
Dev
iatio
n
Location 2L Location 2R
-6%
-4%
-2%
0%
2%
4%
6%
200 400 600 800 1000 1200 1400 1600Torque (ft lb)
Per
cent
Dev
iatio
n
Location 2L Location 2R
vs. Speed
vs. Torque

7/22/04 23
Preliminary Conclusions(based on first 2000 hours of a 6000-hr test)
On average, sensors used in pre-catalyst applications degrade linearly at a rate of 2% per 1,000 hours of operationSome degrade much faster• Investigation of failures is ongoing
Calibration depends somewhat on operating mode.
