long range side channel analysis on smartphone
TRANSCRIPT
Long Range Side Channel Analysis on Smartphone
Yong Xiao1, a, *, Xin Jin1, b and Yanhua Shen2, c 1Electric Power Research Institute, Guangzhou, China
2School of Materials Science and Engineering, South China University of Technology, Guangzhou, China [email protected], [email protected], [email protected]
*Corresponding author
Keywords: RF, Side Channel Analysis, GNU radio, RSA
Abstract: Smart phones have become an important tool in our daily lives. They also carry a lot of sensitive information, such as keys for mobile payment and credentials for e-mails. In this paper, we describe some experimental results about side-channel analysis of a smart phone running RSA cryptographic algorithm. Our target is a smartphone with the main CPU running at 1.2GHz. We took measurement from a distance of 10cm, and we could successfully identify the sequence of modular multiplications and squaring’s in the RSA algorithm. Our study shows that long range side-channel analysis could be a real-world threat.
1. Introduction Side Channel Analysis (SCA) has been a strong measure to break cryptographic algorithms for
more than a decade. SCA attacks target the implementation of cryptographic algorithms other than the mathematical security. The idea is to measure a physical property of a target device while processing cryptographic algorithms and then extract information about the secret out of the measurement. Such properties can be sound [1], timing [2], power consumption [3] and electromagnetic emanations [4]. Kocher et al. showed in 1999 that monitoring the power consumption of a smart card running an implementation of DES allows an attacker to retrieve the secret key. The related result has started a series of research work on Side-Channel attacks against the implementation of all common cryptographic algorithms.
While most of the attacks require physical access to the target device for the measurements (e.g. power consumption), and semi-invasive manipulation of the power supply, electromagnetic attacks [5] [6] can be mounted either in close proximity of or in long distance to the target device. The electromagnetic emanation induced by the switching activities in digital circuits tend to correlate with the data processed by the cryptographic module inside the target device. Notable techniques aiming at recovering the secrets based on correlation include Simple EM Analysis (SEMA) and Differential EM Analysis (DEMA) [4].
Recent years there have been research and experiment conducted showing that EM attacks can be applied from distance of around a meter, and target devices range from smart card, FPGA to laptop [7] [8].
This paper presents our work mounting an EM Side Channel Analysis using standard radio equipment and open source software. After introducing background information (section II), we explain about the measurement environment and test setups (section III). Practical attacks on the target device using both near-field probe and far-field antenna are implemented (section IV). Finally, a conclusion (section V) is given.
2. Background When the wavelength of the signal is comparable to the length of the wire, the current signal on
the wire will form a strong radiation, and thus the radiation signal can be collected at a relatively
2019 3rd International Conference on Mechanical and Electronics Engineering (ICMEE 2019)
Published by CSP © 2019 the Authors 219
long distance. The length of the conductor in the chip is very short, so the signal radiated from the chip at a long distance is mostly in the high frequency band. Our long-distance side channel acquisition experiment uses Software Defined Radio equipment. In the following sections, the architecture of the Software Defined Radio used in our work, as well as the band-pass sampling theorem and the principle of IQ modulation and demodulation are explained.
2.1 Software Defined Radio Software Defined Radio (SDR) is a new type of radio architecture that combines hardware and
software to enable reconfigurability of wireless networks and terminals. Generally speaking, SDR is to implement various communication modules in software on a common hardware platform. SDR provides an efficient and cost-effective solution for building multi-functional wireless devices supporting multi-band. The most interesting feature of SDR is the functional software, which enables the entire system to be reconfigured with dynamic software programming.
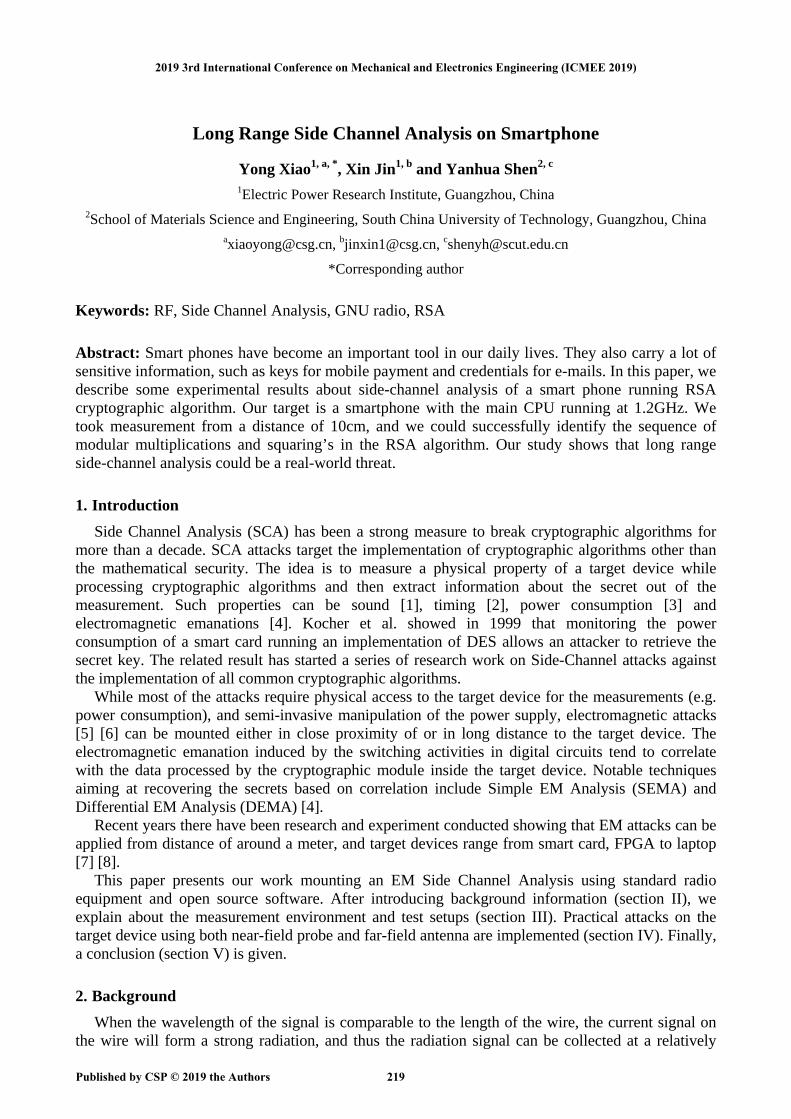
SDR has three common structures: low-pass sampling, RF direct-band sampling, and broadband mid-bandpass sampling. The low pass sampling SDR comes with a fully open RF front end. It is generally only suitable for applications where the working bandwidth is not very wide, such as the short-wave HF band (0.1-30MHz). The RF direct bandpass sampling SDR uses a tracking filter to filter out the required sub-bands, which are amplified and directly sampled by the Analog-to-Digital Converter (ADC). Since the sampled signal is an unconverted signal, it is called RF direct bandpass sampling. The broadband mid-bandpass sampling radio converts the signal received by the antenna into a unified intermediate frequency signal after multiple conversions, and then digitizes it. Its typical structure is shown in Figure 1. In the typical structure, after receiving the signal, the antenna is filtered and amplified, and enters the first-stage mixing to bring the signal to the intermediate frequency. After amplification, the signal enters the second-stage mixing, and finally is converted to an appropriate frequency, and then gets digitized. The broadband mid-bandpass sampling SDR has moderate hardware requirements, good achievability, and wide RF operating frequency response.
Figure 1 Baseband sampling SDR architecture
2.2 Digital modulation/demodulation Common signal modulation methods include amplitude modulation, frequency modulation and
phase modulation. All three modulation methods can be summarized into the following expressions:
𝑠𝑠(𝑡𝑡) = 𝑎𝑎(𝑡𝑡)cos [𝑤𝑤𝑐𝑐𝑡𝑡 + 𝜙𝜙(𝑡𝑡)] (1)
Where 𝑤𝑤𝑐𝑐 represents the carrier angular frequency, 𝑎𝑎(𝑡𝑡) reflects the adjustment of the amplitude of the baseband signal, 𝜙𝜙(𝑡𝑡) refers to the phase adjustment of the baseband signal, and the instantaneous frequency 𝑓𝑓(𝑡𝑡) = 𝜙𝜙(𝑡𝑡) − 𝜙𝜙(𝑡𝑡 − 1) from the phase difference reflects the frequency adjustment to the baseband signal. Expand (1):
𝑠𝑠(𝑡𝑡) = 𝑎𝑎(𝑡𝑡) cos[𝜙𝜙(𝑡𝑡)] cos(𝑤𝑤𝑐𝑐𝑡𝑡) − 𝑎𝑎(𝑡𝑡) sin[𝜙𝜙(𝑡𝑡)] sin(𝑤𝑤𝑐𝑐𝑡𝑡)
= 𝑋𝑋𝐼𝐼(𝑡𝑡) cos(𝑤𝑤𝑐𝑐𝑡𝑡) − 𝑋𝑋𝑄𝑄(𝑡𝑡) sin(𝑤𝑤𝑐𝑐𝑡𝑡) (2)
Where 𝑋𝑋𝐼𝐼(𝑡𝑡) = 𝑎𝑎(𝑡𝑡) cos[𝜙𝜙(𝑡𝑡)] is the in-phase component, and 𝑋𝑋𝑄𝑄(𝑡𝑡) = 𝑎𝑎(𝑡𝑡) sin[𝜙𝜙(𝑡𝑡)] is the quadrature component. The modulation method used by the device to transmit sensitive information based on the IQ demodulation method can achieve better results.
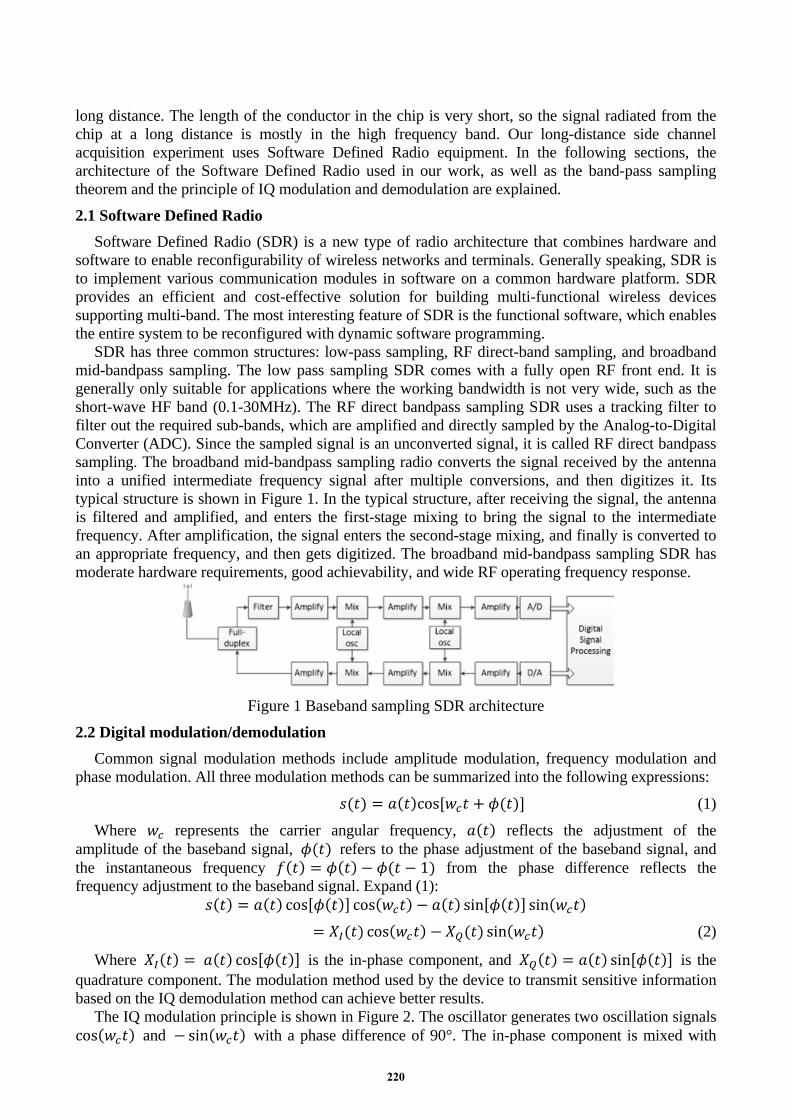
The IQ modulation principle is shown in Figure 2. The oscillator generates two oscillation signals cos(𝑤𝑤𝑐𝑐𝑡𝑡) and − sin(𝑤𝑤𝑐𝑐𝑡𝑡) with a phase difference of 90°. The in-phase component is mixed with
220
the oscillation signal cos(𝑤𝑤𝑐𝑐𝑡𝑡) . The orthogonal component is mixed with the oscillating signal− sin(𝑤𝑤𝑐𝑐𝑡𝑡), and the two mixed signals are summed to obtain a modulated RF signal𝑠𝑠(𝑡𝑡), which is finally transmitted by the antenna.
Figure 2 I/Q modulation
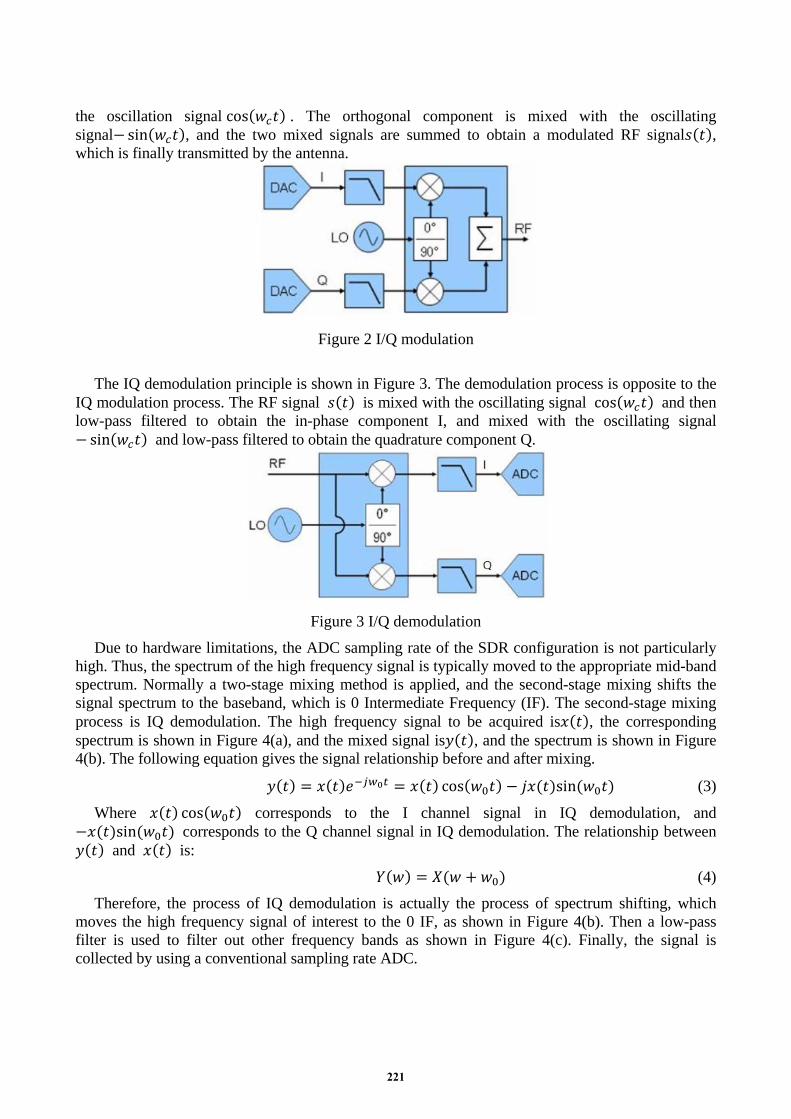
The IQ demodulation principle is shown in Figure 3. The demodulation process is opposite to the
IQ modulation process. The RF signal 𝑠𝑠(𝑡𝑡) is mixed with the oscillating signal cos(𝑤𝑤𝑐𝑐𝑡𝑡) and then low-pass filtered to obtain the in-phase component I, and mixed with the oscillating signal − sin(𝑤𝑤𝑐𝑐𝑡𝑡) and low-pass filtered to obtain the quadrature component Q.
Figure 3 I/Q demodulation
Due to hardware limitations, the ADC sampling rate of the SDR configuration is not particularly high. Thus, the spectrum of the high frequency signal is typically moved to the appropriate mid-band spectrum. Normally a two-stage mixing method is applied, and the second-stage mixing shifts the signal spectrum to the baseband, which is 0 Intermediate Frequency (IF). The second-stage mixing process is IQ demodulation. The high frequency signal to be acquired is𝑥𝑥(𝑡𝑡), the corresponding spectrum is shown in Figure 4(a), and the mixed signal is𝑦𝑦(𝑡𝑡), and the spectrum is shown in Figure 4(b). The following equation gives the signal relationship before and after mixing.
𝑦𝑦(𝑡𝑡) = 𝑥𝑥(𝑡𝑡)𝑒𝑒−𝑗𝑗𝑤𝑤0𝑡𝑡 = 𝑥𝑥(𝑡𝑡) cos(𝑤𝑤0𝑡𝑡) − 𝑗𝑗𝑥𝑥(𝑡𝑡)sin (𝑤𝑤0𝑡𝑡) (3)
Where 𝑥𝑥(𝑡𝑡) cos(𝑤𝑤0𝑡𝑡) corresponds to the I channel signal in IQ demodulation, and −𝑥𝑥(𝑡𝑡)sin (𝑤𝑤0𝑡𝑡) corresponds to the Q channel signal in IQ demodulation. The relationship between 𝑦𝑦(𝑡𝑡) and 𝑥𝑥(𝑡𝑡) is:
𝑌𝑌(𝑤𝑤) = 𝑋𝑋(𝑤𝑤 + 𝑤𝑤0) (4) Therefore, the process of IQ demodulation is actually the process of spectrum shifting, which
moves the high frequency signal of interest to the 0 IF, as shown in Figure 4(b). Then a low-pass filter is used to filter out other frequency bands as shown in Figure 4(c). Finally, the signal is collected by using a conventional sampling rate ADC.
221
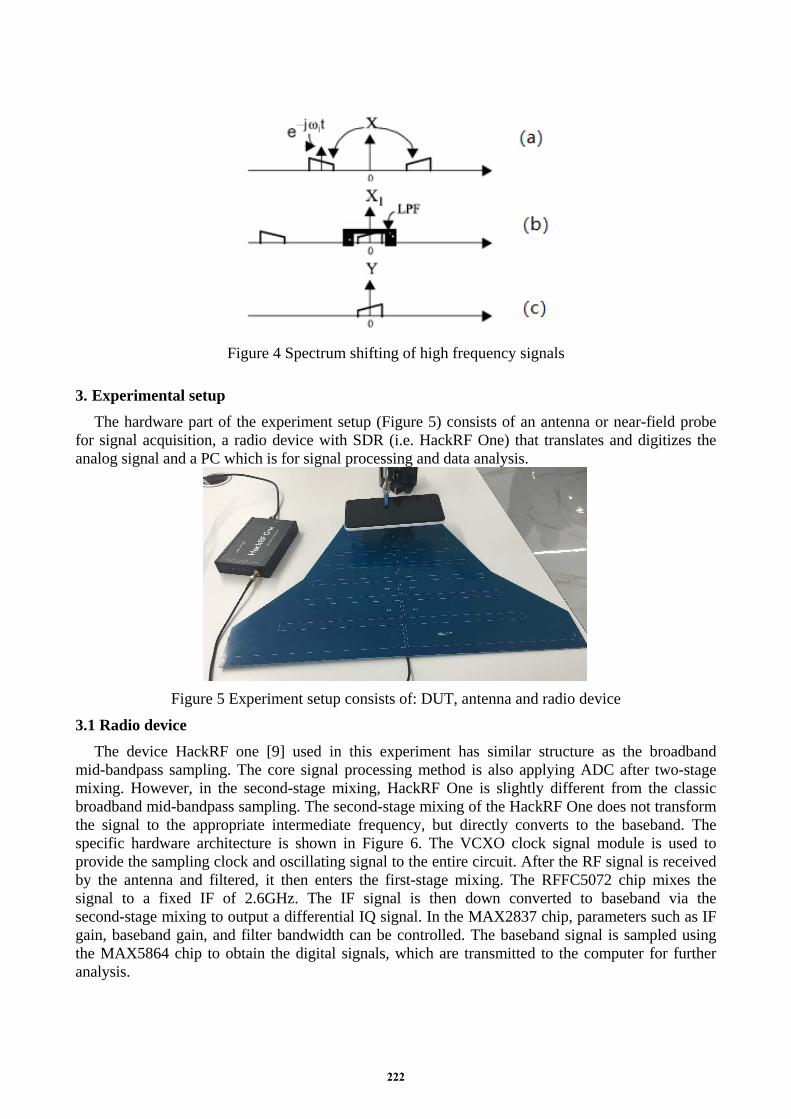
Figure 4 Spectrum shifting of high frequency signals
3. Experimental setup The hardware part of the experiment setup (Figure 5) consists of an antenna or near-field probe
for signal acquisition, a radio device with SDR (i.e. HackRF One) that translates and digitizes the analog signal and a PC which is for signal processing and data analysis.
Figure 5 Experiment setup consists of: DUT, antenna and radio device
3.1 Radio device The device HackRF one [9] used in this experiment has similar structure as the broadband
mid-bandpass sampling. The core signal processing method is also applying ADC after two-stage mixing. However, in the second-stage mixing, HackRF One is slightly different from the classic broadband mid-bandpass sampling. The second-stage mixing of the HackRF One does not transform the signal to the appropriate intermediate frequency, but directly converts to the baseband. The specific hardware architecture is shown in Figure 6. The VCXO clock signal module is used to provide the sampling clock and oscillating signal to the entire circuit. After the RF signal is received by the antenna and filtered, it then enters the first-stage mixing. The RFFC5072 chip mixes the signal to a fixed IF of 2.6GHz. The IF signal is then down converted to baseband via the second-stage mixing to output a differential IQ signal. In the MAX2837 chip, parameters such as IF gain, baseband gain, and filter bandwidth can be controlled. The baseband signal is sampled using the MAX5864 chip to obtain the digital signals, which are transmitted to the computer for further analysis.
222
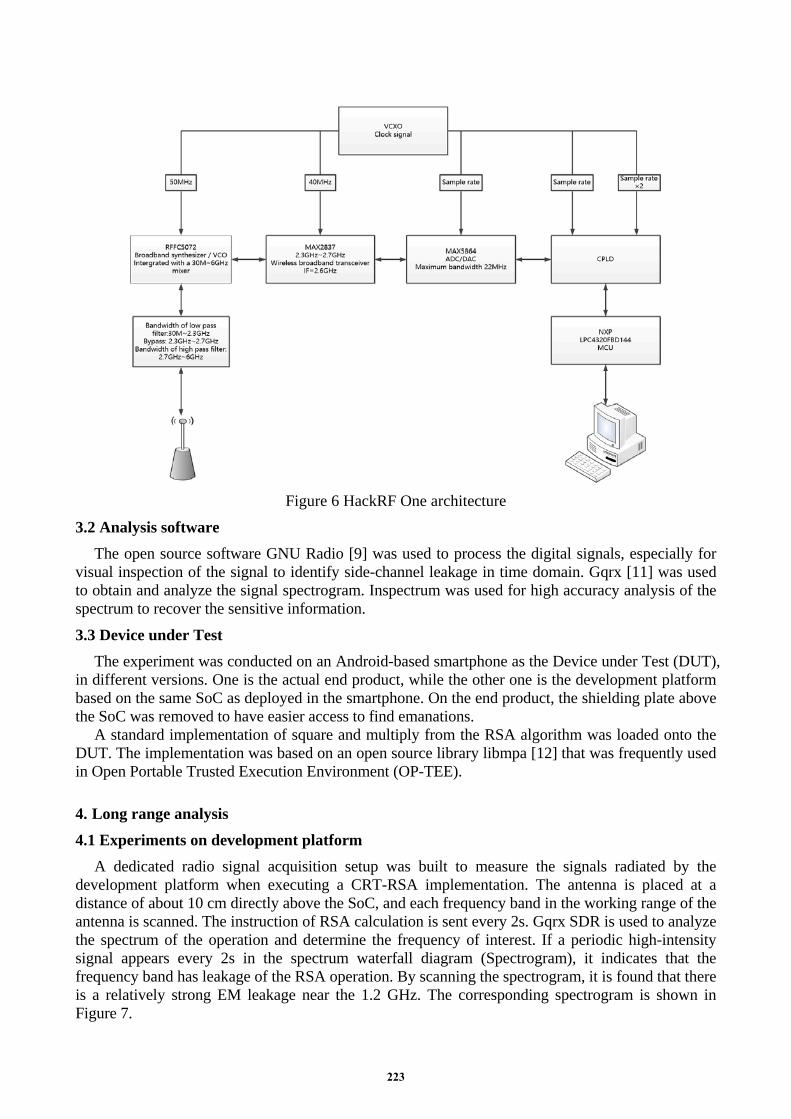
Figure 6 HackRF One architecture
3.2 Analysis software The open source software GNU Radio [9] was used to process the digital signals, especially for
visual inspection of the signal to identify side-channel leakage in time domain. Gqrx [11] was used to obtain and analyze the signal spectrogram. Inspectrum was used for high accuracy analysis of the spectrum to recover the sensitive information.
3.3 Device under Test The experiment was conducted on an Android-based smartphone as the Device under Test (DUT),
in different versions. One is the actual end product, while the other one is the development platform based on the same SoC as deployed in the smartphone. On the end product, the shielding plate above the SoC was removed to have easier access to find emanations.
A standard implementation of square and multiply from the RSA algorithm was loaded onto the DUT. The implementation was based on an open source library libmpa [12] that was frequently used in Open Portable Trusted Execution Environment (OP-TEE).
4. Long range analysis 4.1 Experiments on development platform
A dedicated radio signal acquisition setup was built to measure the signals radiated by the development platform when executing a CRT-RSA implementation. The antenna is placed at a distance of about 10 cm directly above the SoC, and each frequency band in the working range of the antenna is scanned. The instruction of RSA calculation is sent every 2s. Gqrx SDR is used to analyze the spectrum of the operation and determine the frequency of interest. If a periodic high-intensity signal appears every 2s in the spectrum waterfall diagram (Spectrogram), it indicates that the frequency band has leakage of the RSA operation. By scanning the spectrogram, it is found that there is a relatively strong EM leakage near the 1.2 GHz. The corresponding spectrogram is shown in Figure 7.
223

Figure 7 Spectrogram of 1.2 GHz
It can be seen from the comparison that the signal spreads to both sides centering on 1.200044 GHz as shown in Figure 8. From the harmonics one can spot that the RSA operation is divided into two segments, and the frequencies of the two segments are slightly different. The reason for this difference is because the RSA operation targeted here is in the form of CRT, which has two modular exponentiation that results in different computational loads. Subtle changes in the frequency caused by the different loads are modulated to the leakage of the frequency band near the 1.2 GHz clock frequency.
Figure 8 Spectrogram showing a single RSA operation
After identifying the frequency of interest, GNU Radio is used to acquire and analyze the EM trace during the RSA operation, to test whether a signal with higher time precision can be collected to recover the key.
The acquired trace is shown in Figure 9, where the zoomed view is shown in Figure 10 and Figure 11. The pattern from the trace is consistent with the operational characteristics of CRT-RSA.
Figure 9 Trace showing a single RSA operation
224
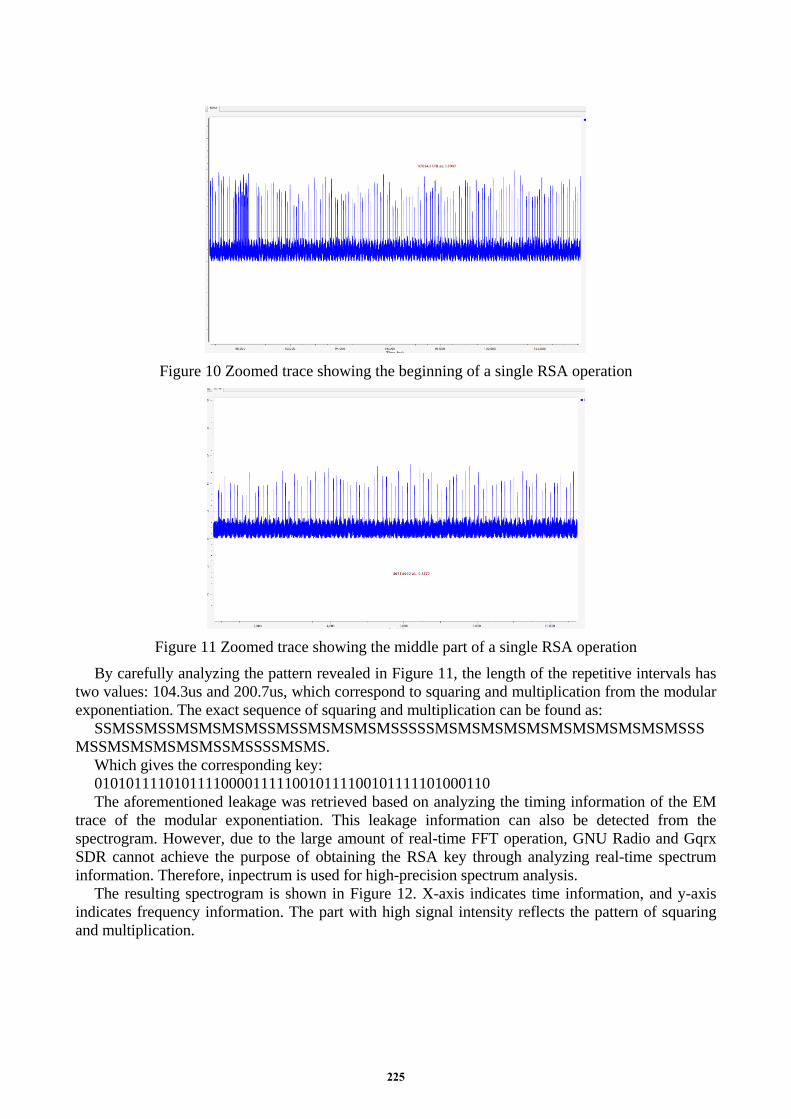
Figure 10 Zoomed trace showing the beginning of a single RSA operation
Figure 11 Zoomed trace showing the middle part of a single RSA operation
By carefully analyzing the pattern revealed in Figure 11, the length of the repetitive intervals has two values: 104.3us and 200.7us, which correspond to squaring and multiplication from the modular exponentiation. The exact sequence of squaring and multiplication can be found as:
SSMSSMSSMSMSMSMSSMSSMSMSMSMSSSSSMSMSMSMSMSMSMSMSMSMSMSSSMSSMSMSMSMSMSSMSSSSMSMS.
Which gives the corresponding key: 01010111101011110000111110010111100101111101000110 The aforementioned leakage was retrieved based on analyzing the timing information of the EM
trace of the modular exponentiation. This leakage information can also be detected from the spectrogram. However, due to the large amount of real-time FFT operation, GNU Radio and Gqrx SDR cannot achieve the purpose of obtaining the RSA key through analyzing real-time spectrum information. Therefore, inpectrum is used for high-precision spectrum analysis.
The resulting spectrogram is shown in Figure 12. X-axis indicates time information, and y-axis indicates frequency information. The part with high signal intensity reflects the pattern of squaring and multiplication.
225
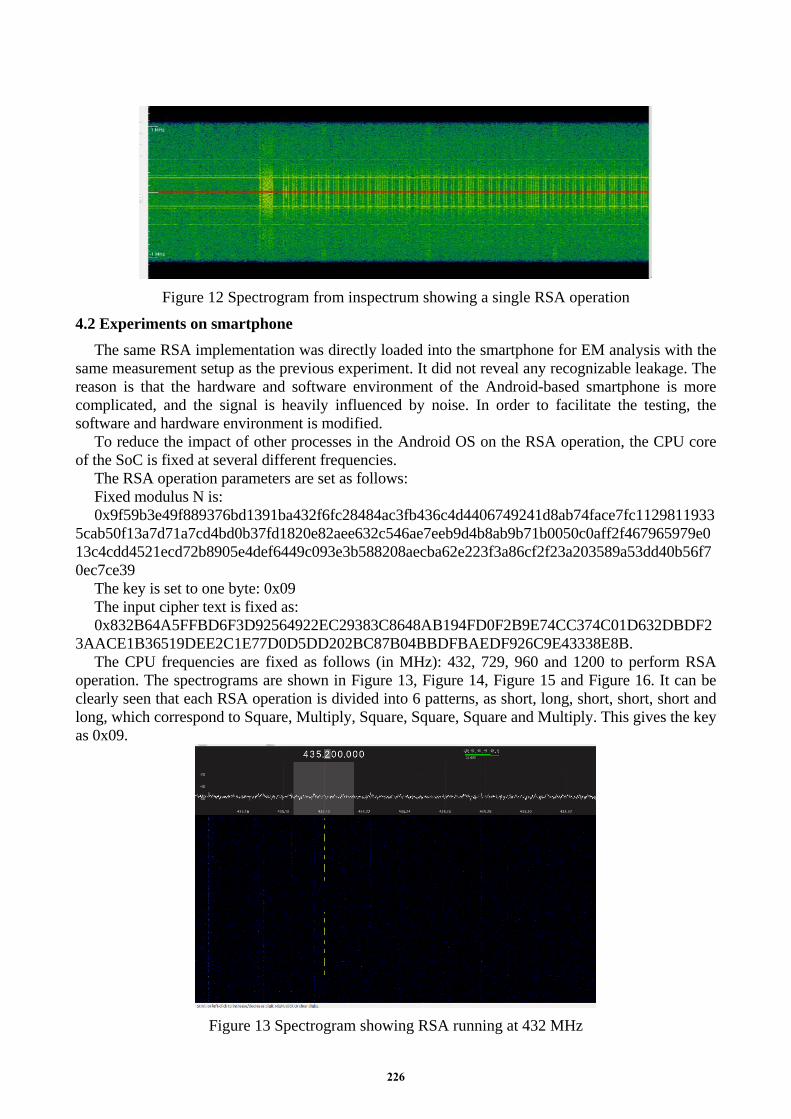
Figure 12 Spectrogram from inspectrum showing a single RSA operation
4.2 Experiments on smartphone The same RSA implementation was directly loaded into the smartphone for EM analysis with the
same measurement setup as the previous experiment. It did not reveal any recognizable leakage. The reason is that the hardware and software environment of the Android-based smartphone is more complicated, and the signal is heavily influenced by noise. In order to facilitate the testing, the software and hardware environment is modified.
To reduce the impact of other processes in the Android OS on the RSA operation, the CPU core of the SoC is fixed at several different frequencies.
The RSA operation parameters are set as follows: Fixed modulus N is: 0x9f59b3e49f889376bd1391ba432f6fc28484ac3fb436c4d4406749241d8ab74face7fc1129811933
5cab50f13a7d71a7cd4bd0b37fd1820e82aee632c546ae7eeb9d4b8ab9b71b0050c0aff2f467965979e013c4cdd4521ecd72b8905e4def6449c093e3b588208aecba62e223f3a86cf2f23a203589a53dd40b56f70ec7ce39
The key is set to one byte: 0x09 The input cipher text is fixed as: 0x832B64A5FFBD6F3D92564922EC29383C8648AB194FD0F2B9E74CC374C01D632DBDF2
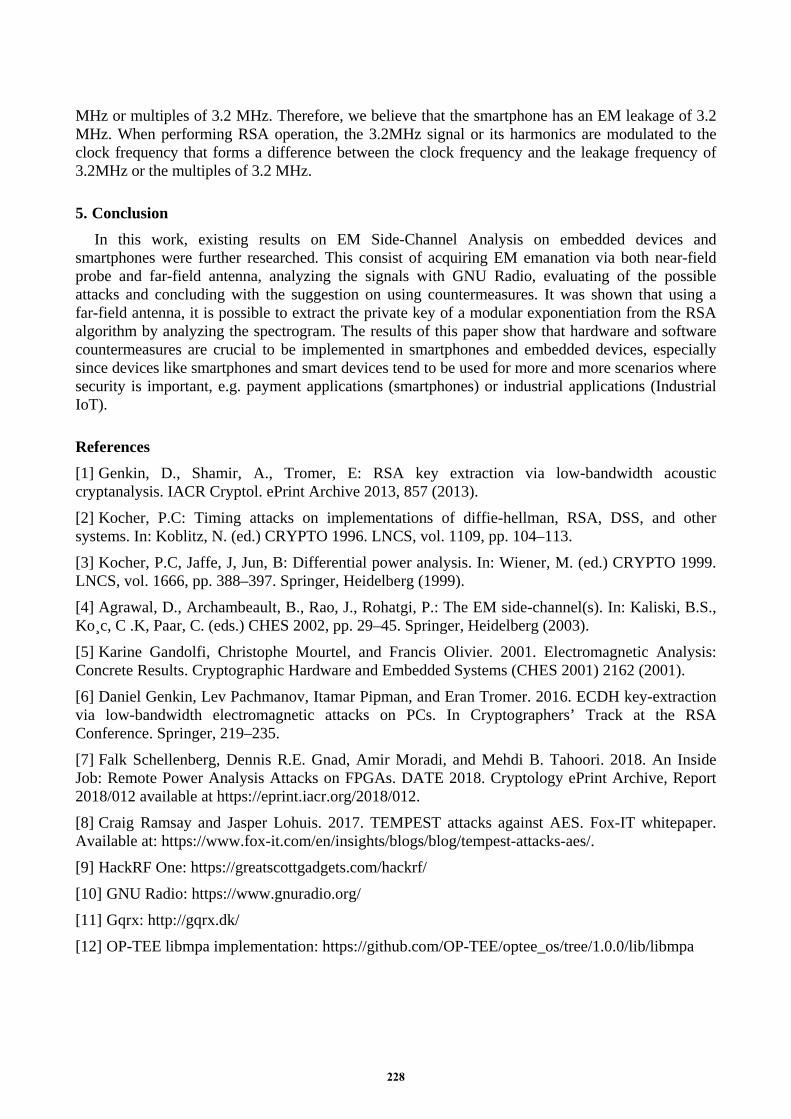
3AACE1B36519DEE2C1E77D0D5DD202BC87B04BBDFBAEDF926C9E43338E8B. The CPU frequencies are fixed as follows (in MHz): 432, 729, 960 and 1200 to perform RSA
operation. The spectrograms are shown in Figure 13, Figure 14, Figure 15 and Figure 16. It can be clearly seen that each RSA operation is divided into 6 patterns, as short, long, short, short, short and long, which correspond to Square, Multiply, Square, Square, Square and Multiply. This gives the key as 0x09.
Figure 13 Spectrogram showing RSA running at 432 MHz
226

Figure 14 Spectrogram showing RSA running at 729 MHz
Figure 15 Spectrogram showing RSA running at 960 MHz
Figure 16 Spectrogram showing RSA running at 1200 MHz
Table 1 Three Scheme comparing
Clock frequency (MHz) 432.0 729.0 960.0 1200.0 Leakage frequency (MHz) 435.2 736.0 966.4 1203.2
Difference (MHz) 3.2 7.0 6.4 3.2 Table 1 listed the clock frequency and the leakage frequency according to the experiment results
from Figure 13 to Figure 16. Observe the frequency differences, 3 of the 4 frequency values are 3.2 227
MHz or multiples of 3.2 MHz. Therefore, we believe that the smartphone has an EM leakage of 3.2 MHz. When performing RSA operation, the 3.2MHz signal or its harmonics are modulated to the clock frequency that forms a difference between the clock frequency and the leakage frequency of 3.2MHz or the multiples of 3.2 MHz.
5. Conclusion In this work, existing results on EM Side-Channel Analysis on embedded devices and
smartphones were further researched. This consist of acquiring EM emanation via both near-field probe and far-field antenna, analyzing the signals with GNU Radio, evaluating of the possible attacks and concluding with the suggestion on using countermeasures. It was shown that using a far-field antenna, it is possible to extract the private key of a modular exponentiation from the RSA algorithm by analyzing the spectrogram. The results of this paper show that hardware and software countermeasures are crucial to be implemented in smartphones and embedded devices, especially since devices like smartphones and smart devices tend to be used for more and more scenarios where security is important, e.g. payment applications (smartphones) or industrial applications (Industrial IoT).
References [1] Genkin, D., Shamir, A., Tromer, E: RSA key extraction via low-bandwidth acoustic cryptanalysis. IACR Cryptol. ePrint Archive 2013, 857 (2013). [2] Kocher, P.C: Timing attacks on implementations of diffie-hellman, RSA, DSS, and other systems. In: Koblitz, N. (ed.) CRYPTO 1996. LNCS, vol. 1109, pp. 104–113. [3] Kocher, P.C, Jaffe, J, Jun, B: Differential power analysis. In: Wiener, M. (ed.) CRYPTO 1999. LNCS, vol. 1666, pp. 388–397. Springer, Heidelberg (1999). [4] Agrawal, D., Archambeault, B., Rao, J., Rohatgi, P.: The EM side-channel(s). In: Kaliski, B.S., Ko¸c, C .K, Paar, C. (eds.) CHES 2002, pp. 29–45. Springer, Heidelberg (2003). [5] Karine Gandolfi, Christophe Mourtel, and Francis Olivier. 2001. Electromagnetic Analysis: Concrete Results. Cryptographic Hardware and Embedded Systems (CHES 2001) 2162 (2001). [6] Daniel Genkin, Lev Pachmanov, Itamar Pipman, and Eran Tromer. 2016. ECDH key-extraction via low-bandwidth electromagnetic attacks on PCs. In Cryptographers’ Track at the RSA Conference. Springer, 219–235. [7] Falk Schellenberg, Dennis R.E. Gnad, Amir Moradi, and Mehdi B. Tahoori. 2018. An Inside Job: Remote Power Analysis Attacks on FPGAs. DATE 2018. Cryptology ePrint Archive, Report 2018/012 available at https://eprint.iacr.org/2018/012. [8] Craig Ramsay and Jasper Lohuis. 2017. TEMPEST attacks against AES. Fox-IT whitepaper. Available at: https://www.fox-it.com/en/insights/blogs/blog/tempest-attacks-aes/. [9] HackRF One: https://greatscottgadgets.com/hackrf/ [10] GNU Radio: https://www.gnuradio.org/ [11] Gqrx: http://gqrx.dk/ [12] OP-TEE libmpa implementation: https://github.com/OP-TEE/optee_os/tree/1.0.0/lib/libmpa
228