long finance what are the frontiers for the risk management profession? financ… · ·...
TRANSCRIPT

© Z/Yen Group
2015
Long Finance – What Are The Frontiers For The Risk Management Profession?
Professor Michael Mainelli FCCA FCSI FBCS
Executive Chairman, Z/Yen Group

© Z/Yen Group
2015
Z/Yen Group Limited
Risk Reward Managers
90 Basinghall Street
London EC2V 5AY
United Kingdom
tel: +44 (20) 7562-9562 www.zyen.com
“Zest for Enlightenment”
PRMIA Webinar
Long Finance What Are The Frontiers For The Risk Management
Profession?
Professor Michael Mainelli
Executive Chairman, Z/Yen Group Limited [email protected]
4 February 2015
@mrmainelli

© Z/Yen Group
2015
♦ Special – City of London’s leading commercial think-tank
♦ Services – projects, strategy, expertise on demand,
coaching, research, analytics, modern systems
♦ Sectors – technology, finance, voluntary, professional
services, outsourcing
Independent Publisher Book Awards Finance, Investment &
Economics Gold Prize 2012 for The Price of Fish
British Computer Society IT Director of the Year 2004 for
PropheZy and VizZy
DTI Smart Award 2003 for PropheZy
Sunday Times Book of the Week, Clean Business Cuisine
£1.9M Foresight Challenge Award for Financial £aboratory
visualising financial risk 1997
Z/Yen

© Z/Yen Group
2015
1. Do you recognise four or more of the
following terms: 1. Predictive Analytics or Big Data 2. Dynamic Anomaly & Pattern Response 3. Activity-based Cost Variance 4. Environmental Consistency Confidence 5. Confidence Accounting 6. Prediction Markets 7. Enterprise Risk/Reward Management
Quick Poll Question

© Z/Yen Group
2015
Agenda
♦ Research agenda
♦ Experiments
1. DAPR
2. Activity-based cost variance
3. Environmental Consistency Confidence
4. Confidence Accounting
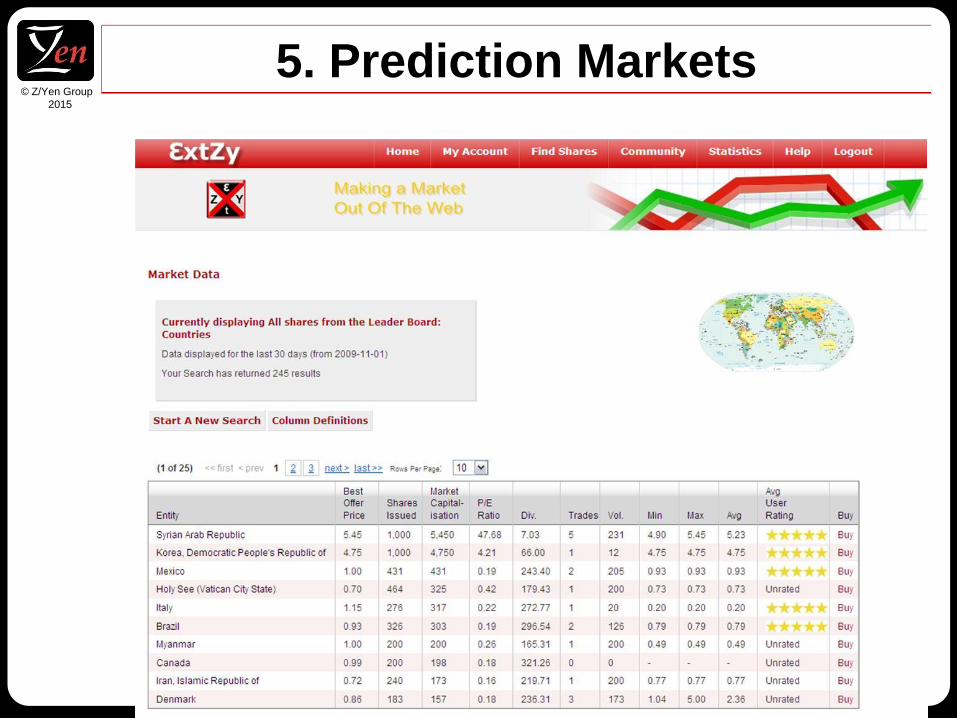
5. Prediction markets
6. Enterprise risk/reward management
♦ Long Finance & Money
“Get a detailed grip on the big picture.”
Chao Kli Ning

© Z/Yen Group
2015
♦ Blockchains (current)
♦ Long Finance predicting bubbles (current)
♦ LIBOR and FX litigation (current)
♦ Prediction markets (1998-present) –
www.extzy.com
♦ Market Intelligence – Ministry of Defence,
e.g. Vision 2020 (1994-present)
♦ Avatars for Big Data (2010-2012)
♦ PropheZy and VizZy – Automation of
Compliance monitoring (2003-2008)
♦ Financial £aboratory Club visualising risk
(1997-1998)
Z/Yen in Finance Research

© Z/Yen Group
2015
Finance - Pricing Risk is All
Risk Selection
Value Pricing
Customers
Capital
“If a man will begin with certainties, he will end in doubts;
but if he will be content to begin with doubts, he will end in certainties.”
Francis Bacon

© Z/Yen Group
2015
Financial £aboratory 1996-1998
Display
Usa
ge
Realistic
Analagous
Abstract
Zone 1 Zone 2
Zone 3 Zone 4
Symbolic
Spreadsheets
Road Signs
VCR Controls
Flight Simulators

© Z/Yen Group
2015
Best Execution Research 2004-2005
The trades in the centre are
those that fell within the
bid/offer spread
The trades on either side
were executed outside the
bid/offer spread

© Z/Yen Group
2015
Predicting Price Movement 2005
Broker B: Differences between Actual and Predicted Price Movement Bands (by day)
0%
10%
20%
30%
40%
50%
60%
70%
80%
90%
100%
78 79 80 81 82 83 84 85 86 87 88 89 90 91 92 93 94 95 98 99 100
Trade date code
Num
ber
of o
bser
vatio
ns (a
s a
perc
enta
ge o
f the
dai
ly to
tal)
Difference within 4 bands Difference within 5-9 bands Difference within 10-14 bands Outliers (Difference of 15 bands or more)

© Z/Yen Group
2015
Compliance Workbench 2005
These four trades are the most anomalous
(the difference between actual and
predicted is 18)
This set of trades are the least anomalous
(the difference between actual and
predicted is 1)

© Z/Yen Group
2015
Incidents & Losses 2005
0
2
4
6
8
10
12
Ja
n-0
3
Ma
r-03
Ma
y-0
3
Ju
l-03
Sep-0
3
No
v-0
3
Ja
n-0
4
Ma
r-04
Ma
y-0
4
Ju
l-0
4
Sep
-04
No
v-0
4
Ja
n-0
5
Ma
r-05
Ma
y-0
5
Ju
l-0
5
model actual

© Z/Yen Group
2015
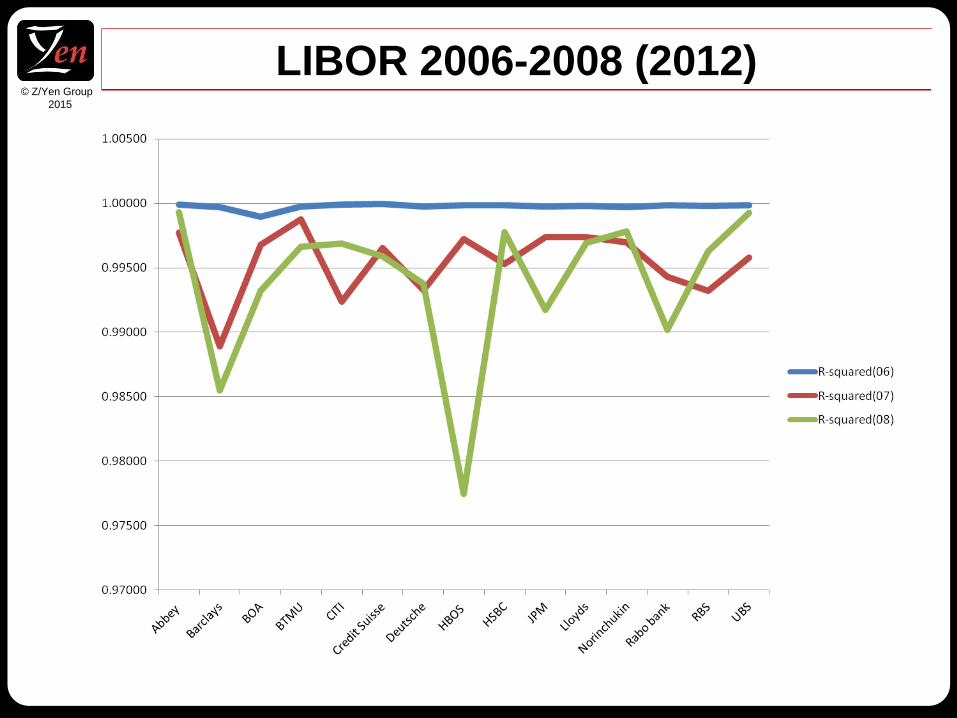
LIBOR 2007-2008
© Z/Yen Group
2015
LIBOR 2006-2008 (2012)

© Z/Yen Group
2015
Existing Approaches
Standards -
fiduciary ratings
ISO9000, SAS70
Manual Necessity 6Ʃ
6.0 3.4 99.9997%
5.0 320 99.98%
4.0 6,210 99.4%
3.0 66,800 93.3%
2.0 308,000 69.2%
1.0 690,000 30.9%
Sigma DPMO Yield
Process Modelling

© Z/Yen Group
2015
2. Which is the most important thing to control
risk?
a. Measure
b. Motivate
c. Manage
Quick Poll Question

© Z/Yen Group
2015
Philosophical Splits
Six Sigma ISO9000
Total Quality
Checklists
Procedures
Inspection
Numerical targets
Engineering
Automation
Contribution
Commitment
Culture
Measure Manage
Motivate

© Z/Yen Group
2015
The Year(s) of OpRisk in Finance?
♦ 199X to 200X – market and credit
analogies
♦ 2007 – present, crises and reputation
♦ Technology
♦ Knowledge - what price risk?
♦ Willpower - why do anything? no capital
allocation?
♦ Discipline - imposed? Basel?
“Perfect numbers like perfect men are very rare.”
René Descartes

© Z/Yen Group
2015
Nupe Sand Divining
[Source: http://www.necep.net/scripts/detail.php?id=89]
© Z/Yen Group
2015
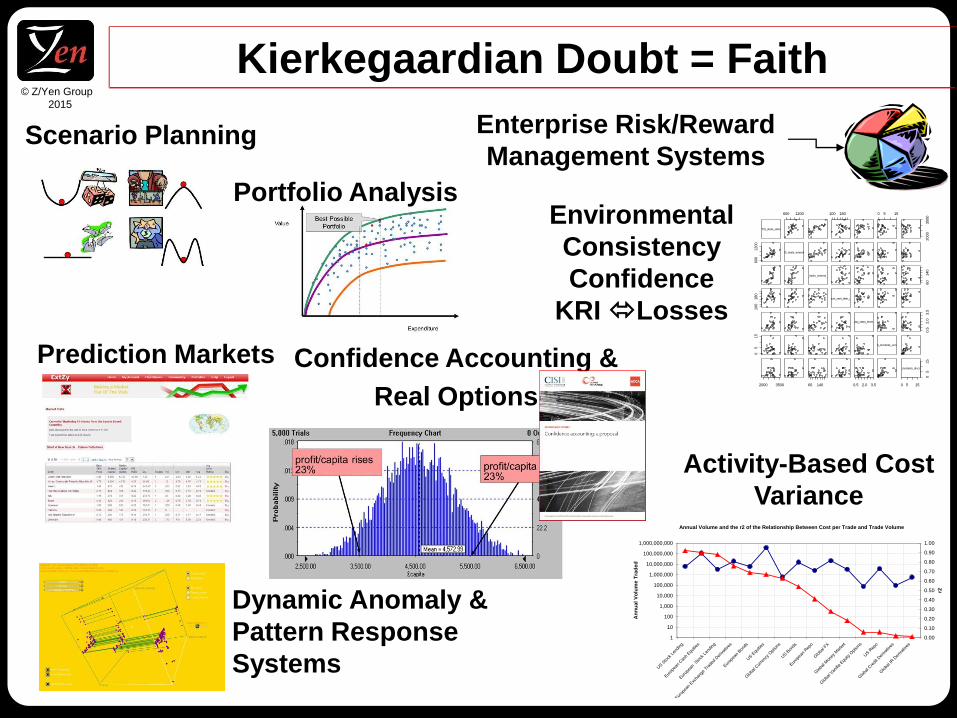
Activity-Based Cost
Variance
Kierkegaardian Doubt = Faith
Annual Volume and the r2 of the Relationship Between Cost per Trade and Trade Volume
1
10
100
1,000
10,000
100,000
1,000,000
10,000,000
100,000,000
1,000,000,000
US S
tock
Len
ding
Europ
ean
Cas
h Equ
ities
Europ
ean
Sto
ck L
ending
Europ
ean
Exc
hang
e Tra
ded
Der
ivat
ives
Europ
ean
Bon
ds
US E
quities
Globa
l Cur
renc
y Opt
ions
US B
onds
Europ
ean
Rep
o
Globa
l FX
Globa
l Mon
ey M
arke
t
Globa
l Van
illa E
quity
Opt
ions
US R
epo
Globa
l Cre
dit D
erivat
ives
Globa
l IR D
erivat
ives
An
nu
al
Vo
lum
e T
rad
ed
0.00
0.10
0.20
0.30
0.40
0.50
0.60
0.70
0.80
0.90
1.00
r2
Total Volume r2
Dynamic Anomaly &
Pattern Response
Systems
Environmental
Consistency
Confidence
KRI Losses
Enterprise Risk/Reward
Management Systems
TIS_deals_done
600 1200 100 180 0 5 15
2000
3500
600
1200
TIS_deals_amended
TIS_deals_entered_late
60
140
100
180
Contracts_sent_after_delivery
X30_day_stdev_brent_price
0.5
2.0
3.5
05
15
BITS_incidents_occurred
2000 3500 60 140 0.5 2.0 3.5 0 5 15
05
15
BITS_incidents_discovered
Prediction Markets
Scenario Planning
Portfolio Analysis
Confidence Accounting &
Real Options

© Z/Yen Group
2015
1. Dynamic Anomaly & Pattern Response
♦ Dynamic Initiates an action
Real-time
♦ Anomaly & Pattern Identifies unusual behaviour
Reinforces successful patterns
♦ Response Adaptive, moves with the data
Integrative, can work without rebuilding the entire IT architecture

© Z/Yen Group
2015
Anomalies
Y Axis: Share Identification Code
X Axis: Actual & Predicted Price Movement Bands – the length of the yellow link indicates the difference between the prediction and the actual value - the longest links represent the anomalous trades
Z Axis: The Difference between Actual
& Predicted Price Movement Bands

© Z/Yen Group
2015
♦ Best execution compliance automation
♦ Operational risks and losses
♦ LIBOR surveillance
…
♦ FX surveillance
♦ Liquidity prediction
♦ Non-STP correction
♦ Customer targeting
♦ Trade performance benchmarking
♦ Opening prices
♦ Automated “tipster” and “avatars”
♦ Anti-money laundering…
Dynamic Anomaly & Pattern Response
In Finance
© Z/Yen Group
2015
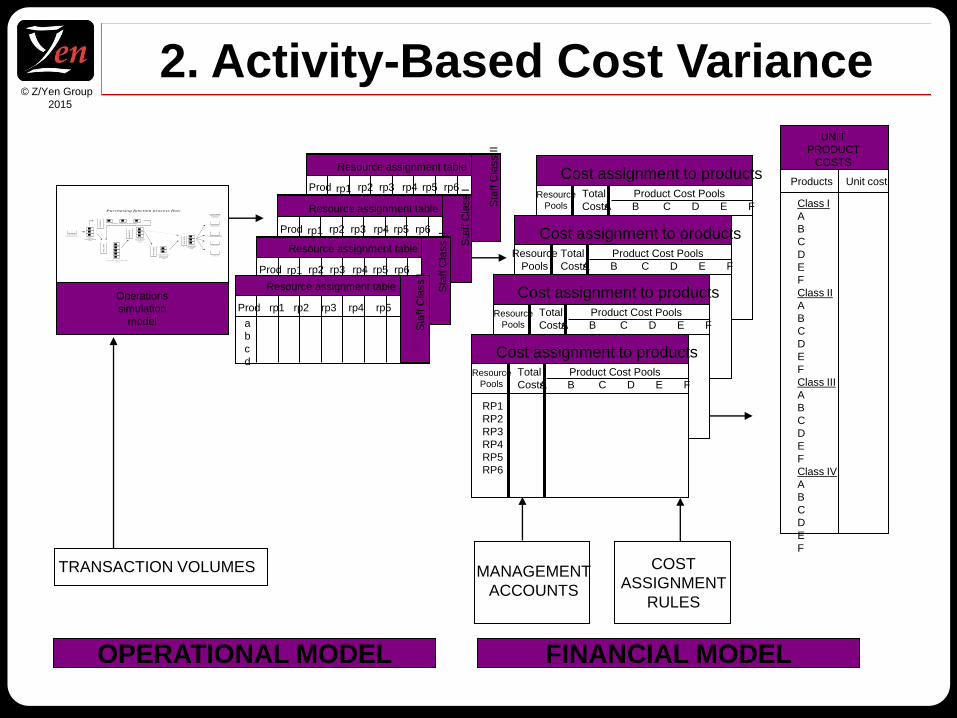
2. Activity-Based Cost Variance
Operations
simulation
model
PURCHASE
REQUISITIONS
DATA
VALIDATION
(x3)
CAPITAL APPROVAL PROCESS
PURCHASING OFFICERS
(x5)
TYPISTS
PURCHASE
ORDERS
(x3)
PURCHASING
MANAGER
APPROVAL
(x2)
CLERICAL
SUPPORT
(x3)
COMPLETED
PURCHASE
ORDERS
SERVICES
CONSUMABLES
STOCKS
CAPITAL
WO
RK
BU
FFER
WO
RK
BU
FFER
WO
RK
BU
FFER
WO
RK
BU
FFER
WO
RK
BU
FFER
Purchasing function process flow
rp3 rp1 rp6 rp5 rp4 rp2 Prod
Resource assignment table
Sta
ff C
lass II
a
b
c
d
rp3 rp1 rp6 rp5 rp4 rp2 Prod
Resource assignment table
Sta
ff C
lass I
a
b
c
d
rp3 rp1 rp6 rp5 rp4 rp2 Prod
Resource assignment table
Sta
ff C
lass II
a
b
c
d
Prod rp1 rp2 rp3 rp4 rp5 rp6
Resource assignment table
Sta
ff C
lass I
a
b
c
d
Cost assignment to products Product Cost Pools
A B C D E F
Total
Costs Resource
Pools
RP1
RP2
RP3
RP4
RP5
RP6
Cost assignment to products Product Cost Pools
A B C D E F
Total
Costs
Resource
Pools
RP1
RP2
RP3
RP4
RP5
RP6
Cost assignment to products Product Cost Pools
A B C D E F
Total
Costs Resource
Pools
RP1
RP2
RP3
RP4
RP5
RP6
Cost assignment to products Product Cost Pools
A B C D E F
Total
Costs Resource
Pools
RP1
RP2
RP3
RP4
RP5
RP6
UNIT
PRODUCT
COSTS
Products Unit cost
Class I
A
B
C
D
E
F
Class II
A
B
C
D
E
F
Class III
A
B
C
D
E
F
Class IV
A
B
C
D
E
F
MANAGEMENT
ACCOUNTS
COST
ASSIGNMENT
RULES
TRANSACTION VOLUMES
OPERATIONAL MODEL FINANCIAL MODEL

© Z/Yen Group
2015
3. Have you used statistical process control in
your organisation?
a. Yes
b. No
Quick Poll Question

© Z/Yen Group
2015
Annual Volume and the r2 of the Relationship Between Cost per Trade and Trade Volume
1
10
100
1,000
10,000
100,000
1,000,000
10,000,000
100,000,000
1,000,000,000
US S
tock
Len
ding
Eur
opea
n Cas
h Equ
ities
Eur
opea
n S
tock
Len
ding
Eur
opea
n Exc
hang
e Tr
aded
Der
ivat
ives
Eur
opea
n Bon
ds
US E
quities
Globa
l Cur
renc
y Opt
ions
US B
onds
Eur
opea
n Rep
o
Globa
l FX
Globa
l Mon
ey M
arke
t
Globa
l Van
illa
Equ
ity O
ptions
US R
epo
Globa
l Cre
dit D
erivat
ives
Globa
l IR D
erivat
ives
An
nu
al
Vo
lum
e T
rad
ed
0.00
0.10
0.20
0.30
0.40
0.50
0.60
0.70
0.80
0.90
1.00
r2
Total Volume r2
OpRisk Activity-Based Cost Variance

© Z/Yen Group
2015
4. Can you predict the incidents and losses
attributable to today
a. Yes
b. No
Quick Poll Question
© Z/Yen Group
2015
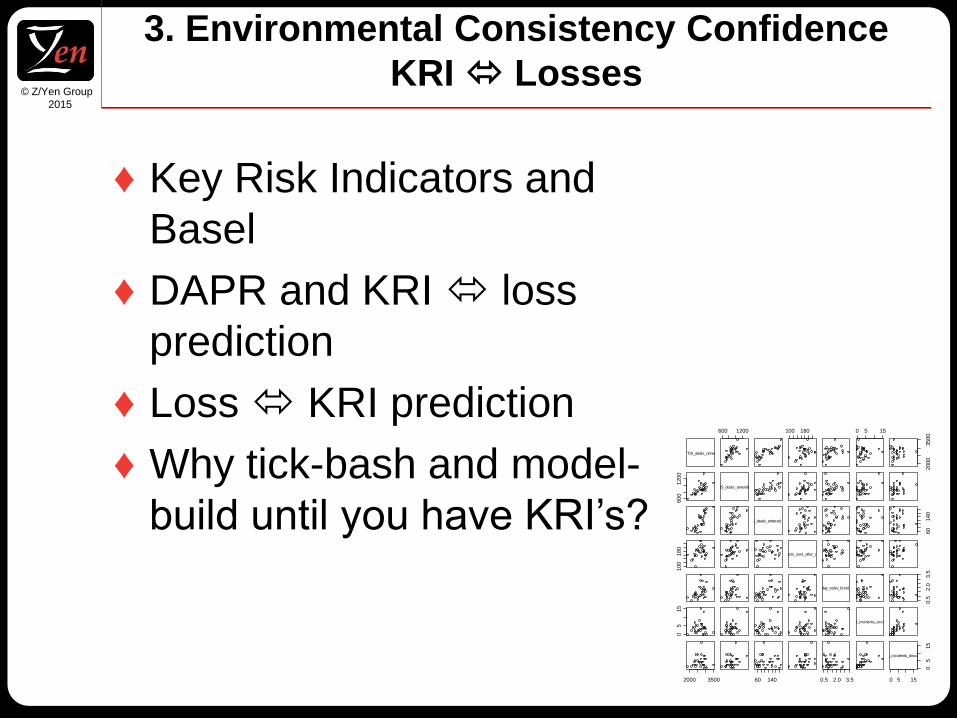
3. Environmental Consistency Confidence
KRI Losses
♦ Key Risk Indicators and
Basel
♦ DAPR and KRI loss
prediction
♦ Loss KRI prediction
♦ Why tick-bash and model-
build until you have KRI’s?
TIS_deals_done
600 1200 100 180 0 5 15
2000
3500
600
1200
TIS_deals_amended
TIS_deals_entered_late
60
140
100
180
Contracts_sent_after_delivery
X30_day_stdev_brent_price
0.5
2.0
3.5
05
15
BITS_incidents_occurred
2000 3500 60 140 0.5 2.0 3.5 0 5 15
05
15
BITS_incidents_discovered

© Z/Yen Group
2015
It’s Only A K-RI If It Predicts!
location
ID
HR-
Headcoun
t #
HR-
Joiners in
month
HR-
Leavers in
month
IT-System
Disruption
Incidents
#
IT-System
Downtime
hr:mm
FO-Trade
Volume #
FO-Trade
Amendme
nts #
OPS-
Nostro
Breaks #
OPS-
Stock
Breaks #
OPS-
Intersyste
m Breaks
#
OPS-
Failed
Trades #
OPS-
Unmatche
d Trades
#
RIS-
Market
Risk Limit
Breaches
#
AU-High
Risk O/S
Overdue
Audit
Issues #
AU-High
Risk O/S
Audit
Issues #
1 136 6 11 2 0.350694 19218 317.1111 3 9 6 463 52.77778 0 0 4.5
2 121 6 11 2 0.03125 8999 0 17 4 2 26 0 3 0 4.5
3 23 6 11 0 0 661 8.777778 3 0 0 0 7.444444 0 0 4.5
4 30 6 11 0 0 4307 80.55556 7 1 1 17 0 1 0 4.5

© Z/Yen Group
2015
Challenging OpRisk Through Prediction
Challenge
indicators
Health indicators
(errors found, delays,
backlogs)
OpRisk incident/cost
measures
Action indicators
(remedial, projects,
controls)
y = 0.2943x + 93.86
R2 = 0.4144
y = 340.45e0.0004x
R2 = 0.4783
0
200
400
600
800
1000
1200
1400
1600
0 1000 2000 3000 4000
Deals done (monthly)
Deals
am
en
ded
(m
on
thly
)
y = 0.0121x - 6.3194
R 2 = 0.3186
y = 8E-06x 2 - 0.0021x
R 2 = 0.34
0
2
4
6
8
10
12
14
16
0 200 400 600 800 1000 1200 1400 1600
Deals amended
BIT
S in
cid
en
ts o
cc
urr
ed

© Z/Yen Group
2015
Why Did We Need This?
♦ You manage what you measure
♦ Distinguish “expected” loss from
“unexpected” loss, in order to
reduce the former through better
decisions
♦ Financial risk dashboard
♦ Contribution to the Economic
Capital view
♦ Preparation for increasing regulation

© Z/Yen Group
2015
5. Do you present ranges and confidence
intervals about assets to your external
auditors?
a. Yes
b. No
Quick Poll Question

© Z/Yen Group
2015
4. Confidence Accounting
© Z/Yen Group
2015
5. Prediction Markets

© Z/Yen Group
2015
6. Enterprise Risk/Reward Management
comparator
sharing best practice
claims
strategic risk valuation
premia
notifications
and investigations
External Markets Internal "Pool"
Risk/Reward Unit
Unit A Unit B
Operations
Organisation

© Z/Yen Group
2015
Ris
k
Likelihood
sh
are
ho
lde
r
vie
w
de
bto
r
vie
w
reg
ula
tor
vie
w
activity-based cost analysis*
& operational reliability
event-loss databases &
benchmarking*
enterprise risk/reward
management systems*
mutual risk management* &
external/re-insurance
extreme value theory &
last resort
debt/equity requirements &
subordinated debt issues
Rew
ard
event frequency
Dealing with Uncertainty

© Z/Yen Group
2015
Risk/Reward Civilisation
Value
Complexity
enterprise risk/reward management systems
detailed calculations
risk reporting simulation
transaction maps
regulatory
compliance
external risk markets
dynamic anomaly
& pattern response
transfer pricing
capital allocation/internal markets
activity-based cost variance
tick-bashing
environmental consistency
confidence
KRI Loss prediction
standards - fiduciary ratings,
ISO 9000, SAS 70
stochastic accounting
prediction markets

© Z/Yen Group
2015
Impertinent Questions
© Z/Yen Group
2015
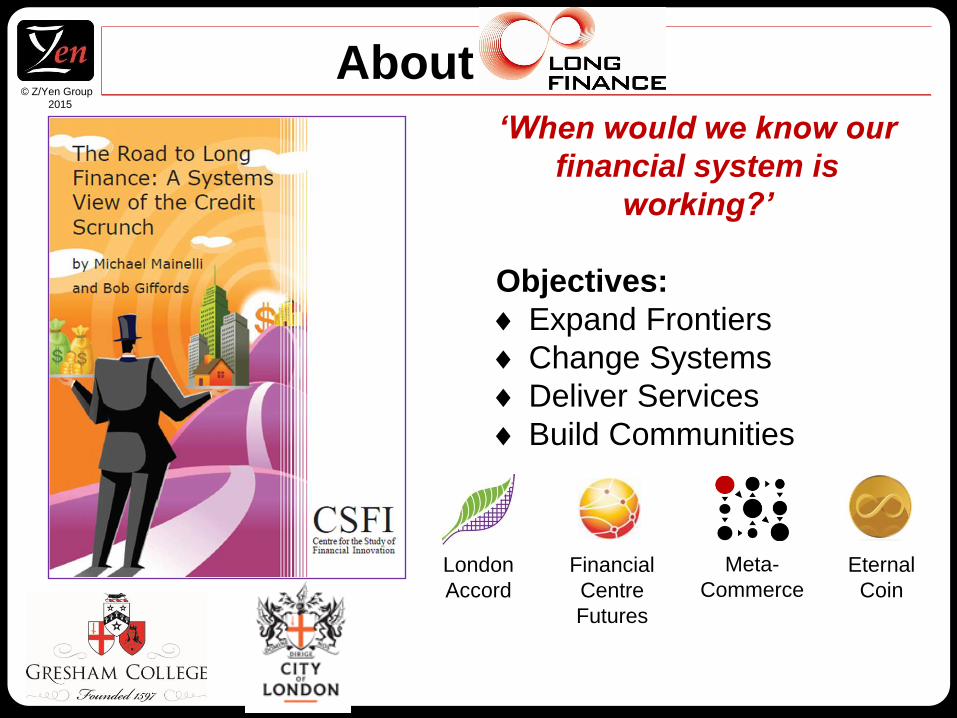
London
Accord
Financial
Centre
Futures
Meta-
Commerce
Eternal
Coin
About
‘When would we know our
financial system is
working?’
Objectives:
Expand Frontiers
Change Systems
Deliver Services
Build Communities

© Z/Yen Group
2015
6. Can your senior management answer the
question, “What is money?” to a child?
a. Yes
b. No
Quick Poll Question

© Z/Yen Group
2015
Single Prices?
P
Q
Supply Demand
P1
P2
Liquidity Black Hole ‘Event Horizon’
© Z/Yen Group
2015
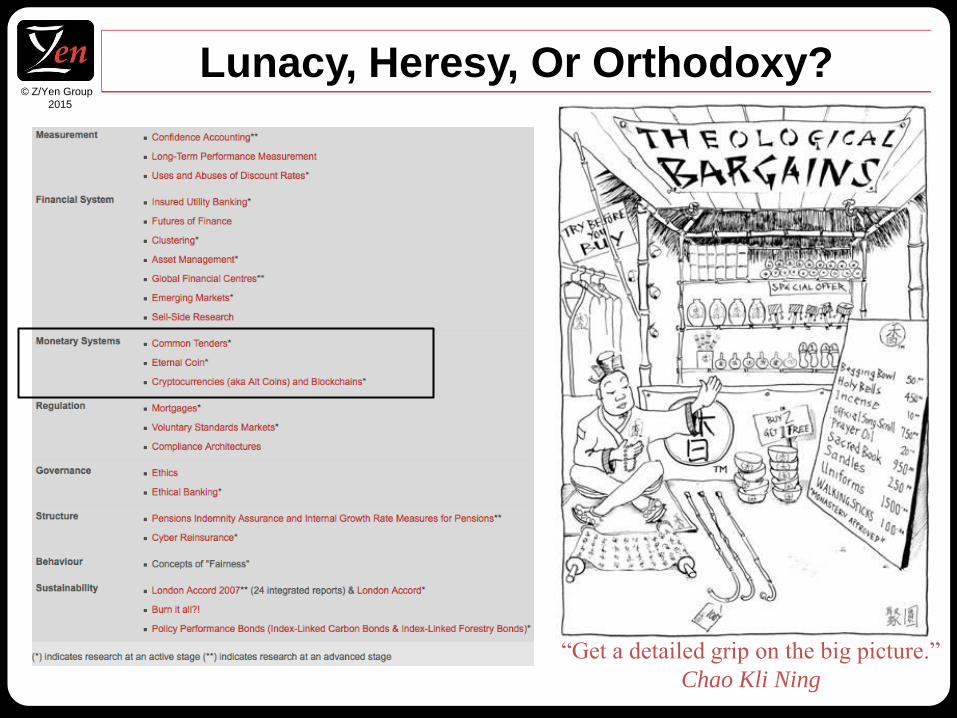
Lunacy, Heresy, Or Orthodoxy?
“Get a detailed grip on the big picture.”
Chao Kli Ning

© Z/Yen Group
2015
Money As Technology
Money
Fiat currency
Common tender
Backed
Unbacked
Commodity money
Composite
Baskets
- currencies
- commodities
Representative money
“Money is a technology
communities use to
trade debts across
space and time.”
“Tokens of
indebtedness are social
desires frozen at a
point in time – tokens
depend on the future
persistence of the
community and its
values.”

© Z/Yen Group
2015
♦ What is the value of money if one person holds all the cash?
♦ What happens if you call your tax authority and tell them you
just don’t feel part of the community but will call when you’re
back in the mood?
♦ What is the value of £1 in France versus a pound in the
Shetlands?
♦ Why can’t you go to your central bank and ask for a ‘bucket’
of GDP?
♦ What happens to the value of a government’s money during
a civil war?
♦ If your nation won the ‘put your feet up for a century’ lottery
– in what currency would you take your winnings?
♦ Is the Euro a tax scrip?
Ignorance About Money

© Z/Yen Group
2015
Evolution In Time & Space
♦ Money 0.0 – communal village
♦ Money 1.0 – social tokens
♦ Money 2.0 – traded value, Mesopotamia
♦ Money 3.0 – gold & silver 1.0, Lydia
♦ Money 4.0 – bills of exchange, Northern Italy
♦ Money 5.0 – fractional reserve goldsmiths
♦ Money 6.0 – central banking 1.0 – cheques, 17th century
♦ Money 6.5 – gold & silver 2.0, 19th & early 20th century
♦ Money 6.0 – Richard Nixon & ultra-leverage
♦ Money 7.0 – ?

© Z/Yen Group
2015
The Long-Term?
Theme Service Question Trust Identities communities Space Transactions services Time Debts value-added

© Z/Yen Group
2015
Money is the self-
referential system upon
which all our financial
analysis is based:
♦ community values
♦ economic activity over
space
♦ debts over time
Trust-Time-Space
[Source: http://illusionsetc.blogspot.com/2005/08/moving-mobius-strip.html]

© Z/Yen Group
2015
Welcome to Knightian
Ignorance
“Are You Not Thinking
What I’m Not Thinking?”
When Would We Know Our Commerce Is Working?
“Get a big picture grip on the details.”
Chao Kli Ning

© Z/Yen Group
2015

© Z/Yen Group
2015