lonestar resources us inc. · pdf filewith any new or revised financial accounting standards...
TRANSCRIPT
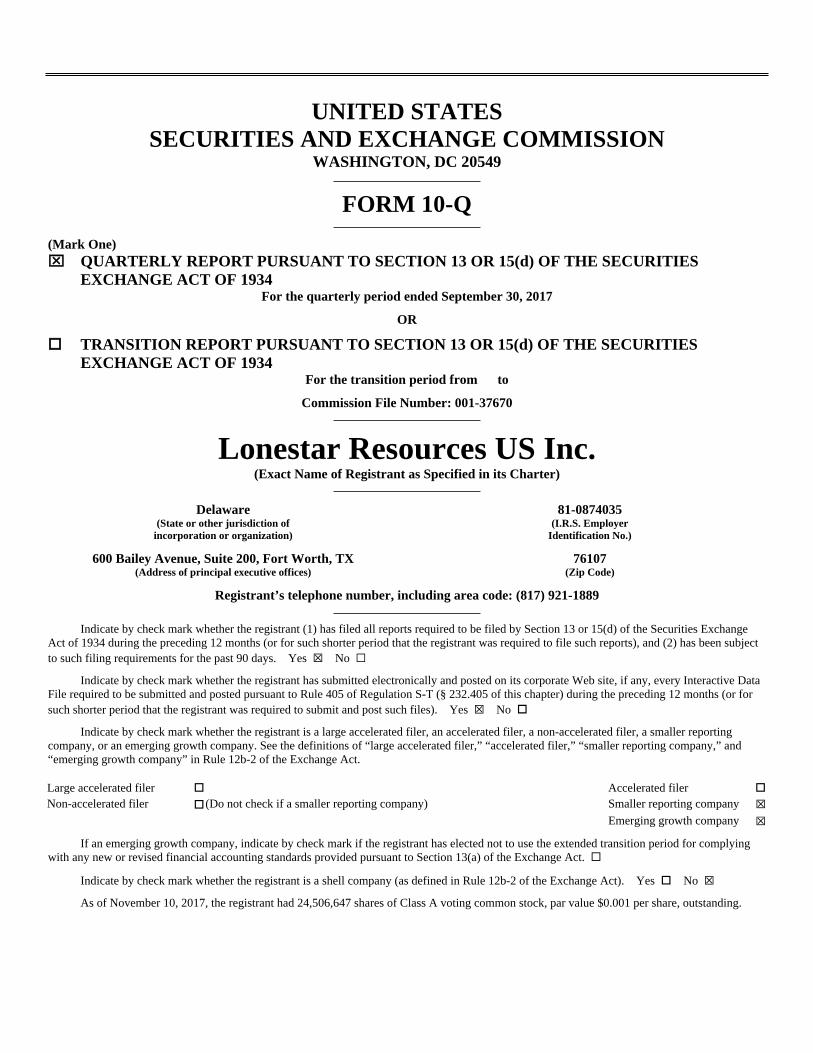
UNITED STATESSECURITIES AND EXCHANGE COMMISSION
WASHINGTON, DC 20549
FORM 10-Q
(Mark One) QUARTERLY REPORT PURSUANT TO SECTION 13 OR 15(d) OF THE SECURITIES
EXCHANGE ACT OF 1934For the quarterly period ended September 30, 2017
OR
TRANSITION REPORT PURSUANT TO SECTION 13 OR 15(d) OF THE SECURITIES EXCHANGE ACT OF 1934
For the transition period from to
Commission File Number: 001-37670
Lonestar Resources US Inc.(Exact Name of Registrant as Specified in its Charter)
Delaware 81-0874035(State or other jurisdiction of
incorporation or organization)(I.R.S. Employer
Identification No.)
600 Bailey Avenue, Suite 200, Fort Worth, TX 76107(Address of principal executive offices) (Zip Code)
Registrant’s telephone number, including area code: (817) 921-1889
Indicate by check mark whether the registrant (1) has filed all reports required to be filed by Section 13 or 15(d) of the Securities Exchange Act of 1934 during the preceding 12 months (or for such shorter period that the registrant was required to file such reports), and (2) has been subject to such filing requirements for the past 90 days. Yes ☒ No ☐
Indicate by check mark whether the registrant has submitted electronically and posted on its corporate Web site, if any, every Interactive Data File required to be submitted and posted pursuant to Rule 405 of Regulation S-T (§ 232.405 of this chapter) during the preceding 12 months (or for such shorter period that the registrant was required to submit and post such files). Yes ☒ No
Indicate by check mark whether the registrant is a large accelerated filer, an accelerated filer, a non-accelerated filer, a smaller reporting company, or an emerging growth company. See the definitions of “large accelerated filer,” “accelerated filer,” “smaller reporting company,” and “emerging growth company” in Rule 12b-2 of the Exchange Act.
Large accelerated filer Accelerated filer Non-accelerated filer (Do not check if a smaller reporting company) Smaller reporting company ☒
Emerging growth company ☒
If an emerging growth company, indicate by check mark if the registrant has elected not to use the extended transition period for complying with any new or revised financial accounting standards provided pursuant to Section 13(a) of the Exchange Act.
Indicate by check mark whether the registrant is a shell company (as defined in Rule 12b-2 of the Exchange Act). Yes No ☒
As of November 10, 2017, the registrant had 24,506,647 shares of Class A voting common stock, par value $0.001 per share, outstanding.

i
Table of Contents
Page
PART I. FINANCIAL INFORMATION Item 1. Financial Statements (Unaudited) 1
Consolidated Balance Sheets 1 Consolidated Statements of Operations & Comprehensive Income (Loss) 3 Consolidated Statement of Changes in Stockholders’ Equity 4 Consolidated Statements of Cash Flows 5 Notes to Consolidated Financial Statements 6
Item 2. Management’s Discussion and Analysis of Financial Condition and Results of Operations 21Item 3. Quantitative and Qualitative Disclosures About Market Risk 37Item 4. Controls and Procedures 38PART II. OTHER INFORMATIONItem 1. Legal Proceedings 38Item 1A. Risk Factors 38Item 2. Unregistered Sales of Equity Securities and Use of Proceeds 38Item 3. Defaults Upon Senior Securities 38Item 4. Mine Safety Disclosures 38Item 5. Other Information 38Item 6. Exhibits 39Exhibit Index 40Signatures 42

ii
Presentation of Information
On July 5, 2016, Lonestar Resources US Inc., a Delaware corporation, acquired all of the issued and outstanding ordinary shares of Lonestar Resources Limited, the former parent company of the Lonestar group of companies, pursuant to a Scheme of Arrangement under Australian law that was approved by the Federal Court of Australia on June 28, 2016, and by Lonestar Resources Limited’s shareholders at a meeting of shareholders, which approval was obtained in March 2016 (the “Reorganization”). The purpose of the Reorganization was to reorganize the operations of Lonestar Resources Limited, an Australian corporation, into a structure whereby the ultimate parent company of the Lonestar group of companies would be a Delaware corporation. In connection with the Reorganization, the ordinary shares of Lonestar Resources Limited were delisted from the Australian Securities Exchange, and the Class A voting common stock of Lonestar Resources US Inc. began trading on the NASDAQ Global Select Market on July 5, 2016 under the ticker symbol “LONE”.
Unless the context otherwise requires, references in this Quarterly Report on Form 10-Q to “Lonestar,” “we,” “us,” “our” and “the Company” refer to (i) Lonestar Resources Limited and its subsidiaries prior to the Reorganization and (ii) Lonestar Resources US Inc. and its subsidiaries, including Lonestar Resources America, Inc. (“LRAI”), the operating company for the Lonestar group of companies, upon completion of the Reorganization, as applicable.
General information about us can be found on our website at www.lonestarresources.com. The information available on or through our website, or about us on any other website, is neither incorporated into, nor part of, this report. Our Annual Reports on Form 10-K, Quarterly Reports on Form 10-Q, Current Reports on Form 8-K and other filings that we make with the U.S. Securities and Exchange Commission (“SEC”), as well as any amendments and exhibits to those reports, will be available free of charge through our website as soon as reasonably practicable after we file or furnish them to the SEC. Information is also available on the SEC website at www.sec.gov for our U.S. filings.
Glossary of Certain Defined TermsThe terms defined in this section are used throughout this Quarterly Report on Form 10-Q:Bbl – Barrel of oil.Bbls/d – Number of one stock tank barrel, or 42 U.S. gallons liquid volume, of oil or other liquid hydrocarbons per day.Boe – Barrels of oil equivalent, with 6,000 cubic feet of natural gas being equivalent to one barrel of oil.Boe/d – Barrels of oil equivalent per day.EUR – Gross estimated ultimate recoveries for a single well.Mcf – Thousand cubic feet of natural gas.Mcf/d – Thousand cubic feet of natural gas per day.MMBOE – Million barrels of oil equivalent, with 6,000 cubic feet of natural gas being equivalent to one barrel of oil.MMBtu – One million British thermal units.WTI – West Texas Intermediate crude oil, which is a light, sweet crude oil, characterized by an American Petroleum Institute gravity between 39 and 41 and a sulfur content of approximately 0.4 weight percent that is used as a benchmark for other crude oils.

1
PART I—FINANCIAL INFORMATION
Item 1. Financial Statements.
Lonestar Resources US Inc.Consolidated Balance Sheets
(In thousands, except share and per share data)
September 30,
2017 December 31,
2016 Assets (Unaudited) Current assets
Cash and cash equivalents $ 4,812 $ 6,068 Accounts receivable:
Oil, natural gas liquid and natural gas sales 10,398 4,680 Joint interest owners and other, net 965 867 Related parties 245 847
Derivative financial instruments 3,121 1,730 Prepaid expenses and other 5,709 2,631
Total current assets 25,250 16,823 Oil and gas properties, net, using the successful efforts method of accounting 552,919 439,228 Other property and equipment, net 12,432 1,421 Derivative financial instruments 773 — Other noncurrent assets 3,796 1,561 Restricted certificates of deposit 76 76 Total assets $ 595,246 $ 459,109
See accompanying notes to unaudited consolidated financial statements.

2
Lonestar Resources US Inc.Consolidated Balance Sheets (continued)
(In thousands, except share and per share data)
September 30,
2017 December 31,
2016 Liabilities and Stockholders’ Equity (Unaudited) Current liabilities
Accounts payable $ 12,386 $ 14,894 Accounts payable – related parties 108 1,135 Oil, natural gas liquid and natural gas sales payable 7,521 3,568 Accrued liabilities 22,365 9,947 Accrued liabilities – related parties 78 224 Derivative financial instruments 1,991 2,985
Total current liabilities 44,449 32,753 Long-term debt 286,398 204,122 Long-term debt - related parties — 3,400 Deferred tax liability 21,977 38,020 Other non-current liabilities 6,241 6,052 Equity warrant liability 439 1,565 Equity warrant liability - related parties 834 2,994 Asset retirement obligations 5,097 2,683 Derivative financial instruments 2,672 1,125 Total liabilities 368,107 292,714 Commitments and contingencies Mezzanine equity
Series A-2 convertible participating preferred stock, $0.001 par value, 76,577 issued and outstanding at September 30, 2017 and 0 issued and outstanding at December 31, 2016 74,712 —
Stockholders’ equity
Class A voting common stock, $0.001 par value, 100,000,000 shares authorized, 21,822,015 issued and outstanding at September 30, 2017 and December 31, 2016, respectively 142,652 142,652 Class B non-voting common stock, $0.001 par value, 5,000 shares authorized, 2,500 issued and outstanding at September 30, 2017 and December 31, 2016, respectively — — Series A-1 convertible participating preferred stock, $0.001 par value and Series B convertible participating preferred stock, $0.001 par value, 5,543 shares and 2,684,632 shares issued and outstanding at September 30, 2017, respectively, 0 and 0 issued and outstanding at December 31, 2016, respectively 3 — Additional paid-in capital 100,146 87,260 Accumulated deficit (90,374) (63,517)
Total stockholders’ equity 152,427 166,395 Total liabilities and stockholders’ equity $ 595,246 $ 459,109
See accompanying notes to unaudited consolidated financial statements.

3
Lonestar Resources US Inc.Consolidated Statements of Operations & Comprehensive Income (Loss)
(In thousands, except share and per share data)(Unaudited)
Three Months Ended Nine Months Ended September 30, September 30,
2017 2016 2017 2016 Revenues
Oil sales $ 23,162 $ 12,285 $ 52,742 $ 36,404 Natural gas sales 1,890 2,190 5,072 5,448 Natural gas liquid sales 1,831 1,063 4,820 2,685
Total revenues 26,883 15,538 62,634 44,537 Costs and expenses
Lease operating and gas gathering 4,515 4,006 10,992 12,764 Production, ad valorem, and severance taxes 1,541 907 3,656 3,046 Rig standby expense 61 364 61 2,261 Depletion, depreciation, and amortization 15,891 10,665 40,527 38,301 Accretion of asset retirement obligations 38 53 96 160 Loss (gain) on sale of oil and gas properties 119 53 466 (1,478)Impairment of oil and gas properties — 29,144 27,081 31,082 Stock-based compensation 346 122 985 313 General and administrative 2,298 2,870 7,940 8,501 Acquisition costs 337 — 3,063 — Other (income) expense (4) 1 (62) 1,045
Total costs and expenses 25,142 48,185 94,805 95,995 Income (loss) from operations 1,741 (32,647) (32,171) (51,458) Other income (expense)
Interest expense (5,031) (5,751) (15,448) (16,961)Gain on disposal of bonds — 29,363 — 29,363 Amortization of finance costs (934) (1,594) (4,368) (2,683)Gain (loss) on warrants 402 (611) 3,286 (611)Gain (loss) on derivative financial instruments (7,657) 1,664 6,505 (3,405)
Total other income (expense), net (13,220) 23,071 (10,025) 5,703 Loss before income taxes (11,479) (9,576) (42,196) (45,755) Income tax benefit (expense) 4,718 (1,684) 15,339 10,354 Net loss (6,761) (11,260) (26,857) (35,401) Preferred stock dividends (1,824) — (2,120) — Net loss attributable to common stockholders $ (8,585) $ (11,260) $ (28,977) $ (35,401)Earnings per share:
Basic $ (0.39) $ (1.44) $ (1.33) $ (4.64)Diluted $ (0.39) $ (1.44) $ (1.33) $ (4.64)Weighted Average Shares Outstanding - basic 21,822,015 7,842,586 21,822,015 7,629,896 Weighted Average Shares Outstanding - diluted 21,822,015 7,842,586 21,822,015 7,629,896
Comprehensive loss: Net loss $ (6,761) $ (11,260) $ (26,857) $ (35,401)Foreign currency translation adjustments — (13) — (29)Comprehensive loss $ (6,761) $ (11,273) $ (26,857) $ (35,430)
See accompanying notes to unaudited consolidated financial statements.

4
Lonestar Resources US Inc.Consolidated Statement of Changes in Stockholders’ Equity
(In thousands, except share data)(Unaudited)
Accumulated Class A Voting Series A-1 and Series B Additional Other Common Stock Preferred Stock Paid-in Accumulated Comprehensive Total Stockholders' Shares Amount Shares Amount Capital Deficit Loss Equity
Balance at December 31, 2015 7,521,788 $ 142,638 — $ — $ 10,270 $ 30,818 $ (760) $ 182,966
Sale of common stock, net of offering costs 13,800,000 14 — — 71,803 — — 71,817 Shares issued for asset acquisition 500,227 — — — 5,499 — — 5,499
Stock-based compensation — — — — 448 — — 448 Foreign currency translation — — — — (760) — 760 — Net loss — — — — — (94,335) — (94,335)
Balance at December 31, 2016 21,822,015 $ 142,652 — $ — $ 87,260 $ (63,517) $ — $ 166,395
Shares issued for asset acquisitions — — 2,690,175 3 12,090 — — 12,093
Stock-based compensation — — — — 796 — — 796 Net loss — — — — — (26,857) — (26,857)
Balance at September 30, 2017 21,822,015 $ 142,652 2,690,175 $ 3 $ 100,146 $ (90,374) $ — $ 152,427
See accompanying notes to unaudited consolidated financial statements.

5
Lonestar Resources US Inc.Consolidated Statements of Cash Flows
(In thousands)(Unaudited)
Nine Months Ended September 30, 2017 2016 Operating activities
Net loss $ (26,857) $ (35,401)Adjustments to reconcile net loss to net cash provided by operating activities:
Gain on disposal of oil and gas properties — (866)Accretion of asset retirement obligations 96 160 Depreciation, depletion, and amortization 40,527 38,301 Stock-based compensation 985 313 Deferred taxes (16,043) (10,432)Gain on disposal of bonds — (29,363)(Gain) losses on derivative financial instruments (6,505) 3,405 Settlements of derivative financial instruments 4,894 24,322 Impairment of oil and gas properties 27,081 31,082 Non-cash interest expense 4,375 1,677 (Gain) loss on warrants (3,286) 611 Changes in operating assets and liabilities:
Accounts receivable (5,214) 865 Prepaid expenses and other assets (3,559) (1,961)Accounts payable and accrued expenses 11,973 (4,479)
Net cash provided by operating activities 28,467 18,234 Investing activities
Acquisition of oil and gas properties (109,031) (3,115)Development of oil and gas properties (56,918) (24,856)Proceeds from sales of oil and gas properties — 2,720 Purchases of other property and equipment (11,580) (202)
Net cash used in investing activities (177,529) (25,453) Financing activities
Proceeds from borrowings and related party borrowings 102,988 63,714 Payments on borrowings and related party borrowings (27,504) (54,789)Proceeds from sale of preferred stock 77,800 — Cost to issue equity (2,790) — Payments of debt issuance costs (2,685) — Changes in other notes payable (3) (9)
Net cash provided by financing activities 147,806 8,916
Effect of exchange rate changes on cash and cash equivalents — (29) (Decrease) increase in cash and cash equivalents (1,256) 1,668 Cash and cash equivalents, beginning of the period 6,068 4,322 Cash and cash equivalents, end of the period $ 4,812 $ 5,990
Supplemental information: Net cash used by operating activities:
Cash paid for taxes $ 2,465 $ — Cash paid for interest expense 11,060 14,095
Non-cash investing and financing activities: Preferred stock issued for asset acquisition $ 10,795 $ — Common stock issued for asset acquisition — 5,500
See accompanying notes to unaudited consolidated financial statements.

6
Lonestar Resources US Inc.Notes to Consolidated Financial Statements
(Unaudited)
1. Nature of Business and Presentation
Lonestar Resources US Inc. (the “Successor”) was incorporated in Delaware in December 2015 for purposes of effecting our corporate reorganization, which was completed on July 5, 2016 (the “Reorganization”), pursuant to a Scheme Implementation Agreement (the “Scheme”), dated December 28, 2015, between the Successor and Lonestar Resources Limited (the “Predecessor”), an Australian company. Prior to the Reorganization, our business was owned and operated under our Predecessor, whose ordinary shares were listed on the Australian Securities Exchange (“ASX”). Pursuant to the Scheme, the Successor acquired all of the issued and outstanding ordinary shares of our Predecessor, and each of our Predecessor’s shareholders received one share of our Class A voting common stock for every two ordinary shares of our Predecessor such shareholder held. Prior to the Reorganization, the Successor had no business or operations, and following the Reorganization, the business and the operations of the Successor consist solely of the business and operations of the subsidiaries of the Predecessor. The reorganization was treated as a transaction among parties under common control and no gain or loss was recorded.
Lonestar Resources America, Inc. (“LRAI”) is a Delaware registered U.S. holding company formed on January 31, 2013, which is engaged in the exploration, development, production, acquisition, and sale of oil, natural gas liquid (“NGL”) and natural gas primarily in the Eagle Ford Shale Play in South Texas, through its wholly owned subsidiary, Lonestar Resources, Inc. Its executive offices are located in Fort Worth, Texas. LRAI was a wholly owned subsidiary of the Predecessor, prior to the reorganization described above. The majority of the activities of the Predecessor were carried out through LRAI. Unless the context otherwise requires, references in this Quarterly Report on Form 10-Q to “Lonestar,” “we,” “us,” “our,” and “the Company” refer to (i) Lonestar Resources Limited and its subsidiaries prior to the Reorganization and (ii) Lonestar Resources US Inc. and its subsidiaries upon completion of the Reorganization, as applicable.
Basis of Presentation
The accompanying interim consolidated financial statements have not been audited by independent public accountants, but in the opinion of management, reflect all adjustments necessary for a fair presentation of the financial position and results of operations. Any and all adjustments are of a normal and recurring nature. Although management believes the unaudited interim-related disclosures in these consolidated financial statements are adequate to make the information presented not misleading, certain information and footnote disclosures normally included in annual audited consolidated financial statements prepared in accordance with accounting principles generally accepted in the United States of America have been condensed or omitted pursuant to the rules and regulations of the Securities and Exchange Commission. The results of operations and the cash flows for the nine months ended September 30, 2017 are not necessarily indicative of the results to be expected for the full year.
Principles of Consolidation
The accompanying consolidated financial statements include the accounts of the Company’s wholly owned subsidiaries. All significant intercompany balances and transactions have been eliminated in consolidation.
2. Recently Issued Accounting Pronouncements
In July 2017, the Financial Accounting Standards Board ("FASB") issued Accounting Standards Update ("ASU") No. 2017-11, “(Part I) Accounting for Certain Financial Instruments with Down Round Features” in order to simplify the accounting for certain financial instruments with down round features. Part I of the ASU changes the classification analysis of certain equity-linked financial instruments, such as warrants and embedded conversion features, such that a down round feature is disregarded when assessing whether the instrument is indexed to an entity’s own stock under Subtopic 815-40. As a result, a down round feature – by itself – no longer requires an instrument to be remeasured at fair value through earnings each period, although all other aspects of the indexation guidance under Subtopic 815-40 continue to apply. For public entities, the amendments in Part I of the ASU are effective for fiscal years, and interim periods within those fiscal years, beginning after December 15, 2018. Management is currently evaluating the new guidance to determine the impact it will have on our consolidated results of operations, financial position or cash flows and anticipates adopting the guidance on the effective date of January 1, 2019.
In February 2016, the FASB issued ASU No. 2016-02, “Leases (Topic 842)” which will require organizations that lease assets to recognize on the balance sheet the assets and liabilities for the rights and obligations created by those leases. This ASU is effective for the annual period beginning after December 15, 2018, including interim periods within those fiscal years. Early adoption is permitted.
7
Management is currently evaluating the new guidance to determine the impact it will have on our consolidated results of operations, financial position or cash flows and anticipates adopting the guidance on the effective date of January 1, 2019.
In May 2014, the FASB issued ASU No. 2014-09, Revenue from Contracts with Customers. The objective of ASU 2014-09 is greater consistency and comparability across industries by using a five-step model to recognize revenue from customer contracts. ASU 2014-09 also contains some new disclosure requirements under GAAP. In August 2015, the FASB issued ASU No. 2015-14, Deferral of the Effective Date. ASU 2015-14 defers the effective date of the new revenue standard by one year, making it effective for annual reporting periods beginning after December 15, 2017, including interim periods within that reporting period. In 2016, the FASB issued additional accounting standards updates to clarify the implementation guidance of ASU 2014-09. The Company is currently determining the impacts of the new revenue standard on its contracts. The Company is currently completing a detailed analysis of its revenue streams at the individual contract level to evaluate the impact of the new revenue standard on its consolidated financial statements. Oil sales represent approximately 84% of total revenue, with gas and NGL sales comprising the remainder. The Company has identified and reviewed oil sales contracts that comprised approximately 80% of oil revenue through September 30, 2017. Based on current assessments completed to date, we do not expect the adoption of this standard will have a material impact on net earnings, however, this conclusion is subject to change. The Company has identified and reviewed gas contracts comprising approximately 80% of our gas and NGL sales through September 30, 2017 and we are still in the process of completing our analysis. The Company’s disclosures surrounding revenue recognition will be more substantial upon adoption. The Company will complete its evaluation during the fourth quarter of 2017 and will adopt this new standard on January 1, 2018, using the modified retrospective method with a cumulative adjustment to retained earnings.
3. Acquisitions and Divestitures
On August 2, 2017, the Company closed on the purchase of an office building with an acquisition price approximating $10 million. The building will be primarily used for the Company’s headquarters and is located in Fort Worth, Texas.
On June 15, 2017, the Company closed an acquisition with Battlecat Oil & Gas, LLC (“Battlecat”) whereby the Company acquired oil and gas properties in the Eagle Ford Shale play in DeWitt, Gonzales and Karnes County, Texas (the “Battlecat Acquisition”). These assets are expected to significantly expand our asset base and drilling locations. The total purchase consideration of approximately $59.8 million consisted of $55.0 million in cash and 1,184,632 shares of Series B Convertible Preferred Stock, par value $0.001 per share (“Series B Preferred Stock”) at a value of approximately $4.8 million. Allocation of the purchase consideration was as follows: $56.3 million to proved reserves; $2.9 million to unproved reserves and $0.6 million to unevaluated acreage and other assets. Additionally, the Company recorded an asset retirement obligation of approximately $0.2 million, resulting in fair value of net assets acquired of approximately $59.6 million. The Company accounted for the acquisition as a business combination under ASC Topic 805. Acquisition related costs of approximately $1.5 million were charged to Acquisition Costs in the Consolidated Statements of Operations & Comprehensive Income (Loss). The effective date of the acquisition was April 1, 2017.
On June 15, 2017, the Company closed an acquisition with SN Marquis LLC (a subsidiary of Sanchez Energy Corporation) (“Marquis”) whereby the Company acquired oil and gas properties in the Eagle Ford Shale play in Fayette, Gonzales and Lavaca County, Texas (the “Marquis Acquisition”). These assets are expected to significantly expand our asset base and production. The total purchase consideration of approximately $50.0 million consisted of $44.0 million in cash and 1,500,000 shares of Series B Preferred Stock at a value of approximately $6.0 million. Allocation of the purchase price was as follows: $48.0 million to proved reserves; $0.6 to unproved reserves and $1.4 million to land, building and other assets. Additionally, the Company recorded an asset retirement obligation of approximately $1.9 million, resulting in fair value of net assets acquired of approximately $48.1 million. The Company accounted for the acquisition as a business combination under ASC Topic 805. Acquisition related costs of approximately $1.2 million were charged to Acquisition Costs in the Consolidated Statements of Operations & Comprehensive Income (Loss). The effective date of the acquisition was January 1, 2017.

8
Pro Forma Operating Results
The following unaudited pro forma combined financial information for the three and nine months ended September 30, 2017 and 2016 is based on the historical consolidated financial statements of the Company adjusted to reflect as if the Battlecat Acquisition and the Marquis Acquisition had closed and related financing had occurred on January 1, 2016. The unaudited pro forma combined financial information includes adjustments primarily for revenues and expenses for the acquired properties, depreciation, depletion, amortization and accretion, and interest expense. The unaudited pro forma combined financial statements give effect to the events set forth below:
• The issuance of 5,400 shares of Series A-1 Preferred Stock and 74,600 shares of Series A-2 Preferred Stock (each as defined below) to Chambers Energy Capital III, LP (“Chambers”) for $80 million to finance a portion of the Battlecat Acquisition and the Marquis Acquisition, at an initial conversion price of $6.00 per share, subject to certain adjustments.
• The borrowing of approximately $24 million on our Senior Secured Credit Facility to finance a portion of the Battlecat Acquisition and the Marquis Acquisition.
• The issuance of 1,500,000 shares of the Company’s Series B Preferred Stock to SN UR Holdings, LLC (a subsidiary of Sanchez Energy Corporation).
• The issuance of 1,184,632 shares of the Company’s Series B Preferred Stock to Battlecat Oil & Gas, LLC.
Three months ended September 30, 2017
Lonestar Marquis Battlecat Pro Forma
Adjustments Pro Forma Lonestar
Revenues $ 26,883 $ — $ — $ — $ 26,883 Net income (loss) attributable to common stockholders (8,585) — — — (8,585)Net income (loss) per common share, basic and diluted (0.39) — — — (0.39) Three months ended September 30, 2016
Lonestar Marquis Battlecat Pro Forma
Adjustments Pro Forma Lonestar
Revenues $ 15,538 $ 7,318 $ 1,090 $ — $ 23,946 Net income (loss) attributable to common stockholders (11,260) 4,127 516 (5,470) (12,088)Net income (loss) per common share, basic and diluted (1.44) — — — (1.54) Nine months ended September 30, 2017
Lonestar Marquis Battlecat Pro Forma
Adjustments Pro Forma Lonestar
Revenues $ 62,634 $ 11,983 $ 1,802 $ — $ 76,419 Net income (loss) attributable to common stockholders (28,977) 7,688 603 922 (19,764)Net income (loss) per common share, basic and diluted (1.33) — — — (0.91) Nine months ended September 30, 2016
Lonestar Marquis Battlecat Pro Forma
Adjustments Pro Forma Lonestar
Revenues $ 44,537 $ 22,234 $ 2,919 $ — $ 69,690 Net income (loss) attributable to common stockholders (35,401) 12,029 1,617 (10,561) (32,317)Net income (loss) per common share, basic and diluted (4.64) — — — (4.24)
Pro forma adjustments to net income (loss) attributable to common stockholders consists of depreciation, depletion, amortization and accretion calculations, additional interest expense, adjustments for income tax (expense) benefit, and dividends on preferred stock issued to complete the acquisitions. The effect on net income (loss) per common share, basic and diluted, is a result of adjustments to Lonestar revenue and net income (loss) for revenue and expenses for acquired properties as well as the pro forma adjustments to arrive at pro forma Lonestar net income (loss) attributable to common stockholders.

9
4. Restricted Certificate of Deposit
The Company is required to maintain a certificate of deposit (“CD”) issued by a municipality in Montana, in which certain of our drilling operations are located. This CD is pledged as collateral for a letter of credit issued by the Company’s bank to the municipality. The CD has a maturity date of March 8, 2018, and bears an interest rate of 0.25%. As this CD is expected to be renewed upon maturity and is not available for use in operations, it is classified as a noncurrent asset.
5. Commodity Price Risk Activities
The Company has implemented a strategy to reduce the effects of volatility of oil and natural gas prices on the Company’s results of operations by securing fixed price contracts for a portion of its expected sales volumes.
Inherent in the Company’s fixed price contracts, are certain business risks, including market risk and credit risk. Market risk is the risk that the price of oil and natural gas will change, either favorably or unfavorably, in response to changing market conditions. Credit risk is the risk of loss from nonperformance by the Company’s counterparty to a contract. The Company does not currently require cash collateral from any of its counterparties nor does its counterparties require cash collateral from the Company. At September 30, 2017, the Company had no open physical delivery obligations.
The Company enters into certain commodity derivative instruments to mitigate commodity price risk associated with a portion of its future oil, NGL and natural gas production and related cash flows. The oil, NGL and natural gas revenues and cash flows are affected by changes in commodity product prices, which are volatile and cannot be accurately predicted. The objective for holding these commodity derivatives is to protect the operating revenues and cash flows related to a portion of the future oil, NGL and natural gas sales from the risk of significant declines in commodity prices, which helps ensure the Company’s ability to fund the capital budget. The Company has not designated any of the commodity derivatives as hedges under the applicable accounting standards. Consequently, all changes in fair value of these derivatives (realized and unrealized) are included in the consolidated statement of operations.
As of September 30, 2017, the following derivative transactions were outstanding:
Instrument Total Volume Settlement Period Fixed Price
Oil – WTI Fixed Price Swap 27,600 Bbl October – December 2017 $ 51.05 Oil – WTI Fixed Price Swap 18,400 Bbl October – December 2017 50.60 Oil – WTI Fixed Price Swap 92,000 Bbl October – December 2017 52.90 Oil – WTI Fixed Price Swap 46,000 Bbl October – December 2017 56.00 Oil – WTI Fixed Price Swap 95,600 Bbl October – December 2017 49.85 Oil – WTI Fixed Price Swap 365,000 Bbl January – December 2018 54.18 Oil – WTI Fixed Price Swap 182,500 Bbl January – December 2018 55.65 Oil – WTI Fixed Price Swap 182,500 Bbl January – December 2018 55.50 Oil – WTI Fixed Price Swap 292,000 Bbl January – December 2018 47.10 Oil – WTI Fixed Price Swap 509,000 Bbl January – December 2018 50.17 Oil – WTI Fixed Price Swap 508,900 Bbl January – December 2019 50.40 Oil – WTI Fixed Price Swap 560,700 Bbl January – December 2019 48.04 Oil – WTI Fixed Price Swap 203,600 Bbl January – June 2020 48.90 Natural Gas – Henry Hub NYMEX Fixed Price Swap 644,000 MMBtu October – December 2017 3.36 Natural Gas – Henry Hub NYMEX Fixed Price Swap 1,825,000 MMBtu January – December 2018 3.09
Instrument Total Volume Settlement Period Puts Calls
Oil – 3 Way Collar 85,000 Bbl October – December 2017 $ 40.00 / 60.00 $ 85.00 Oil – 2 Way Collar 182,500 Bbl January – December 2018 50.00 59.45
The above derivative contracts aggregate to 364,600 barrels or 3,963 barrels of oil per day for the remainder of 2017, 1,713,500 barrels or 4,695 barrels of oil per day for 2018, 1,069,600 barrels or 2,930 barrels of oil per day for 2019 and 203,600 barrels or 1,119 barrels of oil per day thru June 2020. The above natural gas derivative contracts equate to 644,000 MMBtu or 7,000 MMBtu per day for the remainder of 2017 and 1,825,000 MMBtu or 5,000 MMBtu per day for 2018. All derivative contracts are carried at their fair value on the balance sheet and all changes in value are recorded in the consolidated statement of operations in gain or loss on derivative financial instruments.
As of September 30, 2017 and December 31, 2016, all of the Company’s economic derivative hedge positions were with large financial institutions, which are not known to the Company to be in default on their derivative positions. The Company is exposed to

10
credit risk to the extent of non-performance by the counterparties in the derivative contracts discussed above; however, the Company does not anticipate non-performance by such counterparties. None of the Company’s derivative instruments contain credit-risk related contingent features.
6. Fair Value Measurements
Non-recurring fair value measurements include certain nonfinancial assets and liabilities as may be acquired in a business combination and thereby measured at fair value; impaired oil and natural gas property assessments; warrants issued in equity offerings and the initial recognition of asset retirement obligations for which fair value is used. These estimates are derived from historical costs as well as management’s expectation of future cost environments. As there is no corroborating market activity to support the assumptions used, the Company has designated these estimates as Level 3.
In accordance with ASC 820, Fair Value Measurements and Disclosures, fair value measurements are based upon inputs that market participants use in pricing an asset or liability, which are classified into two categories: observable inputs and unobservable inputs. Observable inputs represent market data obtained from independent sources, whereas unobservable inputs reflect a company’s own market assumptions, which are used if observable inputs are not reasonably available without undue cost and effort. ASC 820 prioritizes the inputs used in measuring fair value into the following fair value hierarchy:
Level 1 – Quoted prices for identical assets or liabilities in active markets.
Level 2 – Quoted prices for similar assets or liabilities in active markets, quoted prices for identical or similar assets or liabilities in markets that are not active, inputs other than quoted prices that are observable for the asset or liability, and inputs derived principally from or corroborated by observable market data by correlation or other means.
Level 3 – Unobservable inputs for the asset or liability. The fair value input hierarchy level to which an asset or liability measurement falls in its entirety is determined based on the lowest level input that is significant to the measurement in its entirety.
The following tables present the Company’s assets and liabilities that are measured at fair value on a recurring basis as of September 30, 2017 and December 31, 2016, for each fair value hierarchy level:
Fair Value Measurements Using
QuotedPrices inActive
Markets forIdentical
Assets(Level 1)
SignificantOther
ObservableInputs
(Level 2)
SignificantUnobservable
Inputs(Level 3) Total
September 30, 2017 (Unaudited) (In thousands) Assets:
Commodity derivatives $ — $ 3,894 $ — $ 3,894 Liabilities:
Commodity derivatives — (4,663) — (4,663)Equity warrant liability — — (439) (439)Equity warrant liability - related parties — — (834) (834)Stock appreciation rights — — (189) (189)
Total $ — $ (769) $ (1,462) $ (2,231)
December 31, 2016 (In thousands) Assets:
Commodity derivatives $ — $ 1,730 $ — $ 1,730 Liabilities:
Commodity derivatives — (4,110) — (4,110)Equity warrant liability — — (1,565) (1,565)Equity warrant liability - related parties — — (2,994) (2,994)
Total $ — $ (2,380) $ (4,559) $ (6,939)

11
Level 3 Gains and Losses
The table below sets forth a summary of changes in the fair value of the Company’s Level 3 liabilities for the nine months ended September 30, 2017, in thousands.
Equity Warrant Liability
Stock Appreciation Rights Total
(Unaudited)
Balance at December 31, 2016 $ (4,559) $ — $ (4,559)Purchases, sales, issuances and settlements (net) — (72) (72)Realized gains/(losses) — — — Unrealized gains/(losses) 3,286 (117) 3,169
Balance at September 30, 2017 $ (1,273) $ (189) $ (1,462)
The derivative asset and liability fair values reported in the consolidated balance sheets are as of the balance sheet date and subsequently change as a result of changes in commodity prices, market conditions and other factors. The Company typically has numerous hedge positions that span several time periods and often result in both derivative assets and liabilities with the same counterparty, which positions are all offset to a single derivative asset or liability in the consolidated balance sheets, including the deferred premiums associated with its hedge positions.
The book values of cash and cash equivalents, receivables for oil, NGL and natural gas sales, joint interest billings, notes and other receivables and accounts payable approximate fair value due to the short-term nature of these instruments. The carrying value of debt approximates fair value since it is subject to a short-term floating interest rate that approximates the rate available to the Company, except for bonds, which are recorded at amortized cost less debt issuance costs. The fair value of the 8.750% Senior Notes (as defined in Note 9 below) approximates $148 million as of September 30, 2017, and the notes are considered a Level 3 liability, as they are based on market transactions that occur infrequently as well as internally generated inputs. 7. Oil and Gas Properties
A summary of oil and gas properties is as follows:
September 30,2017
(Unaudited) December 31,
2016 (In thousands)
Proved properties and equipment $ 712,866 $ 538,695 Unproved properties 79,143 72,584 Less accumulated depletion and impairment (239,090) (172,051) $ 552,919 $ 439,228
Depletion expense was approximately $39,960,000 for the nine months ended September 30, 2017 and approximately $46,286,000 for the year ended December 31, 2016. Impairment expense was approximately $27,081,000 for the nine months ended September 30, 2017 and approximately $33,893,000 for the year ended December 31, 2016.

12
8. Accrued Liabilities
Accrued liabilities consisted of the following:
September 30,2017
(Unaudited) December 31,
2016 (In thousands)
Bonus payable $ 1,710 $ 2,155 Payroll payable 11 1 Accrued interest - 8.750% Senior Notes 6,090 2,924 Accrued interest - other 1,810 523 Accrued rent 154 298 Accrued well costs 10,561 3,366 Accrued severance, property and franchise taxes 1,242 431 Other 787 249 $ 22,365 $ 9,947
9. Long-Term Debt
Long-term debt consisted of the following:
September 30,2017
(Unaudited) December 31,
2016 (In thousands)
Senior Secured Credit Facility $ 128,079 $ 43,500 Second Lien Notes — 11,367 8.750% Senior Notes 151,848 151,848 Less unamortized discount on 8.750% Senior Notes (1,139) (1,708)Less deferred financing costs on 8.750% Senior Notes (567) (851)Less deferred financing costs on Second Lien Notes — (316)Mortgage debt 7,904 — Other 273 282 $ 286,398 $ 204,122
Senior Secured Credit Facility
On July 28, 2015, LRAI closed on a Credit Agreement (as amended, supplemented or modified from time to time, the “Credit Agreement”) for a $500,000,000 Senior Secured Credit Facility (the “Senior Secured Credit Facility”) which had a borrowing base of $180,000,000 as of December 31, 2015 and a maturity date of October 16, 2018. Effective as of May 19, 2016, the borrowing base was reduced from $180,000,000 to $120,000,000. Effective as of November 23, 2016, the borrowing base was reduced from $120,000,000 to $112,000,000. Effective as of June 15, 2017, the borrowing base was increased from $112,000,000 to $160,000,000.
The Senior Secured Credit Facility may be used for loans and, subject to a $2,500,000 sub-limit, letters of credit. The Senior Secured Credit Facility provides for a commitment fee of 0.375% to 0.5% based on the unused portion of the borrowing base under the Senior Secured Credit Facility.
Borrowings under the Senior Secured Credit Facility, at LRAI’s election, bear interest at either: (i) an alternate base rate (“ABR”) equal to the higher of (a) the Prime Rate, (b) the Federal Funds Effective Rate plus 0.5% per annum, and (c) the adjusted LIBO rate of a three-month interest period on such day plus 1.0%; or (ii) the adjusted LIBO rate, which is the rate stated on Reuters screen LIBOR01 page, for one, two, three, six or twelve months, as adjusted for statutory reserve requirements for Eurocurrency liabilities, plus, in each of the cases described in clauses (i) and (ii) above, an applicable margin ranging from 1.50% to 2.50% for ABR loans and from 2.50% to 3.50% for adjusted LIBO rate loans (5.17% at September 30, 2017).
The Senior Secured Credit Facility requires LRAI to maintain certain financial ratios and limits the amount of indebtedness LRAI can incur. Subject to certain permitted liens, LRAI’s obligations under the Senior Secured Credit Facility have been secured by the grant of a first priority lien on no less than 80% of the value of the proved oil and gas properties of the Company and its subsidiaries.
13
In connection with the Senior Secured Credit Facility, LRAI and certain of its subsidiaries also entered into certain customary ancillary agreements and arrangements, which, among other things, provide that the indebtedness, obligations, and liabilities of the Company arising under or in connection with the Senior Secured Credit Facility are unconditionally guaranteed by such subsidiaries.
Effective as of July 27, 2016, LRAI, the several banks and other financial institutions party thereto (collectively, the “Consenting Lenders”) and Citibank, N.A., in its capacity as administrative agent for the lenders (the “Administrative Agent”) entered into the Third Amendment to Credit Agreement and Limited Waiver (the “Third Amendment”) to that certain Credit Agreement dated as of July 28, 2015, by and among LRAI, the Consenting Lenders (together with the other banks and financial institutions party thereto, the “Lenders”) and the Administrative Agent to (a) permit LRAI to incur the second lien obligations contemplated by the Securities Purchase Agreement with Leucadia National Corporation and others (as described below) and LRAI’s contemplated use of proceeds thereof, (b) increase the applicable margin for Eurodollar and ABR loans and letter of credit fees by 0.75% across all levels of the previously applicable pricing grid, (c) modify the fee payable on the actual daily unused amount of the aggregate commitments to a flat 0.50% across all levels of the pricing grid, (d) increase the minimum percentage of the value of LRAI’s oil and gas properties that must be mortgaged as collateral for the obligations under the Credit Agreement and the other loan documents from 80% to 90%, (e) modify the maximum leverage ratio thresholds from 4.0 to 1.0 to (i) 4.75 to 1.0 for the four quarterly periods ending June 30, 2016, (ii) 4.50 to 1.0 for the four quarterly periods ending September 30, 2016, (iii) 4.25 to 1.0 for the four quarterly periods ending December 31, 2016 and (iv) 4.00 to 1.0 for all periods thereafter, (f) prohibit distributions to the Predecessor for selling, general and administrative expenses after September 30, 2016 and (g) amend certain other provisions of the Credit Agreement as more specifically set forth in the Amendment.
In connection with closing the Marquis Acquisition and the Battlecat Acquisition, on June 15, 2017, LRAI entered into the Sixth Amendment and Joinder to Credit Agreement (the “Sixth Amendment”) to its Credit Agreement, among LRAI, the subsidiary guarantors party thereto, the several lenders party thereto and Citibank, N.A., in its capacity as administrative agent and as issuing bank. Pursuant to the Amendment, the Credit Agreement was amended to (i) increase the borrowing base from $112 million to $160 million until redetermined or adjusted in accordance with the Credit Agreement, (ii) modify the maximum leverage ratio threshold to be 4.0 to 1.0 for all periods, starting with the fiscal quarter ending September 30, 2017, and providing that EBITDAX (as defined in the Credit Agreement) shall be calculated at the end of each fiscal quarter using the results of the twelve-month period ending with that fiscal quarter end; provided, that EBITDAX shall be calculated (x) at the end of the fiscal quarter ending September 30, 2017 using an amount equal to the EBITDAX for such fiscal quarter, multiplied by four, (y) at the end of the fiscal quarter ending December 31, 2017 using an amount equal to the EBITDAX for the two fiscal quarter period ended on such date, multiplied by two and (z) at the end of the fiscal quarter ending March 31, 2018 using an amount equal to the EBITDAX for the three fiscal quarter period ended on such date, multiplied by four-thirds, (iii) permit LRAI to declare and pay dividends to the Company equal to the amount of any cash dividends declared and payable in accordance with the terms of the Company’s Certificate of Designations of Convertible Participating Preferred Stock, Series A-1, and Certificate of Designations of Convertible Participating Preferred Stock, Series A-2, subject to certain specified terms and conditions and (iv) amend certain other provisions of the Credit Agreement as more specifically set forth in the Sixth Amendment.
As of September 30, 2017 and December 31, 2016 (giving effect to the amended covenant ratio discussed above), LRAI was in compliance with all covenants including all financial ratios under the Senior Secured Credit Facility. As of September 30, 2017 and December 31, 2016, approximately $128,079,000 and $43,500,000 was borrowed, respectively, under the Senior Secured Credit Facility. Borrowing availability was approximately $31,400,000 at September 30, 2017.
8.750% Senior Notes
On April 4, 2014, LRAI issued at par $220,000,000 of 8.750% Senior Unsecured Notes due April 15, 2019 (the “8.750% Senior Notes”) to U.S. based institutional investors. The Company is in active discussions to refinance the 8.750% Senior Notes due April 2019, which will also provide to extend the term of the Senior Secured Credit Facility. During 2016, LRAI repurchased approximately $68.2 million in aggregate principal amount of the 8.750% Senior Notes leaving a remaining balance of approximately $151.8 million.
On or after April 15, 2016, LRAI may redeem the 8.750% Senior Notes in whole or in part at the redemption prices (expressed as percentages of the principal amount) set forth in the following table plus accrued and unpaid interest, if any, on the 8.750% Senior Notes redeemed, to the applicable date of redemption, if redeemed during the twelve-month period beginning on April 15 of the years indicated below:
Year Percentage
2017 104.375%2018 and thereafter 100.000%

14
In addition, upon a change of control of LRAI, holders of the 8.750% Senior Notes will have the right to require LRAI to repurchase all or any part of their 8.750% Senior Notes for cash at a price equal to 101% of the aggregate principal amount of the 8.750% Senior Notes repurchased, plus any accrued and unpaid interest. The 8.750% Senior Notes were issued under and governed by an Indenture dated April 4, 2014, between LRAI, Wells Fargo Bank, National Association, as trustee and LRAI’s subsidiaries named therein as guarantors (the “Indenture”). The Indenture contains covenants that, among other things, limit the ability of LRAI and its subsidiaries to: incur indebtedness; pay dividends or make other distributions on stock; purchase or redeem stock or subordinated indebtedness; make investments; create liens; enter into transactions with affiliates; sell assets; refinance certain indebtedness; and merge with or into other companies or transfer substantially all of LRAI’s assets.
As of September 30, 2017 and December 31, 2016, LRAI was in compliance with all covenants including all financial ratios regarding the 8.750% Senior Notes.
Debt Issuance Costs
The Company capitalizes certain direct costs associated with the issuance of long-term debt and amortizes such costs over the lives of the respective debt. At September 30, 2017 and December 31, 2016, the Company had approximately $2,900,000 and $1,200,000, respectively, of debt issuance costs associated with issuance of the Senior Secured Credit Facility remaining that are being amortized over the lives of the respective debt which are recorded as other non-current assets in the consolidated balance sheets.
Securities Purchase Agreement and Second Lien Notes
On August 2, 2016, the Company entered into a Securities Purchase Agreement with Juneau Energy, LLC, as initial purchaser (“Juneau”), Leucadia National Corporation (“Leucadia”), as guarantor of Juneau’s obligations, the other purchasers party thereto and Jefferies, LLC, in its capacity as the collateral agent for the purchasers, relating to the issuance and sale of (i) up to $49,900,000 aggregate principal amount of LRAI’s 12% senior secured second lien notes due 2021 (the “Second Lien Notes”) and (ii) five-year warrants to purchase up to an aggregate 998,000 shares of the Company’s Class A voting common stock at a price equal to $5.00 per share (the “Warrants”). The balance of these notes and warrants is reflected in the Company’s long-term debt – related parties and equity warrant liability – related parties on the face of the balance sheet.
The Second Lien Notes are secured by second-priority liens on substantially all of LRAI’s and its subsidiaries’ assets to the extent such assets secure obligations under the Senior Secured Credit Facility.
During 2016, LRAI issued $38.0 million in aggregate principal amount of Second Lien Notes and the Company issued the Warrants to purchase 760,000 shares of its Class A voting common stock. The Company recorded an equity warrant liability of approximately $5.1 million which was the fair value amount at the date of issuance. The Warrants were adjusted to fair value at September 30, 2017 which resulted in a gain on the Warrants of approximately $3.3 million for the nine months ended September 30, 2017, which is recorded in the consolidated statements of operations and comprehensive income (loss). Proceeds from the Second Lien Notes issuance were used to repurchase approximately $68.2 million in aggregate principal amount of the 8.750% Senior Notes in privately negotiated open market repurchases with holders of such notes, and to pay related fees and expenses related to the foregoing. The repurchase amounts paid were approximately $36.2 million in cash. Net of related fees, such repurchases resulted in a gain on debt extinguishment of approximately $28.5 million.
In December 2016, LRAI repaid $21.0 million principal of the Second Lien Notes with proceeds from the offering of the Company’s Class A voting common stock that was completed on December 22, 2016 pursuant to a Registration Statement on Form S-1 (File No. 333-214265), which was declared effective on December 15, 2016 (the “2016 Common Stock Offering”). In June 2017, LRAI repaid the remaining $17.0 million principal of the Second Lien Notes including an early payment premium of approximately $1.1 million with borrowings from the Company’s Senior Secured Credit Facility.
10. Stockholders’ Equity
Preferred Stock
The Company is authorized to issue up to 10,000,000 shares of preferred stock with a par value of $0.001. The Company’s preferred stock may be entitled to preference over the common stock with respect to the distribution of assets of the Company in the event of liquidation, dissolution or winding-up of the Company, whether voluntarily or involuntarily, or in the event of any other distribution of assets of the Company among its shareholders for the purpose of the winding-up of its affairs. The authorized but unissued shares of the preferred stock may be divided into and issued in designated series from time to time by one or more resolutions adopted by the Board of Directors of the Company (the “Board”). The Board in their sole discretion shall have the power to determine the relative powers, preferences and rights of each series of preferred stock.
15
Series A & B Preferred Stock
On June 2, 2017 the Company reported entering into a securities purchase agreement (the “Original SPA”) with Chambers, pursuant to which the Company agreed to sell to Chambers, in a private placement under the Securities Act of 1933, as amended (the “Securities Act”), shares of the Company’s newly-created Series A-1 Convertible Participating Preferred Stock, par value $0.001 per share (the “Series A-1 Preferred Stock”), and Series A-2 Convertible Participating Preferred Stock, par value $0.001 per share (the “Series A-2 Preferred Stock” and, together with the Series A-1 Preferred Stock, the “Series A Preferred Stock” and, collectively with the Series A-1 Preferred Stock and the Series B Preferred Stock, the “Preferred Stock”), for an aggregate purchase price of approximately $78 million.
On June 15, 2017, the Company entered into an amended and restated securities purchase agreement (the “A&R SPA”) with Chambers. On the same day, the Company closed the transactions contemplated by the A&R SPA (the “SPA Closing”) and issued to Chambers 5,400 shares of Series A-1 Preferred Stock and 74,600 shares of Series A-2 Preferred Stock. Pursuant to the terms of the SPA, the Company agreed to use commercially reasonable efforts to hold a stockholder meeting (the “Stockholder Meeting”) by no later than December 15, 2017 and to obtain at the meeting stockholder approval of the issuance of shares of the Company’s Class A voting common stock issuable upon conversion of all shares of Series A-1 Preferred Stock and Series A-2 Preferred Stock (upon their conversion to shares of Series A-1 Preferred Stock) issued or issuable pursuant to the A&R SPA (the “Stockholder Approval”). The Stockholder Meeting was held on November 3, 2017, and Stockholder Approval was obtained for Series A-2 Preferred Stock conversion. After the SPA Closing and for so long as the Approved Holders (as defined in the A&R SPA) beneficially own at least 10% of the total number of outstanding shares of Class A voting common stock and Class B non-voting common stock (collectively, “Common Stock”) of the Company, on an as-converted basis, or at least 15% of the number of Series A Preferred Stock issued to Chambers at the SPA Closing, the Company cannot undertake certain actions without the prior consent of holders of a majority of all shares of Common Stock, on an as-converted basis, held by the Approved Holders.
Prior to June 15, 2020, Chambers and its affiliates are prohibited from directly or indirectly engaging in any short sales involving the Common Stock or securities convertible into, or exercisable or exchanged for, Common Stock. Without the prior written consent of the Board, the Approved Holders are subject to customary standstill restrictions until the earlier of (i) the two-year anniversary of the date the Approved Holders are no longer entitled to designate any director to the Board and (ii) the date the Company fails to fully declare and pay all accrued dividends on either series of the Series A Preferred Stock after there are no PIK Quarters (as defined below) remaining. In connection with the SPA Closing and the issuance of shares of Series A Preferred Stock, the Company entered into a registration rights agreement with Chambers (the “Chambers RRA”). Under the Chambers RRA, the Company has agreed to provide to Chambers certain customary demand and piggyback registration rights relating to Chambers’ ownership of Company stock. The Chambers RRA contains customary terms and conditions, including certain customary indemnification obligations.
Each of the Series A-1 Preferred Stock, Series A-2 Preferred Stock and Series B Preferred Stock is a new class of equity security. Each series of Series A Preferred Stock ranks senior to Class A voting common stock with respect to dividend rights and rights upon the liquidation, winding-up or dissolution of the Company, and each series initially has a stated value of $1,000 per share (the “Stated Value”). Series B Preferred Stock ranks pari passu with Class A voting common stock with respect to dividend rights, but senior to Class A voting common stock with respect to rights upon the liquidation, winding-up or dissolution of the Company, with a par value of $0.001 per share. If the stockholder approval is obtained, each outstanding share of Series A-2 Preferred Stock will automatically convert into one share of Series A-1 Preferred Stock, subject to customary adjustments. No later than two business days following the holding of the Stockholder Meeting, each share of Series B Preferred Stock will automatically convert into one share of Class A voting common stock, whether or not the Stockholder Approval has been obtained.
Holders of Series A-1 Preferred Stock will be entitled to vote with holders of Class A voting common stock on an as-converted basis upon the consummation of the Stockholder Meeting, whether or not the Stockholder Approval is obtained. Holders of Series A-2 Preferred Stock are entitled to vote with the holders of Series A-1 Preferred Stock on all matters submitted for a vote of holders of Preferred Stock as a separate class, but in no event are entitled to vote with the holders of Class A voting common stock. Holders of Series B Preferred Stock have no voting rights, except as described below. Holders of any series of Preferred Stock are entitled to one vote per share on any matter on which holders of such applicable series are entitled to vote separately as a class. In addition, for so long as shares of a particular series of Preferred Stock are outstanding, the affirmative vote or consent of holders of at least a majority of the outstanding shares of such series, voting together as a separate class, is necessary for effecting any amendment or modification to the certificate of incorporation or the applicable Certificate of Designations that would materially and adversely affect the relative rights, preferences, privileges or voting power of such series.
Shares of Series A-1 Preferred Stock will be immediately convertible into shares of Class A voting common stock at the option of the holders of such Series A-1 Preferred Stock upon the consummation of the Stockholder Meeting, at a per share rate (the “Conversion Rate”) equal to the Stated Value of such share divided by six, subject to certain adjustments (the “Conversion Price”). Upon the

16
consummation of the Stockholder Meeting, the Company will have the option to convert Series A-1 Preferred Stock to Class A voting common stock if the volume weighted average price of Class A voting common stock exceeds the following percentages of the Conversion Price for twenty out of thirty consecutive trading days: (i) 200%, if such mandatory conversion occurs prior to June 15, 2019, (ii) 175%, if such mandatory conversion occurs after June 15, 2019 but before June 15, 2020, and (iii) 150%, if such mandatory conversion occurs after June 15, 2020. If on June 15, 2024, the Stockholder Meeting has been consummated (no matter whether or not the Stockholder Approval has been obtained) and the trailing 20-day volume weighted average price of Class A voting common stock (the “Prevailing Price”) is equal to or greater than the Conversion Price then in effect, then each share of the Series A-1 Preferred Stock then outstanding will automatically convert to Class A voting common stock at the then applicable Conversion Rate. Notwithstanding anything to the contrary in the foregoing, in no event will in excess of 1,678,089 shares of Class A voting common stock be issued in connection with the conversion of Series A-1 Preferred Stock in advance of the Stockholder Approval, and such conversion will only occur to the extent it will not result in a violation of any applicable rules of The NASDAQ Stock Market LLC (provided, that the Company is to take commercially reasonable efforts to effect the issuance in compliance with such rules).
Holders of Series A Preferred Stock will be entitled to cumulative dividends payable quarterly initially at a rate of 9% per annum (the “Dividend Rate”) in cash and, for any 12 quarters (“PIK Quarters”), at the Company’s option, (i) in the form of additional shares of the respective series of Series A Preferred Stock at a per share price equal to $975 or (ii) by increasing Stated Value, in lieu of cash. After the 12 PIK Quarters, if the Company fails to fully declare and pay dividends in cash, then the Dividend Rate for Series A Preferred Stock will automatically increase by 5.0% per annum for the next succeeding dividend period and then an additional 1.0% for each successive dividend period, up to a maximum Dividend Rate of 20.0% per annum, until the Company pays dividends at such increased rate fully in cash for two consecutive quarters. Separately, if the Stockholder Approval has not been obtained by December 15, 2017, the Dividend Rate for Series A-2 Preferred Stock will automatically increase by 5% per annum for the dividend period ended on March 31, 2018 and by an additional 0.5% each quarter thereafter until the Stockholder Approval is obtained, up to a maximum Dividend Rate of 20.0% per annum. In addition to dividends rights described above, holders of all series of Preferred Stock will be entitled to receive dividends or distributions declared or paid on Class A voting common stock on an as-converted basis. If on June 15, 2024, the Prevailing Price is less than the Conversion Price then in effect, the Dividend Rate for Series A-1 Preferred Stock will automatically increase to 20.0% per annum, payable only in cash, unless automatically converted as described above. However, the Company, at its option, may instead elect to exchange each share of Series A-1 Preferred Stock for senior unsecured notes of the Company with a two-year maturity, a 9.0% per annum coupon payable semi-annually in cash, and governed by terms substantially similar to the Company’s most recent high yield indenture at that time. After June 15, 2020, the Company may redeem shares of Series A Preferred Stock in cash at a per share amount equal to (i) 110% of the Stated Value, if the redemption occurs prior to June 15, 2021, (ii) 105% of the Stated Value, if the redemption occurs prior to June 15, 2022, and (iii) 100% of the Stated Value, if the redemption occurs after June 15, 2022, in each case, plus any unpaid dividends. If the Stockholder Approval is not obtained on or prior to June 15, 2024, the Company must redeem all outstanding shares of Series A-2 Preferred Stock at the Stated Value then in effect on June 15, 2024. If at any time after June 15, 2024 the Company fails to fully declare and pay a quarterly dividend in cash on Series A-1 Preferred Stock, then the Company must redeem in cash all outstanding Series A-1 Preferred Stock at the Stated Value then in effect.
As of September 30, 2017, 5,543 shares of Series A-1 Preferred Stock and 2,684,632 shares of Series B Preferred Stock were issued and outstanding with zero issued and outstanding at December 31, 2016. As of September 30, 2017, 76,577 shares of Series A-2 Preferred Stock were issued and outstanding with zero issued and outstanding at December 31, 2016. The Series A-2 Preferred Stock is classified as Mezzanine Equity in the Consolidated Balance Sheets due to the mandatory redemption feature triggered by the failure to obtain requisite Stockholder Approval. If requisite Stockholder Approval is obtained, the redemption feature would no longer be applicable, and the Series A-2 Preferred Stock will be reclassified to permanent equity at that time.
Common Stock
The Company is authorized to issue up to 100,000,000 shares of $0.001 par value Class A voting common stock of which 21,822,015 were issued and outstanding as of September 30, 2017 and December 31, 2016.
The Company is authorized to issue up to 5,000 shares of $0.001 par value Class B non-voting common stock of which 2,500 shares were issued and outstanding as of September 30, 2017 and December 31, 2016.
11. Stock-Based Compensation
Stock Option Activity
For the nine months ended September 30, 2017, no stock options were issued or exercised. The following tables summarize certain information related to outstanding stock options under the Lonestar Resources Limited 2012 Employee Share Option Plan and the

17
Lonestar Resources US Inc. 2016 Incentive Plan, which replaced the Lonestar Resources Limited 2012 Employee Share Option Plan following the Reorganization:
Shares
WeightedAverage
Exercise PricePer Share
Weighted AverageRemaining
Contractual Term(in years)
Outstanding at December 31, 2016 191,750 $ 15.00 0.25 Options vested and exercisable at December 31, 2016 191,750 $ 15.00 0.25 Granted — — — Exercised — — — Canceled/Expired (16,125) — — Forfeited (75,000) 20.00 — Outstanding at September 30, 2017 100,625 $ 15.00 0.25 Options vested and exercisable at September 30, 2017 100,625 $ 15.00 0.25
Restricted Stock Units
In February 2017, the Company granted awards of restricted stock units (“RSUs”) covering 612,000 shares to certain of its employees. In August 2017, 100,000 units were issued to the Company’s chairman of the board of directors. The awards vest over a three-year period as follows: 40% on the first anniversary of issuance and 30% on each of the second and third anniversaries of issuance, such that the RSU’s will be fully vested on the third anniversary of issuance. The Company determines the fair value of granted RSU’s based on the market price of the Class A voting common stock of the Company on the date of grant. RSUs will be paid in Class A voting common stock or cash, at the Company’s option, after the vesting of the applicable RSU. Compensation expense for granted RSUs is recognized over the vesting period.
Shares
Weighted AverageRemaining
Contractual Term(in years)
Outstanding at December 31, 2016 — — RSUs vested at December 31, 2016 — — Granted 712,000 3.0 Canceled/Expired — — Forfeited (10,000) 2.8 Outstanding at September 30, 2017 702,000 2.5 RSUs vested at September 30, 2017 — —
Shares
WeightedAverage Fair
Value per Share
WeightedAverage
RemainingContractual
Term(in years)
Outstanding non-vested RSUs at December 31, 2016 — $ — — Granted 712,000 6.00 3.0 Vested — — — Forfeited (10,000) 4.10 2.8 Outstanding non-vested RSUs at September 30, 2017 702,000 $ 3.50 2.5
Stock Appreciation Rights
In February 2017, the Company granted awards of stock appreciation rights (“SARs”) covering 700,000 shares to certain of its employees and its non-employee directors. The awards vest over a three-year period as follows: 40% on the first anniversary of issuance and 30% on each of the second and third anniversaries of issuance, such that the SAR’s will be fully vested on the third anniversary of issuance. The SARs will expire five-years after the date of issuance. The exercise price of the SAR is the fair market value of the Company’s Class A voting common stock on the date of the grant. The SAR entitles the holder to receive from the Company upon exercise of the exercisable portion of the SAR an amount determined by multiplying the excess of the fair market

18
value of one share on the date of exercise over the exercise price per share by the number of shares with respect to which the SAR is exercised. SARs will be paid in cash or common stock at holder’s election once the SAR is vested, with the provision that the Company possesses sufficient liquidity to allow for cash settlement of the SAR. The SARs are being treated as a liability in the Consolidated Balance Sheets.
Shares
WeightedAverage
Exercise PricePer Share
Weighted AverageRemaining
Contractual Term(in years)
Outstanding at December 31, 2016 — — — SARs vested and exercisable at December 31, 2016 — — — Granted 700,000 $ 7.20 5.0 Exercised — — — Canceled/Expired — — — Forfeited (10,000) 7.20 4.8 Outstanding at September 30, 2017 690,000 $ 7.20 4.5 SARs vested and exercisable at September 30, 2017 — $ — —
Shares
WeightedAverage Fair
Value per Share
WeightedAverageExercisePrice per
share
WeightedAverage
RemainingContractual
Term(in years)
Outstanding non-vested SARs at December 31, 2016 — $ — $ — — Granted 700,000 5.00 7.20 5.0 Vested — — — — Forfeited (10,000) 4.10 7.20 4.8 Outstanding non-vested SARs at September 30, 2017 690,000 $ 3.50 $ 7.20 4.5
Stock-Based Compensation Expense
For the three and nine month periods ended September 30, 2017, the Company recorded stock-based compensation expenses of approximately $346,000 and $985,000, respectively, related to stock options, restricted stock units and stock appreciation rights. As of September 30, 2017, the total unrecognized stock-based compensation cost was approximately $3,786,000, which will be recognized over the period from October 2017 through February 2020.
12. Earnings Per Share
In accordance with the provisions of current authoritative guidance, basic earnings or loss per share shown on the Consolidated Statements of Operations is computed on the basis of the weighted average number of common shares outstanding during the periods. Diluted earnings or loss per share is computed based upon the weighted average number of common shares outstanding plus the assumed issuance of common shares for all potentially dilutive securities. The Company includes the number of stock options in the calculation of diluted weighted average shares outstanding when the exercise prices are less than the average market prices of the Company’s Class A voting common stock for the period. When a loss from operations exists, all potentially dilutive common shares outstanding are anti-dilutive and therefore excluded from the calculation of diluted weighted average shares outstanding.
Potentially dilutive common shares outstanding consist of shares of Class A voting common stock issuable pursuant to stock options, SARs, and 760,000 equity warrants. These securities have no dilutive effect for the nine months ended September 30, 2017 and 2016. The Series A and Series B Preferred Stock are participating securities as they contain rights to receive non-forfeitable dividends at the same rate as common stock. EPS is computed under the two-class method, which is a method of computing EPS when an entity has both common stock and participating securities. Under the two-class method, the income and distributions attributable to participating securities are excluded from the calculation of basic and diluted EPS and the participating securities are excluded from the weighted average shares outstanding. The dilutive effect of the participating securities was calculated under the treasury stock method and the two-class method. The EPS was more dilutive under the two-class method. As such, there is no difference in basic and diluted EPS.
The following table presents unaudited earnings per share of Lonestar Resources US Inc.

19
Unaudited Earnings Per Share Three Months Ended Nine Months Ended September 30, September 30, 2017 2016 2017 2016 Net loss per share of Class A voting common stock:
Basic $ (0.39) $ (1.44) $ (1.33) $ (4.64)Diluted (0.39) (1.44) (1.33) (4.64)
Weighted average Class A voting common stock outstanding:
Basic 21,822,015 7,842,586 21,822,015 7,629,896 Diluted 21,822,015 7,842,586 21,822,015 7,629,896
13. Related Party Activities
LEUCADIA
On August 2, 2016, Lonestar Resources America, Inc. (“LRAI”) and the Company entered into a Securities Purchase Agreement (the “Purchase Agreement”) with Juneau Energy, LLC (n/k/a JETX Energy, LLC), as initial purchaser (“Juneau”),Leucadia National Corporation (“Leucadia”), as guarantor of Juneau’s obligations, the other purchasers party thereto and Jefferies, LLC, in its capacity as the collateral agent for the purchasers, relating to the issuance and sale of (i) up to $49.9 million aggregate principal amount of LRAI’s 12% senior secured second lien notes due 2021 (“Second Lien Notes”) and (ii) five-year warrants to purchase up to an aggregate 998,000 shares of the Company’s Class A voting common stock at a price equal to $5.00 per share (the “Warrants”). During 2016, LRAI issued $25 million in aggregate principal amount of Second Lien Notes and the Company issued Warrants to purchase 500,000 shares of its Class A voting common stock to Juneau. In December 2016, LRAI repaid to Juneau $21 million principal of the Second Lien Notes with proceeds from the 2016 Common Stock Offering.
In connection with entering into the Purchase Agreement, the Company also entered into a registration rights agreement and an equity commitment agreement, both dated as of August 2, 2016. Pursuant to the registration rights agreement, the Company has agreed to register for resale certain Class A voting common stock issued or issuable to Juneau and Leucadia, including those issuable upon exercise of the Warrants. Leucadia agreed, pursuant to the equity commitment agreement, to purchase a certain number of Class A voting common stock in case the Company elected to pursue an equity offering prior to December 31, 2016. Pursuant to the equity commitment agreement, Leucadia purchased 3,478,261 shares of Class A voting common stock (costing $20 million) through the 2016 Common Stock Offering, which closed on December 22, 2016. In connection with Leucadia’s equity commitment, the Company paid Leucadia on January 3, 2017 a $1 million fee, which was recorded as a reduction to additional paid-in capital. In the event Leucadia purchased not less than its commitment amount, the Company agreed to use commercially reasonable efforts to enter into arrangements to provide Leucadia with the right to appoint one director to the Board of the Company, provided that such right will terminate at such time as Leucadia and its affiliates own a number of shares of Class A voting common stock equal to less than 50% of the shares purchased by Leucadia and its affiliates in such offering. Leucadia has elected to take an observer position on the board of directors, with no voting rights.
EF REALISATION
On October 26, 2016, the Company entered into a Board Representation Agreement (the “Board Representation Agreement”) with EF Realisation Company Limited (“EF Realisation”). Under the Board Representation Agreement, for as long as EF Realisation, together with its affiliates, beneficially owns 15% or more of the issued and outstanding shares of the Company’s Class A voting common stock, it has the right to nominate up to, but no more than, two directors to serve on the Board and for as long as EF Realisation, together with its affiliates, beneficially owns at least 10% but less than 15% of the Company’s issued and outstanding shares of Class A voting common stock, it has the right to nominate up to, but no more than, one director to serve on the Board.
On October 26, 2016, the Company entered into a Registration Rights Agreement with EF Realisation, pursuant to which the Company agreed to register for resale Class A voting common stock indirectly owned by EF Realisation. The Company agreed to file a registration statement providing for the resale of Class A voting common stock held by EF Realisation no later than the earlier of (i) October 26, 2017, and (ii) 30 days after the date the Company first becomes eligible to file a registration statement on Form S-3. The Form S-3 registration statement was filed with the Securities and Exchange Commission on November 7, 2017. The Company has also granted EF Realisation certain piggyback and demand registration rights.
20
AMENDMENT OF REGISTRATION RIGHTS AGREEMENTS
In connection with the consummation of the Battlecat Acquisition, the Marquis Acquisition and the SPA Closing, on June 15, 2017, the Company entered into (i) a first amendment to the registration rights agreement (the “Leucadia RRA Amendment”) with Leucadia and JETX Energy, LLC (f/k/a Juneau Energy, LLC), which amends the registration rights agreement, dated as of August 2, 2016, by and among the same parties, and (ii) a first amendment to registration rights agreement (the “EF RRA Amendment” and, together with the Leucadia RRA Amendment, the “RRA Amendments”) with EF Realisation, which amends the registration rights agreement, dated as of October 26, 2016, by and between the same parties. The RRA Amendments set forth the relative priorities, with respect to demand and piggyback registration rights, among each applicable party thereto, Battlecat, Marquis and Chambers under their respective registration rights agreements with the Company.
OTHER RELATED PARTY TRANSACTIONS
Butterfly Flaps, Ltd, a company in which Dr. Christopher Rowland (a director of the Company) owns an interest, has performed consultancy work for the Company since 2013 covering various strategic, tax structuring and investor matters at a cost of approximately $25,000 per quarter. The consulting arrangement terminated effective December 31, 2016.
New Tech Global Ventures, LLC, a company in which Daniel R. Lockwood (a director of the Company) owns a limited partnership interest, has provided field engineering staff and consultancy services for the Company since 2013. The total cost for such services was approximately $198,000 and $78,000 for the three months ended September 30, 2017 and 2016, respectively, and approximately $664,000 and $465,000 for the nine months ended September 30, 2017 and 2016, respectively.
14. Subsequent Events
In preparing the consolidated financial statements, management has evaluated all subsequent events and transactions for potential recognition or disclosure through the date the accompanying consolidated financial statements were issued.
Conversion of Series B Convertible Preferred Stock
On November 3, 2017, and in accordance with the Certificate of Designations of Series B Convertible Preferred Stock of the Company (the “Series B Certificate of Designations”), all of the outstanding shares of the Company’s Series B Convertible Preferred Stock (the “Series B Preferred Stock”) were converted (the “Series B Conversion”) on a one-to-one basis into shares of the Company’s Class A voting common stock. The Series B Preferred Stock was originally issued to Battlecat Oil & Gas, LLC and SN Marquis LLC, pursuant to a transaction with each party, each as described more fully in Note 3.
Pursuant to the Series B Conversion, 2,684,632 shares of Class A voting common stock were issued (the “Conversion Shares”), and immediately following such conversion, none of the Company’s Series B Preferred Stock remained outstanding. The Conversion Shares are currently unregistered and will be registered pursuant to a Registration Statement on Form S-3, which registers, among other shares, the Conversion Shares. Following the Series B Conversion, there were a total of 24,506,647 shares of Class A voting common stock issued and outstanding.
Conversion of Series A-2 Convertible Participating Preferred Stock
On November 3, 2017, and in accordance with the Certificate of Designations of Convertible Participating Preferred Stock, Series A-2 of the Company (the “Series A-2 Certificate of Designations”), all of the outstanding shares of the Company’s Series A-2 Convertible Participating Preferred Stock (the “Series A-2 Preferred Stock”) were converted (the “Series A-2 Conversion”) on a one-to-one basis into shares of the Company’s Series A-1 Convertible Preferred Stock (the “Series A-1 Preferred Stock”). The Series A-2 Preferred Stock was originally issued to Chambers Energy Capital III, LP, pursuant to the Chambers Securities Purchase Agreement, as described more fully in Note 10.
Pursuant to the Series A-2 Conversion, 76,577 shares of Series A-1 Convertible Preferred Stock were issued, and immediately following such conversion, none of Series A-2 Preferred Stock remained outstanding and an aggregate of 82,120 Series A-1 Preferred Stock were issued and outstanding.

21
Item 2. Management’s Discussion and Analysis of Financial Condition and Results of Operations.
Overview
We are an independent oil and natural gas company, focused on the development, production and acquisition of unconventional oil, natural gas liquids (“NGLs”) and natural gas properties in the Eagle Ford Shale in Texas, where we have accumulated approximately 72,244 gross (57,172 net) acres in what we believe to be the formation’s crude oil and condensate windows, as of September 30, 2017. We operate in one industry segment, which is the exploration, development and production of oil, NGLs and natural gas. Our current operational activities and consolidated revenues are generated from markets exclusively in the United States, and, as of September 30, 2017, we had no long lived assets located outside the United States.
Third Quarter 2017 Operational Summary
During the third quarter of 2017, the Company reported production of 7,662 Boe/d, a 36% sequential increase from the 5,635 Boe/d reported for the three months ended June 30, 2017. The increase in production was attributable to production additions associated with the $116.6 million acquisition of producing properties that closed June 15, 2017 which added an additional 81 gross / 75.2 net wells. The third quarter was also marginally impacted by the addition of 2 gross / 2 net wells placed into service at our Cyclone drilling pad in Gonzales County in late September.
The Company’s third quarter was negatively impacted by Hurricane Harvey in three respects. The Company estimates that 150 Boe/d of production was curtailed by the shut-ins of certain producing wells which were susceptible to flooding, reduced operating levels at certain gas processing plants utilized by the Company, as well as minor electrical outages.
For the three months ended September 30, 2017, approximately 69% of our production was crude oil, 16% was NGLs and 15% was natural gas.
Recent Developments Regarding Lonestar Properties
Eagle Ford Shale Trend - Western Region
Asherton
In Dimmit County, no new wells were completed during the three months ended September 30, 2017. The Asherton leasehold is held by production, and Lonestar does not currently plan any drilling activity here in 2017.
Beall Ranch
In Dimmit County, no new wells were completed during the three months ended September 30, 2017. The Beall Ranch leasehold is held by production, and Lonestar does not currently plan any drilling activity here in 2017.
Burns Ranch
Lonestar has drilled the B#1H and B#2H on Burns Ranch to total depths of 17,927 and 18,002 feet, respectively, with projected perforated intervals for these wells at approximately 9,450 feet. Originally scheduled for early September, 2017, but deferred by our third-party service provider, fracture stimulation operations commenced in late October, 2017. Based on our current rates of daily stage completion, flowback is anticipated to begin in mid-November, 2017. Lonestar owns a 92% working interest (“WI”) and a 69% net revenue interest (“NRI”) in these wells. These wells do not contribute to our third quarter revenues.
Horned Frog
In La Salle County, no new wells were completed during the three months ended September 30, 2017. The Horned Frog leasehold is held by production, and Lonestar has constructed a drilling pad and currently plans to drill the Horned Frog B#4H and C#1H wells, planned for perforated intervals of 10,000 feet in the first quarter of 2018.

22
Eagle Ford Shale Trend - Central Region
Gonzales County
Production from four wells completed as part of the Company’s 2017 capital program contributed to the Company’s third quarter results. The Cyclone #4H & Cyclone #5H were drilled and completed during the second quarter and placed into service in late June, 2017. The production results during the first 120 days in service are encouraging, as the 52,000 barrel average cumulative production from these wells is 31% higher than the first 120 days of Lonestar’s initial wells at Cyclone, the #9H and #10H. The Cyclone #26H and Cyclone #27H wells were drilled and completed in the third quarter and began producing on September 22, 2017. Lonestar has a 100% WI and 79% NRI in these wells. The Cyclone #26H and #27H wells were fracture-stimulated in engineered completions with an average proppant concentration of 1,525 pounds per foot over 28 stages per well, and utilized diverters. The Cyclone #26H was completed with a perforated interval of 8,351 feet and tested 760 Bbls/d and 420 Mcf/d, or 762 Boe/d (three-stream) on a 24/64’’ choke. The well has recently established a 30-day production rate of 723 Boe/d, consisting of 637 barrels of oil per day (88%), 39 barrels of natural gas liquids (5%), and 282 Mcf per day of natural gas (7%). The Cyclone #27H was completed with a perforated interval of 8,278 feet and tested 733 Bbls/d and 428 Mcf/d, or 831 Boe/d (three-stream) on a 22/64’’ choke. The well has recently established a 30-day production rate of 687 Boe/d, consisting of 609 barrels of oil per day (88%), 39 barrels of natural gas liquids (6%), and 282 Mcf per day of natural gas (6%). On average, these two new wells have recovered 14% of their frac load, to date.
Pirate
In Wilson County, no new wells were completed during the three months ended September 30, 2017. The Pirate leasehold is held by production, and Lonestar does not currently plan any drilling activity here in 2017.
Eagle Ford Shale Trend - Eastern Region
Brazos & Robertson Counties
Lonestar owns a 50% WI/ 39% NRI in the Wildcat B#1H, which was placed into service in May 2017. The Wildcat B#1H has now been producing for five months. The Company is encouraged by the productivity of the well, with cumulative production having totaled 225,000 barrels of oil equivalent, which is 65% greater than the average cumulative production from the 20 offset wells drilled by another operator and 23% higher than the most prolific producing offset well. The Wildcat B#1H was classified as “Probable” in the Company’s third-party reserve report as of December 31, 2016. In that third-party report, gross reserves were estimated at 840,000 barrels of oil equivalent. At the request of the Company, our third-party engineer updated its reserves forecast for the Wildcat B#1H to account for actual production results. The updated reserves estimates yield a 29% increase in forecasted Estimated Ultimate Recovery (“EUR”) to 1,086,000 barrels of oil equivalent. The results of the Wildcat B#1H are encouraging, as Lonestar has a sizable leasehold position in the Wildcat Area in the deep Eagle Ford section in Brazos County, and notably, has not booked any proved reserves to the area. Lonestar has 9,555 gross / 6,420 net acres in the Wildcat area, which holds 38 extended-reach drilling locations, based on 800-foot spacing.
Eagle Ford Shale Acquisitions
Karnes, Gonzales, Fayette, Lavaca, DeWitt Counties
Lonestar assumed operatorship of the Marquis and Battlecat Acquisitions on June 15, 2017. The Company quickly transferred daily operations from third party contractors to Lonestar employees and conducted approximately $2 million of capital improvements on 41 of the 81 wells to bring the wells to the Company’s operational standards. This spending has resulted in improved performance, reduced maintenance and September’s production represented the highest month of production since April, 2017.

23
Operating Results
The following discussion relates to our consolidated results of operations, financial condition and capital resources. You should read this discussion in conjunction with our consolidated financial statements and the notes thereto. Comparative results of operations for the period indicated are discussed below.
Results of operations for the three months ended September 30, 2017 compared to the three months ended September 30, 2016
Net Production
For the three monthsended September 30,
2017 2016 % Change
Crude Oil (Bbls/d): Eagle Ford Shale 5,250 2,903 81%Conventional — 272 -100%
Total Crude Oil 5,250 3,175 65%
Natural Gas Liquids (Bbls/d): Eagle Ford Shale 1,228 1,237 -1%Conventional — 1 -100%
Total NGLs 1,228 1,238 -1%
Natural Gas (Mcf/d): Eagle Ford Shale 7,105 8,064 -12%Conventional — 977 -100%
Total Natural Gas 7,105 9,041 -21%
Oil Equivalent (Boe/d): Eagle Ford Shale 7,662 5,485 40%Conventional — 436 -100%
Total Oil Equivalent 7,662 5,921 29%
Production volumes during the three months ended September 30, 2017 were 7,662 Boe/d, an increase of 29% from 5,921 Boe/d during the three months ended September 30, 2016. The increase in our average daily production is primarily the result of Lonestar’s acquisition of the Marquis and Battlecat properties at the end of the second quarter of 2017, which contributed 1,883 Boe/d for the three months ended September 30, 2017. The comparisons for the period are also impacted by the prior sale of our Conventional assets, which contributed 436 Boe/d for the three months ended September 30, 2016 and 0 Boe/d for the three months ended September 30, 2017. Sequentially, Lonestar reported a 36% increase in net oil and gas production, increasing production to 7,662 Boe/d during the three months ended September 30, 2017 compared to 5,635 Boe/d during the three months ended June 30, 2017. For the three months ended September 30, 2017, approximately 69% of our production was crude oil, 16% was NGLs and 15% was natural gas.
• Net production from our Eagle Ford Shale assets averaged approximately 7,662 Boe/d in the three months ended September 30, 2017, a 40% increase over the approximate 5,485 Boe/d in the three months ended September 30, 2016. Approximately 85% of our Eagle Ford production in the three months ended September 30, 2017 was liquid hydrocarbons. Sequentially, Lonestar reported a 36% increase in net oil and gas production in its Eagle Ford Shale assets, increasing production to 7,662 Boe/d during the three months ended September 30, 2017 compared to 5,635 Boe/d during the three months ended June 30, 2017.
• Net production from our Conventional properties was 0 Boe/d in the three months ended September 30, 2017 compared to 436 Boe/d in the three months ended September 30, 2016 due to the divestiture of our Conventional assets in the second half of 2016.

24
Average Sales Price
For the three monthsended September 30,
2017 2016 % Change
Crude Oil ($/Bbls): Eagle Ford Shale $ 47.96 $ 42.11 14%Conventional — 41.46 -100%
Total Crude Oil $ 47.96 $ 42.05 14%
Natural Gas Liquids ($/Bbls): Eagle Ford Shale $ 16.19 $ 9.33 73%Conventional — 6.16 -100%
Total NGLs $ 16.19 $ 9.33 74%
Natural Gas ($/Mcf): Eagle Ford Shale $ 2.90 $ 2.67 8%Conventional — 2.29 -100%
Total Natural Gas $ 2.90 $ 2.63 10%
Oil Equivalent ($/Boe): Eagle Ford Shale $ 38.14 $ 28.33 35%Conventional — 31.05 -100%
Total Oil Equivalent, excluding the effect from hedging $ 38.14 $ 28.53 34%
Total Oil Equivalent, including the effect from hedging $ 40.66 $ 40.03 2%
The average wellhead price for our production in the three months ended September 30, 2017 was $38.14 per Boe, a 34% increase compared to the average price in the comparable period in 2016. Reported wellhead realizations were positively influenced by a 7% increase in the crude oil benchmark price (West Texas Intermediate) and a 3% increase in the natural gas benchmark price (Henry Hub) between these periods. The Company also benefited from its ongoing ability to negotiate better local discounts to the benchmarks. Our crude oil hedge positions added $3.69 per barrel of oil sold or $2.53 per Boe.
• The average wellhead price for our Eagle Ford Shale production in the three months ended September 30, 2017 was $38.14 per Boe, which was 35% higher than the average price in the comparable period in 2016 due to the increase in the crude oil and natural gas benchmark prices.
• The average wellhead price for our Conventional properties in the three months ended September 30, 2017 was $0.00 per Boe, due to the divestiture of our Conventional assets in the second half of 2016.
Revenues
For the three monthsended September 30,
($ in thousands) 2017 2016 % Change
Oil Revenues: Eagle Ford Shale $ 23,162 $ 11,247 106%Conventional — 1,038 -100%
Total Oil Revenues $ 23,162 $ 12,285 89%NGLs Revenues:
Eagle Ford Shale $ 1,831 $ 1,063 72%Conventional — 0 -100%
Total NGLs Revenues $ 1,831 $ 1,063 72%Natural Gas Revenues:
Eagle Ford Shale $ 1,890 $ 1,984 (5)%Conventional — 206 -100%
Total Natural Gas Revenues $ 1,890 $ 2,190 -14%Total Wellhead Revenues:
Eagle Ford Shale $ 26,883 $ 14,294 88%Conventional — 1,244 -100%
Total Wellhead Revenues $ 26,883 $ 15,538 73%

25
Wellhead revenues in the three months ended September 30, 2017 were $26.9 million, a 73% increase from $15.5 million from the comparable period in 2016. This increase in revenue was a result of a 29% increase in production and a 34% increase in realizations. We also realized favorable crude oil hedge cash settlements, which added $1.8 million in gains on commodity derivatives for the three months ended September 30, 2017.
• Wellhead revenues for our Eagle Ford Shale assets in the three months ended September 30, 2017 were $26.9 million, an 88% increase from the comparable period in 2016 as a result of a 35% increase in wellhead price realizations coupled with a 40% increase in production in the three months ended September 30, 2017.
• Wellhead revenues for our Conventional properties in the three months ended September 30, 2017 were $0.0 million, compared to $1.2 million, due to the divestiture of our Conventional assets in the second half of 2016.
Costs and Expenses
The table below presents a detail of costs and expenses for the periods indicated.
For the three monthsended September 30,
(In thousands, except expense per Boe) 2017 2016 % Change
Operating Expenses: Lease operating and gas gathering $ 4,515 4,006 13%Production, ad valorem, and severance taxes 1,541 907 70%Depreciation, depletion and amortization 15,929 10,718 49%General and administrative 2,298 2,870 -20%Rig standby expense 61 364 -83%
Operating Expenses per Boe:
Lease operating and gas gathering $ 6.40 $ 7.36 -13%Production, ad valorem, and severance taxes 2.19 1.67 31%Depreciation, depletion and amortization 22.60 19.68 15%General and administrative 3.26 5.27 -38%
Lease Operating and Gas Gathering Expenses
Lease operating expenses are the costs incurred in the operation of producing properties and workover costs. Expenses for direct labor, water injection and disposal, utilities, materials and supplies comprise the most significant portion of our lease operating expenses. Lease operating expenses do not include general and administrative expenses or production, ad valorem, or severance taxes.
Our lease operating expenses increased $0.5 million (13%) in the three months ended September 30, 2017 to $4.5 million from $4.0 million in the comparable period in 2016. However, on a unit-of-production basis, our lease operating expenses decreased 13% from $7.36 per Boe in the three months ended September 30, 2016 to $6.40 per Boe in the three months ended September 30, 2017 due to our ability to integrate our recent Eagle Ford Shale acquisitions on a cost-effective basis, as well as reduced operating expenses associated with the sale of our Conventional assets in the second half of 2016.
Sequentially, our lease operating expense increased by 28%, or $1.0 million to $4.5 million in the three months ended September 30, 2017 from $3.5 million in the three months ended June 30, 2017. Increased lease operating expenses are a function of the acquisition of 81 gross Eagle Ford Shale wells, which added 1,883 Boe/d of production in the three months ended September 30, 2017. On a unit-of-production basis, we reduced our lease operating expenses by 7% sequentially to $6.40 per Boe in the three months ended September 30, 2017, from $6.87 per Boe in the three months ended June 30, 2017.
Production, Severance and Ad Valorem Taxes
Severance and ad valorem taxes are paid on produced crude oil and natural gas based upon a percentage of gross revenues or at fixed rates established by state or local taxing authorities. In general, the production taxes we pay correlate to the changes in oil and natural gas revenues. We are also subject to ad valorem taxes in the counties where our production is located. Ad valorem taxes are generally based on the valuation of our oil and natural gas properties.
Our total production, severance and ad valorem taxes in the three months ended September 30, 2017 were $1.5 million, an increase of $0.6 million (70%) to $0.9 million from the comparable period in 2016 primarily due to the 29% increase in production.

26
Rig Standby Expense
The Company incurred rig standby expense of $0.1 million in the three months ended September 30, 2017, compared to $0.4 million in the three months ended September 30, 2016.
Depreciation, Depletion and Amortization (DD&A)
For the three monthsended September 30,
2017 2016 (In thousands)
DD&A of proved oil and gas properties $ 15,658 $ 10,498 Depreciation of other property and equipment 233 167 Accretion of asset retirement obligations 38 53
Depreciation, Depletion and Amortization $ 15,929 $ 10,718
Capitalized costs attributed to our proved properties are subject to depreciation and depletion. Depreciation and depletion of the cost of oil and natural gas properties is calculated using the unit-of-production method aggregating properties on a field basis. For leasehold acquisition costs and the cost to acquire proved properties, the reserve base used to calculate depreciation and depletion is the sum of proved developed reserves and proved undeveloped reserves. For development costs, the reserve base used to calculate depletion and depreciation is proved developed reserves only. Other property and equipment are carried at cost, and depreciation is calculated using the straight-line method over the estimated useful lives of the assets, ranging from 3 to 5 years.
DD&A in the three months ended September 30, 2017 was $15.9 million, increased 49% from the comparable period in 2016 due to Lonestar’s acquisition of the Marquis and Battlecat properties which helped increase production 29% as well as the sale of our Conventional assets that held fully depleted producing properties. On a unit of production basis, DD&A increased 15% from $19.68 in the three months ended September 30, 2016 to $22.60 in the three months ended September 30, 2017 due to the sale of our Conventional assets that held fully depleted producing properties.
Sequentially, Lonestar reported a 27% increase in DD&A, increasing DD&A to $15.9 million during the three months ended September 30, 2017, compared to $12.5 million during the three months ended June 30, 2017. Increased DD&A is a function of the acquisition of 81 gross Eagle Ford Shale wells which added 1,883 Boe/d of production in the three months ended September 30, 2017. On a unit of production basis, we reduced our DD&A 8% sequentially to $22.60 per Boe in the three months ended September 30, 2017, from $24.48 per Boe in the three months ended June 30, 2017 due to Lonestar’s acquisition of the Marquis and Battlecat properties which have lower depletion rates per Boe.
Impairment of Oil and Gas Properties
The Company did not record impairment expense for the three months ended September 30, 2017, a decrease of $29.1 million from the three months ended September 30, 2016.
General and Administrative (G&A) Expenses
G&A expenses decreased $0.6 million to $2.3 million in the three months ended September 30, 2017 from $2.9 million from the comparable period in 2016. On a unit of production basis, we decreased our G&A expense by 38% from $5.27 per Boe in the three months ended September 30, 2016 to $3.26 per Boe in the three months ended September 30, 2017.

27
Interest Expense
Our interest expense in the three months ended September 30, 2017 was $5.0 million, a decrease of 13% from $5.8 million from the comparable period in 2016 due to the repayment of our Second Lien Notes and the partial repurchase of the 8.750% Senior Notes. On a unit of production basis, we reduced our interest expense by 48% from $13.49 per Boe in the three months ended September 30, 2016 to $7.05 per Boe in the three months ended September 30, 2017.
For the three monthsended September 30,
2017 2016 (In thousands)
Interest expense on 8.750% Senior Notes $ 3,129 $ 4,268 Interest expense on Second Lien Notes — 505 Interest expense on Senior Secured Credit Facility 1,831 969 Other interest expense 71 9
Interest expense, net $ 5,031 $ 5,751
Gains (Losses) on Derivative Financial Instruments
In the three months ended September 30, 2017, we recognized a non-cash loss of $9.4 million on our commodity derivative contracts related to the change in mark-to-market value of our derivative contracts and while recording a $1.8 million realized gain on settlement of our commodity derivative contracts during the quarter. Settlement of the crude oil hedge positions added $3.69 per barrel to crude oil price realization during the three months ended September 30, 2017.
Income Taxes
As a result of the net loss before income tax of $11.5 million in the three months ended September 30, 2017 and net loss before income tax of $9.6 million in three months ended September 30, 2016, we recorded an income tax benefit of $4.7 million in the 2017 period and an income tax expense of $1.7 million in the 2016 period.
Net Income (Loss) Before Taxes
As a result of the $11.3 million (73%) increase in revenue caused by the increase in crude oil and natural gas benchmark prices, a $29.1 million decrease in impairment expense, a $0.7 million decrease in interest expense, and an unrealized gain on warrants of $1.0 million, offset by an increase in loss on derivatives of $9.3 million, a $5.2 million increase in DD&A, and a $29.4 million decrease in gain on disposal of bonds, we recorded a net loss before income tax of $11.5 million in the three months ended September 30, 2017 compared to net loss before income tax of $9.6 million in the three months ended September 30, 2016.

28
Results of operations for the nine months ended September 30, 2017 compared to the nine months ended September 30, 2016
Net Production
For the nine months ended September 30, 2017 2016 % Change
Crude Oil (Bbls/d): Eagle Ford Shale 4,026 3,192 26%Conventional — 330 -100%
Total Crude Oil 4,026 3,522 14%
Natural Gas Liquids (Bbls/d): Eagle Ford Shale 1,055 1,220 -14%Conventional — 7 -100%
Total NGLs 1,055 1,227 -14%
Natural Gas (Mcf/d): Eagle Ford Shale 6,682 8,386 -20%Conventional — 1,209 -100%
Total Natural Gas 6,682 9,595 -30%
Oil Equivalent (Boe/d): Eagle Ford Shale 6,194 5,810 7%Conventional — 538 -100%
Total Oil Equivalent 6,194 6,348 -2%
Production volumes during the nine months ended September 30, 2017 were 6,194 Boe/d, a decrease of 2% from 6,348 Boe/d during the nine months ended September 30, 2016. The decrease in our average daily production is primarily the result of Lonestar’s sale of its Conventional assets in the second half of 2016, which had contributed 538 Boe/d for the nine months ended September 30, 2016, and reduced drilling activity in the second half of 2016, which yielded natural production declines through the first quarter of 2017. These decreases were partially offset by renewed drilling in 2017, as well as our recent acquisitions of the Battlecat and Marquis properties, which closed on June 15, 2017. For the nine months ended September 30, 2017, approximately 65% of our production was crude oil, 17% was NGLs and 18% was natural gas.
• Net production from our Eagle Ford Shale assets averaged approximately 6,194 Boe/d in the nine months ended September 30, 2017, a 7% increase over the approximate 5,810 Boe/d in the nine months ended September 30, 2016. Approximately 82% of our Eagle Ford production in the nine months ended September 30, 2017 was liquid hydrocarbons.
• Net production from our Conventional properties was 0 Boe/d in the nine months ended September 30, 2017 compared to 538 Boe/d in the nine months ended September 30, 2016 due to the divestiture of our Conventional assets in the second half of 2016.

29
Average Sales Price
For the nine months ended September
30, 2017 2016 % Change
Crude Oil ($/Bbls): Eagle Ford Shale $ 47.99 $ 37.80 27%Conventional — 37.01 -100%
Total Crude Oil $ 47.99 $ 37.73 27%
Natural Gas Liquids ($/Bbls): Eagle Ford Shale $ 16.74 $ 8.00 109%Conventional — 5.98 -100%
Total NGLs $ 16.74 $ 7.99 110%
Natural Gas ($/Mcf): Eagle Ford Shale $ 2.78 $ 2.08 34%Conventional — 2.04 -100%
Total Natural Gas $ 2.78 $ 2.07 34%
Oil Equivalent ($/Boe): Eagle Ford Shale $ 37.04 $ 25.45 46%Conventional — 27.32 -100%
Total Oil Equivalent, excluding the effect from hedging $ 37.04 $ 25.61 45%
Total Oil Equivalent, including the effect from hedging $ 39.31 $ 38.72 2%
The average wellhead price for our production in the nine months ended September 30, 2017 was $37.04 per Boe, which was 45% higher than the average price in the comparable period in 2016. Reported wellhead realizations were driven higher by increases in both the crude oil and natural gas benchmarks between the periods. In addition to the increases in benchmark prices, our crude oil hedge positions added $3.49 per barrel of oil or $2.27 per barrel of oil equivalent.
• The average wellhead price for our Eagle Ford Shale production in the nine months ended September 30, 2017 was $37.04 per Boe, which was 46% higher than the average price in the comparable period in 2016 due to the significant increases in the crude oil and natural gas benchmarks.
• The average wellhead price for our Conventional properties in the nine months ended September 30, 2017 was $0.00 per Boe, due to the divestiture of our Conventional assets in the second half of 2016.
Revenues
For the nine months ended September
30, ($ in thousands) 2017 2016 % Change
Oil Revenues: Eagle Ford Shale $ 52,742 $ 33,063 60%Conventional — 3,341 -100%
Total Oil Revenues $ 52,742 $ 36,404 45%NGLs Revenues:
Eagle Ford Shale $ 4,820 $ 2,673 80%Conventional — 12 -100%
Total NGLs Revenues $ 4,820 $ 2,685 80%Natural Gas Revenues:
Eagle Ford Shale $ 5,072 $ 4,772 6%Conventional — 676 -100%
Total Natural Gas Revenues $ 5,072 $ 5,448 -7%Total Wellhead Revenues:
Eagle Ford Shale $ 62,634 $ 40,508 55%Conventional — 4,029 -100%
Total Wellhead Revenues $ 62,634 $ 44,537 41%

30
Wellhead revenues in the nine months ended September 30, 2017 were $62.6 million, a 41% increase from $44.5 million compared to the comparable period in 2016. These increases in revenue were a result of increases in benchmark prices. We also realized favorable crude oil hedge cash settlements, which added $3.8 million in gains on commodity derivatives for the nine months ended September 30, 2017.
• Wellhead revenues for our Eagle Ford Shale in the nine months ended September 30, 2017 were $62.6 million, a 55% increase from the comparable period in 2016 as a result of a 46% increase in wellhead price realizations, coupled with a 7% increase in production in the nine months ended September 30, 2017.
• Wellhead revenues for our Conventional properties in the nine months ended September 30, 2017 were $0.0 million, compared to $4.0 million from the comparable period in 2016 as a result of the divestiture of our Conventional assets in the second half of 2016.
Costs and Expenses
The table below presents a detail of costs and expenses for the periods indicated.
For the nine months ended
September 30, (In thousands, except expense per Boe 2017 2016 % Change
Operating Expenses: Lease operating and gas gathering $ 10,992 $ 12,764 -14%Production, ad valorem, and severance taxes 3,656 3,046 20%Depreciation, depletion and amortization 40,623 38,461 6%General and administrative 7,940 8,501 -7%Rig standby expense 61 2,261 -97%
Operating Expenses per Boe:
Lease operating and gas gathering $ 6.50 $ 7.34 -11%Production, ad valorem, and severance taxes 2.16 1.75 23%Depreciation, depletion and amortization 24.02 22.11 9%General and administrative 4.70 4.89 -4%
Lease Operating and Gas Gathering Expenses
Lease operating expenses are the costs incurred in the operation of producing properties and workover costs. Expenses for direct labor, water injection and disposal, utilities, materials and supplies comprise the most significant portion of our lease operating expenses. Lease operating expenses do not include general and administrative expenses or production or ad valorem taxes.
Our total lease operating expenses decreased 14% in the nine months ended September 30, 2017 to $11.0 million from the comparable period in 2016 due to a 2% decrease in production as well as operational efficiencies by implementing salt water disposals at multiple properties. On a unit-of-production basis, our lease operating expenses decreased 11% from $7.34 per Boe in the nine months ended September 30, 2016 to $6.50 per Boe in the nine months ended September 30, 2017.
Production, Severance and Ad Valorem Taxes
Severance and ad valorem taxes are paid on produced crude oil and natural gas based upon a percentage of gross revenues or at fixed rates established by state or local taxing authorities. In general, the production taxes we pay correlate to the changes in oil and natural gas revenues. We are also subject to ad valorem taxes in the counties where our production is located. Ad valorem taxes are generally based on the valuation of our oil and natural gas properties.
Our total production, severance, and ad valorem taxes were $3.7 million in the nine months ended September 30, 2017 compared to $3.0 million in the comparable period in 2016.
Rig Standby Expense
The Company incurred rig standby expense of $0.1 million in the nine months ended September 30, 2017, compared to $2.3 million in the nine months ended September 30, 2016.

31
Depreciation, Depletion and Amortization (DD&A)
Capitalized costs attributed to our proved properties are subject to depreciation and depletion. Depreciation and depletion of the cost of oil and natural gas properties is calculated using the unit-of-production method aggregating properties on a field basis. For leasehold acquisition costs and the cost to acquire proved properties, the reserve base used to calculate depreciation and depletion is the sum of proved developed reserves and proved undeveloped reserves. For development costs, the reserve base used to calculate depletion and depreciation is proved developed reserves only. Other property and equipment are carried at cost, and depreciation is calculated using the straight-line method over the estimated useful lives of the assets, ranging from 3 to 5 years.
DD&A in the nine months ended September 30, 2017 was $40.6 million, a 6% increase from $38.5 million in the comparable period in 2016 primarily due to the sale of our Conventional assets that held fully depleted producing properties. On a unit of production basis, DD&A increased 9% from $22.11 per Boe in the nine months ended September 30, 2016 to $24.02 per Boe in the nine months ended September 30, 2017.
For the nine months ended September 30, 2017 2016 (In thousands)
DD&A of proved oil and gas properties $ 39,959 $ 37,839 Depreciation of other property and equipment 568 462 Accretion of asset retirement obligations 96 160
Depreciation, Depletion and Amortization $ 40,623 $ 38,461
Impairment of Oil and Gas Properties
The Company recorded impairment expense of $27.1 million for the nine months ended September 30, 2017 relating to its West Poplar property in Montana, a 13% decrease from the $32.1 million recorded in the nine months ended September 30, 2016 relating primarily to its conventional properties in Texas.

32
General and Administrative (G&A) Expenses
G&A expense in the nine months ended September 30, 2017 was $7.9 million, a decrease of 7% from $8.5 in the comparable period in 2016. On a unit of production basis, we decreased our G&A expense by 4% from $4.89 per Boe in the three months ended September 30, 2016 to $4.70 per Boe in the three months ended September 30, 2017.
Interest Expense
Our interest expense in the nine months ended September 30, 2017 was $15.4 million, a decrease of $1.5 million from $17.0 million from the comparable period in 2016 due to the incurrence of a $1.1 million early payment premium for the Company paying off its second lien debt, which bore a higher interest rate. On a unit of production basis, interest expense increased 12% from $9.38 per Boe in the three months ended September 30, 2016 to $10.56 per Boe in the six months ended September 30, 2017.
For the nine months ended September 30, 2017 2016 (In thousands)
Interest expense on 8.750% Senior Notes $ 9,809 $ 13,893 Interest expense on Second Lien Notes 2,016 505 Interest expense on Senior Secured Credit Facility 3,535 2,535 Other interest expense 88 28
Interest expense, net $ 15,448 $ 16,961
Gains (Losses) on Derivative Financial Instruments
In the nine months ended September 30, 2017, we recognized a non-cash $2.7 million gain on our commodity derivative contracts related to the change in fair value of our derivative contracts and a $3.8 million realized gain on settlement of our commodity derivative contracts. Settlement of the crude oil hedge positions added $3.49 per barrel to crude oil price realization.
Income Taxes
As a result of the net loss before income tax of $42.2 million in the nine months ended September 30, 2017 and net loss before income tax of $45.8 million from the comparable period in 2016, we recorded income tax benefit of $15.3 million and $10.4 million in the nine months ended September 30, 2017 and 2016, respectively.
Net Income (Loss) Before Taxes
As a result of an increase of $18.1 million (41% ) in revenue caused by the increase in crude oil and natural gas benchmark prices, an increase in gain on derivatives of $9.9 million, an unrealized gain on warrants of $3.9 million, a decrease in lease operating expense $1.8 million, a $1.5 million decrease in interest expense, and a decrease in impairment expense of $4.0 million, offset by an increase in DD&A of $2.2 million, a $29.4 million decrease in gain on disposal of bonds, and acquisition costs of $3.1 million, we recorded a net loss before income tax of $42.2 million in the nine months ended September 30, 2017 compared to a net loss before income tax of $45.8 million in the nine months ended September 30, 2016.
Liquidity and Capital Resources
We expect that our primary sources of liquidity and capital resources will be cash flows generated by operating activities and borrowings under our $500,000,000 Senior Secured Credit Facility (the “Senior Secured Credit Facility”).
We have historically financed our acquisition and development activity through cash flows generated by operating activities, borrowings under our Senior Secured Credit Facility, and the issuance of bonds. As circumstances warrant, we may access the capital markets and issue equity or debt from time to time on an opportunistic basis in a continued effort to optimize our balance sheet and to fund our operations and capital expenditures in the future, dependent upon market conditions and available pricing. Such uses of proceeds may include repayment of our debt, development or acquisition of additional acreage, and general corporate purposes. There can be no assurance that future funding transactions will be available on favorable terms, or at all, and we therefore cannot guarantee the outcome of any such transactions.
At September 30, 2017, we had $4.8 million in cash and cash equivalents and approximately $31.9 million of additional availability under our Senior Secured Credit Facility. Based on current commodity prices, we believe that our drilling program will generate increases in the borrowing base associated with our Senior Secured Credit Facility. Combined with our plans to keep capital spending and cash flow from operations in general balance in 2018, we believe that our existing cash and cash equivalents, cash

33
expected to be generated from operations and the availability of borrowing under our Senior Secured Credit Facility as well as additional capital raised through future debt financing will be sufficient to meet our liquidity requirements, anticipated capital expenditures and payments due under our existing credit facility and notes outstanding for at least the next 12 months. We are in active discussions to refinance our 8.750% Senior Notes due April 2019 on terms that are acceptable to the Company, which will also provide to extend the term of the Senior Secured Credit Facility.
Historical Cash Flows
The following table summarizes our cash flows for the periods indicated:
For the nine months ended September 30, ($ in thousands) 2017 2016
Statement of Cash Flows Data: Net cash provided by (used in):
Operating activities $ 28,467 $ 18,234 Investing activities (177,529) (25,453)Financing activities 147,806 8,916 Effect of exchange rate changes on cash and cash equivalents — (29)Decrease in cash and cash equivalents $ (1,256) $ 1,668
Net Cash Provided By Operating Activities
Net cash provided by operating activities increased $10.3 million from $18.2 million in the nine months ended September 30, 2016 to $28.5 million in the nine months ended September 30, 2017. This increase is primarily due to a decrease in net loss of $8.5 million, a $2.7 million increase in non-cash interest expense, a $29.4 million decrease in gain on disposal of bonds, a $0.9 million decrease in gain on disposal of oil and gas properties, an $8.8 million increase in operating assets and liabilities, and an increase in DD&A of $2.2 million, offset by a $19.4 million dollar decrease in settlements of derivative financial instruments, a $4.0 million decrease in impairment of oil and gas properties, a $5.6 million increase in deferred taxes, a $9.9 million increase in non-cash gain on derivative financial instruments, and a $3.9 million increase in unrealized gain on equity warrants during the nine months ended September 30, 2017.
Net Cash Used In Investing Activities
Net cash used in investing activities increased $152.0 million from $25.5 million in the nine months ended September 30, 2016 to $177.5 million in the nine months ended September 30, 2017. This increase is due to a $105.9 million increase in the acquisition of oil and gas properties, a $32.0 million increase in the development of oil and gas properties, an $11.4 million increase in purchases of other property and equipment, and a decrease in proceeds from sales of oil and gas properties of $2.7 million.
Net Cash Provided By Financing Activities
Net cash provided by financing activities increased $138.9 million from $8.9 million used during the nine months ended September 30, 2016 to $147.8 million provided in the nine months ended September 30, 2017. The increase was due to increased borrowings and equity issuances of $117.1 million and decrease payments on bank borrowings of $27.3 million, offset by costs to issue debt and equity of $5.5 million in the nine months ended September 30, 2017.
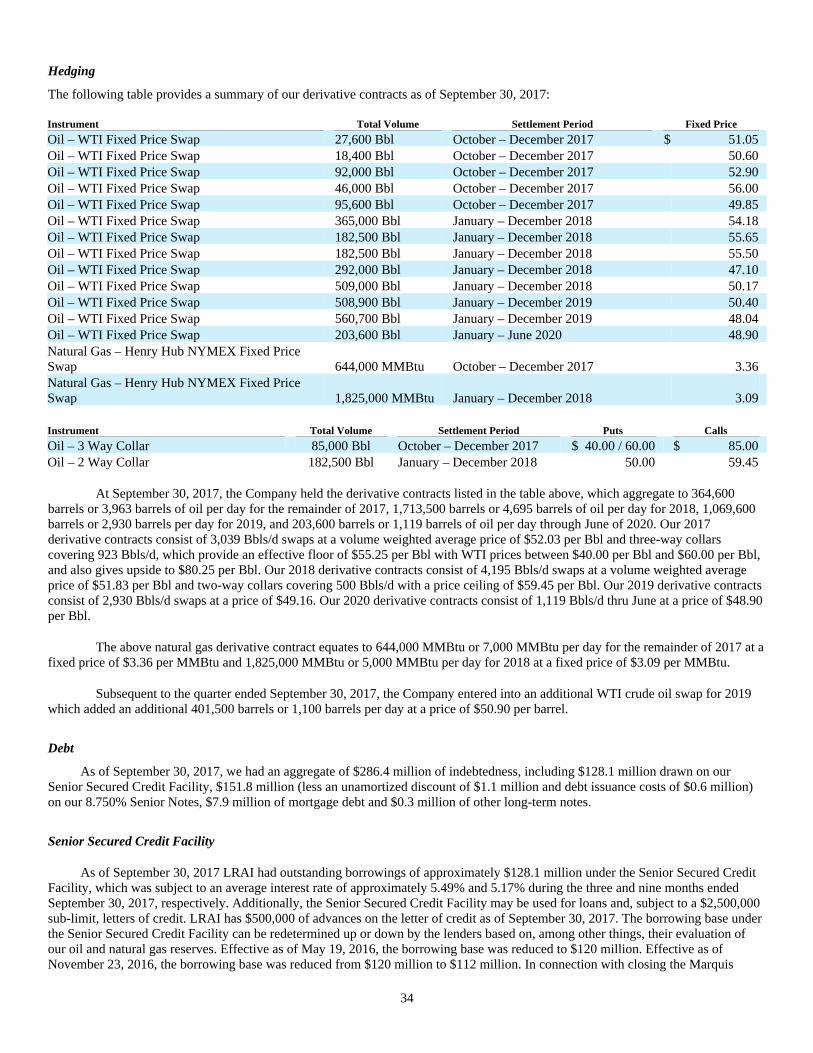
34
Hedging
The following table provides a summary of our derivative contracts as of September 30, 2017:
Instrument Total Volume Settlement Period Fixed Price
Oil – WTI Fixed Price Swap 27,600 Bbl October – December 2017 $ 51.05 Oil – WTI Fixed Price Swap 18,400 Bbl October – December 2017 50.60 Oil – WTI Fixed Price Swap 92,000 Bbl October – December 2017 52.90 Oil – WTI Fixed Price Swap 46,000 Bbl October – December 2017 56.00 Oil – WTI Fixed Price Swap 95,600 Bbl October – December 2017 49.85 Oil – WTI Fixed Price Swap 365,000 Bbl January – December 2018 54.18 Oil – WTI Fixed Price Swap 182,500 Bbl January – December 2018 55.65 Oil – WTI Fixed Price Swap 182,500 Bbl January – December 2018 55.50 Oil – WTI Fixed Price Swap 292,000 Bbl January – December 2018 47.10 Oil – WTI Fixed Price Swap 509,000 Bbl January – December 2018 50.17 Oil – WTI Fixed Price Swap 508,900 Bbl January – December 2019 50.40 Oil – WTI Fixed Price Swap 560,700 Bbl January – December 2019 48.04 Oil – WTI Fixed Price Swap 203,600 Bbl January – June 2020 48.90 Natural Gas – Henry Hub NYMEX Fixed Price Swap 644,000 MMBtu October – December 2017 3.36 Natural Gas – Henry Hub NYMEX Fixed Price Swap 1,825,000 MMBtu January – December 2018 3.09
Instrument Total Volume Settlement Period Puts Calls
Oil – 3 Way Collar 85,000 Bbl October – December 2017 $ 40.00 / 60.00 $ 85.00 Oil – 2 Way Collar 182,500 Bbl January – December 2018 50.00 59.45
At September 30, 2017, the Company held the derivative contracts listed in the table above, which aggregate to 364,600 barrels or 3,963 barrels of oil per day for the remainder of 2017, 1,713,500 barrels or 4,695 barrels of oil per day for 2018, 1,069,600 barrels or 2,930 barrels per day for 2019, and 203,600 barrels or 1,119 barrels of oil per day through June of 2020. Our 2017 derivative contracts consist of 3,039 Bbls/d swaps at a volume weighted average price of $52.03 per Bbl and three-way collars covering 923 Bbls/d, which provide an effective floor of $55.25 per Bbl with WTI prices between $40.00 per Bbl and $60.00 per Bbl, and also gives upside to $80.25 per Bbl. Our 2018 derivative contracts consist of 4,195 Bbls/d swaps at a volume weighted average price of $51.83 per Bbl and two-way collars covering 500 Bbls/d with a price ceiling of $59.45 per Bbl. Our 2019 derivative contracts consist of 2,930 Bbls/d swaps at a price of $49.16. Our 2020 derivative contracts consist of 1,119 Bbls/d thru June at a price of $48.90 per Bbl.
The above natural gas derivative contract equates to 644,000 MMBtu or 7,000 MMBtu per day for the remainder of 2017 at a fixed price of $3.36 per MMBtu and 1,825,000 MMBtu or 5,000 MMBtu per day for 2018 at a fixed price of $3.09 per MMBtu.
Subsequent to the quarter ended September 30, 2017, the Company entered into an additional WTI crude oil swap for 2019 which added an additional 401,500 barrels or 1,100 barrels per day at a price of $50.90 per barrel.
Debt
As of September 30, 2017, we had an aggregate of $286.4 million of indebtedness, including $128.1 million drawn on our Senior Secured Credit Facility, $151.8 million (less an unamortized discount of $1.1 million and debt issuance costs of $0.6 million) on our 8.750% Senior Notes, $7.9 million of mortgage debt and $0.3 million of other long-term notes.
Senior Secured Credit Facility
As of September 30, 2017 LRAI had outstanding borrowings of approximately $128.1 million under the Senior Secured Credit Facility, which was subject to an average interest rate of approximately 5.49% and 5.17% during the three and nine months ended September 30, 2017, respectively. Additionally, the Senior Secured Credit Facility may be used for loans and, subject to a $2,500,000 sub-limit, letters of credit. LRAI has $500,000 of advances on the letter of credit as of September 30, 2017. The borrowing base under the Senior Secured Credit Facility can be redetermined up or down by the lenders based on, among other things, their evaluation of our oil and natural gas reserves. Effective as of May 19, 2016, the borrowing base was reduced to $120 million. Effective as of November 23, 2016, the borrowing base was reduced from $120 million to $112 million. In connection with closing the Marquis

35
Acquisition and the Battlecat Acquisition, on June 15, 2017, LRAI entered into the Sixth Amendment and Joinder to Credit Agreement (the “Sixth Amendment”) to its Credit Agreement, dated as of July 28, 2015, among LRAI, the subsidiary guarantors party thereto, the several lenders party thereto and Citibank, N.A., in its capacity as administrative agent and as issuing bank. Pursuant to the Sixth Amendment, the Credit Agreement was amended to (i) increase the borrowing base from $112 million to $160 million until redetermined or adjusted in accordance with the Credit Agreement Under the Sixth Amendment, redeterminations are scheduled semi-annually to occur during May and November of each year. The next borrowing base redetermination is scheduled for November 2017.
With borrowings outstanding of $128.1 million and letters of credit of $0.5 million, borrowing availability at September 30, 2017 was $31.4 million.
8.750% Senior Notes
LRAI issued $220 million aggregate principal amount of the 8.750% Senior Notes in April 2014 under an indenture among LRAI, its subsidiary guarantors and Wells Fargo Bank, National Association, as trustee. The Company is not a party to the indenture.
The 8.750% Senior Notes mature on April 15, 2019 and accrue interest at a rate of 8.750% per annum, payable semi-annually in arrears on April 15 and October 15 of each year until the maturity date. The 8.750% Senior Notes are fully and unconditionally guaranteed on a senior unsecured basis by each subsidiary of LRAI.
Securities Purchase Agreement and Second Lien Notes
On August 2, 2016, LRAI and the Company entered into a Securities Purchase Agreement (the “Purchase Agreement”) with Juneau Energy, LLC, as initial purchaser (the “Initial Purchaser”), Leucadia National Corporation (“Leucadia”), as guarantor of the Initial Purchaser’s obligations, the other purchasers party thereto (collectively, along with the Initial Purchaser, the “Purchasers”) and Jefferies, LLC, in its capacity as the collateral agent for the Purchasers, relating to the issuance and sale of (i) up to $49,900,000 aggregate principal amount of the Second Lien Notes and (ii) five-year warrants to purchase up to an aggregate 998,000 shares of the Company’s Class A voting common stock at a price equal to $5.00 per share.
The Second Lien Notes are secured by second-priority liens on substantially all of LRAI’s and its subsidiaries’ assets to the extent such assets secure obligations under the Senior Secured Credit Facility.
During 2016, LRAI issued $38.0 million in aggregate principal amount of Second Lien Notes and the Company issued the Warrants to purchase 760,000 shares of its Class A voting common stock. The Company recorded an equity warrant liability of approximately $5.1 million which was the fair value amount at the date of issuance. The Warrants were adjusted to fair value at September 30, 2017 which resulted in a gain on the Warrants of approximately $0.4 million for the three months ended September 30, 2017. Proceeds from the Second Lien Notes issuance were used to repurchase approximately $68.2 million in aggregate principal amount of the 8.750% Senior Notes in privately negotiated open market repurchases with holders of such notes, and to pay related fees and expenses related to the foregoing. The repurchase amounts paid were approximately $36.2 million in cash. Net of related fees, such repurchases resulted in a gain on debt extinguishment of approximately $28.5 million.
In December 2016, LRAI repaid $21.0 million principal of the Second Lien Notes with proceeds from the 2016 Common Stock Offering. In June 2017, LRAI repaid the remaining $17.0 million principal of Second Lien Notes, including an early payment premium of approximately $1.1 million with borrowings from the Company’s Senior Secured Credit Facility. The Company also recorded an approximate $2.0 million charge due to early recognition of the warrant discount associated with the payoff of the Second Lien Notes.
Capital Expenditures
Historical capital expenditures
The table below summarizes our capital expenditures incurred for the periods listed below. Future drilling in 2017 will be dictated by cash flow.
Three Months Ended
Nine months ended
($ in thousands) March 31, 2017 June 30, 2017 September 30,
2017 September
30, 2017
Acquisition of oil and gas properties $ 1,563 $ 106,616 $ 852 $109,031 Development of oil and gas properties 19,076 18,674 19,168 56,918 Purchases of other property and equipment 13 1,509 10,058 11,580
Total capital expenditures, net $ 20,652 $ 126,799 $ 30,078 $177,529

36
Critical Accounting Policies and Estimates
The preparation of our financial statements requires us to make estimates and judgments that can affect the reported amounts of assets, liabilities, revenues and expenses, as well as the disclosure of contingent assets and liabilities at the date of our financial statements. We analyze our estimates and judgments, including those related to oil, NGLs and natural gas revenues, oil and natural gas properties, impairment of long-lived assets, fair value of derivative instruments, asset and retirement obligations and income taxes, and we base our estimates and judgments on historical experience and various other assumptions that we believe to be reasonable under the circumstances. Actual results may vary from our estimates. The policies of particular importance to the portrayal of our financial position and results of operations and that require the application of significant judgment or estimates by our management are summarized in the “Management’s Discussion and Analysis of Financial Condition and Results of Operations” section of our Annual Report on Form 10-K as reported and filed with the SEC on March 23, 2017 (our “2016 10-K”). As of September 30, 2017, there were no significant changes to any of our critical accounting policies and estimates.
Recently Issued Accounting Pronouncements
See “Note 2. Recently Issued Accounting Pronouncements” in the Notes to Unaudited Consolidated Financial Statements in this report for discussion of recently issued and adopted accounting standards affecting the Company.
Cautionary Note Regarding Forward-looking Statements
This Quarterly Report on Form 10-Q statement contains forward-looking statements that are subject to a number of known and unknown risks, uncertainties, and other important factors, many of which are beyond our control. We intend such forward-looking statements to be covered by the safe harbor provisions for forward-looking statements contained in Section 27A of the Securities Act of 1933 and Section 21E of the Securities Exchange Act of 1934. All statements, other than statements of historical fact included in this Quarterly Report on Form 10-Q, regarding our strategy, future operations, financial position, projected costs, prospects, plans and objectives of management are forward-looking statements. When used in this Quarterly Report on Form 10-Q, the words “could,” “believe,” “anticipate,” “intend,” “estimate,” “expect,” “may,” “continue,” “predict,” “potential,” “project” and similar expressions are intended to identify forward-looking statements, although not all forward-looking statements contain such identifying words.
Forward-looking statements may include statements about our:
• discovery and development of crude oil, NGLs and natural gas reserves;
• cash flows and liquidity;
• business and financial strategy, budget, projections and operating results;
• timing and amount of future production of crude oil, NGLs and natural gas;
• amount, nature and timing of capital expenditures, including future development costs;
• availability and terms of capital;
• drilling, completion, performance, and operation of wells;
• timing, location and size of property acquisitions and divestitures;
• costs of exploiting and developing our properties and conducting other operations;
• general economic and business conditions; and
• our plans, objectives, expectations and intentions.
All forward-looking statements speak only as of the date of this Quarterly Report on Form 10-Q. You should not place undue reliance on these forward-looking statements. Although we believe that our plans, objectives, expectations and intentions reflected in or suggested by the forward-looking statements we make in this Quarterly Report on Form 10-Q are reasonable, we can give no assurance that these plans, objectives, expectations or intentions will be achieved. We disclose important factors that could cause our actual results to differ materially from our expectations under Item 1A (Risk Factors), Item 8 (Financial Statements and

37
Supplementary Data) and elsewhere in our 2016 10-K, and Part I (Financial Information), Item 1A (Risk Factors) and elsewhere in this Quarterly Report on Form 10-Q.
These important factors include risks related to:
• variations in the market demand for, and prices of, crude oil, NGLs and natural gas;
• lack of proved reserves;
• estimates of crude oil, NGLs and natural gas data;
• the adequacy of our capital resources and liquidity including, but not limited to, access to additional borrowing to fund our operations;
• borrowing capacity under our credit facility;
• general economic and business conditions;
• failure to realize expected value creation from property acquisitions;
• uncertainties about our ability to find, develop or acquire additional oil and natural gas resources;
• uncertainties with regards to our drilling schedules;
• risks related to expiration of leases on our undeveloped leasehold assets;
• our dependence upon several significant customers for the sale of most of our crude oil, natural gas and NGL production;
• counterparty credit risks;
• competitive within the crude oil and natural gas industry;
• technology risks;
• risks related to the concentration of our operations;
• drilling results;
• potential financial losses or earnings reductions from our commodity price risk management programs;
• potential adoption of new governmental regulations;
• our ability to satisfy future cash obligations and environmental costs; and
• the other factors set forth under “Risk Factors” in Item 1A of Part I of our 2016 10-K.
The forward-looking statements relate only to events or information as of the date on which the statements are made in this Quarterly Report on Form 10-Q. Except as required by law, we undertake no obligation to update or revise publicly any forward-looking statements, whether as a result of new information, future events or otherwise, after the date on which the statements are made or to reflect the occurrence of unanticipated events.
Item 3. Quantitative and Qualitative Disclosures About Market Risk.
There have been no material changes in our market risks as of September 30, 2017 from those disclosed in our 2016 10-K.

38
Item 4. Controls and Procedures.
Limitations on Effectiveness of Controls and ProceduresIn designing and evaluating our disclosure controls and procedures, management recognizes that any controls and procedures,
no matter how well designed and operated, can provide only reasonable assurance of achieving the desired control objectives. In addition, the design of disclosure controls and procedures must reflect the fact that there are resource constraints and that management is required to apply judgment in evaluating the benefits of possible controls and procedures relative to their costs.
Evaluation of Disclosure Controls and ProceduresOur management, with the participation of our Chief Executive Officer and Chief Financial Officer, evaluated, as of the end of
the period covered by this Quarterly Report on Form 10-Q, the effectiveness of our disclosure controls and procedures (as defined in Rules 13a-15(e) and 15d-15(e) under the Securities Exchange Act of 1934, as amended). Based on that evaluation, our Chief Executive Officer and Chief Financial Officer concluded that our disclosure controls and procedures were effective at the reasonable assurance level as of September 30, 2017.
Changes in Internal Controls There was no change in our internal control over financial reporting during the quarter ended September 30, 2017 that
materially affected, or is reasonably likely to materially affect, our internal control over financial reporting.
PART II—OTHER INFORMATION
Item 1. Legal Proceedings.
From time to time, we are subject to legal proceedings and claims that arise in the ordinary course of business. Like other crude oil and gas producers and marketers, our operations are subject to extensive and rapidly changing federal and state environmental, health and safety, and other laws and regulations governing air emissions, wastewater discharges and solid and hazardous waste management activities. We are not aware of any material pending or overtly threatened legal action against us.
Item 1A. Risk Factors.
In addition to the other information set forth in this report, you should carefully consider the factors discussed under Item 1A of Part I of “Risk Factors” in our 2016 10-K. These factors could materially adversely affect our business, financial condition, liquidity, results of operations and capital position, and could cause our actual results to differ materially from our historical results or the results contemplated by any forward-looking statements contained in this report. There have been no material changes to our risk factors affecting the Company since the filing of our 2016 10-K.
Item 2. Unregistered Sales of Equity Securities and Use of Proceeds.
None.
Item 3. Defaults Upon Senior Securities.
None.
Item 4. Mine Safety Disclosures.
Not applicable.
Item 5. Other Information.
None.

39
Item 6. Exhibits.
The exhibits in the accompanying Exhibit Index following the signature page are filed or furnished as a part of this report and are incorporated herein by reference.

40
Exhibit Index Incorporated by Reference .
Exhibit Number Description Form File No. ExhibitFilingDate
Filed/FurnishedHerewith
2.1 Scheme Implementation Agreement, by and between Lonestar Resources US Inc. and Lonestar Resources Limited, executed on December 28, 2015
10-12B 001-37670 2.1 12/31/15
2.2 Purchase and Sale Agreement by and between Lonestar Resources US Inc. and Battlecat Oil & Gas, LLC, dated as of May 26, 2017
8-K 001-37670 2.1 6/2/17
2.3 Amendment No. 1, dated June 15, 2017, to the Purchase and Sale Agreement, by and between Lonestar Resources US Inc. and Battlecat Oil & Gas, LLC, dated May 26, 2017
8-K 001-37670 2.1 6/21/17
2.4 Purchase and Sale Agreement by and between Lonestar Resources US Inc. and SN Marquis LLC, dated as of May 26, 2017
8-K 001-37670 2.2 6/2/17
2.5 Amendment No. 1, dated June 15, 2017, to the Purchase and Sale Agreement by and between Lonestar Resources US Inc. and SN Marquis LLC, dated as of May 26, 2017
8-K 001-37670 2.2 6/21/17
3.1 Certificate of Incorporation of Lonestar Resources US Inc.
10-12B 001-37670 3.1 12/31/15
3.2 Certificate of Amendment to the Certificate of Incorporation of Lonestar Resources US Inc.
10-K 001-37670 3.2 3/23/17
3.3 Certificate of Amendment to Certificate of Incorporation of Lonestar Resources US Inc., dated May 24, 2017
8-K 001-37670 3.1 5/26/17
3.4 Amended and Restated Bylaws of Lonestar Resources US Inc.
8-K 001-37670 3.1 4/7/17
3.5 Certificate of Designations of Series B Convertible Preferred Stock
8-K 001-37670 3.1 6/21/17
3.6 Certificate of Designations of Series A-1 Convertible Participating Preferred Stock
8-K 001-37670 3.2 6/21/17
3.7 Certificate of Designations of Series A-2 Convertible Participating Preferred Stock
8-K 001-37670 3.3 6/21/17
4.1 Registration Rights Agreement dated August 2, 2016 by and among Lonestar Resources US Inc., Leucadia National Corporation and Juneau Energy, LLC.
8-K 001-37670 4.1 8/3/16
4.2 Amendment No. 1, dated June 15, 2017, to the Registration Rights Agreement by and among Lonestar Resources US Inc., Leucadia National Corporation and Juneau Energy, LLC (n/k/a JETX Energy, LLC)
8-K 001-37670 4.4 6/21/17
4.3 Registration Rights Agreement, dated October 26, 2016 between Lonestar Resources US Inc. and EF Realisation Company Limited
8-K 001-37670 4.1 11/1/16
4.4 Amendment No. 1, dated June 15, 2017, to the Registration Rights Agreement by and between Lonestar Resources US Inc. and EF Realisation Company Limited
8-K 001-37670 4.5 6/21/17
4.5 Registration Rights Agreement, dated as of June 15, 2017, by and between Lonestar Resources US Inc. and Battlecat Oil & Gas, LLC
8-K 001-37670 4.1 6/21/17

41
4.6 Registration Rights Agreement, dated as of June 15, 2017, by and between Lonestar Resources US Inc. and SN UR Holdings, LLC
8-K 001-37670 4.2 6/21/17
4.7 Registration Rights Agreement, dated as of June 15, 2017, by and between Lonestar Resources US Inc. and Chambers Energy Capital III, LP
8-K 001-37670 4.3 6/21/17
10.1 Lonestar Resources US Inc. Amended and Restated 2016 Incentive Plan, as amended as of May 24, 2017
8-K 001-37670 10.1 5/26/17
10.2 Securities Purchase Agreement by and between Lonestar Resources US Inc., and Chambers Energy Capital III, LP, dated May 26, 2017
8-K 001-37670 10.1 6/2/17
10.3 Amended and Restated Securities Purchase Agreement by and between Lonestar Resources US Inc., and Chambers Energy Capital III, LP, dated June 15, 2017
8-K 001-37670 10.1 6/21/17
10.4 Sixth Amendment and Joinder dated June 15, 2017 to the Credit Agreement dated July 28, 2015 by and among Lonestar Resources America, Inc., the subsidiary guarantors party thereto, the lenders party thereto and Citibank, N.A., Inc. as administrative agent and issuing bank
8-K 001-37670 10.2 6/21/17
31.1 Rule 13a-14(a)/15d-14(a) Certification of Chief Executive Officer
*
31.2 Rule 13a-14(a)/15d-14(a) Certification of Chief Financial Officer
*
32.1 Section 1350 Certification of Chief Executive Officer
**
32.2 Section 1350 Certification of Chief Financial Officer
**
101.INS XBRL Instance Document *101.SCH XBRL Taxonomy Extension Schema Document *101.CAL XBRL Taxonomy Extension Calculation
Linkbase Document*
101.DEF XBRL Taxonomy Extension Definition Linkbase Document
*
101.LAB XBRL Taxonomy Extension Label Linkbase Document
*
101.PRE XBRL Taxonomy Extension Presentation Linkbase Document
*
* Filed herewith.** Furnished herewith

42
SIGNATURES
Pursuant to the requirements of the Securities Exchange Act of 1934, the registrant has duly caused this report to be signed on its behalf by the undersigned thereunto duly authorized.
LONESTAR RESOURCES US INC. (Registrant) Date: November 13, 2017 By: /s/ Frank D. Bracken, III Frank D. Bracken, III Chief Executive Officer
Date: November 13, 2017 By: /s/ Douglas W. Banister Douglas W. Banister Chief Financial Officer

Exhibit 31.1
CERTIFICATIONS
I, Frank D. Bracken, III, certify that:
1. I have reviewed this Quarterly Report on Form 10-Q of Lonestar Resources US Inc.;
2. Based on my knowledge, this report does not contain any untrue statement of a material fact or omit to state a material fact necessary to make the statements made, in light of the circumstances under which such statements were made, not misleading with respect to the period covered by this report;
3. Based on my knowledge, the financial statements, and other financial information included in this report, fairly present in all material respects the financial condition, results of operations and cash flows of the registrant as of, and for, the periods presented in this report;
4. The registrant's other certifying officer(s) and I are responsible for establishing and maintaining disclosure controls and procedures (as defined in Exchange Act Rules 13a-15(e) and 15d-15(e)) for the registrant and have:
(a) Designed such disclosure controls and procedures, or caused such disclosure controls and procedures to be designed under our supervision, to ensure that material information relating to the registrant, including its consolidated subsidiaries, is made known to us by others within those entities, particularly during the period in which this report is being prepared;
(b) [OMITTED];
(c) Evaluated the effectiveness of the registrant's disclosure controls and procedures and presented in this report our conclusions about the effectiveness of the disclosure controls and procedures, as of the end of the period covered by this report based on such evaluation; and
(d) Disclosed in this report any change in the registrant's internal control over financial reporting that occurred during the registrant's most recent fiscal quarter (the registrant's fourth fiscal quarter in the case of an annual report) that has materially affected, or is reasonably likely to materially affect, the registrant's internal control over financial reporting; and
5. The registrant's other certifying officer(s) and I have disclosed, based on our most recent evaluation of internal control over financial reporting, to the registrant's auditors and the audit committee of the registrant's board of directors (or persons performing the equivalent functions):
(a) All significant deficiencies and material weaknesses in the design or operation of internal control over financial reporting which are reasonably likely to adversely affect the registrant's ability to record, process, summarize and report financial information; and
(b) Any fraud, whether or not material, that involves management or other employees who have a significant role in the registrant's internal control over financial reporting.
Date: November 13, 2017 By: /s/ Frank D. Bracken, III Frank D. Bracken, III
Chief Executive Officer
(Principal Executive Officer)
Exhibit 31.2
CERTIFICATIONS
I, Douglas W. Banister, certify that:
1. I have reviewed this Quarterly Report on Form 10-Q of Lonestar Resources US Inc.;
2. Based on my knowledge, this report does not contain any untrue statement of a material fact or omit to state a material fact necessary to make the statements made, in light of the circumstances under which such statements were made, not misleading with respect to the period covered by this report;
3. Based on my knowledge, the financial statements, and other financial information included in this report, fairly present in all material respects the financial condition, results of operations and cash flows of the registrant as of, and for, the periods presented in this report;
4. The registrant's other certifying officer(s) and I are responsible for establishing and maintaining disclosure controls and procedures (as defined in Exchange Act Rules 13a-15(e) and 15d-15(e)) for the registrant and have:
(a) Designed such disclosure controls and procedures, or caused such disclosure controls and procedures to be designed under our supervision, to ensure that material information relating to the registrant, including its consolidated subsidiaries, is made known to us by others within those entities, particularly during the period in which this report is being prepared;
(b) [OMITTED];
(c) Evaluated the effectiveness of the registrant's disclosure controls and procedures and presented in this report our conclusions about the effectiveness of the disclosure controls and procedures, as of the end of the period covered by this report based on such evaluation; and
(d) Disclosed in this report any change in the registrant's internal control over financial reporting that occurred during the registrant's most recent fiscal quarter (the registrant's fourth fiscal quarter in the case of an annual report) that has materially affected, or is reasonably likely to materially affect, the registrant's internal control over financial reporting; and
5. The registrant's other certifying officer(s) and I have disclosed, based on our most recent evaluation of internal control over financial reporting, to the registrant's auditors and the audit committee of the registrant's board of directors (or persons performing the equivalent functions):
(a) All significant deficiencies and material weaknesses in the design or operation of internal control over financial reporting which are reasonably likely to adversely affect the registrant's ability to record, process, summarize and report financial information; and
(b) Any fraud, whether or not material, that involves management or other employees who have a significant role in the registrant's internal control over financial reporting.
Date: November 13, 2017 By: /s/ Douglas W. Banister Douglas W. Banister
Chief Financial Officer
(Principal Financial Officer)

Exhibit 32.1
CERTIFICATION PURSUANT TO18 U.S.C. SECTION 1350, AS ADOPTED PURSUANT TO
SECTION 906 OF THE SARBANES-OXLEY ACT OF 2002
In connection with the Quarterly Report of Lonestar Resources US Inc. (the “Company”) on Form 10-Q for the period ending September 30, 2017 as filed with the Securities and Exchange Commission on the date hereof (the “Report”), I certify, pursuant to 18 U.S.C. § 1350, as adopted pursuant to § 906 of the Sarbanes-Oxley Act of 2002, that:
(1) The Report fully complies with the requirements of section 13(a) or 15(d) of the Securities Exchange Act of 1934; and
(2) The information contained in the Report fairly presents, in all material respects, the financial condition and result of operations of the Company.
Date: November 13, 2017 By: /s/ Frank D. Bracken, III Frank D. Bracken, III Chief Executive Officer

Exhibit 32.2
CERTIFICATION PURSUANT TO18 U.S.C. SECTION 1350, AS ADOPTED PURSUANT TO
SECTION 906 OF THE SARBANES-OXLEY ACT OF 2002
In connection with the Quarterly Report of Lonestar Resources US Inc. (the “Company”) on Form 10-Q for the period ending September 30, 2017 as filed with the Securities and Exchange Commission on the date hereof (the “Report”), I certify, pursuant to 18 U.S.C. § 1350, as adopted pursuant to § 906 of the Sarbanes-Oxley Act of 2002, that:
(1) The Report fully complies with the requirements of section 13(a) or 15(d) of the Securities Exchange Act of 1934; and
(2) The information contained in the Report fairly presents, in all material respects, the financial condition and result of operations of the Company.
Date: November 13, 2017 By: /s/ Douglas W. Banister Douglas W. Banister Chief Financial Officer