london western riverside study: phase 2 john leaman, mori 11 february 2004
TRANSCRIPT

London Western Riverside Study: Phase 2
London Western Riverside Study: Phase 2
John Leaman, MORI
11 February 2004

Contents
Background
Methodology
Summary - What’s changed?
Main Findings– Attitudes towards Recycling– Knowledge and Views of Services– Recycling Behaviour– Campaigns & Communications
Questions?

Background
One year on from first survey, access to recycling facilities in Western Riverside is improved:
– kerbside schemes fully rolled-out– Orange sacks
Doorstepping campaign and (in Kensington & Chelsea) Recycling Wardens
Work in schools may also help to “educate” parents
Newsletters and articles in council publications

Methodology Second wave designed to update first wave - to gauge impact of new
services and campaign on a Borough-specific level
Wave 19 Oct-26 Nov 20021,300 interviews- 408 Lambeth- 313 H&F- 277 K&C- 302 Wandsworth
Wave 227 Oct-30 Nov 20031,314 interviews- 354 Lambeth- 298 H&F- 312 K&C- 350 Wandsworth
Face-to-face, in-home interviews
Sample selected (by quota) to be representative of 16+ populations in each Borough
Statistically “weighted” to fine-tune profiles, and ensure precise comparability between the two waves

Interpreting the Changes
For changes/trends to be statistically significant, we need shifts (plus or minus) of at least:
– 3 percentage points in the overall results– 8 percentage points in the Borough-specific results
. . . or more if the questions are only asked of certain groups (those with kerbside, those with recycling banks etc)

Summary - What’s Changed?
Summary - What’s Changed? (1)
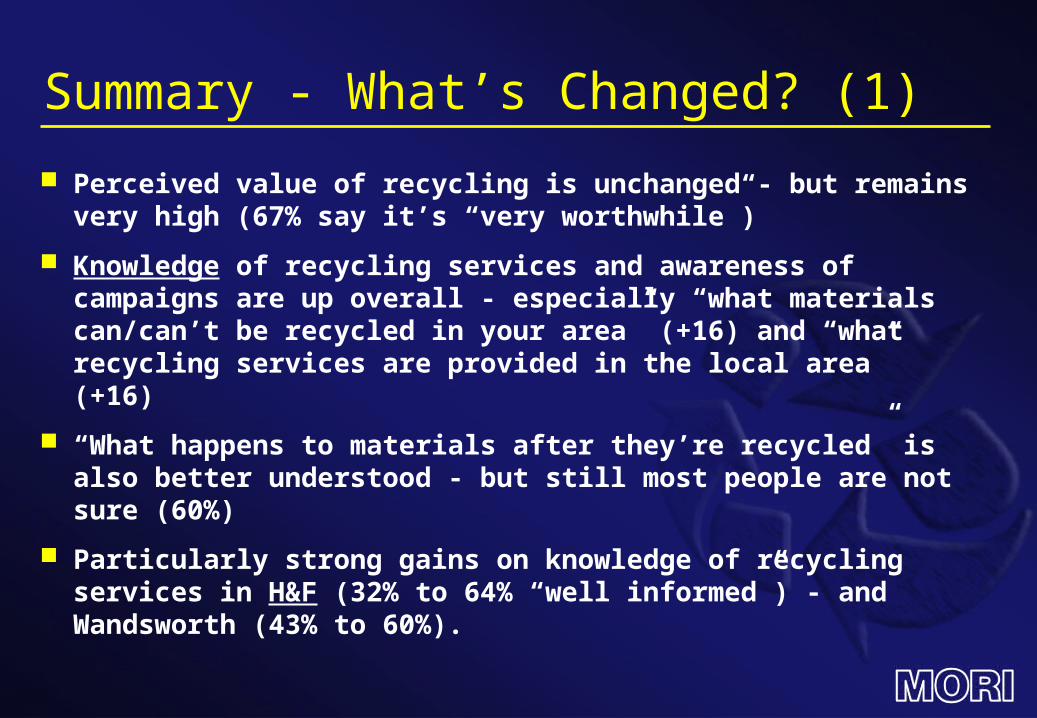
Perceived value of recycling is unchanged - but remains very high (67% say it’s “very worthwhile”)
Knowledge of recycling services and awareness of campaigns are up overall - especially “what materials can/can’t be recycled in your area” (+16) and “what recycling services are provided in the local area” (+16)
“What happens to materials after they’re recycled” is also better understood - but still most people are not sure (60%)
Particularly strong gains on knowledge of recycling services in H&F (32% to 64% “well informed”) - and Wandsworth (43% to 60%).

Summary - What’s Changed? (2)
People now believe that more people are recycling (on average, up from a [perceived] average of 25% to 34%). Gains in all Boroughs - particularly Wandsworth (23% to 39%)
Several specific materials are now more widely felt to be recyclable “in this specific area”: card/cardboard (+7), food and drink cans (+8), fruit juice/milk cartons (+10) and - in particular - plastic bottles (+18)
No shift on newspapers/magazines, glass bottle and jars or old clothes/shoes
Misconceptions remain, however (50% in Lambeth say they can recycle card/cardboard). A typical case of “benefit of the doubt”. . . . ?

Summary - What’s Changed? (3)
As with knowledge and perception of recycling, behaviour is also shifting - dramatically
26% say “I recycle everything possible” (more than doubled from 11% last time)
Borough-specific shifts are:– Lambeth 11% to 24% (+13)– H&F 9% to 31% (+22)– K&C 14% to 19% (+5)– Wandsworth 11% to 30% (+19)
Those reporting low/no recycling are correspondingly fewer

Summary - What’s Changed? (4) Recycling of specific materials reflects growing
perceptions that they can be recycled: “Every/most time” recyclers are now:
– 44% for card/cardboard (+15)– 40% for drink cans (+18)– 25% for fruit juice/milk cartons (+13)– …. and 36% for plastic bottles (+23%)
Increased recycling behaviour is explained by people mainly on the basis of the availability of better facilities:
– “Have been given bins/bags/of different colours” up from 10% to 37% (spontaneous mentions)

Summary - What’s Changed? (5) Reported access to kerbside up from 36% to 54%, and
– from 36% to 42% in Lambeth (+6)– from 31% to 63% in H&F (+32)– from 40% to 41% in K&C (+1)– from 39% to 70% in Wandsworth (+31)
Satisfaction with council - provided recycling facilities up:– “Overall provision” is rated well by– 52% in Lambeth (+12)– 61% in H&F (+34)– 55% in K&C (+28)– 64% in Wandsworth (+24)
Accessibility, range and services at local tips also all better rated overall, in each Borough

Summary - What’s Changed? (6) Home storage remains a challenge; despite some
improvements:– 46% agree they need a container to be provided– 42% say they don’t have enough space– …. 30% feel it causes smells/clutter
And most still feel they need more information on what can/can’t be recycled (albeit down from 68% to 57%).
By Borough, it is– 64% in Lambeth (-1)– 42% in H&F (-26)– 57% in K&C (-16)– 62% in Wandsworth (-5)

Attitudes Towards Recycling

7%
15%
10%
11%
8%
9%
5%
5%
3%
2%
1%
Everybody’s Doing it . . .?Q14 What proportion of households in this area do
you think recycle or compost?
Nobody (0%)
One in ten (10%)
Two in ten (20%)
Four in ten (40%)
Six in ten (60%)
Eight in ten (80%)
Three in ten (30%
Five in ten (half)
Seven in ten (70%)
Nine in ten (90%)Everyone (100%)
-4
-11
-7
-3
-1
+2
+2
+2
+1
+1
0
Change +
Mean 34%(+9)
Base: 1, 314 residents aged 16+, face-to-face, in-home, London Western Riverside, October-November 2003, Waste Watch/MORI
Attitudes Towards Council Recycling
% Agree% Disagree
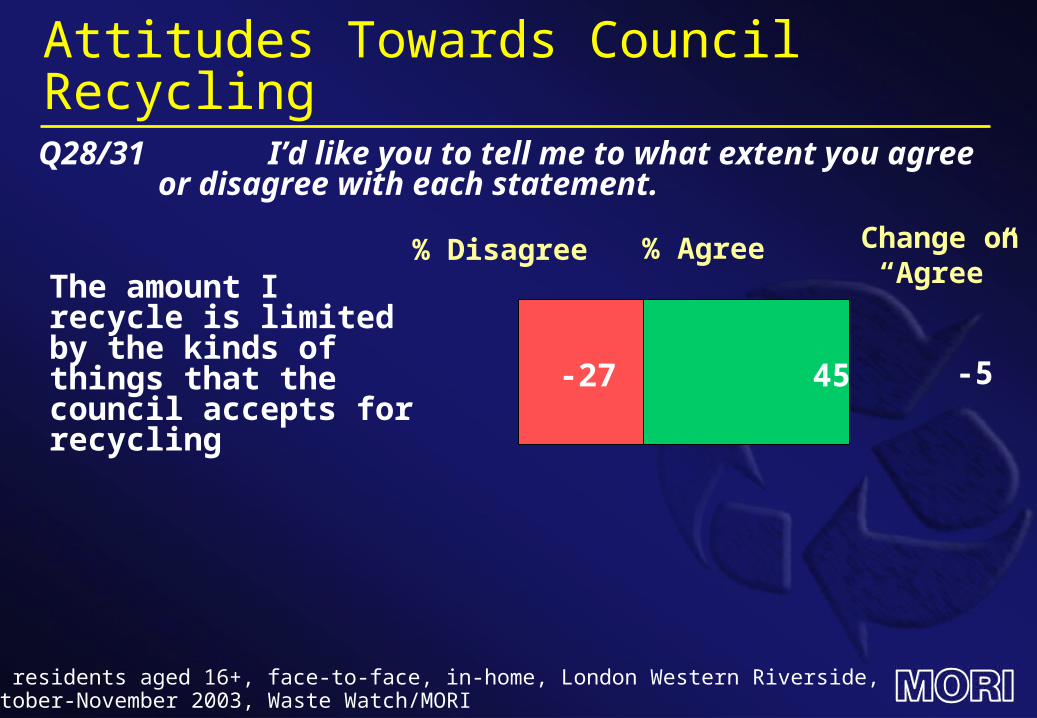
The amount I recycle is limited by the kinds of things that the council accepts for recycling
Q28/31 I’d like you to tell me to what extent you agree or disagree with each statement.
Base: 1, 314 residents aged 16+, face-to-face, in-home, London Western Riverside, October-November 2003, Waste Watch/MORI
-27 45 -5
Change on“Agree”

Attitudes Towards Council Recycling
% Agree% Disagree
The amount I recycle is limited by the kinds of things that the council accepts for recycling
I don’t believe the council actually does recycle all of the items collected for recycling
Q28/31 I’d like you to tell me to what extent you agree or disagree with each statement.
Base: 1, 314 residents aged 16+, face-to-face, in-home, London Western Riverside, October-November 2003, Waste Watch/MORI
-27
-42
45
18
-5
-2
Change on“Agree”

Knowledge and Views of Service

-20
-19
-18
-13
60
58
56
43
Satisfaction with Council Recycling Facilities
% Satisfied
Q21 Thinking about the recycling facilities your local council provides, how satisfied or dissatisfied are you with . . . .?
Accessibility of recycling services
The provision of recycling facilities overall
% Dissatisfied
The provision of recycling facilities at your local tip
Change on“Satisfied”
+18
+18
+11
Base: 1, 314 residents aged 16+, face-to-face, in-home, London Western Riverside, October-November 2003, Waste Watch/MORI
+19
The range of recyclables you are able to deposit

Satisfaction with Council Recycling FacilitiesQ21
Lambeth H&F K&C Wandsworth
Overall Provision 52% (+12) 61% (+34) 55% (+28) 64% (+24)
Accessibility 58% (+14) 68% (+36) 59% (+13) 58% (+14)
Range 43% (+5) 62% (+36) 55% (+7) 64% (+25)
Local Tip 43% (+10) 51% (+27) 33% (0) 45% (+6)
“Satisfied” (& 2000-03 change)
-36 46
Barriers to Recycling in the Home
% Agree% Disagree
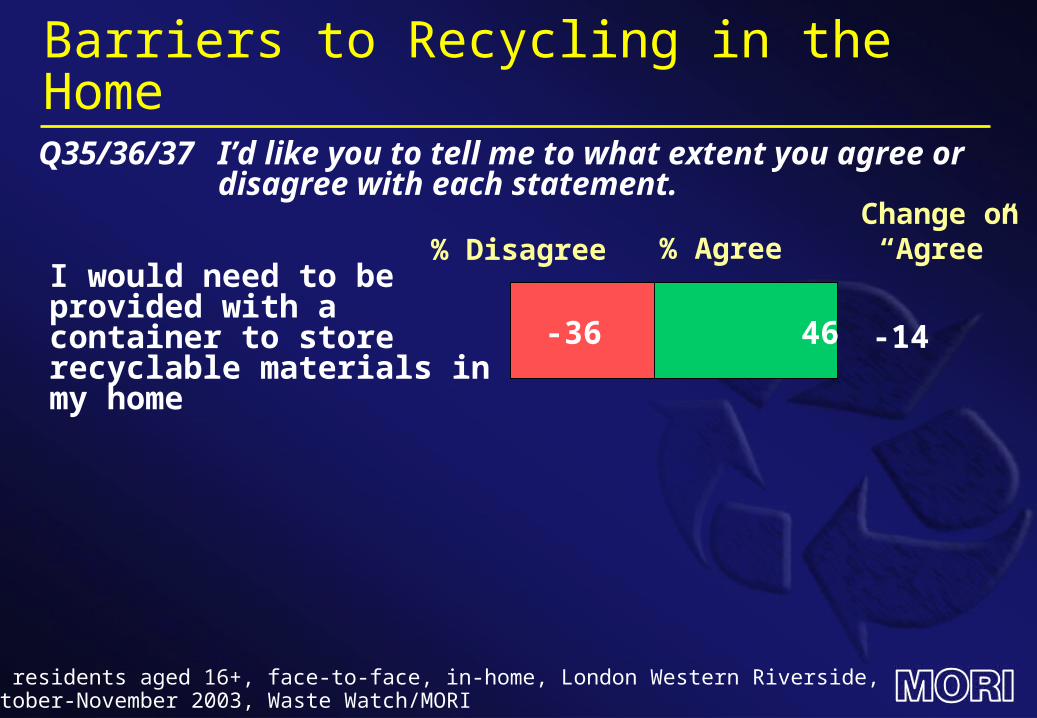
I would need to be provided with a container to store recyclable materials in my home
-14
Q35/36/37 I’d like you to tell me to what extent you agree or disagree with each statement.
Change on“Agree”
Base: 1, 314 residents aged 16+, face-to-face, in-home, London Western Riverside, October-November 2003, Waste Watch/MORI

-36
-46
46
42
Barriers to Recycling in the Home
% Agree% Disagree
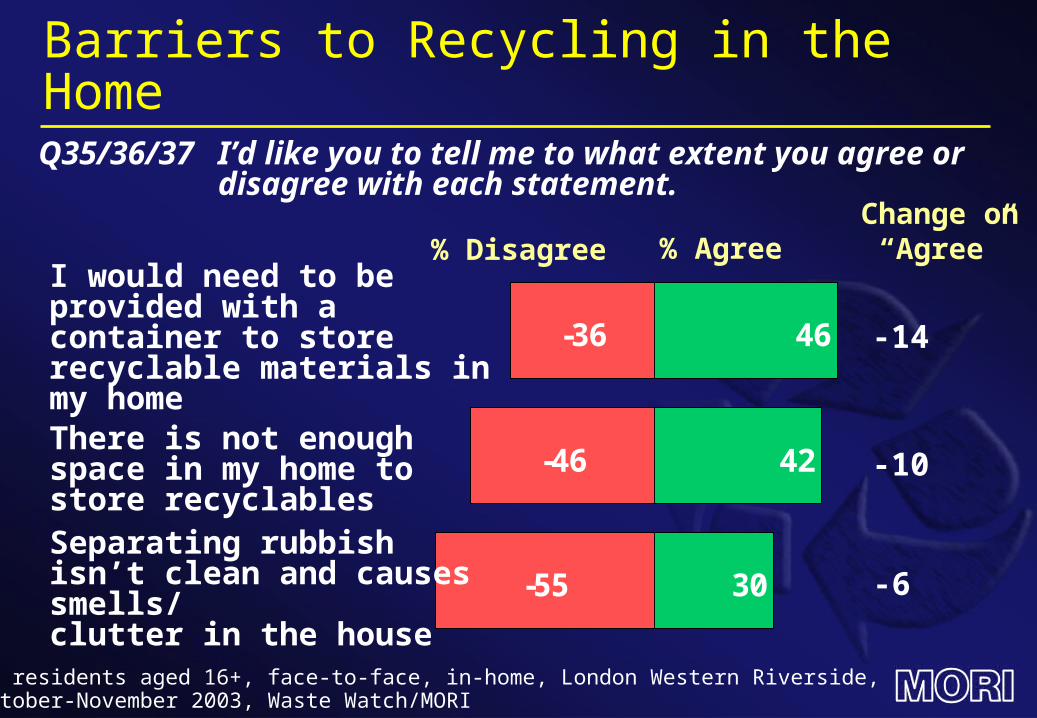
I would need to be provided with a container to store recyclable materials in my home
-14
There is not enough space in my home to store recyclables
-10
Q35/36/37 I’d like you to tell me to what extent you agree or disagree with each statement.
Change on“Agree”
Base: 1, 314 residents aged 16+, face-to-face, in-home, London Western Riverside, October-November 2003, Waste Watch/MORI
-36
-46
-55
46
42
30
Barriers to Recycling in the Home
% Agree% Disagree
I would need to be provided with a container to store recyclable materials in my home
-14
There is not enough space in my home to store recyclables
-10
Separating rubbish isn’t clean and causes smells/ clutter in the house
-6
Q35/36/37 I’d like you to tell me to what extent you agree or disagree with each statement.
Change on“Agree”
Base: 1, 314 residents aged 16+, face-to-face, in-home, London Western Riverside, October-November 2003, Waste Watch/MORI
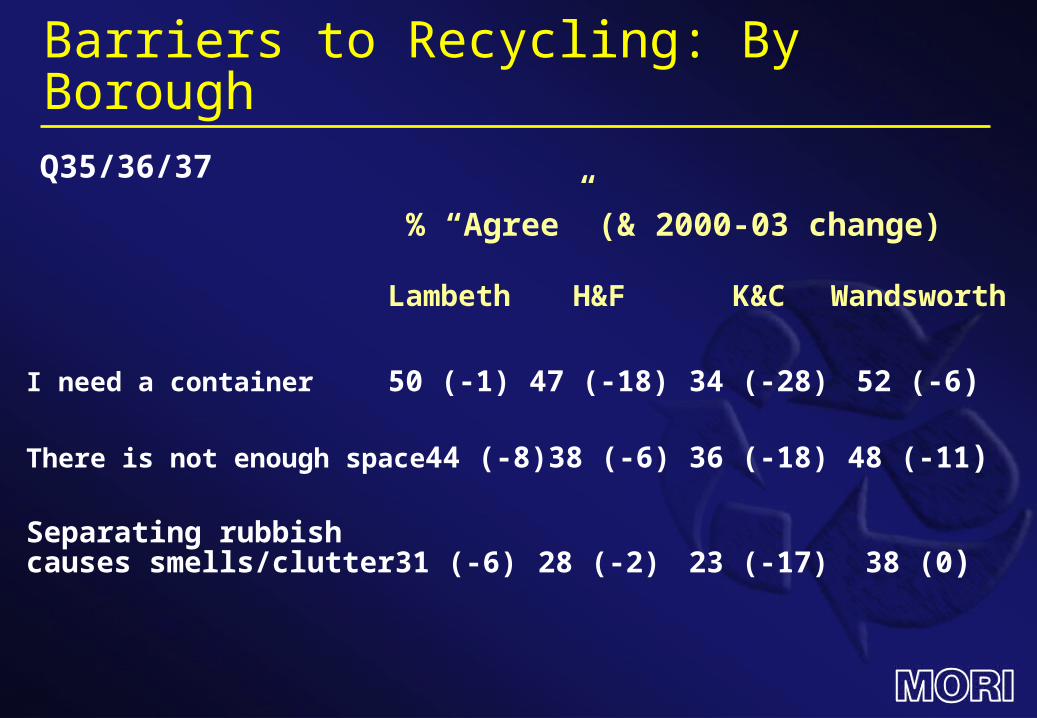
Barriers to Recycling: By BoroughQ35/36/37
Lambeth H&F K&C Wandsworth
I need a container 50 (-1) 47 (-18) 34 (-28) 52 (-6)
There is not enough space 44 (-8) 38 (-6) 36 (-18) 48 (-11)
Separating rubbish causes smells/clutter 31 (-6) 28 (-2) 23 (-17) 38 (0)
% “Agree” (& 2000-03 change)

-32
-32
-39
-45
-60
-58
64
65
57
52
33
34
Information Available on Recycling
% Informed% Not informed
What the benefits of recycling are +5
What materials can and cannot be recycled in your area +16
What recycling services are provided in the local area +16
What types of recycled products you can buy +12
What happens to materials after they are collected +14
Campaigns/promotions in the local area +16
Q8-13 How well informed would you say you are about each of the following?
Base: 1, 314 residents aged 16+, face-to-face, in-home, London Western Riverside, October-November 2003, Waste Watch/MORI
Change on“Informed”

Information Available on RecyclingQ21
Lambeth H&F K&C Wandsworth
Benefits of recycling 59 (+8) 76 (+17) 63 (-3) 62 (-2)
What can/can’t be recycled 59 (+12) 69 (+26) 61 (+4) 72 (+21)
Local recyclingservices 52 (+9) 64 (+32) 53 (+9) 60 (+17)
What recycling products can be bought 47 (+4) 56 (+21) 55 (+12) 49 (+13)
What happens after materials are recycled 31 (+14) 44 (+26) 31 (+8) 24 (+6)
Local campaigns/promotions 36 (+14) 39 (+26) 31 (+13) 32 (+13)
% “Informed” (& 2002-03 change)

-8
-12
-18
-17
-26
-29
89
88
75
74
63
66
48
42
-3
-3
Awareness of What Can be Recycled
% Can
Q15 To the best of your knowledge, which of the following things can and cannot be recycled in this area? % Can’t
Newspapers and magazines
Glass bottles and jars
Food and drink cans
Card/cardboard
Old clothes/shoes
Plastic bottles
Fruit juice/milk cartonsGarden and kitchen organic rubbish
-
+0
+8
+7
-2
+18
+10
+6
Change on“Informed”
Base: 1, 314 residents aged 16+, face-to-face, in-home, London Western Riverside, October-November 2003, Waste Watch/MORI

Recycling Behaviour
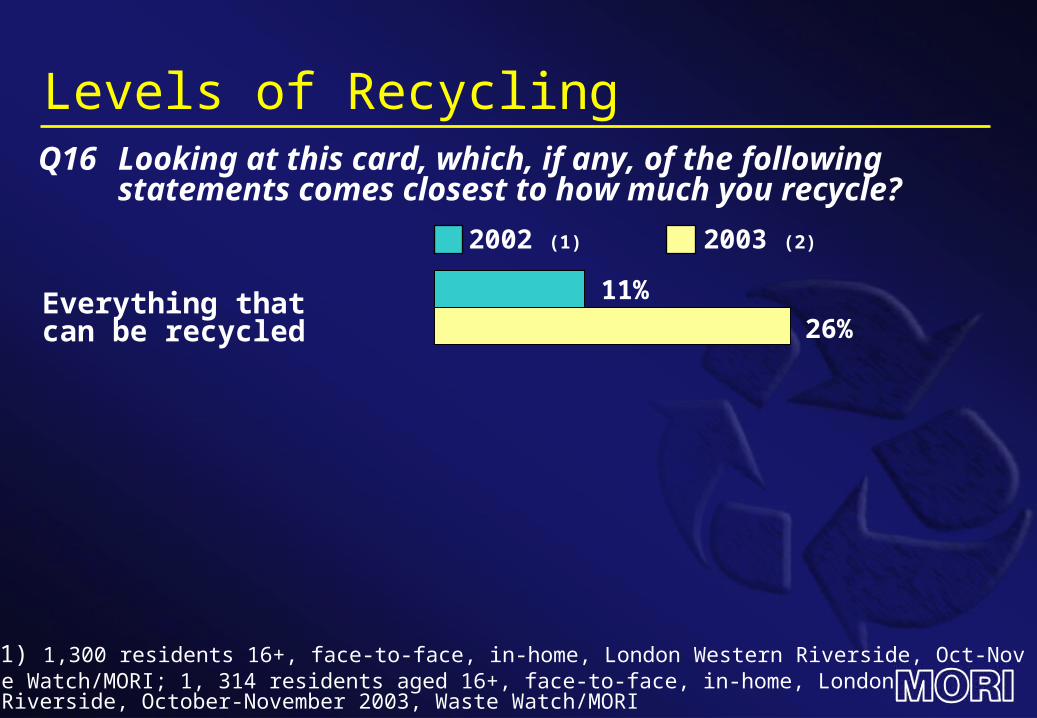
Levels of Recycling
Everything that can be recycled
2003 (2)2002 (1)
Q16 Looking at this card, which, if any, of the following statements comes closest to how much you recycle?
Base: (1) 1,300 residents 16+, face-to-face, in-home, London Western Riverside, Oct-Nov 2002,(2) Waste Watch/MORI; 1, 314 residents aged 16+, face-to-face, in-home, London Western Riverside, October-November 2003, Waste Watch/MORI
11%
26%

Levels of Recycling
A lot but not everything that can be recycled
Everything that can be recycled
2003 (2)2002 (1)
Q16 Looking at this card, which, if any, of the following statements comes closest to how much you recycle?
Base: (1) 1,300 residents 16+, face-to-face, in-home, London Western Riverside, Oct-Nov 2002,(2) Waste Watch/MORI; 1, 314 residents aged 16+, face-to-face, in-home, London Western Riverside, October-November 2003, Waste Watch/MORI
11%
30%
26%
35%

Levels of Recycling
A lot but not everything that can be recycled
Everything that can be recycled
I do not recycle much
2003 (2)2002 (1)
Q16 Looking at this card, which, if any, of the following statements comes closest to how much you recycle?
Base: (1) 1,300 residents 16+, face-to-face, in-home, London Western Riverside, Oct-Nov 2002,(2) Waste Watch/MORI; 1, 314 residents aged 16+, face-to-face, in-home, London Western Riverside, October-November 2003, Waste Watch/MORI
11%
30%
29%
26%
35%
24%

Levels of Recycling
A lot but not everything that can be recycled
Everything that can be recycled
I do not recycle much
I do not recycle anything
2003 (2)2002 (1)
Q16 Looking at this card, which, if any, of the following statements comes closest to how much you recycle?
Base: (1) 1,300 residents 16+, face-to-face, in-home, London Western Riverside, Oct-Nov 2002,(2) Waste Watch/MORI; 1, 314 residents aged 16+, face-to-face, in-home, London Western Riverside, October-November 2003, Waste Watch/MORI
11%
30%
29%
29%
26%
35%
24%
15%

Level of Recycling By Borough
% A lot% Everything
Lambeth
H&F
Wandsworth
Q16
K&C
24
31
19
30
31
37
31
41
% “I Recycle Everything/A lot” (& 2002-03 change)
=55% (+14)
=68% (+31)
=71% (+26)
=50% (+7)
Base: 1, 314 residents aged 16+, face-to-face, in-home, London Western Riverside, October-November 2003, Waste Watch/MORI

-6-7
-13-10
-4-2-1
-7-6
30
2930
2733
3232
20
3721
-6
Reported Change in Recycling Behaviour: Sub-Groups - 1
% “More”Q18
% “Less”
All
MenWomen
16-24
25-3435-5455-64
65+
Base: 1, 314 residents aged 16+, face-to-face, in-home, London Western Riverside, October-November 2003, Waste Watch/MORI
ABC1C2DE
+13
+14
+11
+9+16+13+19
+6
+16+10
2002-03 Change on “more” +%

-6-4
-2-4
-12
-7-7-6-5
30
3642
4242
11
1737
1549
-6
Reported Change in Recycling Behaviour:Sub-Groups - 2
% “More”Q18
% “Less”All
Access to kerbside*Access to Banks
High recyclersMedium recyclersLow recyclers
LambethH&F
Base: 1, 314 residents aged 16+, face-to-face, in-home, London Western Riverside, October-November 2003, Waste Watch/MORI
K&CWandsworth(* = Those not living in high/medium rise flats)
+13
+18
+17
+11+11+4
+1+24-6+30
2002-03 Change on “more” +%

Reasons for Increasing Amount of Recycling
Top 5 reasons
More awareness/hear more about it
Base: All who recycle more (414), October-November 2003, Waste Watch/MORI
Q19
11%
13%
15%
37%
6%
Why do you say you recycle more than a year ago?
+4
+27
n/a
More facilities available now
Offered a better collection service
Bigger range can be recycled
Change ±
Been given bins/bags for recycling
-12
-6

58%57%
54%53%
44%41%
38%36%35%35%
24%21%
18%14%
Recycling of Specific Materials
Magazine/brochure
Q17 How often, if at all, do you recycle . . .
Glass jars
Drink cans
Plastic bottles
Base: 1, 314 residents aged 16+, face-to-face, in-home, London Western Riverside, October-November 2003, Waste Watch/MORI
Newspaper/Paper
Glass bottles
Card/cardboard
Food tins
Carrier bagsOld clothes/shoes
Kitchen foilGarden organic rubbishFruit juice/milk cartons
Kitchen organic rubbish
% “Every/most times” (+2002-03 change)(+10)(+12)(+11)(+13)(+15)(+19)(+17)(+23)
(+9)(-2)
(+8)(+12)
(+4)
(+12)

Recycling of Specific Materials – By BoroughQ27
K & C Lambeth
Newspaper/Paper 43 (-6) 51 (+5)
Magazine/Brochure 47 (-1) 46 (+3)
Glass Bottles 47 (+3) 45 (+3)
Glass Jars 45 (+3) 46 (+7)
Card/Cardboard 40 (- ) 21 (+6)
Drinks Cans 33 (+8) 32 (+9)
Food Tins 32 (+7) 33 (+12)
Plastic Bottles 39 (+4) 14 (+6)
Carrier Bags 37 (+5) 29 (+6)
Old Clothes/Shoes 24 (-18) 33 (-1)
Fruit Juice/Milk Cartons 23 (0) 12 (+7)
Garden/Organic Rubbish 10 (0) 21 (+9)
Kitchen Foil 18 (+8) 15 (+9)
Kitchen Organic Rubbish 9 (+3) 16 (+4)
% “Every/Most Times” (& 2002-03 change)

Recycling of Specific Materials – By BoroughQ17
H & F Wandsworth
Newspaper/Paper 67 (+22) 71 (+19)
Magazine/Brochure 65 (+22) 70 (+22)
Glass Bottles 61 (+19) 66 (+19)
Glass Jars 54 (+17) 64 (+22)
Card/Cardboard 54 (+28) 63 (+22)
Drinks Cans 45 (+30) 52 (+29)
Food Tins 40 (+27) 46 (+22)
Plastic Bottles 44 (+38) 50 (+40)
Carrier Bags 34 (+9) 40 (+17)
Old Clothes/Shoes 37 (+1) 44 (+6)
Fruit Juice/Milk Cartons 33 (+25) 32 (+19)
Garden/Organic Rubbish 25 (+9) 25 (+12)
Kitchen Foil 23 (+19) 15 (+8)
Kitchen Organic Rubbish 15 (+7) 16 (+4)
% “Every/Most Times” (& 2002-03 change)

Junk Mail StickersQ25 As you may know, some people in the area now have
stickers on or near their front door, saying that they do not wish to receive junk mail. Could you tell me which of these apply to you in regard to these stickers?
6%
28%
13%
45%
5%
3%
I have never seen/heard of them
Don’t know I have one, found it is effective
I have one, but found it is not very effective
I have seen/heard, and would like one
Have seen/heard, but do not want one
Base: 1, 314 residents aged 16+, face-to-face, in-home, London Western Riverside, October-November 2003, Waste Watch/MORI
9% have one

“Green Consumerism”
10
7
8
20
43
51
52
25
42
40
49
55
7 44
47
% most/some times% always% rarely/never
Base: All who use each material, 16+, face-to-face, in-home, London WesternRiverside, October-November 2002, Waste Watch/MORI
Q24 How often, if at all, do you do any of the following? If you don’t use an item, please tell me. 2002-03
Change on “always” ±
Purchase “Bags for Life” +3
+1
+1
-3 +15
- Lambeth- H&F- K&C- Wandsworth
6
5
2
10
23
24
28
9
71
70
61
81
8 31
71Use the Mailing Pref. Service
- Lambeth- H&F- K&C- Wandsworth
0
+1
-5
-1
+3
Campaigns & Communications

-32
-38
-53
57
51
34
Information required by residents
% Agree
Q32/29/27 I’d like you to tell me to what extent you agree or disagree with each statement.
I need to know more about the benefits of recycling
% Disagree Change on “Agree”
-11
-4
-13
I need more information on what can and can’t be recycled
I don’t know what recycling facilities are on offer in the area
Base: 1, 314 residents aged 16+, face-to-face, in-home, London Western Riverside, October-November 2003, Waste Watch/MORI

Exposure to Promotional Activity -1Q39/40 Which of these, if any, do you remember seeing/
hearing about over the last year?
2%3%
17%
9%
8%
6%
5%
3%
24%
16%
14%
10%
9%
5%
Personally + Seen/heard aboutPersonally
Leaflets/info through the door
People knocking on door, explaining benefits of recyclingStands providing info about recycling at events
Local newspaper adverts/articles
TV coverage
Local posters/billboards
Recycling promotion in council magazine / newsletters
Base: 1, 314 residents aged 16+, face-to-face, in-home, London Western Riverside, October-November 2003, Waste Watch/MORI

Exposure to Promotional Activity -2Q39/40 Firstly, which of these, if any, do you remember
seeing/ hearing about over the last year?Personally + Seen/heard aboutPersonally
Radio coverage
Activities in local schools
Promotion of recycling on web sites/ the internet
None of these
‘The Giant Motorised Dustbin’
Giving talks to local groups
2%
1%
1%
1%
1%
66%
3%
2%
2%
1%
1%
55%
Base: 1, 314 residents aged 16+, face-to-face, in-home, London Western Riverside, October-November 2003, Waste Watch/MORI

Exposure to Promotional Activity: Sub Groups - 1
% Seen Any % Seen/Heard About AnyPromotions Promotions
High Recyclers 40 55Medium Recyclers 35 50Low Recyclers 28 33
Access to Kerbside* 37 52
Recycling More than 1 yr ago 44 64Recycling Same as 1 yr ago 26 40Recycling Less than 1 yr ago 17 38
Lambeth 25 46H&F 29 42K&C 22 37Wandsworth 42 53
(*Those not living in high/medium rise flats)

Exposure to Promotional Activity: Sub Groups - 2
% Seen Any % Seen/Heard About AnyPromotions Promotions
All 29 45
Men 31 45Women 29 45
16-24 21 3825-34 28 4635-54 32 4755-64 29 4565+ 33 44
ABC1 34 50C2DE 25 39
Base: 1, 314 residents aged 16+, face-to-face, in-home, London Western Riverside, October-November 2003, Waste Watch/MORI
18%
11%
9%
8%
7%
7%
3%
3%
3%
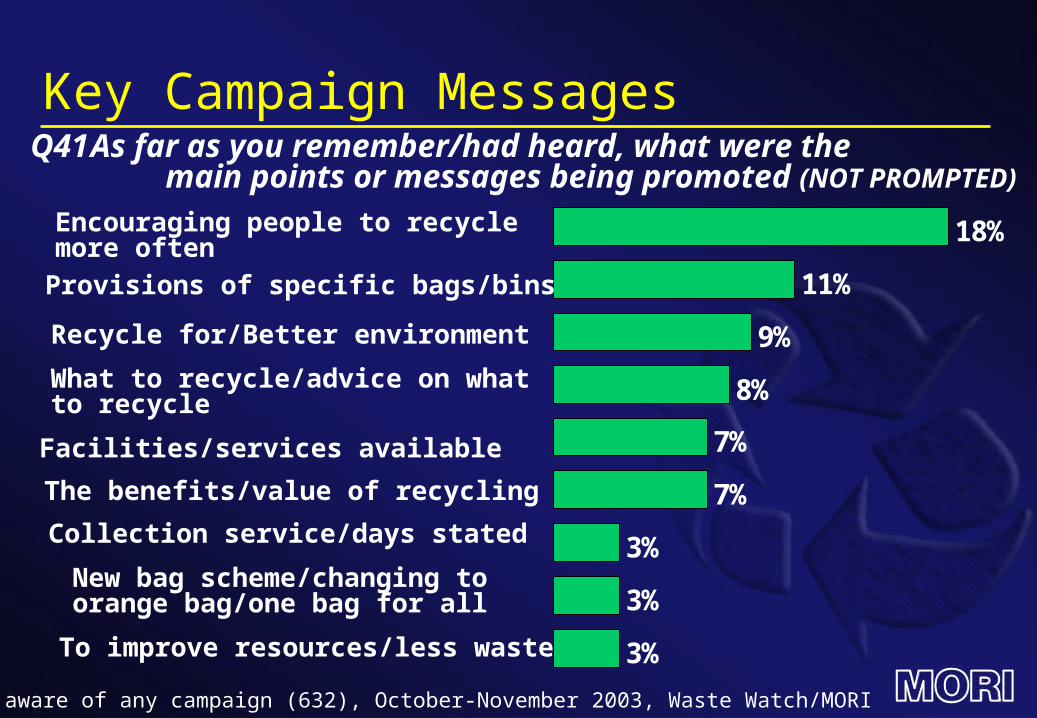
Key Campaign Messages Q41 As far as you remember/had heard, what were the
main points or messages being promoted (NOT PROMPTED)
Encouraging people to recycle more often
Provisions of specific bags/bins
Recycle for/Better environment
What to recycle/advice on what to recycle
Facilities/services available
The benefits/value of recycling
Collection service/days stated
New bag scheme/changing to orange bag/one bag for all
To improve resources/less waste
Base: All aware of any campaign (632), October-November 2003, Waste Watch/MORI

Key Campaign Messages – Collection Sacks/Bins (By Borough)
Q41
Lambeth H&F K&C Wandsworth% % % %
Provision of specificbags/bins for recycled materials/Smart Sacks/ 3 13 7 19 Orange sacks
New bag scheme/changing from separateto orange bag scheme/ 1 3 0 6one bag for everything
Base: All aware of any campaign (632), October-November 2003, Waste Watch/MORI
0
0
55
34
16
-1
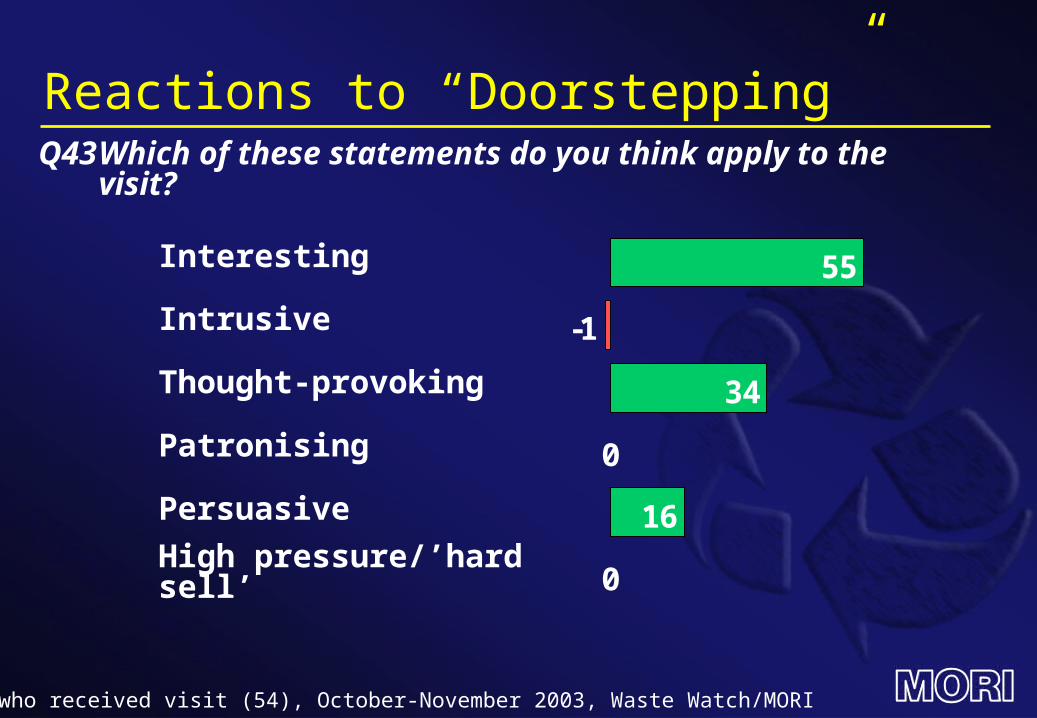
Reactions to “Doorstepping”Q43 Which of these statements do you think apply to the
visit?
Interesting
Intrusive
High pressure/’hard sell’
Thought-provoking
Patronising
Persuasive
Base: All who received visit (54), October-November 2003, Waste Watch/MORI

“Chatter Factor”Q42 How many people, if any, have you talked to about
recycling/waste issues this year?
7%
15%
25%
37%
6% 9%
None/nobody
Don’t know/not stated 11 or more
6 to 10
3 to 5
1 to 2
Base: 1, 314 residents aged 16+, face-to-face, in-home, London Western Riverside, October-November 2003, Waste Watch/MORI
57% have spoken to someone

Thank [email protected]