london olympic games 2012 belgian track cycling evaluation wiggins
TRANSCRIPT

London Olympic Games 2012 Belgian track cycling Evaluation
4.02.317 BR WK Melbourne 4.04.056 OG London 2012
The athletes started their preparations for the Olympic
games at an altitude training camp in Spain in September
2011. It is proven that from these aerobic gains that it was
beneficial for the team to further their training intensities
at frequent intervals at altitude up until the Olympic
games. The aerobic base proved both in tests and in the
race itself to be a success with the team splitting
consistently 3km each at 59seconds throughout the race .
Why then was the time off pace from the targets set to try
and break the four minutes?
•Why did the team go out too slow?
•Why did the pace not get picked up from Cornu in 4th
position?
•Why did Cornu not ride 2laps ?
•Why did De Ketele stay on a full lap when the coach asked
him to do half a lap?
The following report is important to see that the gear was
influential in trying to achieve 3.59. Without this correct
gear the team would falter due to too high revolutions, too
high heart rates and not targeting the correct power
delivery. Crucially the team needs to be launched into its
efforts at the right speeds during the opening km to stand
any chance of achieving the target.
The comparison between
April and August , a
confirmation that the
athletes were in
condition and ready to go
under the magic four
minute barrier. What
exactly went wrong and
why the team effort was
dictated by a slow start.
Jon Wiggins top sport trainer WBV

2012
OLY
MP
IC Y
EAR
WB 3 Peking/Beijing WB3 De Ketele 1.07.617 na na na na
jan/12
10e 4.10.462 De Pauw na na na na 360 380 378
DePoortere 460/126 660 732 1096 380 410 420
Schets na na na na Gelost
WB 4 London WB4 Cornu 54x14 1.06.532 524/ 599 708/647 1153
feb/12
4e Heats De Ketele 53x14 na na na na
4.06.596 BR Van HoeckeG 53x14 453/ 626.7 709/647 1072
Dufrasne 53x14 na na na na Gelost
London WB4 De Ketele 53x14 1.04.572 na na na na
4e Final Final Dufrasne 54x14 na na na na
4.04.956 BR De Poortere 54x14 452 614 764/694 1026 362 Gelost
Cornu 54x14
525/123/54x14
657 757/711 1182
WK Melbourne WK 2012 De Ketele 53x14 1.04.025 464/128 541 573 1202 apr/12 Gelost
6e 4.02.317 BR Van Hoecke 53x14 467/127 555 /657605 1150
Cornu 54x14 509/127 676 829/694 800
Dufrasne 50x13 na na na na
EK Portugal U23 EK Van Hoecke G na na na na jul/12
3e 4.09.609 De Pauw Moreno na na na na
De Buyst J na na na na 337 346 410
Cornet na na na na Gelost
EK Portugal U23 EK Van Hoecke G na na na na
Final 4.08.612 De Pauw Moreno na na na na
Bronze De Buyst J na na na na
Cornet na na na na Gelost
OG London OG 2012 De Ketele 50x13 1.05.461 410/126 579 634 1156 aug/12 362 320 380
9e 4.04.056 Van Hoecke 50x13 520/121 580 720 1182 370 389 420
Dufrasne 50x13 na na na na 368 380 398
Cornu 51x13 523/122 613 754 1165 380 410 460
Belgian Olympic team pursuit - designing the team pursuit profile (Jon Wiggins TS trainer WBV)
Jaar Event Venue Athlete start WIA 4km Wiav.kop Pw/avkop start W Jaar PIANS ERGO test VWEM
PIANS steptest VWEM
training camp watts ians
Comment
400
450
500
550
600
650
700
750
4 4,02 4,04 4,06 4,08 4,1 4,12 4,14 4,16 4,18 4,2 4,22 4,24
"Cornu4.04"
"De Ketele4.04"
"""Schets4.11"""
"De Poortere4.04"
"Dufrasne 4,04"
"VanHoecke G 4.06"
"De Pauw 4.06"
"Van HoeckeG4,07"
"Cornu 4,02"
These chart simplify the statistics and importantly pin-point the athletes that are meeting the world class potential
team pursuit profile. Av. 1epos.
Jon Wiggins team pursuit profile indicator - aiding the selection criteria to determine the best four team pursuiiters 1. WIA Watts individual average 4km 2. Wiav Watts individual average lead 3. PIANS Power individual anaerobic swell 4. Start watts 5. Ergo test VWEM SRM and specific towards pursuiters 6. Steptest - a vital test to determine individual track training zones and to establish the individual profile for gearing/watts and cadence. 7. Training ians power ratio - athletes that show potential and have the capacity in training but don't yet realize it in competition. 8. Comments: complete or dropped - important to see if the team completed the 4km with 4 riders or who was dropped.
Jon Wiggins top sport trainer WBV

Steptest evolutie
Bestetijd ranking 06.11.03 06.12.21 07.10.01 07.10.15 07.12.21 08.03.16 08.08.19 09.03.14 10.03.12 10.10.15
11.03.03 11.11.21 4.07.2012
Jongens Athlete Best time
1 Cornu 2.15.0 2.07.13 2.05.35 2.07..68 bestetijd
2 De Poortere 2.21.0 2.11.91 2.08.00
2.10.20 2.18.1 2.18 2.11.13 gewonestuur
3 Mertens 2.12.65 2.11.22 2.11.37 2.13.17 2.09.01 2.08.02 RECORD
4 Dufrasne 2.19.42 2.11.35 2.12.60 2.10.6 2.09.81 2.05.72
5 Vlasselaer 2.14.36
6 De Ketele 2.23.25 2.11.22 2.11.16 2.09.03 2.09.17 2.14.56 2.16.0 2.04.15
7 Tuytens 2.24.09
8 Steels 2.13.21 2.13.68
9 Roesems 2.14.53
10 Lepla 2.14.96 2.13.10 2.14.8
11 Schets 2.16.27 2.15.06
12 Van Hoecke G
2.12.60 2.06.77 2.09.19
13 De Pauw 2.19.50 2.09.45
14 Breyne 2.12.70
15 Van Hoecke J
16 Cocquyt 2.11.3
17 De Buyst Juli 2.10.25 2.11.75
Gewoonstuur
18 Keisse 2.19.07
Dames bestetijd
07.06.01 07.06.02 07.06.30 07.07.17 08.03.03 08.03.13 08.06.05 09.03.14 10.03.04
10.10.15 11.03.03 11.08.17 11.09.29 gewonestuur
Bestetijd
ranking Athlete
RECORD
1 D'hoore 1.46.89 1.44.60 1.47.2 1.43.10
2 Daams 1.49.11 1.48.50 1.47.85 1.53.36
3 Druyts 1.48.21 1.50.75 1.51.0
4 Polspoel 1.49.02 1.47.2
5 Belmans 1.48.0 1.46.43
6 Crocket 1.55.16
7 Miriam 2.09.70
8 Vinck 2.00.80
The steptest proved again to be crucial in confirming the condition and also importantly showing the progression made in both the aerobic and anaerobic energy systems
Jon Wiggins top sport trainer WBV

Training evaluation and confirmation
Jon Wiggins top sport trainer WBV
Anaerobic work was detrimental in realising the top end speed and this file shows that the athletes built always correctly into their training sessions with a routined warm up using 2 to 3 5km building through 5.20 on 10’minutes

Standing 3km race pace
Jon Wiggins top sport trainer WBV
During the last preparation training camps and running into the last few days of the taper, standing start race pace simulations were key to confirm that the gearing was good and that freshness was coming into the athletes which means speed and full faster recovery. The signs were excellent and the boys felt very good.
Here is the predicted pacing Standing 3km for 3.58 which was realistic. Opening 1.04 – 2.02 – 2.59 – 3.58
Realised pacing 1.04 – 2.01 – 2.59
Note how the tempo is maintained and power delivery is correct.
Time 03:58,0
Avg Lap 00:14,5
RPM 123,63
15 00:20,5
14 00:35,0
13 00:49,5
12 01:04,0
11 01:18,5
10 01:33,0
9 01:47,5
8 02:02,0
7 02:16,5
6 02:31,0
5 02:45,5
4 03:00,0
3 03:14,5
2 03:29,0
1 03:43,5
03:58,0

Last block on front from standing 3km. Showing good pace on 2.59 schedule
Jon Wiggins top sport trainer WBV
The gearing here is 100% correct. Any smaller there would be problems with cardio-vascular intensity in the drafting/wheel recovery.

Race day, morning effort. Again a very good correct example of the warm up. Then the preparation interval demonstrates an excellent form.
Jon Wiggins top sport trainer WBV

Race pace check morning more than 5hours before the start
Jon Wiggins top sport trainer WBV
Super, on track to realise target.

Race DC
Jon Wiggins top sport trainer WBV
Race KDK
Training standing 3km
Note the poor start which leads into a very bad transition of power delivery thorugh out the team . 130rpm in training same gear same simulation, 125rpm in race and 89watts different power output which is massive.
Also Kenny starts in simulation with 1200watts and only pushes 1150watts in the race which is lesser than Cornu and Cornu is 4th man. No wonder that the whole team were back pedalling
1.04.572 London world cup opening km 1.04.025 Melbourne opening km 1.04.1 London standing 3km training 1.05.461 London Olympics opening km
Note however in the film that the coach says “goed zo” as the renners come through the first km! Also the coach shouts for De Ketele to ride half alap after 3km but he does a full lap!
In the film also big fault in the finish. Way to early up and not racing for the line.

The gearing decision
Ring 53 Ring 50
Cog 14 Cog 13
Gear 102,21429 Gear 103,84615
Distance 321,11565 Distance 326,24231
0,59 124,65 122,69
0,57 128,73 126,71
Jon Wiggins top sport trainer WBV
Time 03:58,0
Avg Lap 00:14,5
RPM 123,63
15 00:20,5
14 00:35,0
13 00:49,5
12 01:04,0
11 01:18,5
10 01:33,0
9 01:47,5
8 02:02,0
7 02:16,5
6 02:31,0
5 02:45,5
4 03:00,0
3 03:14,5
2 03:29,0
1 03:43,5
03:58,0
The gearing decisions were dominated by both the feedback from the athletes as the proof on the srm files that the current form that the boys had was realisitic in realsiing their goals. Any smaller would have meant riding for 4.03 or 4.02 which of course with hind sight would have been enough to confirm their time of the world championships. However the athletes were better physically prepared for ther Games than the world championships proving in training tests both individually and as a team.
This failure in performance has to be strongly linked to mentalitity and scared to fail in front of a world wide audience. In the world championships in Melbourne Kenny De Ketele also started but their ambition proved to be greater than here at the Olympics. Kenny was dropped after 3km in Melbourne and obviously in London didnt want to start as quick risking what he would see as humiliation.

Gijs Van Hoecke
• Flying lap Split 13th TimesRankTimeStart –
• 50m 15th 2.71 • 250m - 150m12th 5.408 • 150m - 250m14th 5.513
• 250m 13.633
• Points race 9th 1lap gained – 3points on 6th classification
• Elimination 18th • 4km IP Split TimesRankTimeStart – 4:29.992 best Omnium time
• 1000m 8th 1:10.797 • 1000m - 2000m13th 1:06.527 • 2000m - 3000m13th 1:06.756 • 3000m - 4000m9th 1:05.912
• Scratch 15th -1lap • Km 1.04.748 12th
Jon Wiggins top sport trainer WBV
Omnium

Confirmation of good condition from Van Hoecke
Jon Wiggins top sport trainer WBV
Points race
Again wasting energy at the end. An effort that changed nothing.

Elimination
Jon Wiggins top sport trainer WBV
Here we see a problem area towards mentallity and arrogance. Starting at the back there was no indication in the video or files here that Gijs tried to move up. The increase of cadence is only due to peleton speed increase. Normally with this gearing in the sprint Gijs can realise + 147rpm and +1000watts. He mentally literally eliminated his chances of performing at the Olympics.
Here he gives up in the home straight and does not pedal with force
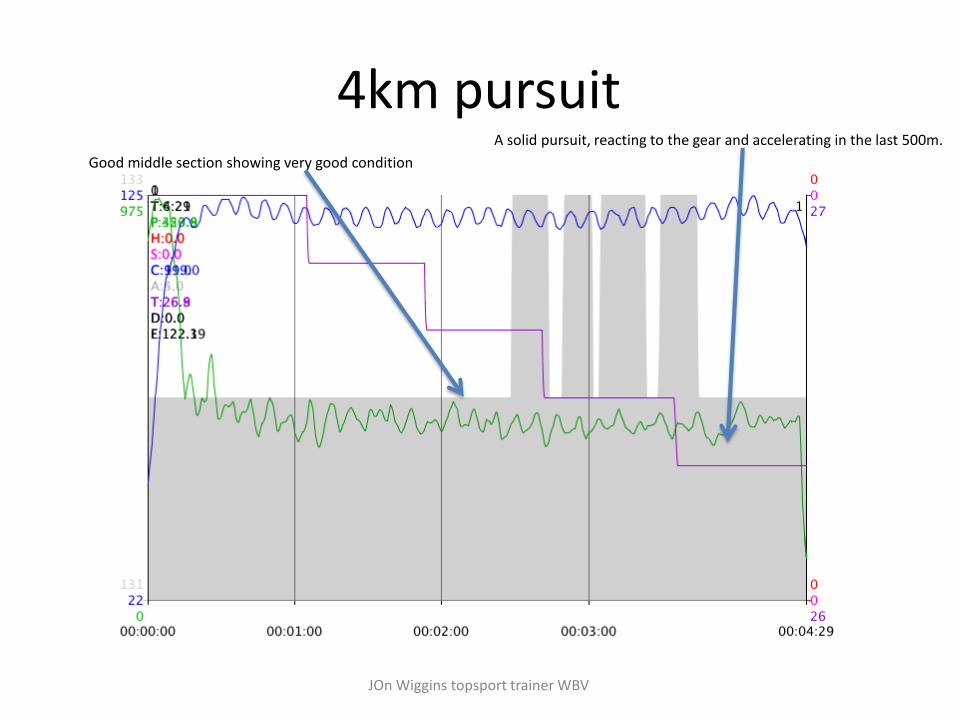
4km pursuit
JOn Wiggins topsport trainer WBV
A solid pursuit, reacting to the gear and accelerating in the last 500m.
Good middle section showing very good condition

Scratch
JOn Wiggins topsport trainer WBV

km
Jon Wiggins top sport trainer WBV
Time loss in poor transition, again focus is not right

Jolien D’Hoore 5th place
Jon Wiggins top sport trainer WBV
• Flying lap Split 10th Split TimesRankTimeStart
• - 50m 92.85 • 150m - 150m9th 5.796 • 150m - 250m10th 5.947 • 250m 14.594
• Points race 4th 1lap gained – 5points on 3rd classification
• Elimination 6th • 4km IP 8th Split TimesRankTimeStart –
• 1000m10th 1:15.236 • 1000m - 2000m8th 1:12.745 • 2000m - 3000m8th 1:13.514 • 3000m 3:41.495 new BR
• Scratch 5th • Km 12th Split TimesRankTimeStart –
• 250m10th 21.016 • 250m - 500m13th 15.569 • 500m 36.585
Omnium

Top conditie
Jon Wiggins top sport trainer WBV
1. Mentally stronger, linked up here to Nexus at altitude
2. Physically stronger 3. Faster 4. Better aerobic capacity and power 5. Better anaerobic adaptations 6. Massive response aerobically to
altitude 7. Faster recovery from altitude
adaptation
Aerobic power and anaerobic power objectives realised enabling top speed . Perfect interval and fractions including strong broken sets

Flying lap
Jon Wiggins top sport trainer WBV
This is good an area that has been worked on alot, but the transition can still be better. Gearing was good an optimal for achieving a solid start.
Strong finish

Points race
Jon Wiggins top sport trainer WBV
One of the best points races ever from Jolien. Normally a weak point of her Omnium. Read the race well, used her energy efficiently which has not been the case in previous races. Lesser max peaks which is good to see. Gaining a lap proving mental strengths gained.

3km IP
Jon Wiggins top sport trainer WBV
Very strong even performance from Jolien

Test type
step test
Test values Leeftijd Lactate IAS Lactate IANS Vians kph Vians m/s Watts Ias Watts Ians w/kg IANS Peak lactate Peak av.watts last block av/rpm 7e Gearing Time
D'hoore Jolien
2007 17
2008 18 2,2 3,7 40.91 11,2 160 216 3,6 12.1 360 125 52x16+discs 1.54.04
2009 19 1,9 5,4 42.86 11,8 168 218 3,7 15.6 410 126 52x16+discs 1.48.79
2010/Maart 20 1,8 4,2 42.6 11.77 175 225 3,8 12.1 445 126 53x16+discs 1.46.8
2010/Oktober 20 1,8 4 42.84 11,9 182 228 4 14,6 460 124 51x15+discs 1.44.6
2011/Maart 21 1,8 4 43.9 12.2 188 238 3.7 10.8 498 121 51x15+discs 1.47.2
2011/September 21 1,9 4 44.6 12.4 190 246 3,9 7,7 490 125 51x15+discs 1.43.10
Jon Wiggins top sport trainer WBV
Evolutie conditie Jolien D’hoore