log world istics ncil bottlenecks - world energy council · logistics bottlenecks world energy...
TRANSCRIPT

LogBottWorld gistics
tleneckEnergy Cou
ks uncil

Officers of the World Energy Council
Pierre Gadonneix Chair
Francisco Barnés de Castro Vice Chair, North America
Norberto Franco de Medeiros Vice Chair, Latin America/Caribbean
Richard Drouin Vice Chair, Montréal Congress 2010
C.P. Jain Chair, Studies Committee
Younghoon David Kim Vice Chair, Asia Pacific & South Asia
Jorge Ferioli Chair, Programme Committee
Marie-José Nadeau Vice Chair, Communications & Outreach Committee
Abubakar Sambo Vice Chair, Africa
Johannes Teyssen Vice Chair, Europe
Abbas Ali Naqi Vice Chair, Special Responsibility for Middle East & Gulf States
Graham Ward, CBE Vice Chair, Finance
Zhang Guobao Vice Chair, Asia
Christoph Frei Secretary General
Logistics Bottlenecks World Energy Council
Copyright © 2010 World Energy Council
All rights reserved. All or part of this publication may be used or reproduced as long as the following citation is included on each copy or transmission: ‘Used by permission of the World Energy Council, London, www.worldenergy.org’
Published 2010 by:
World Energy Council Regency House 1-4 Warwick Street London W1B 5LT United Kingdom
ISBN: 978-0-946121-12-0
Logistics Bottlenecks

Logistics Bottlenecks World Energy Council
1
Content 1
Executive Summary 2
Introduction 3
1 Energy capabilities and requirements in the mid- and long-term 4
1.1 Coal 5 1.2 Oil 5 1.3 Natural gas and liquefied natural gas (LNG) 6 1.4 Uranium 6 1.5 Biomass and biogas 7 1.6 Electricity 7
2 Energy trade: closing the gaps between requirements and capabilities 9
2.1 Coal 9 2.2 Oil 11 2.3 Natural gas and liquefied natural gas (LNG) 11
3 Largest logistics bottlenecks across the energy supply chain and energy carriers 13
3.1 Bottlenecks across the supply chain steps related to energy sources 13 3.2 Bottlenecks across the supply chain steps related to energy carriers 14 3.3 Crude oil transportation 14 3.3.1 Major bottlenecks 14 3.3.2 Necessary capacities 15 3.4 Gas transportation 18 3.4.1 Major bottlenecks 18 3.4.2 Necessary capacities 19 3.5 Electricity systems 21 3.5.1 Major bottlenecks 22 3.5.2 Necessary capacities 22
4 Infrastructure investments required to manage key logistics bottlenecks 24
4.1 Necessary investments in oil transportation 24 4.1.1 Relevant price benchmarks 24 4.1.2 Evaluation of investments required in the 2008–2020 time frame 25 4.1.3 Evaluation of investments required in the 2020–2050 time frame 25 4.2 Necessary investments in gas transportation 26 4.2.1 Relevant price benchmarks 26 4.2.2 Evaluation of investments required in the 2008–2020 time frame 27 4.2.3 Evaluation of investments required in the 2020–2050 time frame 27 4.3 Necessary investments in efficient electricity systems 28 4.3.1 Relevant price benchmarks 28 4.3.2 Evaluation of investments required in the 2008–2020 time frame 30 4.3.3 Evaluation of investments required in the 2020–2050 time frame 30
5 Necessary policies 31
5.1 Necessary policies in oil transportation 31 5.2 Necessary policies in gas transportation 31 5.3 Necessary policies in electricity transportation 32 References 34
Study Group Membership 35
Appendix 1. Conversion rates used in the study 36
Appendix 2. Matrix of logistics bottlenecks 37 Appendix 3. Oil refining 41
Contents

Logistics Bottlenecks World Energy Council
2
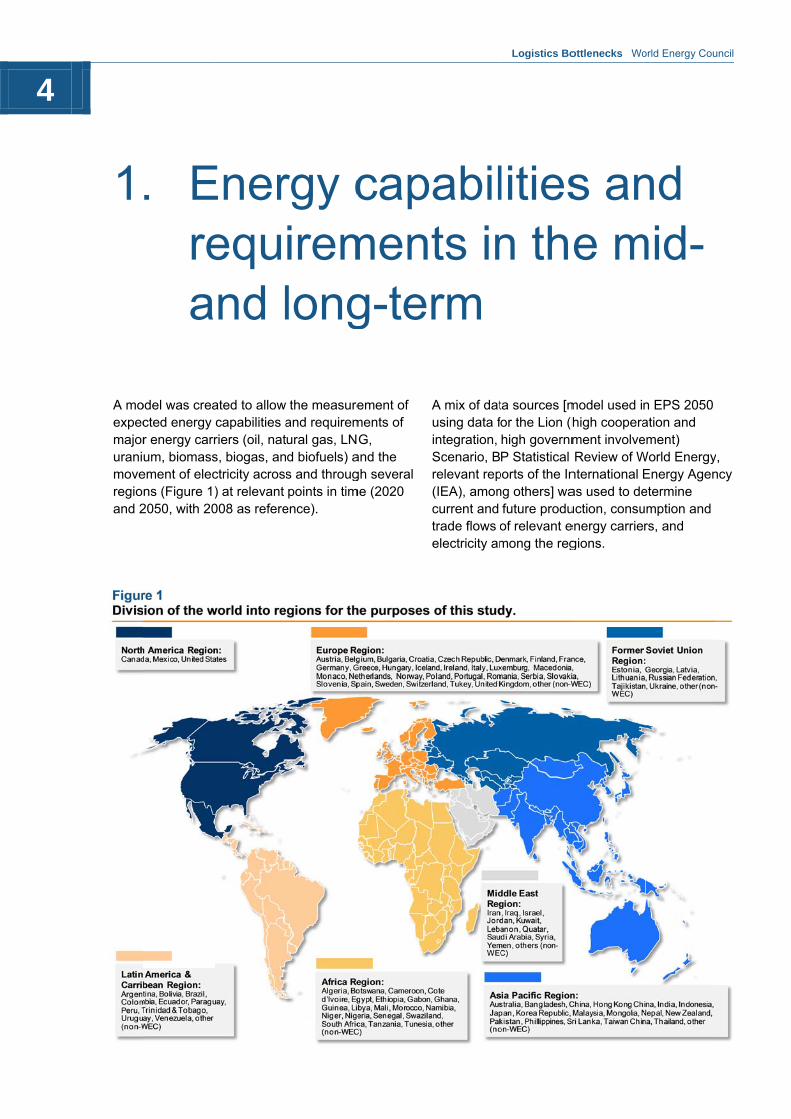
Many of the vulnerabilities to Energy Access, Energy Security, and Environmental Sustainability result from impediments to reaching a global demand–supply balance, as well as local balances, for various energy sources and carriers. Vulnerabilities result from multiple reasons: regional imbalances of energy production and consumption, the bulky character of the majority of energy fuels, the virtual necessity of electricity consumption following its production, among others.
To detect and prioritize respective “bottlenecks” across energy carriers, they have to be measured. In this report, production, consumption, exports, and imports were measured across all major energy carriers for seven key regions of the world for three time frames—2008, 2020, and 2050. Imbalances between production and consumption form bottlenecks in each region.
From the logistics point of view, the most important types of fuel are those biggest volumes that must be transported over large distances. If fuels are ranked on that criterion, the winners are coal, oil, and gas. Although people are slowly turning to alternative energy sources—such as biofuels and nuclear energy—even in 2050, those three fuels in terms of total volume will dominate without question.
Another challenge is electricity transportation. Electricity must be consumed at its source or sent along a transmission-and-distribution network right after its production, as storage is inefficient. To make things more complicated, transmission itself is inefficient over long distances, necessitating production facilities close to end-users.
To better identify and assess possible logistics bottlenecks, a Logistics Bottlenecks Matrix was constructed, showing major bottlenecks across the energy value chain on one axis (from the manufacturing of equipment through mining and extraction to transportation and consumption) and types of fuels/electricity on the other axis.
Having prioritized energy sources and their imbalances, as well as having outlined major sources of possible imbalances, three crucial bottlenecks were identified—oil movement, natural gas and liquefied natural gas (LNG) movement, and electricity movement. Should they not be managed in 2020 and 2050 (i.e., if required energy sources and carriers are not delivered from producers to consumers), enormous damage will be done to the global economy, the full extent of which is currently immeasurable.
To manage expected key bottlenecks, significant infrastructure investments need to be made. To develop the required oil pipeline and tanker networks, gas pipelines and LNG carriers systems, as well as smart grids boosting the efficiency of electricity distribution, a total amount of about USD 900 billion will have to be spent in the 2008–2050 time frame, signifying average annual outlays of USD 21.4 billion.
Moreover, required policies and concrete actions for world leaders are described. These actions will allow for timely investments in the respective infrastructures and build bridges between the private and public sectors in various regions, so that the money which needs to be spent is spent effectively, generating desired results for companies, governments, and society.
Executive Summary

Logistics Bottlenecks World Energy Council
3
The Deciding the Future: Energy Policy Scenarios to 2050 study (EPS), published by the World Energy Council in 2007, indicated a number of impediments and threats to achieving access, security, and environmental sustainability of energy around the globe. Many of those threats, or vulnerabilities, which need to be overcome by the joint efforts of policymakers, companies, and societies, involve the movement of energy.
Logistics vulnerabilities are inherent to the world of energy and result for multiple reasons:
Regional imbalances of energy production and consumption (e.g., Europe consumes much more oil than it produces);
Low-energy density of the majority of fuels (GJ per kilogram), stressing modes of transportation (pipelines, mega-tankers, LNG carriers, etc.);
The virtual necessity of immediate electricity consumption due to inefficient and costly technologies for storing electricity;
Electricity transmission is inefficient over long distances.
Worth examining are the numerous points of contact between logistics bottlenecks and manufacturing bottlenecks. In fact, the energy supply chain along starts with the manufacturing of energy equipment and energy-related facilities, such as power plants
Introduction
4
A moexpecmajoruranimoveregioand 2
1
odel was creacted energy r energy carrum, biomass
ement of elecns (Figure 12050, with 20
. Erea
ated to allowcapabilities ariers (oil, nats, biogas, anctricity across) at relevant 008 as refere
Enereqund l
the measureand requiremural gas, LNd biofuels) as and througpoints in tim
ence).
rgy ciremlong
ement of ments of G,
and the gh several
me (2020
capmeng-te
A mix of datusing data fintegration, Scenario, Brelevant rep(IEA), amoncurrent and trade flows oelectricity am
pabilts inrm
Logistics Bo
ta sources [mfor the Lion (hhigh governmP Statistical
ports of the Inng others] wa
future produof relevant emong the reg
litiesn th
ottlenecks Wo
model used ihigh cooperament involveReview of W
nternational Eas used to deuction, consuenergy carriegions.
s ane m
orld Energy Cou
n EPS 2050ation and ement) World EnergyEnergy Agenetermine umption and rs, and
nd mid-
uncil
y, ncy

Log
1.
In glooveanthreqfacwoforfasco
Debuoil rolwogeestto co
FigGrproSou
gistics Bottlen
.1 Coa
2008, the Asobal coal proer 3 billion tod-supply (the
roughout the uals 27 800
ctors used in orld have mur the past sevstest growingnsumption p
espite the higrning coal anor natural gae in ensuring
orld due to itsographical stimated to in2008, and bynsumer will b
gure 2 rowth rate inojections fource: EPS2050,
ecks World En
l
sia Pacific reducer and co
onnes—61%e conversionstudy: 1 millTJ). Append this report. Och lower appveral years, cg energy carroint of view (
gh burden onnd low-energas, coal is exg the energy s abundancepread. Globacrease by 20y a further 54be Asia Paci
n the producor 2020 and 2, 2009 BP Statis
nergy Council
gion was theonsumer, bo of the globa
n rate for coalion tonnes o
dix 1 has the Other regionpetites for cocoal has beerier from a gl(Figure 2).
n the environgy density wixpected to kebalance aro
e and fairly eval coal produ0% in 2020, w4% by 2050.fic, and only
ction and co2050. stical Review of
e biggest th values
al demand-al used of coal conversion
ns of the oal, although en the lobal
ment from th respect toeep its majoround the ven uction is with respect The major Europe and
onsumption
f World Energy 2
o r
d
Russia arconsump
1.2 O
The situacomplex tmarkets amost of it(Figure 3East. The(70% of aPacific (6pipelines products
By 2020, billion ton(1 million
n of coal in 2
2009, IEA
re expected tion by 2020
Oil
ation in the oithan the coaare often far ts reserves a). Two-thirdsere are greatannual consu68%), which c
and tankersfrom exporti
global consunnes, meanin
tonnes of oi
2008 accord
to decrease 0 and 2050.
l market is mal market. Oilfrom produc
are limited to s of reserves
oil importersumption impocould not funbringing in c
ng countries
umption of ong a 12% incl equals ~ 42
ing to regio
their coal
much more l consumer cer markets a
a few areas are in the Ms, such as Eorted) or Asianction withoucrude and oi
s.
il will reach 4crease from 22,000 TJ).
on, with
and
Middle urope a ut l
4.4 2008
5

6
Althodepeprimacontrexamconsumainlratheto the
1.3 nat
Naturthan liquefconstgas pregiobillionsee A
FigurGrowprojeSource
ough some rendence on oarily to expanrolling consum
mple, will switumed in 200ly thanks to e
er than cuttinge EPS 2050
Naturaural gas
ral gas is muoil. Expensivfaction/re-gatructed next produced in 2ns, while then cubic meteAppendix 1 fo
re 3 wth rate in thections for 2e: EPS2050, 20
egions will deoil imports, thnding producmption. Norttch from impo8 to a break-expanding pg consumptiomodel).
al gas as (LNG)
uch less convve pipelines aasification terto harbours. 2008 was exe same indicaers (bcm) of gor the conve
he productio2020 and 20009 BP Statistica
ecrease theirhat will be duction rather thh America, aorting 43% o-even in 202roduction byon by 12% (a
nd lique
venient to traare needed orminals must
Hence, onlyported to othator for oil wagas equals 3rsion table].
on and cons50. al Review of Wo
r e han as an of oil 20, but y 54% according
efied
ansport or be
y 12% of her as 48% [1
36,000 TJ;
sumption of
orld Energy 200
Discovered abundant thobserved onproduction ifrom 2020 toEPS 2050 m
1.4 Ur
Uranium orenuclear powfew regions—Australia, Nthey are resproduction. power plantenergy densworld (arounuranium).Thbe transportoil and coal Appendix 1
f oil in 2008
09, IEA
Logistics Bo
reserves of nhan oil, and an the global ms expected to 2050, anotmodel.
ranium
e reserves, awer plants, ar—six countriamibia, Russ
sponsible for Although mos has to be ise and therefnd 2,250 TJ fhe total volumted is insignif(1 tonne of ufor the conve
according t
ottlenecks Wo
natural gas aalready a shifmarkets. By to increase bther 41%, ac
an energy sore concentraies (Canada,sia, and Nigeover 80% of
ost uranium umported, it is
efore efficientfrom one ton
me of uraniumficant when uranium equersion table)
to region, w
orld Energy Cou
are much moft toward gas2020, global
by 39%, and ccording to th
ource for ted in just a , Kazakhstaner). Togetherf global used in nucles the most t fuel in the nne of m that has tocompared wals 546 TJ; s
). Therefore,
with
uncil
ore s is l
he
n, r,
ear
o with see

Log
urastu
1.
TodimbiobeEntax
Frobioglocunaprothaeitnepre
FigGrproSou
gistics Bottlen
anium will beudy.
.5 Biom
o lower the glminishing eneofuels, and oing looked a
ntrepreneurs x incentives,
om the logistomass are stobal productibic meters (stural gas). Toduction. Bioan 1% of globher exportedither biomaseferentially in
gure 4 rowth rate inojections fource: EPS 2050
ecks World En
e not included
mass an
obal carbon ergy resourcther renewabt by more anare being givand other re
tics point of vtill insignificaon in 2008 esame converhat was just
omass is a lobal productio
d or importedss nor biogasn further part
n the producor 2020 and 20, 2009 BP Stati
nergy Council
d in further p
nd bioga
footprint andces, biomassble energy fund more goveven green ce
egulatory sup
view, both bint. As for bio
equalled 33.1rsion rate to 1.1% of natu
ocal energy son is expected. For these rs will be treatts of the stud
ction and co2050. stical Review o
parts of the
as
d save , biogas,
uels are ernments. ertificates, pport.
ogas and ogas, its 1 million TJ as ural gas source—less ed to be reasons, ted dy.
onsumption
f World Energy
1.6 E
After havenergy prreceived vehicles, electricitynecessitieenergy, thto everydtechnologregions. Tper capitathroughou
Electricityand sent grid, has is wastedproductioinefficienttransportaand distri
n of natural g
2009, IEA
Electrici
ing mined, products, diffeper se—be iheat for our
y for our toolses of living. Rhere is no do
day activities gical progresThere is a higa and electricut the world.
y, after beingalong transmto be consum
d, putting a pon. Storing elt, as is its veation. At the bution losse
gas in 2008
ty
rocessed, anerent types ot fuel for carshouses and
s, appliancesRegardless ooubt electricitand lies at th
ss for countriegh correlatiocity consump
g produced inmission lines med on the sremium on “jectricity is bory long-distaend of 2007s in U.S., for
according t
nd transporteof energy ares and other workplaces,
s, and other of the form oty is fundamhe heart of es and whole
on between Gption per cap
n power plan to a distribuspot—otherwjust in time” oth expensiv
ance 7, transmissior example, w
to region, w
ed
, or
f ental
e GDP pita
nts ution wise it
ve and
on were
ith
7

Logistics Bottlenecks World Energy Council
8
estimated at 6.5% (U.S. Energy Information Administration). Hence, electricity usage has many restrictions and imbalances around the globe.
Currently, electricity production and consumption are concentrated in the most developed regions of the world. Europe, with just over 9% of the global population, consumes 24% of the world’s electricity. North America, with 5%, consumes 28%. On the other extreme, Africa’s 14% of the world’s inhabitants must do with just 3% of the electricity (1 TWh of electricity equals 3,600 TJ; see Appendix 1 for the conversion table).
Not surprisingly, the demand for electricity will increase for all regions in both the 2008–2020 and 2020–2050 time frames (Figure 5). Growth will be driven especially by emerging markets. The Asia Pacific region is projected to increase electricity consumption between 2008 and 2020 by 60%, Africa by 86%, and Latin America by 87% (EPS 2050 model).
Figure 5 Projected electricity consumption across regions in 2008, 2020, and 2050. Source: EPS 2050 model
0
10.000
20.000
Africa
2008 2020 2050
Europe
Greater Russia
APAC
Middle East
North Am
LAC
30.000
40.000
50.000TWh

Log
Thcatranecochaflowloo
2
gistics Bottlen
e fragile suprriers can onnsportation ot-exporting cnsumption, aanges) to news are preseok to 2020 an
2. Ega
ecks World En
pply–demandnly be achievof respectivecountries (whassuming noet-importing cented per fuend 2050.
Enegapsand
nergy Council
d balance acved today thae energy carrhere producti significant scountries. Mael type with a
ergy s becap
ross energy anks to the riers from ion exceeds stock level ajor trade a forward
tradetwepab
2.1 C
In 2008, talmost 5 exported reserves As a resuwithout loEurope athe region
de: eenilitie
Coal
the global prbillion of tonto other regiare spread f
ult, most coalong-distance s the biggesn’s consump
clos req
es
oduction of cnes, 14% of ons (Figures
fairly evenly al-consuming coal transpot exception (
ption).
singquire
coal reachedwhich was
s 6 and 7). Caround the gcountries do
ortation, with(imports 73%
g theeme
d
Coal globe. o h % of
e ents
9
s

10
Over regiothan althouwith rdeclin
FigurThe wmillioSource
Russ
the next decns will explopursue long-ugh global corespect to 20ne by 9%, to
re 7 world’s largon tonnes. e: EPS 2050, 2
Venezuela
China
Vietnam
Kazakhstan
US
South Africa
Colombia
sian Federation
Indonesia
Australia
cade, the bigit their own c-distance impoal consump
008, coal exp637 million t
est net-exp
2009 BP Statistic
5
8
24
25
32
38
4
2008 net trad
20
ggest coal-cocoal reservesports. By 202ption will growports are projtonnes.
orters and i
cal Review of W
46
52
de volumes of b
128
008 net trade v
onsuming s rather 20, w by 19% jected to
mporters of
World Energy 20
111
biggest coal ex
65
volumes of bigg
The 2050 timexports will tonnes with increasing nfrom net-expPacific will r
f coal in 200
009, IEA
169
xporters
40
37
33
25
17
1
1
1
gest coal impo
Logistics Bo
me frame wilstart growingrespect to 2
nominal impoporters to imremain the bi
08 and their
3
2
2
Turkey
Taiwan
France
orters
Brazil
Japan
South K
India
German
United K
Italy
ottlenecks Wo
ll change thisg (by 39% to
2008), with alorts and som
mporters (Africiggest coal e
net trade vo
Korea
ny
Kingdom
orld Energy Cou
s picture. Coo 926 million l regions
me even turnica). Asia
exporter and
olumes in
uncil
oal
ng

Logistics Bottlenecks World Energy Council
11
importer with global shares of 41% and 43%, respectively (according to the EPS 2050 WEC model).
2.2 Oil
For many years, global supply–demand in the oil market has been anything but balanced. Few countries hold the majority of reserves, while most of oil “heavy users” are vulnerable and dependent on supplier countries, often from other regions. In 2008, out of around 3.9 billion tonnes of oil produced, as much as 2.2 billion were exported to other regions, accounting for 56% of total production (Figures 8 and 9).
Toward 2020, most of the heavy oil importers will struggle to curb their dependence, or at least replace long-distance suppliers with closer ones to some extent. One reason is that large reserves of oil are located in geopolitically turbulent areas, which places higher risks on them as import sources. Another reason, thanks to successful research and development, is that previously unavailable oil fields in net-importing countries are now feasible alternatives to imports (heavy oil in Venezuela and oil sands in Canada).
In the 2020–2050 time frame, global demand for oil will remain difficult to curb—and so will be its
transportation needs. It is projected that 58.8% of oil refined in 2050 will be exported to other regions of the world—a higher share than either in 2008 or 2020.
2.3 Natural gas and liquefied natural gas (LNG)
The transportation of natural gas, vital for today’s economy, is a challenge much more difficult to overcome than arguably any other fuel. It needs to be compressed and pumped in large quantities to create sufficient pressure in gas pipelines. If transported by sea, it must be liquefied and then re-gasified at the destination.
As a result, only 11.5% of natural gas extracted in 2008 was exported to other regions of the globe (Figure 10). Most of those relatively scarce trade flows occurred via gas pipelines linking gas fields in former Soviet countries and Europe (44% of global exports). Other significant flow was directed from North Africa to southern Europe—86 bcm represented around one-fourth of global exports (Figure 11).
By 2020, the world will be demanding much higher accessibility and portability of natural gas. Not only will gas exports grow by 86%, according to our projections, but also their share in global
Figure 9 The world’s largest oil net-exporters and importers in 2008 and their net-trade volumes in million tonnes. Source: EPS 2050, 2009 BP Statistical Review of World Energy 2009, IEA
127
489
515
92
99
104
105
117
119
122
Saudi Arabia
Russian Federation
Iran
2008 net trade volumes of biggest oil exporters
Kuwait
Iraq
United Arab Emirates
Nigeria
Norway
Venezuela
Angola 579
222
186
118
103
99
92
77
76
50
Japan
Germany
South Korea
US
China
2008 net trade volumes of biggest oil importers
India
France
Spain
Italy
Taiwan

12
M
A
Neth
In
Russ
produthe hBetwwill gthe M
FigurExpoSource
Figur
The wvolumSource
21
Malaysia
Australia 20
Nigeria
herlands
Qatar 17
2 2
ndonesia 7
Algeria
Canada
Norway
sian Fed.
NLNG
2008 net tra
uction is bouighest raise een 2008 anrow their exp
Middle East b
re 10 orts and impe: EPS 2050, 2
re 11
world’s largmes in billioe: EPS 2050, 2
29
27
40
38 22
93
87
37
Natural gas
ade volumes o
nd to increasacross all en
nd 2020, formports by 39%by as much a
ports of natu2009 BP Statistic
est natural on cubic me2009 BP Statistic
2
154
of biggest gas e
2008 net
se by 45%, snergy carriersmer Soviet co%, Africa by 1as 225%.
ral gas in 20cal Review of W
gas and LNeters.
cal Review of W
78
75
7
92
NLNG
exporters
t trade volume
signifying s. ountries 02%, and
008 accordinWorld Energy 20
G net-expor
World Energy 20
37
11
32
5
72
25
16
1
29
37
Natural gas
es of biggest ga
By 2050, gloto almost triexports in thdouble—wilmoved will nnow exportewill increase
ng to region009, IEA
rters and im
009, IEA
Logistics Bo
Japan
US10
Italy2
Germany
France13
Spain
Turkey5
South Ko
United Ki1
Belgium2
as importers
obal natural gple with resphe world’s prl reach 34.8%not be as larged to other ree enormously
, with projec
mporters in 2
ottlenecks Wo
y
orea
ingdom
gas exports pect to 2020,roduction—m%. The quange as oil (58egions), but ny compared
ctions for 20
2008 and the
orld Energy Cou
are expected, and share o
more than ntity of gas .2% of outpunonetheless to the presen
020 and 205
eir net-trade
uncil
d of
ut is
nt.
0.
e

Logistics Bottlenecks World Energy Council
13
Assessing major expected trade flows across regions and energy carriers is vital to show which carriers will really “matter” when it comes to transportation over the long distances to meet energy demand in the future. Equally important is mapping and evaluating potential bottlenecks in a sustainable energy supply. A structure based primarily on an energy supply chain is used here, from extraction of the respective fuel types through their transportation and storage to consumption (Figure 12). These steps need to be adjusted for electricity bottlenecks. Transmission grids (high-voltage) and distribution grids (mid- and low-voltage) as well as storage are most important.
Bottlenecks can be assigned to respective energy sources or to the carriers themselves, as described previously. For segmentation purposes, energy sources can be divided into three basic types—solid (coal, uranium, and solid biomass), liquid (oil and biofuels), and gas (natural gas and biogas).
Placing successive steps of a logistics supply chain on one axis and energy sources and carriers on the other one leads to a matrix of logistics bottlenecks. This matrix, in turn, can be populated with respective logistics risks that may disturb the energy supply–demand balance.
A detailed discussion of all identified logistics bottlenecks would take extensive space; besides, it is difficult to prioritize them to show major challenges to the demand–supply equilibrium over the long term. Therefore, Appendix 2 shows details according to the segmentation described above and is only summarized below, followed with an overview of critical gaps where the biggest bottlenecks appear.
3.1 Bottlenecks across the supply chain steps related to energy sources
A variety of logistics bottlenecks is related to energy sources. Some are universal for all their types (e.g., capacity shortage for manufacturing of energy-related equipment), but more are source-specific. For some solid fuels, for example biomass, compromising agricultural areas is an issue, as growing populations require increasingly higher food production
Liquid fuels, i.e., oil and biofuels, have their problems. In the case of biofuels, many challenges result from a rather complex supply chain—both biodiesel (from oil crops) and bioethanol (from sugar and starch crops) require growing crops first, then processing them to obtain the final product, which in case of bioethanol, has to be additionally blended in refineries or depots with gasoline. Moreover, due to pressure on agricultural areas, EU countries are already debating decreasing minimum obligatory shares of bioethanol in car fuel. Oil logistics bottlenecks will be discussed in detail in the study.
Most of transportation bottlenecks related to gas energy carriers are related to their inherent characteristics—volatility and flammability. Vulnerabilities related to natural gas and LNG will be discussed in the study. As for biogas, an important logistics issue that can restrict its growth is low average production capacity of biogas facilities. Fuelled with organic waste, rarely do biogas-fired power plants (or combined heat and
3. Largest logistics bottlenecks across the energy supply chain and energy carriers

Logistics Bottlenecks World Energy Council
14
power plants) have access to high amounts of fuel. Therefore, their potential output will be limited due to lack of economies of scale.
3.2 Bottlenecks across the supply chain steps related to energy carriers
When discussing energy accessibility, people relate primarily to electricity, which arguably has biggest impact on their lives. After being produced in power plants, electricity is transported via high-, mid-, and low-voltage grids to end consumers—households, industry, institutions, and so forth. It may also be stored for later use. Transportation bottlenecks are detailed in later chapters of the study. Critical gaps are identified where the biggest vulnerabilities appear (based on the Vulnerabilities Matrix).
Although all logistics bottlenecks deserve attention and concrete actions from investors and policymakers to ensure a stable supply of respective energy carriers and electricity, they still can be prioritised to show critical gaps, which the world must manage; otherwise, exporting countries will not realize potential sales and the economic growth of importers will be hampered without energy to fuel it.
Three bottlenecks —oil transportation, gas transportation, and efficient-electricity systems—require the most effort to ensure a supply–demand balance in the 2050 time frame. They will be detailed and measured, and a management plan will be proposed.
3.3 Crude oil transportation
Since its first commercial use in the 1850s, the variety of applications for crude oil has steadily expanded. Crude oil is reasonably portable and its reserves around the globe are uneven. The Middle East countries and Russia hold between them a little less than two-thirds of global reserves as of 2008. Both mid- and long-distance transportation are required to satisfy the growing hunger for oil. In 2008, 56% of extracted oil was already being transported to other regions. Such an amount has and will result in an array of logistics challenges to handle.
3.3.1 Major bottlenecks
Between 2008 and 2050, global oil exports are projected to increase by 17%. This growth may not seem extraordinarily high, but nonetheless investors and politicians will struggle to ensure a sustainable supply. That will happen due to three reasons:
Figure 12 Potential bottlenecks across the steps of an energy supply chain with conversion to electricity.
Electricity storage
Grid distribution
Electricity
Construction of power plants
StoragePipeline transpor‐tation
Road, rail &water
transpor‐tation
Extraction
Grid transmission
Raw materials and fuels
Logistics Bottlenecks World Energy Council
15
1. Oil exports higher by 17% from 2008 to 2050 is still a large growth, equalling 368 million tonnes—close to the oil consumption of France, Germany, Italy, and Spain together in 2008.
2. Along with shifting demand–supply patterns, oil trade routes will change. For example, European crude imports are projected to shrink from 681 million tonnes in 2008 to a mere 430 million tonnes in 2050, signifying that some exporters (like Russia and surrounding countries) will have to find new markets for their products. This means higher investment needs than those resulting from a volume increase of pure exports.
3. Apart from the economic issues likely to happen, social, political, and environmental tensions that may create more logistics bottlenecks for oil are also very important.
Having those three sources of potential supply bottlenecks in mind, a list of them may be put forward:
Postponing investment decisions (for example new rigs) due to price volatility of crude.
An insufficient number of ships.
Terrorist attacks on ships.
Hijacking ships (e.g., pirates near Somalia).
Terrorist attacks on pipelines.
Pipelines used as a tool in political blackmail.
Congestion management (especially in agglomerations).
Sinking oil platforms (often cheaper than towing it and disposing of it on land).
3.3.2. Necessary capacities
Equally important to identifying oil transportation bottlenecks is actually sizing them, i.e., defining the investment gap that will cover necessary amounts of crude to regions which will need them in the 2020 and 2050 time frames.
Logistics infrastructure in 2008
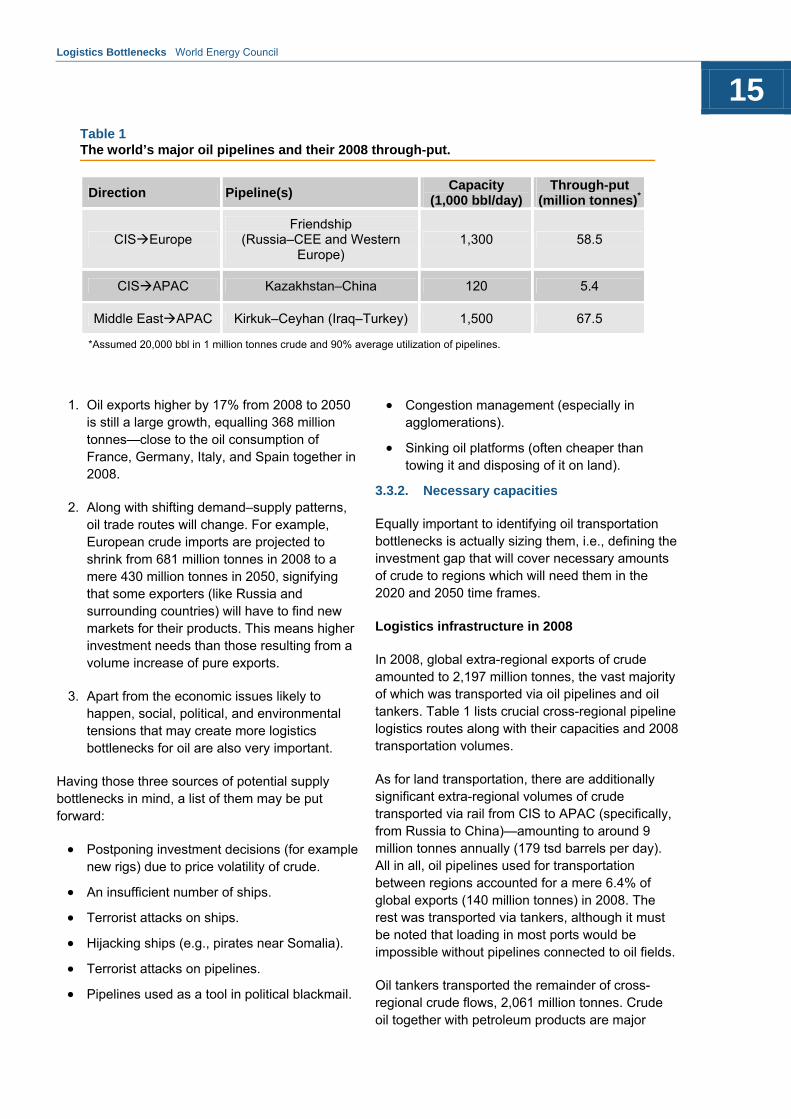
In 2008, global extra-regional exports of crude amounted to 2,197 million tonnes, the vast majority of which was transported via oil pipelines and oil tankers. Table 1 lists crucial cross-regional pipeline logistics routes along with their capacities and 2008 transportation volumes.
As for land transportation, there are additionally significant extra-regional volumes of crude transported via rail from CIS to APAC (specifically, from Russia to China)—amounting to around 9 million tonnes annually (179 tsd barrels per day). All in all, oil pipelines used for transportation between regions accounted for a mere 6.4% of global exports (140 million tonnes) in 2008. The rest was transported via tankers, although it must be noted that loading in most ports would be impossible without pipelines connected to oil fields.
Oil tankers transported the remainder of cross-regional crude flows, 2,061 million tonnes. Crude oil together with petroleum products are major
Table 1 The world’s major oil pipelines and their 2008 through-put.
Direction Pipeline(s) Capacity
(1,000 bbl/day) Through-put
(million tonnes)*
CISEurope Friendship
(Russia–CEE and Western Europe)
1,300 58.5
CISAPAC Kazakhstan–China 120 5.4
Middle EastAPAC Kirkuk–Ceyhan (Iraq–Turkey) 1,500 67.5
*Assumed 20,000 bbl in 1 million tonnes crude and 90% average utilization of pipelines.

Logistics Bottlenecks World Energy Council
16
maritime transport commodities, accounting for 34% of total transports via the sea in 2008. At the end of the year, the tonnage of tanker fleet reached 414 million dead-weight tonnes.1 Utilization of global tankers reached 96.5% and has been rising over last 20 years, with exception of last financial crisis temporarily curbing oil demand across all regions (Figure 13).
Apart from investments in enhancing the total capacity of oil tankers, maintaining such a large fleet in operational condition required scraping some ships and replacing them with new ones. In 2008, 202 vessels were demolished, totalling 5.5 million DWT (1.3% of total capacity).
Capacity requirements between 2008–2050
Between 2008 and 2050, significant investments in oil movement infrastructure will be required to maintain the supply–demand balance. They will result from increasing demand in most regions and from changing demand–supply patterns around the globe (e.g., regions shifting from net-exporters to net-importers).
1 Dead-weight tonnage (DWT) determines how much weight a particular ship can safely carry. DWT contains weights of cargo, fuel, ballast water, fresh water, provisions, crew, and passengers; 1 DWT equals 1 tonne of payload.
Existing oil pipelines will continue to operate in the foreseeable future—first, because there will be demand from Europe for Russian crude (Friendship pipeline) and from APAC for Middle East oil (Dorytol pipeline). However, increasing demand, especially from emerging Asian economies, such as China and India, will urge neighbouring net-exporters to lay additional pipelines, which are at the moment the cheapest means of crude transportation. Table 2 lists planned pipelines investments for the 2008–2020 time frame.
Between 2008 and 2020, all major currently planned investments in increasing crude pipeline capacity will be realized among the CIS, Europe, APAC, and the Middle East. It comes as no surprise—they are relatively close and urgently require new transport routes to reach clients for their crude (CIS and Middle East) or to ensure supply for domestic markets (Europe and APAC).
Altogether, four significant projects are planned, with a combined length of around 9,000 kilometres and an annual through-put of 175 million tonnes of crude. From this amount, 50 million tonnes from the Neka–Jask pipeline should be subtracted; it will
Figure 13 Capacity development of the global tanker fleet and capacity surplus in the 1990–2008 period. Source: Review of the maritime transport 2009, United Nations Conference on trade and development, Geneva
0
50
100
150
200
250
300
350
400
450
200620042002200019981996199419921990 2008
Million DWT
World tanker fleet (M DWT)
Tanker fleet surplus (M DWT)
Logistics Bottlenecks World Energy Council
17
Figure 14 Projected required capacities for oil pipelines and tankers for extra-regional crude exports in the 2008–2050 time frame.
0
500
1000
1500
2000
2500
2008 2020 2050
Ex
tra
-re
gio
nal
oil
ex
po
rts
, M
ton
ne
s
Year
Crude volume exported extra-regionally via pipelines
Crude volume exported extra-regionally via tankers
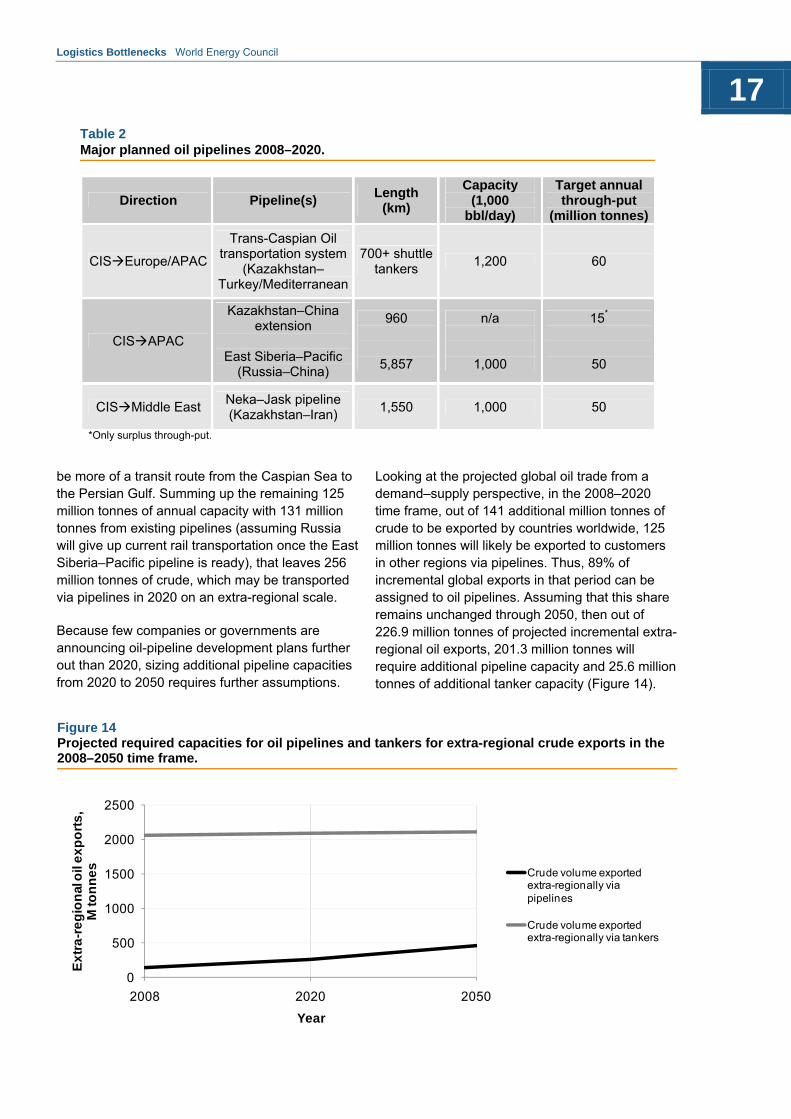
be more of a transit route from the Caspian Sea to the Persian Gulf. Summing up the remaining 125 million tonnes of annual capacity with 131 million tonnes from existing pipelines (assuming Russia will give up current rail transportation once the East Siberia–Pacific pipeline is ready), that leaves 256 million tonnes of crude, which may be transported via pipelines in 2020 on an extra-regional scale.
Because few companies or governments are announcing oil-pipeline development plans further out than 2020, sizing additional pipeline capacities from 2020 to 2050 requires further assumptions.
Looking at the projected global oil trade from a demand–supply perspective, in the 2008–2020 time frame, out of 141 additional million tonnes of crude to be exported by countries worldwide, 125 million tonnes will likely be exported to customers in other regions via pipelines. Thus, 89% of incremental global exports in that period can be assigned to oil pipelines. Assuming that this share remains unchanged through 2050, then out of 226.9 million tonnes of projected incremental extra-regional oil exports, 201.3 million tonnes will require additional pipeline capacity and 25.6 million tonnes of additional tanker capacity (Figure 14).
Table 2 Major planned oil pipelines 2008–2020.
Direction Pipeline(s) Length
(km)
Capacity (1,000
bbl/day)
Target annual through-put
(million tonnes)
CISEurope/APAC
Trans-Caspian Oil transportation system
(Kazakhstan–Turkey/Mediterranean
700+ shuttle tankers
1,200 60
CISAPAC
Kazakhstan–China extension
East Siberia–Pacific
(Russia–China)
960
5,857
n/a
1,000
15*
50
CISMiddle East Neka–Jask pipeline (Kazakhstan–Iran)
1,550 1,000 50
*Only surplus through-put.

Logistics Bottlenecks World Energy Council
18
3.4. Gas transportation
The transportation of natural gas is arguably even more challenging than oil. Gas is highly flammable and ethereal. The smallest leak in a pipeline may lead to losing large amounts of this valuable resource, not to mention creating an extraordinary risk for fire or explosions. Long-distance gas transportation is equally, if not more, problematic. It has to be cooled down to less than -162 degrees Celsius to liquefy it and its volume compressed more than 600-fold. So its trade value must justify its transportation cost.
3.4.1. Major bottlenecks
Long-distance natural gas transportation is projected to rise rapidly via pipelines and LNG
carriers. In 2008, global extra-regional exports of gas amounted to 353.5 bcm—11.5% of the world’s production. In 2020, this volume is projected to increase to 657.3 bcm (16.7% of global production), and to as much as 1,892.7 bcm (34.8% of global production) in 2050!
To ensure this growth, numerous logistics bottlenecks concerning natural gas must be addressed:
Sub-optimal investments in pipeline systems, partly due to geopolitical pressures (Nord Stream, South Stream, and Nabucco).
Adjustments of local laws and regulations to avoid obstruction of network investments (e.g., right of way).
Table 3 The world’s major gas pipelines and their 2008 through-put.
Direction Pipeline(s) Length (km) Through-put
(bcm)
CISEurope
Yamal–Europe
Druzhba
4,196
2,750
33
30
CISAPAC
Central Asia–China (Turkmenistan/
Kazakhstan–China)
South Caucasus Pipeline (Azerbaijan–Turkey)
1,833
692
40
8.8
CISMiddle East Korpeje–Kordkuy
(Turkmenistan–Iran) 200 8
APACEurope Turkey–Greece 210 7
Middle EastCIS Iran–Armenia 140 2.3
Middle EastAPAC Iran–Turkey 2,577 11
AfricaEurope
Maghreb–Europe (Algeria–Spain)
Greenstream (Libya–Italy)
Medgaz (Algeria–Spain)
Trans-Mediterranean (Algeria–
Italy)
1,620
540
757
2,560
12
11
8
30.2
AfricaMiddle East Arab gas pipeline (Egypt–Lebanon)
992 10.3

Logistics Bottlenecks World Energy Council
19
Threat of terrorist attacks on pipelines and LNG tankers.
Other LNG transportation challenges (distance from production unit to end-consumers, costs incurred, and infrastructure required to compress/decompress natural gas).
3.4.2. Necessary capacities
To assess necessary capacities, as in case of oil, the gas exports in 2008 may be split into two streams: gas pipelines and LNG carriers. Analogically to crude, the current infrastructure and needs for its further development to satisfy global demand are described.
Logistics infrastructure in 2008
In 2008, extra-regional exports of gas amounted to 353.5 bcm, transported by both gas pipelines, and LNG tankers. Gas pipelines moved around 60% of this volume, 211.6 bcm, between regions. Table 3 shows the division of that volume among respective pipelines. Altogether, 13 trans-regional gas pipelines have a total estimated through-put of 211.6 bcm.
As for infrastructure associated with LNG, at the end of 2008, there were 309 LNG carriers worldwide, with total capacity of 43.2 bcm of gas. They transported 141.9 bcm of LNG following routes shown in Table 4. Altogether, 353.5 bcm of
natural gas exported in 2008 between regions were transported via LNG carriers (roughly 40%) and 60% via pipelines.
Capacity requirements between 2008 and 2050
The demand for natural gas, being a much cleaner fuel than oil and thus more widely accepted, will grow significantly over the coming years. The resulting extra-regional exports are projected to grow almost exponentially—by 86% from 2008 to 2020 and by another 188% in the 2020–2050 time frame! Beyond any doubt, that will require tremendous investment to make sure exporting markets have a platform to reach their customers.
To accommodate such growth, exporters are already building their capacities of existing pipelines and laying new ones. Table 5 lists planned gas pipelines, their length, diameter, and annual targeted through-put.
Should all started and announced projects be completed, 398.5 bcm of pipeline capacity would be added between 2008 and 2020. That is not likely to happen, however, for one simple reason—Europe will not need that much gas. At the end of 2008, 63 bcm of gas were imported by Europe from CIS via the Druzhba and Yamal–Europe pipelines, plus 68 bcm from Africa and Turkey. In 2008–2020, incremental European gas imports are projected at 33.2 bcm. Even assuming that all of that will be imported via gas pipelines, there is still a huge gap
Table 4 Global extra-regional routes of LNG transportation in 2008 (in bcm). Orange boxes indicate intra-regional flows and are presented for information only. Source: BP Statistical Review of World Energy, 2009
Origin North
America LAC Europe
Middle East
Africa APAC
Des
tin
atio
n
North America - 8.75 0.56 0.18 4.06
LAC 1.61 0.08
Europe 5.03 1.21 8.06 40.99
Asia Pacific 0.97 1.97 0.42 53.78 17.05 85.69

Logistics Bottlenecks World Energy Council
20 Table 5 The world’s major planned gas pipelines.
Direction Pipeline(s) Length (km)Diameter (inches)
Target annual through-put (bcm/year)
CISAPAC
Central Asia–China enhancement
(Turkmenistan–China)
Altai Gas Pipeline (Russia–China)
South Caucasus
Pipeline (Azerbaijan–Turkey)
Trans-Afghanistan
Pipeline (Turkmenistan–India)
Blue Stream
(Russia–Turkey)
1,833
2,800
692
1,680
1,213
42
56
42
56
24–55
15*
30
11.2*
33
16
CISMiddle East
Azerbaijan–Iran
Arab gas pipeline, Phase 2 (Turkey–
Syria)
Azerbaijan–Syria
200
62
36
90
6.57
1
CISEurope
Nabucco
Nord Stream
White Stream (Georgia–EU pipeline)
South Stream (Russia–EU)
3,300
1,222
2,100
900
36
48
42
31
55
32
63
Middle EastAPAC
Qatar–Turkey pipeline
Oman–India pipeline
Iran–Pakistan pipeline
Pars pipeline (Iran–Turkey
2,500
1,100 (subsea)
900
1,740
28
42
42 -
20
26.5
7.8
37
AfricaEurope GALSI
(Algeria–Italy) 865 22–48 8
APACEurope Turkey–Greece 210 36 5*
Africa Middle East
Arab gas pipeline (Egypt–Jordan)
1,200 36 0.5
*Only surplus through-put.

Logistics Bottlenecks World Energy Council
21 Figure 15 Projected required capacities for gas pipelines and LNG carriers in extra-regional gas exports in the 2008–2050 time frame.
0
200
400
600
800
1000
1200
2008 2020 2050
Ex
tra
-re
gio
nal
ga
s e
xp
ort
s,
bc
m
Year
Gas volume exported extra-regionally via pipelines
Gas volume exported extra-regionally via LNG carriers
of 161.2 bcm between announced new pipelines to Europe (in total, 194 bcm) and the abovementioned projected import increase. Such a discrepancy stems from political reasons—some projected pipelines will substitute for current ones (e.g., the Nord Stream is an alternative to the Druzhba or Yamal pipes). The others will substitute each other (like the South Stream supported by Russia versus Nabucco or White Stream supported by politicians and investors willing to decrease the current European dependence on Russian gas).
Of the announced incremental investments in gas pipelines to Europe, potentially capable of transferring 194 bcm of gas, only 33.2 bcm of additional gas inflows are about to materialize. That leaves 237.8 bcm of global incremental gas exports via pipelines. (Other planned pipeline investments are all assumed to be realized.) From the remaining list, some of the projects are competing for the same gas—for example, the South Caucasus Pipeline (Azerbaijan–Turkey) and Blue Stream (Russia–Turkey). Taking that into account, a 30% correction factor representing shares of projects not likely to be completed because other options were substituted can be assumed. This leaves 166.4 bcm as likely incremental gas pipeline throughput between 2008 and 2020.
The remainder of necessary exports will have to be transported by LNG tankers, if at all. It would amount to 137.3 bcm (difference between
additional exports of 303.8 bcm in 2008–2020 and 166.4 bcm assumed to be transported via new pipelines).
Between 2020 and 2050, as in case of oil, there are no available projections for the development of transportation infrastructure for natural gas. Incremental gas exports from 2020 to 2050 have been estimated at 1,235.5 bcm. To see how they might be split between gas pipelines and the LNG fleet, the world map with additional gas demand and supply divided among the regions, is illustrative. In case of Europe, imports are projected to stay at a constant level between 2020 and 2050. In APAC, however, gas imports are likely to increase by 719 bcm. Assuming 80% of that amount to be transported via pipelines calculates to 575.2 bcm. Remaining incremental capacity (660.3 bcm) will be transported via LNG carriers (Figure 15).
3.5 Electricity systems
The process of the generation and distribution of electricity has always been a struggle to increase efficiency, i.e., the ratio of output (power supplied to end-customers) to input (energy value of the fuels used to generate electricity). According to the McKinsey Global Institute, in 2003, only 37% of energy used in power generation process reached customers, the rest being lost in transmission.

Logistics Bottlenecks World Energy Council
22
Looking ahead to 2020 and 2050, the energy sector must achieve much higher efficiency to be able to satisfy increasing demand, especially from emerging economies, while consuming scarce energy resources.
3.5.1 Major bottlenecks
Major bottlenecks to increasing the efficiency of electricity systems can be divided into two groups: those related to power generation and those related to power distribution. The former results in manufacturing bottlenecks (for example, replacing standard, coal-fuelled power turbines with modern ones based on Integrated Gasification Combined Cycle, IGCC). The latter results in logistics bottlenecks. For example:
Inability to accurately assess the required amount of electricity in the network, resulting in the distribution of excessive quantities of power.
One-way communication in the network, from electricity providers to customers, losing
information potentially helpful in production planning (switch-off plans in factories, holidays of private users).
Problems with the distribution of electricity generated from renewable sources (wind and solar) and the production planning of such intermittent resources restrains their contribution to the total volume of such energy in the network.
Few trans-national grid connections, enabling potential price reductions (arbitrage)
Increasing overall network security (local blackouts), and increasing the stability of local networks near borders.
Limited capabilities in assessing sources of power loss along the grid, resulting from technical issues or energy theft.
3.5.2. Necessary capacities
All inefficiencies embedded in today’s electricity transmission and distribution processes may be decreased—and some of them eliminated—thanks
Table 6 Status of implementation of smart grids in selected countries. Source: From Policy To Implementation: The Status of Europe’s Smart Metering Market, Cap Gemini 2009 and Smart Meters Gaining U.S. Foothold, www.sustainablebusiness.com
Country Status
Denmark Smart meters being introduced on a large scale; around 30% of meters are being replaced with smart meters
Finland All major utilities are implementing smart meters on a large scale; 20% of the population already have a smart meter installed
Ireland Implementing a two-way communication system with the customers of an innovative electricity pre-payment service
Italy Arguably the best developed smart meter network in the world—27 million meters have been replaced with AMR devices by 2006; plans to reach 95% of consumers by the end of 2011
Sweden
Some smart grid functions implemented nationwide with a project to install meters that collect payments monthly was finished in 2009; around 1 million advanced meter readers now being implemented by Vattenfall and E.ON
U.S.
Smart meters now represent 4.7% of installed meters in U.S.; President Obama’s administration made large-scale implementation of smart meters a top priority in the energy sector, introducing a large-scale stimulus plan worth in total USD 4.5 billion for this purpose in January 2009

Logistics Bottlenecks World Energy Council
23
to smart grid systems. “Smart grid” is a colloquialism for a set of tools, both software and hardware, enabling power companies to increase the efficiency of electricity distribution by improving information capture throughout the network. Hardware elements of smart grids contain, first of all, automated meter readers (AMRs) that measure in real-time the consumption of electricity by various points in the network (at end-users and at crucial network points, such as transformers). Telecommunications and data-storage infrastructure is required to handle, analyse, and store enormous amounts of data gathered via AMRs (from SIM cards to servers). The software elements of smart grids comprise programs used by operators to monitor network utilization, as well as programs for end-users (web-based CRM software) to monitor energy consumption in households.
Necessary capacities with respect to electricity distribution should indicate when respective regions of the globe could develop their own smart grid systems. Table 6 reflects the current status of smart-grid implementation in countries most advanced in this area.
From the current status of smart-meter implementation around the world, it can be argued that Europe and North America are two regions with the highest potential for the widespread use of smart meters by 2020. This argument is supported by ABI Research, which argues that the EU and North America will have the highest numbers of AMRs by 2014—the former being projected to have installed 115 million smart meters, and the latter 45 million units.
Other regions of the world, it can be assumed, are more likely to finish their deployment by 2050, although some are already actively pursuing smart power networks. An exception may be Middle East, which has not yet started large-scale implementation of AMRs, but due to a comparatively low number of citizens and large financial reserves, they could complete the whole process in a few years.

Logistics Bottlenecks World Energy Council
24
Table 7 Cost evaluation of selected, planned oil pipeline projects .
Pipeline(s)
Annual through-put
target (million tonnes)
Projected cost of the
pipeline Pipeline(s)
Trans-Caspian oil transportation system (Kazakhstan–Turkey/Mediterranean
60 4,000 66.7
East Siberia–Pacific (Russia–China) 50 600 30
Neka–Jask pipeline (Kazakhstan–Iran) 50 2,000 40
In this section, a top-down cost assessment of required investments in the global development of smart grids is proposed.
4.1 Necessary investments in oil transportation
Having assessed the required capacities for the oil infrastructure in the 2020 and 2050 time frames, the projected actual investments needed, can be calculated should those capacities be addressed. To do this, it is necessary to assess relevant price benchmarks for each means of transportation.
4.1.1 Relevant price benchmarks
As for oil pipelines, required investments in developing the transportation infrastructure may be projected primarily based on an average cost of constructing a pipeline capable of delivering 1 million tonnes of crude from producer markets to consumer markets. To quantify this benchmark, a closer look on cost evaluation of selected pipeline projects was taken.
An average cost per 1 million tonnes of crude oil through-put as the average for the current and planned pipelines is calculated in Table 7 and this yields an estimated cost of USD 45.6 million per million tonnes.
In case of oil tankers, it will be easier to project investments in developing the fleet with respect to required capacity measured in DWT. A benchmark cost of 1-million DWT of tanker capacity can be derived. Although generally the price of tankers depend on their capacity, it is not linear—thanks to economies of scale, great ships cost much less per 1-million DWT than small vessels. Table 8 summarizes the estimated cost per 1 million DWT depending on type (class) of tanker.
Measured as the average from Table 8’s calculated prices per 1-million DWT capacity of various tanker types depending on size, an average price per 1-million DWT of capacity at USD 666.3 million is estimated.
4. Infrastructure investments required to manage key logistics bottlenecks

Logistics Bottlenecks World Energy Council
25
4.1.2 Evaluation of investments required in the 2008–2020 time frame
Multiplying additional through-put resulting from planned investments in oil pipelines with the price benchmark of cost per 1 million tonne of target crude through-put yields the projected investment outlay necessary to close the demand gap for crude oil transported via oil pipelines.
USD 5.7 billion investments in pipelines 2008–2020
=
125 million tonnes through-put of planned pipelines
x
USD 45.6 million/million tonnes price benchmark–average cost of a pipeline
per 1 million tonnes
In the case of oil tankers, required investments should include both outlays for developing the fleet to cover additional demand as well as replacing obsolete vessels. As outlined previously, in 2008, the global tanker fleet transported 2,061 million tonnes of oil using ships with 414 million DWT. This signifies 1 million DWT of the global tanker fleet’s capacity were used to transport 5 million tonnes of crude. If, as calculated previously, extra-regional oil exports using tankers will increase by 15.9 million tonnes in the 2008–2020 period, that will require an additional 3.2 M DWT tanker capacity. Multiplying this by the price benchmark of USD 666.3 million per 1 million DWT (average tanker construction cost), demands USD 2.1 billion to fill this demand.
On top of that, required outlays to keep the global fleet operational, scrapping no-longer-viable vessels and replacing them with new ones, must be added. In 2008, the tonnage of scraped vessels reached 5.5 million DWT. Assume this rate remains stable from 2008 to 2020. That would mean a cumulative replacement tonnage of 66 million DWT—equalling USD 43.9 billion of investment costs.
Total required investments in the 2008–2020 time frame may be calculated as follows:
USD 56 billion investments in tankers 2008–2020
=
USD 2.1 billion new tankers required
x
USD 43.9 billion fleet replacement cost
Summing up, required investments in oil pipelines and tankers yield USD 51.7 billion necessary to cover logistics aspects of meeting extra-regional demand for oil in the 2008–2020 time frame.
4.1.3 Evaluation of investments required in the 2020–2050 time frame
Incremental crude transport volumes in the 2020–2050 time frame have already been derived. Using the same methodology and price benchmarks as in the 2008–2020 time frame (investment unit costs will most probably in fact rise), the required capital expenditures (CAPEX) can be easily calculated.
Table 8 Average price of oil tankers per 1-million DWT depending on type of vessel.
Tanker class Average size (in
DWT)
Price of a new vessel
(USD million)
Price per million DWT
(USD million)
Product tanker 35,000 43 1,229
Panamax 70,000 50.5 721
Aframax 100,000 58 580
Suezmax 160,000 89 556
Very Large Crude Carrier 260,000 120 462
Ultra Large Crude Carrier 435,000 196 450
Logistics Bottlenecks World Energy Council
26
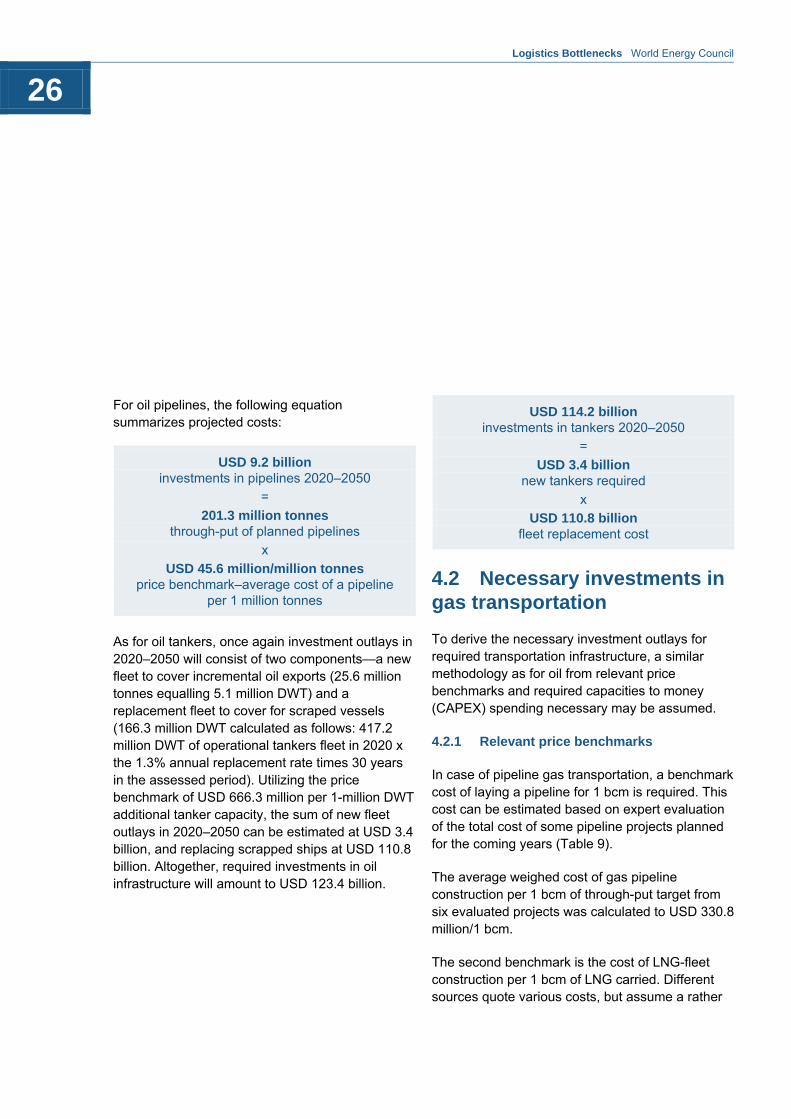
For oil pipelines, the following equation summarizes projected costs:
USD 9.2 billion investments in pipelines 2020–2050
=
201.3 million tonnes through-put of planned pipelines
x
USD 45.6 million/million tonnes price benchmark–average cost of a pipeline
per 1 million tonnes
As for oil tankers, once again investment outlays in 2020–2050 will consist of two components—a new fleet to cover incremental oil exports (25.6 million tonnes equalling 5.1 million DWT) and a replacement fleet to cover for scraped vessels (166.3 million DWT calculated as follows: 417.2 million DWT of operational tankers fleet in 2020 x the 1.3% annual replacement rate times 30 years in the assessed period). Utilizing the price benchmark of USD 666.3 million per 1-million DWT additional tanker capacity, the sum of new fleet outlays in 2020–2050 can be estimated at USD 3.4 billion, and replacing scrapped ships at USD 110.8 billion. Altogether, required investments in oil infrastructure will amount to USD 123.4 billion.
USD 114.2 billion investments in tankers 2020–2050
=
USD 3.4 billion new tankers required
x
USD 110.8 billion fleet replacement cost
4.2 Necessary investments in gas transportation
To derive the necessary investment outlays for required transportation infrastructure, a similar methodology as for oil from relevant price benchmarks and required capacities to money (CAPEX) spending necessary may be assumed.
4.2.1 Relevant price benchmarks
In case of pipeline gas transportation, a benchmark cost of laying a pipeline for 1 bcm is required. This cost can be estimated based on expert evaluation of the total cost of some pipeline projects planned for the coming years (Table 9).
The average weighed cost of gas pipeline construction per 1 bcm of through-put target from six evaluated projects was calculated to USD 330.8 million/1 bcm.
The second benchmark is the cost of LNG-fleet construction per 1 bcm of LNG carried. Different sources quote various costs, but assume a rather

Logistics Bottlenecks World Energy Council
27
conservative cost by the Review of Maritime Transportation that estimates a 150 million-cubic-meter LNG tanker costing USD 245 million in 2008. Because costs of LNG-carrier construction have dropped by 45% since the mid-80s, according to the U.S. Energy Information Administration, efficiency increase needs to be built in. Assuming another 40% efficiency increase as an average between 2008 and 2050 yields USD 147 million for a 150 million-cubic-meter carrier, which, extrapolated to a 1-bcm capacity, gives the cost benchmark 980 M USD per 1 bcm LNG tanker capacity.
4.2.2 Evaluation of investments required in the 2008–2020 time frame
Having calculated necessary cost benchmarks and required capacities for gas pipelines and LNG tankers, the projected necessary investments for the 2008–2020 time frame can be derived.
In case of pipelines, essential CAPEX outlays will be the product of planned cumulative through-put and the price benchmark—average cost of a gas pipeline per 1 bcm.
USD 55.1 billion investments in pipelines 2008–2020
=
166.4 bcm through-put of planned pipelines
x
USD 330.8 million/1 bcm price benchmark–average cost of a pipeline
per 1 bcm
As for LNG tankers, a part of the fleet operating in 2008 will become obsolete and have to be replaced sometime between 2008 and 2020. Assuming the same rate of scraped fleet (1.32% per year) fleet replacement will be assumed to be the same. In 12 years from 2008 to 2020, 15.8% of the global fleet is likely to be replaced at a cost of USD 6.7 billion (12 years � 1.36% replacement rate � 43.2 bcm of global fleet capacity � USD 980 million cost benchmark per 1 bcm). In case of a new fleet, tankers with a total capacity of 41.8 bcm will be required (if 43.2 bcm capacity was sufficient in 2008 to transport 141.9 bcm LNG, then an 85-bcm capacity should be enough in 2020 to transport 279.2 bcm of LNG, indicating required incremental capacity of 41.8 bcm).
Total required investments in the global LNG fleet in 2008–2020 may be calculated as follows:
USD 47.7 billion investments in tankers 2008–2020
=
USD 41.0 billion new tankers required
x
USD 6.7 billion fleet replacement cost
4.2.3 Evaluation of investments required in the 2020–2050 time frame
For oil tankers, the same price benchmark applies to calculate the necessary investments, multiplied by the projected 2020–2050 additional pipeline through-put.
Table 9 Cost evaluation of selected planned gas pipeline projects.
Pipeline(s) Annual through-
put target (bcm)
Projected cost of the pipeline
(USD million)
Cost per 1 bcm of through-put target
(USD million)
Nabucco 31 10,600 341.9
Iran–Pakistan gas pipeline 7.8 3,200 410.3
Central Asia–China pipeline expansion
15 7,300 486.7
Trans-Afghanistan pipeline 33 7,600 230.3
South Stream 63 21,500 341.3
GALSI 8 2,000 250.0

Logistics Bottlenecks World Energy Council
28
USD 190.3 billion investments in pipelines 2020–2050
=
575.2 bcm through-put of planned pipelines
x
USD 330.8 million/1 bcm price benchmark–average cost of a pipeline
per 1 bcm
Necessary investments in the LNG fleet will be very high to compensate for planned exports growth. Expanding the fleet to cover projected incremental 660.3 bcm exports will cost USD 197 million (same logic as before). On top of that, USD 13.3 billion will be needed to cover the part of the fleet that becomes obsolete during this time (30 years x 1.36% replacement rate x 85 bcm of global fleet capacity in 2020 x USD 980 million cost benchmark per 1 bcm). All in all, necessary investments will amount to USD 210.3 billion.
USD 210.3 billion investments in tankers 2020–2050
=
USD 197.0 billion new tankers required
x
USD 13.3 billion fleet replacement cost
4.3. Necessary investments in efficient electricity systems
Investments in efficient electricity systems, in order to achieve sustainable energy systems, will require smart grids around the globe on a national level utilizing interconnectivity options with neighbouring countries (trans-national connections like today’s Market Coupling in Benelux and Germany and Nord Pool in Scandinavia). Based on the experience from the most advanced markets in smart-grid deployment and on an assumed implementation pace in the respective regions, an investment projection may be constructed.
4.3.1 Relevant price benchmarks
Italy is the most advanced market in the world with respect to smart grids. From 2001 to 2006, 80% of end-users were linked to a smart network and their meters replaced with two-way automated meter readers (AMRs). The project cost was estimated at a total of USD 3 billion. Considering the annual consumption of electricity in Italy of 317.9 TWh (2008 consumption according to the International Energy Agency), the average cost of a smart grid per 1 TWh of consumption amounted to USD 11.8 million (total cost of USD 3 billion/(80% of customers x 317.9 TWh total consumption).
Target benchmark cost of installing smart-grid solutions per 1 TWh of electricity consumption should incorporate expected diminishing hardware costs (AMRs should be less and less costly to produce) and scale effects. For the purposes of this study, it has been assumed that the average cost of smart-grid components will be average 50%
Logistics Bottlenecks World Energy Council
29
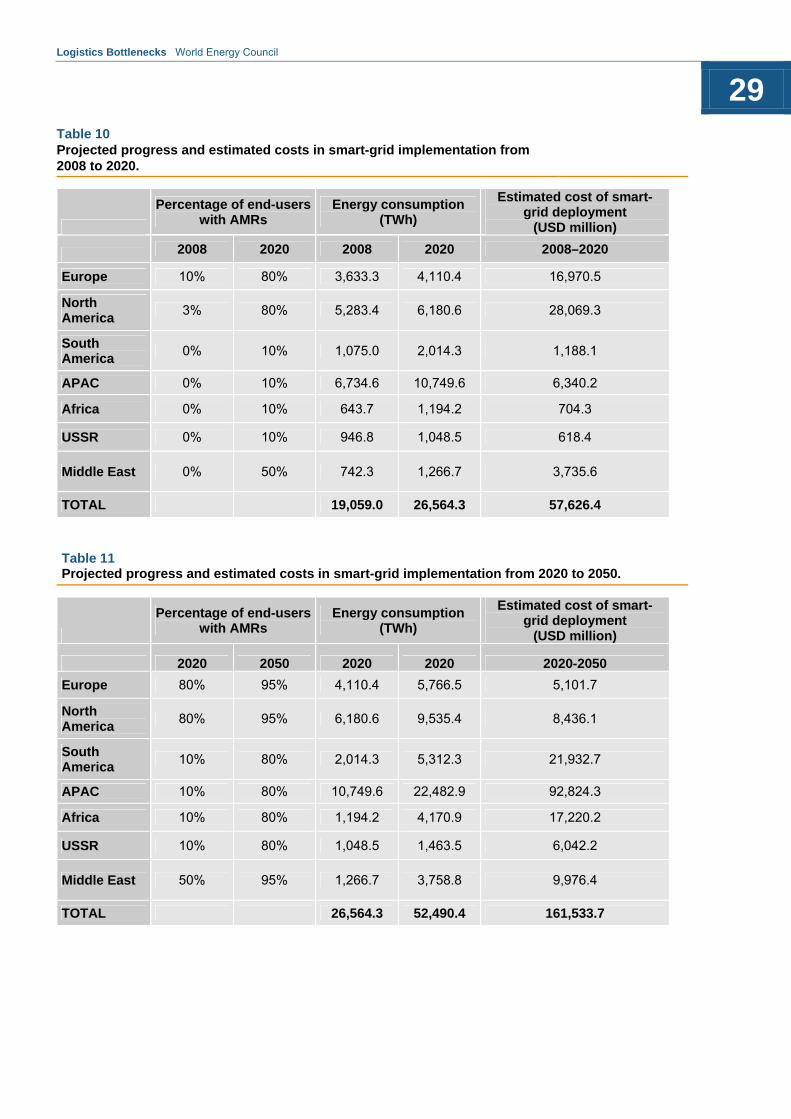
Table 10 Projected progress and estimated costs in smart-grid implementation from 2008 to 2020.
Percentage of end-users with AMRs
Energy consumption (TWh)
Estimated cost of smart-grid deployment
(USD million)
2008 2020 2008 2020 2008–2020
Europe 10% 80% 3,633.3 4,110.4 16,970.5
North America
3% 80% 5,283.4 6,180.6 28,069.3
South America
0% 10% 1,075.0 2,014.3 1,188.1
APAC 0% 10% 6,734.6 10,749.6 6,340.2
Africa 0% 10% 643.7 1,194.2 704.3
USSR 0% 10% 946.8 1,048.5 618.4
Middle East 0% 50% 742.3 1,266.7 3,735.6
TOTAL 19,059.0 26,564.3 57,626.4
Table 11 Projected progress and estimated costs in smart-grid implementation from 2020 to 2050.
Percentage of end-users with AMRs
Energy consumption (TWh)
Estimated cost of smart-grid deployment
(USD million)
2020 2050 2020 2020 2020-2050
Europe 80% 95% 4,110.4 5,766.5 5,101.7
North America
80% 95% 6,180.6 9,535.4 8,436.1
South America
10% 80% 2,014.3 5,312.3 21,932.7
APAC 10% 80% 10,749.6 22,482.9 92,824.3
Africa 10% 80% 1,194.2 4,170.9 17,220.2
USSR 10% 80% 1,048.5 1,463.5 6,042.2
Middle East 50% 95% 1,266.7 3,758.8 9,976.4
TOTAL 26,564.3 52,490.4 161,533.7

Logistics Bottlenecks World Energy Council
30
lower in 2008–2050 period than it was in case of Italy. Hence, the value of benchmark cost of installing smart-grid solutions per 1 TWh of electricity consumption has been finally calculated at USD 5.90 million.
4.3.2 Evaluation of investments required in the 2008–2020 time frame
As discussed previously, Europe and North America are most likely to introduce smart grids on a wide scale before 2020 (Table 10). Current progress of implementation in Europe (which may be measured as a share of the AMRs in the total number of meters in the region) can be estimated at around 10%, whereas in North America, it is around 3% (highest in U.S., lowest in Mexico). Apart from several pilot projects, other regions have yet to start full-scale implementation projects.
Both Europe and North America have the means and determination to install AMRs at 80% crucial consumption point by 2020. The Middle East can easily reach 50% implementation—this region by 2020 will reach consumption levels of 1,266.7 TWh, just over 20% of the consumption in North America. Other regions will most probably have started large-scale implementation programs by then, allowing them to reach 10% implementation. To reach the assumed implementation status, USD 57.6 billion of investments in smart grids is required.
4.3.3 Evaluation of investments required in the 2020–2050 time frame
The year 2050 may see nearly full emplacement of smart meters worldwide (Table 11). By then, Europe, North America, and the Middle East should reach 95% coverage, whereas other regions may install smart meters for 80% of the population. Reaching these assumed implementation levels by 2050 requires investing over USD 161.5 billion.

Logistics Bottlenecks World Energy Council
31
Multi-million dollar investments are a necessary but not exclusive condition to bring about the infrastructure required to ensure a balanced energy supply–demand and manage key logistics bottlenecks. Equally important are necessary policies that support the timely development of necessary infrastructure without excessive costs.
5.1 Necessary policies in oil transportation
Apart from enhancing pipeline capacities and developing a dense network of oil tankers, the following steps are recommended to ensure a constant supply of oil on a global scale:
Recommendations for policymakers
Granting legal rights-of-way for oil pipelines (mostly at the national level) to prevent blockage for economic reasons (selling the ground at economically-justified prices;
International cooperation to reduce piracy on oil tankers ; unless pirates are pressured on land and sea, oil tankers will have to choose suboptimal routes, and in extreme cases be unable to serve some customers
Introducing stimulus packages for oil-tanker producers (long-term tanker leasing contracts, dockyard infrastructure adapted to producing oil tankers, incentivizing the replacement of obsolete fleet).
Recommendations for industry
Intensifying RD&D activities aimed at increasing oil demand–supply balance, i.e., increasing production in importing regions
Develop additional pipeline infrastructure (cheapest oil transportation mode) and pursue economies of scale in the market for tankers.
5.2 Necessary policies in gas transportation
As seen over the past few years, political tensions and power games in natural-gas transportation could obscure the primary objective, which should be providing sufficient quantities from net-exporting to net-importing countries at affordable prices. Every so often, natural gas is treated as a political tool to increase influence over a particular importing region or to obtain ownership over distribution assets in targeted economies.
To prevent it and allow for undisturbed access to this natural gas, strict policies should be supported by both policymakers and companies:
Recommendations for policymakers
Granting legal rights-of-way for gas pipelines (also mostly at the national level
Incentivizing projects with the most positive economic impact and ensuring highest energy interconnectivity (like the Trans-European Energy Network programme)
Providing incentive packages to increase cross-border trade of natural gas (especially
5. Necessary policies
Logistics Bottlenecks World Energy Council
32
via pipelines), such as decreasing transit fees, and signing long-term legally-binding contracts.
Cutting price subsidies gradually for gas where they are too high to encourage energy efficiency (especially in net-exporting countries), and enforcing much stricter controls over gas consumption and potential losses (tends to be laxer in countries with abundant gas).
Recommendations for industry
Increasing regional partnerships through joint infrastructure investments (sharing natural gas storage facilities, and sharing costs of laying pipelines), which also may decrease per-unit investment costs.
RD&D investments in liquefaction and re-gasification technologies – any process efficiency increases will have a large impact in the face of rapid projected growth in LNG transportation
Increasing LNG transportation efficiency, e.g. through economies of scale in LNG carriers (transportation using the largest carriers results in a cost reduction of20-30%)
5.3 Necessary policies in electricity transmission
A set of regulations and incentives ensuring proper management of electricity transmission should focus on promoting increased energy efficiency and regional cooperation. We recommend adapting following principles by policymakers and industry:
Recommendations for policymakers
Developing financial vehicles by utilities and governments (especially regulators) to ensure the timely deployment of smart grid networks. International cooperation by governments to incentivise deployment of trans-system network connections, e.g., the EU list of supported electricity infrastructure projects as part of the Trans European Network.
Support the introduction of third-party access (TPA). This functions well in EU countries but on much too low a scale outside the European Union. TPA ensures de-monopolization of regional electricity markets, opens options to buy electricity from any market player.
Supporting international projects to build “energy bridges” between countries—to ensure electricity price convergence and create power pools to decrease the risk of blackouts; an example is the Scandinavian Nord Pool
Creating stimulus packages for operators of power plants and distribution infrastructures. The focus should be on increasing productivity, efficiency, and reliability of energy assets. Elements of a possible incentive system can be found in EU climate directives (red certificates for combined heat and power production, CO2 allowances for modernization of production infrastructure, and planned white certificates for increasing energy efficiency).

Logistics Bottlenecks World Energy Council
33
Recommendations for industry
International cooperation in developing common standards for smart-grid networks; joint efforts could diminish required outlays for developing standards and increase interoperability between national power networks.
Investments in large-scale smart-grid systems even without strong incentives from governments, thereby decreasing energy losses and delivering extra value to customers (through more accurate information and billing and extended services package) should be encouraged.
Logistics Bottlenecks World Energy Council
34
1. Hayler, William B.; Keever, John M. (2003). American Merchant Seaman's Manual. Cornell Maritime Pr
2. Pipelines international - March 2010
3. Vladimir Socor (2005-05-05). "Trans-Caspian Oil Pipeline Planned in Kazakhstan". Eurasia Daily Monitor (The Jamestown Foundation).
4. Tom Colton "The World Fleet of LNG Carriers ", from shipbuildinghistory.com
5. Annual Report on the Progress in Smart Metering 2008, European Smart Metering Alliance
6. Shargal, M. (2009). From Policy to Implementation: The Status of Europe’s Smart Metering Market
7. The Climate Group (2008). SMART 2020: Enabling the low carbon economy in the information age.
8. McKinsey Global Institute (2008) The Case of Investing in Energy Productivity
9. UNCTAD (2009) Review of Maritime Transport
10. World Energy Council (2007) Deciding the Future: Energy Policy Scenarios to 2050
11. BP (2009) Statistical Review of World Energy
12. International Energy Agency (2009) Energy Statistics of non-OECD countries
13. International Energy Agency (2009) Energy Statistics of OECD countries
References

Logistics Bottlenecks World Energy Council
35
Vulnerabilities Study Chair
Thulani Gcabashe (South Africa)
Study Chair:
R.V. Shahi (India)
Study Director:
Mariusz Turek (Poland)
Members:
Víctor Díez (Colombia) Jeong-Gwan Lee (Korea) Ion Nedelcu (Romania) Emilio Guerra (Spain)
Oil Refining Task Force
Chair:
Alessandro Careri / Giuseppe Ricci (Italy)
Members:
Ayman Emara (Egypt) Laila Gaber (Egypt) Ismael Mohamed (Egypt) Jarmo Nupponen (Finland) Philippe Jacob (France) Pierre Marion (France) Harald Kraft (Romania) Nenad Djajic (Serbia and Montenegro) Urban Kärrmarck (Sweden) Jean-Eude Moncomble (France) - Observer
Study Group Membership

Logistics Bottlenecks World Energy Council
36
Table 1 Conversion rates used in the study
Study unit Terajoules (1012 J)
Electricity 1 TWh 9.3
Gas 1 bcm 37.5
Oil 1 million tonnes 41.7
Uranium 1 tonne 0.44
Coal 1 million tonnes 27.79
Appendix 1. Conversion rates used in the study

Logistics Bottlenecks World Energy Council
37
Appendix 2. Matrix of logistics bottlenecks

Logistics Bottlenecks World Energy Council
38
Ta
ble
1
Ra
w m
ate
ria
ls /
fu
els
E
lec
tric
ity
E
xtr
ac
tio
n
Ro
ad
/ r
ail
/ w
ate
r tr
an
sp
ort
ati
on
P
ipel
ine
tra
ns
po
rta
tio
n
Sto
rag
e C
on
str
uc
tio
n &
fi
ttin
g o
f e
ne
rgy-
rela
ted
fa
cil
itie
s G
rid
tra
nsm
iss
ion
G
rid
dis
trib
uti
on
E
lec
tric
ity
sto
rag
e
Raw materials / fuels - solid
Co
al
• S
ecu
rity
conc
ern
s e
sp.
In
un
de
rgro
un
d m
ines
• L
ack
of
pro
pe
r in
fra
stru
ctu
re (
po
rts
for
loa
din
g /
o
fflo
ad
ing
co
al)
• B
ala
nci
ng
ne
cess
ity o
f in
cre
ase
d
ge
ne
ratio
n f
rom
b
iom
ass
/ co
-g
en
era
tion
with
a
ffo
rda
bili
ty f
or
en
d-
cust
ome
r
Nu
cle
ar
•
No
wid
e r
ecy
clin
g
of
nu
cle
ar
wa
ste
(h
igh
co
sts?
)
• N
IMB
Y is
sue
w
he
n c
on
stru
ctin
g
a p
lan
t (n
ee
d o
f b
ett
er
soci
al
ed
uca
tion
)
So
lid
b
iom
as
s •
Co
mp
rom
isin
g
ag
ricu
ltura
l are
as
for
ne
ed
s of
en
erg
y se
cto
r (b
iom
ass)
•
Ne
ed
to
bu
ild
po
we
r p
lan
t /
CH
P
clo
se t
o b
iom
ass
sou
rces
Raw materials / fuels - liquid
Oil
•
Po
stp
on
ing
in
vest
me
nt
de
cisi
on
s (e
.g.
in
ne
w r
igs)
du
e t
o
pri
ce v
ola
tility
of
cru
de
• In
suff
icie
nt
nu
mb
er
of s
hip
s •
Te
rro
rist
att
acks
o
n s
hip
s •
Sh
ips'
hija
ckin
g
(e.g
. p
ira
tes
ne
ar
Som
alia
)
• T
err
ori
st a
ttac
ks
on
pip
elin
es
•
Pip
elin
es u
sed
as
a t
oo
l in
po
litic
al
bla
ckm
ails
Bio
fue
ls
• C
om
pro
mis
ing
a
gri
cultu
ral a
reas
fo
r n
ee
ds
of e
ne
rgy
sect
or
(bio
fue
ls)

Logistics Bottlenecks World Energy Council
39
Ta
ble
1
Ra
w m
ate
ria
ls /
fu
els
E
lec
tric
ity
E
xtr
ac
tio
n
Ro
ad
/ r
ail
/ w
ate
r tr
an
sp
ort
ati
on
P
ipel
ine
tra
ns
po
rta
tio
n
Sto
rag
e C
on
str
uc
tio
n &
fi
ttin
g o
f e
ne
rgy-
rela
ted
fa
cil
itie
s G
rid
tra
nsm
iss
ion
G
rid
dis
trib
uti
on
E
lec
tric
ity
sto
rag
e
Raw materials / fuels - gas
Na
tura
l g
as
•
Inve
stm
en
t sh
ort
ag
e in
in
tern
atio
na
l p
ipe
line
link
ag
es
• In
vest
me
nt
de
cisi
on
s d
rive
n b
y p
olit
ics
rath
er
tha
n e
con
omic
fa
cto
rs
• N
ee
d o
f a
dju
stm
ent
of
loca
l la
ws
/ re
gu
latio
ns t
o
avo
id o
bst
ruct
ion
of
ne
two
rk
inve
stm
ent
s (e
.g.
La
w o
f ro
ad
) •
Pip
elin
es u
sed
as
a t
oo
l in
po
litic
al
bla
ckm
ails
• S
tora
ge
se
curit
y e
sp.
Ag
ain
st
terr
ori
sts
atta
cks
• H
igh
de
pe
nd
en
ce
on
ga
s in
en
erg
y p
ort
folio
of
ma
ny
cou
ntr
ies
(e.g
. R
om
an
ia,
Ita
ly)
• L
ow
leve
l of
inve
stm
ent
se
curit
y (e
.g.
in R
uss
ia)
Bio
ga
s
LN
G
•
Insu
ffic
ien
t n
um
be
r of
sh
ips
• T
err
ori
st a
ttac
ks
on
sh
ips
• S
hip
s' h
ijack
ing
(e
.g.
pir
ate
s n
ea
r S
oma
lia)
•
Te
rro
rist
att
acks
(e
sp.
LN
G
term
ina
ls
/ si
los
in
po
rt c
ities
)
Hyd
rog
en

Logistics Bottlenecks World Energy Council
40 T
ab
le 1
Ra
w m
ate
ria
ls /
fu
els
E
lec
tric
ity
E
xtr
ac
tio
n
Ro
ad
/ r
ail
/ w
ate
r tr
an
sp
ort
ati
on
P
ipel
ine
tra
ns
po
rta
tio
n
Sto
rag
e C
on
str
uc
tio
n &
fi
ttin
g o
f en
erg
y-re
late
d f
ac
ilit
ies
Gri
d t
ran
smis
sio
n
Gri
d d
istr
ibu
tio
n
Ele
ctr
icit
y s
tora
ge
Renewables
Ge
ne
ral
ren
ew
able
s
Win
d
• G
en
era
tion
vo
lum
e ve
ry h
ard
to
pre
dic
t /
mo
de
l -
ma
y d
istu
rb
dist
rib
utio
n
netw
ork
•
Ma
nu
fact
urin
g
cap
aci
ty s
ho
rta
ge
fo
r w
ind
mill
s (e
sp.
Som
e p
art
s e
.g.
roto
r b
lad
es)
•
Dis
rup
tion
of
dis
trib
utio
n n
etw
ork
(v
ola
tility
of
ge
ne
ratio
n f
rom
w
ind
)
• In
suff
icie
nt
ele
ctric
ity s
tora
ge
p
oss
ibili
ties
(ma
y le
ad
to
net
wo
rk
dis
rup
tions
/
ove
rlo
ad
s)
So
lar
•
Ve
ry h
igh
g
en
era
tion
cos
ts
limiti
ng
usa
ge
in
ma
ny
cou
ntr
ies
(e.g
. in
Afr
ica,
Asi
a)
• In
eff
icie
nt lo
ng
dis
tanc
e
tran
spo
rta
tion
(esp
. n
ee
de
d e
.g.
in
Me
dite
rra
nea
n)
Hyd
ro
• T
hre
at
of
terr
ori
st a
ttac
ks
on d
ams
•
Fu
rth
er
de
velo
pm
en
t o
f h
ydro
en
erg
y lim
ited
in s
ome
cou
ntr
ies
(be
st
site
s a
lre
ad
y in
u
se)
Electricity
Ele
ctr
icit
y
•
Ele
ctric
ity
ge
ne
ratio
n ca
pa
city
g
ap
like
ly in
mos
t co
un
trie
s -
ne
ed
to
sp
ee
d u
p g
en
era
tion
inve
stm
ent
s •
No
pro
per
fis
cal
po
licy
ince
ntiv
izin
g
inve
stm
ent
s in
g
en
era
tion
cap
aci
ty
• T
ran
smis
sio
n
ine
ffic
ienc
y (e
sp.
Lo
ng
dis
tanc
e)
- in
clud
ing
en
erg
y lo
sses
•
No
pro
pe
r fis
cal
po
licy
ince
ntiv
izin
g
inve
stm
ent
s in
tr
an
smis
sio
n n
etw
ork
•
Insu
ffic
ien
t in
terc
on
ne
ctio
ns
be
twee
n n
atio
nal
gri
ds
da
ng
ero
us
in
case
of
bla
cko
uts
etc
. •
Imb
ala
nce
d n
atio
na
l n
etw
orks
(g
en
era
tion
a
sset
s fa
r fr
om
con
sum
ptio
n)
• D
istr
ibut
ion
in
eff
icie
ncy
in
clud
ing
en
erg
y lo
sses
•
No
pro
pe
r fis
cal
po
licy
ince
ntiv
izin
g
inve
stm
ent
s in
d
istr
ibut
ion
ne
two
rk
• L
ibe
raliz
atio
n o
f E
U e
lect
ricity
d
istr
ibut
ion
to
o s
low
in
som
e c
ou
ntr
ies
-
qu
alit
y o
f se
rvic
es
less
like
ly t
o
imp
rove
• E
lect
ricity
sto
rag
e
ine
ffic
ien
t a
nd
in
suff
icie
nt
(ele
ctric
ity
con
sum
ed
"on
spo
t")
• S
low
R&
D
pro
gre
ss o
n
tech
no
log
ies
en
ab
ling
ele
ctri
city
st
ora
ge
(e
.g. f
ue
l ce
lls)
Logistics Bottlenecks World Energy Council
41
Importance of refining in the oil value chain
Discussions about the oil and gas business tend to take place in the media only when accidents or crises are catalysing the public’s attention, but are otherwise left to the experts. This is now clearly not in the interest of the industry, because it brings attention only to the negative aspects of the business and ignores its contribution to the general well-being and to the health of the economy. In fact energy is the driver of any type of economy and oil has still a fundamental contribution as “energy producer”.
Oil per se is not of much use as an energy source: it needs to be converted in different products before it can be used. Refining is the step that converts crude oil into different types of fuels and feeds for the petrochemical sector.
It is this centrality of the oil sector to the economic system of developed countries that explains why it is so often invoked to explain global geo-political balances and energy security issues. What instead is not discussed is how the well-being of the oil sector is crucial to the welfare of a country. All OECD countries are large importers of crude oil but, apart from providing employment opportunities for many skilled workers, a competitive refining sector produces advanced fuels, meeting increasingly tougher environmental standards and cheap raw materials for the chemical industry. It also requires advanced research in several disciplines, develops and spreads around
sophisticated technologies and contributes large amounts of indirect taxes to the public coffers!
It is important to ensure the viability of the refining sector because, given the current proportion of energy products derived from oil and the complex and extensive logistics infrastructure in place to move oil and fuels, the process to replace fossil fuels and oil with other energy sources will be gradual and slow. All international studies forecasting energy consumption indicate that fossil fuels (oil, coal and gas) will still be the main source for a few more decades, so it is each country’s vital interest to safeguard its existing refining business.
Scale, cyclicality and other main characteristics of the business
The refining business has some intrinsic characteristics that it developed in its history and now define its structure. It is impossible to understand how it reacts to the impacts from the recent financial crisis without recognizing that:
it requires huge investments because of economies of scale;
its assets lie preferably close to demand;
once a plant configuration has been fixed, it is relatively inflexible in adjusting the ratio between gasoline and diesel, as well as the crude type;
in the ‘60s - ‘80s most EU refiners invested heavily in cat-crackers (which are yielding mainly gasoline) in order to supply internal
Appendix 3. Oil refining

Logistics Bottlenecks World Energy Council
42
market and growing demand from the US market. Over the last few years, instead, new investments in Europe tended to be in hydrocracking capacity, in order to meet the increased internal demand of diesel, while in the US they mainly went into coking.
The recent difficulties of the refining sector can be explained by the combination of two effects: those related to global economic changes (mainly the growing importance, for both demand and supply, of developing countries, where very significant oil resources are located) and those specific to the financial crisis. We will examine the two separately, because the effects of the crisis are transitory, while the others are long-term trends.
Among the “structural”, long-term trends, we highlight:
The decoupling of oil and fuels prices, that have started to be controlled by different drivers:
- fuel prices reflect mainly the supply/demand balance in the served markets;
- oil prices are now distorted by financial considerations (because oil, as commodities in general, is now a financial investment class whose attractiveness to global money flows is largely uncorrelated with demand of the physical).
As a consequence, refining margins have become more volatile.
The divergence of growth rates between OECD and developing countries, with the OECD almost flat and developing countries showing markedly higher rates
- local demand grows with population and income per capita;
- less stringent environmental constraints which facilitate low-cost production of less sophisticated products;
- subsidies are often provided for fuels in order to sustain demand and speed up development of the country;
- availability of Western technologies allows more competitive (more efficient and large-scale) investments.
All this results in different supply/demand balances between the countries, with a diffused overcapacity in the OECD and difficulties to export excess fuels from developed economies to the countries with strong demand.
The demand growth for energy products in emerging economies will slow down somewhat because of:
- income inequality (since wealth concentrates into fewer hands);
- phasing-out of subsidies;
- congestion and pollution;
- widespread availability of more efficient technology reducing unit energy consumption.
Logistics Bottlenecks World Energy Council
43
The availability in developing countries of capital to invest. For the refining sector this has meant huge investments outside the OECD area.
The changing structure of the refining business in OECD countries: IOCs have tended to focus on upstream investments rather than on the downstream, so a growing number of refineries in the world is now operated by independents or NOCs.
Unique features of this last crisis compared to previous cycles
Refining has traditionally been a cyclic business, plagued by alternating phases of under and over-capacity expansion. In the report we will look at what makes the crisis of the last two years different from past cycles.
This last one started as a financial crisis in the USA: the sudden lack of liquidity from the banking system immediately led to (among other things) a drop in consumption that in turn caused a drop in production across all economic sectors among developed countries. The economic recession took on some specific characteristics in the downstream sector, because of changes occurring in the energy business. In brief, on a global scale:
the crisis and economic recession, hitting an already mature market resulted in a contraction of demand for fuels. This has in turn, because of the inflexibility of supply, led to depressed refining margins;
there are some factors that in OECD countries are contributing to dampen fuels demand growth:
- increasing demand for biofuels, sustained by mandatory requirements;
- increasing availability of other (e.g. LPG, methane);
- improving engine performance standards and adoption of stricter efficiency standards (e.g. CAFE standards in the US);
- improved extraction technology and new large discoveries of shale gas in the USA is likely to dampen consumption of oil based fuels in the coming years;
- lower fuels demand in the USA has dampened gasoline exports to the US, a mainstay of the European refining balance;
- the continuing shift in the transportation sector from gasoline to diesel puts pressure on all the plants without an hydrocracker;
- legislation to limit greenhouse gases emissions, particularly by OECD countries, further impact the already weak competitiveness of local refiners. Given its proximity to the Middle East, in the EU the adoption of the new ETS mechanism for CO2 emission permits can significantly improve the competitiveness of imports. This phenomenon is known as “carbon leakage”.

Logistics Bottlenecks World Energy Council
44
The investments by NOCs in local refining capacity bring at the same time reduced demand in the Middle East and increasing exports into developed countries fuel markets
The reduced economic attractiveness of the downstream business is gradually pushing IOCs (International Oil Companies) to focus more on E&P.
In the past the reaction of developed countries to cyclical downturns in refining were (also sharp) reductions in capacity, closing, transforming in depots. This is still likely to happen again, but with some new twists:
Assets dismissed by IOCs are often taken over by NOCs, eager to increase their penetration into developed economies
Some refiners are trying to develop technologies allowing more flexibility in adjusting the ratio of diesel and gasoline in the conversion process
EU refiners are hoping that improved performance of Internal Combustion Engines will reduce motorists’ preference for diesel over gasoline. In the meanwhile, they are wishing for a termination by local legislators of the tax advantages granted years ago to diesel.
Medium-long term consequences for the refining business
It is important to understand how the refining industry will re-balance in order to supply:
increasing demand from the BRIC (Brazil Russia India China) countries;
the diesel deficit in Europe
while reducing gasoline exports to the USA, and which countries and companies will have to reduce their ambitions in the downstream business.
This report is an attempt to estimate the new trade balances in fuels, by macro-basin, for the years to come. It will look at the sudden global swing from under to over-capacity brought about by the economic crisis and the macro-changes described above and assess their impact along the various steps of the global oil value chain, focusing on those specific to refining operations.
World Evolution of the Demand
The economic crisis, the spread of the biofuels and energy efficiency are the main factors influencing the world demand. In particular:
the economic crisis will bring, by 2020, a contraction of the consumption estimated between 2 and 5 Mbpd (present estimation around 100÷103 Mbpd versus an estimation prior to the crisis of 105 Mbpd);
at 2020 biofuels contribution is estimated to be around 3 Mbpd (2.2÷2.6 ethanol e 0.6÷0.7 biodiesel);
the effect of the measures introduced in North America (CAFE Standards) in matters of energy efficiency will have a growing impact on the reduction of the petroleum products.

Logistics Bottlenecks World Energy Council
45
The areas that will grow more than others in terms of demand and refining capacities are Asia and the Middle East.
Europe will have to face - from both political and industrial point of view - the problem of structural gasoline surplus which, on the long run, will have to find its outlet not only in the North American market but also in other consuming areas (mainly Asia).
Two scenarios are here illustrated (High and Low) based on the projections of two primary energy consultants (Wood Mackenzie and Parpinelli). These two scenarios do not appear to be so different, at least in the big numbers, and this is because there is a substantial agreement on the assumptions made by the consultants.
We try to synthesize them below:
refined products will remain key for the transport sector at least up to 2020;
the economic crisis, which began at the end of 2008 and it is not completely overcome yet, had an impact on demand growth, not only changing the growth rates, but also decreasing the starting point (demand in 2009);
the growing spread of biofuels, supported in the OECD countries by laws and regulations, is eroding the consumptions of gasoline and diesel;
there is renewed attention to energy efficiency, not only in Europe, but also in the US (CAFE standards).
Demand Outlook
The economic crisis will bring a contraction in consumptions, and by 2020, the overall results in both scenarios will be
contraction of consumption is estimated between 2 and 5 Mbpd (present estimation around 100÷103 Mbpd versus an estimation prior to the crisis of 105 Mbpd). To 2020 consumption growth is expected between 1.4% (Low scenario) and 1.9% (High scenario) vs. 1.6% expected before the crisis;
break-through technologies to increase efficiency in transport (reduction of consumption) or greater energy efficiency affect the demand;
a reduction of gasoline demand in Europe and in the US;
growth in the demand of middle distillates worldwide;
Europe and Asia are confirmed as major consumer of diesel due to the dieselization of the fleet and strong growth in transport business especially in Asia;
consumption of biofuels will reach approx. 3 Mbpd (2.2÷2.6 ethanol e 0.6÷0.7 biodiesel);
in North America gasoline will continue to be requested (43% of world total in both scenarios) from the United States but will tend to gradually decrease;
Europe will face an increasing structural surplus capacity, particularly on gasoline,
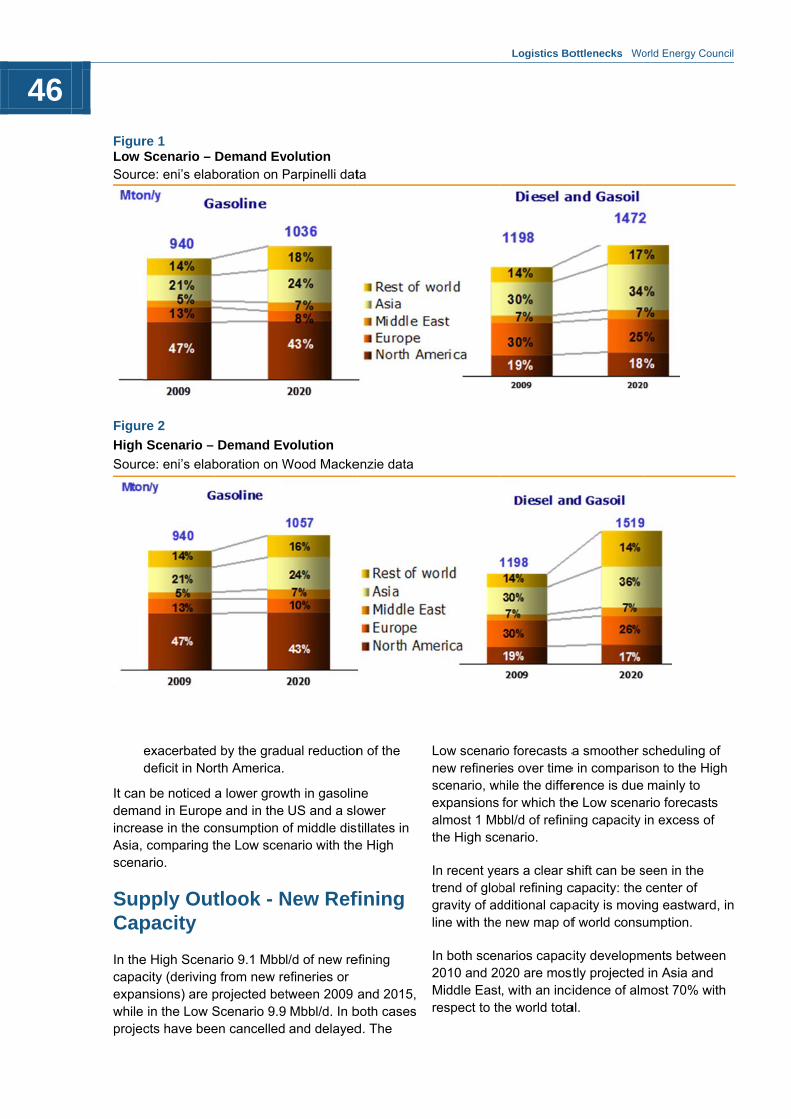
46
It candemaincreaAsia, scena
SupCap
In thecapacexpanwhileproje
FigurLow Sourc
Figur
High
Sourc
exacerbateddeficit in Nor
n be noticed and in Europase in the cocomparing t
ario.
pply Outpacity
e High Scenacity (derivingnsions) are p
e in the Low Scts have bee
re 1 Scenario – ce: eni’s elab
re 2
Scenario –
ce: eni’s elab
d by the gradrth America.
a lower growe and in the
onsumption othe Low scen
tlook - N
ario 9.1 Mbbg from new reprojected betScenario 9.9en cancelled
Demand Evboration on P
Demand Ev
boration on W
ual reduction
wth in gasolinUS and a slo
of middle distnario with the
New Ref
l/d of new reefineries or tween 2009 aMbbl/d. In band delayed
volution Parpinelli dat
volution
Wood Macke
n of the
ne ower tillates in e High
fining
efining
and 2015, both cases d. The
ta
enzie data
Low scenarnew refineriscenario, whexpansions almost 1 Mbthe High sce
In recent yetrend of globgravity of adline with the
In both scen2010 and 20Middle Eastrespect to th
Logistics Bo
io forecasts aes over timehile the differfor which the
bbl/d of refinienario.
ars a clear sbal refining cdditional capae new map of
narios capac020 are mostt, with an incihe world tota
ottlenecks Wo
a smoother se in comparisrence is duee Low scenaing capacity
shift can be scapacity: the acity is movif world consu
city developmstly projectedidence of alm
al.
orld Energy Cou
scheduling oson to the Hig
mainly to ario forecastsin excess of
seen in the center of ng eastwardumption.
ments betwee in Asia and
most 70% wi
uncil
of gh
s
d, in
en
th
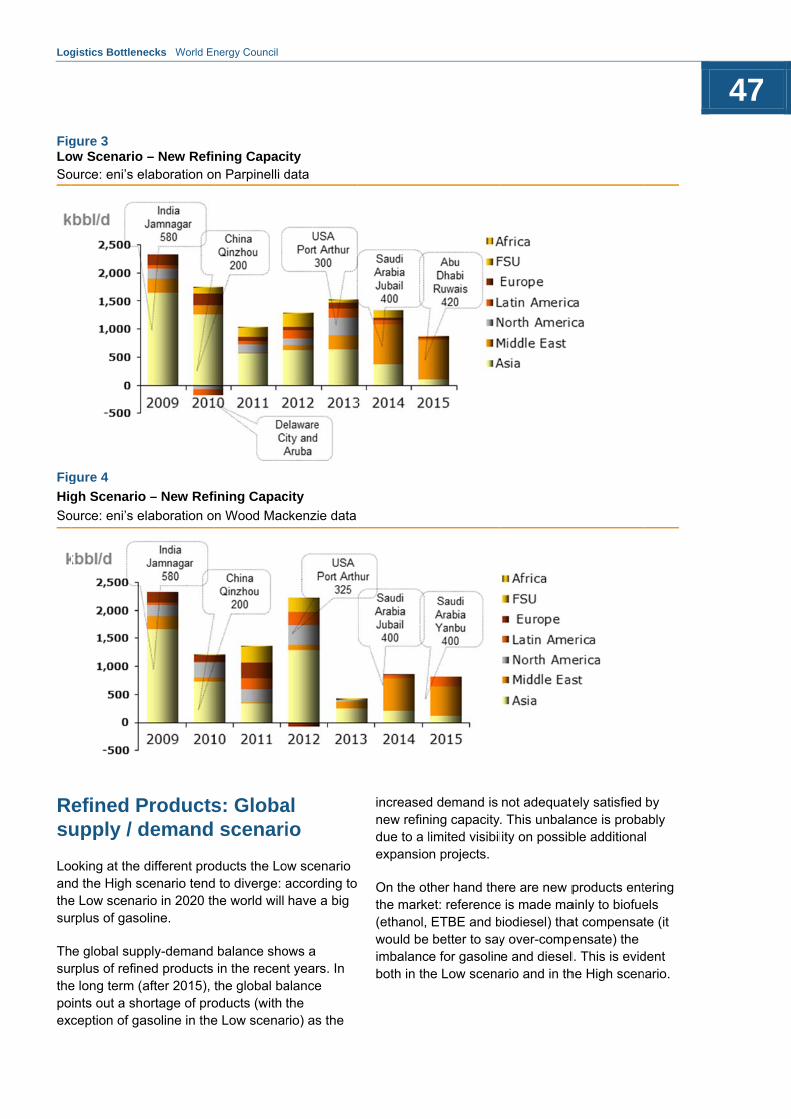
Log
Rsu
Loanthesu
Thsuthepoexc
FigLoSo
Fig
Hig
So
gistics Bottlen
efined Pupply / d
oking at the d the High sc
e Low scenarplus of gaso
e global suprplus of refine long term (aints out a shception of ga
gure 3 ow Scenario ource: eni’s e
gure 4
gh Scenario
ource: eni’s e
ecks World En
Productsdemand
different procenario tendrio in 2020 tholine.
pply-demand ed products after 2015), tortage of proasoline in the
– New Refielaboration o
o – New Refi
elaboration o
nergy Council
s: Globascenari
ducts the Lod to diverge: ahe world will
balance shoin the recenthe global baoducts (with e Low scenar
ning Capacn Parpinelli d
ining Capac
n Wood Mac
al io
ow scenario according to have a big
ows a t years. In
alance the rio) as the
ity data
city
ckenzie data
increasednew refindue to a lexpansio
On the otthe marke(ethanol, would be imbalancboth in th
d demand is ing capacitylimited visibiln projects.
ther hand theet: referenceETBE and bbetter to saye for gasolin
he Low scena
not adequate. This unbalaity on possib
ere are new pe is made mabiodiesel) thay over-compee and dieselario and in th
tely satisfied ance is probable additiona
products entainly to biofueat compensaensate) the l. This is evidhe High scen
by ably l
tering els te (it
dent nario.
47

48
FigurLow Sourc
Figur
Low
Sourc
re 5 Scenario – ce: eni’s elab
re 6
Scenario - G
ce: eni’s elab
Refined Proboration on P
Global Supp
boration on P
oducts SuppParpinelli dat
ply/Demand
Parpinelli dat
ply/Demandta
Balance at
ta
d Balance 20
2020
Logistics Bo
020
ottlenecks Wo
orld Energy Couuncil
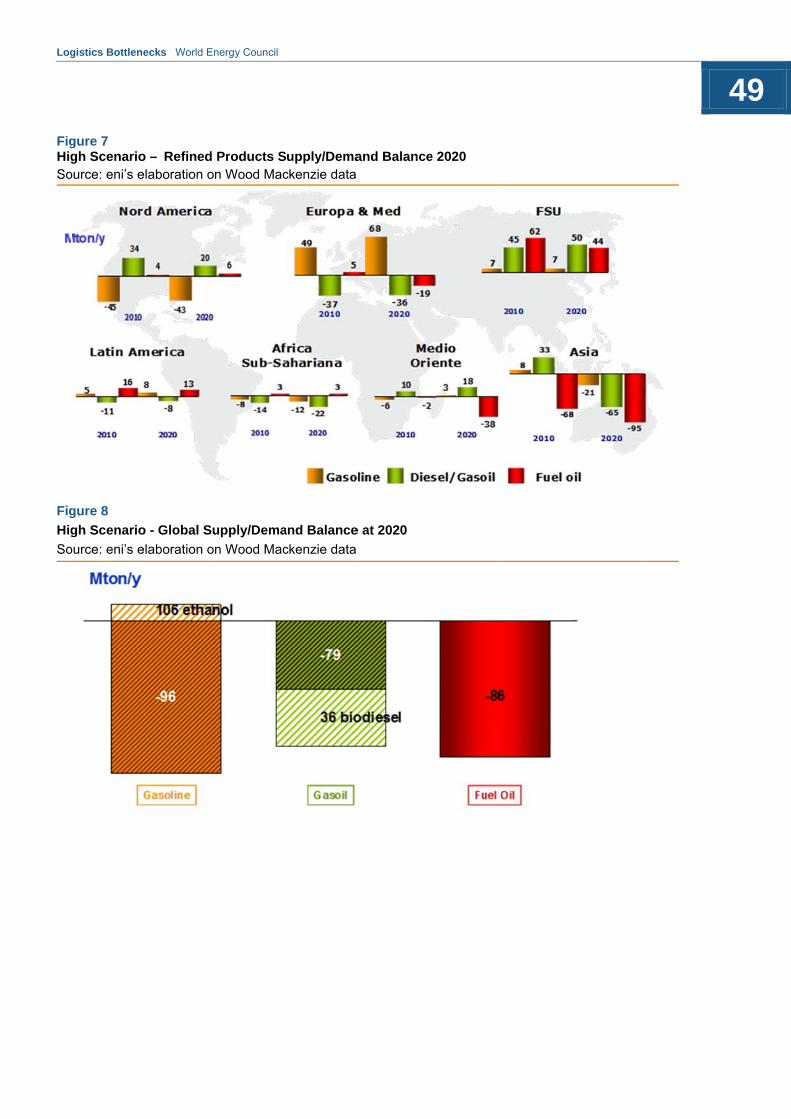
Log
FigHigSo
Fig
Hig
So
gistics Bottlen
gure 7 gh Scenario
ource: eni’s e
gure 8
gh Scenario
ource: eni’s e
ecks World En
o – Refined elaboration o
o - Global Su
elaboration o
nergy Council
Products Sn Wood Mac
upply/Dema
n Wood Mac
upply/Demackenzie data
and Balance
ckenzie data
and Balance
e at 2020
e 2020
49

50
Gaso
AlthoNorthincrea
In 20in the"goinadmin
At glosituat
Europsurplu
FigurGasoSourc
oline
ough gasolineh America, it asing surplus
20, a graduae US is projeg green" polnistration, wi
increased enanticipating CAFE stand
tax credits tomillion hybridpurchase of
progressive estimated grthe Low sceHigh scenar
obal level wetions at 2020
in the Low sfossil gasolinworsened by
in the High sgasoline of 9compensate
pe, which forus towards t
re 9 oline Demance: eni’s elab
e deficit remawill be hardes from Europ
al reduction icted, mainly icy carried oith its three p
ngine efficiento year 2016ards
o facilitate thd vehicles bycars using L
penetration rowth rates anario and 4.2
rio in the peri
e have comp0 in the two s
scenario thene of 19 mln y 118 mln ton
scenario ther96 mln ton/y,ed by ethano
r years has bhe US, would
nd in the USboration on W
ains almost ser to place thpe.
n imports of because of ut by the US
primary goals
ncy standard6 the goals of
e registrationy 2015 and tLPG
of bioethanoaround 6% pe2% per year od 2010-202
letely differescenarios:
re is a surpluton/y, which
n/y of ethano
re is a deficit, more than l for 106 mln
been exportind need to tak
A Wood Macke
steady in he
gasoline the
S s:
ds, f the
n of 1 he
ol, with er year in in the
20.
nt
us of h is further ol;
t in fossil
n ton/y.
ng its ke
enzie data
appropriate refining capyields) and
In that conteAsia, why nosurplus of Edeclining USa market anis complicatbecause Eureduced climrequired (ancountries wiconstraints, are heavily the intent tosupplies froaspect that markets, exthe greater ddomestic cosubtract largRussia, the
Diesel
Also with renot in agreebalance at 2global deficibalanced byHigh scenarbiodiesel is deficit of 43
Logistics B
measures oacity and trypolitical (pro
ext, and with ot consider it
European gasS consumptiond redirect thted for at leasuropean prodmate environnd therefore nithout stringeand second
investing in n reduce an inm abroad. Cstrongly conacerbating thdemand for d
onsumption inge amounts omain supplie
gard to Gasoement about t2020, becausit of diesel ( 3y biodiesel (+rio deficit of donly 36 mln mln ton/y. T
Bottlenecks W
on the industrying to improv gasoline tax
particular ret a good marsoline to replon? In fact, pe flow of tradst two reaso
ducts are hignmental impanot competitent environmly because Anew refining ncreasing de
Consider alsonect Asian ahe condition diesel needen emerging cof product mer of Europe
oil the two scthe supply-dse in the Low35 mln ton/y+36 mln ton/ydiesel is 79 mton/y, leadin
The High sce
World Energy Co
rial (closing ve diesel x policy) side
eference to rket for the lace the nowpenetrate sucditional expons: firstly h quality and
act is not tive) in
mental Asian countricapacity wit
ependence oo another critand Europea
of the latter:ed to cover countries can
mostly from .
cenarios are demand w scenario ) is more thay), while in thmln ton/y andng to a total nario moreov
ouncil
e.
w ch
orts
d
ies h
on tical n
n
an he d
ver

Log
doabwhOilde
Fu
ThUNpreem(MsigapemMAin sthe3.5Jaeff“su20
ThAreEnbebe1 J
Rereq
FigLeSoECA
gistics Bottlen
es not take iout bunker fu
hich could redl and increasmand.
uel Oil
e InternationN agency in ceventing poll
missions by vARine POLlu
gnificative amproved, aime
missions fromARPOL Annesulphur oxidee global sulp50% (from thnuary 2012; fective from 1ustainability r18, that coul
e limits appleas (SECAs
nglish Channginning on 1ing further re
January 2015
ecently even quested the d
gure 10 egislative Imource: EPA, W
A = Emission C
ecks World En
nto account uel (while theduce of abouse of the sam
nal Maritime charge of impution from sh
vessel traffic ution) regula
mendment to ed at reducin
m ships. The ex VI will seee (SOx) emishur cap in bue current 4.5then progres
1 January 20review” to beld delay the e
icable in Sul, currently Bael) have bee July 2010 (f
educed to 0.15.
United Statedefinition of a
mpact on FueWood Macke
Control Area, SE
nergy Council
the new IMOe Low scenaut 40% the d
me amount G
Organizationproving safehips, in orderissued the M
ation. In OctoMARPOL A
ng even furthmain change
e a progressissions from sunker reduce50%), effectivssively to 0.5020, subject te completed enforcement
phur Emissioaltic Sea, No
en reduced tofrom the curr10 %, effecti
es and Canaan ECA (Em
el Oils enzie, InternaECA = SOx Emis
O regulationsario does), eficit of Fuel
Gasoil
n (IMO), the ty and r to reduce
MARPOL ober 2008 a Annex VI washer es to ive reductionships, with ed initially to ve from 1 50 %, to a no later thant at 2025.
on Control orth Sea and o 1.00%, rent 1.50 %);ve from
da mission
ational Maritission Control A
s
s
n
n
;
Control A2012.
This coultowards morder of 2
In this coprojects sdecrease
Concl
Main Oil
For the oshould recommitmchallengeWorld an
contresp(gas(gas
addractiv
comEurothe e
implprog
ime OrganizaArea
Area) that cou
d bring to swmiddle distilla200 mln ton/y
ntest the roleshould be vee fuel oil prod
lusions
System Cha
n-going yeareiterate its strents to overc
es affecting td in Europe
tinue to adjusponse to shrisoline/diesel soline deman
ress the impvities in affec
mply with seveopean Unionenvironment
lement a signgram in Asia
ation (IMO)
uld come into
witching fuel oates, with any.
e of new deery important
duction.
allenges
rs the whole rategy, objeccome the strhe refining inand USA in p
st its refiningnking demanfuel imbalan
nd);
act of the rescted regions;
ere regulatio, especially t
nificant capitand in Middl
o effect from
oil demand n impact of in
ep conversionin order to
Oil System ctives and ructural ndustry in theparticular, by
g base in nd in Europence); and US
structuring o
ons, i.e. in thethose conce
tal expenditule East, as
the
n
e y:
e A
f its
e rning
re
51
Logistics Bottlenecks World Energy Council
52
forecast for 2015, that should offer an appropriate answer to the growing demand expected till 2020
How to cope with challenges
In the meantime the Oil Companies should be committed that the long term viability of the industry depends not only on a necessary reduction of the refining capacity, but also on restoring its competitiveness. In order to achieve this, it would be appropriate to:
encourage flexibility and rationalization of unbalanced refining assets through fiscal measures, optimization of remediation liabilities and cooperation agreements between suffering operators;
challenge the more stringent requirements on biofuel blending;
review the tax distortions on fuel mix and in general on refining activities;
try to reduce the differences in environmental laws and regulations between Europe and Asia/Middle East
impose involvement of Oil Companies in the European Union legislative process.

Albania Algeria Argentina Austria Belgium Botswana Brazil Bulgaria Cameroon Canada China Colombia Congo (Democratic Republic) Côte d'Ivoire Croatia Cyprus Czech Republic Denmark Egypt (Arab Republic) Estonia Ethiopia Finland France Gabon Germany Ghana Greece Hong Kong, China Hungary Iceland India
Indonesia Iran (Islamic Republic) Ireland Israel Italy Japan Jordan Kazakhstan Kenya Korea (Rep.) Kuwait Latvia Lebanon Libya/GSPLAJ Lithuania Luxembourg Macedonia (Republic) Mexico Monaco Mongolia Morocco Namibia Nepal Netherlands New Zealand Niger Nigeria Norway Pakistan Paraguay Peru Philippines
Poland Portugal Qatar Romania Russian Federation Saudi Arabia Senegal Serbia Slovakia Slovenia South Africa Spain Sri Lanka Swaziland Sweden Switzerland Syria (Arab Republic) Taiwan, China Tajikistan Tanzania Thailand Trinidad & Tobago Tunisia Turkey Ukraine United Arab Emirates United Kingdom United States Uruguay
Member committees of the World Energy Council
Designed and produced by Merchant (Brunswick Group).

World EnRegencyLondon WT (+44) 2F (+44) 2E [email protected]
Promotingreatest
ISBN: 97
nergy Council y House 1-4 WaW1B 5LT United20 7734 5996 20 7734 5926 worldenergy.orgorldenergy.org
ng sustainable ebenefit of all
78-0-946121-12-
rwick Street d Kingdom
g
energy for the
-0