localized vibrational modes of lithium and · localized vibrational modes of lithium and...
TRANSCRIPT
IC)
n F)
USCEE 304
Final Report
Period from 1 July 1967 - 30 September 1968
LOCALIZED VIBRATIONAL MODES OF LITHIUM AND
LITHIUM-DEFECT PAIRS IN SILICON
Principal Investigator: Wi l l i am G. Spitzer
Sponsored by the
"-.tional Aeronautics and Space Administration Under Grant 05-018-083
(ACCESSION NUMBER)
(CATEGORY)
https://ntrs.nasa.gov/search.jsp?R=19680028256 2020-04-06T03:15:56+00:00Z

USCEE 304
Final Report
Period from 1 July 1967 - 30 September 1968
LOCALIZED VIBRATIONAL MODES OF LITHIUM AND
LITHIUM-DEFECT PAIRS IN SILICON
Principal Investigator: Wi l l i am G. Spitzer
Sponsored by the
National Aeronautics and Space Adrninis tration Under Grant 05-018-083
Departments of Materials Science and Electrical Engineering
Division of Electrical Sciences University of Southern California
L os Angeles , California
TABLEOFCONTENTS
IntrOdUCtioI-f. ......................................................... - I. Localized Vibrational Mode of Lithium Diffused, Undoped Silicon. * 4
C. Localized Modes in Boron-Lithium Doped Silicon' * * 10
D. The Isolated, Interstitial Li Vibrational Mode a * * . . * * * 12
11. Preliminary Experiments in the Infrared Absorption of Electron Irradiated, Lithium Diffused Silicon - e. . . - 0 . . . 16
111. Localided Vibrational Mode Absorption of Lithium and Phosphorus ......................................... Impurities in Germanium. 28
IV. Lithium-Boron Defect Pairs in Si. Ge Alloys - 9 34 1-x x
V. Localized Vibrational Modes of Substitutional Defect Pa i rs in Silicon and Lithium Induced Donor Precipitation- - - - . - 36
............................ 2. Impurity Precipitation Effects. -043 '
VI. Theoretical Calculations of One-and Two-Phonon Optical Absorption ................................ f rom Boron Impurities in Silicon * - 4 7
INTRODUCTION
It is the objective of this report to present a description of the work
carried out between 1 July 1967 and 30 September 1968 under NASA Research
Grant No. 05-018-083. \
There are a number of studies which were pursued under this
contract, and i t w i l l be necessary to divide the main text into several
sections which a r e listed a s follows:
(I) Localized Vibrational Mode of Lithium Diffused, Undoped
Silicon
Preliminary Experiments in the Infrared Absorption of
Electron Irradiated, Lithium Diffused Silicon
Localized Vibrational Mode Absorption of Lithium and
(11)
(111)
Phosphorus Impurities in Germanium
(IV) Lithium-Boron Defect Pairs in Si Ge Alloys 1-x x
(V) Localized Vibrational Modes of Substitutional Defect Pairs
in Silicon and Lithium Induced Donor Precipitation
Theoretical Calculations of One- and Two-Phonon Optical
Absorption from Boron Impurities in Silicon
(VI)
In sOme cases the results of the investigation have been published, and
hence in these cases, the review given here will be quite brief. In those
cases where the results have not been published or do not warrant publica-
tion, more extensive discussions wi l l be given.
attempted to make each section somewhat independent of the others to
In general, w e have
-1-
facilitate readers who may be interested in only one of the topics.
The following personnel were actively engaged in the research
reported here:
Faculty: (1) W i l l i a m G. Spitzer
(2) Maurice H. L. Pryce (summer 1967)
Post Doctoral Research Fellow:
L. Bellomonte (left October 1967)
Students: (1) A. E. Cosand
(2) G. Cumming
( 3 ) J. Kung
Publications and papers presented a t technical meetings which had
their origin in the work to be discussed in this report a r e listed as follows:
1.
2.
3.
4.
Localized Vibrational Modes of Li and P Impurities in Germanium by A. E. Cosand and W. G. Spitzer, Appl. Phys. Letters 11, 279 (1967). -
Localized Vibrational Modes of Defect Pairs in Silicon by V. Tsvetov, W. Allred, and W. G. Spitzer, Oral presentation to Conference on Localized Excitation Phenomena, Univ. of California a t Irvine, September, 1967; Published in Proceedings of Conference on Localized Excitations in Solids, Plenum Press .
Calculation of the Optical Absorption Due to Localized Mode-Lattice Vibration Combination Bands in Bor on-Doped Silic on by L. Bellomonte and M. H. L. Pryce, Oral presentation to Conference on Localized Excitation Phenomena, Univ. of California a t Irvine, September 1967; Published in Proceedings of Conference on Localized Excitation Phenomena, Plenum Press.
Calculation of One- and Two-Phonon Optical Absorption from Boron Impurities in Silicon by L. Bellomonte and M.H. L. Pryce, Proc. Phys. SOC. (London), to be published.
-2-
5. Vibrational Modes of Boron-Lithiurn Doped Silicon-Germanium Alloys by A. E. Cosand and W. G. Spitzer presented a t American Physical Society Meeting, Berkeley, California, March 1968.
-3 -

I. Localized Vibrational Mode of Lihtium Diffused, Undoped Silicon
It w a s one of the f i r s t tasks of the present investigation to deter-
mine whether there is an observable localized vibrational mode due to
isolated interstitial lithium, hereafter called Li.. In short, we were
unable to observe such a localized mode.
inability to observe the mode require some discussion.
desirable to precede this discussion with somewhat more general sections
concerning the nature of localized vibrational mode absorption and appli-
cation to the case for boron-lithium pair defects in silicon.
1
The possible reasons for our
However, i t is
A. Review of Local Mode Concepts
In the subject of infrared lattice absorption we usually deal with
the lattice dynamics of pure semiconductor crystals, and the interaction
between the radiation field and the phonon spectrum of the material.
the present case, however, we a r e interested in the same subject,but the
crystals considered may have large concentrations of defects.
particular interest to consider the influence of the defects on the vibrational
spectrum and the role the defects play in influencing the absorption of
electromagnetic radiation.
dered a r e point defects and they a r e in concentration
atomic concentrations of the host material.
In
It is of
In almost all cases the imperfections consi-
low compared to
It should be clearly understood
that we consider here only defect-induced vibrational absorption.
consider other types of defect-related absorption such a s f r e e ca r r i e r
We do not
absorption and electronic photoexcitation or photoionization of the center.
-4-

Defects can cause very substantial changes in the absorption of a
semiconductor. They can cause homopolar materials such a s silicon to
become absorbing a s a result of single phonon-photon processes which
a r e forbidden in the perfect crystal.
absorption bands to appear a t frequencies well above the maximum phonon
frequency or in the gap between the optical and acoustical parts of the
phonon spectrum of the unperturbed lattice.
processes which occur in this frequency range in the crystal with no defects
a r e those related to interaction between the radiation and two or more
Defects can cause very sharp
. 1
The only lattice absorption
phonons, i. e., multiphonon absorption. If the proper conditions a r e met,
i t is also possible for absorption bands to be introduced within the range
of allowed phonon frequencies.
The subject of defect induced absorption has been extended both
theoretically and experimentally in recent years , and it has given consi-
derable information not only about the vibrational properties of the system
but also about the defects themselves.
The space lattice of the diamond structure is the cubic close packed
(fcc) and the atomic sites associated with each space lattice point (p,q, r )
a r e at (p, q, r) and (p t a/4, q t a /4 , r t a /4 ) where a is the lattice constant.
Thus the crystal structure is one of two interlocking face centered cubic
lattices, and the atoms a r e all tetrahedrally bounded. There is a center of
inversion midway between nearest neighbors. This is the crystal structure
of both Si and Ge.
- 5-

The primitive cell of the face centered cubic lattice is trigonal, and
Thus there a r e 6 branches to the phonon vs. there a re two atoms per cell.
wavevector ( 9 ) curves, 3 of which are optical and 3 acoustical.
the inversion symmetry leads to a degeneracy of the LO (longitudinal optical)
and LA (longitudinal acoustical) branches at the zone edge in the < 100 >
direction.
transverse branches a r e doubly degenerate for the special directions in q space.
1 In Si and Ge,
The degeneracy is lifted in the zincblend structure. Both of the J
A The maximum phonon energy, the LO branch near q = 0 in Fig . I - l a k ,
is generally W < 0. 1 eV for the materials of interest. Therefore, for
processes involving the absorption of a photon with the creation of a phonon,
conservation of energy requires the photon be in the infrared. Conservation
of wave vector means that only phonons near q - 0 can be involved, and the
necessity of coupling between the radiation field and the phonons leads to an
m -
A
interaction only with the TO branches.
moment of the TO mode.
in the 111-V compounds but is symmetry forbidden in Si and Ge.
absorption which accounts for the well-known residual ray behavior of
polar and partially polar crystals and i s often known a s the fundamental
lattice absorption.
The coupling is through the dipole
Thus single-photon-phonon absorption can occur
It i s this
Processes involving the absorption of a photon with the creation of
two or more phonons (multiphonon summation absorption) occurs in Si and
Ge. In this case also the conservation of wave vector applies and means
that the two phonons must have nearly equal and opposite q values (or the 3
.L .I-
Each figure, table and reference in this report is labelled by a Roman
numeral representing the particular section and by an Arabic numeral
representing the sequence within the section.
-6-

same values for difference absorption where one phonon is created and
the photon with another phonon is absorbed). Density of states arguments
Lead to the conclusion that most of the phonons involved are in several
relatively small frequency ranges. These frequencies originate f rom
regions near the zone edges where the phonon branches have small slopes
in q space. 2
Thus the multiphonon absorption is often analyzed in terms
of combinations of a few frequencies which a r e called characteristic f re-
quencies. More sophisticated analysis interprets the changes in slope of
the absorption in terms of two phonon critical points, i. e., regions where
the ovs q of the s u m or difference of two branches has zero slope in q space. -5
The coupling in the multiphonon.case is either via absorption by the
fundamental which then decays into two phonons through anharmonicity in
the potential or through a second order electric moment mechanism. The
f i r s t process requires an optically active fundamental and is therefore
inoperative in Si and Ge.
points the reader is referred to two recent review papers
For a more detailed discussion of all of these
(1-1, 1-2)
The theory of the effect of defects on the normal modes and eigen-
frequencies of a lattice have been discussed extensively by several authors.
The contributions of A. M a r a d ~ d i n ' I - ~ ' 1-5)and R. Elliott (1-6, 1-7,1-8, I-9)are
particularly w e l l known.
Some of the essential features can be introduced from physical
reasoning by considering an isotopic, substitutional defect in a Si lattice.
The isotopic assumption means that the defect atam has a inass M' which
-7-

may differ f rom that of Si but the force constants remain unchanged fram
the Si-Si values. If the defect atom were extremely light compared to Si
then we would expect a mode in which the impurity is vibrating against an
almost stationary lattice.
ing higher than the highest phonon frequency of the unperturbed system u)
In this case the light impurity's high natural resonance frequency w a
makes M' acts as a high frequency driving force on the neighboring lattice.
The lattice is being driven a t a frequency well above its highest unperturbed
This mode would have a frequency w consider- L
. m
- L E
normal mode frequency and thus the amplitude of motion is exponentially
attenuated as a function of distance from MI.
point group symmetry, the potential for small displacements of M ' is that
Since the si te of M ' has Td
of a spherical harmonic oscillator,and thus the high frequency rnode is
triply degenerate. As the mass of M' is increased we expect the local
mode frequency w to decrease and approach w . At the same time the L m
attenuation length should increase. This high frequency mode is often
called a ''localized mode" because of the spatial localization.
B. Absorption in the Defect Lattice
Infrared absorption by vibrations of defects in Si was treated by
(I-6,I-7) Dawber and Elliott for both the local mode and the band modes. The
model used w a s that of a substitutiona1,charged impurity in a homopolar
lattice and the result for the localized mode is
2 2 2 217 De a(w) = I x (011 g(w) nc
-8 -
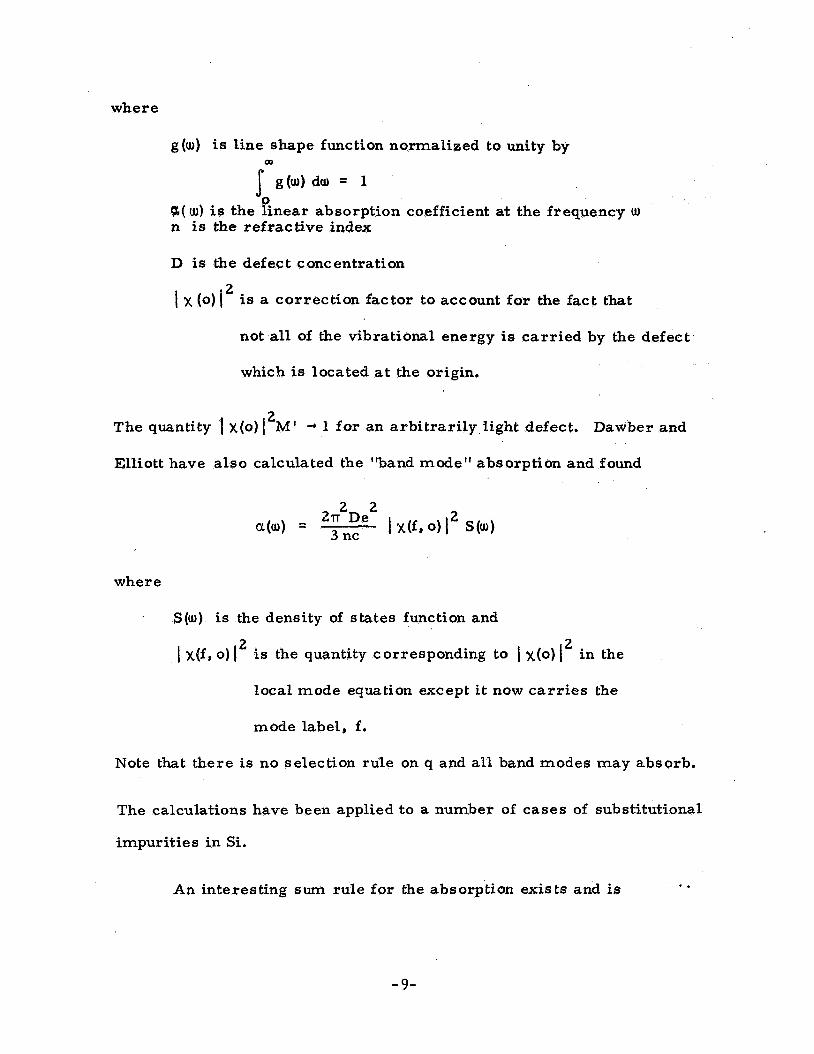
where
g(w) is line shape function normalized to unity by
fg(w) dw = 1 9 a( w) is the linear absorption coefficient at the frequency UI
n is the refractive index
I) is the defect concentration
2 I x (0) I is a correction factor to account for the fact that
not all of the vibrational energy is carried by the
which is located a t the origin.
defect
2 The quantity I x(o)l MI 4 1 for an arbitrari ly light defect. Dawber and
Elliott have also calculated the "band mode" absorption and found
where
S(W) is the density of states function and
2 2 is the quantity corresponding to 1 x(o) 1 1 X(f, 0 ) I in the
local mode equation except i t now car r ies the
mode label, f.
Note that there is no selection rule on q and all band modes may absorb.
The calculations have been applied to a number of cases of substitutional
impurities in Si.
.. An interesting s u m rule for the absorption exists and is
- 9-
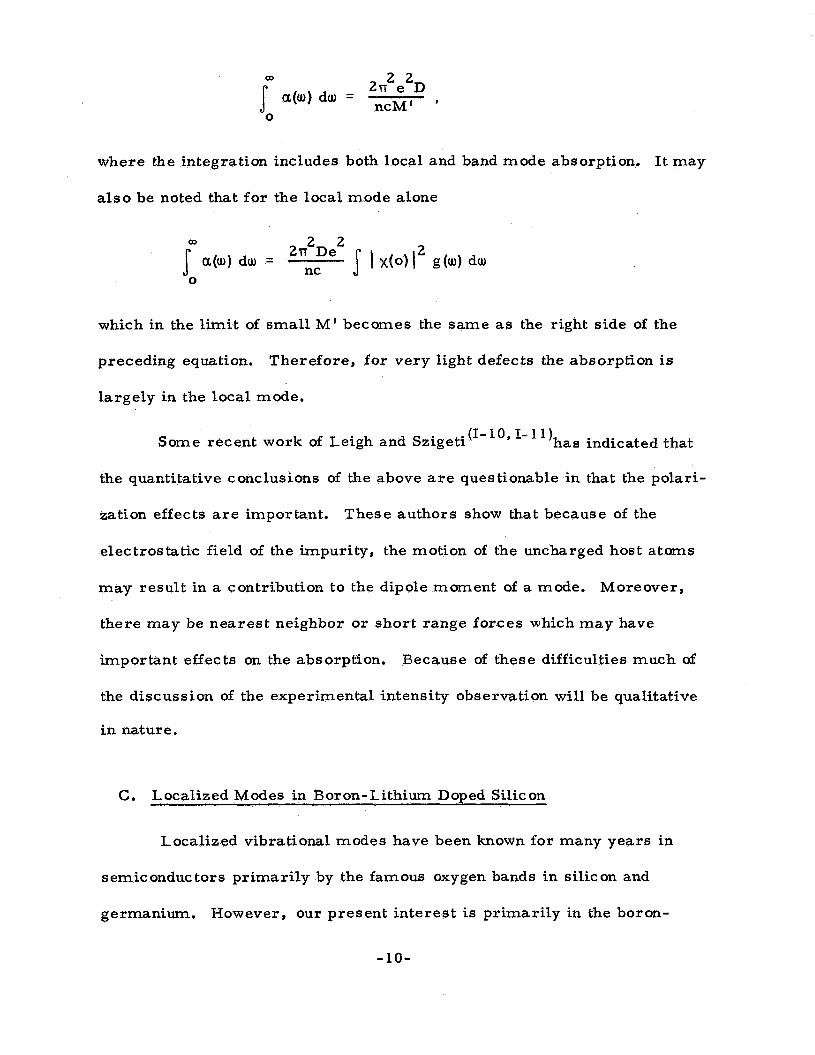
00 2 2 2rr e D ncM' ' 1 a ( w ) dw =
0
where the integration includes both local and band mode absorption. I t may
a l so be noted that for the local mode alone
which in the l imit of small M' becomes the same as the right side of the
preceding equation. Therefore, for very light defects the absorption is
largely in the local mode.
Some recent work of Leigh and Szigeti'I-''' '-'')has indicated that
the quantitative conclusions of the above a r e questionable in that the polari-
zation effects are important.
electrostatic field of the impurity, the motion of the uncharged host atoms
may result in a contribution to the dipole moment of a mode.
there may be nearest neighbor or short range forces which may have
important effects on the absorption. Because of these difficulties much o€
the discussion of the experimental intensity observation will be qualitative
in nature.
These authors show that because of the
Moreover,
C. Localized Modes in Boron-Lithium Doped Silicon
Localized vibrational modes have been known for many years in
semiconductors primarily by the famous oxygen bands in silicon and
germanium. However, our present interest is primarily in the boron-
-10-
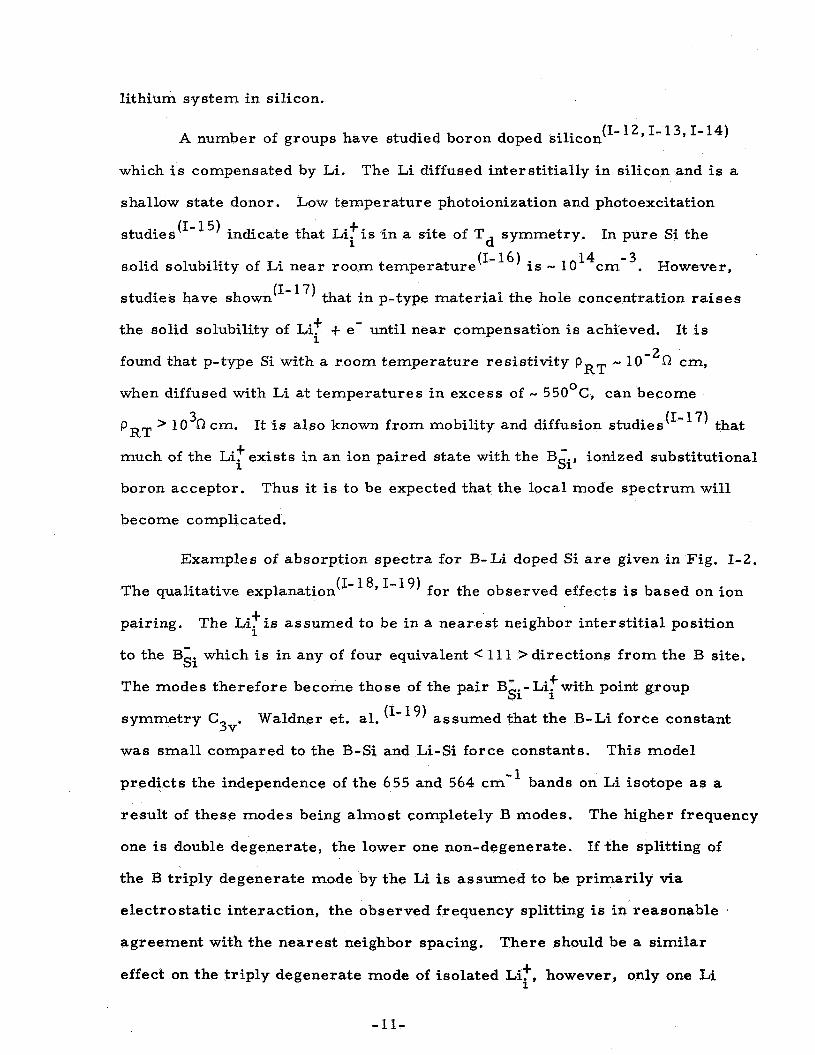
lithium system in silicon.
(1-12,1-13,1-14) A number of groups have studied boron doped silicon
which i s compensated by Li. The Li diffused interstitially in silicon and is a
shallow state donor. Low temperature photoionization and photoexcitation
t indicate that Li. is in a site of T 1 d symmetry. In pure Si the
14 -3 solid solubility of Li near room temperature ( 1 - 1 6 ) i s - 1 ~
studies have shown (I-'') that in p-type material the hole concentration raises
the solid solubility of Lif + e- until near compensation i s achieved. It is
found that p-type Si with a room temperature resistivity p - 10"O cm,
when diffused with Li at temperatures in excess of - 55OoC, can become
pRT > 10 L-2 cm.
t much of the Li. exists in an ion paired state with the Bii, ionized substitutional
boron acceptor,
c m . However,
RT
3 (1-17) fiat It is also known from mobility and diffusion studies
1
Thus it is to be expected that the local mode spectrum will
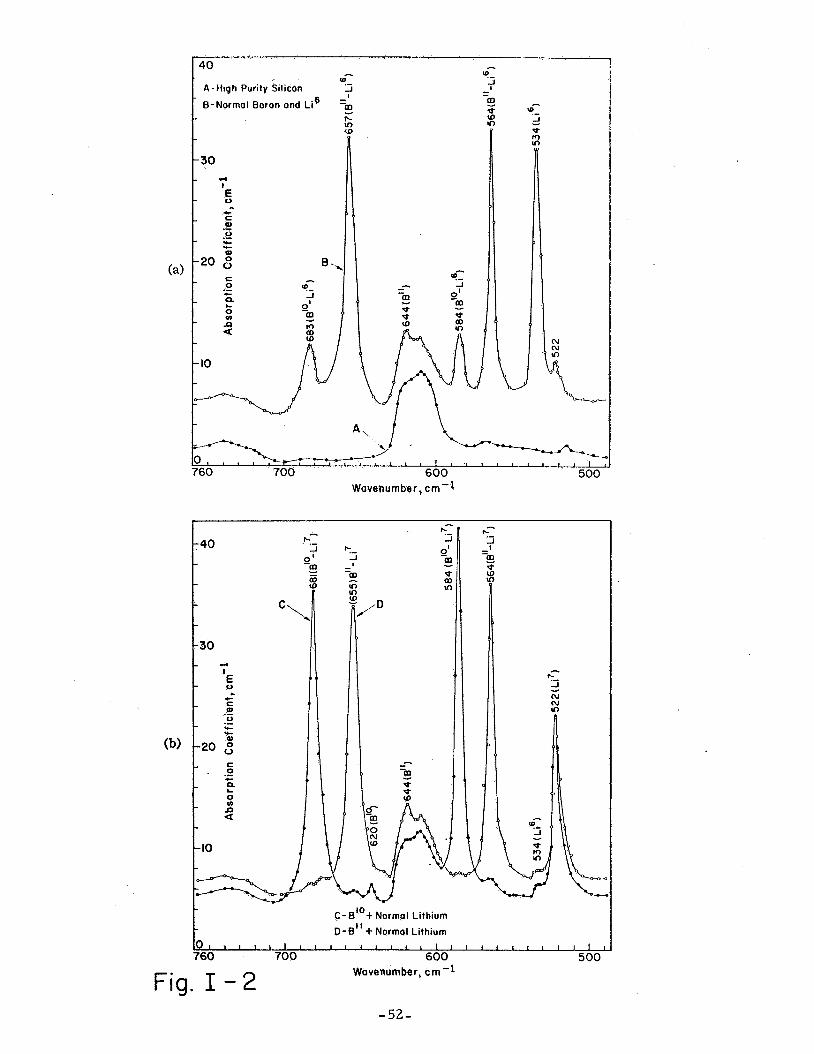
be come complicated . Examples of absorption spectra for B-Li doped Si a r e given in Fig. 1-2.
The qualitative explanation ('="'
pairing.
to the B& which is in any of four equivalent < 11 1 >directions f r o m the B site.
The modes therefore become those of the pair B- -Li. with point group
symmetry C3v. Waldner et. al.
was small compared to the B-Si and Li-Si force constants.
predicts the independence of the 655 and 564 cm" bands on Li isotope as a
result of these modes being almost completely B modes.
one is double degenerate, the lower one non-degenerate.
the B triply degenerate mode by the Li is assumed to be primarily via
electrostatic interaction, the observed frequency splitting is in reasonable
agreement with the nearest neighbor spacing.
effect on the triply degenerate mode of isolated L i t however, only one Li 1'
for the observed effects i s based on ion
t The Li. is assumed to be i n a nearest neighbor interstitial position 1
t Si 1
assumed that the B-Li force constant
This model
The higher frequency
If the splitting of
There should be a similar
- 1 1 -
7 -1 6 mode is observed at 522 cm-l for Li or 534 cm for Li. It is assumed
that this band i s the high frequency member of a pair where the other band
falls below Wmax(q) - 5iO cm-'. Thus a low frequency local mode band will
not be observed.
It has been suggested that the 522 cm-l band may be related to
the presence of L i -0 complex formation. Since the 522 cm'l band occurs
when no other L i -0 o r 0 bands a r e observed in Si, since the band has been
observed in float zone low [ 01 silicon with a strength equal to that in pulled
crystals, and since the band strength is directly proportional to [ B], the
Li- 0 complex explanation i s unlikely.
Elliott and Pfeuty have applied their theory to the B-Li pair case
and conclude that they can make a reasonable f i t the observed spectra if the
force constant for the B-Si bond is lowered along the Li-B direction.
Bellomonte and Pryce have calculated the W L frequency of isolated
interstitial Li a s a preliminary step to the study of the effect of pairs.
find that isolated Li may also have a local mode although it is pointed out
They
that the numerical values obtained in the calculation cannot be regarded a s
very accurate.
D. The Isolated, Interstiaial Li Virbrational Mode
From the preceding discussion it is clear that the interpretation of
the 522 cm-l absorption band is that it is the high frequency, doubly
,degenerate L i t mode for (B&-Lii) defects. Since Wm, the maximum phonon
frequency of the pure silicon, is at - 520 e m
that the isolated L i t will not have a high frequency localized mode.
since the calculations of Bellomonte and Pryce conclude that the Li might
have a local mode, we decided to look carefully in the spectral region f rom
+ 1
-1 , we a r e forced to conclude
However, 1
1

450 cm-l to -800 cm-I.
Since the Lii is a shallow donor it will be nearly fully ionized at room
temperature. With the lithium concentration [Lii ] - ne = 4 x 10 c m 3, the
f ree car r ie r absorption coefficient at W = 500 cm iscl 150 cm" yielding a
f ree car r ie r absorption cross section a/n z 37 x 10 c m . From the
measurements at lower temperatures where the carrier a r e repopulating the
donor levels, the absorption c ross section for donor photoionization is of the
There are several difficulties with this measurement.
t
+ - 17 - -1
17 2 e
same order a s that for f ree car r ie rs .
lower temperatures.
Thus the absorption does not drop at
F rom the (B-Li) pair absorption at (u = 522 cm-' we
2 estimate the local mode cross section to be -'= a(522) = 0.05 1 0 - l ~ ~ ~ . Therefore, the local mode absorption c ross section may be approximately
three orders of magnitude less than that for f ree ca r r i e r s at UJ- 500 cm-'.
While it is true that the frequency dependence of the f ree ca r r i e r absorption
i s of the W -2 form, we have to go near W - 1500 cm-' before the ca r r i e r cross
section drops one order of magnitude.
band will probably be in a region of very high background absorption making
o bs e rvation difficult .
Thus we can see that the local mode
t As indicated previously, our attempts to observe the Lii mode were
not successful.
tions n 5 x 10 ~ m - ~ . Measurements were made with scale expansions
such that aband /a - 5 x 1 O m 3 for a band halfwidth of -4 cm- should have been
observable.
with one doped with arsenic and close to the same ne.
band in the Li doped sample was observed.
no evidence from these measurements for the existence of the isolated Li.
vibrational mode.
Samples were diffused with lithium to yield ca r r i e r concentra-
17 e 5
Measurements were also made comparing a Li doped sample
Again, no absorption
W e must conclude that there is
t 1
A disappointing but not unexpected result.
-13-
REFERENCES
1-1. W. G, Spitzer, Semiconductor and Semimetals, Vol. 3, (Edited by R. K. Willardson and A. C. Beer, Academic Press, New York, 1967), p. 17.
1-2. F. A. Johnson, Progress in Semiconductors, Vol. 9, (Pergamon Press, Oxford, 196 5).
1-3. A. A. Maradudin, Solid State Physics, Vol. 18 (Edited by F. Seitz and D. Turnbull, Academic Press, New York, 1966).
1-4. A. A. Maradudin, Solid State Physics, Vol. 19 (Edited by F. Seitz and D. Turnbull, Academic Press, New York, 1967).
1-5. A. A. Maradudin, E. W. Montroll, G. H. Weise , Solid State Physics, Suppl. 3 {Edited by F. Seitz and D. Turnbull, Academic Press, New York, 1963).
1-6. P. G. Dawber and R. J. Elliott, Proc. Phys. SOC. - 81, 453 (1963).
1-7. P. G. Dawber and R. J. Elliott, Proc. Roy. SOC. - 273, 222 (1963).
1-8. R. J. Elliott, Lectures on Defects i n Solids, Lectures at Argonne National Laboratory; available as ANL-7237 f rom Clearinghouse for Federal Scientific and Technical Information NBS, U. S. Department of Commerce, Springfield, Virginia.
1-9. R. J. Elliott and P. Pfeuty, J. Phys. Chem. Sol. - 28, 1627 (1967).
1-10. R. Marshall and S. S. Mitra, Phys. Rev. - 134, A1019 (1964).
€-11. R. S. Leighand B. Szigeti, Proc. Roy. SOC. A301, 211 (1967).
1-12. J. W. Corbett, G. D. Watkins, and R. S. McDonald, J. Phys. Chem. Sol. 25, 873 (1964). -
1-13, W. Kaiser and C. D. Thurmond, J. Appl. Phys. 30, 427 (1959). - 1-14. W. Nazareiwicz and M. Balkanski, J. Phys. Chem. Sol. 25, 437 (1964). - 1-15. J. F. Angress, A. R. Goodwin, and S.D. Smith, Proc. Roy. SOC.
A287, 64 (1965). - 1-16, W. 6. Spitzer and M. Waldner, J. Appl. Phys. 36, 2450 (1965).
1-17. For references see M. Hass, Semiconductors and Semimetals, Vol. 3
-
(Academic Press, New York, 1967).
1-18. R. M. Chrenko, R. S. McDonald, and E. M. Pell, Phys. Rev. 138, - ~ 1 7 7 5 (1965).
1-19. R. L. Aggarwal, P. Fisher, V. Mourzine, A. K. Ramdas, Phys. Rev. 118. A882 (1965).
- 14-

1-20. L. Bellomonte and M. H. L. Pryce, Proc. n y s . Soc. 89, 967 (1966).
1-21.
- L. BelIomonte and M.H. L. Pryce, Proc. PhYS. 8 9 - 9 973 f1966).
- 15-
11. Preliminary Experiments in the Infrared Absorption of Electron
Irradiated, Lithium Diffused Silicon
A. Introduction
The previous section described the difficulties in the attempts to
t measure the isolated Li. mode.
preliminary attempts to observe the localized modes of Li. paired with
either a vacancy or a divacancy.
with Li, electron irradiated, and then taken through isochronal anneals
between room temperature and 600 C.
The present section describes s o m e 1
t 1
For this reason samples were diffused
0 These experiments a r e similar to
a more extensive set of measurements reported by Prof. John C. Corelli
in NASA Grant NGR-33-018-090, Progress Report:
March 1968. However, as we were in contact with Prof. Corelli and
because the requirements of our experiments a r e somewhat different,
15 June 1967 to 15
the experimental conditions a r e not the same as those employed by him.
Reasonably pure, low oxygen content silicon w a s diffused with Li
t under conditions to obtain the maximum [Li. 1 we could produce. However,
under these conditions, the [ L i l >> [ Lii 1. Some samples were irradiated
by 1.8 Mev electrons with a fluence of 1-2 x 10l8 e / c m and these samples
were compared with the unirradiated ones.
enhance the probability of (Li
1
t
2
t The large [ Li. ] w a s used to
1 t
forma ti on, i - 'Si'pair
While the experimental details wi l l be discussed shortly, the
principal results may be listed as follows:
- 16-

19 -3 I ) For the samples of CLi3 10 cm , there is a large
tail on the absorption edge. The origin of this tail is
probably scattering fram precipitated Li.
2) The low frequency absorption which is presumably due to
f ree ca r r i e r s , decreases with increasing anneal tempera-
ture up to -200 -300 C , then increases with higher anneal: 0 0
temperature.
most free car r ie r absorption.
tatively explicable in terms of the temperature dependencies
Long t e r m anneal (24 hours) at 6OO0C removes
This behavior is qua'fi-
of the solid solubility and diffisuion constant for Li. The
arguments do not depend in any essential way upon the
irradiation produced defects . 3 ) After annealing a t -45OoC, both the irradiated and
unirradiated samples had a strong broad absorption band
which peaks near 21.1, close to but not the same as the 1.8 1.1
divacancy band. The band anneals out by 6OO0C and is
present only in the samples of high [ Li] . this band is not understood.
The origin of
4) NO (d- v absorption band w a s observed. However,
a s a result of these measurements, experiments can be
proposed which should enhance the prospects of observing
such a band,
I Si pair
-I 7-

B. Experimental Method
The silicon used in this study was ordered f rom Wacker Chem. Co. It is
floating zone ( F Z ) silicon (low oxygen content) with resistivity greater than 10
ohm-cm.
by a diamond saw, and those wafers were further cut into 7mm x 15mm x 1.5mm
pieces by a wire saw.
The 2cm diameter silicon ingot was sliced into 1. 5mm thick wafers
The diffusion of lithium (Li) into silicon was conducted in two steps. First
was to alloy lithium on the surface.
surface of sample and then heated in an inert gas until it formed an alloy layer.
Lithium mineral oi l paste was painted on the
The second step was to diffuse the lithium into the sample.
was preheated to 1000°C and flushed with inert gas.
A vertical furnace
The alloyed sample was
burried with silicon carbide powder in a tantalum boat.
sample were heated in the furnace a t 1000°C for a desired period of time (- h r s )
The container and
and then quenched by dropping into mineral oil.
Four of our samples treated in the above manner were electron irradiated. *
Irradiation was done by a 1.8 Mev Van de Graaff a t Aerospace Corporation.
The sample temperature was maintained at 100°K by contact with a liquid nitrogen
bath. The radiation rate was -1. 1 x 10 electron/sec -cm . The total dosage
was- 1-2x 10l8 electron/cm2. These samples a r e called 1R. 2R. 3R and 4R.
14 3
All the annealing steps for both irradiated and unirradiated samples were
done in an iner t gas unless otherwise specified.
sample surface sometimes gets a stained appearance, especially when annealed
at higher temperatures.
silk $0 repolish the surface.
Even in the inert gas, the
In this case, we used Linde 0.3A Micron Abrasive on
Two Perkin-Elmer infrared grating spectrometers were used to measure
the absorption spectra; the Model 210 and Model 301.
was held in a metal dewar with CsI windows.
With Model 210 the sample
When measured with Model 301
the sample was fastened on a sample holder plate; sometimes a beam condenser
* W e thank Dr. E. J. Stoffel and Mr. L. Rachal for letting us use the radiation facilities.
-18-
was employed when the sample has been broken and:.thus reduced in size.
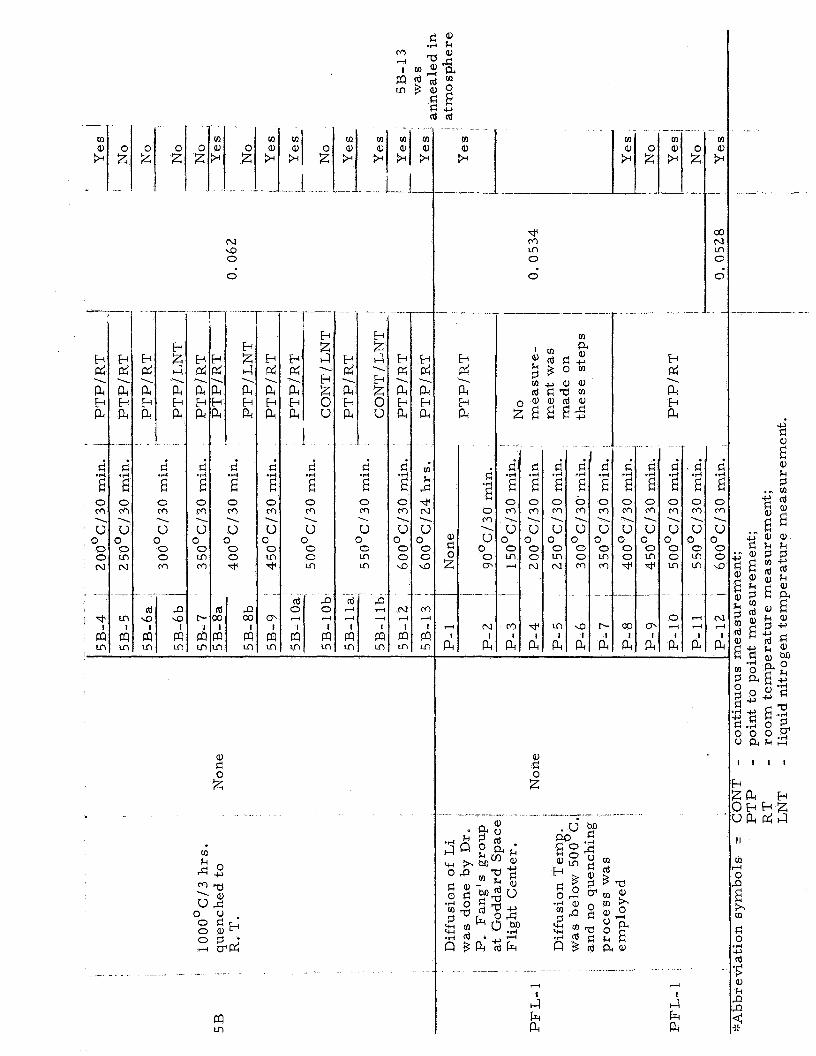
condition of measurements and annealing procedures a r e listed in Table 11- 1.
The
c. Results and Discussion
The results a r e plotted in Fig. 11-1 through Fig. 11-8. Al l curves in these
figures a r e specified by the same coding as in the "RUN" column in Table 11- 1.
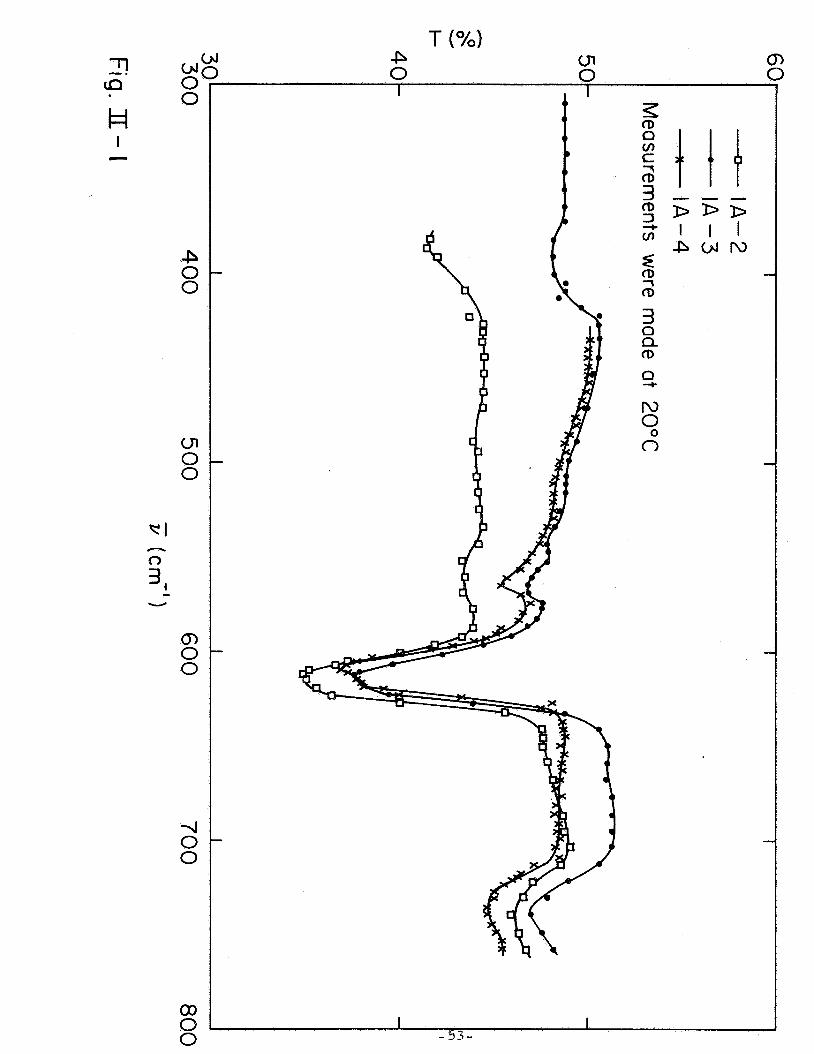
Fig . 11-1 shows the transmission spectra in the long wave length region of an
unirradiated sample.
irradiated samples, 1R and 2R respectively.
at liquid nitrogen temperature.
Fig. 11-3 were measured a t 20°C except the unannealed one which was measured
at liquid nitrogen temperature.
the figures a s they showed nearly the same behavior a s ZR.
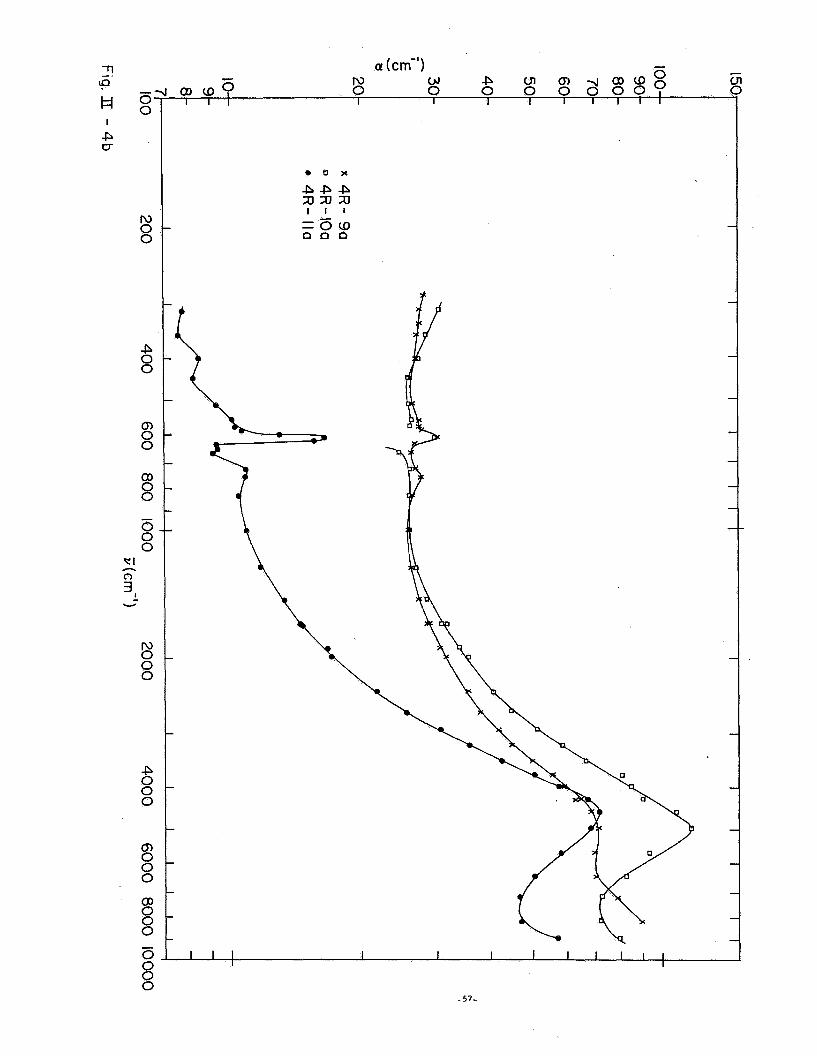
F i g , 11-4 b show the room temperature absorption spectra at different annealing
stages of irradiated sample 4R. Liquid nitrogen measurements of sample 4R at
the same annealing stages showed no distinct difference compared with the
general. behavior of the room temperature measurements.
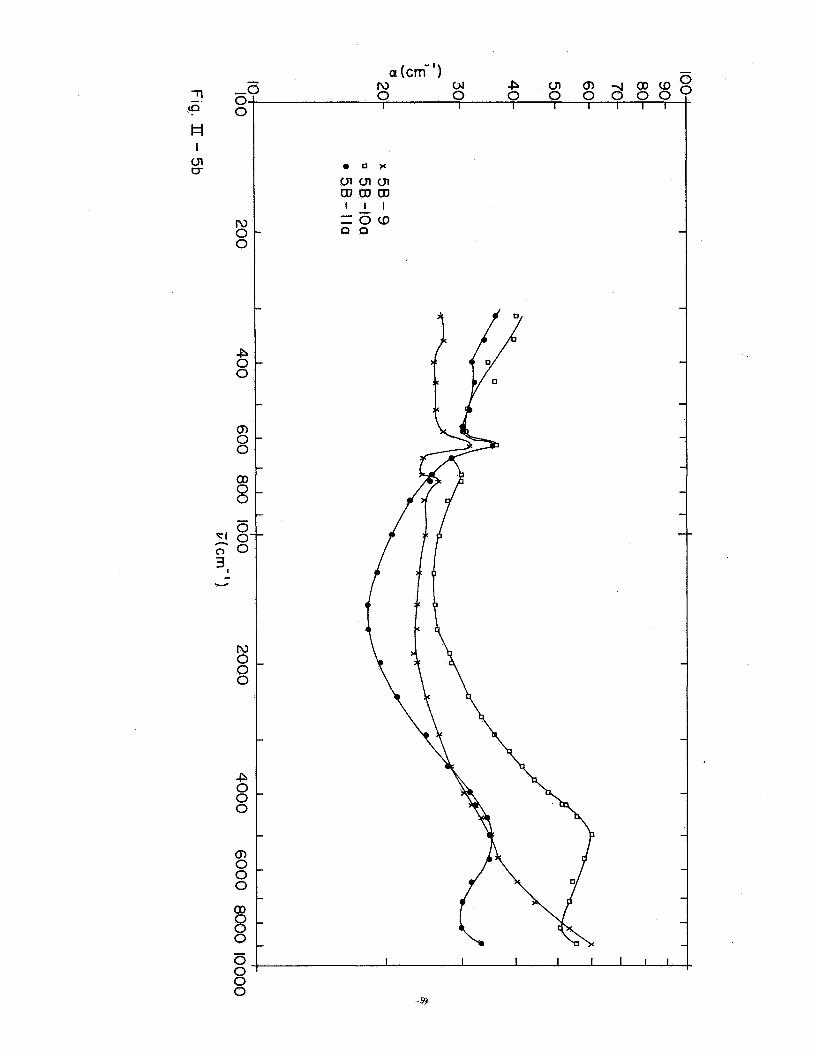
absorption spectra of an unirradiated sample 5B a r e shown in F ig . II-5a and
Fig. 11-5b.
measurements a r e not shown in this report.
Fig. II-2 and Fig. 11-3 show the transmission spectra of two
Nate that sample IR was measured
Most of the curves for sample 2R shown in
Measurements of sample 3R a r e not shown in
F ig . II-4a and
The room temperature
For the same reason a s in sample 4R, the results of liquid nitrogen
Fig. 11-6 shows the transmission
spectra of sample PFL-1. The preparation of these samples will be stated later.
All the samples except PFL-1 showed a reverse annealing phenomenon at
around 200° - 30OoC.
samples. (Fig. 11-1 through Fig . II-5b). The PFL-1 sample was cut f rom the
same ingot as the other samples but lithium diffused at Goddard Space Flight
Center by Dr. Paul Fang's group*.
This can be seen on both irradiated and unirradiated
The diffusion temperature was low ( - 50OoC)
and no fast quenching was employed. All the other samples were diffused at our
*We thank Mr. W a l t e r Wappous for preparing the sample for us.
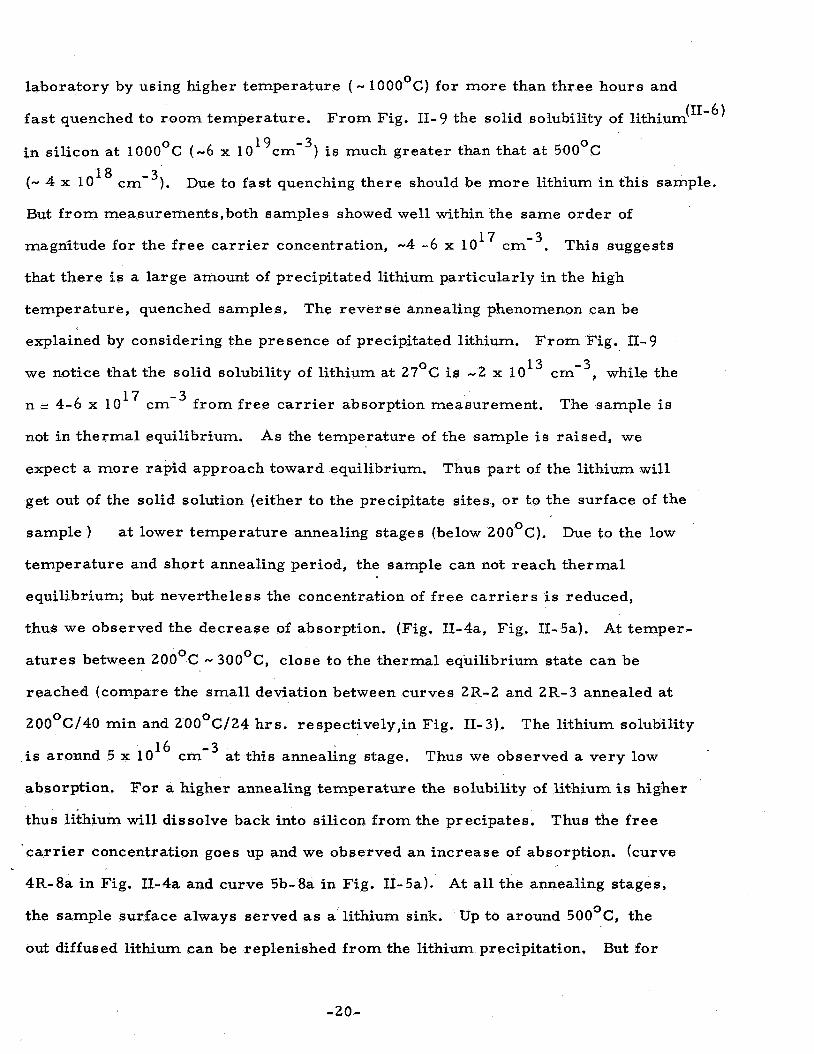
laboratory by using higher temperature
fast quenched to room temperature.
- 1000°C) for more than three hours and
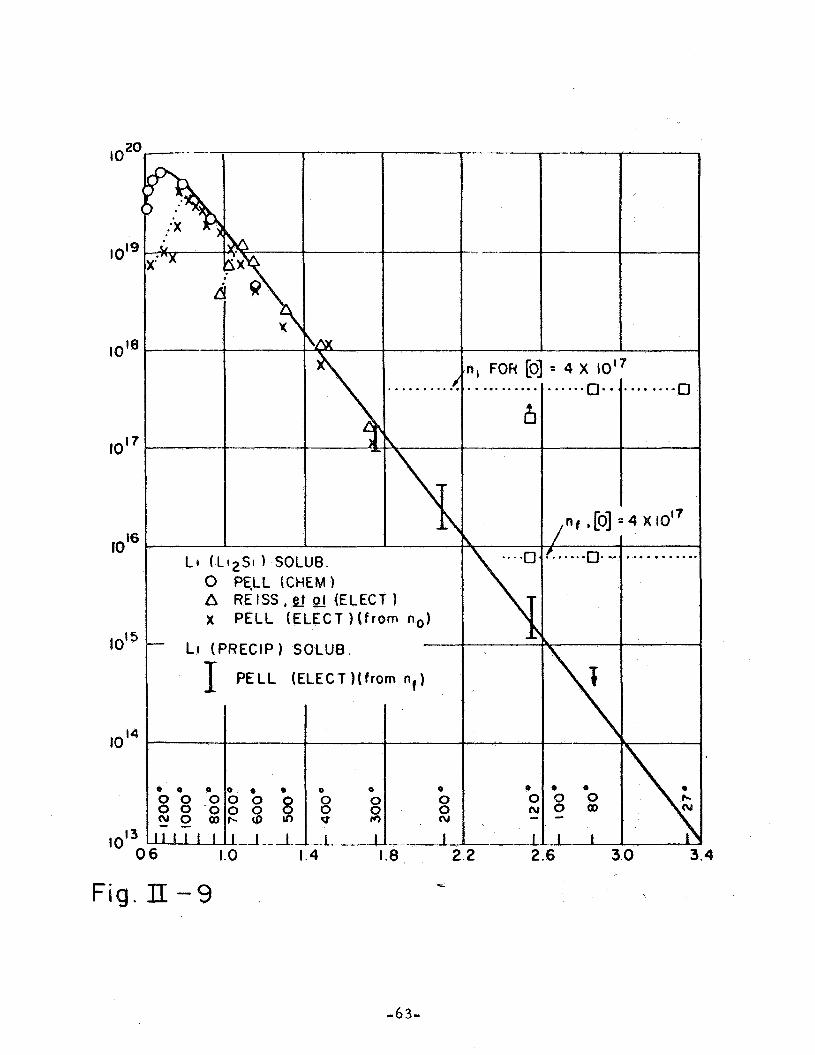
(11-6) F rom Fig. 11-9 the solid solubility of lithium
i n silicon at 1000°C (-6 x 1019cm-3) i s much greater than that at 5OO0C
(- 4 x 10 18 - cm '). Due to fast quenching there should be more lithium in this sample.
But f rom measurements,both samples showed well within the same order of
magnitude for the free car r ie r concentration, -4 -6 x 10 cm . This suggests
that there is a large amount of precipitated lithium particularly in the high
temperature, quenched samples. The reverse annealing phenomenon can be
17 -3
explained by considering the presence of precipitated lithium.
we notice that the solid solubility of lithium at 27OC is -2 x 10
n = 4-6 x 10 cm f r o m free car r ie r absorption measurement. The sample is
F r o m Fig . 11- 9 13 -3 cm , while the
17 -3
not in thermal equilibrium.
expect a more rapid approach toward equilibrium.
get out of the solid solution (either to the precipitate sites, or to the surface of the
sample)
As the temperature of the sample i s raised, we
Thus part of the lithium will
0 a t lower temperature annealing stages (below 200 C). Due to the low
temperature and short annealing period, the sample can not reach thermal
equilibrium; but nevertheless the concentration of f ree ca r r i e r s is reduced,
thus we observed the decrease of absorption. (Fig. II-4aY Fig. 11-5a). At temper-
atures between 2OO0C - 30O0C, close to the thermal equilibrium state can be
reached (compare the small deviation between curves 2R-2 and 2R-3 annealed at
20OoC/40 min and 2OO0C/24 hrs. respectively,in Fig. 11-3).
i s aronnd 5 x 10
absorption.
thus lithium will dissolve back into silicon from the precipates.
The lithium solubility 16 -3 cm at this annealing stage. Thus we observed a very low
For a higher annealing temperature the solubility of lithium is higher
Thus the f ree
' c a r r i e r concentration goes up and we observed an increase of absorption. (curve
4R-8a in Fig. 11-4a and curve 5b-8a in Fig. 11-5a).
the sample surface always served as a lithium sink.
out diffused lithium can be replenished f rom the lithium precipitation.
At all the annealing stages,
Up to around 5OO0C, the
But for
-20-

higher temperature annealing (5 55OoC), the solubility of lithium is very high
(> 6 x 10 18 ~ m - ~ ) , all the lithium precipitation may be used up, but the out
diffusion process will not stop. As a result, the lithium concentration will again
decline, thus a decrease of absorption is observed. (Fig. II-4b, curve 4R- 1 l a ,
Fig. II-5b, curve 5b- 1 la). When annealed at 6OO0C for 24 hours, most of the
lithium will be out diffused, thus the sample was nearly transparent. (Fig. 11-8).
During the annealing process some of the curves showed very little frequency
dependence of the absorption at low frequency.
ascribed to intraband f ree ca r r i e r transitions, it is recognized that the predicted
f ree car r ie r absorptionwVP (where 1 .5 < p - 3) is not observed.
While this absorption is tentatively
- <
(For instance
curves 5b-la, 5b-9 i n F ig . 11-5b). Further investigation i s necessary here.
We also observed an absorption band near 2 . 0 I-t after the 45OoC/30 min.
annealing. The band remained during the next two annealing stages, namely
50OoC/30 min and 55OoC/30 min.
annealing (Fig. 11-8).
It disappeared completely after 6OO0C/24 hour
We observed this band on both the electron irradiated
sample 4R(Fig. 11-4b) and the unirradiated sample 5b (Fig. 11-5b). Sample PFL-1
also went through the same annealing steps as did on the 5b and 4R, but without
showing any absorption band near 2.0 I-t . (Fig, 11-6).
A 1.8 I-t absorption band is well known as an electronic transition in irradiated
attributed this band to divacancy (II- l , I I -2 , II- 3,II-4, II- 7) Cheng et al silicon.
absorption. All the observations indicated in the reference were made on non-
lithium diffused silicon and the 1. 8 c1 absorption band annealed completely between
100°C to 2OO0C for neutron irradiated sample o r at a temperature below 35OoC for
electron irradiated sample To our knowledge, no one has ever observed
a 1.8 I-1 band in non-irradiated silicon.
A quantitative measurement of the 2.0 I-1 absorption band is difficult because
In the electron irradiated sample the the high frequency dependent background.
background is in itself due to a radiation produced band which was called "the
absorption edge band" by Fan and Ramdas In a lithium precipitated silicon
-21-

sample the background appears to follow an - A m 2 relationship. Similar behavior
was observed in neutron-irradiated GaAs . Calculation of the infrared
absorption for a distribution of small metallic inhomogeneities in an otherwise
uniform nonmetallic crystal was carr ied out and obtained excellent agreement
with the X - 2 region of neutron irradiated GaAs. For the above reason, only a
(11- 5)
qualitative analysis of the 2.0 p band is possible.
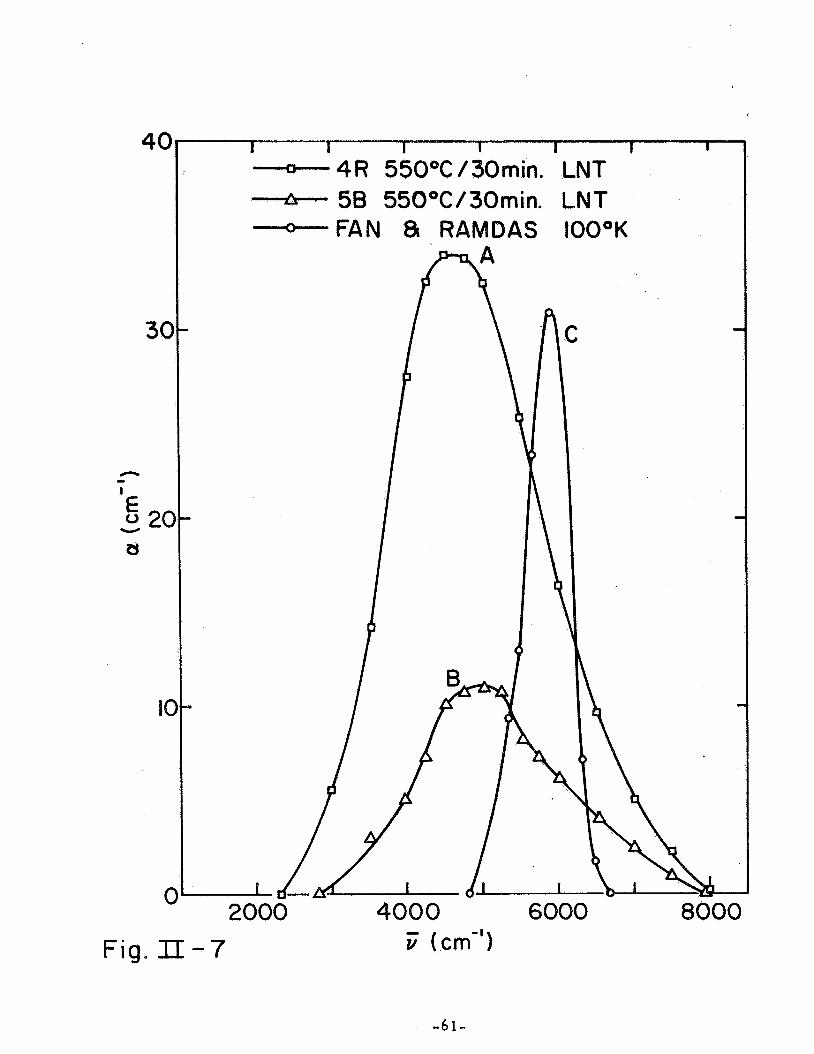
Three absorption bands with background substracted a r e plotted in Fig. 11-7.
They were f rom measurements (c.f. Table 11-1) 4R- l lb (as curve A), 5B-l lb
(as curve b),and f rom the paper by Fan and Ramdas (11-3)(as curve c), respectively.
F rom Fig. 11-7, we notice that curves A and B a r e shifted to the lower wave number
side of the spectrum and a r e f a r broader than curve C. A comparison between
curves A and B shows that they have the same width and centered at about the
same frequency. The only difference is that curve A is higher (i. e. , more
absorption) than curve B. At present time, it i s not clear yet whether the
irradiation made the absorption of curve A larger. Further investigation is
needed.
F ig . 11-8 shows the transmission spectra of both irradiated sample 4R and
unirradiated sample 5B after 60OoC annealing. The 2.0 p band disappeared after
a 60OoC/30 min. annealing on sample 4R, but a heavy free car r ie r absorption in
the long wave length region was observed, (Fig. 11-8, curve 4R-12a). Sample 5b
also showed a similar heavy free car r ie r absorption after a 600°/30 min annealing,
i n addition a very small absorption band near 2.0 p was observed,
curve 5B- 12).
on both samples, the results showed that both of them were nearly transparent.
(Fig. 11-8, curves 4R-13, 5B-13).
(Fig. 11-8,
A prolonged annealing (24 hrs . ) at 60OoC in atmosphere was made
F rom the contrast showed in Fig. 11-7 together with the low temperature
( compare to 45OOC) annealing out effect of the divacancy associated 1.8 p band,
it is suggested that the 2.0 p band we observe may be due to divacancy lithium
-22-
complex and is probably a new band. The suggested explanation may be stated a s
follows: The high annealing temperatures of the suggested t r imer , the divacancy +Lii + , , .
as compared to the divacancy (4OO0C vs - 350OC) could a r i s e f rom the contribution
of the pairing energy’ between the divacancy and the Li. to the free energy.
source of divacancies could be f rom either (Li!-vacancy) which a r e not
+ The 1
1
observed or f rom the regions near the precipitated Li. Further investigation and
detail calculation a r e necessary to verify this.
-23-

REFERENCES
11-1. Becker, Fan and Lork-Horovitz, Phys. Rev. - 85, 730(A) (1952).
11-2. M. Nisenoff (unpublished measurement).
11-3. H. Y. Fanand A. K. Ramdas, JAP 7 30, No. 8, 1127 (1959).
11-4. L. J. Cheng, J. C. Corelli, J. W. Corbett, and G. D. Watkins, Phys. Rev. - 152, 761, (1966).
11-5. L. W. Aukerman, Semiconductors and Semimetals, Vol. 4., p. 401.
11-6. E. M. Pell, Solid State Physics in Electronics and Telecommunications, Vol. 1, Part 1, p. 263.
11-7. H. Y. Fan and A. K, Ramdas, J. Phys, Chem. Solids 8, 272 (1959).
11-8. J. C. Corelli, Progress Report, Covering Period f rom 15 June 1967
-
to 15 March 1968, Sponsored by NASA, Under Grant NGR-33-018-090.
-24-

z m a,
3.1
m
; z "
-- .
I -__ . ... . .. __
. ..
. . . . __ . - . .. I
m Q)
3.1
. _
m a, *
m a,
3.1 z
N m 0 N 0
0
\D In In m 0
d
co 0 0
F In
;" 0
b -+ 0
0 0 0
I3 d ' 2
E '
0 u
I3 d Pi I3 PI
\
\
n 4 -I -I
3 . 1 3 3 I
r d _1
I
d -E Ln rr, ' u 0 0 0 9
Ln
2 d
. .
E V
d d
rn rd
2 cd m
d 4
m rd
2 rd m
d m
m
d 4
m rd
2 rd m
d 4
m d '
. - . .. . . -
d w 4
4 d 4
d N

d 'E' 0 m -. u 0 0 0 N
rd y
1- 1 , d *
d -2 0 m --. u 0 0 m (u
P l d $ A A P
d + m
d + * .7
. I
N a 0
0 0
i - -i
d 4
I
m a
I=" LZ
rn k
m --. s
u 3 0 0 0 4
d 4
rn rd
... .- . . .
d 4
rn ld
. . .. .. - . .- - . - __ . . . .. .
z"
2 m 0
0
N 9 0
0
-- , I - - ---I -
F .I-
E C rr -r
c 3 C Lf rr
-
r
P I
d 3
0 n ..
0 m
0 n u
0 0 m
C
m
cc d
0-
d
~ ___I- - __ - . .- . .
4
ci . .. . -
Fr PI a
m
I11 D Localized Vibrational Mode Absorption of Lithium and Phosphorus
Impurities in Germanium
Localized vibrational modes of light impurities in a crystal lattice
have been observed by infrared absorption measurements in a large group
of c rys tals including s everal s emic onduc tor s . studied a r e Si, GaAs, GaSb, InSb, CdS, ZnSe . fore , that in Ge no absorption via localized modes had been reported.
mater ia l is of particular interest since i t i s one of the more promising
Among the s emic onduc tor s
is surprising, there- (111- lit
This
cases where comparison between detailed theoretical calculations and
experiment might be made. The only reported fundamental mode transition
An = 1, €or an impurity in G e is the recent Raman work of Feldman, et al.,
(111- 2 for Si-doped Ge . kn the present work we report infrared absorption
measurements of both Li and P high-frequency localized modes in Ge.
Because the impurities used in this study are shallow-state electrical
dopants, i t is necessary to electrically compensate the sample for the
-1(III-3) absorption coefficient a - 2 cm . In Ge (single doped to that level we
anticipate a similar absorption band strength), however, a (free ca r r i e r )
is of the order of 10 to 10 cm in the spectral range of interest,
v -300 to 1000 cm . 2 4 -1
- 1
The compensation of p-type, B-doped Si by L i diffusion to a point
20 where a (local modes) > (free ca r r i e r s ) is successful for p ? 5 x 10
18 - 3 cm -3(111;4)However, in G e for p N > 10 cm the Li compensation is not
sufficient to meet the above condition for CI.
- 2 8 -
Thus, for Ge, double doping and a method of c r y s b l growth that
gives good homogeneity of doping a r e required. Samples were therefore
grown by the Czochralski method in a < 311 > direction.
Ga a r e a suitable pair of dopants; they have similar segregation coefficients
and high so€ubilities.
Phosphorus and
Only the P is expected to give r i s e to a localized
mode with vL > vl, where v
phonon frequencies, respectively.
and v a r e the local mode and highest unperturbed L 1
The initial material was grown with G a p as the dopant so that in the
18 -3 crystal [PI c [ G a l = 3-4 X 10 cm . I t w a s a p-type with p = 20-40 x
N
$2-cm. The material w a s compensated by di€fusing lithium fr& a
0 surface alloy layer a t 500-550 C for 15-2 5 hr. and then quenching to room
temperature within a few seconds to avoid precipitating the tithiun. (III- 5)
The best samples were uniformly n-type immediately after quenching but
became high resistivity p-type after a few hours to a few days a t roam
temperature. They were then stored in liquid nitrogen to prevent further
change.
polishing. In none of the samples w a s it possible to entirely get rid of
all background abs orp ti on.
Care was taken not to heat the samples during grinding and
-1 -1 In the spectral region from 270 cm to 510 cm four absorption
bands not present in high-purity Ge a r e found in Li-compensated G a and
-1 P-doped G e a t 80°K (sample 1, Fig.111-l).Two of the bands, a t 356 crn
and 380 crn-l, change frequency to 379 cm-', and 405 em
, -1 6 if Li is used
7 instead of natural Li (93% Li). These two bands also appear a t the same
-2 9-
frequency in Ga-doped Ge which has been nearly compensated with As and
Sb and then diffused wi th L i (samples 2 and 3 , Fig. 111-1); the two bands in
the Ga- and P-doped material a t 343 and 350 cm -1
which do not show a
Li isotope shift do not appear in this material.
The presence of two Li bands implies that the interstitial Li is in
a paired configuration, probably as Li-Ga pairs. The stronger band
should then correspond to a doubly degenerate transverse mode and the
weaker band to a singly degenerate axial mode.
pairs in Si
The model used for B-Li
(III- 6 h , t a t of completely localized B and Li vibrations interacting
with a simple Coulomb field, predicts the doubly degenerate vibrations to
be the higher frequency ones.
this model but only one Li mode with v
In Si, the B vibrations qualitatively fitted
close to v w a s observed. In the L 1
present case, although vL values for both Li modes > v the vL (doubly 1' degenerate) < vL (singly degenerate) and the splitting Av is much smaller L
than that predicted by the Coulomb model.
It is not obvious that there should be two P bands as there is only
one abundant P isotope. Another specimen w a s prepared with about twice
the doping level of the f i rs t P- and Ga-doped specimen. The larger band
- 1 -1 - 1 a t 343 cm
the smaller band a t 351 cm
a = 16 cm
almost doubled in strength from a = 23 cm to 3 9 cm while '
to -1 -1
more than tripled from a = 5 cm
-1 (measured in terms of peak absorption strength).
A possible model is that the stronger band is attributed to the
triply degenerate mode of isolated substitutional P and the weaker one is
- 30-
due to P - G a pairs. It is not unreasonable that only a single additonal band
be seen from pairs.
ve observed pairing of B with P, As, and Sb (111-g Tsvetov, et al.
in silicon; in each case two additional bands were observed, but in one case,
B-P pairs, one of the bands appeared only as a small shoulder on the band
due to isolated B while the other band w a s split off by a substantial amount.
If the observed additional band in Ge were the doubly degenerate (and thus
stronger) band, a weaker band could well be hidden under the isolated P
band.
Elliott and Pfeuty(lll-c?idlculated the frequencies of local modes of B
in Si paired with an impurity of arbi t rary mass.
slightly lighter than the host lattice, the situation analogous to P-Ga pairs
in Ge, their calculation predicts, for changed mass only with no change in
force constants, that the doubly degenerate local mode is a t very nearly
the same frequency as is that of the isolated lighter impurity of the pair,
and the singly degenerate mode is raised in frequency.
with the experimental results in Si show that force constant changes are not
negligible; in the case of B-As pairs in Si the doubly degenerate band is
predicted to be a t a higher frequency but the stronger of the two bands
observed is the lower frequency one.
Fo r the a rb i t ra ry impurity
However, camparison
*
The phonon spectra for Ce and Si are sufficiently similar when
normalized to the same maximum frequency that the calculation by Dawber
and Elliott('?foo)r the frequency of local modes in Si should apply reasonably
-31-
to Ge.
frequency to be 1.27 V1 while the obseraed frequency of 343 cm-l is only about
1.14 V1.
For P in Ge their isotpic substitution model predicts the local mode
Also, here, the isotopic substitution is not an adequate model and
changes in force constants a r e required to describe the situation.
The authors thank Worth Allred for advice and assistance i n the growth
of the crystals used.
-32-
REFERENCES
111-1. For example, see 0. G. Lorimor and W. G. Spitzer, J. Appl. Phys. - 38, 3008 (1967);.S. Ibuki, H. Komiya, A.Mitsuishi, A. Manabe, and H. Yoshinaga, Proc. Int. Conf. of the 11-VI Semiconducting Compounds, Brown University, 1967; M. Balkanski and M. Nazarewicz, J. Phys. Chem. Solids, - 25, 437 (1964).
- 17, 1209 (1966). 111-2. D. W. Feldman, M. Ashken, and J. H. Parker, Phys. Rev. Letters
111-3. W. G. Spitzer and M. Waldner, J. Appl. Phys. 36, 2450 (1965).
111-4. Unpublished work of one of the authors, A. Cosand.
-
111-5. H. Reiss, C. S. Fuller, and F, J. Morin, Bell System Tech. J., _I 35, 535 (1956).
111-6. M. Waldner, M. A. Hiller, and W. G. Spitzer, Phys. Rev. 140, A172, (1965).
V. Tsvetov, W. Allred, and W. G. Spitzer, Proc. Int. conf. on Localized Excitations in Solids, Irvine (Plenum Press, New York, 1968);
-
111-7.
V. Tsvetov, W. Allred and W. G. Spitzer, Appl. Phys. Letters 10, - 326 (1967).
111-8. R. J. Elliott and P. Pfeuty, J. Phys. Chem. Solids, 28 , 1627 (1967). - 111-9. P. G. Dawber andR. J. Elliott, Proc. Phys. Soc. 81, 453 (1963). -
-33-
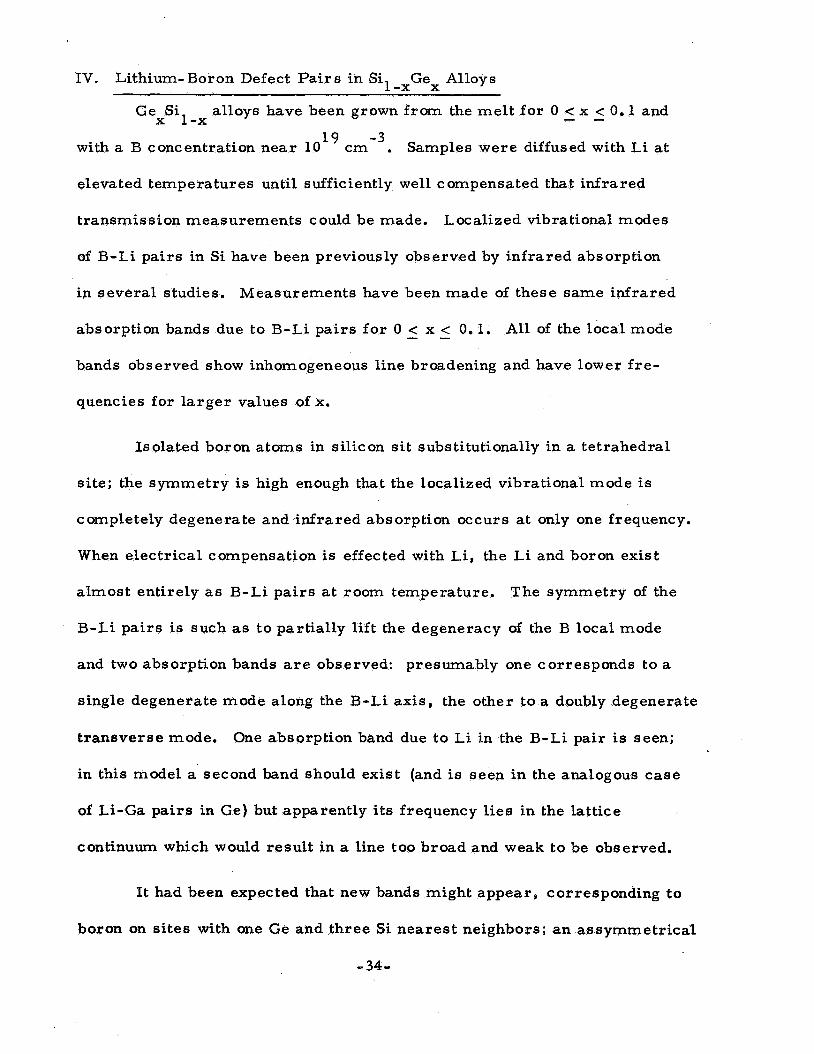
IV. Lithium-Boron Defect Pairs in SilmxGex Alloys
Ge Sil alloys have been grown from the melt fo r 0 < x < 0.1 and - - x -x 19 -3
with a B concentration near 10 cm . Samples were diffused with Li a t
elevated temperatures until sufficiently well compensated that infrared
transmission measurements could be made. Localized vibrational modes
of B-Li pairs in Si have been previously observed by infrared absorption
in several studies.
absorption bands due to B-Li pairs for 0 < x < 0.1.
bands observed show inhomogeneous line broadening and have lower f re -
quencies for larger values of x.
Measurements have been made of these same infrared
All of the local mode - -
Isolated boron atoms in silicon sit substitutionally in a tetrahedral
site; the symmetry is high enough that the localized vibrational mode is
completely degenerate and infrared absorption occurs at only one frequency.
When electrical compensation is effected with Li, the Li and boron exist
almost entirely as B-Li pairs a t room temperature.
B-Li pairs is such as to partially lift the degeneracy of the B local mode
and two absorption bands a r e observed: presumably one corresponds to a
single degenerate mode along the B-Li axis, the other to a doubly degenerate
transverse mode.
The symmetry of the
One absorption band due to Li in the B-Li pair is seen;
in this model a second band should exist (and is seen in the analogous case
of Li-Ga pairs in Ge) but apparently i ts frequency l ies in the lattice
continuum which would result in a line too broad and weak to be observed.
I t had been expected that new bands might appear, corresponding t o
boron on sites with one Ge and three Si nearest neighbors; a n assymmetrical
- 34-

broadening of the narrower of the two B-Li pair bands rnay be evidence that
this actually occurs. If, a s is assumed, the assymetrically broadened line
corresponds to the single degenerate axial mode, then it appears that in the
case of a Ge-B-Li complex, the three atoms prefer to lie along a single axis,
as any other configuration would tend to split the degeneracy of the transverse
mode.
-35-

V. Localized Vibrational Modes of Substitutional Defect Pairs in Silicon
and Lithium Induced Donor Precipitation
A. Introduction
There have been many recent studieJV- 'Jf the effect of impurities,
both substitutional and interstitial, on the vibrational modes of crystals.
The conditions for introducing high frequency 1ocaliz.ed vibrational modes
have been discussed in the literature, and experimental observation of
infrared absorption bands associated with localized modes have been
reported for a number of systems.
with concentrations ranging between 10 and 10 cm , in semiconductor
Several cases have involved impurities,
16 20 -3
crystals. In many cases the impurity used is an electrical dopant, and the
resulting absorption from the large free ca r r i e r concentration must be
reduced by the introduction of an electrically compensating impurity. This
is the reason for some cases involving pairs of impurities.
Of interest to the present study is the experimental work done with
B and B-Li impurities in Si. Measurements(V-;?p)Lace the triply degenerate
localized mode for isolated substitutional B near 624
nitrogen temperature for "B and 647 cm
a r e larger than the highest unperturbed silicon phonon frequency of -518 cm
When interstitial Li compensates B some rather striking effects have been
reported
doubly and singly degenerated modes separated by 90 cm
-1 cm a t liquid
- 1 10 for B. Both frequencies
-1 .
(V- 3, v-4 . d o s t of the triply degenerate B band is split, indicating
-1 with the doubly
degenerate modes a t higher frequency. In addition a band is observed
-36-
slightly above the top of the unperturbed spectrum. The frequency of
this mode is dependent upon the Li isotope but insensitive to the B isotope.
A qualitative explanation has been offered in which these bands a r e related
to the formation of ion pairs, BSi-Lii, where B
is interstitial Li. The point group symmetry a t the B and Li si tes is
reduced from tetrahedral (Td) to axial (C
is B on a Si si te and Li. Si I
) by the pairing. 3v
This work is an experimental study of Si doped heavily with B and
largely compensated with a substitutimaldonor impurity, i.e. P, As, or
Sb. New absorption bands
have been observed which can be attributed to B-P, B-As, and B-Sb nearest
neighbor pairs. In some cases, notably B-P, the strength of some of the
absorption bands depends upon the time and temperature of L i diffusion.
This Iatter effect is interpreted in terms of impurity precipitation.
The compensation is completed by diffusing Li.
B. Experimental Method
Silicon ingots were pulled from a melt of high purity Si and the
desired impurities.
P and As were added as Ca3 (PO ) and Ca3 ( A s O ~ ) ~ .
and the donor impurity were added to the melt simultaneously wi th concen-
trations adjusted to make the crystal p-type but, where possible, nearly
compensated. The B concentration [ B l was always > 10 cm while
the donor concentrations varied from near 10 cm for [ P], - 5 x 10 cm
fo r [As!, and -2-3 x 10 cm for [Sb). The samples were single crystal
or polycrystalline with crystallities of several mms. in dimension.
The B and Sb were introduced in elemental form while
In most cases B 4 2
20 -3
20 -3 19 -3 N
19 -3
The
-37-

11 10 B, i.ee 98% "B and 2% B used was enriched
measurements of the resistivity p gave values consistent with the doping
levels. The silicon w a s diffused wi th natural Li, i. e. -93% Li and 7%
6
B. Four point probe
7
Li. The resulting compensated samples had p > 100 Sa cm. The times,
temperatures, and conditions for Li diffusion have already been discussed
N
(V-4, v-5)
-1 Spectral half widths were always less than 1.0 cm
generally near 0. 5 cm . All optical measurements were made a t liquid
nitrogen temperature e
wave number and
-1
C. Experimental Results
1. Localized Mode Frequencies. In Fig. V-1 results were shown for
11 three samples, each doped with B a substitutional donoro and Lie The
term donor w i l l be used only for the substitutional donor impurity and not
for the diffused Li. The bands near 523, 536, 566, 586, 622, and 656 agree
closely with bands reported for samples not containing the donor.
absorption bands a r e related to the presence of B and Li.
have been observed for each donor, and their positions in Fig. V-1 a r e
indicated by the arrows. There a r e two bands in each case with a possible
third one in the B-As sample. The frequencies depend upon the donor
employed. In a B-P crystal the new bands have very nearly the same
These
(V-6) New bands
0 isotope shift as isolated B band. Measurements a t 5 K gave nearly the
same results as those obtained a t nitrogen temperature.
and absorption peak positions as a function of temperature for the new band
a re , within experimental accuracy, the same as for the isolated B line.
The line widths
- 38-
Several B-P doped ingots have been grown and the new bands a r e present in
all cases. An ingot w a s doped with B and elemental Ca, and Li compensated.
The concentration of Ca introduced w a s the same as that by the Ca (PO )
and only B and B-Li bands were observed.
3 4 2
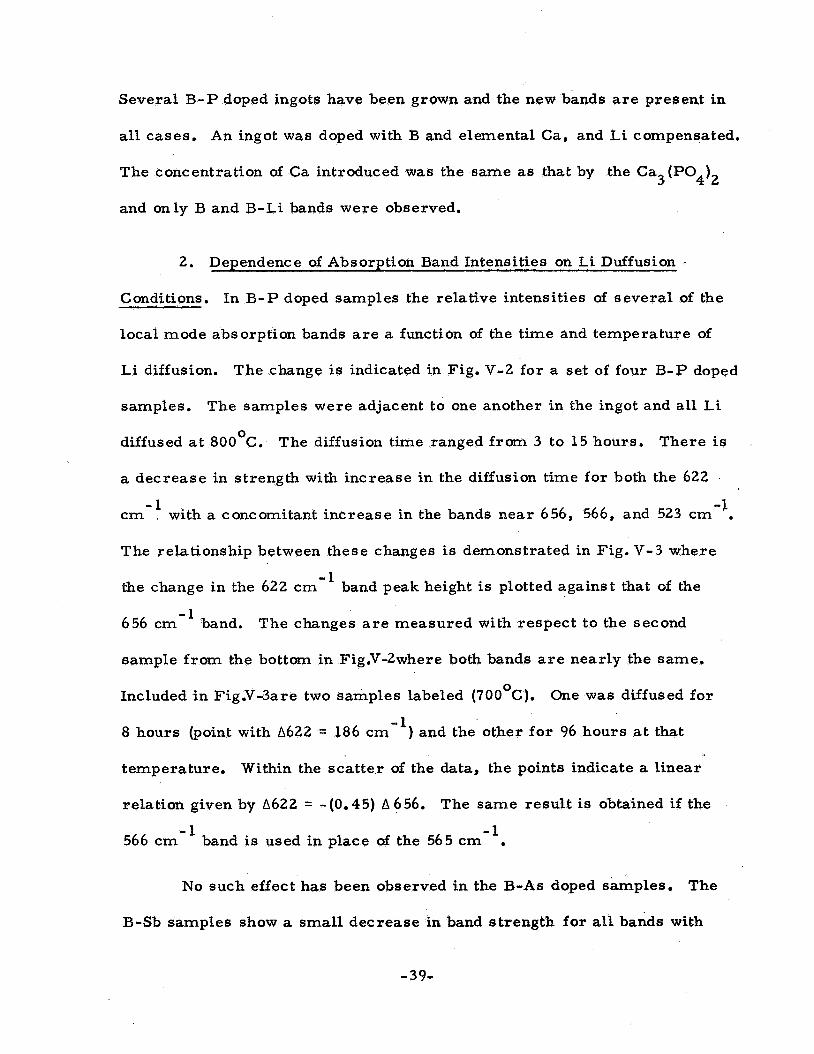
2. Dependence of Absorption Band Intensities on Li Duffusion .
Conditions. In B-P doped samples the relative intensities of several of the
local mode absorption bands a r e a function of the time and temperature of
Li diffusion.
samples.
diffused a t 800°C.
a decrease in strength with increase in the diffusion time €or both the 622
cm . with a concomitant increase in the bands near 656, 566, and 523 cm
The relationship between these changes is demonstrated in Fig. V-3 where
the change in the 622 cm
The change is indicated in Fig. V-2 for a set of four B-P doped
The samples were adjacent to one another in the ingot and all Li
The diffusion time ranged from 3 to 15 hours. There is
-1 -1 .
-1 band peak height is plotted against that of the
-1 656 cm
sample from the bottom in Fig.V-2where both hands are nearly the same.
Included in Fig.V-3are two samples labeled (700 C) .
8 hours (point with A622 = 186 cm-l ) and the other for 96 hours a t that
temperature.
relation given by A622 = - (0.45) A 656.
566 cm
band. The changes a r e measured with respect to the second
0 One w a s diffused for
Within the scatte.r of the data, the points indicate a linear
The same result is obtained if the
-1 -1 band is used in place of the 565 cm .
No such effect has been observed in the B-As doped samples. The
B-Sb samples show a small decrease in band strength for all bands with
-39-
0 longer times of diffusion a t 800 C as well a s an increase in the apparent
background ab s orp ti on.
D. Discussion of Results
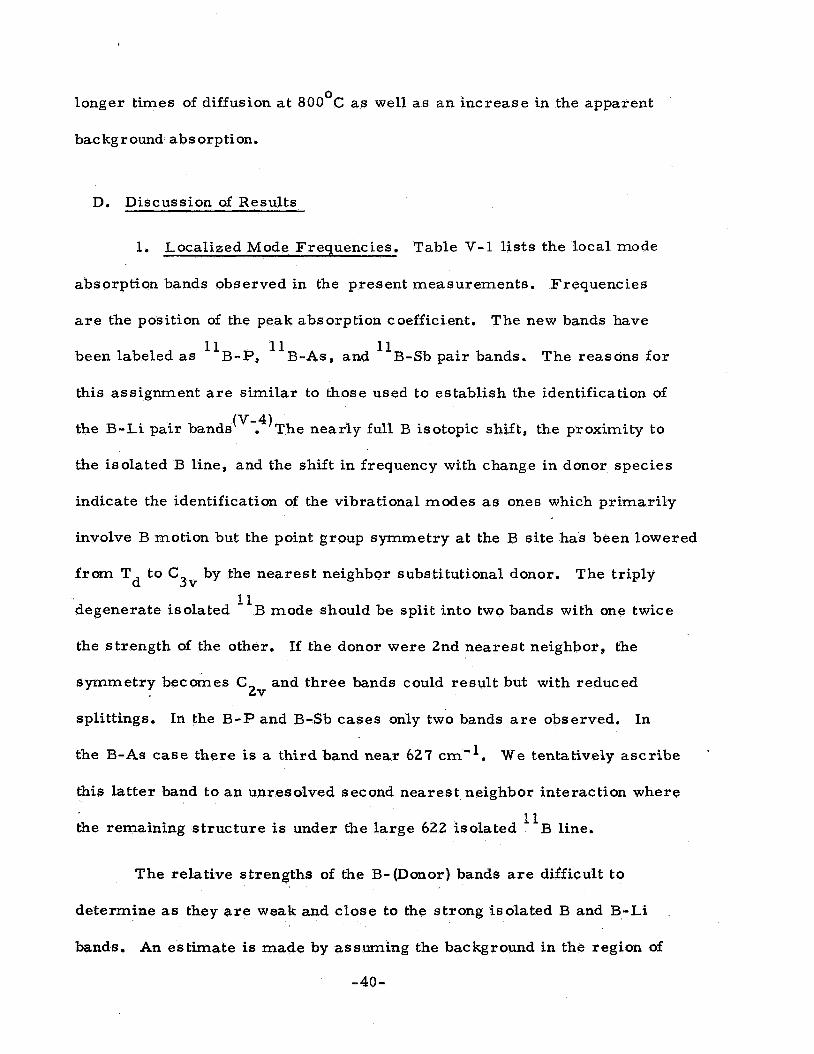
1. Localized Mode Frequencies. Table V-1 l ists the local mode
absorption bands observed in the present measurements.
a r e the position of the peak absorption coefficient.
been labeled as B-P, B-As, and B-Sb pair bands. The reasons fo r
Frequencies
The new bands have
11 11 11
this assignment a r e similar to those used to establish the identification of
the B-Li pair bands(V-?)The nearly full B isotopic shift, the proximity to
the isolated B line, and the shift in frequency with change in donor species
indicate the identification of the vibrational modes as ones which primarily
involve B motion but the point group symmetry a t the B site has been lowered
from Td to C by the nearest neighbor substitutional donor.
degenerate isolated
the strength of the other. If the donor were 2nd nearest neighbor, the
symmetry becomes C and three bands could result but with reduced
splittings. In the B-P and B-Sb cases only two bands a r e observed.
the B-As case there is a third band near 627 crn-l. We tentatively ascribe
The triply 3v 11
B mode should be split into two bands with one twice
2v
In
this latter band to an unresolved second nearest neighbor interaction where
the remaining structure is under the large 622 isolated 11 B line.
The relative strengths of the B-(Donor) bands a r e difficult to
determine as they are weak and close to the strong isolated B and B-Li
bands. An estimate is made by assuming the background in the region of
-40-

TABLE V-1
Liquid Nitrogen Temperature Frequencies of Absorption Bands
B-Li Pair 656.1 It 0.6 683 Bands 566.1 2 0.6 586
B Band 622.2 4 0.5 647 - -- - -- --- Li Band 523.3 f 0.5 523.3 f 0. 5 --- --- --- B-Donor --- --- - 628 636.7+0.4 642.7+ 0.3 Bands --- --- 6 0 0 . 1 ~ 0 . 5 603.7k0.3 611.920.3 --- --- - 627 ---
B-D bands to be a constant plus the tails of the nearby major bands. The
absorption tails a r e estimated by assuming a t each local mode can be repre-
sented by a collection of non-interacting harmonic oscillators of resonance
frequency v . This model gives an absorption coefficient 0
2 V
n
where v and 6 a r e the frequency and damping constant normalized by the
resonance frequency, n the refractive index, and C a constant. It is
assumed that n is independent of frequency.
fitting for a B-P sample. The only major band close enough to the B-P
pair bands to have any effect is the isolated "B band at 622 cm". C/n
Figure V-4 shows the curve
was adjusted to give u = 250 cm" with 6 of 0.008 (5 .0 cm-l). peak
Measurements over a more extended frequency range indicate that for this
-41 -

and the -1 = 14 cm . Subtraction of u bac kg round sample, u bac kg round
calculated curve from the measured data points give the dashed curves
in Fig.V-4.
The results for estimates of adw for the pair bands in several s samples a r e given in Table V-2. While the results a r e not conclusive, they
suggest that the high frequency band is the doubly degenerate one for B-P
and B-Sb and the low frequency one for B-As. Comparison of the total
integrated absorption of the B-Donor pair bands to that for isolated B gives
C U d v = 0.1 to 0.2 adv for both B-P and B-As and 0.4 to 0.5 udw
for B-Sb. pair Jl3 JB
The difference could a r i s e either from a somewhat larger pairing
energy for the B-Sb case or from the equilibrium configuration for B-Sb
being characteristic of a somewhat lower temperature. The latter case
would imply a larger diffusion constant for Sb than for As and P which is
not in agreement with published data. w- 7)
TABLE V-2
1 High frequency Low frequency pair band pair band
r-
-42 -
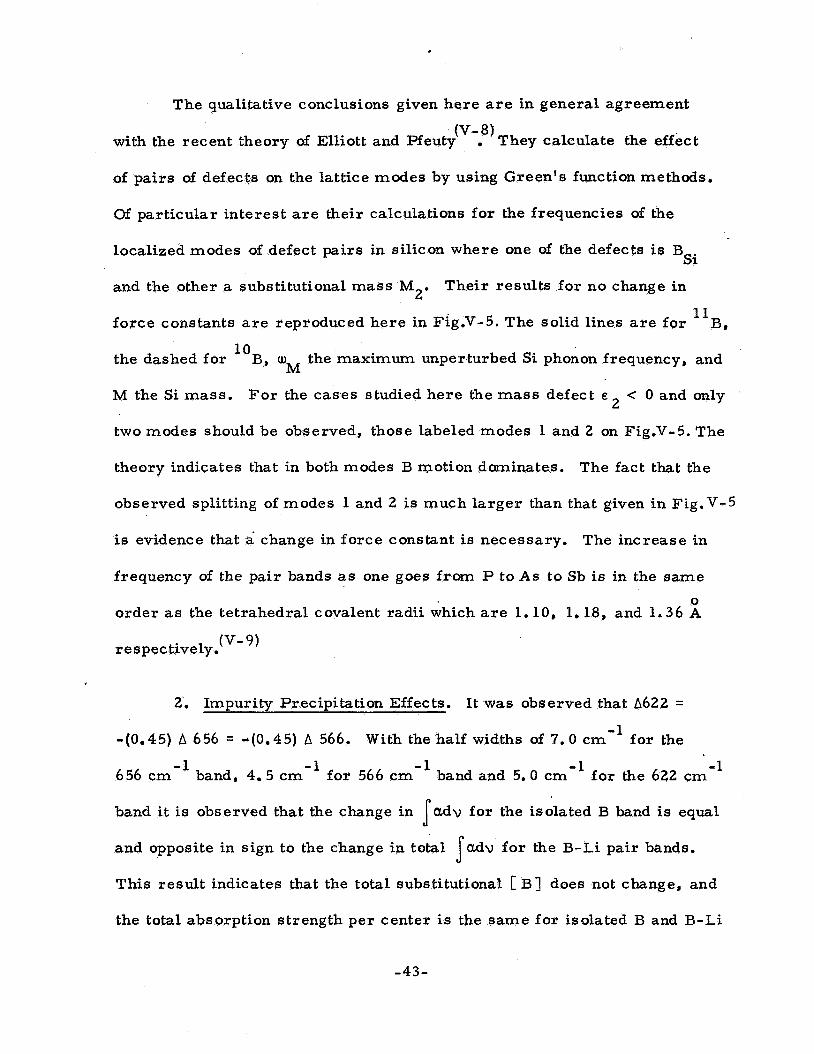
The qualitative conclusions given here are in general agreement
(V-8) with the recent theory of Elliott and Pfeuty They calculate the effect
of pairs of defects on the lattice modes by using Green's function methods.
Of particular interest a r e their calculations for the frequencies of the
localized modes of defect pairs in silicon where one of the defects is B Si
and the other a substitutional mass M Their results for no change in
force constants a r e reproduced here in Fig.V-5. The solid lines a r e for
the dashed for
2' 11
B,
B, wM the maximum unperturbed Si phonon frequency, and 10
M the Si mass. For
two modes should be
theory indicates that
observed splitting of
the cases studied here the mass defect E < 0 and only
observed, those labeled modes 1 and 2 on Fig.V-5. The
in both modes B motion dominates.
modes 1 and 2 is much larger than that given in Fig.V-5
2
The fact that the
is evidence that a change in force constant is necessary. The increase in
frequency of the pair bands as one goes from P to As to Sb i s in the same
0 order as the tetrahedral covalent radii which a r e 1.10, 1.18, and 1.36 A
r e spec tive ly . w-9)
2. Impurity Precipitation Effects. It w a s observed that A622 =
-(0.45) A 656 = d(0.45) A 566. With the half widths of 7 . 0 cm-l for the
656 cm band, 4.5 cm-l for 566 cm
band i t is observed that the change in
-1 -1 -1 band and 5.0 cm-' for the 622 cm
adv for the isolated B band is equal s and opposite in sign to the change in toea1
This result indicates that the total substitutional [ BJ does not change, and
the total absorption strength per center is the same for isolated B and B-Li
adv fo r the B-Li pair bands. s
-43-
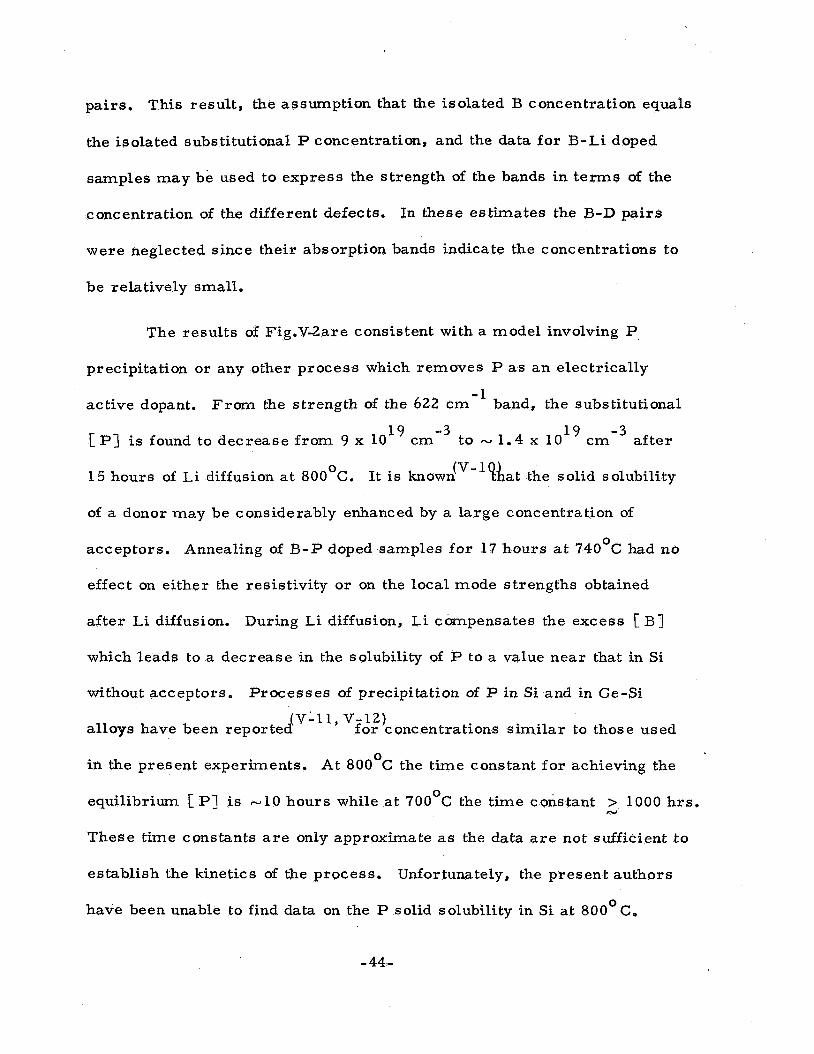
pairs.
the isolated substitutional P concentration, and the data for B-Li doped
samples may be used to express the strength of the bands in terms of the
concentration of the different defects.
were neglected since their absorption bands indicate the concentrations to
be relatively small.
This result, the assumption that the isolated B concentration equals
In these estimates the B-D pairs
The results of Fig.V-2are consistent with a model involving P
precipitation or any other process which removes P as an electrically
active dopant.
[ P I is found to decrease from 9 x 1019 cm
-1 From the strength of the 622 cm band, the substitutional
-3 19 -3 to - 1.4 x 10 cm after
15 hours of Li diffusion a t 80OOC. It is knowdV-l?Aat the solid solubility
of a donor may be considerably enhanced by a large concentration of
acceptors. Annealing of B - P doped samples for 17 hours a t 74OoC had no
effect on either the resistivity or on the local mode strengths obtained
after Li diffusion. During Li diffusion, Li compensates the excess [ B1
which leads to a decrease in the solubility of P to a value near that in Si
without acceptors. Processes of precipitation of P in Si and in Ge-Si
(VL11, v-12) alloys have been reported for concentrations similar to those used
0 in the present experiments. At 800 C the time constant for achieving the
equilibrium [P I is -10 hours while a t 700 C the time constant > 1000 hrs. 0
N
These time constants a r e only approximate as the data a r e not sufficient to
establish the kinetics of the process. Unfortunately, the present authors
have been unable to find data on the P solid solubility in Si a t 8OO0C.
-44-
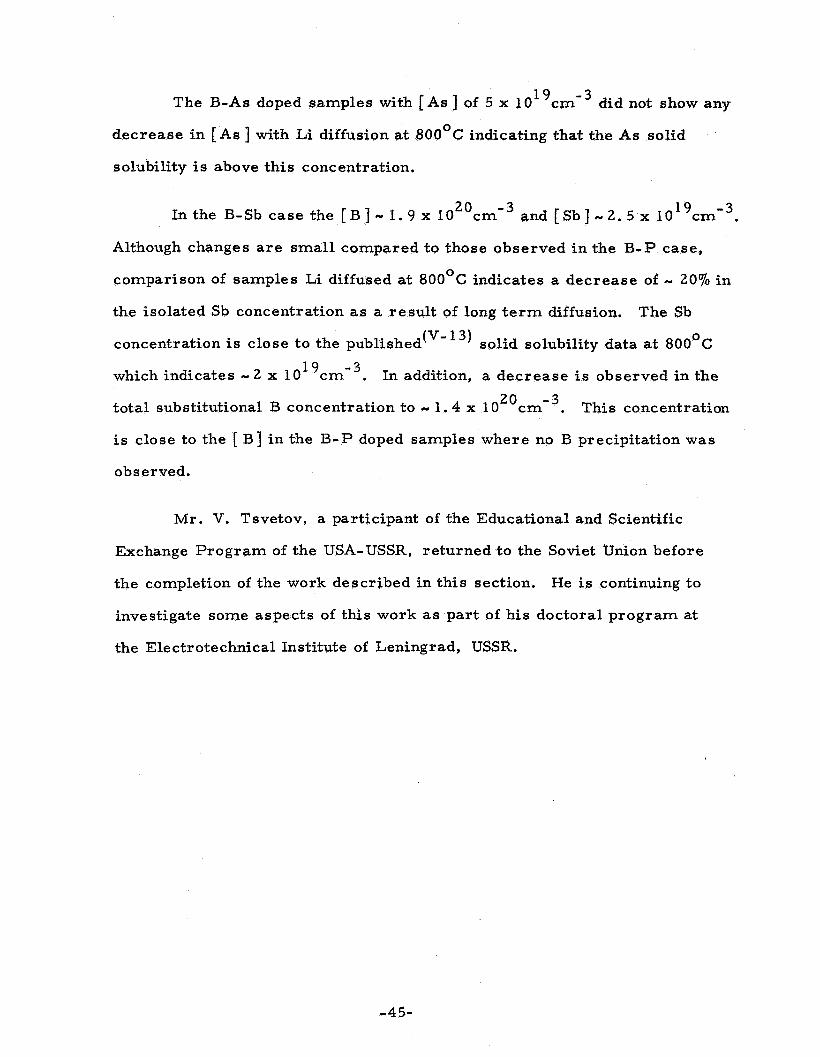
19 - 3 The B-As doped samples with [As ] of 5 x 10 cm did not show any
decrease in [ A s ] with Li diffusion at 800°C indicating that the As solid
solubility is above this concentration.
20 - 3 c m In the B-Sb case the [ B ] - 1 .9 x 10 and [Sb] m 2 . 5 x 1019cm-3.
Although changes a r e small compared to those observed in the B-P case,
comparison of samples Li diffused at 800°C indicates a decrease of - 20% i n
the isolated Sb concentration as a result of long term diffusion.
concentration is close to the published (v- 3, solid solubility data at 8OO0C
which indicates - 2 x 10
total substitutional B concentration to - 1.4 x 10 c m . This concentration
is close to the [ B] in the B-P doped samples where no B precipitation was
observed.
The Sb
19 ~ m - ~ . In addition, a decrease is observed in the
20 - 3
Mr. V. Tsvetov, a participant of the Educational and Scientific
Exchange Program of the USA-USSR, returned to the Soviet Union before
the completion of the work described in this section. He is continuing to
investigate some aspects of this work as part of his doctoral program at
the Electrotechnical Institute of Leningrad, USSR.
-45-
V-
v-2.
v-3.
v-4.
v- 5.
V-6.
v- 7.
V- 8.
v- 9.
v-10.
v-11.
v-12.
V-13.
REFERENCES
For a discussion of this topic see A. A. Maradudin, Solic State Phys (Edited by F. Seitz and D. Turnbull, Academic Press, New York, l966), vol. 18, 273.
J. F. Angress, A. R. Goodwin, andS. D. Smith, Proc. Roy. SOC. (London) 287A, 64 (1965). - M. Balkanski and W. A. Nazarewicz, J. Phys. Chem. Solids 27, 671 (1966).
-
M. Waldner, M. A. Hiller, and W. G. Spitzer, Phys. Rev. 140, A172 (1965); also W. G. Spitzer and M. Waldner, J. Appl. Phys. - 36, 2450 (1965).
-
E. M. Pell, J. Phys. Chem. Solids 3, 77 (1957). - V. Tsvetov, W. Allred, and W. G. Spitzer, Appl. Phys. Letters, 10, p. 326 (1967).
-
H. Reiss and C. S. Fuller, Semiconductors (Edited by B. Hannay, Reinhold Publishing Co., New York, 1959), p. 244.
R. Elliott and P. Pfeuty, J. Phys. Chem. Solids, 28, 1627 (1967). - L. Pauling, The Nature of the Chemical Bond (Cornel1 Univ. Press, Ithaca, New York, 1960), p. 246.
H. Reiss, C. S. Fuller, and F. J. Morins, Bell System Technical Journal 35, 535 (1956).
_I
M. L. Joshi and S. Dash, IBM Journal of Research and Development 10, 446 (1966). -
L. Ekstrom and J. P. Dismukes, J. Phys. Chem. Solids - 27, 857 (1966).
F. A. Trumbore, Bell System Technical Journal 39, 205 (1960).
.c s
-46-
VI. Theoretical Calculations of One- and Two-Phonon Optical
Absorption from Boron Impurities in Silicon
It is well known that in homopolar crystals such a s silicon, there
is no f i r s t order infrared absorption.
which has been studied by Lax and Burstein (1955), who explained it in
terms of the second order dipole moment, since the anharmonicity was
There is a second order spectrum,
unable to provide a mechanism for it. In the present paper we a r e con-
cerned with the f i rs t and second order infrared absorption of boron-doped
silicon.
We have calculated the absorption corresponding to the excitation
of electromagnetic radiation of the following types of vibrations (which
occur near the impurity site):
excitation of a local mode vibration;
excitation of a perturbed band mode;
simultaneous excitation of two local mode quanta (overtones);
simultaneous excitation of a local mode and a perturbed
band mode (combination tone).
simultaneous excitation of a local mode and an unperturbed
band mode (combination tone);
These types of absorption are absent in the perfect lattice and (except for
2) their frequencies depend strongly on the boron mass.
calculate the second-order absorption arising from simultaneous excitation
We do not
of two band modes. This wi l l be weak and of the same general structure as
-47-

the intrinsic second-order absorption.
We must point out that in calculating with a model system containing
only boron as the doping agent w e a r e dealing with a system on which
experimental data is not readily available because of f ree ca r r i e r absorp-
tion.
sated by donors, wi th which it may aggregate into pairs of lower symmetry,
and more complex properties, than the isolated boron centers we a r e dealing
In practice the boron, which acts as an acceptor, must be compen-
with here.
point for understanding the intensity of absorption in compensated boron-
doped silicon.
Nevertheless, these calculations should serve a s a useful starting
Since the details of the calculations have been published in ar t ic les
#3 and 4 which a r e listed in the Introduction to this report, they wi l l not
be reproduced here.
follows: The simplified model employed gives values for the absorption
c ross section of the fundamental and the f i r s t overtone which a r e in order
The conclusions, however, may be briefly stated as
of magnitude agreement with experiment.
band modes and the combination modes seen t o agree qualitatively with the
experiment a1 data.
Moreover, calculations for the
-48-
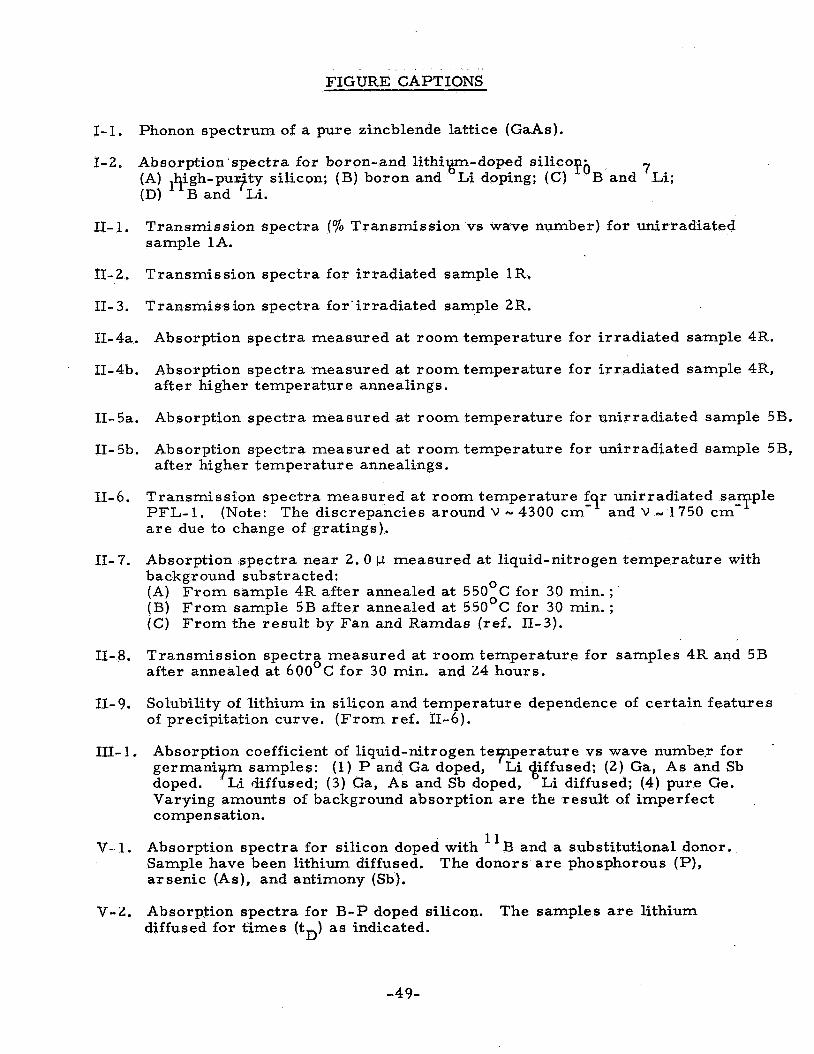
FIGURE CAPTIONS
1-1. Phonon spectrum of a pure zincblende lattice (GaAs).
1-2. Absorption 'spectra for boron-and l i th ip-doped silicorb 7 (A) lvgh-puqty silicon; (B) boron and Li doping; (C) B and Li; (D) B and Li.
11- 1. Transmission spectra ('$0 Transmission vs wave number) for unirradiated sample 1A.
11-2.
11-3.
Transmission spectra for irradiated sample 1R.
Transmission spectra for'irradiated sample 2R.
11-4a. Absorption spectra measured at room temperature for irradiated sample 4R.
11-4b. Absorption spectra measured at room temperature for irradiated sample 4R, after higher temperature annealings.
11- 5a. Absorption spectra measured at room temperature for unirradiated sample 5B.
11- 5b. Absorption spectra measured at room temperature for unirradiated sample 5B, after higher temperature annealings.
11-6. Transmission spectra measured at room temperature f r unirradiated sayple PFL-1. (Note: The discrepancies around V - 4300 c m and V - 1750 cm- a re due to change of gratings).
-9
11- 7. Absorption spectra near 2 . 0 l-i measured at liquid-nitrogen temperature with background substracted: (A) From sample 4R after annealed at 550:C for 30 min. ; (B) From sample 5B after annealed at 550 C for 30 min. ; (C) From the result by Fan and Ramdas (ref. 11-3).
Transmission spectra measured at room temperature for samples 4R and 5B after annealed at 6OO0C for 30 min. and 24 hours.
11-8.
11- 9. Solubility of lithium in silicon and temperature dependence of certain features of precipitation curve. (From ref. 11-6).
Absorption coefficient of liquid-nitrogen teypera ture vs wave number for germani m samples: (1) P and Ga doped, Li gffused; (2) Ga, As and Sb doped. Li diffused; (3) Ga, As and Sb doped, Li diffused; (4) pure Ge. Varying amounts of background absorption a r e the result of imperfect compensation.
111- 1. Y
V- 1. Absorption spectra for silicon doped with l1 B and a substitutional donor. Sample have been lithium diffused. arsenic (As), and antimony (Sb).
The donors are phosphorous (P),
V-2. Absorption spectra for B-P doped silicon. diffused for times (t,) as indicated.
The samples a r e lithium
-49-
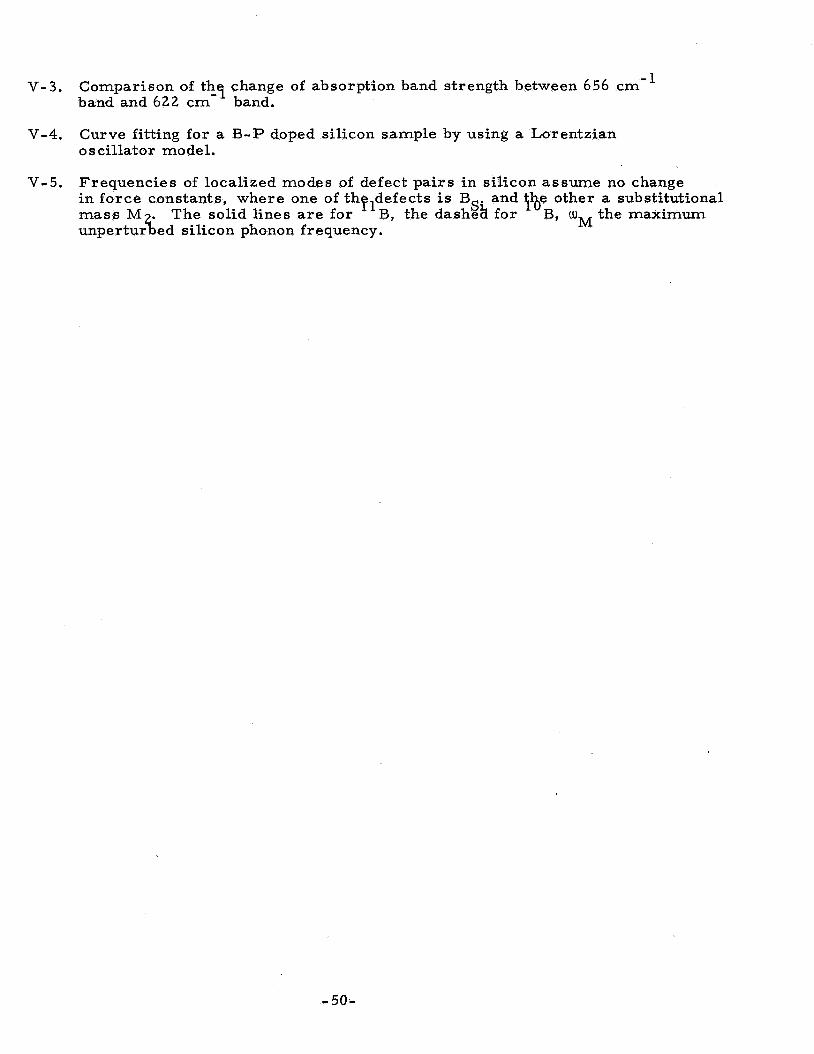
V-3. Comparison of thf change of absorption band strength between 656 cm" band and 622 cm- band.
V-4. Curve fitting for a B-P doped silicon sample by using a Lorentzian oscillator model.
Frequencies of localized modes of defect pairs in silicon assume no change in force constants, where one of th defects is B . and t&? other a substitutional mass M z The solid lines a re for "B, the dash% for unperturbed silicon phonon frequency.
V-5.
B, w the maximum M
- 50-

Frequehcy ( lo'* c /s
4
0
13 0
, 0
Frequency ( 10'2c/s ) 01
I 0 i
Fig. 1-1 -51-
Wavenumber, cm
L C-Blo t Normal Lithium D-8" + Normal Lithium
,o, I I I I I I I I 1 I I I I 1 1 1 1 I 1 1 I I I , { ,
Wavenumber, cm-1
-52-
-. 17 4 (13 0
0 t=l
I c
P 0 0
(JI 0 0
00 0 0
I P u1 I 0 0
I I
I I - 5 3 -

Cr, 0 0
4 0 0
P P 0 cn
I I I I I
T (70) w w
0 5 cn 8 G: 0 cn -
0
I -
I IZ I I I I I I C I I
-54-

P 0 0
PI h
0
3: Y
01 0 0
00 0 0
z 0
m D
- 5 5 -

a3 0 0 0
0 0 0
si
r\) w P a o , - J a @ 0 0 0 0 0 0 0 0 i i1
1 1 1 1 1 I l l
-56-
7 -. 9 g
I
u P
% 0
P 0 0
0 0 0
a 0 0
5 0 0
VI 0 CI
3 - v
8 0 0
P 0 0 0
8
8
8
0 0
0 0
0 6
. O X

7 -. 9 H a' I O cn n
Tu 0 0
8 0
0 0 0
00 0 0 -
PI 0 - 0 0 0 3 L v
N 0 0 0
P 0 0 0
8 0
03 0 0 0
0 0 0
b
* a o x
7 -I 0 “ 0 -.
u1 U
0, 0 0
8 0
8 0
75 8 0
1 1 1 1 1 I l l
-sp

0 0
N 0 0
(rl TI 5 0 3 0 I O
-p1 0 0 0
Y
m 0 0 0
00 0 0 0
40 I 1 I I I 1 I - 4 R 550OC /30min, LNT * 5B 550°C/30min. LNT -FAN a RAMDAS IOOOK
Fig. IT -7 2000 4000 6000 8000
F (em")
-61-

bJ P ul 6, 0 0 0 0 0 0 0
Tu
00 I I
- N
I
40f t
IOZ0
ioi9
IO'*
IQ'
lot5
IO l4
LI ( L Q S I 1 soLue. 0 PE-LL (CHEM) A R E l S S , a a (ELECT 1 x PELL (ELECT ) ( f r o m no)
I PELL (ELECT)(from n,)
- LI (PRECIP) SOLUB. -
1.0 d3
0 6 1.4 1.8 # 4 4
z Fig. IT -9
-63 -

4c
3c
n
I
0
- E Y
CI
2(
I C
8 I 1 8 V I 1
I I I I I 1 I
340 360 380 400 w (Crn")
Fig. I U - 1
-64-
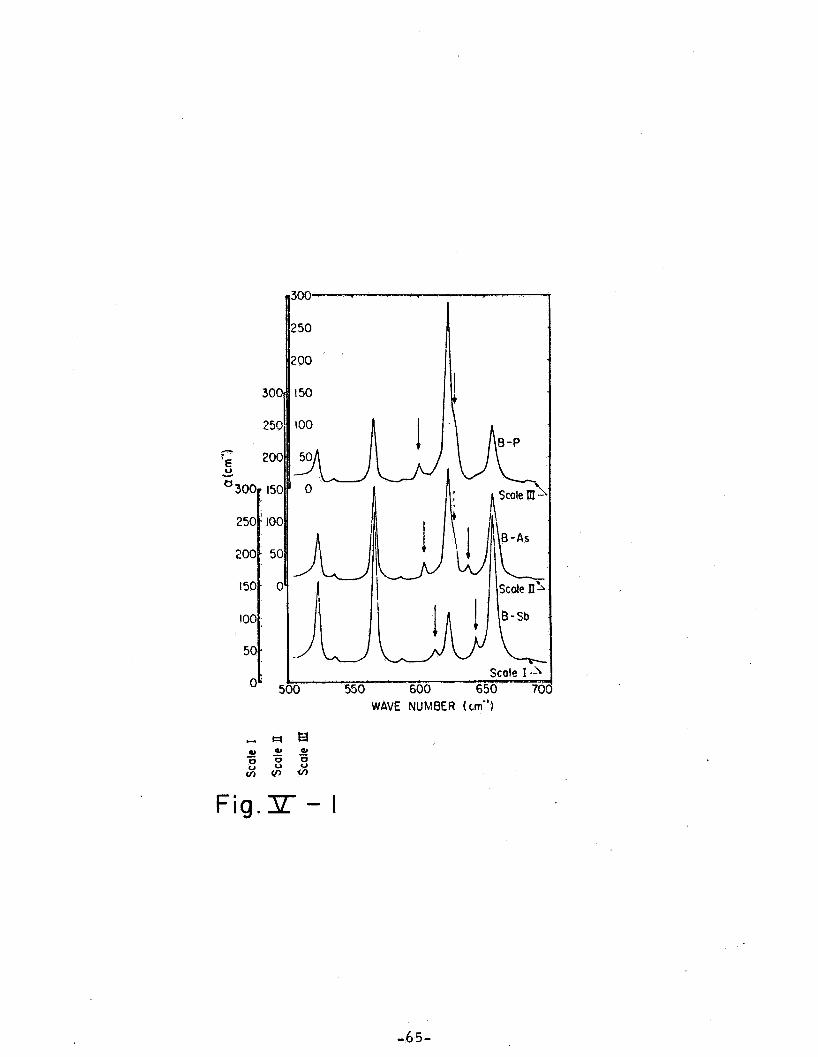
WAVE NUMBER (ern-')
F i g . T - 1
- 6 5 -

Fig. 'ZiT - 2
-66-

A622 ( c n " ) t : : : : t --*- -----c---(
-200 -160 -120 -80 80 I20 160 200
F i g X - 3
-67-

-6 8-
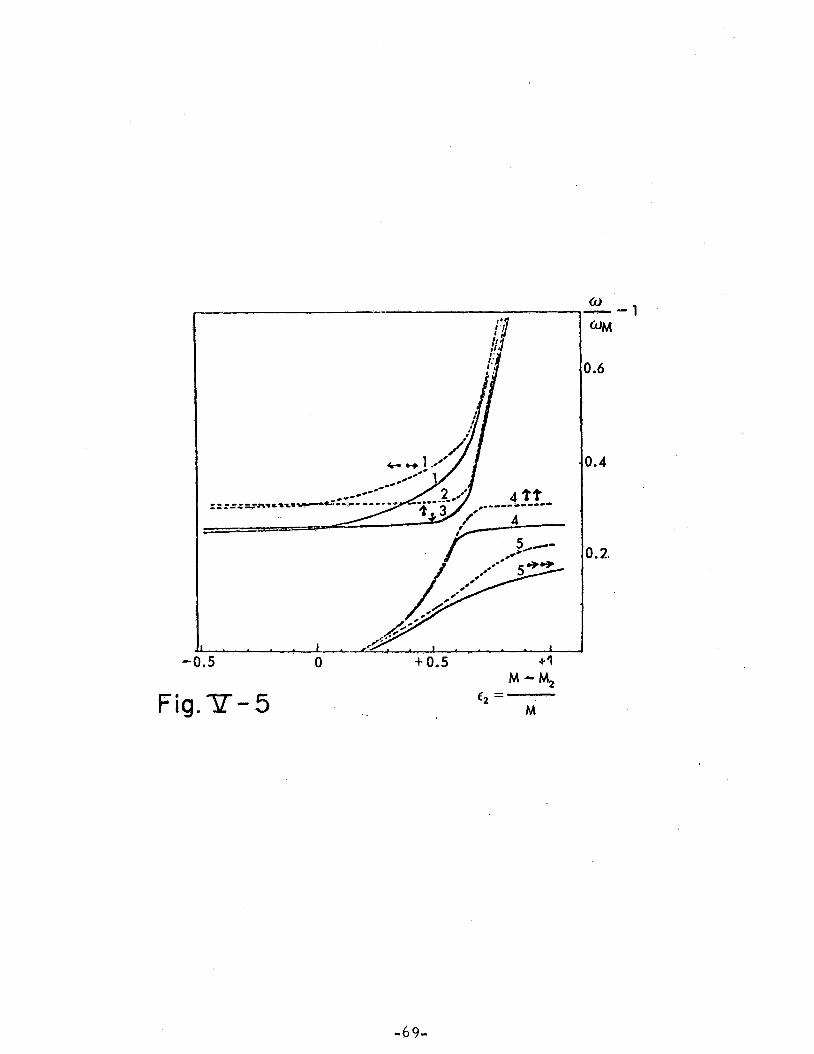
F ig .P - 5 M - M,
€* =- M
0 - - 1 OM
1.6
1.4
1.2.
-6 9-