localization of the human malaria parasite's dhfr-ts and
TRANSCRIPT
Localization of the Human Malaria Parasite’s Dihydrofolate Reductase-Thymidylate
Synthase and Examining Its Role in Proguanil and Atovaquone Drug Synergy
Joseph William Fowble
A dissertation
submitted in partial fulfillment of the
requirements for the degree of
Doctorate of Philosophy
University of Washington
2014
Reading Committee:
Pradipsinh K. Rathod, Chair
Tomikazu Sasaki
Robert E. Synovec
Program Authorized to Offer Degree:
Chemistry

ii
©Copyright 2014
Joseph W. Fowble

iii
University of Washington
Abstract
Localization of the Human Malaria Parasite’s Dihydrofolate Reductase-Thymidylate
Synthase and Examining Its Role in Proguanil and Atovaquone Drug Synergy
Joseph W. Fowble
Chair of the Supervisory Committee:
Professor Pradipsinh K. Rathod
Departments of Chemistry and Global Health
Malaria is the common name for a disease caused by Plasmodium parasites.
Malaria kills an estimated 1 million people out of approximately 200 to 500 million cases
annually. The incredible number of cases of the disease, high numbers of parasites
present in an infected individual, and sometimes rapid ability of the parasite to acquire
drug resistance emphasizes the need to find new drugs to treat individuals and prevent
infection. In the race to develop new drugs, elucidation of the exact mechanisms of
older drugs and their targets is sometimes left unresolved.
Dihydrofolate reductase (DHFR) has been an antimalarial drug target since the
late 1940s, well before the rise of modern biochemistry and genetic analysis methods.
Antimalarials targeting DHFR have been used for so long that resistant populations of
parasites have rendered these antimalarials ineffective in many countries. While DHFR
iv
is among the oldest antimalarial drug targets identified, significant gaps remain in our
understanding of the enzyme. Low levels of expression and essentiality in a haploid
genome have made biochemical investigations of malarial DHFR and genetic
manipulation particularly difficult.
A few of the proteins proteins involved in pyrimidine biosynthesis and the folate
cycle (dihydroorotate dehydrogenase (DHODH) and an isoform of serine
hydroxymethyltransferase (SHMT)) have experimentally identified localizations that are
mitochondrial. However, the localization of the malaria parasite’s conjoined
dihydrofolate reductase and thymidylate synthase enzymes (DHFR-TS) has not been
either investigated or reported. We pursued a theory that DHFR-TS is localized in the
malaria parasite and that the observed in vitro synergy of Malarone®, combining an
inhibitor of the mitochondrial electron transport chain and a pro-drug for a DHFR
inhibitor, was influenced by DHFR inhibition and disruption of localization. The
subcellular localization of the endogenous form of the DHFR-TS enzyme was
investigated using the latest design techniques for peptide antigen-derived polyclonal
antibodies, laser-scanning confocal microscopy, and advanced image analysis
techniques interrogate the patterned DHFR-TS signal in relation to the organelles of the
parasite. Comparisons between DHFR-TS and mitochondria-marking dyes, an
engineered mitochondrial protein (HProtein-GFP), and native DHODH enzyme all
indicate mitochondrial localization of this important drug target, DHFR-TS. Digitonin
v
based selective permeabilization of cell membranes further illustrated that DHFR-TS is
not cytosolic but localized and released alongside known mitochondrial protein.
Proguanil and atovaquone drug synergy was evaluated with added consideration
of DHFR localization involvement. Even with widespread resistance to antimalarials
based on DHFR inhibitors, the modern antimalarial drug Malarone® combines
atovaquone-based inhibition of the electron transport chain pathway with
proguanil/cycloguanil-based inhibition of DHFR and the folate cycle. Atovaquone’s
clinical trials were initially halted when it could not reliably cure patients due to the
rapid acquisition of resistance to atovaquone. After proguanil was added to atovaquone
a 98.7% cure rate was achieved, even in regions where DHFR-based drug resistance
phenotypes were well established.
We evaluated parasite strains with known DHFR mutations and observed
Malarone® susceptibility in flasks largely matched the EC50 patterns predicted for DHFR-
based inhibition by cycloguanil. We also identified parasite strains that displayed no
synergistic interactions between proguanil and atovaquone. We analyzed parasite
cultures treated with proguanil and atovaquone and, against the dogma of a human
liver being necessary to create cycloguanil, observed low quantities of cycloguanil. In
order to pursue a cycloguanil connection with minimal background genetic changes, a
strain of parasites expressing a cycloguanil-resistant Plasmodium vivax DHFR-TS enzyme
was created. The cycloguanil resistance conferred by the rescue plasmid did not
translate into resistance to proguanil and atovaquone treatment with a transfection

vi
construct that did not localize as the native DHFR-TS. We concluded that the rescue
construct, without proper localization, was unable to fully replicate the function of the
native falciparum DHFR-TS enzyme.
vii
Prior Publications
Rathod Lab
Narayanasamy K, Chery L, Basu A, Duraisingh MT, Escalante A, Fowble J, Guler JL, Herricks T, Kumar A, Majumder P, Maki J, Mascarenhas A, Rodrigues J, Roy B, Sen S, Shastri J, Smith J, Valecha N, White J, Rathod PK. (2012). "Malaria evolution in South Asia: knowledge for control and elimination." Acta Trop 121(3): 256-266. Guiguemde WA, Shelat AA, Bouck D, Duffy S, Crowther GJ, Davis PH, Smithson DC, Connelly M, Clark J, Zhu F, Jiménez-Díaz MB, Martinez MS, Wilson EB, Tripathi AK, Gut J, Sharlow ER, Bathurst I, El Mazouni F, Fowble JW, Forquer I, McGinley PL, Castro S, Angulo-Barturen I, Ferrer S, Rosenthal PJ, Derisi JL, Sullivan DJ, Lazo JS, Roos DS, Riscoe MK, Phillips MA, Rathod PK, Van Voorhis WC, Avery VM, Guy RK. (2010). "Chemical genetics of Plasmodium falciparum." Nature 465(7296): 311-315. Mui EJ, Schiehser GA, Milhous WK, Hsu H, Roberts CW, Kirisits M, Muench S, Rice D, Dubey JP, Fowble JW, Rathod PK, Queener SF, Liu SR, Jacobus DP, McLeod R. (2008). "Novel triazine JPC-2067-B inhibits Toxoplasma gondii in vitro and in vivo." PLoS Negl Trop Dis 2(3): e190. Ganesan K, Ponmee N, Jiang L, Fowble JW, White J, Kamchonwongpaisan S, Yuthavong Y, Wilairat P, Rathod PK. (2008). "A genetically hard-wired metabolic transcriptome in Plasmodium falciparum fails to mount protective responses to lethal antifolates." PLoS Pathog 4(11): e1000214.
Previous Labs
Lockard JV, Zink JI, Luo Y, Weaver MN, Konradsson AE, Fowble JW, Nelsen SF. (2006). "Excited-state mixed-valence distortions in a diisopropyl diphenyl hydrazine cation." J Am Chem Soc 128(51): 16524-16531.
Kulp SK, Yang YT, Hung CC, Chen KF, Lai JP, Tseng PH, Fowble JW, Ward PJ, Chen CS. (2004). "3-phosphoinositide-dependent protein kinase-1/Akt signaling represents a major cyclooxygenase-2-independent target for celecoxib in prostate cancer cells." Cancer Res 64(4): 1444-1451. Zhu J, Huang JW, Tseng PH, Yang YT, Fowble J, Shiau CW, Shaw YJ, Kulp SK, Chen CS. (2004). "From the cyclooxygenase-2 inhibitor celecoxib to a novel class of 3-phosphoinositide-dependent protein kinase-1 inhibitors." Cancer Res 64(12): 4309-4318.
viii
Table of Contents
CHAPTER 1 - BACKGROUND ..................................................................................................................... 1
MALARIA........................................................................................................................................................ 1
Global Burden of Malaria ....................................................................................................................... 1
History of Malaria ................................................................................................................................... 2
Species Differences/Distribution ............................................................................................................. 3
The Parasite Life Cycle ............................................................................................................................ 4
ESTABLISHED ANTIMALARIAL DRUG TARGETS ........................................................................................................ 6
Pyrimidine Biosynthesis and the Folate Cycle ......................................................................................... 7
Electron Transport Chain/Mitochondrial Function ............................................................................... 10
Heme Polymerization and Waste Disposal ........................................................................................... 11
Unclear Target – Artemisinin Family .................................................................................................... 12
THE MITOCHONDRION .................................................................................................................................... 13
Mitochondrial Localization Processes ................................................................................................... 14
Mitochondrial Localization Prediction Methods ................................................................................... 15
RESIDENT MITOCHONDRIAL FOLATE-UTILIZING ENZYMES ...................................................................................... 17
MALARONE® DEVELOPMENT ........................................................................................................................... 19
FIGURES ....................................................................................................................................................... 25
CHAPTER 2 – PLASMODIUM DIHYDROFOLATE REDUCTASE – THYMIDYLATE SYNTHASE LOCALIZATION 30
INTRODUCTION .............................................................................................................................................. 30
EXPERIMENTAL PROCEDURES ........................................................................................................................... 32
Materials............................................................................................................................................... 32
Antibodies to DHFR-TS ..................................................................................................................................... 32
Organelle Labels ............................................................................................................................................... 33
Nucleus – DAPI/Hoechst33342 .................................................................................................................... 33

ix
Mitochondria – Mitotracker/HProtein-GFP/PfDHODH ................................................................................ 34
Apicoplast – ACP-GFP .................................................................................................................................. 35
Endoplasmic Reticulum – ER-Tracker Blue-White DPX ................................................................................ 36
Digestive Vacuole – LysoTracker Red ........................................................................................................... 36
Methods ................................................................................................................................................ 37
Localization Prediction Algorithms ................................................................................................................... 37
Image Analysis Algorithms ................................................................................................................................ 37
Base Microscopy Protocol – Paraformaldehyde Fixed Cells ............................................................................. 40
RESULTS ....................................................................................................................................................... 43
DHFR-TS Localization Patterns Observed.............................................................................................. 43
DHFR Antibody Localizes At Specific Organelle - Mitochondria ............................................................ 44
Digitonin Fractionation Supports Localized PfDHFR-TS ........................................................................ 51
DISCUSSION .................................................................................................................................................. 52
FIGURES ....................................................................................................................................................... 56
CHAPTER 3 - A ROLE OF CYCLOGUANIL IN THE SYNERGY BETWEEN ATOVAQUONE AND PROGUANIL? .. 69
INTRODUCTION .............................................................................................................................................. 69
EXPERIMENTAL PROCEDURES ........................................................................................................................... 71
Materials............................................................................................................................................... 71
Synthesis of Cycloguanil, 2-Chlorocycloguanil .................................................................................................. 71
Creation of Cycloguanil Resistant Parasites via Rescue Plasmid....................................................................... 71
Methods ................................................................................................................................................ 74
Parasite Transfection Using Preloaded Erythrocytes ........................................................................................ 74
Assay for Anti-Plasmodial Activity (EC50) .......................................................................................................... 76
Solid Phase Extraction and Quantification of Proguanil Conversion via LC-MS/MS ......................................... 77
RESULTS ....................................................................................................................................................... 79
Single Drug Susceptibility Profiles ......................................................................................................... 79
Drug Synergy Profiles ............................................................................................................................ 83
x
Direct UPLC-MS/MS Evidence for Cycloguanil Formation .................................................................... 86
Drug Rescue with Cycloguanil Resistant Plasmodium vivax DHFR-TS .................................................. 87
Digitonin Permeabilization of PvDHFR-TS-Containing Parasites .......................................................... 88
DISCUSSION .................................................................................................................................................. 89
FIGURES ..................................................................................................................................................... 103
TABLES ...................................................................................................................................................... 115
CHAPTER 4 - SIGNIFICANCE AND FUTURE PROSPECTS .......................................................................... 119
SIGNIFICANCE .............................................................................................................................................. 119
FUTURE PROSPECTS ...................................................................................................................................... 123
APPENDIX 1: AUXILIARY EXPERIMENTS ................................................................................................ 128
INTRODUCTION ............................................................................................................................................ 128
EXPERIMENTAL PROCEDURES ......................................................................................................................... 128
Materials............................................................................................................................................. 128
DHFR Active Site Label – Methotrexate .......................................................................................................... 128
Methods .............................................................................................................................................. 129
DHFR-TS Activity Assay Using 96-Well Plate Reader....................................................................................... 129
RESULTS ..................................................................................................................................................... 131
Active Site Marker (Fluorescently Labelled Methotrexate) Not Cell Permeable ................................. 131
Malarone® Drug Exposure – A Slow Change? ..................................................................................... 132
DISCUSSION ................................................................................................................................................ 133
APPENDIX 1 FIGURES .................................................................................................................................... 135
APPENDIX 2: GENERAL EXPERIMENTAL PROCEDURES .......................................................................... 137
MATERIALS ................................................................................................................................................. 137
Digitonin Permeabilization Reagents ................................................................................................. 137
Western Blot Reagents ....................................................................................................................... 137
xi
GENERAL METHODS ..................................................................................................................................... 138
Continuous Growth of Blood-Stage Parasites ..................................................................................... 138
Western Blotting ................................................................................................................................. 139
Digitonin Permeabilization Method .................................................................................................... 141
BIBLIOGRAPHY ..................................................................................................................................... 146
xii
List of Abbreviations
ATO – Atovaquone CG – Cycloguanil DHF - 7,8-dihydrofolic Acid DHFR/DHFR-TS – Dihydrofolate Reductase-(Thymidylate Synthase) DHODH – Dihydroorotate Dehydrogenase DHPS – Dihydropteroate Synthase DTT - Dithiothreitol EC50 – Effective Concentration of an inhibitor to reduce cellular effect by 50% ETC – Electron Transport Chain (mitochondrial membrane potential source) GFP – Green Fluorescent Protein GST – Glutatione S-Transferase HProtein – A component of the Glycine Cleavage System, Mitochondrial IC50 – Inhibitory Concentration, concentration of inhibitor to reduce enzymatic activity by 50% MTX – Methotrexate mTHF - N5,N10-Methylene Tetrahydrofolic Acid NADPH - Nicotinamide Adenine Dinucleotide Phosphate, Reduced PG – Proguanil SHMT – Serine Hydroxymethyltransferase TCA – Tricarboxylic Acid (Citric Acid Cycle/Krebs Cycle) THF - 5,6,7,8-Tetrahydrofolic Acid TS – Thymidylate Synthase
1
Chapter 1 - Background
Malaria
Global Burden of Malaria
Malaria is a tropical disease caused by Plasmodium parasites. Approximately
48% of the world’s population lives in regions where malaria is endemic [1, 2]. The
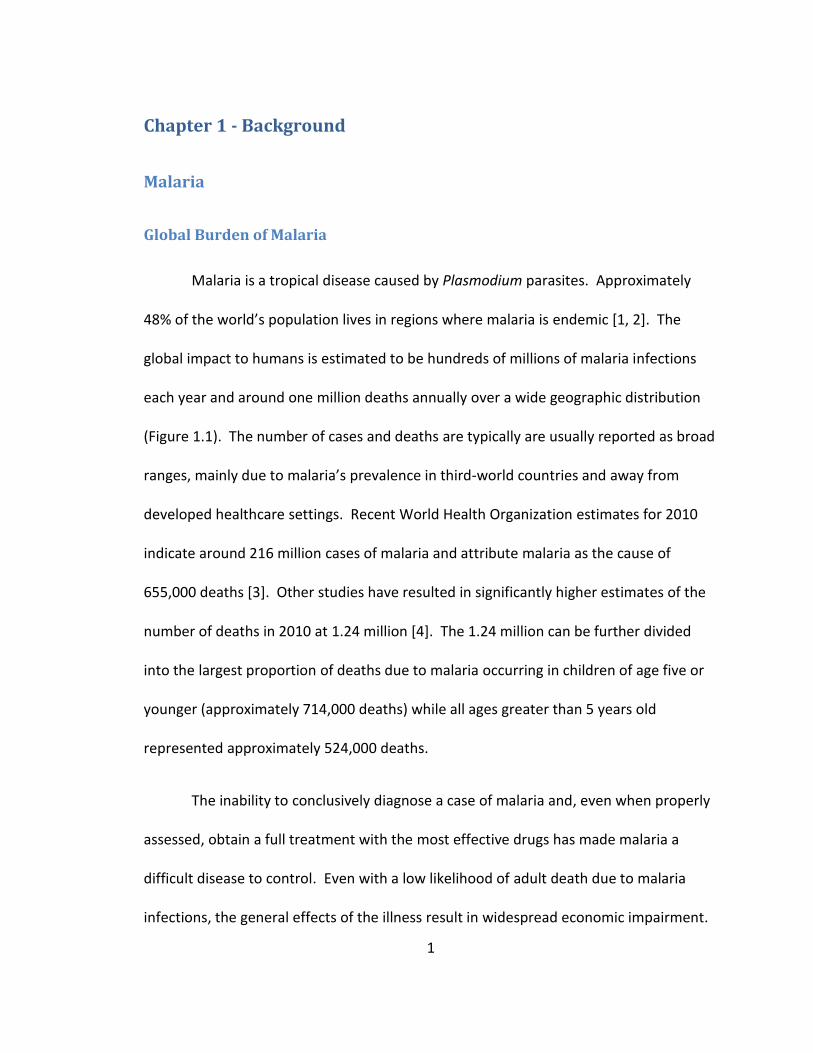
global impact to humans is estimated to be hundreds of millions of malaria infections
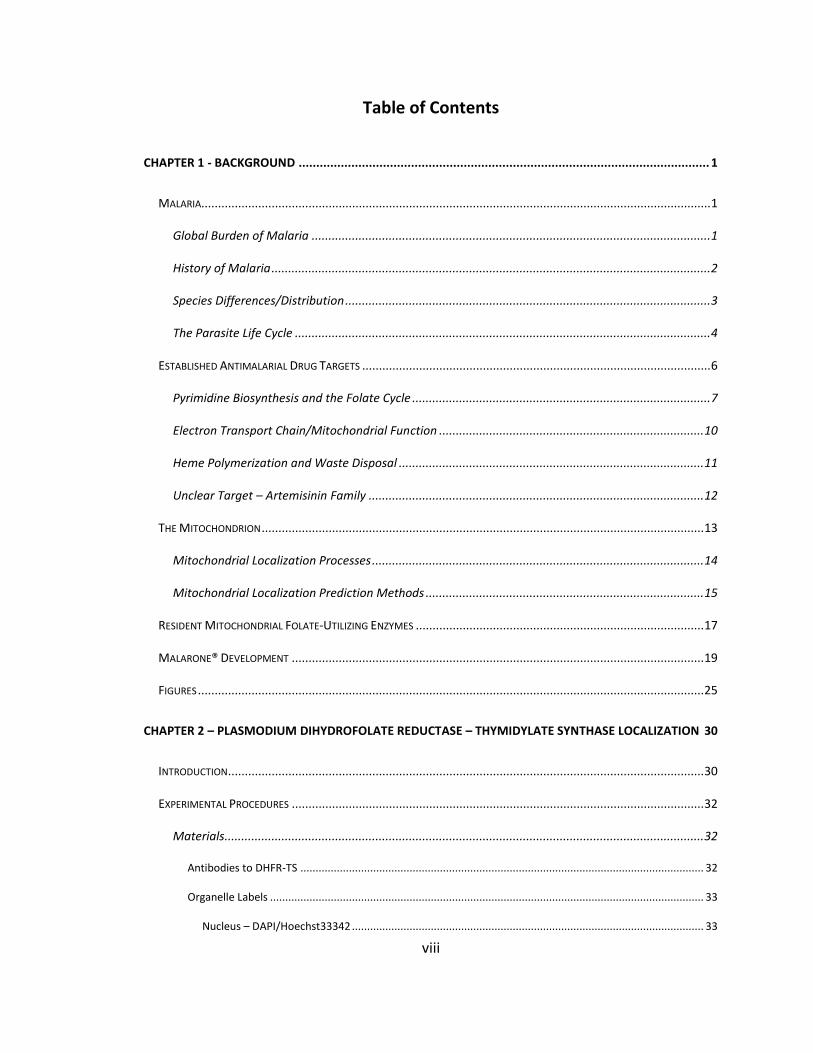
each year and around one million deaths annually over a wide geographic distribution
(Figure 1.1). The number of cases and deaths are typically are usually reported as broad
ranges, mainly due to malaria’s prevalence in third-world countries and away from
developed healthcare settings. Recent World Health Organization estimates for 2010
indicate around 216 million cases of malaria and attribute malaria as the cause of
655,000 deaths [3]. Other studies have resulted in significantly higher estimates of the
number of deaths in 2010 at 1.24 million [4]. The 1.24 million can be further divided
into the largest proportion of deaths due to malaria occurring in children of age five or
younger (approximately 714,000 deaths) while all ages greater than 5 years old
represented approximately 524,000 deaths.
The inability to conclusively diagnose a case of malaria and, even when properly
assessed, obtain a full treatment with the most effective drugs has made malaria a
difficult disease to control. Even with a low likelihood of adult death due to malaria
infections, the general effects of the illness result in widespread economic impairment.
2
The most direct cause of economic impairment is due to illness affecting the ability to
work and the need for medicines that may come at locally significant expense. Beyond
being those most likely to die from episodes of malaria, the lives of young children can
be put at a severe disadvantage by living in malaria-endemic regions. Studies have
found that malaria is responsible for primary school children in Kenya missing 11% of
school days resulting in long-lasting educational disadvantages [5]. The malaria-
attributed economic losses in Africa alone are estimated at $12 billion annually [6].
Increased public awareness and support from organizations like the Bill and Melinda
Gates Foundation, the President’s Malaria Initiative, and the Roll Back Malaria
Partnership have focused efforts to combat the disease but has also resulted in added
pressure to show marked progress [6-8].
History of Malaria
Malaria has sickened and killed humans for many thousands of years.
Genetically, the human-lethal malaria parasite species Plasmodium falciparum is an
evolutionarily recent zoonotic offshoot of the reasonably well tolerated western gorilla
malaria parasite [9]. Finding a recent species hop from gorillas to humans suggests
some species of malaria parasites that are reasonably tolerated in humans might have
co-evolved while more lethal forms are recent crossover events. The pathology of
malaria is marked by the fevers that occur, often in two day cycles. Cyclical fevers,
headaches, and chill symptoms associated with malaria infections and stagnant
marshland appear in writings from over 4,000 years ago detailing the history of Egypt,
3
Samaria, and India. The association between the disease and causative protozoan
parasites was first recorded by Charles Louis Alphonse Laveran, the Chair of Military
Diseases and Epidemics at Ecole du Val de Grace while in Algeria in 1880 [10, 11]. The
full life-cycle of the malaria parasite (from host to mosquito to host) was subsequently
observed in Indian birds by Patrick Manson and Ronald Ross in 1897 and in Roman
humans by Giovanni Battista Grassi in 1898 [12]. In temperate climates, as found in
much of the United States, where freezing winters knock down the mosquito
population, malaria eradication was achieved through widespread insecticide spraying,
land reformation, and the use of natural products and early synthetic drugs. Natural
products like quinine and artemisinin have a long history treating malaria. Many years
would pass before Western medicine had advanced to the point of developing new
synthetic drugs to combat malaria. Both quinine and artemisinin are still used to treat
malaria, with differing scopes of use.
Species Differences/Distribution
The parasite that causes malaria belongs to the Plasmodium genus. Plasmodium
parasites have a life cycle involving two hosts, a mosquito and a vertebrate. There are
five species of malaria parasites that are known to infect humans – Plasmodium
falciparum, Plasmodium vivax, Plasmodium ovale, Plasmodium malariae, and
Plasmodium knowlesi [13-15].
Of the less prevalent species, Plasmodium ovale and the morphologically nearly-
identical Plasmodium malariae take on an oval shape. Plasmodium ovale is able to

4
produce hypnozoites during infections [16]. Plasmodium malariae has a longer, 72 hour
erythrocytic life cycle, lacks a hypnozoite stage, and has a geographical distribution
similar to that of falciparum [17]. Plasmodium knowlesi is restricted to areas of
southeast Asia, where it can infects both macaques and humans, and has a rapid, 24
hour erythrocytic life cycle [18].
The two most studied and most prevalent species of human malaria-causing
parasites are Plasmodium vivax and Plasmodium falciparum. Malaria caused by
Plasmodium falciparum is implicated in half of all clinical cases and accounts for 95% of
all malaria-related deaths. Malaria caused by Plasmodium vivax accounts for 45% of all
clinical cases but is rarely implicated in malaria fatalities [19]. Plasmodium falciparum
and vivax are typically diagnosed by morphological differences observed using light
microscopy of blood smears or rapid diagnostic tests. Plasmodium vivax and falciparum,
under ideal conditions, each require different antimalarial drug treatments to address
unique features of the parasite’s life. Plasmodium vivax parasites are able to enter a
dormant state in the human liver (hypnozoites) where they do not divide and have
minimal metabolic activities for months or years before parasites re-emerge and the
infection resumes. The falciparum form of malaria does not differentiate into
hypnozoites, but the life cycles are otherwise very similar.
The Parasite Life Cycle
The life cycle of Plasmodium parasites is complex and, with the human infecting
forms falciparum and vivax, takes place in two different hosts. We will first examine the
5
overall pathway from infected mosquito to naïve human to naïve mosquito and then we
will more thoroughly examine how parasites develop and mature in the circulatory,
human blood stages (Figure 1.2) [20]. A malaria-infected female mosquito that feeds
on human blood will inject malaria parasite-containing saliva during the feeding process.
The parasites transferred during the bite are in the sporozoite life-stage. The motile
sporozoites make their way into circulatory blood until they sequester in the human
liver. Rapid replication and cell division creates massive groups of individual parasites
(merozoites) inside the liver hepatocytes. Upon release of the thousands of individual
merozoites into the circulating blood, the malaria parasite invades the red blood cell
(erythrocyte) and most continue in an erythrocyte-based replication cycle with ten-fold
or greater multiplication in each cycle. The erythrocytic, asexual replication cycle will be
detailed more thoroughly in the next paragraph. A small fraction of merozoites that
invade erythrocytes differentiate into sexual-stage parasites called the gametocytes.
When a naïve mosquito bite results in the uptake of blood containing gametocytes, the
sexual parasites develop into gametes which merge and fertilize to create zygotes. The
zygotes sequester in the mosquito gut to form oocysts. The parasite rapidly replicates
and divides into thousands of sporozoites which then migrate to the mosquito salivary
glands. An infected mosquito can thus bite a new human host and another life cycle
begins [21].
During the erythrocytic, asexual replication cycle the parasite starts from a
haploid genome and amasses materials sufficient for the individual parasite to divide

6
into ten to twenty daughter parasites over a two day period. Those daughter parasites
then rupture the red blood cell and invade new erythrocytes. The erythrocytic, asexual
replication cycle can be viewed as starting when the merozoite invades a red blood cell.
During invasion the merozoite pushes into the erythrocyte membrane via an apical
structure that uses actin-myosin motors inside the parasite to pull the parasite into the
membrane [22]. The parasite does not traverse the erythrocyte membrane, instead
wrapping itself with the membrane. The parasite ends up with a fluid bubble
(parasitophorous vacuole) that separates it from the red blood cell contents [23]. The
merozoite then develops into a ring-stage (early trophozoite) parasite where certain
organelles like the mitochondria expand and the parasite assembles many of the
substrates needed for further replication. The ring-state parasite develops into a large,
late stage trophozoite and then a schizont. As the trophozoite matures into a schizont,
the parasite replicates its genome and organelles like the mitochondria bud off until the
parasite has fully divided into a cluster of pre-merozoites encapsulated in the same
parasitophorous vacuole. The schizont then degrades the erythrocyte membranes and
allows mature merozoites to egress and find new erythrocytes to invade [22].
Established Antimalarial Drug Targets
Management of the malaria disease has depended upon chemoprophylaxis and
chemotherapy. Over time, the drugs used to treat malaria have changed significantly.
Early treatments based on natural products (e.g. quinine originally isolated from tree

7
bark and artemisinin once isolated from wormwood) are still used to treat malaria while
some of the synthetic antimalarial agents that have been mass-produced for decades
have fallen from favor due to widespread drug resistance. Following is a brief overview
of some of the most common antimalarial drug targets and the key differences between
the malaria parasite and the human host that are routinely exploited.
Pyrimidine Biosynthesis and the Folate Cycle
Reproduction of the parasite genome, a necessary step for cells to grow and
multiply, requires a sufficient supply of component DNA bases. The malaria parasite can
salvage purinic DNA bases (adenine and guanine) from the human host but lacks
components of the pyrimidine salvage pathway such that it can’t utilize the host’s
pyrimidine bases (thymine and cytosine) [24]. The only way for the malaria parasite to
obtain new pyrimidine bases for making DNA is through de novo biosynthesis, which
also depends on the folate recycling pathway (Figure 1.3) [25, 26]. During growth, the
human host is able to both make new pyrimidine DNA bases and recycle existing
pyrimidine bases. The net result of these nucleotide salvage differences is that malaria
parasites are more sensitive to DNA nucleotide supplies and imbalances than the human
host.
A number of antimalarial drugs have come from larger scale efforts to create
folate analogs to treat human cancer. The dihydrofolate reductase (DHFR) enzyme has
been a drug target since the 1940s with the introduction of aminopterin to treat human
cancer [27-30]. Further refining of aminopterin via analogs yielded methotrexate (MTX),

8
a drug still used to treat leukemia, breast/head and neck cancers, and rheumatoid
arthritis [31]. Additional folate analogs have been created to perturb the balance of
DNA nucleotides in a way that is lethal for the malaria parasite but not to the host.
During massive war-effort screening to find new antimalarials, aminopterin analogs
were identified with antimalarial activity and eventually lead to the antifolate proguanil
being the earliest DHFR-inhibiting antimalarial [32-35].
The pyrimidine biosynthesis pathway, as well as many other cellular processes,
requires a pool of one-carbon (C1) donors and acceptors to function. The folate
pathway (Figure 1.3) is one way that the cell maintains the supply of the C1 donors and
acceptors. The folate pathway can be viewed as having five steps to make the base
folate, 7,8-dihydrofolic acid (DHF) and three enzymatic steps that cycle the base folate
into other folate derivatives (THF, mTHF) which then can be converted back to DHF [26].
The folate cycle can be viewed as 7,8-dihydrofolic acid’s reduction to 5,6,7,8-
tetrahydrofolic acid via dihydrofolate reductase (DHFR) enzyme, the conversion of
5,6,7,8-tetrahydrofolic acid to N5,N10-methylene tetrahydrofolic acid via serine
hydroxymethyltransferase (SHMT) enzyme, and the conversion of N5,N10-methylene
tetrahydrofolic acid back into 7,8-dihydrofolic acid via thymidylate synthase (TS) enzyme
[36]. The folate cycle is an important process, providing multiple drug targets, because
proper one-carbon donor flux is essential to maintaining the synthesis of pyrimidine
nucleotides [37].

9
The antimalarial drugs that target the core components of the folate cycle target
the malarial DHFR. Malarial DHFR is significantly divergent from the human version of
the enzyme, differing both in sequence as well as structure by having a second enzyme,
thymidylate synthase, conjoined to it [38, 39]. The sequences of the human and malarial
DHFR enzymes align at 33% of the residues and are only 20% similar, however both
enzymes still perform the same reaction using identical substrates. While some drugs
that inhibit DHFR, like methotrexate, are cross reactive with malarial and human DHFR,
the divergent sequence and regulation of the two enzymes creates opportunities for
drug selectivity [40]. Optimizations to folate analogs have created proguanil (via its
active form cycloguanil) and pyrimethamine, which are much stronger inhibitors of the
Plasmodium DHFR enzyme, the folate cycle, and, thus, the parasite’s DNA synthesis [41].
Point mutations in the DHFR enzyme sequences are the most commonly observed
method that malaria parasites gain resistance to DHFR-targeting drugs [22, 30, 34, 42-
44].
The dihydropteroate-synthase (DHPS) enzyme is used by malaria parasites to
create the folic acid (Vitamin B9) substrate of the folate cycle. The parasite must
perform de novo synthesis of folates but the human relies on folate salvage mechanisms
and has no ability to perform de novo folate biosynthesis, providing a great deal of
selectivity. Sulfonamides such as sulfadoxine and sulfamethoxypyridazine target the
dihydropteroate synthase enzyme and reduce the malaria parasite’s ability to make
10
DNA, leading to parasite death. Resistance for DHPS-targeting drugs is typically due to
amino acid mutations in the enzyme [45-47].
Electron Transport Chain/Mitochondrial Function
Coenzyme Q is a central, membrane bound substrate involved in transferring
electrons between components of the electron transport chain in eukaryotes (Figure
1.4). Libraries of coenzyme Q analogs have, thus far, yielded one antimalarial drug. The
clinically used antimalarial/ETC inhibitor atovaquone targets the cytochrome b subunit
of cytochrome b/c1 component (Complex III) in the electron transport chain [48]. While
the intra-erythrocytic malaria parasite does not derive significant energy from the
mitochondria, it does use that organelle to perform specific tasks such as TCA substrate
conversion, iron-sulphur cluster biogenesis, ubiquinone synthesis, and some aspects of
heme synthesis [49, 50]. Inhibition of the electron transport chain can disrupt several
of these important functions. Electron transport chain inhibition by atovaquone has
long been expected to inhibit pyrimidine biosynthesis via dihydroorotate
dehydrogenase (DHODH), which also utilizes the substrate coenzyme Q [51]. The
experiments performed by Painter indicated that, at least in the red blood cell stages,
the malaria parasite’s electron transport chain’s most critical role is to recycle the
DHODH substrate coenzyme Q [52].
Unfortunately, malaria patients treated with atovaquone alone were able to
develop resistance readily, even during initial and follow up clinical trials [53-55]. For
this reason, atovaquone is not recommended for use as a prophylactic or single agent
11
antimalarial drug [54]. Atovaquone is sometimes used in advanced clinical settings as a
single anti-parasitic agent administered intravenously to treat pneumonia or parasitic
diseases such as toxoplasmosis or babesiosis [56-58]. With malaria, atovaquone is
generally combined with a secondary agent like proguanil with synergistic effect [59].
Beyond atovaquone, electron transport chain inhibition to treat malaria is still at
the development stage. The acridones are a family of inhibitors that have been
explored for their ability to act like atovaquone and inhibit mitochondrial function but
they also can be tuned to target heme processing [60, 61]. As a poly-aromatic
compound, there are good arguments for both functions being effective targets. The
acridone family resembles coenzyme Q and the pi-pi stacking can result in the acridone
binding to heme and inhibiting polymerization. The coenzyme Q-like structure has been
successful for many inhibitors and projects are actively working on advancing acridone-
based antimalarials that inhibit complex III of the electron transport chain [62].
Malaria parasites also possess somewhat unusual, non-canonical enzymes that
are coupled to the electron transport chain. One such enzyme, an alternate type II
NADH:dehydrogenase (alternate complex I, PfNDH2) has also produced interesting
experimental inhibitors based on coenzyme Q analogs, although it’s uncertain if those
inhibitors are also acting through DHODH inhibition directly [61, 63].
Heme Polymerization and Waste Disposal
A major source of materials for the intra-erythrocytic malaria parasite is human
hemoglobin contained in the red blood cells. The parasites produces proteases which
12
break down hemoglobin in an organelle compartment called the food vacuole. The
breakdown process generates a number of cellular substrates and results in the
production of a reactive and toxic byproduct, heme. The parasite minimizes heme
toxicity by polymerizing the heme into a crystalline form called hemozoin [64]. The
unique heme digestion and storage process is ripe with potential antimalarial drug
targets. Several antimalarial agents (quinine, chloroquine, mefloquine, halofantrine)
inhibit heme polymerization and perturb the digestive vacuole’s function [65-67]. The
buildup of quinine derivatives in the food vacuole generally inhibits polymerization,
changes the local pH, and kills the parasite via mechanisms involving the toxicity of the
heme. Resistance to this class of drugs is associated with mutated transporter genes
such as the chloroquine resistance transporter (CRT) or the ABC transporter “multi-drug
resistance gene” (MDR1) [68, 69].
Unclear Target – Artemisinin Family
Drugs based on the artemisinin core are derived from ancient Eastern medicine’s
use of the herb qing-hao. The natural product was isolated in the 1970s and derivatives
which improve bioavailability created the artemisinin-family drugs. Artemisinins were
long thought to inhibit the heme metabolic pathway via a radical-mechanism but the
“evidence” is not yet conclusive. Other targets like a calcium ATPase or depolarization
of the plasma membrane potential have also been implicated in artemisinin’s
mechanism of action [70-73]. Artemisinin-derived drugs are frequently used with a
partner drug because earlier use of poorly bioavailable derivatives was associated with

13
recrudescence and a second drug may help ward off the generation of drug resistance
[74]. Unfortunately, recent field reports indicate that some parasite populations along
the Thai border have acquired resistance to artemisinin as evidenced by delayed
parasite clearance [75, 76].
The Mitochondrion
The malarial mitochondria functions differently from canonical eukaryotic
mitochondria. In most eukaryotes, the mitochondrially located tricarboxylic acid (TCA)
cycle is the main source of ATP and energy for the cell. During TCA-cycle derived ATP
production, glycolysis is used to pump protons into the mitochondrial matrix and to
create an electrochemical gradient to drive the ATP synthase complex. Other functions
of the typical eukaryote mitochondria include heme and steroid synthesis, calcium
storage, apoptosis, producing warmth, and cell cycle control [77].
The malaria parasite’s mitochondria are used in an atypical manner, with
significant changes during the cell cycle [78]. In blood-stage malaria parasites the
mitochondria is far less active in energy production [79]. The morphological and
physiological conditions change significantly during the parasite life cycle, particularly
the oxygen levels that are needed for aerobic energy production. The oxygen available
in the human liver is reduced compared to circulating blood or that available in the
mosquito midgut. During the intraereythrocytic stages the malaria mitochondrion
14
progresses from a small, punctate organelle during the merozoite stage into a branched
structure in later stages. During maturation and growth of the mitochondria it greatly
reduces the number of cristate, indicating a reduction in even the ability for the
mitochondria to perform standard metabolic activity [79]. Energy production by blood-
stage malaria parasites occurs largely through anaerobic glycolysis, with the malaria
parasite’s TCA-cycle enzymes not actively producing energy [80, 81].
The malaria parasite’s unusually small mitochondrial genome has also led to
speculation that the mitochondrion of the parasite is trimmed to minimal function. The
mitochondrial genome of Plasmodium falciparum is only 6 kb and encodes the Cox I,
cytochrome b, and Cox III subunits of the electron transport chain [39, 82]. Most known
mitochondrial proteins are encoded by the nucleus to be imported post-translationally.
The mitochondria of the intraerythrocytic parasite are viewed as near-vestigial and have
only essential mitochondrial functions retained. One such function is the conversion of
various substrates using classically mitochondrial enzymes, such as those involved in the
citric acid cycle or turnover of coenzyme Q [49, 52].
Mitochondrial Localization Processes
Eukaryotic cells have organelles and internal compartmentalization of
substances into organelles like the nucleus, chloroplast, lysosome, mitochondria, and
others. The compartmentalization creates micro-environs and localized concentration
gradients which can make enzymatic processes more efficient. The Plasmodium
mitochondrion has two primary avenues for protein import to deposit proteins into

15
different compartments of the mitochondria, the TOM (translocator outer membrane)
and TIM (translocator inner membrane) complexes [50].
The understanding of localization signals in malaria parasites is still incomplete.
Predictive algorithms have been created based on similarity to proteins in more
frequently studied organisms [83, 84]. The most common algorithms have determined
that proteins targeted to Plasmodium mitochondria tend to contain N-terminal
mitochondrial targeting signals with positive charges and few negatively charged amino
acids [84]. The leading N-terminal region, sometimes found as excisable transit
peptides, interact with the translocase complexes and use the electron transport chain’s
resulting gradient to drive the translocase. The bias of N-terminal residues is not
entirely predictive of mitochondrial localization in the plasmodium parasite as some
transmembrane domains, C-terminal, and internal targeting motifs have been
demonstrated to control localization [85, 86].
Mitochondrial Localization Prediction Methods
There are many shortfalls in our ability to predict the localization of proteins
based on raw genetic sequence. Large-scale gene sequencing vastly expanded the data
available to determine localization signatures. Most efforts have gone into the study of
model organisms or those with the greatest payoff (humans), with little attention paid
to apicomplexa like Plasmodium. After the malaria parasite genome was published, the
inability of common eukaryote genomic prediction methods to appropriately interpret
the Plasmodium genome became evident and required further algorithm development.
16
Despite efforts to design good algorithms, protein localization still requires biological
verification. An example of algorithms falling short is illustrated by the lipoic acid
scavenging enzyme LipL1 which has been GFP tagged and found to localize to the
mitochondria while it is predicted by MitoProt II algorithm to be mitochondrially
targeted with a probability of 0.93, apicomplexa-targeted PlasMit predicts a cytosolic
localization with a 99% confidence [87].
MitoProt II
Efforts to predict mitochondrial localization have resulted in computer
algorithms that are trained with data sets of proteins expected or known to be localized.
The predictive ability of the resulting algorithms can be cautiously useful. MitoProt II is
an early algorithm developed for predicting mitochondrial localization in eukaryotes
based on the N-terminal sequence [88]. The authors of the program developed 47
parameters that were evaluated against the 40 N-terminal residues. Claros et al claim a
75-97% prediction rate for proteins that have been studied, although the method was
developed using a limited base of only 61 known mitochondrial proteins (an additional
49 were putative)[88].
TargetP
With further refinement, the prediction algorithm for eukaryotic localization
TargetP was released in 2000 [89, 90]. TargetP 1.1 is a neural-network based tool
designed to take the N-terminal protein sequence of eukaryotic genes and predict the

17
localization to mitochondria, chloroplasts, the secretory pathway (ER, Golgi), or some
“other” location. The designers claim a 90% success rate for non-plant genes in
redundancy-reduced test sets [89].
PlasMit
In order to address shortfalls in the general eukaryote predictions when applied
to apicomplexans, a Plasmodium-specific neural network-based algorithm called PlasMit
was developed in 2002. The PlasMit algorithm analyzes 19 physiochemical properties
as well as amino acid frequencies of the first 24 N-terminal amino acids. The algorithm
predicted that N-terminal sequences more abundant in isoleucine, tyrosine, asparagine,
and lysine are more likely to be localized to the mitochondria [84]. The designers of the
PlasMit algorithm reported 84% correct prediction in a 10-fold cross-validation study.
The algorithm has been cited as predicting 381 mitochondrial genes out of 5,334
annotated genes in the Plasmodium falciparum genome [85]. Experimentally, others
have found mitochondrial localization signals of folate cycle proteins are much more
involved than just the first 24 amino acids [85, 91, 92].
Resident Mitochondrial Folate-Utilizing Enzymes
Organisms require folic acid for many of their one-carbon metabolic activities.
Certain plants, like carrots, peas, potatoes, mosses, and pines, have been found to
sequester their folate-recycling enzymes in organelles like mitochondria or chloroplasts
18
in a way that may make the folate cycle more efficient [93-95]. Most plants also possess
a bifunctional DHFR-TS enzyme (e.g. carrots, Arabidopsis thaliana, soybeans, and corn)
[96-100]. Beyond plants, the bifunctional DHFR-TS motif is also observed in the DHFR
and TS genes of protozoa like Leishmania, Trypanosoma, and Plasmodia [101, 102].
Advances in tools and genetic manipulation have made it possible to identify the
cellular distribution of many enzymes, including those of the malaria parasite. Recent
papers have examined the localization of several enzymes related to the folate cycle.
Some have found HProtein, a component of the glycine cleavage system, which is
coupled to SHMT, to be localized to the mitochondria [103]. A more complicated
pattern has been observed for both the cytoplasmic and mitochondrial SHMT isoforms
[91, 92]. Read et al suggests that the cytoplasmic SHMT is not excluded from organelles
like the mitochondria and apicoplast [91]. Read et al also found the mitochondrial
SHMT is well distributed throughout the cell but has some bias for the mitochondria as
well as the tips of apicoplast. Curiously, transfection with a truncated version of the
mitochondrial SHMT with only one hundred N-terminal amino acids and a GFP domain
resulted in a solely mitochondrial localization [91]. Supporting the theory of large
domains determining mitochondrial localization, the mitochondrial SHMT’s first 80
amino acids fused to GFP resulted in a mixed localization of mitochondrial and cytosolic
signal [92]. Additionally, fusions with segmented 40 amino acid domains walking down
the N-terminal 120 amino acids of mitochondrial SHMT were all cytoplasmic and only

19
full length SHMT sequence (or that with the first 24 amino acids deleted) was exclusively
mitochondrial [92].
Our investigation concerns the localization of DHFR-TS, which performs two of
the three catalytic functions involved in the folate cycle. The localization prediction
methods TargetP and PlasMit fail to identify any transit peptides and are unable to
predict any localization for DHFR-TS. As highlighted by SHMT, the third component of
the folate cycle, prediction algorithms may provide an initial hypothesis for localization
but the diverse and uncertain determinants require follow-up with biologically relevant
studies to demonstrate localization.
Malarone® Development
Proguanil
The prevailing theory of proguanil’s activation to cycloguanil requires specific
cytochrome P450s enzymes that are most abundant in the human liver (CYP2C19,
CYP3A4, and CYP2D6) [59, 104, 105]. Proguanil was developed in the western world
where CYP2C19 deficiency is rare but as many as 13-23% of Asian and other ethnic
populations are deficient in CYP2C19 activity. When proguanil was developed as an
alternative for Ally soldiers unable to acquire quinine, the lack of attention to poor
metabolizer phenotypes was not a great concern. After wartime usage, the high
20
prevalence of these deficiencies in locations with endemic malaria led to studies of
drug’s efficacy amongst populations where CYP2C19 poor metabolizer phenotypes are
common. Unfortunately, people in the Philippines and Vietnam, where the phenotype
for CYP2C19 activity is low, were the same populations that would most benefit from an
affordable antimalarial like proguanil. Over time, larger studies with have shown that
people with CYP2C19 deficiencies and reduced abilities to convert proguanil to
cycloguanil have proguanil-based cure rates statistically equal to normal metabolizers, a
very unexpected result [106-108]. While most people have the ability to convert
proguanil into cycloguanil, the seeming lack of correlation between cure rates and
conversion has not been explained.
Additional studies have found direct administration of proguanil more effective
at treating malaria than cycloguanil, leading to hypotheses about a direct proguanil
activity which never developed beyond speculation [109-112]. Adding to possible
alternate targets, it has been suggested cycloguanil metabolites have their own targets
as the susceptibility to cycloguanil can vary significantly between parasite isolates with
identical DHFR sequences [113, 114]. The mechanism by which in vitro cultures of
parasites, where no liver-based CYP450 metabolism is occurring, are killed by proguanil
is not yet known [115]. In 1998, David Fidock bypassed malarial DHFR inhibition by
transfecting human DHFR into malaria parasites [112]. The presence of human DHFR
generated 1,000 fold shifts in the nanomolar levels of cycloguanil potency but no change
in the high micromolar proguanil potency. The lack of a proguanil EC50 shift was cited as
21
evidence for a non-DHFR target for proguanil, but no candidate was proposed [112].
There have been no other proguanil targets identified beyond the cycloguanil-based
target enzyme DHFR.
Atovaquone
Atovaquone was created as an analog to ubiquinone, a substrate known to be
important in the electron transport chain as well as other processes. Atovaquone’s
development as a treatment for malaria hit a stumbling block when resistance emerged
in patients during clinical trials [53, 54, 116]. Following drug treatment and an initial
reduction in parasitemia, parasites frequently recrudesced after developing mutations
in the cytochrome b component of the electron transport chain [117-119]. The resulting
67% cure rate at 28 days was considered too low for further development of
atovaquone as a monotherapy [120]. Already approved drugs with antimalarial activity
were investigated for use as partner drugs (tetracycline, doxycycline, pyrimethamine,
and proguanil) and acceptable performance reported with doxycycline, tetracycline, and
proguanil [54]. Tetracycline was a strong candidate, but fast elimination and tooth
enamel staining were concerns. The tetracycline analog, doxycycline, had a longer half-
life, but adverse reactions in young children made it less desirable [116, 121]. The
slightly improved performance of atovaquone with proguanil, combined with the
relatively impermanent side effect of stomach upset, low cost, and atovaquone-
compatible dosing schedule, made proguanil the better partner choice. Atovaquone

22
drug development was rescued by combining with proguanil and the resulting
treatment consists of both proguanil and atovaquone [59].
Malarone®
The first characterization of the combination of proguanil and atovaquone as
synergistic was reported in 1995, although atovaquone and the proguanil-like PS-15 (a
prodrug of WR99210) synergy was reported in 1993 [59, 122]. In a synergistic drug
combination, multiple drugs combine to give a response beyond what would be
predicted by simple addition of single drugs. In the case of Malarone®, as shown in
Table 3.1 and 3.2 B, the EC50 of proguanil was found to be 13 µM and atovaquone
measured at 4.6 nM in 3d7 parasites. When only 1 nM atovaquone was combined with
proguanil, the measured EC50 of the proguanil with 1 nM atovaquone was shifted 81
fold to 0.16 µM.
Theories to explain the synergy between proguanil and atovaquone have been
proposed and updated over the years, but none have been biochemically verified.
Initially, it was assumed that the synergy between antifolates and atovaquone came
from the ubiquinone link (Figure 1.5) between the electron transport chain and
pyrimidine biosynthesis (both DHODH’s need for ubiquinone and DHFR inhibition by
cycloguanil) [116]. Experiments in culture flasks also displayed synergy between
proguanil and atovaquone, contradicting the presumed mechanism which required
metabolic activation of proguanil to cycloguanil by liver-based cytochrome P450s [59].
When populations deficient in the P450s responsible for creating cycloguanil were

23
investigated, the combination of proguanil with atovaquone was still sufficiently
effective to avoid changing the proguanil component of the formulation and supported
ideas of alternate mechanisms of action [123]. One lab has offered multiple theories,
including one where proguanil, as a biguanide, was responsible for causing the gradient
of the electron transport chain to become “leaky” but only with atovaquone and no
other ETC inhibitors [124]. In additional studies, Painter et al transfected parasites with
yeast-derived DHODH that would bypass the need for ubiquinone recycling to function.
The parasites were highly resistant to ETC inhibitors but the combination of proguanil
with atovaquone was still lethal. Painter et al proposed an alternate theory that
proguanil’s alternate target was something used to create a mitochondrial membrane
potential after the main driver of that potential, the electron transport chain, was
inhibited [52]. Despite never resolving the synergy or alternate target for proguanil, the
drug combination has been sufficiently effective that its use has continued and it is now
the most prescribed antimalarial in the US [125].
The product of combining proguanil and atovaquone is a single pill called
Malarone®. A Malarone® tablet contains 250 mg of atovaquone and 100 mg of
proguanil hydrochloride and the dosage schedule is once a day for prophylactic use and
four pills at a time as a treatment dose [123]. The Malarone® combination achieved an
average 98.7% cure rate against Plasmodium falciparum over ten studies involving five
hundred patients where patients were given treatment for three days, including those
living in areas where proguanil resistance was widespread [116]. The steady state
24
concentrations of proguanil and cycloguanil have been reported at 131 - 473 nM and 57
- 154 nM, respectively [126, 127]. The elimination half-lives of the compounds are a bit
more imbalanced, with proguanil’s half-life of 14 hours and atovaquone’s half-life
measuring just under six days [107, 128, 129]. Physiologically, the Malarone®
combination results in proguanil/cycloguanil as the fast acting agent and atovaquone
acting as the long-lasting agent to clear any lingering parasites. The still-great mystery
surrounding how the two components of Malarone® interact is how patients with a
reduced ability to convert proguanil into cycloguanil differ so significantly in cycloguanil
exposure, with a 3 hr post-dosage cycloguanil plasma concentration of 71 nM in poor
metabolizers but 171 nM in normal/extensive metabolizers (proguanil was 4,030 nM
and 3,721 nM), yet clinical trials of the combination indicate similar cure rates even
where parasites are largely resistant to antifolates [107, 116].

25
Chapter 1 Figures
Figure 1.1 – Cumulative Probability of Death Caused by Malaria (2010) The likelihood of an individual’s death to be caused by malaria infection at any point in an individual’s life, from ages 0-80, is grouped into color coded countries. Countries in Africa and parts of Southeast Asia have particularly high likelihoods of death caused by malaria. Figure used with permission from Murray 2012.
26
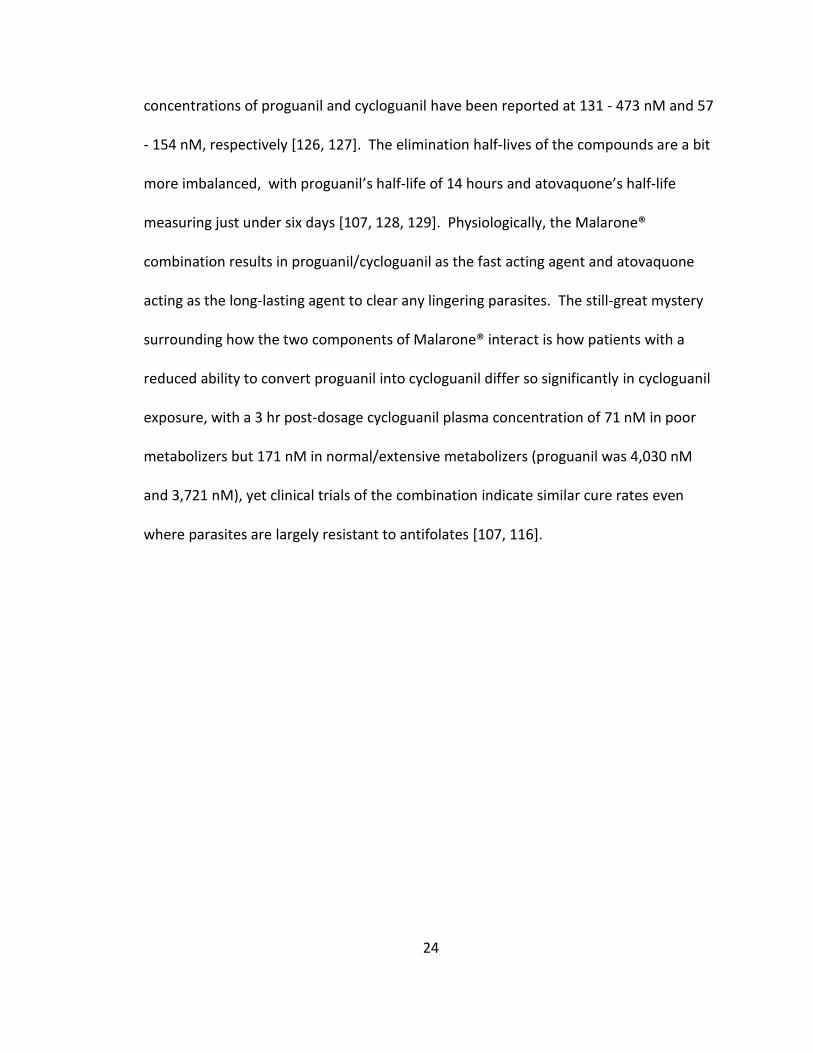
Figure 1.2 – The Malaria Parasite Life Cycle Spans Two Hosts The human-infecting malaria parasite’s life cycle is complex and involves two hosts. The sequence depicted most closely resembles the life cycle of Plasmodium falciparum. Starting the malaria life cycle from the initial infection, a malaria-infected Anopheles mosquito injects sporozoites during a blood meal. Sporozoites then make their way into liver hepatocytes. Upon infecting hepatocytes, the parasites undergo several rounds of replication before maturing into exo-erythrocytic merozoites released into the blood stream. Merozoites invade erythrocytes and grow through ring stages into trophozoites and mature schizonts. A fully matured schizont then ruptures the cell and releases merozoites that invade new erythrocytes. A small fraction of asexual, blood stage malaria parasites differentiate into sexual-stage parasites called gametocytes that can be taken up with circulating blood to infect mosquitoes. Once entering the mosquito gut, maturation of the male and female gametes occurs. Upon sexual recombination, a fertilized zygote develops into ookinetes and oocysts, eventually releasing sporozoites that can infect another human. Figure used with permission from Cowman et al.,
2012. Originally published in JCB. doi: 10.1083
27
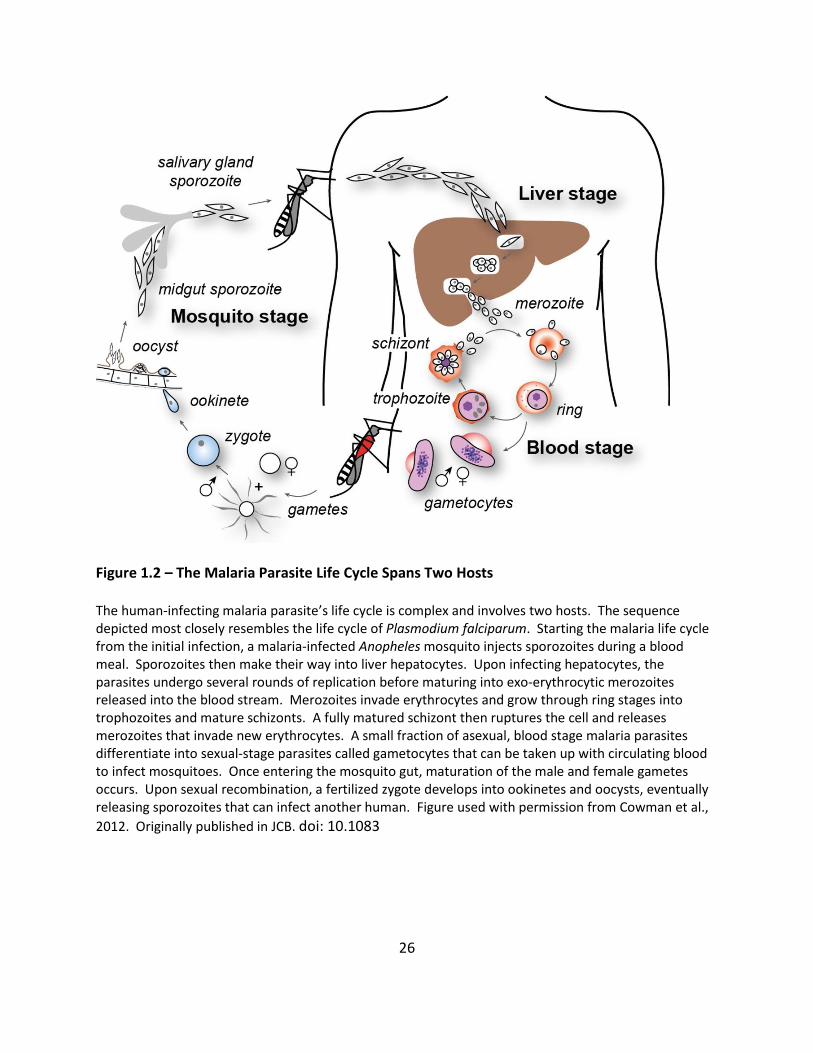
Figure 1.3 – Pyrimidine Biosynthesis and the Folate Cycle The pyrimidine biosynthesis pathway (blue) has a number of components that are targeted with antimalarial drugs. The dihydrofolate reductase (DHFR) enzyme of the folate cycle (lavender), necessary for methyl transfer in a number of processes, is targeted by drugs like cycloguanil and pyrimethamine. Dihydropteroate synthase (DHPS) is involved in folate biosynthesis, prior to the depicted folate cycle, and was often targeted alongside DHFR in combination drugs like sulfadoxine-pyrimethamine.
28
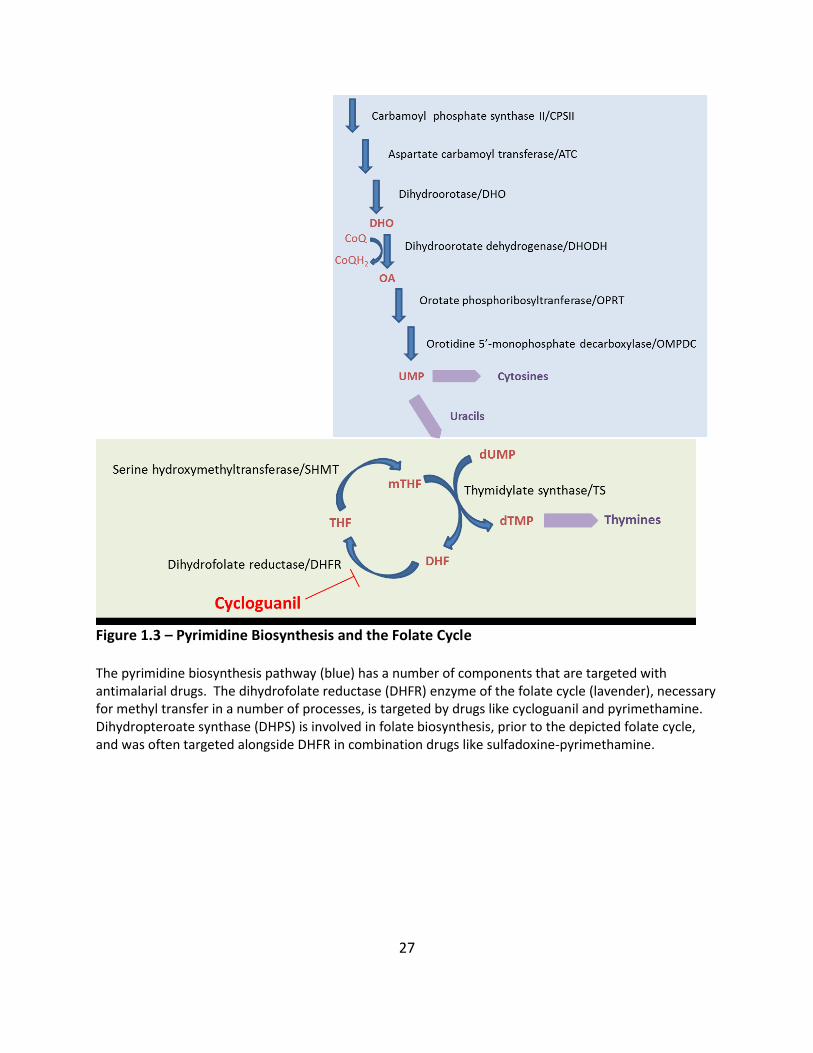
Figure 1.4 - Major Components of the Plasmodium Electron Transport Chain The main components of the malarial electron transport chain and dihydroorotate dehydrogenase (DHODH) are depicted in (a). Compared to most eukaryotes, the parasite no longer posesses a canonical Complex I and, instead, has a non-proton pumping NDH (NADH dehydrogenase or NADH:ubiquinone oxidoreductase) that reduces ubiquinone. The malarial Complex II is called succinate dehydrogenase. Complex III is comprised of two subunits (cytochrome b and cytochrome c1) and is called the ubiquinol:cytochrome c reductase complex. Complex IV is called the cytochrome b oxidase complex. DHODH is membrane-associated and utilizes the membrane associated coenzyme Q substrate which is regenerated by Complex III. (b) contains a diagram of the reaction sites of Complex III. Atovaquone, myxothiazol, and several other coenzyme Q analogs inhibit at the Q0 site of Complex III. Antimycin A inhibits at the Qi site of Complex III. Inhibition of Complex III disrupts the membrane potential gradient and results in a buildup of reduced coenzyme Q, eventually leading to reduced DHODH activity. Figure used with permission from Vaidya 2009.

29
Figure 1.5 – Potential Synergistic Coenzyme Q-based Link between Pyrimidine Biosynthesis Pathway, Electron Transport Chain, and the Folate Cycle Coenzyme Q flux has been viewed as the source of synergy that links the electron transport chain (Complex III is in the red box) to pyrimidine biosynthesis (blue box) and the folate cycle (lavender box). Atovaquone inhibits the Q0 site and reduces the amount of oxidized coenzyme Q present. The pyrimidine biosynthesis pathway (blue box) requires DHODH activity, which requires oxidized coenzyme Q as a substrate. The folate cycle (lavender) is also necessary for pyrimidine biosynthesis and the DHFR enzyme is targeted by cycloguanil, the active form of proguanil. Multiple enzymatic targets in the same pathway may lead to drug synergy, although localization of enzymes and their targets may also lead to synergy.
30
Chapter 2 – Plasmodium Dihydrofolate Reductase – Thymidylate
Synthase Localization
Introduction
The malaria parasite’s dihydrofolate reductase (DHFR) enzyme was the first
target that synthetic antimalarial drugs were specifically designed to inhibit. The DHFR
enzyme catalyzes an obligate step in the folate cycle, a cycle that regenerates folate-
derived C1 carriers used by the pyrimidine biosynthetic pathway. Malaria parasites are
required to perform their own pyrimidine biosynthesis and maintain a balanced supply
of nucleobases to survive and replicate.
Although single antimalarial drugs targeting DHFR have fallen out of favor due to
established drug resistance, several actively used antimalarial drug combinations mix a
DHFR inhibitor with another drug, often targeting other components in the pyrimidine
pathway. The drug combination sulfadoxine and pyrimethamine inhibits folate
synthesis via the dihydropteroate synthase (DHPS) enzyme and the folate cycle via the
DHFR enzyme. Malarone®’s mode of action is slightly more complex, but it combines an
electron transport chain inhibitor, atovaquone, with a pro-drug for a DHFR inhibitor
(proguanil as the pro-drug for cycloguanil). The electron transport chain generates a
proton gradient in the mitochondria. That proton gradient is utilized for several
purposes, including the import of proteins to the mitochondria. The bifunctional DHFR-
TS motif of malaria parasites is something also observed in plants. Plants are known to
sequester folate-recycling enzymes in organelles. Further implicating the pyrimidine

31
biosynthesis pathway with the mitochondria, dihydroorotate dehydrogenase (DHODH)
is mitochondrial, requiring a mitochondrial membrane-bound substrate, and the malaria
parasite’s folate cycle enzyme serine hydroxymethyltransferase (SHMT) has an isoform
with a mitochondrial localization signal.
We set out to determine the localization of malarial DHFR, a drug target with a
long history but also a challenging enzyme with low expression levels [40]. Knowing the
localization of the drug target will help explain how current drugs work and multiple
drugs interact. We applied laser-scanning confocal microscopy to compare DHFR
localization patterns observed to various organelles. An algorithmic assessment of the
colocalization between organelles and DHFR was employed to help compensate for low
amounts of fluorescent signal while not biasing our interpretation. In total, signals from
mitochondrial dye, a native mitochondrial protein, and a GFP tagged mitochondrial
protein were all compared to the DHFR signal. Pushing beyond what is common for
biological studies of localization, we also employed a non-microscopy-based method of
cell fractionation to assess the localization of DHFR to the mitochondria.
32
Experimental Procedures
Materials
Antibodies to DHFR-TS
Custom polyclonal Plasmodium falciparum and Plasmodium vivax DHFR-TS
antibodies were generated in rabbits. The supplier, GenScript, was provided with lab-
generated reference standards of crude, recombinant target protein expressed in the
wheat germ-cell free system with an N-terminal GST tag and a “background control” of
wheat-germ lysate. To further evaluate reactivity and specificity, we provided lysates of
3d7 Plasmodium falciparum parasites and 3d7 Plasmodium falciparum parasites which
were transformed to express Plasmodium vivax DHFR-TS enzyme. The peptide antigens
were generated with proprietary computer algorithms and several potential antigen
peptides evaluated for antigenicity in rabbits. The rabbits were immunized twice before
serum was used to screen responses to the target peptide. The best candidates were
further subjected to two additional booster inoculations before serum was collected
and antibodies purified with antigen peptide affinity columns.
The resulting antibodies reacted with the peptides KLKWKRERYLRMEAc
corresponding to PvDHFR and NNDMPLKNDDKDTc corresponding to PfDHFR’s
joining/hinge region. The results of the lalign algorithm with the antigen regions
highlighted predicts the species specificity (Figure 2.1) [130]. BlastP evaluation of both
33
antigen sequences revealed extremely limited domains of homology to any genes in the
human or Plasmodium falciparum genome, aside from the respective, intended targets.
Antibody specificity was assessed using parasite lysates from the major parasite
strains used during the course of the thesis (3d7, PvDHFR-TS(wt) 3d7, PvDHFR-TS(cycR)
3d7, Dd2, HProtein-GFP Dd2, ACP-GFP D10) and against recombinant standards
produced in a wheat germ expression system. The species specificity of the falciparum
and vivax antibodies was demonstrated in Western blots against Plasmodium
falciparum parasite lysates, including lysates created from a PvDHFR-TS expressing
construct in 3d7 parasites as Plasmodium vivax cannot be continually cultured in vitro
(Figure 2.2).
Organelle Labels
Nucleus – DAPI/Hoechst33342
The nucleus of the malaria parasite begins as a single organelle in the early
erythrocytic stage of the parasite’s life cycle. Over the life cycle the genome replicates
and the nucleus divides to reach approximately 14-20 nuclei in a schizont-stage parasite.
Certain cationic dyes like DAPI and Hoechst 33342 bind DNA at the minor groove, with a
preference for A and T nucleobases, and are able to mark the location of the nucleus
where DNA concentration is highest [131-133]. The DAPI and Hoechst 33342 dyes have
been utilized to mark the nucleus of malaria parasites in our lab for years. Of
morphological note, in merozoite stages or late trophozoite/schizont stages the malaria

34
parasite’s nucleus frequently appears to have a hollow, like puffed oats, due to the
nucleus being squeezed aside by other organelles in a very confined cell.
Mitochondria – Mitotracker/HProtein-GFP/PfDHODH
The Plasmodium mitochondrion is a slightly acidic environment with lipophilic
character due to the cristae that comprise its inner membrane. Dyes like mitotracker
take advantage of the reduced pH and lipophilicity to be taken up into the
mitochondria. Once inside the mitochondria, the mitotracker dyes react to form
covalent bonds with free thiols which aid dye retention during fixation and
permeabilization steps [134]. Commercially available, reduced forms of Mitotracker
Orange (M-7511) and Mitotracker Red (M-7513) and non-reduced Mitotracker Deep
Red (M-22426) were procured from Life Technologies/Invitrogen and utilized as
appropriate at 75 - 100 nM concentrations.
A 2010 paper by Spalding et al has localized the HProtein subunit of the glycine
cleavage complex to the Plasmodium falciparum mitochondria [103]. In many
organisms the glycine cleavage complex (a central component of fatty acid biosynthesis)
is established as mitochondrially localized [135]. The N-terminal sequence of HProtein
was used to generate transfection plasmids that express HProtein with a C-terminal
green fluorescent protein (GFP) fusion construct. The Prigge lab was kind enough to
provide this parasite line as a reference but it should also be noted that integration of
the attB mycobacteriophage targeting site to the Dd2 parasite genome has also inserted
a human DHFR gene into the parasite line, additional to the intended plasmid. While
35
the HProtein is still useful as a marker for mitochondria, human DHFR can impart
resistance to many DHFR-based antimalarial drugs and limits the drug-response studies
that can be performed with H-proteinDd2 cells.
The HProtein-GFP containing Dd2 parasite line was also applied to digitonin-
based cell fractionation experiments. The C-terminal GFP tag was probed with the
monoclonal anti-GFP antibody used for immunofluorescence imaging (Santa Cruz
#sc9995). HProtein-GFP containing Dd2 parasites provided a valuable, published
standard for a mitochondrial protein.
Mouse sera containing polyclonal antibodies to the malarial dihydroorotate
dehydrogenase enzyme were obtained from the Vaidya lab and the Phillips lab in limited
quantities. Malarial DHODH has a well-established membrane anchor and requires a
membrane-associated ubiquinone cofactor [136]. The native DHODH protein served as
a scientifically interesting control for a mitochondrial protein that could also be probed
and correlation evaluated [137].
Apicoplast – ACP-GFP
The apicoplast is an organelle common to the phylum Apicomplexa. An
abundant protein localized to the Plasmodium apicoplast is acyl-carrier protein, an
enzyme central to fatty acid biosynthesis. The McFadden lab developed a transfection
plasmid to probe apicoplast protein localization and included both the signal and transit
peptide domains necessary for targeting the GFP construct to the apicoplast [138].
36
Previously transfected D10 parasites containing the plasmid were utilized with the
localized GFP signal marking the apicoplast.
Endoplasmic Reticulum – ER-Tracker Blue-White DPX
The endoplasmic reticulum (ER) of the cell is usually viewed as a center of
protein translation and substrate storage. The Plasmodium ER tends to be associated
with the nucleus and may be labeled with ER-Tracker Blue-White DPX dye (Life
Technologies/Invitrogen #E-12353). The red and blue versions of the dye have been
reported as effective for live Plasmodium falciparum parasite imaging [139, 140]. ER
Tracker Blue-White DPX dye is partially retained after fixation and is able to be
visualized in the UV/blue fluorescence range with 430 nm excitation maximum and
emissions from 430-640 nm. Cells were treated with ER-Tracker Blue-White DPX for 30
minutes at 250 nM prior to fixation.
Digestive Vacuole – LysoTracker Red
The lysosome of the cell is an acidic environment where the cells break down
proteins into smaller peptides for reuse. The parasite has one large lysosome in the
digestive vacuole. The parasite also has auxiliary lysosomal bodies that may be a part of
a functional endocytotic/autophagocytotic system [141-143]. Lysotracker Red dye has
been shown to label the malaria parasite’s digestive vacuole well [141]. Lysotracker Red
DND-99 was procured from Life Technologies/Invitrogen (#L-7528) and applied directly
to 100 nM concentration.
37
Methods
Localization Prediction Algorithms
The most frequently cited mitochondrial/apicoplast localization prediction
algorithms for Plasmodium parasites are PlasMit and MitoProt II. For this work the
PlasMit progam was used to judge mitochondrial sequence localization. The MitoProt II
program was also used to help examine if DHFR-TS had any signals for localization to the
mitochondria and the apicoplast. The mitochondria and apicoplast organelles develop
at the same time and in proximity to each other, requiring great care in judging one
from the other via microscopy.
Image Analysis Algorithms
For colocalization analysis, images were captured on a Zeiss META 510 confocal
LSM system with a 63x oil immersion lens. The pinhole diameter was set to 1 airy unit
for the longest wavelength light source (generally the 543 nm laser) and all other light
sources had pinhole diameters set to match the optimal imaging section’s depth. The z-
stack slices were then captured using the “optimal” setting for the longest wavelength
imaged to minimize oversampling (generally 0.41 µm and 8 to 12 slices were captured,
of which approximately six capture the full depth of the parasite). The images were
examined via both Zeiss LSM Image Browser v4.2 and the FiJi collection of ImageJ plug-
ins.
The FiJi-ImageJ suite of programs contains several plug-ins useful to quantify
colocalization of different signals in a specimen [144]. The algorithm used by the

38
colocalization plug-in can evaluate many different features of the image. It quantifies
where each voxel (volumetric pixel) in a stack of images overlaps from one channel to
another in order to assign numerical values which help compare entirely different
images to one another. The parameter we used to evaluate the images was, primarily,
the Pearson’s correlation coefficient value [145]. The Pearson’s correlation value
quantifies the covariance of two signals in the image. Ideally, two signals that vary
perfectly together, such that strong signals overlap each other and weak signals overlap
each other, will lead to an R coloc value as high as 1. If a strong signal in one channel is
never found with a signal from the other, the R coloc value has a lower limit of -1. If the
algorithm determines there is no relation, a Pearson’s correlation coefficient value near
0 is expected. The FiJi colocalization plugin computes a lower threshold for what is
considered “signal” in the image via the Manders’ thresholding algorithm and calculates
a thresholded Pearson’s correlation coefficient (R coloc) based only on signals exceeding
the threshold [146]. Additional considerations must be given when the images captured
are devoid of background signals and otherwise “dark” around the colored areas. Cells
displaying low, background-type fluorescence on a slide of no signal may yield moderate
values of correlation if the threshold is too low. If the image is rescaled and a more
stringent threshold is set for signals, such that only the most intense signals are
considered, the bar for finding covariant signals is significantly higher and moderate
thresholded overlaps are significant.
39
One way to perform the analysis is to consider the whole image, permit the
program to determine which signal levels represent background, and to allow it to
output the Pearson correlation coefficient. For that method, the images were opened in
FiJi (an ImageJ-based suite of tools), the color channels separated, and the image stack
analyzed using the colocalization plugin. Another way to analyze the image is to crop to
an infected erythrocyte, rescale the color thresholds, and only evaluate the intense,
focal signals. If a stringent threshold was to be used the image was rescaled using the
brightness/contrast tools to set the minimum and maximum color values of the 8 bit
image. To ensure that images were of high quality, no images were analyzed where
more than half of the color depth was removed unless the images were controls where
low to no signal is to be expected in certain channels.
The thresholded Pearson’s correlation coefficient (R coloc as labeled by FiJi’s
plugin) also needed to be examined with respect to the number of colocalized pixels
considered for the calculation. Some images that contained very intense, localized
signals gave stronger correlations but only a small number of pixels overlapped. Some
images with diffuse signals showed broad swaths of the image which appeared to
overlap weakly with one another. The R coloc values have difficulty comparing such
vastly different signals from the background and demanded attention be given to what
images are being compared. If the image had been manually thresholded to evaluate
only the stronger signals (useful when mitochondrial branches are present but also
contain moderate background signals) the R coloc value becomes influenced by the

40
manually set threshold. As a general guide, most high quality images captured
contained background intensities that could be thresholded out at less than 10% of the
total signal range captured.
Base Microscopy Protocol – Paraformaldehyde Fixed Cells
Sample Fixation and Permeabilization
Parasites to be imaged were grown in complete, serum supplemented RPMI-
1640 media and red blood cells prior to being prepared for microscopy. Complete
media was removed, the sample divided into multiple tubes or flasks, and fresh media
added. In instances where fluorescent dyes were to be added less than an hour before
sample preparation, the dye was added directly to media comprised of RPMI without
phenol red indicator in order to minimize the conflicting fluorescent signals and lipid
contents. In antibody-only sample preparations, parasites were isolated from flasks
grown in standard complete media. Dye was directly added to parasites suspended in
approximately 5 mL of media, the parasites put under gas, and the sample incubated at
37 °C during dye treatment.
Following dye treatment, the contents of the flasks were removed to a 50 mL
centrifuge tube and spun for 3 minutes at 800 rpm/~120 rcf in a Sorvall Legend X1r
swinging bucket centrifuge at 4 °C. The media was removed and the pellet resuspended
in 5 mL of cold PBS. The sample was again spun for 3 minutes at 800 rpm at 4 °C. The
supernatant was removed and the pellet resuspended in PBS to ~1.5 mL total volume
before 4.5 mL of a freshly made 5% para-formaldehyde (PFA) in PBS solution was added
41
(effectively, 3.8% PFA final concentration). The sample was inverted occasionally to
avoid having the parasites settle. Glutaraldehyde was added after 10 minutes to
supplement the PFA to to 0.009% glutaraldehyde fixative, which helped retain the red
blood cell external membrane. After 5 minutes of further fixation the parasites were
spun down at 300 rpm/17 rcf for 9 minutes and the supernatant removed until the
remaining contents of the tube were approximately 1 mL. With little delay, the pellets
were resuspended in 4 mL of cold PBS via inversion and gentle orbital shaking. The cells
were again spun down at 300 rpm for 8 minutes. Following sedimentation, the
parasites were resuspended in 2 mL of cold PBS via inversion and gentle orbital shaking.
Permeabilization of membranes was performed using 3 mL of PBS with 0.1% v/v Triton-
X 100 for better penetration by antibodies, when appropriate. The parasites were then
spun down at 300 rpm for 8 minutes. The intracellular red hemoglobin protein rapidly
dissipated from this point forward. The supernatant was removed and the pellet
resuspended in 3 mL of cold PBS and then 3 mL of 3% BSA (w/v) PBS was added to react
with any available aldehyde groups and block reactive surfaces. The blocking mixture
was allowed to react for 20 minutes before the cells were spun down at 300 rpm for 8
minutes, the supernatant removed, and 3% BSA in PBS added and the suspended cells
were allowed to block for an additional hour. The cells were then spun down at 300
rpm for 8 minutes, the supernatant removed, and 3% BSA in PBS added to a total
volume of approximately 0.8 mL.
42
The preferred method for mounting parasites for imaging was to activate the
surface of a glass cover slip via brief exposure to a Bunsen burner’s flame and then allow
cells to settle on the cover slip. During these experiments the cover slip was flamed, the
edges outlined with an ImmEdge pen (Vector Laboratories), and the cover slip placed in
a humidified chamber with a lid. Cells were applied to the cover slip while suspended in
blocking solution and allowed to settle for at least 30 minutes.
Immunostaining
Antibodies were added to PBS with 3% BSA at concentrations from 1:100 to
1:500 v/v dilutions for primary antibodies. 25x25mm #1 coverslips hold between 0.2 to
0.3 mL of solution during the exposure. The cells and primary antibodies were allowed
to react for at least 1 hour before excess media was “poured” off the edge of the cover
slip and washed with 0.35 mL portions of 3% BSA in PBS. Three rounds of combined
wash/blocking were performed with a minimum incubation time of 10 minutes to allow
cells to settle after manipulation. After the third wash, a solution with fluorescently
tagged secondary antibody (reactive to the primary antibodies and labeled with a
fluorescent Alexa Fluor tag) was applied at 1:200 to 1:500 dilutions depending on
previous performance and abundance of the target. The secondary antibody was
permitted to react with the cells for a minimum of 1 hour before cells were washed.
The initial washes were performed with 3% BSA in PBS to extend blocking activity. After
two or three BSA washes, the blocking agent was removed and the additional wash
steps were performed with PBS or PBS with DAPI/Hoechst 33342 dye (10 µg/mL DAPI or

43
100 µg/mL for Hoechst). Background signal was minimized by washing with PBS at least
three times before assembling the slide.
To assemble the slides for imaging, we poured off excess PBS from the coverslip,
used a clean Kimwipe to dab excess liquid from the corner, and applied an 8 µL portion
of ProLong Gold anti-fade sealant to the center of the slide. The slide was then lowered
on top of the cell-coated coverslip. Generally, a small amount of excess PBS could be
wicked away from the slide by tapping the slide edge to a paper towel on both long
edges of the slide. The slide was then permitted to cure at room temperature
overnight, in the dark prior to the imaging session. Nail polish was applied along the
edges of the coverslip to ensure the coverslip was not dislodged during imaging. PBS
residues could be cleaned from the top of the cured coverslip and optical clarity
restored with gentle swipes of a wet Kimwipe.
Results
DHFR-TS Localization Patterns Observed
Plasmodium falciparum parasites were grown in standard 10 mL culture flasks,
aliquotted, and then the parasite and red blood cells fixed using 3.8% para-
formaldehyde (PFA) and 0.0009% glutaraldehyde solutions in phosphate buffered saline
(PBS). PFA fixation for antibody use required cell permeabilization utilizing Triton-X 100
to strip away lipid layers and enable antibody penetration throughout the cell. The
44
antibodies used for Plasmodium falciparum DHFR-TS provided good localization of the
DHFR-TS signal to the parasite. Upon closer examination of images obtained via
confocal microscopy the appearance of localized spots of DHFR-TS signal was noted
(Figure 2.3). Currently there are no known binding partners for PfDHFR-TS and both the
PlasMit and MitoProt II algorithms did not predict PfDHFR-TS targeting to any organelles
(99% non-mitochondrial by PlasMit and only a 0.2711 probability of export to the
mitochondria by MitoProt II). The localized patterns observed with the DHFR antibody
warranted further examination. Several organelles in the malaria parasite were
systematically examined for correlation between organelle and DHFR-TS.
DHFR Antibody Localizes At Specific Organelle - Mitochondria
The availability of organelle-specific dyes and established localization of select
proteins enabled their use as comparators to the localization patterns observed for the
PfDHFR-TS enzyme. The dyes employed successfully include ER Tracker Blue-White DPX
(labeling the endoplasmic reticulum), Lysotracker Red (labeling lysosomes and the food
vacuole), DAPI and Hoechst 33342 (labeling the nucleus), and Mitotracker Orange or
Deep Red (labeling mitochondria). The apicoplast organelle was labeled using
episomally transfected parasites containing acyl carrier protein-GFP fusions generated
by Waller et al in 2000 [138]. Additional labels of the parasite mitochondria included a
parasite line which had an integrated copy of the mitochondrial HProtein fused to GFP
[103] as well as the limited use of a mouse antibody to PfDHODH that was obtained
from Meg Phillips and Akhil Vaidya.

45
Several experiments were performed to examine colocalization of PfDHFR-TS
signal with organelles of the parasite. Proper delineation of the signal intensity of an
organelle, as opposed to the background signal observed due to nonspecific binding that
is stronger in the malaria parasite, required thresholding the images using a histogram
of the signal intensities. The high threshold/high stringency analysis was accomplished
by isolating a single infected red blood cell from the three dimensional image,
generating a histogram of pixel intensities, and setting the signal minimum above the
immediately visible “bell curve” of intensities so as to remove background/the most
prevalent signal of the image and adjusting the high signal intensity so no pixels were
saturated. This high stringency analysis avoided the parasite membrane, with higher
background signals than the red blood cell membranes, contributing large areas of low
intensity overlap to the point organelle comparisons.
Comparison to Nucleus
The nucleus of the malaria parasite is a membrane-bound organelle that
contains the chromosomal DNA of the parasite. Rounds of DNA replication and fission
split the nucleus into 10 to 20 daughter nuclei in later stages of the parasite life cycle.
The appearance of the nucleus when labeled with Hoechst 33342 or DAPI is that of an
ovoid dot like a grain of rye, occasionally showing a “dimple” from the nuclear
membrane being pushed aside by the digestive vacuole. The correlation coefficient for
the nucleus with the PfDHFR-TS was determined to have a mean and SEM of -0.038 and
0.086, respectively. There was no statistically significant correlation between DHFR-TS
46
and the nucleus, as evaluated by the one sample t test finding a P value of 0.68.
Example images appear in Figure 2.4 and the resultant data is summarized in Figure 2.8.
Comparison to Lysosome/Digestive Vacuole
Lysotracker dye was used to examine the location of the digestive/food vacuole
of the malaria parasite. The digestive vacuole of mature parasites is often observable in
the DIC image due to crystallized heme causing optical interference, but the digestive
vacuole is much more difficult to observe during earlier stages. Lysotracker dye targets
acidic organelles and localizes to both the mature digestive vacuole and, with lower
affinity, to the earlier stage parasite’s smaller food vacuoles . The correlation
coefficient for the food vacuole with PfDHFR-TS was determined to have a mean and
SEM of 0.084 and 0.032 in this experiment. There was no statistically significant
correlation between DHFR-TS and the digestive vacuole, as evaluated by the one sample
t test generating a P value of 0.08. Example images appear in Figure 2.4 and the
resultant data is summarized in Figure 2.8.
Comparison to Endoplasmic Reticulum
The endoplasmic reticulum (ER) was also examined for correlation with the
PfDHFR-TS signal. The ER organelle is structured with many folds and invaginations.
The ER is involved in protein production and processing, with the nuclearly associated
rough ER is dotted with ribosomes all along the surface. ER Tracker Blue-White DPX dye
was used to mark the ER. The observed signal correlation for ER and PfDHFR-TS is

47
variable but has a mean and SEM of -0.073 and 0.067. There was no statistically
significant correlation between DHFR-TS and the endoplasmic reticulum, as evaluated
by the one sample t test finding a P value of 0.33. Example images appear in Figure 2.5
and the resultant data is summarized in Figure 2.8.
Comparison to Mitochondria via Mitotracker
The mitochondria of the malaria parasite, while not involved in energy
production, still seems to be an essential, maintained organelle. As the parasite
develops the volume of the mitochondria increase and the organelle branches and buds
off into daughter parasites. The branched structure of the mitochondria is evident in
microscopy images. The correlation coefficient of the PfDHFR-TS and the mitochondria
(via Mitotracker Orange) is the least variable of the organelles examined and has a mean
and SEM of 0.211 and 0.038. The correlation between PfDHFR-TS and the mitochondria
is the best fit of the individual organelles examined and the only fit with a statistical
significance, with a P value of 0.005 from the one sample t test. Example images appear
in Figure 2.5 and the resultant data is summarized in Figure 2.8.
With increased focus, additional slides were prepared and dozens more images
were generated to pool the results and examine if the signals coalesced or remained
variable. Forty images were captured, run through image analysis, and the correlation
values for DHFR-TS compared to both the mitochondria and the nucleus pooled. The
result of the increase observations was the mean correlation coefficient for DHFR-TS
with the nucleus was still insignificant at -0.019 with a SEM of 0.036 while the mean
48
correlation for DHFR-TS with the mitochondria was 0.236 with a SEM of 0.021. The P
value was < 0.0001 for the correlation of DHFR-TS with the Mitotracker signal and was
significant based on the one sample t test. The data is summarized in Figure 2.9 A.
We chose to evaluate the life cycle stage and effect on the correlation coefficient
of parasites. 3d7 parasites were sorbitol synchronized to ring stages either 24 or 48
hours ahead of when the microscope slides were prepared. When parasites are small
and in the ring stages, additional overlap is to be expected based on proximity and the
limited spatial resolving power of light microscopy. The fluorescence signals of ring-
stage parasites treated with DAPI were compared to DHFR-TS antibody signal and the
correlation coefficient was 0.255 with a SEM of 0.099. The DHFR-TS signal was
compared to the mitochondria with Mitotracker Orange dye and yielded a correlation
coefficient of 0.458 with a SEM of 0.038 with ten parasite images evaluated. With the
later stage parasites, the correlation observed for DHFR-TS with the nucleus, via DAPI,
was 0.004 with a SEM of 0.044 but the correlation of DHFR-TS with the mitochondria
was decently high and significant at 0.247 with a SEM of 0.028 in a total of 27 late stage
parasites. A chart summarizing life cycle’s influence on the correlation coefficient
appears in Figure 2.9 B.
Comparison to Mitochondria via DHODH Antibody
A known mitochondrial protein that we could actively probe with alternate color
fluorophores proved to be dihydroorotate dehydrogenase (DHODH). Antibodies from
mouse serum were utilized to compare DHODH to DHFR and Mitotracker Deep Red dye

49
as an example for the correlation values observed between a known mitochondrial
protein, DHFR-TS, Mitotracker dye, or another organelle like the nucleus. The parasites
were sorbitol synchronized and evaluated in either late trophozoite/schizont or
early/ring stages. Several representative parasite images are found in Figure 2.10 and a
summary from many observations was compiled into Figure 2.11. For late stage
parasites, the mean correlation coefficient and SEM was -0.075 ± 0.043 for DHODH
antibody compared to DAPI marking the nucleus, 0.357 ± 0.061 for DHODH antibody
compared to DHFR-TS antibody, 0.478 ± 0.054 for DHODH antibody compared to
Mitotracker Deep Red, and 0.393 ± 0.059 for DHFR antibody compared to Mitotracker
Deep Red marking the mitochondria. For ring stage parasites, the mean correlation
coefficient and SEM was -0.092 ± 0.097 for DHODH antibody compared to DAPI marking
the nucleus, 0.346 ± 0.076 for DHODH antibody compared to DHFR-TS antibody, 0.273 ±
0.038 for DHODH antibody compared to Mitotracker Deep Red, and 0.250 ± 0.055 for
DHFR-TS antibody compared to Mitotracker Deep Red marking the mitochondria.
Comparison to Apicoplast
The apicoplast of the malaria parasite was examined using a published ACPleader-
GFP transfection construct [138]. The construct contains a fusion-protein with an
apicoplast leader/targeting sequence and a C-terminal GFP. The signal was able to be
observed with both native GFP fluorescence and with GFP-targeting Alexa Fluor 488
labelled antibodies. For consistency and to avoid photo-bleaching, GFP primary
antibodies with fluorescent Alexa Fluor 488 secondary antibodies were employed for
50
the correlation coefficient calculations. The correlation observed was variable, from
0.353 to -0.384 with a mean of -0.056. The SEM was high at 0.124. There was no
statistically significant correlation between the apicoplast and DHFR-TS, as evaluated by
the one sample t test finding a P value of 0.68. Example images appear in Figure 2.6 and
the resultant data is summarized in Figure 2.8.
Comparisons were made between ACP-GFP and other organelles (the nucleus
and the mitochondria) to serve as controls. The apicoplast is normally adjacent to the
mitochondria during the life cycle and the ability to distinguish the apicoplast from
mitochondria, as marked by Mitotracker dye, was an important test for the
colocalization algorithm’s ability to differentiate parasite organelles. The mean Pearson
correlation coefficient for the apicoplast with Mitotracker Orange was 0.055 with a SEM
of 0.071. Statistically, there is no colocalization as judged by the one sample t test with
a P value of 0.46. Example images appear in Figure 2.7 and the resultant data is
summarized in Figure 2.8. To further serve as a control for the specificity of the ACP-
GFP construct, the colocalization of the nucleus with ACPleader-GFP signal of the
apicoplast was also calculated from population of parasites represented in Figure 2.6
and Figure 2.7 and the resultant data is summarized in Figure 2.8. The mean correlation
value was -0.033 with a SEM of 0.056. Again, there was no colocalization as judged by
the one sample t test with a P value of 0.57.
HProtein-GFP Profiled by Microscopy and Correlation to Mitochondria

51
An alternate, protein-based marker for the mitochondria was obtained from the
Prigge lab. Spalding created Dd2 parasites with an integrated copy of HProtein fused to
a C-terminal GFP and published the localization findings [103]. Parasite images,
including those in Figure 2.12, were obtained in order to confirm the published
localization and to add confidence to future parasite permeabilization studies that
would use the HProtein-GFP as a marker for a mitochondrial proteins.
Digitonin Fractionation Supports Localized PfDHFR-TS
An alternate, non-microscopy based method was needed to confirm localization.
Selective digitonin fractionation of parasite cell membranes was performed utilizing the
HProtein-GFP containing Dd2 parasite lines created by Spadling. The HProtein-GFP
parasites were previously reported as having the tagged protein localizing with the
mitochondria in live cells [87, 103, 147]. HProtein-GFP was readily detected in Western
blots using monoclonal anti-GFP antibody. Anti-PfDHFR-TS and anti-Pfaldolase
antibodies reacted with the native DHFR-TS and the cytosolic aldolase protein,
respectively. The level of HProtein expression seemed to be, tentatively, similar to the
DHFR-TS signal if not a bit higher. The blots shown in Figure 2.13 are representative
experiments of those performed six times at that concentration gradient. A similar
pattern was observed in another eight experiments performed with the gradient of
digitonin favoring lower concentrations.
The blots obtained from digitonin permeabilization of HProtein-GFP
demonstrated the HProtein-GFP releasing, primarily, between 1.4 – 0.7 mM digitonin.
52
This indicated that the mitochondrial membranes were sufficiently degraded to release
the tagged HProtein into the supernatant of the sample. Those same samples also
showed the native PfDHFR-TS was released into the supernatant at concentrations
greater than 0.7 mM digitonin. With PfDHFR-TS, the transition was between 1.4 – 0.7
mM. In some experiments heavier-massed secondary reactivity to the PfDHFR-TS
antibodies were present in the pelleted fractions. These heavier signals were minimized
through fast processing of the lysate and careful ice chilling whenever possible. The
Pfaldolase bands were observed to taper more gradually between 0.7 to 0.35 and 0.18
mM, depending on the experiment. The Pfaldolase’s half-maximal signal intensity was
safely in the lower tenths of a millimolar amount of digitonin.
Discussion
Determining the localization of malarial DHFR-TS has been long overdue. With
no predicted transmembrane domains or localization sequences, the DHFR-TS enzyme
has been presumed to be cytosolic for years. The essentiality of DHFR-TS activity in the
malaria parasite, the lethality of even partial inhibition, and the low levels of enzyme in
vivo have all been large barriers to standard biological approaches of studying the native
DHFR-TS [40, 148-150]. The generation of antibodies against the malarial DHFR-TS
enzyme has been undertaken before with limited success [151]. Newer techniques in
antigen prediction and peptide-based affinity isolation led to a new generation of DHFR-
TS antibodies with improved performance.
53
The antibodies generated for Plasmodium falciparum DHFR-TS (and Plasmodium
vivax DHFR-TS) proved very specific and high performing (Figures 2.1 and 2.2). With
insufficient washing/blocking or parasite sample degradation, which can happen quickly,
the falciparum antibody was observed to yield some high-molecular weight background
signal whose origins have not been identified. The antibody performed well in
specificity tests and proved useful for probing fixed, permeabilized cells for localization
studies.
Organelle Comparison Indicates Mitochondrial Localization
With antibodies to DHFR-TS performing well, we compared the localized signals
with major parasite organelles including the mitochondria, apicoplast, digestive vacuole,
endoplasmic reticulum, and the nucleus. The images from the confocal microscope
were thresholded to focus on the high-intensity signals and a computer algorithm
employed to assess colocalization and reduce bias in analyzing the weak DHFR-TS signal.
The highest Pearson correlation coefficient obtained for DHFR-TS antibody with an
organelle was 0.24 with Mitotracker dye as averaged over a large population of mixed
stage parasites (Figures 2.8 and 2.9 A). The fixation and permeabilization method
employed favors late-stage parasites surviving to deposition on the slide. The bias
towards late stages may be a factor influencing how asynchronous parasite cultures
over many experiments gave a Mitotracker to DHFR-TS correlation of 0.24 but, when
separated out by stage of the life cycle, the correlation was as high as 0.46 in ring stages
but only 0.25 in later stage parasites (Figure 2.9 B). Comparison of DHFR-TS signal to the

54
mitochondria-adjacent apicoplast was investigated to add certainty to our mitochondrial
characterization. We employed an established ACPleader-GFP transfected D10 strain for
studies with an apicoplast marker [138]. To help establish the functional range of
mitochondrial protein Pearson correlation values, as measured by this confocal
microscopy-based method and technique, DHODH antibody was added as a comparator
to Mitotracker dye and DHFR-TS antibody in 3d7 parasites. The observed correlations
for DHODH and DHFR had a mean value between 0.35 to 0.36, independent of the life
cycle stage. When compared to Mitotracker dye, both proteins displayed correlations
above 0.39 when in the late stage parasites, but the correlation values were lower, at
0.25, for ring stage parasites (Figure 2.11). When the standard error of the mean is
taken into account, these values are nearly identical for each stage of the life cycle,
further supporting of our successful measurement of Plasmodium falciparum DHFR-TS
as a mitochondrial protein.
Digitonin Fractionation Indicates Mitochondrial Localization
An orthogonal, non-microscopy-based method to investigate localization was
used to evaluate localization of DHFR-TS enzyme in the malaria parasite. Digitonin
permeabilization has been used with malaria parasites and other cells based on the
cholesterol content of organelle membranes differing from that of plasma membranes.
A profile of the cytosolic vs organellar contents was obtained through measuring the
proteins released into supernatants with differing concentrations of digitonin. The
Western blot detection method employed does not permit perfect delineation of which
55
organelle is ruptured, but does reinforce observations of cytosolic vs organellar
localization. Our comparisons using HProtein-GFP containing Dd2 parasites show that
the mitochondria is ruptured at digitonin concentrations between 1.4 and 0.7 mM,
while cytosolic contents release at significantly lower concentrations of digitonin, with a
more gradual transition that could be due to stochastic factors or parasite life cycle
stage diversity (Figure 2.13). From these experiments we observed digitonin
permeabilization releasing the cytosolic proteins at concentrations approximately five
times lower than where the mitochondrial protein was being released into the
supernatant and DHFR-TS was releasing in the same range of digitonin concentrations as
the mitochondrial HProtein-GFP.
Summary
We developed antibodies that mark the malaria DHFR-TS enzyme and applied
them to demonstrate that the DHFR-TS enzyme has a sub-cellular localization in the
malaria parasite. With the help of algorithmic colocalization calculations, organelle
specific dyes, and both tagged and native proteins, we determined the mitochondria to
be the target organelle of DHFR-TS. Further supporting the localization of DHFR-TS, we
employed cell fractionation via digitonin and demonstrated localization akin to that of a
previously published mitochondrial protein from the glycine cleavage system, HProtein
[103].
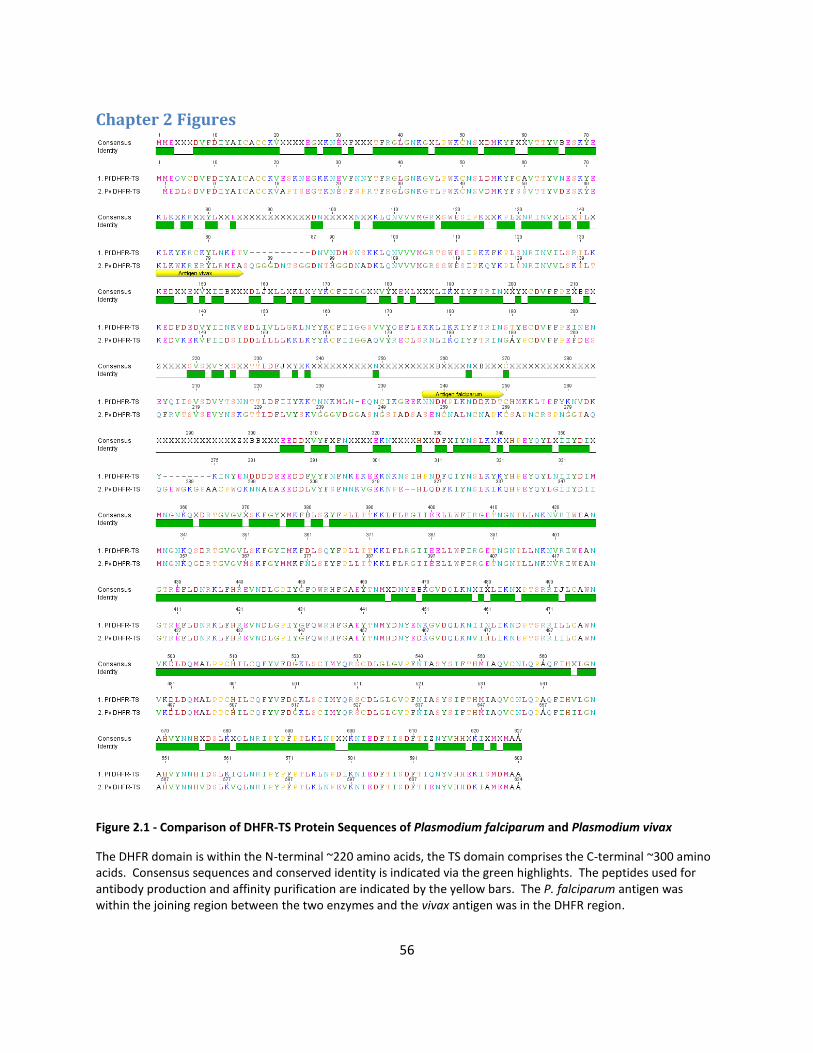
56
Chapter 2 Figures
Figure 2.1 - Comparison of DHFR-TS Protein Sequences of Plasmodium falciparum and Plasmodium vivax
The DHFR domain is within the N-terminal ~220 amino acids, the TS domain comprises the C-terminal ~300 amino acids. Consensus sequences and conserved identity is indicated via the green highlights. The peptides used for antibody production and affinity purification are indicated by the yellow bars. The P. falciparum antigen was within the joining region between the two enzymes and the vivax antigen was in the DHFR region.
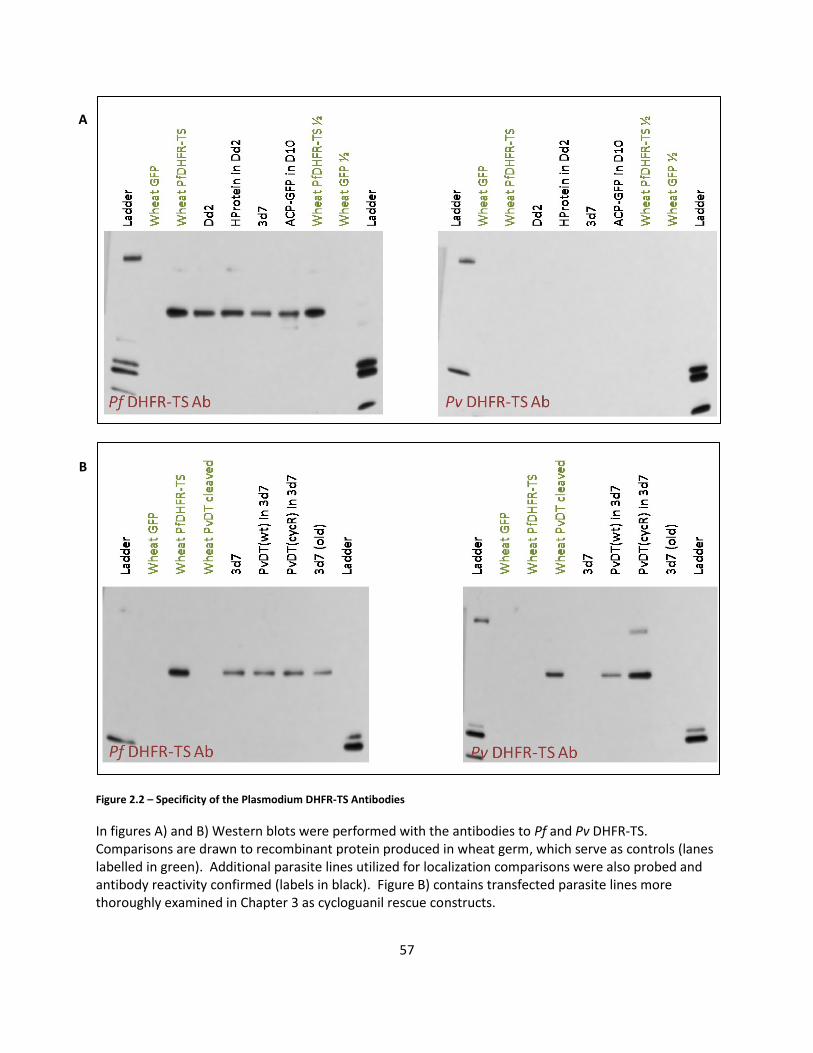
57
Figure 2.2 – Specificity of the Plasmodium DHFR-TS Antibodies
In figures A) and B) Western blots were performed with the antibodies to Pf and Pv DHFR-TS. Comparisons are drawn to recombinant protein produced in wheat germ, which serve as controls (lanes labelled in green). Additional parasite lines utilized for localization comparisons were also probed and antibody reactivity confirmed (labels in black). Figure B) contains transfected parasite lines more thoroughly examined in Chapter 3 as cycloguanil rescue constructs.
B
A
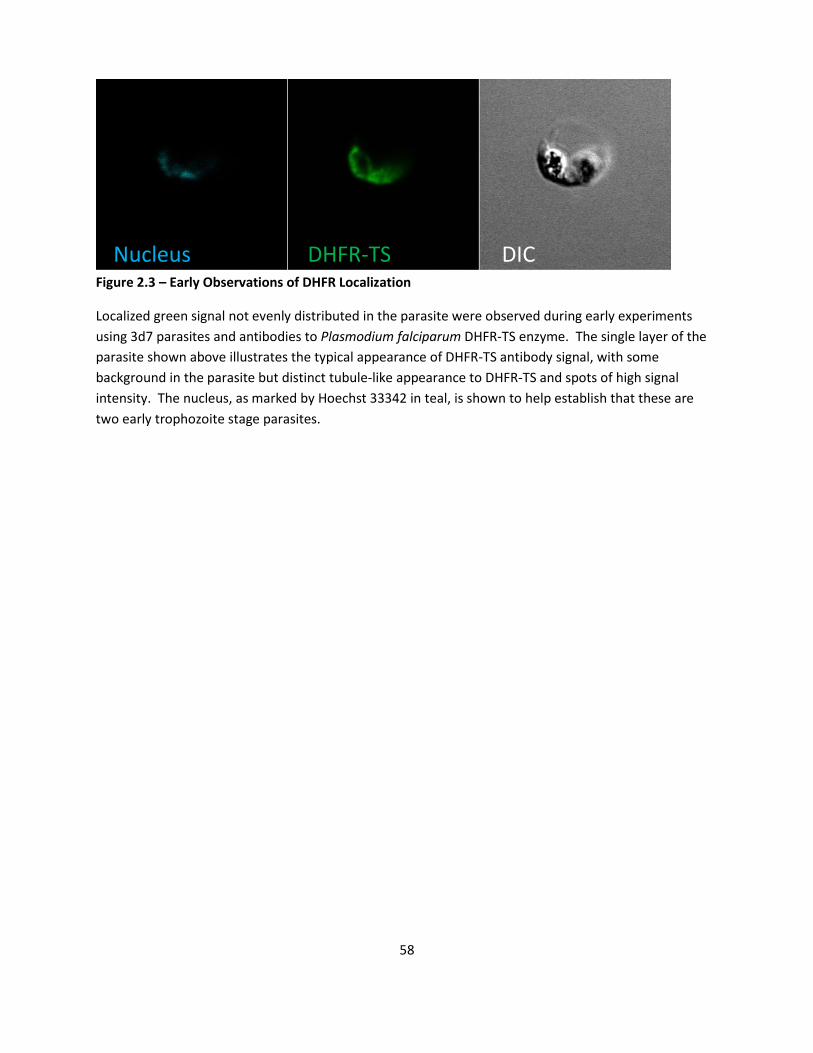
58
Figure 2.3 – Early Observations of DHFR Localization
Localized green signal not evenly distributed in the parasite were observed during early experiments
using 3d7 parasites and antibodies to Plasmodium falciparum DHFR-TS enzyme. The single layer of the
parasite shown above illustrates the typical appearance of DHFR-TS antibody signal, with some
background in the parasite but distinct tubule-like appearance to DHFR-TS and spots of high signal
intensity. The nucleus, as marked by Hoechst 33342 in teal, is shown to help establish that these are
two early trophozoite stage parasites.
Nucleus DHFR-TS DIC

59
Figure 2.4 – Comparison of DHFR-TS to Nucleus and Digestive Vacuole
Confocal microscopy images were obtained of 3d7 parasites treated for a half hour with Lysotracker
dye, fixed, permeabilized, and probed with DAPI and antibodies to PfDHFR-TS followed by a secondary
Alexa Fluor 488 antibody. DAPI (teal) indicates the nucleus, Lysotracker Red indicates the digestive
vacuole, primarily, and the PfDHFR-TS antibody is shown in green. The DIC image is similar to that of a
simple light microscope, but allows for better capture at a set focal plane. The histogram in the lower
right corner is a scatter plot of the colocalized pixels with respect to the green and red channels. In
these experiments, the signal for DHFR-TS did not overlap with either the nucleus or the digestive
vacuole with any statistically significant result.
Nucleus
Nucleus
DHFR-TS
DHFR-TS
Lysosome
Lysosome
DIC
DIC
Merge
Merge
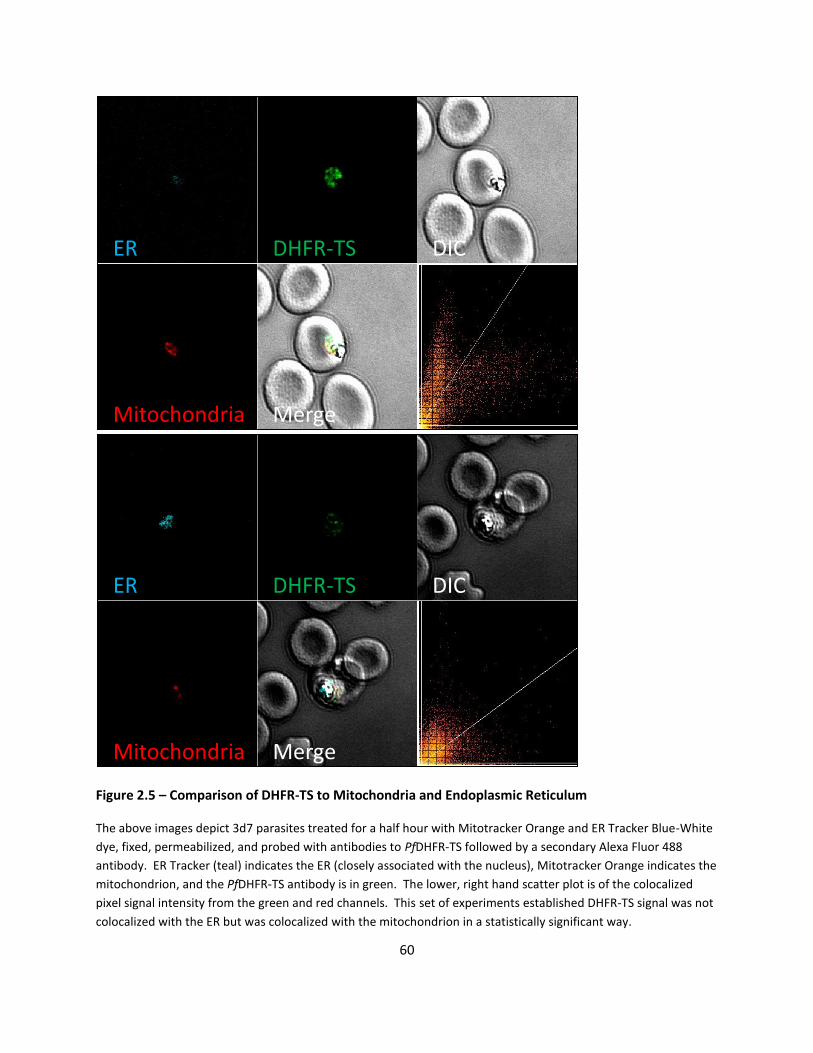
60
Figure 2.5 – Comparison of DHFR-TS to Mitochondria and Endoplasmic Reticulum
The above images depict 3d7 parasites treated for a half hour with Mitotracker Orange and ER Tracker Blue-White
dye, fixed, permeabilized, and probed with antibodies to PfDHFR-TS followed by a secondary Alexa Fluor 488
antibody. ER Tracker (teal) indicates the ER (closely associated with the nucleus), Mitotracker Orange indicates the
mitochondrion, and the PfDHFR-TS antibody is in green. The lower, right hand scatter plot is of the colocalized
pixel signal intensity from the green and red channels. This set of experiments established DHFR-TS signal was not
colocalized with the ER but was colocalized with the mitochondrion in a statistically significant way.
ER
ER
DHFR-TS
DHFR-TS
Mitochondria
Mitochondria
DIC
DIC
Merge
Merge

61
Figure 2.6 – Comparison of DHFR-TS to Nucleus and Apicoplast
Confocal microscopy images were obtained for D10 parasites containing an ACP-GFP protein which were fixed,
permeabilized, and probed with antibodies to PfDHFR-TS and GFP followed by secondary Alexa Fluor 488 and 532
antibodies. DAPI (teal) indicates the nucleus, the green GFP antibody signal indicates the apicoplast, and the
PfDHFR-TS antibody is shown in red. The histogram in the lower right corner is a scatter plot of the colocalized
pixels with respect to the green and red channels. The apicoplast and DHFR-TS signals were near, but not
colocalized with any statistical significance.
Nucleus
Nucleus
Apicoplast
Apicoplast
DHFR-TS
DHFR-TS
DIC
DIC
Merge
Merge

62
Figure 2.7 – The Apicoplast is Clearly Distinguished from the Mitochondria
Immunofluorescence microscopy was performed to establish the method’s ability to distinguish
apicoplastic signals from the mitochondrion. Confocal microscopy images were obtained for D10
parasites, containing an ACPleader-GFP protein, which were treated with Mitotracker Orange, fixed,
permeabilized, and probed with an antibody to GFP followed by secondary Alexa Fluor 488. DAPI (teal)
indicates the nucleus, the green GFP antibody signal indicates the apicoplast, and the Mitotracker dye is
shown in red. The histogram in the lower right corner is a scatter plot of the colocalized pixels with
respect to the green and red channels.
Nucleus
Nucleus
Apicoplast
Apicoplast
Mitochondria
Mitochondria
DIC
DIC
Merge
Merge

63
Figure 2.8 – Summary of Organelles Investigated for DHFR-TS Localization and Fit to Mitochondria
A localization survey was performed using dyes to different organelles. Colocalization of the organelle
to the PfDHFR-TS antibody signal was calculated using stringent thresholds and Pearson correlation
coefficient methodology. The mean and standard error of the mean was calculated from at least ten
images for each condition and plotted to guide further inquiry. The only correlation that registered as
significant was that of DHFR-TS with the Mitochondria, with a one-sample t test P value of 0.005 in the
broad survey.
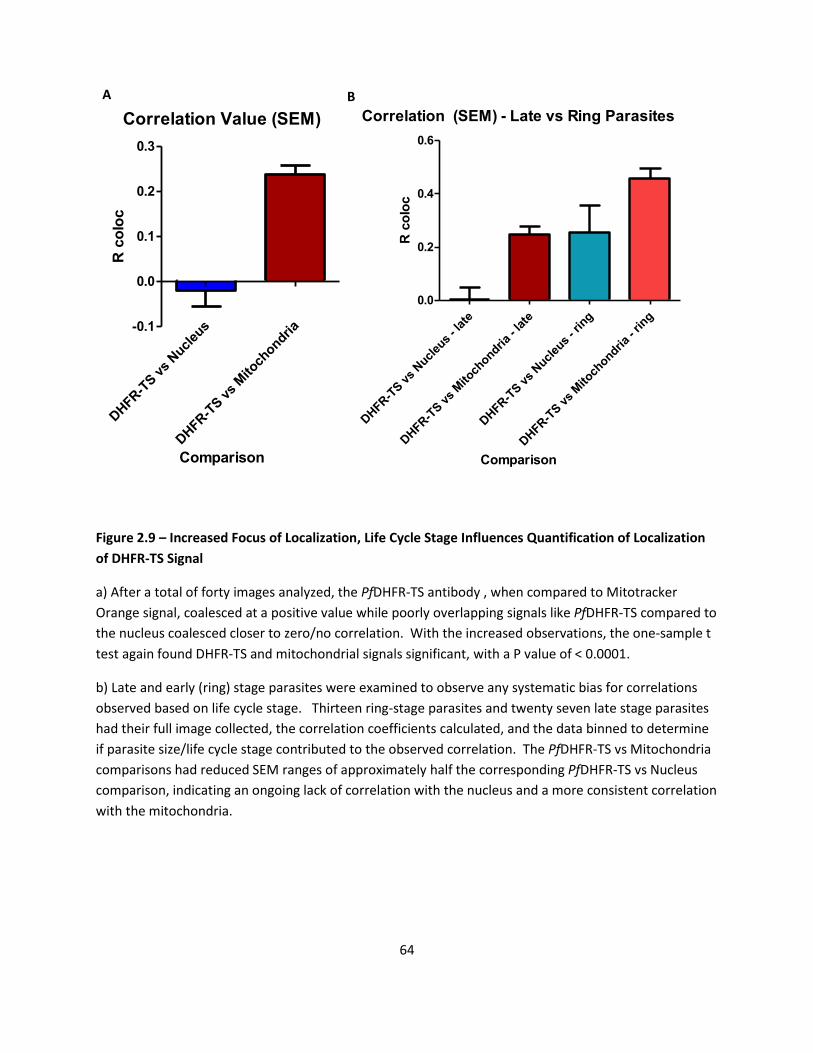
64
Correlation Value (SEM)
DHFR
-TS v
s Nucl
eus
DHFR
-TS v
s M
itoch
ondria-0.1
0.0
0.1
0.2
0.3
Comparison
R c
olo
cCorrelation (SEM) - Late vs Ring Parasites
DHFR
-TS v
s Nucl
eus
- lat
e
DHFR
-TS v
s M
itoch
ondria
- lat
e
DHFR
-TS v
s Nucl
eus
- rin
g
DHFR
-TS v
s M
itoch
ondria
- rin
g
0.0
0.2
0.4
0.6
Comparison
R c
olo
c
Figure 2.9 – Increased Focus of Localization, Life Cycle Stage Influences Quantification of Localization
of DHFR-TS Signal
a) After a total of forty images analyzed, the PfDHFR-TS antibody , when compared to Mitotracker
Orange signal, coalesced at a positive value while poorly overlapping signals like PfDHFR-TS compared to
the nucleus coalesced closer to zero/no correlation. With the increased observations, the one-sample t
test again found DHFR-TS and mitochondrial signals significant, with a P value of < 0.0001.
b) Late and early (ring) stage parasites were examined to observe any systematic bias for correlations
observed based on life cycle stage. Thirteen ring-stage parasites and twenty seven late stage parasites
had their full image collected, the correlation coefficients calculated, and the data binned to determine
if parasite size/life cycle stage contributed to the observed correlation. The PfDHFR-TS vs Mitochondria
comparisons had reduced SEM ranges of approximately half the corresponding PfDHFR-TS vs Nucleus
comparison, indicating an ongoing lack of correlation with the nucleus and a more consistent correlation
with the mitochondria.
A B

65
DAPI DHODH
DHFR Mitotracker Deep Red
Nucleus DHODH
DHFR-TS Mitochondria
Figure 2.10 – Images of PfDHODH antibody compared to PfDHFR and Mitotracker Dye
Confocal microscopy images were obtained for 3d7 parasites that were treated with Mitotracker Deep Red for 30
minutes, fixed, permeabilized, and probed with antibodies to PfDHFR-TS and DHODH followed by secondary Alexa
Fluor 488 and 532 antibodies. DAPI treatment was added immediately before mounting. DAPI (teal) indicates the
nucleus, Mitotracker Deep Red indicates the mitochondria, the green signal indicates the mitochondrial DHODH
signal, and the PfDHFR-TS antibody is shown in red.
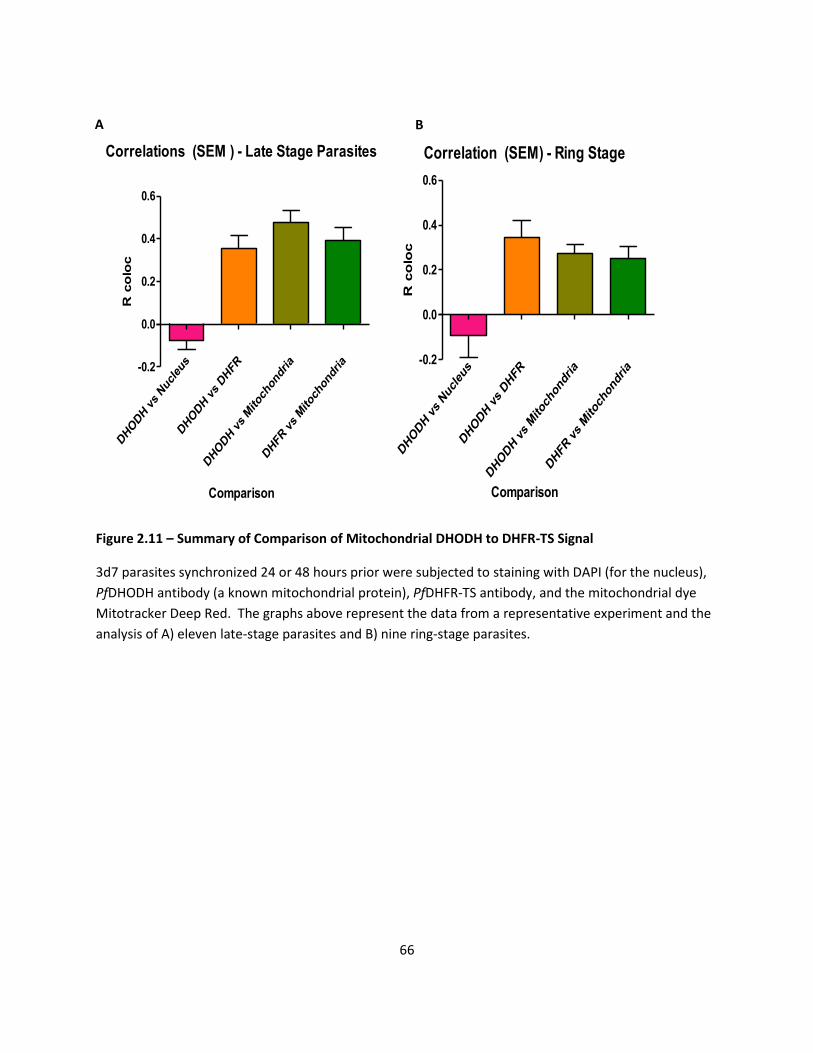
66
Correlations (SEM ) - Late Stage Parasites
DHODH vs Nucleu
s
DHODH vs DHFR
DHODH vs Mitoc
hon
dria
DHFR vs Mitoch
ondr
ia-0.2
0.0
0.2
0.4
0.6
Comparison
R c
olo
c
Correlation (SEM) - Ring Stage
DHODH vs Nucleu
s
DHODH vs DHFR
DHODH vs Mitoch
ondria
DHFR vs Mitoch
ondria
-0.2
0.0
0.2
0.4
0.6
Comparison
R c
olo
c
Figure 2.11 – Summary of Comparison of Mitochondrial DHODH to DHFR-TS Signal
3d7 parasites synchronized 24 or 48 hours prior were subjected to staining with DAPI (for the nucleus),
PfDHODH antibody (a known mitochondrial protein), PfDHFR-TS antibody, and the mitochondrial dye
Mitotracker Deep Red. The graphs above represent the data from a representative experiment and the
analysis of A) eleven late-stage parasites and B) nine ring-stage parasites.
A B

67
Figure 2.12 – HProtein-GFP Dd2 Parasite Line Also Marks Mitochondria
Images were captured of Dd2 parasites containing a chromosomally-integrated copy of the HProtein-
GFP fusion. HProtein-GFP was thus able to serve as a mitochondrial marker. The mitochondrial marker
Mitotracker Deep Red excelled at marking the parasite mitochondria, particularly in relation to the
HProtein-GFP as marked by GFP antibody. DAPI was used to mark the nucleus and PfDHFR-TS antibody
was also reactive in the Dd2 parasite line similar to the 3d7 line which comprised the bulk of the
microscopic images captured earlier.
DAPI HProtein-GFP
DHFR Mitotracker Deep Red
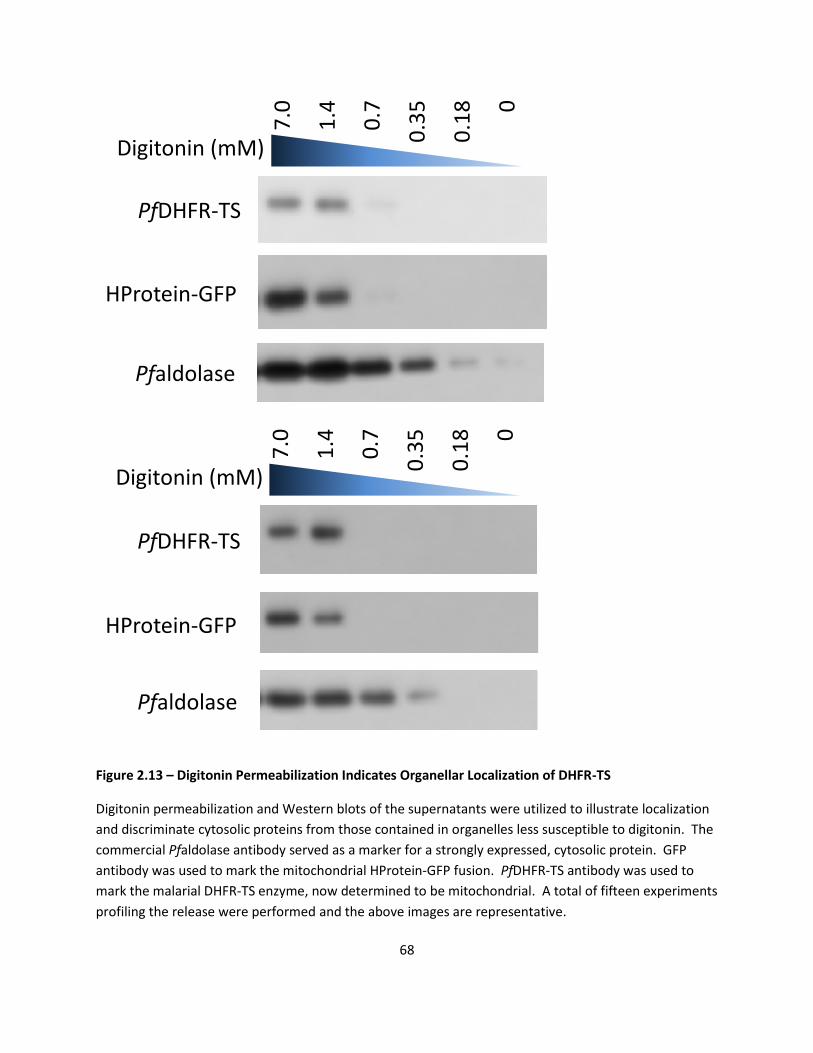
68
Figure 2.13 – Digitonin Permeabilization Indicates Organellar Localization of DHFR-TS
Digitonin permeabilization and Western blots of the supernatants were utilized to illustrate localization
and discriminate cytosolic proteins from those contained in organelles less susceptible to digitonin. The
commercial Pfaldolase antibody served as a marker for a strongly expressed, cytosolic protein. GFP
antibody was used to mark the mitochondrial HProtein-GFP fusion. PfDHFR-TS antibody was used to
mark the malarial DHFR-TS enzyme, now determined to be mitochondrial. A total of fifteen experiments
profiling the release were performed and the above images are representative.
PfDHFR-TS
HProtein-GFP
Pfaldolase
Digitonin (mM)
7.0
1.4
0.7
0.3
5
0.1
8
0
PfDHFR-TS
HProtein-GFP
Pfaldolase
Digitonin (mM)
7.0
1.4
0.7
0.3
5
0.1
8
0
69
Chapter 3 - A Role of Cycloguanil in the Synergy Between
Atovaquone and Proguanil?
Introduction
Upon observing that Plasmodium falciparum dihydrofolate reductase-
thymidylate synthase (DHFR-TS) was localized in the parasite, many questions related to
its use as a drug target remained. In particular, two drugs considered sub-optimal as
single agents have been combined to create Malarone®. Malarone® is presently a front-
line drug for the prophylaxis and treatment of malaria, comprising the bulk of
antimalarial drugs sold in the US in 2009 [125]. Just how the proguanil and atovaquone
components of Malarone® work so effectively together is something that has been
speculated upon but no mechanism has been demonstrated.
When the drug combination was proposed, the efficacy in patients was thought
to arise from proguanil being converted to cycloguanil. Cycloguanil would then inhibit
the folate cycle enzyme DHFR. Atovaquone contributed to the synergy by inhibiting
pyrimidine biosynthesis, indirectly, through DHODH. Atovaquone would inhibit complex
III of the electron transport chain and block coenzyme Q recycling. Coenzyme Q is a
necessary substrate for malarial DHODH’s catalytic function. Curiously, in vitro culture
systems, which are devoid of liver-based cytochrome P450s responsible for converting
proguanil to cycloguanil, also display a synergy between proguanil and atovaquone.
Rather than implicate some alternate target for proguanil, we formulated a different

70
idea: that DHFR’s inhibition by cycloguanil and atovaquone’s blockade of the electron
transport chain were behind the mechanism of synergy.
In order to assess the role of DHFR inhibition by cycloguanil, we drew from the
many parasite isolates both from the field and the decades of researching DHFR. We
would use drug sensitivity amongst these strains with known resistance-conferring point
mutations to determine if DHFR drug susceptibility influences susceptibility to
Malarone® and other related inhibitors. Additional parasite strains that would afford
unique resistance methods to Malarone®-components or related drugs were obtained
to dissect which components are involved in the synergistic method of action of
Malarone®. We transfected a cycloguanil resistant form of Plasmodium vivax DHFR-TS
into falciparum parasites to directly assess cycloguanil-based inhibition of DHFR with
minimal uncontrolled changes to the parasite.
To further assess if cycloguanil was a contributor to Malarone®’s mechanism of
action, a direct assay was developed to extract the organic components from flasks of
growing parasites. The assay was tuned to capture, via analytical UPLC-MS/MS
instrumentation, even trace cycloguanil conversion.

71
Experimental Procedures
Materials
Synthesis of Cycloguanil, 2-Chlorocycloguanil
Cycloguanil and a cycloguanil-analogue with an additional chlorine atom in the
ortho position of the aniline were synthesized for use in subsequent experiments. The
synthesis of both compounds on a 10 millimole scale was accomplished by refluxing 4-
chloro-aniline or 2,4-dichloro-aniline with dicyandiamide, acetone, and hydrochloric acid
(reaction scheme in Figure 3.1) [152, 153]. The resulting cycloguanil and 2-chloro-
cycloguanil were found free of impurities by NMR, MS (ESI), and HPLC. The internal
standard 2-chloro-cycloguanil and proguanil stocks were run through the HPLC-MS/MS
protocol at 1 and 10 µM (10 µM being five times higher than the proguanil measured in
any sample) to verify that no cycloguanil impurities were present.
Creation of Cycloguanil Resistant Parasites via Rescue Plasmid
In order to assess the role of cycloguanil in the mechanism of action of
Malarone®, we engineered parasites that expressed a cycloguanil-resistant form of
DHFR-TS from Plasmodium vivax. Three transfection plasmid variants were created in
order to have adequate controls for genetic complementation experiments. Two
variants expressed Plasmodium vivax DHFR-TS of either the wild type or cycloguanil
resistant form. An intermediate plasmid construct, without the vivax DHFR-TS gene
inserted, was used as a control (referred to as the “blank” plasmid). O’Neil described a
Plasmodium vivax DHFR-TS transfection construct that conferred 1,700 fold cycloguanil
72
resistance to transfected falciparum parasites [154]. However, the construct he utilized
involved a N-terminal bsd gene in frame with the DHFR-TS, a type of modification our
lab has found not well tolerated by the DHFR enzyme in Plasmodium falciparum and has
the potential to disrupt the commonly N-terminal localization signals for mitochondrial
localization. We desired to create a plasmid as close to native sequence and expression
levels as possible without the added time and selection issues related to chromosomal
integration. The pRZ-TK-BSD2 transfection plasmid was our starting point because it
contained a Blasticidin resistance expression cassette opposing another expression
cassette [155]. Blasticidin selection is based on the ribosome, in contrast to antifolate-
based selection used by most malaria transfection. The plasmid was modified to
incorporate the falciparum DHFR-TS 5’ UTR/promoter, the vivax form of DHFR-TS (wild
type as well as the cycloguanil resistant form), and a rep20 element to aid in episome
segregation. Figure 3.2 includes the overview of the plasmid construction.
The plasmid pRZ-TK-BSD2 was modified to remove both the thymidine kinase
(TK) gene as well as the 5’ calmodulin (CAM) promoter sequence. In its place was
inserted an adapter sequence containing the BlpI restriction site, a 50 bp spacer, the
SpeI and NotI restriction sites, and then the XhoI restriction site. To add back the
physiologically relevant promoter, 830 bp of the PfDHFR-TS 5’ UTR was amplified and
modified from 3d7 parasite genomic DNA using primers that also add BlpI and SpeI
restriction sites (PfDHFR_5UTR_F_Lng GGC CGG GCT AAG CAC TTT CCT TGT AAA TGT
CAT TCT TTA TAT TAA GAA GAA C and PfDHFR_5UTR_r2_Lng GGC TGG CTC GAG CGG
73
CCG CAC TAG TAA AAA GGA GAA AAT ATA AAT ATA TAA ATA AAT AAA). The 5’UTR was
inserted into a pGEM-T Easy vector for sequencing before being excised via double
restriction digest and inserted into the digested, adapter-containing pRZ-BSD +Adapter
plasmid, replacing the 50 bp spacer.
The cycloguanil-resistant Plasmodium vivax DHFR-TS gene was based on the
AMRU-1 strain referenced by O’Neil as GenBank Accession DQ244115 [45, 154, 156].
The resistant DHFR sequence was overlaid on the full length Plasmodium vivax DHFR-TS
gene from Sal-1 strain (GenBank Accession XM_001615032 and PlasmoDB ID
PVX_089950) and the indicated point mutations added to the Sal-1 sequence (Figure
3.3). The wild type Sal-1 DHFR-TS gene and cycloguanil resistant (cycR) AMRU-1 DHFR-
TS gene with four point mutations were obtained in native codons from GenScript with
a SpeI restriction site at the 5’ end and XhoI at the 3’ end (Figure 3.4). The genes were
excised from Genscript’s plasmid using the SpeI and XhoI restriction enzymes and
inserted into a similarly digested pRZ-BSD +Adapter +PfUTR backbone to make a
functional transfection plasmid.
A 550 bp section of rep20 sequence was amplified from pHHyDHOD–GFP
plasmid obtained from the Vaidya lab, which itself was derived from the reduced rep20
element-containing pHHMC*/3R0.5 plasmid published by O’Donnel[52, 157]. The
amplification was performed using the primers Rep20_3RS_F and Rep20_3RS_r
containing the HindIII and SalI restriction sequences as well as auxiliary EcoRI and BlpI
sequences. The HindIII and SalI sites were used to insert the rep20 sequence at the 3’
74
end the expression cassette following the Plasmodium vivax DHFR-TS gene while the
backup EcoRI and BlpI sites would allow for insertion at the end of the Blasticidin
resistance gene expression cassette or between the opposing expression cassettes if
needed. The sequence of primer Rep20_3RS_F is GGA CCG AAT TCG CTA AGC AAG CTT
CTA TAT TTG TTA AAT TAA GAC CAA ACT TAG TAC C and the sequence of primer
Rep20_3RS_r is GGA CCG AAT TCG CTT AGC GTC GAC TAC TTT CAC TAA TAT AGG TCC
TAT CAT AAC TAA C with the HindIII and SalI sites underlined, respectively. Following
PCR, the rep20 element was agarose gel purified and then ligated into a pGEM-T Easy
vector for plasmid production purposes.
The pRZ-BSD Plasmodium vivax DHFR-TS transfection plasmids were further
enhanced by incorporation of the rep20 element following the PvDHFR-TS expression
cassette. Digestion of the target pRZ plasmid and pGEM-T Easy with the rep20 element
with both the HindIII and SalI restriction enzymes was sufficient to linearize both
template and insert. The rep20 element was gel purified, ligated into the digested pRZ
template, and the resulting plasmid (Figure 3.2 C) was produced, sequenced, and then
further transfected into 3d7 parasites per established “preloaded erythrocyte”
protocols.
Methods
Parasite Transfection Using Preloaded Erythrocytes
Parasite transfection was accomplished using a method where erythrocytes were
electroporated to load them with plasmid DNA and the malaria parasites were allowed

75
to invade the pre-loaded red blood cells and spontaneously uptake the plasmid. The
protocol is based on the low current, high capacitance method published by Fidock and
adapted to preload erythrocytes prior to invasion by Deitsch [111, 158]. The pre-loaded
erythrocyte method has been found 5 to 180 times more effective than direct
electroporation [159].
High salt electroporation media called “cytomix” was made from DEPC treated
water with 120 mM KCl, 0.15 mM CaCl2, 2 mM EGTA, 5 mM MgCl2, 25 mM HEPES, and
10 mM pH 7.6 K2HPO4/KH2PO4 as described by Wu [160]. The cytomix was filtered
through a bottle-top 20 micron Millipore filter to sterilize. Cytomix formula was stable
at room temperature for many months but prolonged storage at 4 °C resulted in salt
precipitates.
Relatively fresh erythrocytes were processed, as usual for cell culture, then
combined 1:1 v/v with cytomix, spun down at 4,000 rpm in a swinging bucket
centrifuge, and the supernatant removed. This high salt parasite pellet was used for
transformations. For each transformation, 100 µg of plasmid (under 100 µL volume)
was combined with 200 µL of the salt-washed erythrocyte pellet, and an additional ~100
µL of cytomix was added bring the total volume to 0.4 mL in a 0.2 cm gap Bio-Rad
electroporation cuvette (#165-2086). The erythrocytes were electroporated at 310 V,
950 µF and then removed from the cuvette into a parasite culture flask with additional
media washes. The cultures were grown with daily media changes and as-needed red
blood cell additions until the selection agent had killed most untransformed parasites.

76
The selection agent was added 48 hours after the initial transformation. Cultures were
subjected to media changes every other day and smears were used to assess parasite
emergence starting one week after the transfection was performed. Three to four
weeks was the minimum time for parasites to emerge from this procedure, with slower
growing transformants emerging a week or more later.
Assay for Anti-Plasmodial Activity (EC50)
Parasite growth and the effects of various inhibitors were assayed based on
parasite metabolic activity using a modified Desjardins radioisotope method [161]. The
assay measures the incorporation of 3H-hypoxanthine to quantify parasite survival and
growth. The 96-well plates were setup with triplicate wells containing 180 uL of
parasitized erythrocytes (1% parasitemia and 0.5% hematocrit) to which 20 uL of 10%
DMSO drug intermediate was added. The drug solutions were made up in 100% DMSO
stocks and arrayed in plates, then transferred into RPMI-1640 to create the
intermediate 10% DMSO plate. Procedurally, atovaquone solubility issues observed
during larger experiments with low DMSO intermediates were best avoided by quick
handling of intermediate drug plates during assay setup. Each assay plate contained a
DMSO only/No Drug control. The assays were incubated at 37°C for 48 hours in an
atmosphere of 90% N2, 5% CO2, and 5% O2. Radioactive 3H hypoxanthine solution (0.25-
0.5 µCi per 50 µL of complete media) was added to the wells and the parasite plates
incubated another 24 h. At the end of the assay plates were placed in a -80 °C freezer
overnight to halt growth and help with cell lysis. The plates were thawed and DNA
77
harvested onto glass fiber filters (Inotech Biosystems IH201A) with an Inotech
Biosystems Cell Harvester. The mats were washed with three rinses of ~40 mL of Milli-Q
water per plate. The filters were then secured in plate-format cartridges (Packard
Omnifilter) and permitted several hours to dry. After fully drying, 30 µL of Microscint-O
scintillation fluid (Perkin Elmer) was added to each well using a 12 channel pipette and
the plate sealed with a TopSeal-A adhesive film (Perkin Elmer). Radioactive nucleotide
incorporation was quantified using a TopCount scintillation counter with counts
collected for 2 minutes per well. The data was then reduced to growth rates relative to
DMSO control at each data point and pooled into Graphpad Prism 5.01 . The data was
plotted, curves fit , and the data reduced to EC50 tables where appropriate. The curves
were generally best fit via nonlinear curve fitting with automatic data point rejection.
Each assay was repeated at least three times before a representative experiment was
chosen for presentation.
Solid Phase Extraction and Quantification of Proguanil Conversion via LC-
MS/MS
3d7 malaria parasites were cultured in 30 mL volume T75 flasks under standard
conditions for 24 hours in the presence of 100 nM proguanil alone, 100 nM atovaquone
alone, 100 nM atovaquone and 100 nM proguanil, or 100 nM proguanil that was added
just before the red blood cells and parasites were harvested from the media.
Additionally, a separate flask with all the media and red blood cell content, but no
malaria parasites was cultured with 100 nM proguanil. The red blood cell pellet
78
containing the parasites was harvested by centrifugation in a swinging bucket centrifuge
at 2,000 x g for 5 minutes. The supernatant was removed, leaving a 0.7 mL pellet to
which 100 picomoles of a 2-chlorocycloguanil internal standard was added. In early
experiments the blood pellet was lysed by freezing at -80°C overnight before adding
internal standard. Later experiments were performed under more harsh conditions, via
adding the internal standard and then sonicating ice-chilled samples for 30 seconds
using a Heat Systems Ultrasonics Inc., Model W185 Cell Disrupter with a micro tip at 30
watt output. The resulting 0.7 mL blood pellet became more translucent and was then
adjusted to 70% acetonitrile to precipitate cellular proteins. The tube was centrifuged
at 10,000 x g for 20 minutes at 4 °C. The supernatant was then aliquotted into 1.5 mL
tubes and speed vacuumed. The dry samples were resuspended in 100 µL of
acetonitrile and water 1:1, combined into a single tube, and speed vacuumed again.
The sample was then resuspended in 50 µL of acetonitrile and water 1:1 before being
loaded into an auto sampler vial and stored at 4 °C before analysis. The following
fragmentations were monitored during the run: 2-chloro-cycloguanil 286.1-229.1,
286.1-58.0; proguanil 254.2-170.2, 254.2-153.0; cycloguanil 252.2-195.2, 252.2-153.1,
252.2-58.0 .
A standard curve was constructed from 6 to 9 samples in acetonitrile:water 1:1
containing proguanil, cycloguanil, and 2-chloro-cycloguanil at concentrations from 5,000
to 0.5 nM. Extraction efficiencies were compared by adding three different
concentrations of mixed standards to the 0.7 mL red blood cell and parasite pellet
79
during work up and comparing the resulting samples to the standard curve. The peak
areas of the most responsive ion fragments of each drug across all samples were
recorded, the internal standard used to normalize each run’s extraction efficiency
individually, and the resulting areas were compared to the standard curve to determine
the drug concentration in each sample.
Results
Single Drug Susceptibility Profiles
Malaria parasite growth and drug survival assays (EC50s) were performed to
assess the effects of selected antimalarial drugs. To establish baselines for the effects of
the drug combination Malarone® (proguanil and atovaquone), we first profiled the
susceptibility to single drugs as well as relevant combinations. Proguanil’s metabolite,
cycloguanil, and a biguanide drug also reported as synergistic with atovaquone,
synthalin, were assayed [105]. Inhibitors of complex III of the electron transport chain,
the target of atovaquone, were also profiled [162]. Growth was assessed by 3H-
hypoxanthine uptake assays conducted following 48 hours of drug exposure in standard,
20% serum supplemented RPMI-1640 media. Experiments were performed using the
common lab strains 3d7, FCR3, D6, Dd2, and TM90 C2A as well as the non-standard lab
strains/drug-resistant lines B/G9, SB1-A6, and TM90 C2B. A series of single-agent
antimalarial drugs related to Malarone® were assayed and resulted in the parasite
growth data shown in the representative experiment in Figure 3.5.
80
Proguanil
The growth inhibitory effects of proguanil were examined at drug concentrations
as high as 100 µM. The individual results of the proguanil EC50 are reported in Figure
3.5 and Table 3.1. Of the parasite lines tested, nearly all parasite strains tested display
similar EC50 drug inhibition profiles of around 10 µM (3d7 13 µM, B/G9 12 µM, FCR3 15
µM, Dd2 15 µM, TM90 C2A 14 µM). Moderate sensitivity was observed with SB1-A6
and TM90 C2B lines at 8.0 and 8.2 µM, respectively. The D6 parasite strain, a strain very
susceptible to many drugs, stood out with a sensitivity of 0.43 µM.
Cycloguanil
The levels of drug resistance observed for cycloguanil are quite a bit more
variable than other drugs discussed. The EC50 of the most cycloguanil-sensitive lines
were in the low nanomolar range (D6 2.8 nM and SB1-A6 3.2 nM). The most common
lab strain, 3d7, was moderately less susceptible to cycloguanil (3d7 15 nM) and is
generally regarded as the baseline standard for a “sensitive to antifolates” phenotype.
More pronounced resistance was observed with strains carrying known point mutations
in the DHFR gene (Table 3.5) which resulted in low micromolar sensitivity (FCR3 1.8 µM
and Dd2 2.9 µM). The highest level of cycloguanil resistance was observed in the
parasite strains B/G9 and the TM90 C2A and C2B variants (B/G9 19 µM, TM90 C2A 35
µM, and TM90 C2B 18 µM).
81
Atovaquone
Atovaquone is a particularly potent antimalarial drug with activity in the single
nM range for most strains of malaria. Atovaquone potency was assessed via 3H-
hypoxanthine uptake and yielded EC50s of - 3d7 4.6 nM, B/G9 8.9 nM, FCR3 1.9 nM, Dd2
6.2 nM, and TM90 C2A 14 nM. Moderate sensitivity was observed in the D6 line at 0.15
nM. High levels of resistance were observed in the SB1-A6 and TM90 C2B lines (98 and
69 µM, respectively). The SB1-A6 and TM90 C2B strains are expected to have
pronounced resistance to atovaquone due to their previous exposure and acquired
resistance to an experimental acridone-based electron transport chain inhibitor or
atovaquone, respectively.
Myxothiazol
Additional parasite growth assays were performed using inhibitors of two active
sites of complex III in the electron transport chain, myxothiazol and antimycin A. The
results of these alternate complex III inhibitors are reported in Figure 3.6 and Table 3.1.
Parasites exposed to myxothiazol are well grouped in their sensitivity. The majority of
the parasite lines are sensitive around the several hundred nanomolar level (3D7 360
nM, B/G9 460 nM, Dd2 370 nM, and TM90 C2A 750 nM). The most myxothiazol-
sensitive lines tested were the FCR3 and D6 strains at 100 nM and 68 nM, respectively.
Significant resistance to myxothiazol was observed in the TM90 C2B and SB1-A6 parasite
lines (TM90 C2B 9 µM and SB1-A6 53 µM). The fact that atovaquone binds to the same

82
Q0 active site as myxothiazol is predictive of the resistance displayed by the TM90 C2B
and SB1-A6 strains.
Antimycin A
Parasites exposed to antimycin A were difficult to quantify given the limited
solubility of antimycin A in our culture media. Antimycin A binds the alternate Qi site of
complex III of the electron transport chain. The majority of the parasite lines display
moderately sensitive to antimycin A (3d7 9.6 µM, B/G 6.6 µM, and Dd2 5.5 µM). D6 and
FCR3 parasites, at 840 and 1,000 nM, were more sensitive than the majority of parasite
lines. TM90 C2A, TM90 C2B and SB1-A6 appeared highly resistant to antimycin A with
the TM90 C2A strain EC50 at 96 µM but the TM90 C2B and SB1-A6 strains resistance
extending above the 100 µM maximum concentration assayed.
Synthalin
Synthalin is a commercially available, alternate biguanide drug reported to
inhibit parasite growth and act synergistically with atovaquone [105]. Synthalin’s
structure, a 10 carbon hydrocarbon chain with guanidine on each end, cannot be
activated to a cycloguanil-like structure. Any biguanide-specific targets that were
evident for proguanil might carry over into synthalin, particularly any components of
synergy. As a single agent antimalarial, the majority of the synthalin EC50s were in the
upper tens of micromolar range (3d7 121 nM, B/G9 37 nM, D6 35 nM, Dd2 34 nM, SB1-
83
A6 67 nM, TM90 C2A 55 nM, TM90 C2B 47 nM). Only the FCR3 parasite line seemed to
appreciably differ in sensitivity to synthalin, at only 4.1 nM.
Drug Synergy Profiles
Low concentrations of atovaquone have been implicated in creating a
susceptibility to proguanil that is synergistic in nature. The relatively consistent
response of parasite strains to proguanil alone, varied response to atovaquone, and
even more varied response to cycloguanil, proguanil’s active form, inspired the profiling
of parasite growth in response to both components of Malarone®, atovaquone and
proguanil across a broad range of parasite strains. A number of variations on the design
were performed, with the best display of synergistic response from experiments where
a low nanomolar amount of atovaquone was kept fixed as the concentration of
proguanil was varied. Due to the growth inhibition by atovaquone being varied, the
inflection point of the proguanil curve is being reported rather than the true, non-drug
treated 50% growth inhibition point. To help quantify synergy, something we will call a
“Synergy Shift Ratio” was calculated by dividing the concentration of half maximum
inhibition of the biguanide by the half maximum inhibition of that parasite strain’s
biguanide with atovaquone. High Synergy Shift Ratios represent higher levels of a
synergistic drug action. A representative experiment’s inhibition curves are displayed in
Figure 3.7 and the interpreted EC50s and Synergy Shift Ratios are reported in Table 3.2 .
Against a single drug, most parasite strains were susceptible to proguanil with an EC50
around 10 micromolar. The D6 parasite strain is more sensitive with an EC50 of 430

84
nanomolar. When a small amount of atovaquone was added, many parasite lines
exhibited a significant shift in the half-maximal growth inhibition concentration of
proguanil. At 0.4 nM atovaquone added to the proguanil, the most significant shift was
in FCR3’s EC50 value being reduced 7 fold compared to proguanil alone. With 1 nM
atovaquone added to the flasks of proguanil treated parasites, proguanil’s observed EC50
was, again, significantly shifted in the FCR3 strain (56 fold compared to proguanil alone)
as well as in the 3d7 and Dd2 strains (at 81 fold and 6 fold shifts). When atovaquone
was increased to 5 nM, the EC50 had shifted in most parasite lines, indicating a
phenomenon where some parasite lines may require relatively high amounts of
atovaquone to achieve synergy. The parasite strains that displayed a synergy shift at
lower atovaquone concentrations (3d7, FCR3, and Dd2) were also shifted in the 5 nM
atovaquone with proguanil treatment group at 100, 153, and 107 fold shifts,
respectively. Additionally, the B/G9, SB1-A6, and TM90 C2A parasite strains had
synergistic shifts of 34, 12, and 79 fold, respectively. Curiously, the D6 parasites, which
are the most susceptible to atovaquone, did not seem to display a synergy shift nor did
the TM90 C2B parasite line.
Another experiment was designed to examine if biguanides were consistent in
their synergistic potency against parasites already experiencing atovaquone-based
disruption of the electron transport chain. We examined the theory proffered by
Srivastava et al that biguanide potency was achieved through a leaky complex III that
was only exposed after atovaquone’s disruption of the major driving force of the
85
electropotential gradient [124]. Malaria parasite lines were drug treated at grouped
concentrations calculated to be approximate to the EC70 concentrations of atovaquone
(0.2 nM for D6, 1.5 nM for 3d7, B/G9, and FCR3, 5 nM for Dd2 and TM90 C2A, 100 nM
for SB1-A6 and TM90 C2B) with a variable proguanil. The SB1-A6 and TM90 C2B strains
are highly atovaquone resistant, so the 100 nM was a practical limit and not the EC70.
The Synergy Shift Ratio for proguanil and high levels of atovaquone was calculated by
dividing the concentration of half maximum inhibition of the biguanide by the half
maximum inhibition of that parasite strain’s biguanide with EC70 atovaquone. Again,
high Synergy Shift Ratios represent higher levels of a synergistic drug action. The 3H-
hypoxanthine uptake/cell growth curves for a representative experiment are displayed
in Figure 3.8 and interpreted in Table 3.3. The Synergy Shift Ratio of proguanil with
atovaquone was high in the 3d7, FCR3, TM90 C2A, and Dd2 parasite lines, resulting in a
proguanil potency shifts of 148, 158, 163, and 100 fold, and modest in B/G9 and SB1-A6
parasite lines, resulting in synergy shifts for proguanil potency of 43 and 41 fold. The
synergy of synthalin and atovaquone at its EC70 value was similarly evaluated as high in
the TM90 C2A parasite line, at 126 fold, and modest in FCR3, 3d7, and B/G9 parasite
lines, with potency shifts of 42, 16, and 16 fold. The parasites displaying proguanil and
atovaquone synergy had some members in common with the synergy between the
synthalin biguanide and atovaquone, but some inconsistent members and a differing
order of sensitivities cast doubt on the source of synergy being the same target(s). We
then directly evaluated if proguanil’s conversion to cycloguanil was involved in the in
vitro observations of synergy.

86
Direct UPLC-MS/MS Evidence for Cycloguanil Formation
Individual T75 flasks of parasites were grown at the same 100 nM proguanil and
100 nM atovaquone concentrations described by Painter while studying Malarone®
synergy [52]. Flasks were grown with proguanil but not parasites, proguanil or
atovaquone alone in the presence of parasites, and conditions with both proguanil and
atovaquone with parasites for a 24 hour period. The extraction efficiency of the method
with BondElut C18 columns was variable; between 10 – 30% was a typical recovery
achieved while creating the standard curve. Upon normalizing the internal standard to
the standard curve, it was possible to reasonably quantify the levels of drugs recovered
from the red blood cell pellet, although run to run variation was high. The level of
proguanil extracted from the 1 mL red blood cell pellet was 22 ± 3 µM, 18 ± 4 µM, 15 ± 4
µM, and 0 from the conditions of no parasites, proguanil alone with parasites, proguanil
and atovaquone with parasites, and atovaquone alone with parasites, respectively. The
level of cycloguanil measured in that same pellet was determined to be 9 ± 3 nM, 14 ± 2
nM, 16 ± 2 nM, and 0 from the conditions of no parasites, proguanil alone with
parasites, proguanil and atovaquone with parasites, and atovaquone alone with
parasites, respectively, when averaged across experiments. The data is summarized in
Figure 3.10. The presence of cycloguanil is remarkable and not something that depends
on parasite metabolism.

87
Drug Rescue with Cycloguanil Resistant Plasmodium vivax DHFR-TS
Rescue plasmids were constructed to transfect malaria parasites with a
cycloguanil resistant form of DHFR-TS from Plasmodium vivax in order to evaluate a
theory that proguanil was activated to cycloguanil in the flasks of parasites. The
transfected parasites were evaluated for their susceptibility to the proguanil and
atovaquone components of Malarone®, cycloguanil, and various concentrations of
proguanil mixed with atovaquone. Continual selection with Blasticidin was required to
maintain the episomal plasmids. The growth inhibition curves from a representative
experiment using the transfected parasites appears in Figure 3.11 and the data is
summarized in Table 3.4. The difference between the drug susceptibility of parasites
containing plasmids was minor, from 9.5 µM for 3d7 parasites without drugs to 6.4 – 3.4
µM for parasites assayed for proguanil. Atovaquone susceptibility was not appreciably
altered in the transfected parasites, all displaying EC50s near 1 nM. A moderate level of
cycloguanil resistance was conferred to parasites transfected with the cycloguanil
resistant form of PvDHFR-TS. Parasites had a cycloguanil susceptibility of 5.5 to 5.9 nM
without the addition of PvDHFR-TS enzyme (for 3d7 and the pRZ (blank) transfectant,
respectively). The wild type form of the PvDHFR-TS enzyme conferred slight levels of
resistance (16.5 nM, 3 fold) in some experiments, but the resistance was not significant
enough to be faithfully reproduced in all experiments. Cycloguanil resistant PvDHFR-TS-
containing parasites were between 10 and 37 fold more resistant to cycloguanil
compared to the EC50 obtained for the wild type PvDHFR-TS transfectants or between 27
and 60 fold more resistant when the cycloguanil resistant PvDHFR-TS parasites are
88
compared to the transfection control pRZ (blank). The cycloguanil resistant form of
PvDHFR-TS did produce an unusual curve shape in 3H-hypoxanthine uptake assays and
the shallow slope contributed to uncertainty in the EC50. When the transfected
parasites were treated with proguanil and a 1 nM amount of atovaquone, the EC50s
were fairly consistent at between 38 and 95 nM for the parasite lines. No significant
shift in the level of synergy between 1 nM atovaquone and proguanil was observed
relative to proguanil alone.
Digitonin Permeabilization of PvDHFR-TS-Containing Parasites
Digitonin-based selective membrane permeabilization was performed on the
3d7 parasites transfected with Plasmodium vivax DHFR-TS expression plasmids. As
shown in the experiment depicted in Figure 3.12, the un-mutated, wild-type PvDHFR-TS
protein levels became extracellular at digitonin concentrations between 0.7 mM – 0.35
mM, similar to the pattern observed for aldolase (a cytosolic protein) releasing between
0.7 mM to 0.35 mM. The native PfDHFR-TS was released into the supernatant between
1.4 mM and 0.7 mM. The cycloguanil-resistance point mutations incorporated in
PvDHFR-TS did not alter the digitonin permeabilization profile observed. The
cycloguanil-resistant PvDHFR-TS was probed with the same antibody as wild-type
PvDHFR-TS and was also released into the supernatant between 0.7 mM - 0.18 mM. In
that same experiment, the cytoplasmic marker Pfaldolase was also observed to release
between 0.7 mM - 0.18 mM. In contrast, the PfDHFR-TS was released into the
supernatant between 1.4 and 0.7 mM digitonin concentrations. These results indicate
89
that our PvDHFR-TS proteins were cytoplasmic and not localizing like the native PfDHFR-
TS.
Discussion
Proguanil Sensitivity
Proguanil is a relatively weak antimalarial in parasite cultures. While effective in
the human body due to pro-drug activation to cycloguanil, the proguanil administered
to parasite cultures requires very high concentrations to kill parasites. The levels of
proguanil necessary to kill parasites in cultures are not achieved in human plasma
following standard oral doses [107, 163]. The parasites’ susceptibility to proguanil was a
relatively uniform response, with EC50s between 8 and 15 µM in all strains but D6
parasites. The D6 strain was the most susceptible to proguanil (at 430 nM) and is 20
times more sensitive than the SB1-A6 experimental strain that was derived from D6
(which measured at 8,000 nM). SB1-A6 was created from D6 parasites via repeated
rounds of selection with an experimental antimalarial that targets the electron transport
chain [162]. The Riscoe lab that created the SB1-A6 line has been investigating the
genetic basis for that strain’s resistance and may, in the future, have additional insight
about the causes for the reduced proguanil sensitivity in that parasite line.
Cycloguanil Sensitivity
Cycloguanil acts on the same DHFR active site as pyrimethamine, an antimalarial
drug used for decades until resistance became well established in the field [164-166].
90
Widespread use of antifolate-based antimalarial drugs, including pyrimethamine and
proguanil/cycloguanil, has resulted in many parasite isolates with different DHFR point
mutations contributing to varied levels of cycloguanil resistance. A summary of the
DHFR point mutations amongst parasite strains used in this study is found in Table 3.5.
Both the D6 and SB1-A6 parasite lines are very sensitive to cycloguanil, with 2.8 and 3.2
nM EC50s. 3d7 parasites are slightly more resistant to cycloguanil with a 4.6 nM EC50.
The Dd2 strain is a DHFR triple mutant and FCR3 has a unique double mutant genotype
that contributes to moderate cycloguanil resistance, at 2.9 and 1.8 µM, respectively.
B/G9 parasites are a transgenic parasite strain with an incorporated human DHFR gene,
which confers an extreme cycloguanil resistance of 19 µM. The TM90 C2A and TM90
C2B strains have a DHFR quadruple mutant genotype and are highly resistant to
cycloguanil at 35 and 18 µM EC50, respectively. The observed sensitivity to cycloguanil
agrees with the trends expected from the point mutations known for each parasite line,
as well as the incorporation of a transgenic human DHFR to the B/G9 strain. Human
DHFR is not appreciably inhibited by cycloguanil. The order of sensitivities to proguanil
and cycloguanil are divergent, with little similarity beyond D6 being the most sensitive
strain to both drugs.
Atovaquone Sensitivity
Atovaquone potency is typically in the low nanomolar to sub-nanomolar range in
EC50 assays. Many early experiments with large panels of parasites were not of suitable
quality due to issues with atovaquone’s solubility in RPMI media as DMSO decreased.
91
Adjustments were made, requiring careful dilutions of drug plates with RPMI-1640
intermediate concentration plates and timely handling to avoid precipitation effects.
The solubility observation could also be related to a report of lipid level influence on
atovaquone EC50 measurements, as drug stocks and intermediates were made in RPMI-
1640 and added to serum-supplemented media (with associated lipids) containing the
live parasites [167]. The majority of the cell lines assayed were predictably sensitive to
atovaquone in the 5 - 14 nM range with both extra-sensitive (D6 and FCR3, at 0.15 and
1.9 nM) and resistant exceptions (SB1-A6 and TM90 C2B, at 98 and 69 µM). The SB1-A6
line was derived from the D6 isolate after exposure to increasing levels of an electron
transport chain inhibitor, 3-(6,6,6-trifluorohexyloxy)-6-amino-acridone, with stepwise
increases from 100 nM to 5,000 nM over 4 weeks [162]. The mechanism(s) by which
SB1-A6 parasites display such strong electron transport chain inhibitor resistance while
simultaneously possessing mitochondria that, when made into free lysates, possess
enzymes that are inhibited by those same electron transport chain inhibitors, are not
yet elucidated. The TM90 C2B isolate is related to the TM90 C2A isolate as it is derived
from the patient who provided the TM90 C2A isolate whose infection recrudesced after
atovaquone monotherapy, yielding TM90 C2B [54]. The TM90 C2B strain is reported to
have differences in the expression of several components of the electron transport
chain’s complex III and complex IV as well as glycolysis [168]. The TM90 C2B line is also
known to have a point mutation in the cytochrome b gene at amino acid 268 (Tyrosine
to Serine). Mutations at codon 268 have been found to decrease the efficiency of the
92
enzyme and interfere with the quinone oxidation (QO) site targeted by atovaquone [168-
170].
Alternate Electron Transport Chain Inhibitors (Myxothiazol and Antimycin A)
The SB1-A6 and TM90 C2B parasite lines were selected with atovaquone or
atovaquone-like compounds until they developed drug resistance. Additional electron
transport chain inhibitors targeting complex III were also screened to evaluate if
atovaquone susceptibility was unique compared to other complex III inhibitors.
Antimycin A is a bacteria-derived antibiotic that acts on the Qi site of complex III.
Myxothiazol is a ubiquinone analog that acts on the QO site of complex III, the same site
that atovaquone binds in. The reason for screening both inhibitors is that both sites are
necessary for complex III, an essential component of the electron transport chain of the
mitochondrion, to function. Due to the many parasite strains being studied, some with
known resistance to atovaquone and like compounds, we needed to evaluate which
parasites may be displaying reduced atovaquone susceptibility instead of a reduced
reliance on the electron transport chain. Probing the same complex would also provide
an avenue for evaluating if any off-target effects of atovaquone were partly responsible
for its anti-parasitic activity.
Parasites exposed to antimycin A in the 3H-hypoxanthine uptake assay elicited a
wide range of responses. The majority of EC50s for antimycin A were in the single
micromolar range (Table 3.1 - FCR3 1 µM, Dd2 5.5 µM, B/G9 6.6 µM, and 3d7 9.6 µM).
The D6 parasite line was the most susceptible at 840 nM and the TM90 C2A, SB1-A6,
93
and TM90 C2B parasite lines were the most resistant (at 96 µM and above). The
relatively weak potency of antimycin A made it difficult to evaluate if parasites
susceptible to atovaquone were displaying a similarly ranked susceptibility to antimycin
A. To a first approximation, parasite strains of high and low sensitivity to atovaquone
displayed a similarly ordered sensitivity to antimycin A. The intermediate sensitivities
were not of the same order. It was noticed that antimycin A had difficulties with
precipitation in 10% DMSO intermediate plates sufficient to leave some traces on the
plastic culture plates. Comparison to another report of antimycin A potency differs
significantly and casts doubt on our protocols being appropriate for this
compound[162]. The low potency and high expense of antimycin A created a significant
barrier to its use in drug synergy experiments and discouraged further experimentation.
Parasites exposed to myxothiazol displayed a similarly broad range of EC50s in
parasite growth assays, generally achieving EC50 values 50 to 100 fold higher than the
value of atovaquone (Table 3.1). Notable exceptions to the trend were the most
sensitive parasites, D6 at 68 nM and its 450 fold increase, and the least sensitive
parasites, SB1-A6 and TM90 C2B at 53 and 9 µM, which were 2 fold and 8 fold less
potent than atovaquone on the same parasite strains. The ordering of sensitivity to
atovaquone mirrors that found in myxothiazol, as one might expect with the same Q0
active site inhibited by both compounds. It is known that the TM90 C2B parasite line
has a Y268S mutation in cytochrome b that decreases atovaquone’s potency but SB1-A6
94
parasites were not found to have any mutation in cytochrome b and the mechanism of
its resistance remains unknown [162].
Alternate Biguanide (Synthalin Sulfate)
While not actively used as an antimalarial agent, the biguanide drug synthalin
sulfate has been reported to be synergistic with atovaquone and electron transport
chain inhibition [105]. The drug synthalin was developed as a functional analog of
Metformin. Metformin resulted following a progression from lilac extracts to guanidine
in the early 1900s to Metformin [171]. Synthalin was utilized to treat diabetes but was
withdrawn in the 1940s due to liver toxicity and other drugs have since displaced it
[172-174]. Synthalin also lead to the pentamidine class of drugs to treat
trypanosomiasis [175]. Structurally, synthalin is comprised of two guanidines linked
through a 10 carbon hydrocarbon chain. Synthalin is incapable of being metabolized to
cycloguanil.
The potency of synthalin against many parasite lines was determined, using the
EC50 growth assay, for use as a baseline for further synergy tests. The majority of the
parasite lines had drug susceptibilities around 40 nM (Table 3.1). SB1-A6 parasites had
an EC50 slightly elevated at 67 nM and 3d7 parasites were the most resistant at 121 nM.
The most sensitive strain was FCR3 at 4 nM. Despite reports of synthalin’s synergy with
atovaquone being like that of proguanil, there is no discernable pattern for susceptibility
to synthalin alone that matches up with that of the biguanide proguanil (Table 3.3).
95
Drug Synergy Trends
The panel of lab adapted parasite isolates was treated with variable
concentrations of proguanil combined with small, 0.4 – 5 nM amounts of atovaquone.
Proguanil and atovaquone have been implicated as a synergistic drug combination with
unproven theories about the mechanism [59]. Our experiments (Figure 3.7 and Table
3.2A) were able to capture the synergistic shift of proguanil with fixed concentrations of
atovaquone. Comparing the potency of proguanil with atovaquone to cycloguanil,
parasite strains susceptible to cycloguanil order similarly, but not identically, to
proguanil with atovaquone. For example, at 1 nM atovaquone and varied proguanil the
EC50 from least to greatest orders as 3d7, D6, FCR3, SB1-A6, Dd2, B/G9, TM90 C2A, and
TM90 C2B while cycloguanil susceptibility orders as D6, SB1-A6, 3d7, FCR3, Dd2, TM90
C2B, B/G9, and TM90 C2A. At a single atovaquone concentration, the proguanil and
atovaquone potency is similar to that of cycloguanil. With differing amounts of
atovaquone added to proguanil, our experiments (Figure 3.7 and Table 3.2B) illustrated
that some parasite lines (FCR3, 3d7, and possibly Dd2) display susceptibility to drug
synergy between proguanil and atovaquone potentiated at low concentrations of
atovaquone, but others (B/G, TM90 C2A, and possibly the SB1-A6 line) only display
synergistic shifts at higher concentrations of atovaquone. In this set of experiments, in
strains where strong synergy was noted between proguanil and atovaquone, the level of
proguanil needed to reach half-maximal growth was reduced by around 100 fold
compared to proguanil alone. Oddly, two parasite lines exhibiting extreme atovaquone
96
sensitivity and extreme insensitivity, D6 and TM90 C2B, display no significant synergy
between atovaquone and proguanil, instead measuring less than a fourfold difference
from the potency of proguanil alone.
Drug synergy between proguanil and atovaquone has also been characterized as
a general synergy between biguanides and atovaquone [59]. To help delineate if any
cycloguanil-specific mechanisms were in play, we attempted to measure the synergy
between a biguanide that can’t make cycloguanil, synthalin, with atovaquone and
compare to the Malarone® drug combination. In the biguanide-synergy comparison, we
incorporated higher concentrations of atovaquone calculated to be inhibitory against
each parasite line to more directly illustrate any drug synergy (Figure 3.8 and Table 3.3).
The Synergy Shift Ratio for synthalin with atovaquone ranged from 1 to 126 fold, with
the ordering from high to low of TM90 C2A 126 fold, FCR3 42 fold, 3d7 and B/G9 16
fold, Dd2 6 fold, and D6, SB1-A6, and TM90 C2B having shifts of less than fourfold
(within the range of experimental variation). When put in an order of magnitude, drug
susceptibility compares well with the pattern observed for proguanil with atovaquone
(TM90 C2A 163 fold, FCR3 158 fold, 3d7 148 fold, Dd2 100 fold, B/G9 43 fold, SB1-A6 41
fold, and D6 and TM90 C2B being fourfold or less). As the single drug EC50s for synthalin
and proguanil widely differed in strain susceptibility, the pattern for both proguanil and
synthalin when combined with atovaquone is surprising. The magnitudes of the Synergy
Shift Ratios fluctuate but the ordering is reasonably well preserved (except for B/G9 and
Dd2 exchanging positions and SB1-A6 displaying no synergy between the synthalin and
97
atovaquone combination). The D6 and TM90 C2B parasites not displaying synergy
between both biguanides and atovaquone was remarkable and suggests these parasite
lines may have some unidentified similarity that contributes to lack of synergy between
proguanil and atovaquone.
A theory of a secondary proguanil-based sensitivity playing a role in the synergy
is perhaps bolstered by the results with TM90 C2B parasites. TM90 C2B has a known
atovaquone-specific point mutation in the cytochrome b gene (Y268S) and did not
display proguanil and atovaquone synergy [54, 168]. Also interesting, the SB1-A6
parasites displaying moderate synergy between proguanil and atovaquone but the
progenitor D6 line not displaying biguanide and atovaquone synergy hints at a complex
set of changes that have occurred in the D6 parasites that even the lab that created SB1-
A6 has not yet identified.
We profiled the drug susceptibilities of different parasite isolates as an efficient
way to examine parasites with differing DHFR mutations, but relying on isolates may
also introduce complications. Different lab-cultured parasite isolates have very different
histories, including the length of continuous culture in media, known antimalarial drug
treatments and acquired resistance, and differing changes resulting from long term
asexual culture (a bias towards fewer gametocytes, inability to produce both sexes of
gametocytes, loss of cytoadherence, and reduced folate uptake abilities for
example)[176-182]. In order to more thoroughly remove genetic variation and establish
a role for cycloguanil in Malarone® drug treatment, assays were performed to assess if

98
cycloguanil was generated under in vitro culture conditions. We also developed a
transfection-based rescue construct that would impart parasites with a cycloguanil
resistant form of DHFR-TS enzyme.
Mass Spec Determination of CG and PG Levels from In Vitro Cultures
The proguanil and cycloguanil drugs are organic molecules that could be
extracted from cell cultures via solid phase extraction techniques. The internal standard
of 2-chloro-cycloguanil was added just prior to lysis of the blood and parasite pellet,
allowing for a way to correct for variations in recovery efficiencies. Detection was
initially performed on a Waters Micromass Quattro Micro QTQ in the Chemistry
Department but the cycloguanil signal could barely be detected above the noise. A
Waters Micromass Quattro Premier XE UPLC QTQ system in the Medicinal Chemistry
department, which combines a higher pressure HPLC with a more sensitive mass spec,
proved more reliable at detecting the faint signal of cycloguanil.
Solid phase extraction from a 30 mL culture flask recovered between 13-30 % of
the drugs present in the flask. When corrected to the standard curve via extraction
efficiencies from added internal standard, the levels of drugs could be quantified. The
amount of proguanil, typically from 15 - 22 µM in the injected 50 µL sample is significant
and suggests some sequestration in the red blood cell pellet. The UPLC system was
employed for greater resolution in lower volumes, essentially allowing for more of the
sample to be injected into the Triple Quadrupole Mass Spectrometer. The UPLC system
was able to detect peaks for cycloguanil that were significant relative to the noise and
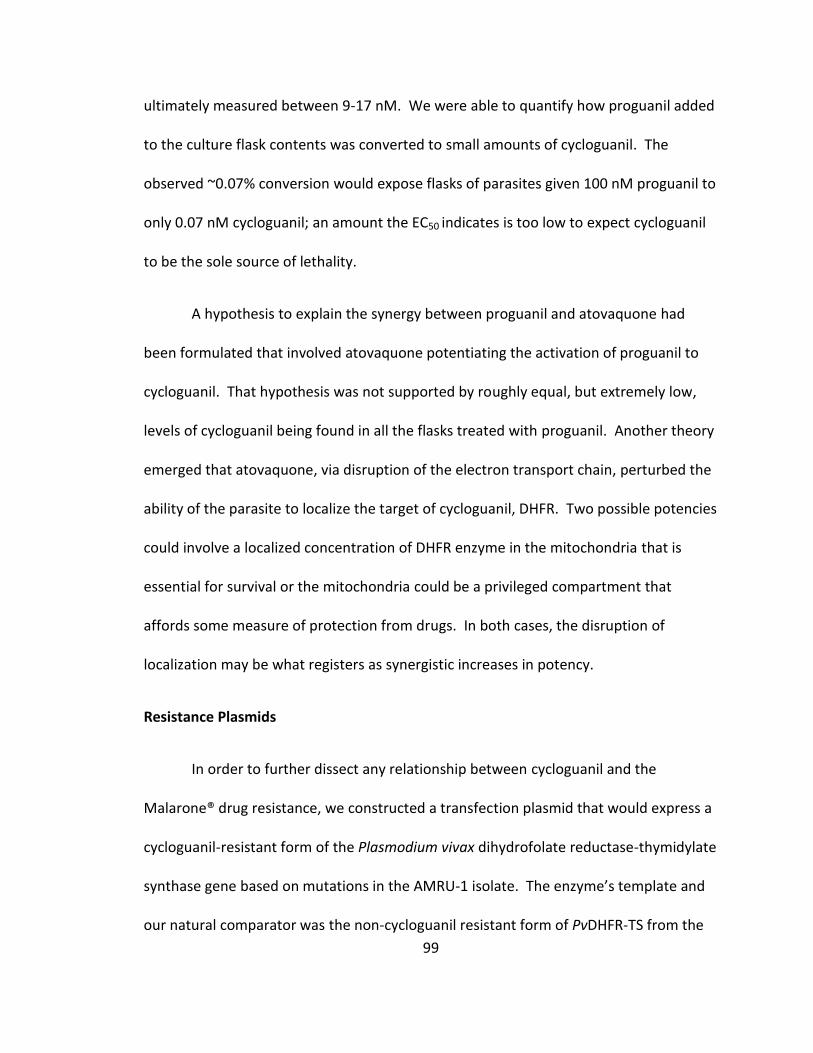
99
ultimately measured between 9-17 nM. We were able to quantify how proguanil added
to the culture flask contents was converted to small amounts of cycloguanil. The
observed ~0.07% conversion would expose flasks of parasites given 100 nM proguanil to
only 0.07 nM cycloguanil; an amount the EC50 indicates is too low to expect cycloguanil
to be the sole source of lethality.
A hypothesis to explain the synergy between proguanil and atovaquone had
been formulated that involved atovaquone potentiating the activation of proguanil to
cycloguanil. That hypothesis was not supported by roughly equal, but extremely low,
levels of cycloguanil being found in all the flasks treated with proguanil. Another theory
emerged that atovaquone, via disruption of the electron transport chain, perturbed the
ability of the parasite to localize the target of cycloguanil, DHFR. Two possible potencies
could involve a localized concentration of DHFR enzyme in the mitochondria that is
essential for survival or the mitochondria could be a privileged compartment that
affords some measure of protection from drugs. In both cases, the disruption of
localization may be what registers as synergistic increases in potency.
Resistance Plasmids
In order to further dissect any relationship between cycloguanil and the
Malarone® drug resistance, we constructed a transfection plasmid that would express a
cycloguanil-resistant form of the Plasmodium vivax dihydrofolate reductase-thymidylate
synthase gene based on mutations in the AMRU-1 isolate. The enzyme’s template and
our natural comparator was the non-cycloguanil resistant form of PvDHFR-TS from the
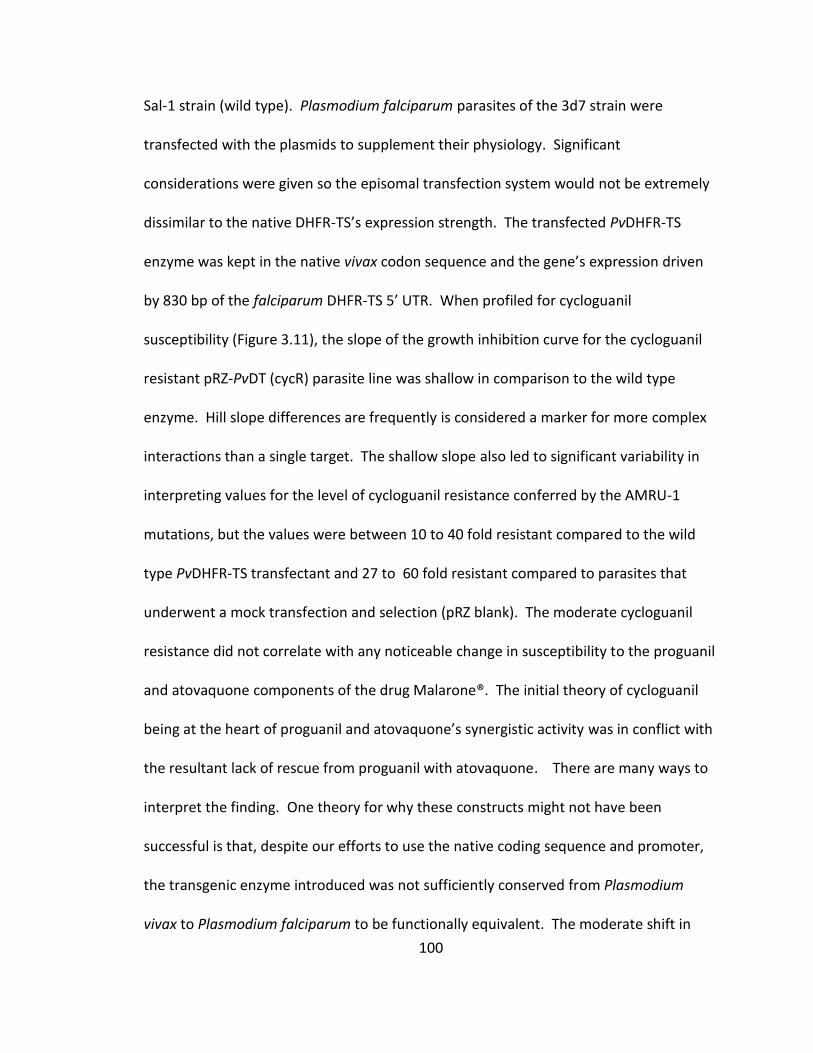
100
Sal-1 strain (wild type). Plasmodium falciparum parasites of the 3d7 strain were
transfected with the plasmids to supplement their physiology. Significant
considerations were given so the episomal transfection system would not be extremely
dissimilar to the native DHFR-TS’s expression strength. The transfected PvDHFR-TS
enzyme was kept in the native vivax codon sequence and the gene’s expression driven
by 830 bp of the falciparum DHFR-TS 5’ UTR. When profiled for cycloguanil
susceptibility (Figure 3.11), the slope of the growth inhibition curve for the cycloguanil
resistant pRZ-PvDT (cycR) parasite line was shallow in comparison to the wild type
enzyme. Hill slope differences are frequently is considered a marker for more complex
interactions than a single target. The shallow slope also led to significant variability in
interpreting values for the level of cycloguanil resistance conferred by the AMRU-1
mutations, but the values were between 10 to 40 fold resistant compared to the wild
type PvDHFR-TS transfectant and 27 to 60 fold resistant compared to parasites that
underwent a mock transfection and selection (pRZ blank). The moderate cycloguanil
resistance did not correlate with any noticeable change in susceptibility to the proguanil
and atovaquone components of the drug Malarone®. The initial theory of cycloguanil
being at the heart of proguanil and atovaquone’s synergistic activity was in conflict with
the resultant lack of rescue from proguanil with atovaquone. There are many ways to
interpret the finding. One theory for why these constructs might not have been
successful is that, despite our efforts to use the native coding sequence and promoter,
the transgenic enzyme introduced was not sufficiently conserved from Plasmodium
vivax to Plasmodium falciparum to be functionally equivalent. The moderate shift in

101
cycloguanil susceptibility supports this notion, as the point mutations introduced have
been reported to confer three orders of magnitude resistance to cycloguanil when using
a different transfection system for the AMRU-1 enzyme [45, 154]. Another theory to
explain why the transfected PvDHFR-TS was not able to confer more resistance is that
the native enzyme might need to be present and active in a particular location in the
parasite. Following the observation of localization of PfDHFR-TS to the mitochondria,
the localization of the PvDHFR-TS enzyme produced in these transgenic parasites was
also examined using digitonin permeabilization.
Digitonin-based Fractionation of PvDHFR-TS Transfectants
Experiments were performed utilizing selective digitonin permeabilization of the
3d7 Plasmodium falciparum parasites that had been transfected to express Plasmodium
vivax DHFR-TS. The blots obtained from these experiments (Figure 3.12) hinted at a
relatively strong production of PvDHFR-TS protein in the cell. Although Western blots
are not a quantitative technique, the relatively short exposure times compared to native
Plasmodium falciparum DHFR-TS suggest a greater abundance of the vivax protein.
Digitonin fractionation on both vivax DHFR-TS containing parasite lines showed the
cytosolic protein, aldolase, was released from the parasite at similar digitonin
concentrations as the Plasmodium vivax DHFR-TS protein. The native Plasmodium
falciparum DHFR-TS only appeared in the supernatant of the higher digitonin
concentration samples, indicating organellar localization not shared with the vivax
protein. The cycloguanil-resistance point mutations incorporated in PvDHFR-TS did not
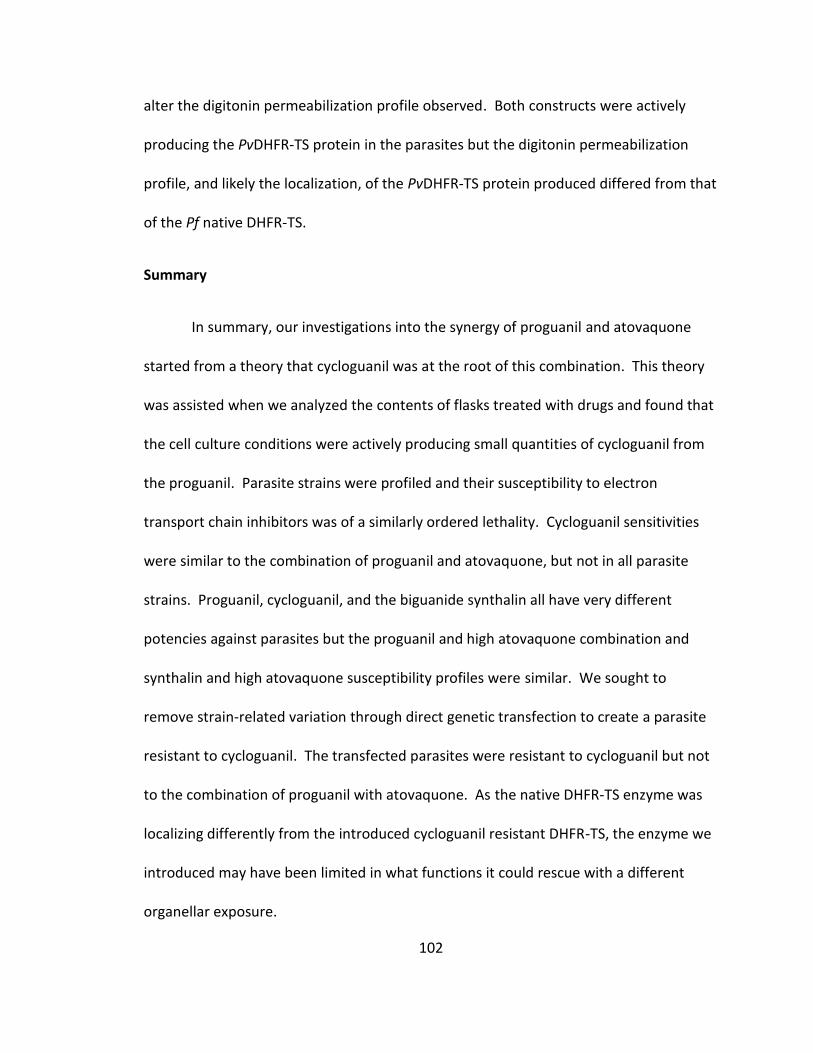
102
alter the digitonin permeabilization profile observed. Both constructs were actively
producing the PvDHFR-TS protein in the parasites but the digitonin permeabilization
profile, and likely the localization, of the PvDHFR-TS protein produced differed from that
of the Pf native DHFR-TS.
Summary
In summary, our investigations into the synergy of proguanil and atovaquone
started from a theory that cycloguanil was at the root of this combination. This theory
was assisted when we analyzed the contents of flasks treated with drugs and found that
the cell culture conditions were actively producing small quantities of cycloguanil from
the proguanil. Parasite strains were profiled and their susceptibility to electron
transport chain inhibitors was of a similarly ordered lethality. Cycloguanil sensitivities
were similar to the combination of proguanil and atovaquone, but not in all parasite
strains. Proguanil, cycloguanil, and the biguanide synthalin all have very different
potencies against parasites but the proguanil and high atovaquone combination and
synthalin and high atovaquone susceptibility profiles were similar. We sought to
remove strain-related variation through direct genetic transfection to create a parasite
resistant to cycloguanil. The transfected parasites were resistant to cycloguanil but not
to the combination of proguanil with atovaquone. As the native DHFR-TS enzyme was
localizing differently from the introduced cycloguanil resistant DHFR-TS, the enzyme we
introduced may have been limited in what functions it could rescue with a different
organellar exposure.
103
Chapter 3 Figures
Figure 3.1 - Scheme for Synthesis of Cycloguanil, 2-Chloro-cycloguanil
The synthesis of cycloguanil and 2-chloro-cycloguanil was carried out by refluxing 10.7 millimoles of
dicyandiamide, 10 millimoles of the corresponding aniline, 10 millimoles of hydrochloric acid, and 5 mL
of acetone overnight. The precipitate was recrystallized from either water or methanol (as indicated).
HPLC and ESI-MS verified the product and purity of the product. The 2-chloro-cycloguanil was to be
used as an internal standard for HPLC-MS/MS experiments and was run through the appropriate
detection system at concentrations 10x higher than expected to ensure no trace cycloguanil was
present/detectable with that method.

104
Figure 3.2 – Construction of Plasmodium vivax DHFR-TS Rescue Plasmid
Above is the plasmid construction scheme for the Plasmodium vivax DHFR-TS transfections. A) Depicts
the pRZ-BSD +Adaptor plasmid obtained from removing extraneous pRZ-TK-BSD2 elements and inserting
the synthetic primer sequence of restriction sites. B) Depicts the Plasmodium falciparum DHFR-TS 5’
UTR used as a promoter and rep20 element. Both were modified with the indicated restriction sites
using PCR from either 3d7 genomic DNA or the pHHyDHODH-GFP plasmid. All domains were sequenced
in cloning vectors before being added to the transfection vector. C) Depicts the completed construct
after the native PfDHFR-TS 5’ UTR promoter, rep20 segregation promoter, and PvDHFR-TS gene
elements were added. Plasmid maps generated with Lasergene.
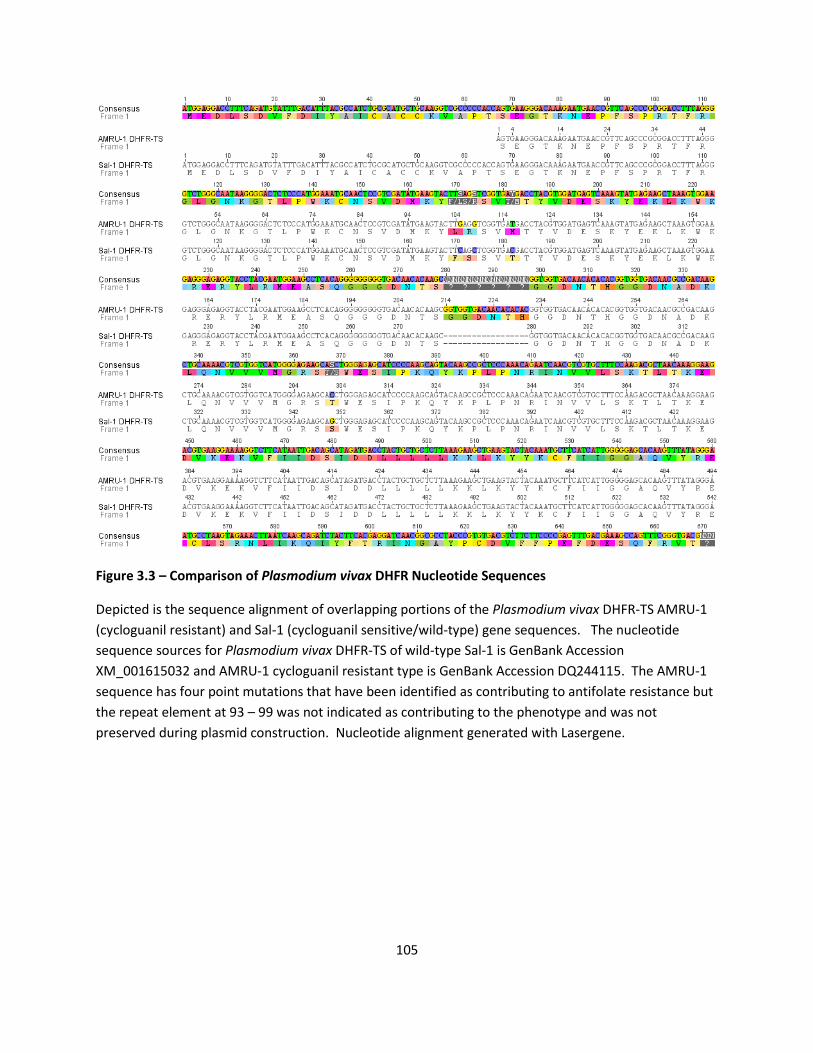
105
Figure 3.3 – Comparison of Plasmodium vivax DHFR Nucleotide Sequences
Depicted is the sequence alignment of overlapping portions of the Plasmodium vivax DHFR-TS AMRU-1
(cycloguanil resistant) and Sal-1 (cycloguanil sensitive/wild-type) gene sequences. The nucleotide
sequence sources for Plasmodium vivax DHFR-TS of wild-type Sal-1 is GenBank Accession
XM_001615032 and AMRU-1 cycloguanil resistant type is GenBank Accession DQ244115. The AMRU-1
sequence has four point mutations that have been identified as contributing to antifolate resistance but
the repeat element at 93 – 99 was not indicated as contributing to the phenotype and was not
preserved during plasmid construction. Nucleotide alignment generated with Lasergene.
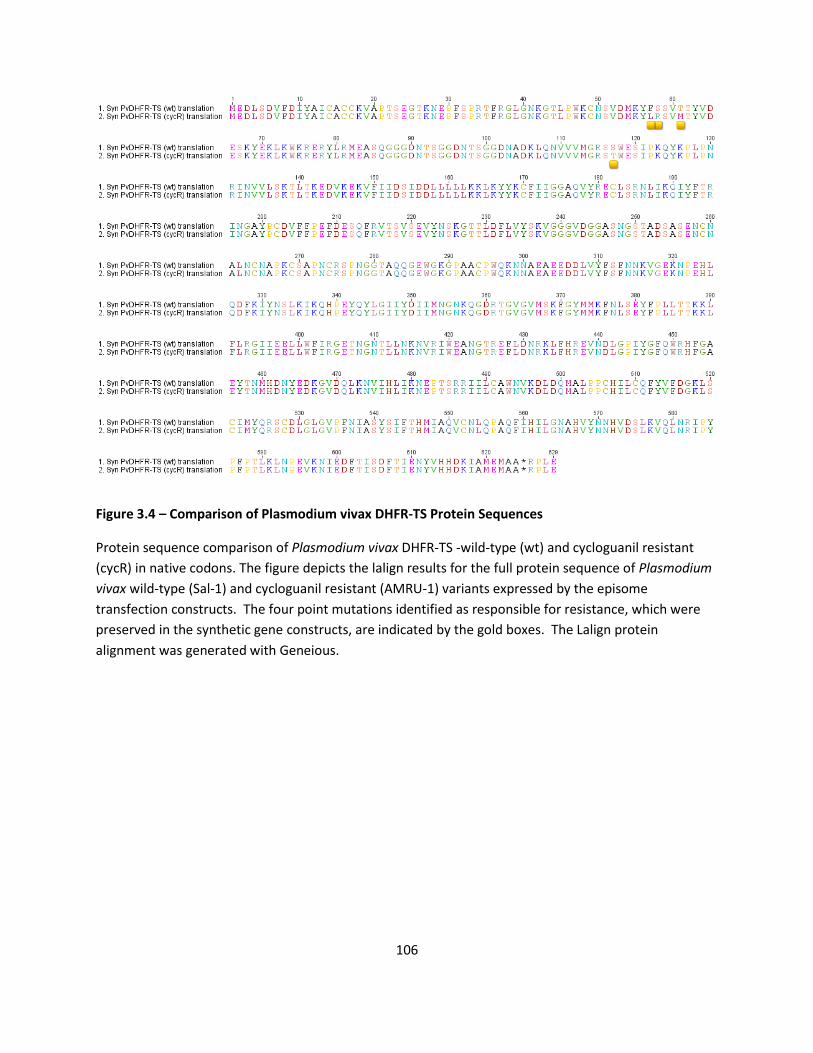
106
Figure 3.4 – Comparison of Plasmodium vivax DHFR-TS Protein Sequences
Protein sequence comparison of Plasmodium vivax DHFR-TS -wild-type (wt) and cycloguanil resistant
(cycR) in native codons. The figure depicts the lalign results for the full protein sequence of Plasmodium
vivax wild-type (Sal-1) and cycloguanil resistant (AMRU-1) variants expressed by the episome
transfection constructs. The four point mutations identified as responsible for resistance, which were
preserved in the synthetic gene constructs, are indicated by the gold boxes. The Lalign protein
alignment was generated with Geneious.
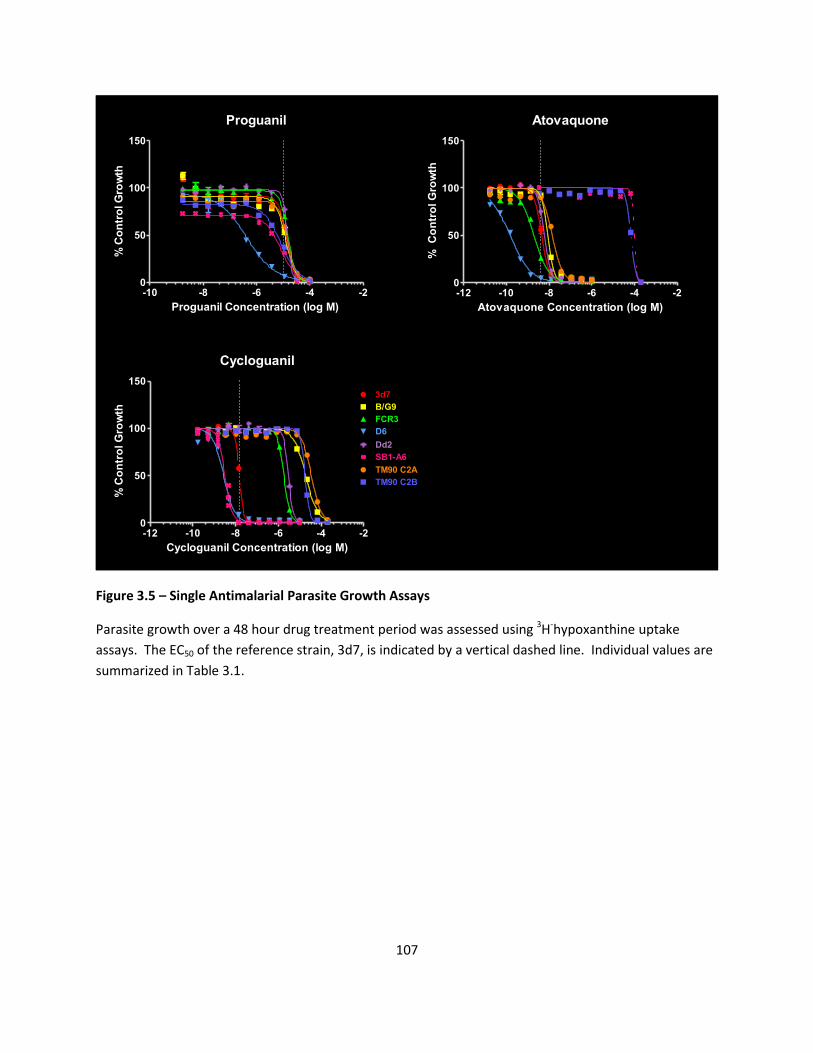
107
Proguanil
-10 -8 -6 -4 -20
50
100
150
Proguanil Concentration (log M)
% C
on
tro
l G
row
thAtovaquone
-12 -10 -8 -6 -4 -20
50
100
150
Atovaquone Concentration (log M)
%
Co
ntr
ol G
row
th
Cycloguanil
-12 -10 -8 -6 -4 -20
50
100
150
3d7
B/G9
FCR3
D6
SB1-A6
Dd2
TM90 C2A
TM90 C2B
Cycloguanil Concentration (log M)
% C
on
tro
l G
row
th
Figure 3.5 – Single Antimalarial Parasite Growth Assays
Parasite growth over a 48 hour drug treatment period was assessed using 3H-hypoxanthine uptake
assays. The EC50 of the reference strain, 3d7, is indicated by a vertical dashed line. Individual values are
summarized in Table 3.1.
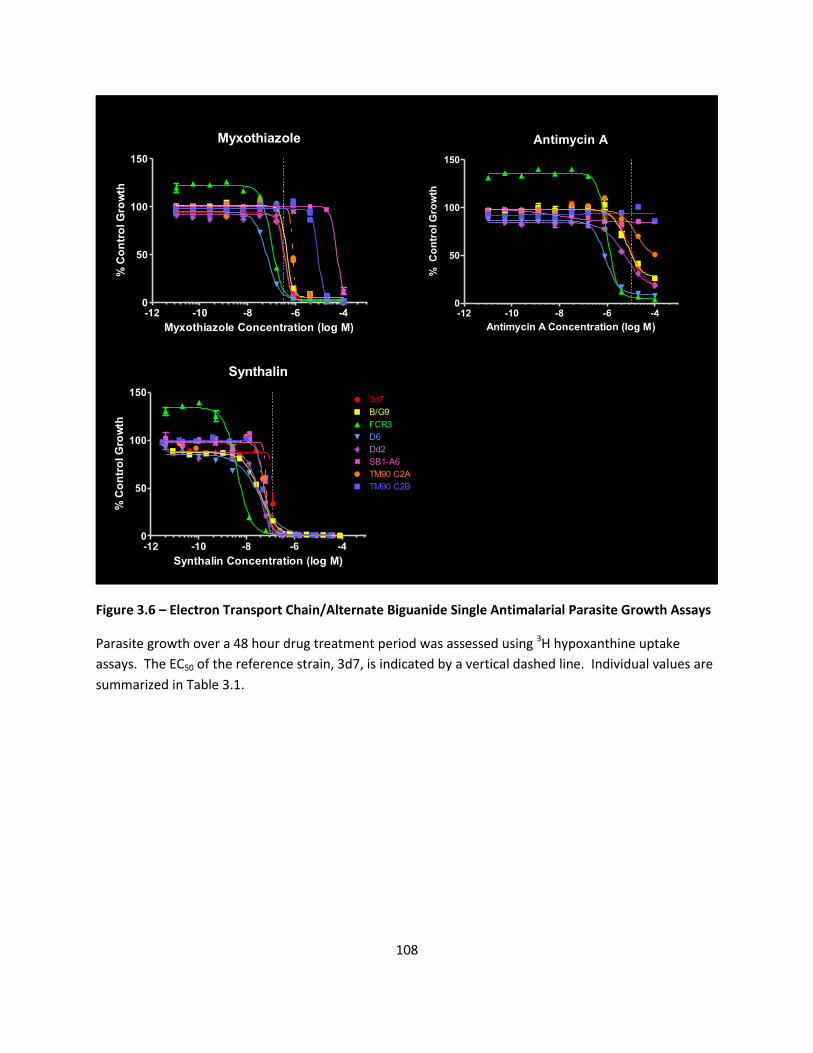
108
Myxothiazole
-12 -10 -8 -6 -40
50
100
150
Myxothiazole Concentration (log M)
% C
on
tro
l G
row
th
Synthalin
-12 -10 -8 -6 -40
50
100
1503d7
B/G9
FCR3
D6
SB1-A6
Dd2
TM90 C2A
TM90 C2B
Synthalin Concentration (log M)
% C
on
tro
l G
row
th
Jwf-417
Antimycin A
-12 -10 -8 -6 -40
50
100
150
Antimycin A Concentration (log M)
% C
on
tro
l G
row
th
Figure 3.6 – Electron Transport Chain/Alternate Biguanide Single Antimalarial Parasite Growth Assays
Parasite growth over a 48 hour drug treatment period was assessed using 3H hypoxanthine uptake
assays. The EC50 of the reference strain, 3d7, is indicated by a vertical dashed line. Individual values are
summarized in Table 3.1.
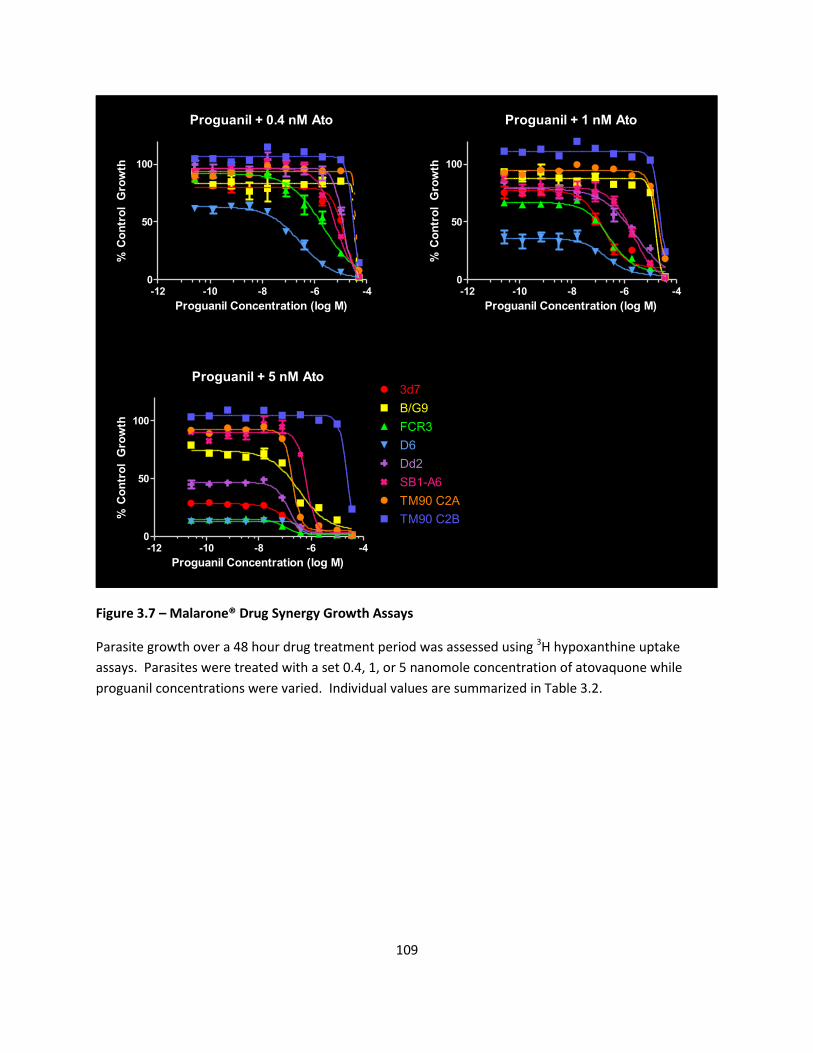
109
Proguanil + 0.4 nM Ato
-12 -10 -8 -6 -40
50
100
Proguanil Concentration (log M)
% C
on
tro
l G
row
thProguanil + 1 nM Ato
-12 -10 -8 -6 -40
50
100
Proguanil Concentration (log M)
% C
on
tro
l G
row
th
Proguanil + 5 nM Ato
-12 -10 -8 -6 -40
50
100
3d7
B/G9
FCR3
D6
Dd2
SB1-A6
TM90 C2A
TM90 C2B
Proguanil Concentration (log M)
% C
on
tro
l G
row
th
JWF-410
Figure 3.7 – Malarone® Drug Synergy Growth Assays
Parasite growth over a 48 hour drug treatment period was assessed using 3H hypoxanthine uptake
assays. Parasites were treated with a set 0.4, 1, or 5 nanomole concentration of atovaquone while
proguanil concentrations were varied. Individual values are summarized in Table 3.2.

110
Proguanil
-9 -8 -7 -6 -5 -40
50
100
150
Proguanil Concentration (log M)
% C
on
tro
l G
row
thSynthalin
-12 -10 -8 -6 -40
50
100
150
Synthalin Concentration (log M)
% C
on
tro
l G
row
th
Proguanil + EC70 Ato
-9 -8 -7 -6 -5 -40
50
100
150
Proguanil Concentration (log M)
% C
on
tro
l G
row
th
Synthalin + EC70 Ato
-12 -10 -8 -6 -4
0
50
100
1503d7
B/G9
FCR3
D6
SB1-A6
TM90 C2A
TM90 C2B
Dd2
Synthalin Concentration (log M)
%
Co
ntr
ol G
row
th
Figure 3.8 – Growth Assays Evaluating Synergy of Biguanides with Effective Concentrations of
Atovaquone
Parasite growth over a 48 hour drug treatment period was assessed using 3H hypoxanthine uptake
assays. Parasites were treated with a set concentration of atovaquone calculated to achieve 70%
growth inhibition alone, although actual results differed, while proguanil concentrations were varied.
The individual EC50 values and synergy ratio are summarized in Table 3.3.
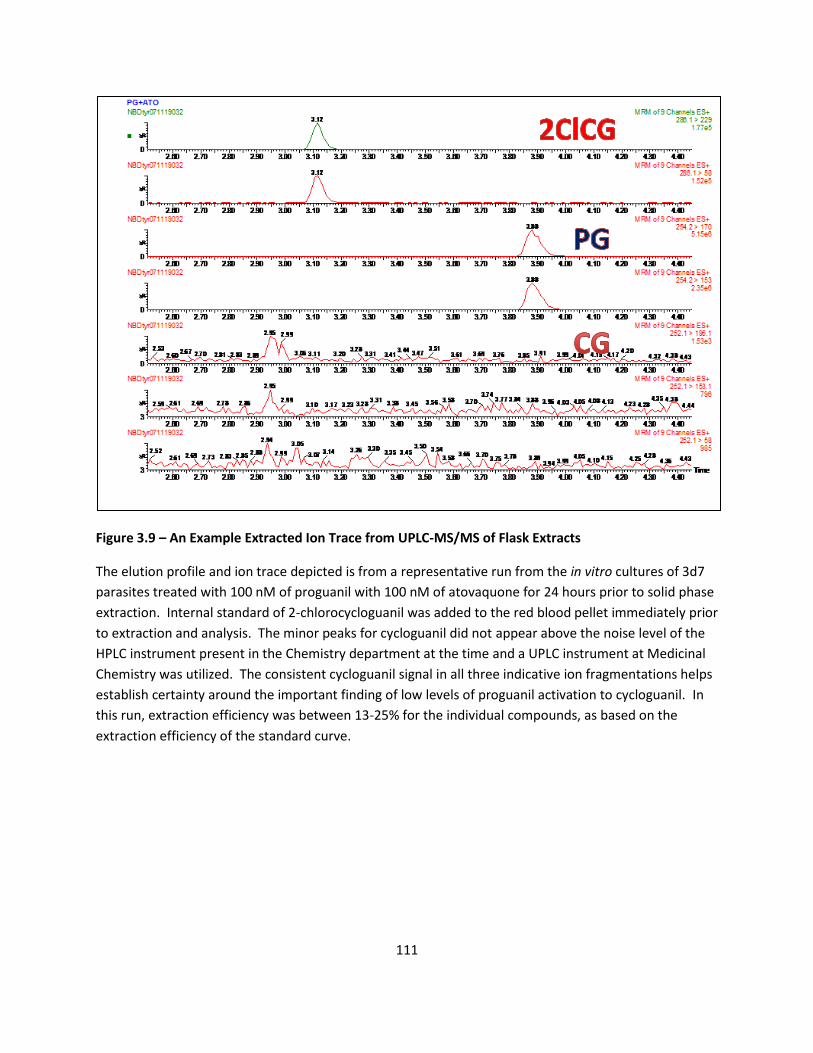
111
Figure 3.9 – An Example Extracted Ion Trace from UPLC-MS/MS of Flask Extracts
The elution profile and ion trace depicted is from a representative run from the in vitro cultures of 3d7
parasites treated with 100 nM of proguanil with 100 nM of atovaquone for 24 hours prior to solid phase
extraction. Internal standard of 2-chlorocycloguanil was added to the red blood pellet immediately prior
to extraction and analysis. The minor peaks for cycloguanil did not appear above the noise level of the
HPLC instrument present in the Chemistry department at the time and a UPLC instrument at Medicinal
Chemistry was utilized. The consistent cycloguanil signal in all three indicative ion fragmentations helps
establish certainty around the important finding of low levels of proguanil activation to cycloguanil. In
this run, extraction efficiency was between 13-25% for the individual compounds, as based on the
extraction efficiency of the standard curve.
PG
2ClCG
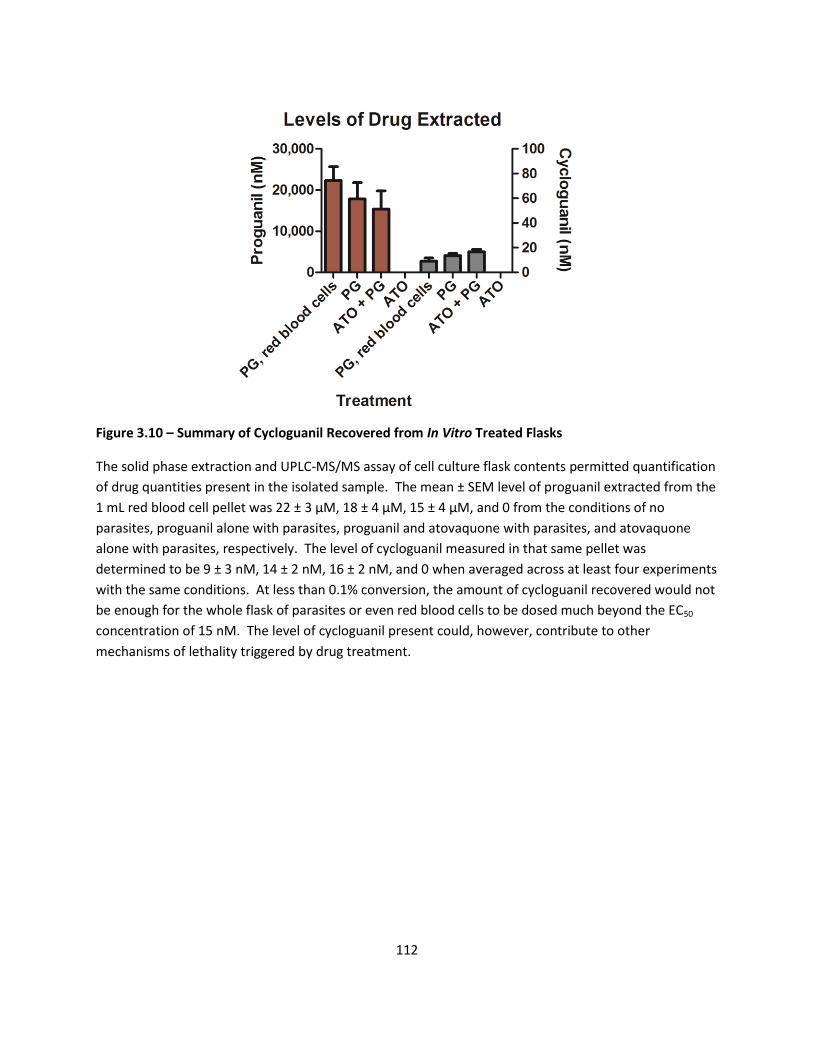
112
Figure 3.10 – Summary of Cycloguanil Recovered from In Vitro Treated Flasks
The solid phase extraction and UPLC-MS/MS assay of cell culture flask contents permitted quantification
of drug quantities present in the isolated sample. The mean ± SEM level of proguanil extracted from the
1 mL red blood cell pellet was 22 ± 3 µM, 18 ± 4 µM, 15 ± 4 µM, and 0 from the conditions of no
parasites, proguanil alone with parasites, proguanil and atovaquone with parasites, and atovaquone
alone with parasites, respectively. The level of cycloguanil measured in that same pellet was
determined to be 9 ± 3 nM, 14 ± 2 nM, 16 ± 2 nM, and 0 when averaged across at least four experiments
with the same conditions. At less than 0.1% conversion, the amount of cycloguanil recovered would not
be enough for the whole flask of parasites or even red blood cells to be dosed much beyond the EC50
concentration of 15 nM. The level of cycloguanil present could, however, contribute to other
mechanisms of lethality triggered by drug treatment.
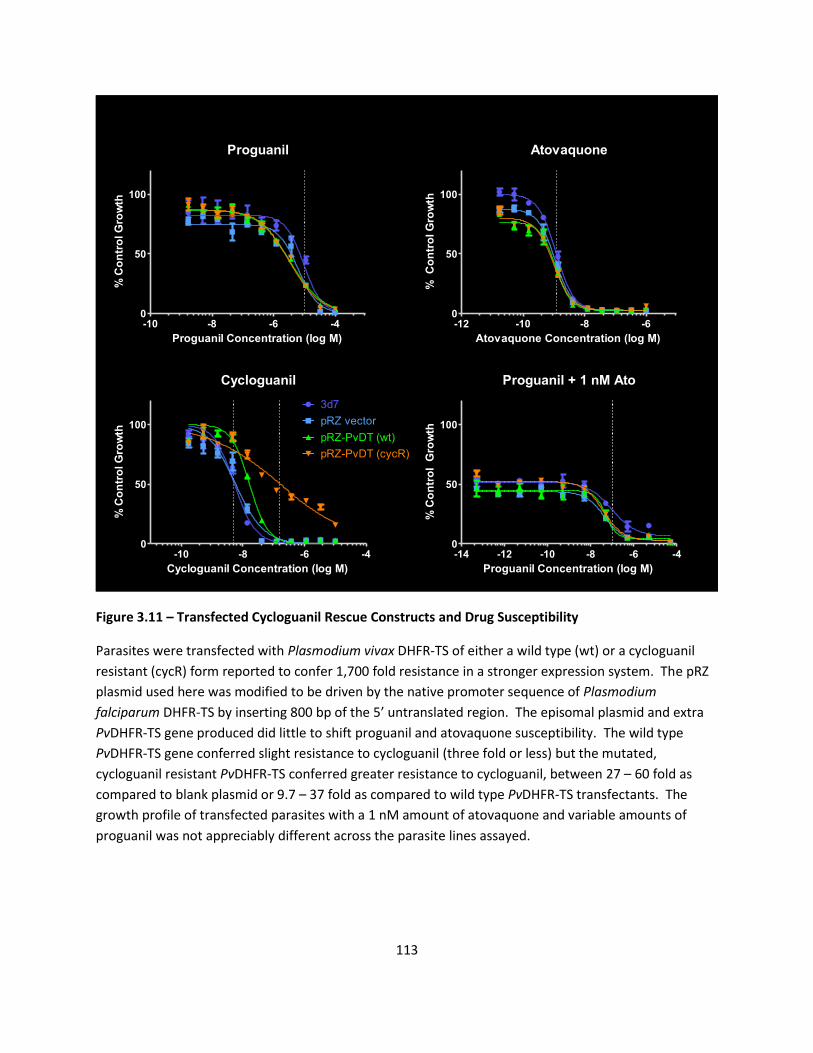
113
Proguanil
-10 -8 -6 -40
50
100
Proguanil Concentration (log M)
% C
on
tro
l G
row
th
Atovaquone
-12 -10 -8 -60
50
100
Atovaquone Concentration (log M)
%
Co
ntr
ol G
row
th
Cycloguanil
-10 -8 -6 -40
50
100
3d7
pRZ vector
pRZ-PvDT (wt)
pRZ-PvDT (cycR)
Cycloguanil Concentration (log M)
% C
on
tro
l G
row
th
Proguanil + 1 nM Ato
-14 -12 -10 -8 -6 -40
50
100
Proguanil Concentration (log M)
% C
on
tro
l G
row
th
Figure 3.11 – Transfected Cycloguanil Rescue Constructs and Drug Susceptibility
Parasites were transfected with Plasmodium vivax DHFR-TS of either a wild type (wt) or a cycloguanil
resistant (cycR) form reported to confer 1,700 fold resistance in a stronger expression system. The pRZ
plasmid used here was modified to be driven by the native promoter sequence of Plasmodium
falciparum DHFR-TS by inserting 800 bp of the 5’ untranslated region. The episomal plasmid and extra
PvDHFR-TS gene produced did little to shift proguanil and atovaquone susceptibility. The wild type
PvDHFR-TS gene conferred slight resistance to cycloguanil (three fold or less) but the mutated,
cycloguanil resistant PvDHFR-TS conferred greater resistance to cycloguanil, between 27 – 60 fold as
compared to blank plasmid or 9.7 – 37 fold as compared to wild type PvDHFR-TS transfectants. The
growth profile of transfected parasites with a 1 nM amount of atovaquone and variable amounts of
proguanil was not appreciably different across the parasite lines assayed.

114
Figure 3.12 – Digitonin Permeabilization Profile of Transfected vivax DHFR-TS Constructs
Transfected parasites were treated with digitonin at differing concentrations to generate supernatants
that were probed via Western Blot. The profile of the released vivax form of DHFR-TS more closely
matches the release of the cytosolic protein, aldolase, than the native falciparum DHFR-TS. The wild
type and the cycloguanil resistant vivax DHFR-TS containing parasites appear in the top and bottom
panels, respectively.
PvDHFR-TS
Pfaldolase
PfDHFR-TS
Digitonin (mM)
7.0
1.4
0.7
0.3
5
0.1
8
0
PvDHFR-TS
Pfaldolase
PfDHFR-TS
Digitonin (mM)
7.0
1.4
0.7
0.3
5
0.1
8
0
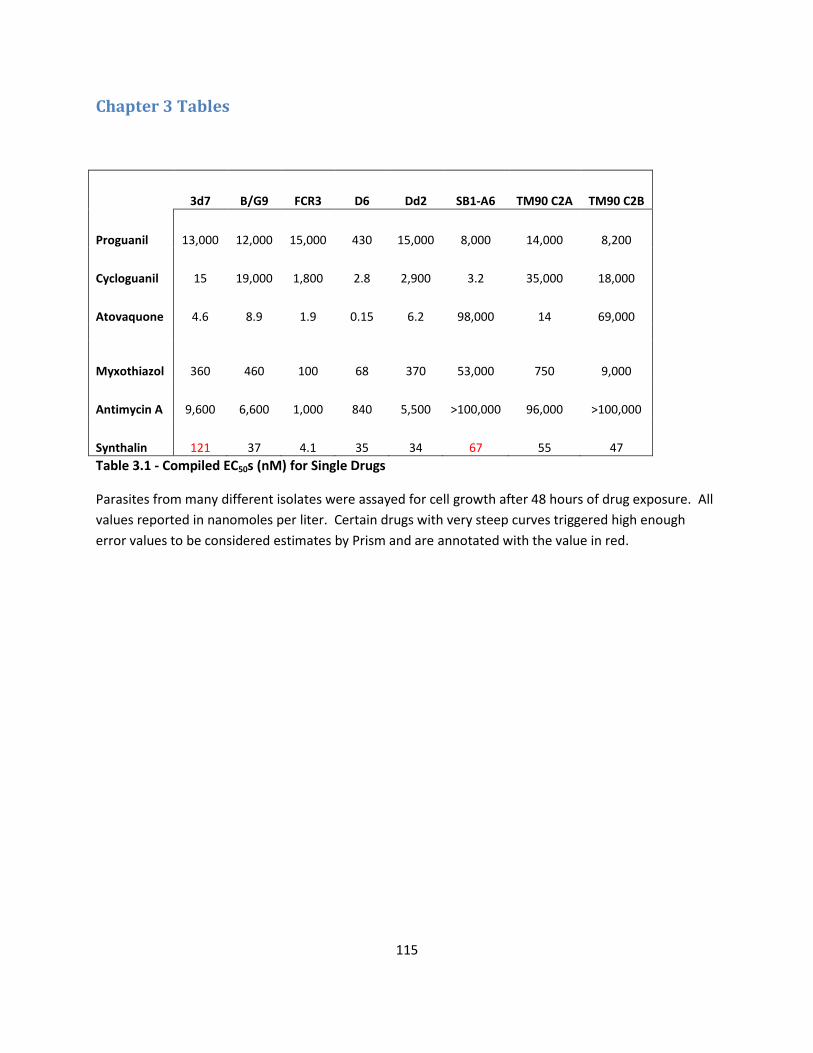
115
Chapter 3 Tables
3d7 B/G9 FCR3 D6 Dd2 SB1-A6 TM90 C2A TM90 C2B
Proguanil 13,000 12,000 15,000 430 15,000 8,000 14,000 8,200
Cycloguanil 15 19,000 1,800 2.8 2,900 3.2 35,000 18,000
Atovaquone 4.6 8.9 1.9 0.15 6.2 98,000 14 69,000
Myxothiazol 360 460 100 68 370 53,000 750 9,000
Antimycin A 9,600 6,600 1,000 840 5,500 >100,000 96,000 >100,000
Synthalin 121 37 4.1 35 34 67 55 47
Table 3.1 - Compiled EC50s (nM) for Single Drugs
Parasites from many different isolates were assayed for cell growth after 48 hours of drug exposure. All
values reported in nanomoles per liter. Certain drugs with very steep curves triggered high enough
error values to be considered estimates by Prism and are annotated with the value in red.

116
A
3d7 B/G9 FCR3 D6 Dd2 SB1-A6 TM90 C2A TM90 C2B
Proguanil 13 12 15 0.43 15 8.0 15 8.2
Proguanil + 0.4 nM Ato
13 34 2.1 0.29 12 6.4 37 29
Proguanil + 1 nM Ato
0.16 16 0.27 0.21 2.5 2.1 21 24
Proguanil + 5 nM Ato
0.13 0.35 0.098 0.36 0.14 0.67 0.19 24
B
3d7 B/G9 FCR3 D6 Dd2 SB1-A6 TM90 C2A
TM90 C2B
PG/(PG+0.4Ato) - - 7 - - - - -
PG/(PG+1Ato) 81 - 56 - 6 - - -
PG/(PG+5Ato) 100 34 153 - 107 12 79 -
Table 3.2 – Compiled EC50s (µM) for Proguanil and Atovaquone Mixtures and Synergy Shift Ratios
(bold)
In table (A) parasites from many different isolates were assayed for cell growth after 48 hours of
exposure to a mixture of variable amounts of proguanil with a fixed concentration of atovaquone. All
values reported in micromoles per liter. Table (B) provides a summary of the Synergy Shift Ratio
observed for each parasite strain, as calculated by the half-maximal growth inhibition of proguanil alone
divided by the half-maximal growth inhibition of proguanil with atovaquone at a fixed concentration. All
Synergy Shift Ratios where the determined EC50 concentrations differed by fourfold or less were omitted
in order to highlight only the larger, synergistic variations.
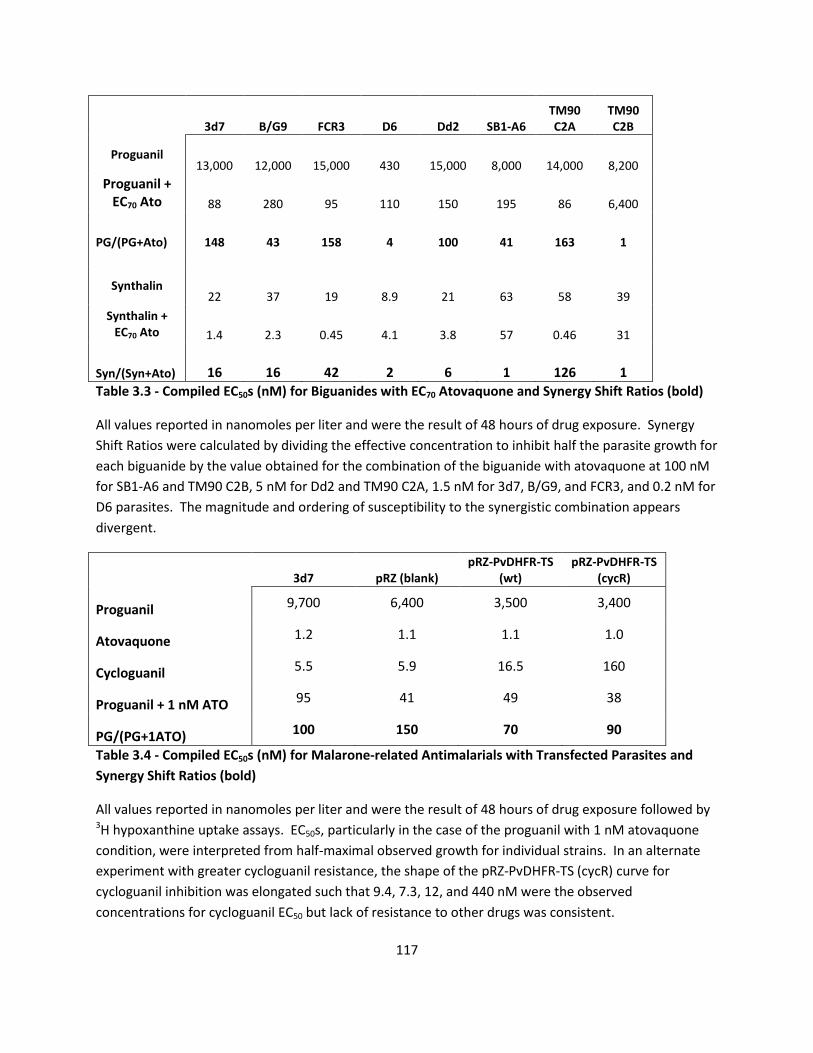
117
3d7 B/G9 FCR3 D6 Dd2 SB1-A6 TM90 C2A
TM90 C2B
Proguanil 13,000 12,000 15,000 430 15,000 8,000 14,000 8,200
Proguanil + EC70 Ato 88 280 95 110 150 195 86 6,400
PG/(PG+Ato) 148 43 158 4 100 41 163 1
Synthalin 22 37 19 8.9 21 63 58 39
Synthalin + EC70 Ato 1.4 2.3 0.45 4.1 3.8 57 0.46 31
Syn/(Syn+Ato) 16 16 42 2 6 1 126 1
Table 3.3 - Compiled EC50s (nM) for Biguanides with EC70 Atovaquone and Synergy Shift Ratios (bold)
All values reported in nanomoles per liter and were the result of 48 hours of drug exposure. Synergy
Shift Ratios were calculated by dividing the effective concentration to inhibit half the parasite growth for
each biguanide by the value obtained for the combination of the biguanide with atovaquone at 100 nM
for SB1-A6 and TM90 C2B, 5 nM for Dd2 and TM90 C2A, 1.5 nM for 3d7, B/G9, and FCR3, and 0.2 nM for
D6 parasites. The magnitude and ordering of susceptibility to the synergistic combination appears
divergent.
3d7 pRZ (blank) pRZ-PvDHFR-TS
(wt) pRZ-PvDHFR-TS
(cycR)
Proguanil 9,700 6,400 3,500 3,400
Atovaquone 1.2 1.1 1.1 1.0
Cycloguanil 5.5 5.9 16.5 160
Proguanil + 1 nM ATO 95 41 49 38
PG/(PG+1ATO) 100 150 70 90
Table 3.4 - Compiled EC50s (nM) for Malarone-related Antimalarials with Transfected Parasites and
Synergy Shift Ratios (bold)
All values reported in nanomoles per liter and were the result of 48 hours of drug exposure followed by 3H hypoxanthine uptake assays. EC50s, particularly in the case of the proguanil with 1 nM atovaquone
condition, were interpreted from half-maximal observed growth for individual strains. In an alternate
experiment with greater cycloguanil resistance, the shape of the pRZ-PvDHFR-TS (cycR) curve for
cycloguanil inhibition was elongated such that 9.4, 7.3, 12, and 440 nM were the observed
concentrations for cycloguanil EC50 but lack of resistance to other drugs was consistent.
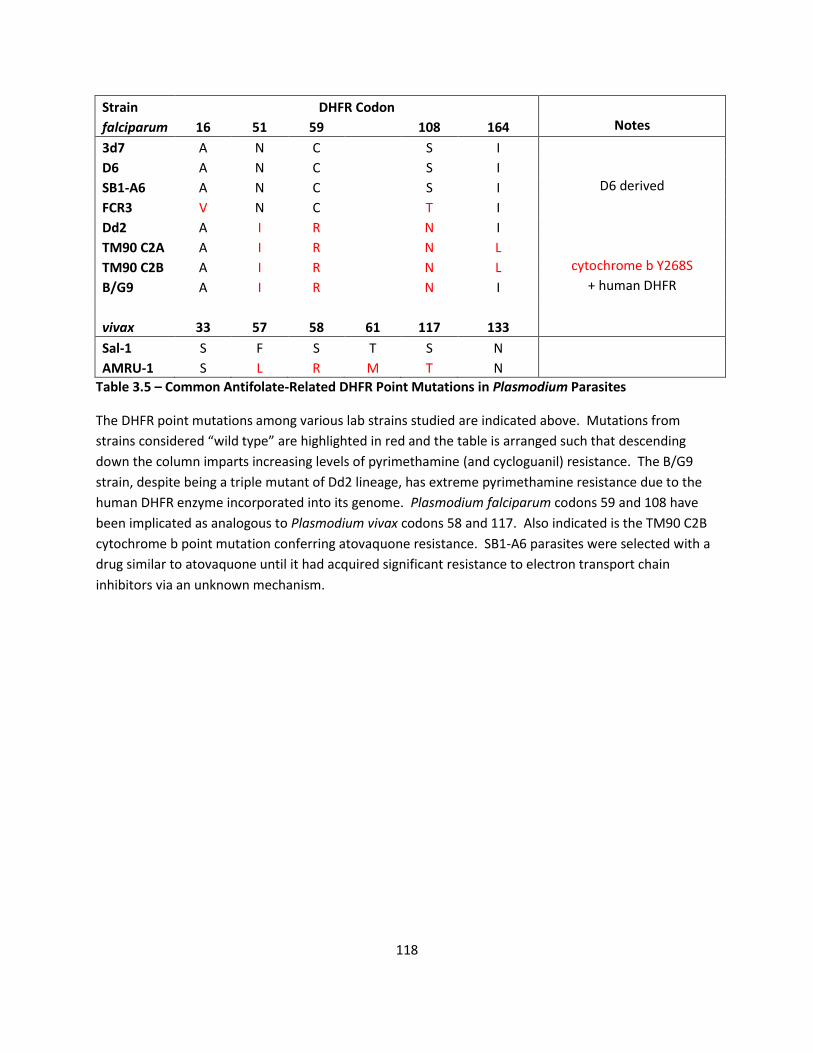
118
Strain DHFR Codon
falciparum 16 51 59
108 164 Notes
3d7 A N C
S I
D6 A N C
S I
SB1-A6 A N C
S I D6 derived
FCR3 V N C
T I
Dd2 A I R
N I
TM90 C2A A I R
N L
TM90 C2B A I R
N L cytochrome b Y268S
B/G9 A I R
N I + human DHFR
vivax 33 57 58 61 117 133
Sal-1 S F S T S N
AMRU-1 S L R M T N
Table 3.5 – Common Antifolate-Related DHFR Point Mutations in Plasmodium Parasites
The DHFR point mutations among various lab strains studied are indicated above. Mutations from
strains considered “wild type” are highlighted in red and the table is arranged such that descending
down the column imparts increasing levels of pyrimethamine (and cycloguanil) resistance. The B/G9
strain, despite being a triple mutant of Dd2 lineage, has extreme pyrimethamine resistance due to the
human DHFR enzyme incorporated into its genome. Plasmodium falciparum codons 59 and 108 have
been implicated as analogous to Plasmodium vivax codons 58 and 117. Also indicated is the TM90 C2B
cytochrome b point mutation conferring atovaquone resistance. SB1-A6 parasites were selected with a
drug similar to atovaquone until it had acquired significant resistance to electron transport chain
inhibitors via an unknown mechanism.

119
Chapter 4 - Significance and Future Prospects
Significance
Antimalarial drugs have been targeting the folate cycle and DHFR since the
1940s. DHFR has been an antimalarial drug target for so long that large swaths of
continents have populations of malaria parasites with established resistance to drugs
that inhibit DHFR. A PubMed search for “malaria DHFR” results in hundreds papers but
“malaria DHFR localization” yields no indication that the enzyme’s localization has ever
been demonstrated experimentally. Some of the same features that made DHFR a great
drug target (low levels of enzyme and the polypeptide’s essentiality in performing two
catalytic steps in the folate cycle) also make it incredibly difficult to perform significant
biological assays with the native malaria protein. Due to several ongoing investigations
related to mitochondrial proteins and connections to DHFR inhibition, we decided to
apply science’s new generation of to determine the localization of native malarial DHFR-
TS. We sought to avoid changing the native protein with epitope tags, avoid
overexpression, and perform manipulations with a toolset limited by how commonly
DHFR-based selection is employed.
Antibodies were generated from a panel of antigenic DHFR-TS peptides. The
antibodies advanced through via multiple booster immunizations proved to be highly
specific, beyond what our lab has been able to obtain using recombinant proteins [40,
183]. Malaria parasites were fixed, probed with the DHFR-TS and Alexa Fluor tagged
antibodies, and a confocal laser scanning microscope utilized to generate a three

120
dimensional image of the malaria parasite. The malaria parasite is so small that the
diffraction limits of light microscopy actually result in parasite images that are, at
optimal settings, less than 100 voxels across and only about 5 voxels thick. Early studies
demonstrated DHFR-TS antibodies bound and showed an odd patterning that involved
more features than would be expected for a cytosolic protein, but the signal was still
faint.
Advanced image analysis methods were employed to evaluate localization of the
faint DHFR-TS signal with an unbiased eye. A panel of parasite organelles was evaluated
to confirm that the DHFR-TS pattern aligned with that of the mitochondria. Beyond
Mitotracker dye, we also employed an established HProtein-GFP fusion protein and the
canonically mitochondrial membrane associated DHODH enzyme as additional markers
for the mitochondria to compare with DHFR-TS. Digitonin-based selective membrane
permeabilization and recovery of organellar contents served to generate additional
confidence in our finding of a mitochondrial localization for Plasmodium falciparum
DHFR-TS enzyme.
Preliminary drug susceptibility profiling of different parasite strains was
responsible for leading us to develop a theory whereby cycloguanil was playing a key
role in the synergistic action that makes Malarone® a successful drug. When viewed
with a limited set of parasite isolates (3d7, D6, FCR3, SB1-A6, and TM90 C2B) the
pattern of susceptibility to combinations of proguanil with atovaquone follows a similar
susceptibility to that observed for cycloguanil. The drug susceptibility pattern also
121
resembles the order that would be predicted by known DHFR point mutations in the
parasite strains. When additional parasite lines were brought into the comparison and
the drug interactions more thoroughly calculated, the picture became murkier. Some
parasite strains were not observed to display any synergy between proguanil and
atovaquone; a feature reported of TM90 C2B bearing cytochrome b point mutation
Y268S. However, D6 parasites also did not display synergy.
Folate uptake mechanisms, which vary in their preservation by different parasite
isolates, are known to influence in vitro assessment of antifolate drugs. The published
information regarding parasite uptake of exogenous folates is limited, but could impact
susceptibility to a DHFR inhibitor like cycloguanil [184-186]. Both Dd2 and 3d7 parasites
are implicated in their ability to utilize exogenous folates, but between incomplete
literature on the topic and the curious change to non-synergy from TM90 C2A to TM90
C2B via cytochrome b mutation, chasing down folate uptake effects would have been a
significant deviation. A full profiling of the folate salvage abilities of all eight parasite
strains might elucidate if it influences the proguanil and atovaquone synergy.
In attempts to clarify the role of cycloguanil in parasites treated with proguanil
and atovaquone, two investigations were launched to directly address cycloguanil. One
inquiry involved using solid phase extraction of the organic components of flasks treated
with Malarone® and component drugs to assess if any proguanil was being converted
into cycloguanil, despite lack of a hepatic system. This would address some of the
controversy surrounding proposed mechanisms of synergy. Another project was to

122
engineer parasites that had been directly modified to impart cycloguanil resistance. We
created a rescue plasmid to impart cycloguanil resistance using a related vivax DHFR-TS
and examined Malarone® susceptibility. Significant efforts were made to avoid over-
expression and not disrupt any potential leading localization sequences by keeping a
native Plasmodium falciparum DHFR-TS promoter, not adding additional GFP-type
protein tags, and keeping the gene in the native Plasmodium vivax codons.
The direct quantification of cycloguanil extracted from flasks of parasites was
successful in that trace amounts of cycloguanil were measured from flasks treated with
proguanil. However, with 100 nM of proguanil applied to the flask’s contents, the 0.07%
converted to cycloguanil would be ineffective against DHFR unless some mechanism for
sequestration was occurring in the parasite. Solid phase extraction efficiencies from the
bulk culture remained sub-optimal at under 30%. Optimization of the extraction and
quantification method was not pursued further as results of rescue plasmid experiments
and more promising findings related to DHFR localization developed. However, the
tools developed could be further improved and put to use to actively pursue which
components (media, time, heat) are necessary or influential in converting proguanil to
cycloguanil in vitro and possibly developed into a pulse-chase profile of what happens
with this conversion before and after exposure to another drug.
Cycloguanil rescue constructs were created and validated as conferring modest
cycloguanil resistance (significantly less than was reported in a different transfection
system that used an antifolate-based selection for plasmid maintenance). The
123
observed cycloguanil resistance with the appropriate plasmid was not observed in the
same parasites treated with a synergistic combination of Malarone®. Further
investigation of the localization of the added PvDHFR-TS enzyme using digitonin-based
membrane permeabilization revealed that our construct may not have been a fully
functional replacement. The bulk of the PvDHFR-TS enzyme was isolated from the
cytosolic fractions and may not have been able to replicate any DHFR-TS function
requiring localization to the mitochondria.
Malarial DHFR has been studied for decades and even well-funded organizations
and drug companies have yet to explain the synergy of Malarone® in vitro. It was a
difficult undertaking for our academic lab with our resources to explain how this drug
combination works, but combining drug target elucidation with complex biological
processes like localization would not be expected to be easy.
Future Prospects
In this thesis we uncovered interesting, biologically relevant localization
surrounding the well-established antimalarial drug target DHFR. We have pushed the
boundaries of what can be observed in fluorescence, laser scanning confocal microscopy
with a very low abundance enzyme. The brightest, most biologically compatible
fluorophores were employed for these studies and we still needed to push further to
determine localization. We integrated advanced image analysis techniques in order to
establish the mitochondrial localization of Plasmodium falciparum dihydrofolate
124
reductase-thymidylate synthase enzyme and validated the algorithm with additional
mitochondrial dyes and the membrane-bound mitochondrial protein dihydroorotate
dehydrogenase.
Explorations into malaria parasite drug action, particularly those that may
involve DHFR, are challenged by the limited genetic tools available. The majority of
transfection systems for malaria utilize either human DHFR or drug resistant
apicomplexa DHFR enzyme, leaving Blasticidin one of the only other avenues for
selection. Commonly employed protein fusion epitopes such as GFP were avoided over
concerns of unnatural localization possibilities. As with many other organelles, few
experimentally established controls are available for mitochondrial localization with
malaria. With the data from the native enzyme indicating a mitochondrial localization,
one could create a fused DHFR-GFP construct in order to generate follow-up images that
may also show mitochondrial signals. The biological relevance might be reduced, but
the images from such a construct might be easier for the larger community to
acknowledge.
Another method to support mitochondrial localization could be to isolate
parasite mitochondria with nitrogen bomb cavitation and gradient centrifugation.
Rupture of parasites via gas bubbles has potential to be rather harsh and destructive,
but it may be used to attempt to detect high levels of DHFR protein in the mitochondrial
fractions vs cytosol. Another method would have DHFR-TS protein crosslinked via
formaldehyde or another chemical means and tryptic digests and MS analysis used to
125
evaluate if the DHFR-TS fragments were in sufficient proximity to other mitochondrial
proteins to detect an increased crosslinking to mitochondrial proteins compared to
crosslinking to non-mitochondrial/cytosolic protein.
A more ambitious effort would be to create new, fluorescently labelled DHFR
inhibitors that are biologically compatible and bind covalently. While methotrexate is
usually taken into parasites (and additional glutamic acid moieties attached) our
experience was the raw enzyme inhibition was retained but bioavailability disrupted
after coupling Alexa Fluor 488 or fluorescein to the glutamic acid moiety of
methotrexate. A better tolerated fluorescent label or fluorescent molecule
incorporated directly into a binding moiety could result in a more bio-compatible
fluorescent tag for DHFR’s active site. However, folic acid is a substrate for several
enzymes and even minor changes to the molecule would create a need to establish the
new fluorescent label’s specificity prior to use as a label of DHFR.
Efforts to investigate the synergy behind Malarone® proved to be more
confounding than initially expected. While a cursory examination of synergy between
proguanil and atovaquone followed the trends of cycloguanil resistance, some noted
exceptions and the inconsistent patterns with another reportedly synergistic biguanide,
synthalin, and atovaquone cast some doubt on a cycloguanil-based mechanism. Our
panel of different parasites suggests that the process of drug selection performed on D6
parasites that created the SB1-A6 strain may have also restored proguanil sensitivity and
possibly a synergistic response to proguanil and atovaquone. It is hoped that further

126
profiling by the lab that created the parasite lines (which has more direct access to the
source strain) will eventually elucidate what changes resulted in the SB1-A6 strain
obtaining its unique resistance to electron transport chain inhibition while also shifting
proguanil sensitivity and restoring Malarone® synergy.
An important feature of antifolates related to parasite drug susceptibility is the
ability of different parasite lines to salvage folates from media. A more thorough
understanding of which parasite lines retain the ability to uptake folates from media and
the rate could provide insight into which parasites were experiencing DHFR-related
effects. Similarly, while we’ve observed the result of DHFR-TS localization to the
mitochondria organelle, the determining sequences and pathway DHFR-TS traverses to
enter the mitochondria has not been investigated.
Flasks of media and red blood cells, after the addition of proguanil, yielded
minute amounts of cycloguanil that could be detected by UPLC and Triple Quadrupole
Mass Spectrometry. We employed three indicative ion fragmentations to remove
ambiguity in cycloguanil identitification. Which components of the media and factors
that result in the activation of proguanil to cycloguanil was not well investigated due to
more promising localization observations. One method to add more confidence to this
conversion (and perhaps create a tool for pulse-chase studies) would be to create an
isotopically labelled proguanil that would yield a similarly labelled cycloguanil. The most
direct routes for the synthesis of proguanil with commercially available isotopes that
would be significantly shifted involved U-13C p-chloroaniline.

127
The localization of the cycloguanil resistant PvDHFR-TS protein produced by the
rescue plasmid was subjected to digitonin permeabilization only recently. Efforts made
to preserve all possibility of localizing similar to native enzyme appear to have been
insufficient. Genetic manipulation of parasites can be a long process but it would be
instructive to determine the drug potencies of parasites containing a more targeted
version of the rescue construct. A known mitochondrial targeting/leader sequence, like
that found in DHODH, could more assuredly drive localization to the mitochondria. With
enough cycloguanil resistant DHFR-TS driven into the mitochondria ahead of any
electron transport chain inhibition, perhaps a greater resistance to cycloguanil would be
observed as well as a possible shift in the susceptibility to proguanil and atovaquone.
128
Appendix 1: Auxiliary Experiments
Introduction
Over the course of this project, many experiments were performed that were
indicative, but don’t exactly fit into the story of this thesis. One idea was to use
commercially produced, fluorescently labelled methotrexate as a marker for DHFR
enzyme by binding to the active site. While fluorescently labelled methotrexates were
able to bind and inhibit the recombinant enzyme, the label seemed to interfere with
target accessibility in raw parasites. Another series of experiments attempted to profile
the parasite’s response to drug treatment and how that influences localization. The
difficulty is, however, that the signal from DHFR is already fairly weak and the influence
of lethal amounts of drugs would be anticipated to kill the parasite.
Experimental Procedures
Materials
DHFR Active Site Label – Methotrexate
The common use of DHFR enzyme as a resistance selection marker in many
assays has resulted in commercially available fluorescently tagged methotrexate (MTX).
Methotrexate is a known, tight inhibitor of the malarial DHFR-TS enzyme [187].
Invitrogen/Life Technologies was our source for methotrexate conjugated to Alexa Fluor
488 (M23271) and methotrexate conjugated to fluorescein (M1198MP). When used as

129
an enzyme active-site label, the fluorescent folate analog would be a uniquely specific
way to examine localization.
Methods
DHFR-TS Activity Assay Using 96-Well Plate Reader
The DHFR activity assay was modified from a cuvette based assay to be
performed in a 250 µL reaction volume in a 96 well micro plate with up to 48 samples
run at a time and data collected for 10 minutes. The concentrations of substrate were
not modified, at 100 µM each DHF and NADPH, but the amount of enzyme was reduced
to permit longer data sampling and minimize data lost during plate preparation. The
working buffer (Buffer A) was created from 20 mM K2PO4 pH 7.0, 0.1 mM EDTA, 10%
glycerol, and 10 mM DTT (added fresh before use as its breakdown seems to absorb at
340 nM). To minimize pipetting operations, three separate solutions were combined in
the assay plate immediately before running. The solution containing the inhibitor was
prepared first using serial dilutions in a 400 µL/well 96 well plate and contributed 35 µL
to the final reaction volume. The other solutions were a 139 µM DHF solution in Buffer
A that was able to be kept at room temperature and contributed 180 µL to the total
reaction. The final solution, 714 µM NADPH and DHFR enzyme in Buffer A, was kept on
ice and additional DHFR titrated in as necessary. The reaction was arrayed such that no
outside wells of the 96 well plate were used for inhibitor (they have the greatest
temperature fluctuation and were only used for no-inhibitor positive controls) and 5
replicate wells for each concentration were read at a time, up to half the plate being
130
setup and run during the same one to two minutes of pipetting into the assay plate. UV-
permissive PMA polymer 96 well plates were used for the assay. To establish the
correct amount of DHFR for an activity measurement at 340 nM of -0.02 to -0.025
Abs/min, DHFR enzyme was added in aliquots to the DHFR+NADPH solution and un-
inhibited test reactions of 35 µL Buffer A, 180 µL DHF solution, and 35 µL of NADPH +
enzyme solution were performed. After several additions, the appropriate activity
would generally yield a linear change in absorbance for the 8-10 minute run and,
depending on sample conditions, would remain acceptable for about 40 minutes before
additional DHFR enzyme would need to be added and the rate of reaction verified.
For assay plates, inhibitor (in Buffer A and whatever DMSO was necessary) was
arrayed from the inhibitor stock plate into the assay plates. For the other solution
components basins were used to help speed up use of an 8 well pipette. DHF solution
was dispensed from a basin that was at room temperature and a basin set in ice was
used as the receptacle for the chilled NADPH + enzyme solution. 180 µL of the DHF
solution was added to the wells of the plate which was rapidly followed by 35 µL of the
NADPH + enzyme solution. The assay plate was then loaded into the plate reader, a 10
second high intensity mix step was programed to run, and then the plate was read for
absorbance at 340 nm every 30 seconds for 10 minutes to yield the linear activity
measurement. Pyrimethamine was often included as a negative control for its ability to
inhibit enzyme activity. For most IC50s, both halves of a plate were devoted to each
compound such that 12 concentrations were used to construct the IC50 curve.
131
Results
Active Site Marker (Fluorescently Labelled Methotrexate) Not Cell Permeable
We desired to leverage the DHFR active site binding ability of methotrexate by
using fluorescently tagged methotrexates as a probe for DHFR in microscopy studies.
However, adding the fluorescent label to the MTX molecule has the potential to reduce
the binding ability of methotrexate.
The ability of the fluorescently labeled methotrexates to inhibit the PfDHFR-TS
enzyme was examined using split, recombinant DHFR + TS enzyme [183]. In the NADPH
consumption assay the DHFR (+ TS) enzyme, NADPH, and dihydrofolic acid were
combined with various concentrations of methotrexate, methotrexate conjugated to
Alexa Fluor 488, or methotrexate conjugated to fluorescein. The reaction progress was
monitored as a function of time on a UV-Vis absorbance plate reader measuring at 340
nm. Methotrexate and the fluorescently labeled versions all produced similar low
nanomolar IC50 inhibition levels, at 1.5 to 3.8 nM (Figure A1.1 A). The experiment
demonstrates that the covalently bound fluorescent label does not significantly disrupt
the ability of the methotrexate molecule to inhibit the DHFR enzymatic reaction.
In contrast, parasites assayed for the EC50 in the presence of methotrexate and
fluorescently labeled methotrexates for 48 hours showed that while methotrexate is
132
lethal to the parasite with an EC50 of 11 nM the fluorescent label conjugation results in
an approximately 200-fold elevated EC50 of ~2,200 nM (Figure A1.1 B).
Malarone® Drug Exposure – A Slow Change?
Eventually, we desired to see if the localization of DHFR-TS was disrupted by
Malarone® treatment. A perfect experiment was made more difficult by our inability to
rescue from proguanil and atovaquone with PvDHFR-TS, so we took a straight-forward
approach to see what was observable. Asynchronous cultures of integrated HProtein-
GFP expressing Dd2 parasites from the Prigge lab were exposed to 100 nM of both
proguanil and atovaquone or 100 nM of chloroquine 12, 3, and 0 hours prior to workup.
Previous experiments with live cell imaging utilizing just Mitotracker and the native GFP
fluorescence had indicated significant loss of fluorescence by 24 hours. The treated
samples were processed, the nucleus marked with DAPI, and images captured on the
confocal microscope.
The colocalization values for drug-treated parasites that were imaged were
extremely variable. Additionally, analysis was confounded by the signal for the
mitochondrial HProtein-GFP fading in a significant population of parasites by 12 hours.
While the parasites were able to be imaged, in this set of experiments it was difficult to
see if the proguanil and atovaquone signal was changing at a rate faster than
chloroquine, a fast-acting drug with a different target from that suspected for
Malarone®.

133
Discussion
Fluorescently Labelled Methotrexates
Commercially available fluorescently labelled methotrexates were also
investigated for use in labelling fixed cells at the DHFR active site and for any localization
after irreversibly binding to the enzyme. The presence of the fluorophore attached to
the glutamic acid moiety was not appreciably disruptive to DHFR enzymatic activity as
measured on the native enzyme (Figure A1.1 A). However, the fluorophore interfered
with the ability to kill whole cells and resulted in a 200 fold reduction in potency (Figure
A1.1 B), presumably due to reduced uptake or triggered deactivation mechanisms. The
inability to use bioaccumulation processes to help drive DHFR labelling by fluorescent
methotrexates limited their use to methods that could bypass parasite membranes and
permeability issues.
The fluorescently labelled methotrexates were attempted to be used as probes
for confocal microscopy, being applied in methods analogous to an antibody, but the
minor amount of fluorescent signal obtained could not be discriminated from that of
background fluorescence of the fixed samples. It is possible the DHFR active site is
simply unable to bind an inhibitor after being fixed, proteins cross-linked, and cell
membranes washed away by detergents as a part of the sample preparation process.
134
Malarone® Drug Exposure
Examination of localization of proteins as a parasite is also being given a lethal
amount of drug is not a process that is easy to tease a cause and effect relationship out
of. We’d hoped that a rescue construct that would replace DHFR’s function would assist
our studies, but ultimately that rescue construct was ineffective against the proguanil
and atovaquone combination. Despite not having a way to control for protein turnover
that would allow us to distinguish the fade of old proteins from the generation of new
ones and our mitochondrial marker being influenced by the same protein turnover, we
performed a limited number of experiments examining the effect of proguanil and
atovaquone treatment on localization of DHFR in HProtein containing parasites. The
results were inconclusive, with rather large error bars and processing issues related to
attempting repeatable thresholding of images as the signals faded.
With a more clever design involving the ability to control when the proteins are
actively transcribed and possibly the introduction of a modified amino acid that could be
detected by antibody might make this a type of examination more complete. If our
rescue construct worked, it would have been interesting to see if the native DHFR-TS
localization was disrupted by drug treatment. Unfortunately, the long and difficult
process of genetic manipulation in malaria parasites did not permit free
experimentation with such designs.

135
Appendix 1 Figures
Figure A1.1 – Fluorescently Labelled Methotrexate Not Able to Penetrate Cells
Following several experiments where fluorescently-tagged methotrexates were unsuccessfully attempted to be used as markers for DHFR-TS enzyme, a more thorough failure analysis was performed. In experiment A) DHFR-TS enzyme activity was assayed in the presence of methotrexate and the fluorescently labelled analogs and the observed inhibition was between 1.3 and 3.8 nM. B) When whole parasites were treated for 48 hours with the methotrexates, the fluorescent labels result in a 200-fold loss in potency in whole cells (shifting from 11 nM to 2,200 – 2,400 nM), suggesting uptake and drug permeability may be preventing standard methotrexate potency.
A
B

136
Figure A1.2 – Limited Observations of Drug-Treated Parasites Uncertain
HProtein-GFP containing Dd2 parasites were treated with 100 nM proguanil and atovaquone or
100 nM chloroquine for 3 or 12 hours prior to slide preparation. Overall, colocalization values
did not appear to drastically change. Confounding the analysis, the mitochondrial HProtein-GFP
signal was reduced by 12 hours, an unknown rate of protein turnover makes it difficult to judge
which are new localization events vs the loss of old, and a protocol where images are
thresholded individually makes for a shifting baseline and may lose data about the quantities of
enzyme present.
137
Appendix 2: General Experimental Procedures
Materials
Digitonin Permeabilization Reagents
Digitonin was procured from Sigma Aldrich (D141) and prepared as either a 40 or
50 mg/mL stock in DMSO. Parasite wash buffer was prepared from PBS with 3% w/v
sucrose and a tablet of cOmplete, EDTA-free protease inhibitor cocktail (Roche).
Antibodies used were rabbit polyclonal anti-Pf aldolase HRP conjugated (abcam
ab38905, 1 mg/mL), mouse monoclonal anti-GFP (clone B2) (Santa Cruz sc9995, 0.2
mg/mL), rabbit polyclonal anti-Pf DHFR-TS (GenScript custom, 0.6 mg/mL), rabbit
polyclonal anti-PvDHFR-TS (GenScript custom, 0.6 mg/mL), HRP conjugated goat anti-
mouse (Santa Cruz sc2301, 0.4 mg/mL), and HRP conjugated goat anti-rabbit (Santa Curz
sc2302, 0.4 mg/mL).
Western Blot Reagents
Lysis buffer for malaria parasite samples was composed of 50 mM Tris pH 8.0, 5
mM EDTA, and 0.5 % Triton X 100 in water. Additionally, Bio-Rad Laemmli 2x Sample
Buffer was used for loading the samples. For wet transfers performed overnight, a 500
mL volume of 10x Bio-Rad wet transfer solution was made from 15 g Tris Base, 72 g of
glycine, and 2.5 g of SDS and made up as a 1x solution with 10% methanol for immersive
transfers. TBST solutions were made with 0.1% Tween from 1L of a 10x stock comprised
of 88 g NaCl, 24 g TrisCl, 5.6 g Tris base, and 10 mL of Tween 20 all adjusted to pH 7.6
after preparation of the stock as well as after preparation of each 1x working solution.

138
General Methods
Continuous Growth of Blood-Stage Parasites
Plasmodium falciparum blood-stage parasites and transfectants were cultured
with human erythrocytes at 2% hematocrit in RPMI-1640 media (Life Technologies
#22400-89 +Glu +25 mM HEPES) supplemented with 20% human serum using a protocol
previously described [188]. Cultures were maintained in sterile conditions in a biosafety
level 2 hood. All instruments and equipment were purchased sterile, sterilized by 70%
ethanol spray, or filtered using bottle-top 20 micron filters. All culture waste was either
mixed with bleach to 10% v/v to sterilize or collected in autoclave bags and autoclaved
according to University of Washington regulations prior to disposal.
Continuous parasite culture required fresh blood, media, and, for transfected
lines, new selective agents at regular intervals. Flasks and plates of parasite cultures
were grown under 90% N2, 5% CO2, and 5% O2 atmosphere with media changes and
infected culture dilutions occurring every ~48 hours to keep parasitemia below 5%. Use
of cultures desired to be at high parasitemia was typically assisted by changing the
media every 24 hours for a full life cycle in order to maximize nutrients available to the
parasites. Red blood cells were prepared via a two stage wash/centrifugation in RPMI
and the white buffy coat of white blood cells was removed after each centrifugation
step to ensure only red blood cells were being introduced. Such prepared red blood
cells were viable for up to a month without significant growth abnormalities in the
139
parasites infecting the red blood cells. A knobbed appearance to the membrane could
be noticed when red blood cells were of sufficient age to inhibit parasite replication
appreciably.
Western Blotting
Sample Preparation
Parasite pellets were prepared using traditional Saponin lysis treatment and then
resuspended in parasite lysis buffer (typically around 0.1 mL for each T25 flask). The
parasites mostly dissolved in the lysis buffer with mechanical agitation using a pipet tip
or they benefitted from a -80 °C freeze-thaw step. The appropriate amount of lysate
was diluted with 2x Laemmli buffer and boiled for 5 minutes, cooled to room
temperature, and then spun at 10,000 x g for 2 minutes to prevent introduction of
insoluble components.
Electrophoresis and Transfer
The SDS-PAGE gels were run according to standard methods, released from the
cassette, fringes from the top of the comb removed, washed individually in trays of
about 50 mL of water, and then soaked in Bio-Rad wet transfer solution for at least 10
minutes on a rocking platform. The Mini Protean immersive transfer tank was then
setup with a stir bar at the bottom, most of the liquid added, and a pre-chilled cold pack
and a station with a stir plate and power supply prepared in the cold room. The gel was
loaded into the plastic transfer cassette with care that the black half was negative and
140
proteins would be directed to the positive/red/clear side of our apparatus. Assembly of
the transfer sandwich was done in an oversized tray that was filled with wet transfer
buffer. Another tray was used to expose PVDF membrane to methanol for a few
minutes before assembly. The plastic cassette was put into the transfer buffer tray
followed by the two reusable sponges in order to hydrate and remove air bubbles. The
top sponge was lifted away and a layer of filter paper was placed on top of the lower
sponge, followed by the gel, followed by the methanol treated PVDF membrane,
followed by another layer of filter paper, followed by the second reusable sponge while
avoiding any air bubbles or mis-aligned pieces. The cassettes were loaded into the wet
transfer apparatus and the tank topped off to avoid any components not being
immersed and drying out. Transfer was performed for approximately 14 hours using the
overnight method at 30 volts and 80 milliamps if only one transfer box was used, 120
milliamps if two. After the overnight transfer, the cassettes were opened and the PVDF
membrane transferred to a tray containing transfer buffer and the edges of the
membrane were trimmed with scissors to reduce the size of the membrane down to
more appropriately match the size of the gel (prestained ladders in the outer lanes
made this straightforward). The top corner corresponding to lane 1 of the gel was
“nicked” to help provide a consistent orientation to the blots.
Antibody Probing
The blots were generally blocked with 5% BioRad blocking buffer (non-fat milk of
fine grind) in TBST at room temperature for a minimum of two hours. After blocking,
141
the primary antibody (1:5,000 dilution as a starting point) was applied in a solution of
4% milk in TBST. Best performance was typically achieved by overnight exposure to the
primary antibody in this solution at 4 °C on a rocker in the cold room. The following
morning the antibody solution was removed and the blot washed with 4% milk in TBST
at least twice for 15 minutes, followed by additional TBST washes as desired. The
secondary antibody was generally applied in 4% milk TBST solution at room temperature
(1:50,000 Santa Cruz HRP conjugated secondary antibody dilution as a starting point) for
approximately 3 hours. Afterwards, the blot was washed at room temperature with 4%
milk in TBST at least twice for between 5 and 10 minutes each, followed by at least 3
TBST washes of similar length. Imaging was performed with Amersham ECL Prime and
Lumi-Film Chemiluminescence Detection Film in a dark room with appropriate Kodak
GBX fixer/developer solutions.
Digitonin Permeabilization Method
A non-microscopy method to examine localization was employed using digitonin
to separate out the contents of each membrane-bound component of the parasite.
Digitonin is a non-ionic detergent that may be used to permeabilize cell membranes.
Digitonin complexes with sterols, with cholesterol as the primary partner in eukaryote
cells, and causes rupture of the membrane. The different membranes of cells often
have their properties fine-tuned by having a varied composition, including different
ratios of cholesterol. The various ratios of cholesterol provide an opportunity to
selectively permeabilize the different membranes by incubating them with varied
142
concentrations of digitonin. Differential susceptibility to digitonin permeabilization has
been used to achieve rupture of the cytosolic contents versus the organellar contents
for the recovery and assay of native enzymes from many different cell types[189],
including more recent usage to assay asexual bloods stage malaria parasites [190-192].
The level of control of selective membrane permeabilization is limited, but others have
used it to support the comparison of cytosolic localization to a specific organelle with
some success. In malaria parasites, the trends are for mitochondrial fractions to release
in the range of low, single millimolar concentrations rather sharply while cytosolic
components are lysed more gradually, centered around the lower hundreds of
micromolar range.
Bulusu et al performed experiments using malaria parasites and digitonin
permeabilization at concentrations of 7, 3.5, 0.7, 0.35, 0.17, 0.08 and 0 mM digitonin,
finding that the mitochondrial protein was released between 3.5 mM - 0.7 mM while
the cytosolic protein had a more gradual release between 0.7, 0.35, and 0.17 mM
concentrations of digitonin [190]. Hodges et al performed similar experiments at the
concentrations of 10, 2.5, 0.5, 0.3, 0.1, and 0 mM digitonin, with the mitochondrial
protein being released between 2.5 - 0.5 mM [192]. Hodges also observed cytosolic
content release as even more spread out than observed by Bulusu, but the 50% point
was between 0.5 - 0.3 mM. In all, mitochondrial membranes appear about 50%
permeabilized near 1 mM with what may be a sharper release than cytosolic proteins,
which appear centered about 0.3 mM.

143
To perform digitonin assays, parasites were prepared by first growing three 10
mL cultures of 2% hematocrit and approximately 4% parasitemia or greater. The excess
media was removed and infected red blood cells were resuspended in 20 mL of ice cold
PBS. The infected red blood cells were pelleted at 1,000 x g for 5 minutes in a 4 °C
swinging bucket centrifuge. The supernatant was removed and replaced with 10 mL of
fresh wash solution. Saponin from 12% w/v stock was added to lyse the RBCs at 0.03%
w/v on ice for 2 minutes. When the red blood cells were lysed additional cold wash
solution was added of equal volume. The freed parasites were then spun at 4,000 x g
for 6 minutes to pellet. The supernatant was removed and the pellet was gently
resuspended in approximately 5 mL of ice cold wash buffer. The pellet was then spun at
4,000 x g for 3 minutes. The supernatant was again removed from the pellet and the
pellet was resuspended in 3 mL of ice cold wash buffer for this final wash. The pellet
was then spun at 4,000 x g for 3 minutes, the supernatant removed, and a final aliquot
of approximately 200 µL of ice cold wash buffer was added to the pellet. The color of
supernatants removed from the parasites quickly faded from red to faint tan color by
the last wash. More forceful shaking was used to resuspend the parasites in the buffer
to make a parasite suspension that would be used for further experiments.
A total parasite lysate sample of 50 µL was made from 25 µL of the parasite
suspension combined with 25 µL of 2x Laemmli buffer. Prior to harvesting the parasites,
microcentrifuge tubes were prepared with 5 µL of the PBS wash buffer or digitonin from
35 and 3.5 mM intermediate stocks such that concentration of digitonin in each sample

144
after adding 20 µL of parasite suspension would be 7, 1.4, 0.7, 0.35, 0.18, and 0 mM
digitonin. The digitonin aliquot tubes were chilled and 20 µL of the parasite suspension
was added to the wall of the tube while on ice. The parasite suspension was “flicked”
down into the digitonin, the mixture quickly mixed, and a water bath at 37 °C was then
used to incubate the mixture for two minutes. After two minutes, the samples were
removed back to an ice bath and then placed in a 4°C chilled fixed angle centrifuge and
the samples spun at 20,000 x g for two minutes to separate the components present in
the supernatant from what was still in the pellet. The supernatant was carefully
removed to a new microcentrifuge tube that had been prepared with 25 µL of 2x
Laemmli buffer. To the pellet samples, 20 µL of PBS was added followed by 25 µL of 2x
Laemmli buffer. The samples were then mixed forcefully to help solubilize the pellet
and the samples incubated at 95 °C for 6 minutes. The samples were then quickly
frozen at -80°C until time permitted to run the Western blots.
The proteins present in the digitonin-treated samples were separated using 15
well SDS-PAGE gels of a 4-15% gradient. A total of 10 µL of each sample was loaded per
lane, relative to 7.5 µL of Precision Plus WesternC prestained protein ladder (Bio-Rad
161-0376) and 10 µL of Precision Plus Dual Color prestained protein ladder loaded in the
outside lanes. The gel contents were transferred and probed as described in the
Western blot protocol. To mark the release of different organelle contents, several
antibodies to proteins of known location were used including the malaria parasite
aldolase (Abcam ab38905), GFP as part of a protein-fusion tag (Santa Cruz sc9995), and
145
the antibodies to malaria parasite DHFR-TS that were generated with GenScript’s
service. Primary antibodies were generally applied in a 5% milk-TBST solution at a
1:5,000 fold dilution. The aldolase antibody was applied at 1:2 million via an
intermediary stock solution. For a uniform clarity in figures, the data was reduced so
that the supernatant bands of each appropriate protein were shown.
146
Bibliography
1. Hay, S.I., et al., The global distribution and population at risk of malaria: past, present, and future. Lancet Infect Dis, 2004. 4(6): p. 327-36.
2. Snow, R.W., et al., The global distribution of clinical episodes of Plasmodium falciparum malaria. Nature, 2005. 434(7030): p. 214-7.
3. World Health Organization., World Malaria Report, 2010, World Health Organization: Geneva, Switzerland. p. v.
4. Murray, C.J., et al., Global malaria mortality between 1980 and 2010: a systematic analysis. Lancet, 2012. 379(9814): p. 413-31.
5. Sachs, J. and P. Malaney, The economic and social burden of malaria. Nature, 2002. 415(6872): p. 680-5.
6. Perry, A., Battling a scourge. Malaria has plagued us for centuries but a new model for global aid could change the game. Time, 2010. 175(24): p. 37, 39-40, 42.
7. Burrows, J.N., et al., Antimalarial drug discovery - the path towards eradication. Parasitology, 2014. 141(1): p. 128-39.
8. Slutsker, L. and S.P. Kachur, It is time to rethink tactics in the fight against malaria. Malar J, 2013. 12: p. 140.
9. Liu, W., et al., Origin of the human malaria parasite Plasmodium falciparum in gorillas. Nature, 2010. 467(7314): p. 420-5.
10. Tan, S.Y. and A. Ahana, Charles Laveran (1845-1922): Nobel laureate pioneer of malaria. Singapore Med J, 2009. 50(7): p. 657-8.
11. Bruce-Chwatt, L.J., Alphonse Laveran's discovery 100 years ago and today's global fight against malaria. J R Soc Med, 1981. 74(7): p. 531-6.
12. Capanna, E., Grassi versus Ross: who solved the riddle of malaria? Int Microbiol, 2006. 9(1): p. 69-74.
13. Cox-Singh, J., et al., Plasmodium knowlesi malaria in humans is widely distributed and potentially life threatening. Clin Infect Dis, 2008. 46(2): p. 165-71.
14. Miller, L.H., et al., The pathogenic basis of malaria. Nature, 2002. 415(6872): p. 673-9.
15. Jongwutiwes, S., et al., Naturally acquired Plasmodium knowlesi malaria in human, Thailand. Emerg Infect Dis, 2004. 10(12): p. 2211-3.
16. Collins, W.E. and G.M. Jeffery, Plasmodium ovale: parasite and disease. Clinical microbiology reviews, 2005. 18(3): p. 570-81.
17. Collins, W.E. and G.M. Jeffery, Plasmodium malariae: parasite and disease. Clinical microbiology reviews, 2007. 20(4): p. 579-92.
18. Collins, W.E., Plasmodium knowlesi: a malaria parasite of monkeys and humans. Annu Rev Entomol, 2012. 57: p. 107-21.
19. Sherman, I.W. and A.S.f. Microbiology., The power of plagues2006, Washington, D.C.: ASM Press.
147
20. Cowman, A.F., D. Berry, and J. Baum, The cellular and molecular basis for malaria parasite invasion of the human red blood cell. J Cell Biol, 2012. 198(6): p. 961-71.
21. Su, X., K. Hayton, and T.E. Wellems, Genetic linkage and association analyses for trait mapping in Plasmodium falciparum. Nat Rev Genet, 2007. 8(7): p. 497-506.
22. Hekmat-Nejad, M. and P.K. Rathod, Plasmodium falciparum:Kinetic Interactions of WR99210 with Pyrimethamine-Sensitive and Pyrimethamine-Resistant Dihydrofolate Reductase. Experimental Parasitology, 1997. 87(3): p. 222-228.
23. Cowman, A.F. and B.S. Crabb, Invasion of red blood cells by malaria parasites. Cell, 2006. 124(4): p. 755-66.
24. Reyes, P., et al., Enzymes of purine and pyrimidine metabolism from the human malaria parasite, Plasmodium falciparum. Mol Biochem Parasitol, 1982. 5(5): p. 275-90.
25. Bungener, W. and G. Nielsen, [Nucleic acid metabolism in experimental malaria. 1. Studies on the incorporation of thymidine, uridine, and adenosine in the malaria parasite (Plasmodium berghei and Plasmodium vinckei)]. Z Tropenmed Parasitol, 1967. 18(4): p. 456-62.
26. Sherman, I.W., Biochemistry of Plasmodium (malarial parasites). Microbiol Rev, 1979. 43(4): p. 453-95.
27. Mitchell, H.K., E.E. Snell, and R.J. Williams, THE CONCENTRATION OF “FOLIC ACID”. Journal of the American Chemical Society, 1941. 63(8): p. 2284-2284.
28. Farber, S., et al., The action of pteroylglutamic conjugates on man. Science, 1947. 106(2764): p. 619-621.
29. Farber, S., et al., Temporary Remissions in Acute Leukemia in Children Produced by Folic Acid Antagonist, 4-Aminopteroyl-Glutamic Acid (Aminopterin). New England Journal of Medicine, 1948. 238(23): p. 787-793.
30. Sirawaraporn, W., et al., The dihydrofolate reductase domain of Plasmodium falciparum thymidylate synthase-dihydrofolate reductase. Gene synthesis, expression, and anti-folate-resistant mutants. J Biol Chem, 1993. 268(29): p. 21637-44.
31. McGuire, J.J., Anticancer antifolates: current status and future directions. Curr Pharm Des, 2003. 9(31): p. 2593-613.
32. Maegraith, B.G., A.R. Adams, and et al., Studies on synthetic antimalarial drugs; results of a preliminary investigation of the therapeutic action of 4888 (paludrine) on acute attacks of malignant tertian malaria. Ann Trop Med Parasitol, 1945. 39: p. 232-6.
33. Curd, F.H., D.G. Davey, and F.L. Rose, Studies on synthetic antimalarial drugs; some biguanide derivatives as new types of antimalarial substances with both therapeutic and causal prophylactic activity. Annals of tropical medicine and parasitology, 1945. 39: p. 208-16.
34. Peterson, D.S., W.K. Milhous, and T.E. Wellems, Molecular basis of differential resistance to cycloguanil and pyrimethamine in Plasmodium falciparum malaria. Proc Natl Acad Sci U S A, 1990. 87(8): p. 3018-22.
148
35. Nzila, A., The past, present and future of antifolates in the treatment of Plasmodium falciparum infection. J Antimicrob Chemother, 2006. 57(6): p. 1043-54.
36. Abeles, R.H., P.A. Frey, and W.P. Jencks, Biochemistry1992, Boston: Jones and Bartlett. xxii, 884 p.
37. Hyde, J.E., Drug-resistant malaria - an insight. FEBS J, 2007. 274(18): p. 4688-98. 38. Chaudhary, K. and D.S. Roos, Protozoan genomics for drug discovery. Nat
Biotechnol, 2005. 23(9): p. 1089-91. 39. Gardner, M.J., et al., Genome sequence of the human malaria parasite
Plasmodium falciparum. Nature, 2002. 419(6906): p. 498-511. 40. Zhang, K. and P.K. Rathod, Divergent regulation of dihydrofolate reductase
between malaria parasite and human host. Science, 2002. 296(5567): p. 545-547.
41. Falco, E.A., et al., 2:4-diaminopyrimidines- a new series of antimalarials. British journal of pharmacology and chemotherapy, 1951. 6(2): p. 185-200.
42. McKie, J.H., et al., Rational drug design approach for overcoming drug resistance: application to pyrimethamine resistance in malaria. J Med Chem, 1998. 41(9): p. 1367-70.
43. Sirawaraporn, W., Dihydrofolate reductase and antifolate resistance in malaria. Drug Resist Updat, 1998. 1(6): p. 397-406.
44. McCutchan, T.F., et al., Mechanism of pyrimethamine resistance in recent isolates of Plasmodium falciparum. Antimicrobial Agents and Chemotherapy, 1984. 26(5): p. 656-9.
45. Auliff, A., et al., Amino acid mutations in Plasmodium vivax DHFR and DHPS from several geographical regions and susceptibility to antifolate drugs. Am J Trop Med Hyg, 2006. 75(4): p. 617-21.
46. Gregson, A. and C.V. Plowe, Mechanisms of resistance of malaria parasites to antifolates. Pharmacol Rev, 2005. 57(1): p. 117-45.
47. Wang, P., et al., Sulfadoxine resistance in the human malaria parasite Plasmodium falciparum is determined by mutations in dihydropteroate synthetase and an additional factor associated with folate utilization. Mol Microbiol, 1997. 23(5): p. 979-86.
48. Davies, C.S., et al., The causal prophylactic activity of the novel hydroxynaphthoquinone 566C80 against Plasmodium berghei infections in rats. Acta Leidensia, 1989. 58(2): p. 115-28.
49. Olszewski, K.L., et al., Branched tricarboxylic acid metabolism in Plasmodium falciparum. Nature, 2010. 466(7307): p. 774-8.
50. van Dooren, G.G., L.M. Stimmler, and G.I. McFadden, Metabolic maps and functions of the Plasmodium mitochondrion. FEMS Microbiol Rev, 2006. 30(4): p. 596-630.
51. Gutteridge, W.E., D. Dave, and W.H. Richards, Conversion of dihydroorotate to orotate in parasitic protozoa. Biochimica et biophysica acta, 1979. 582(3): p. 390-401.
149
52. Painter, H.J., et al., Specific role of mitochondrial electron transport in blood-stage Plasmodium falciparum. Nature, 2007. 446(7131): p. 88-91.
53. Chiodini, P.L., et al., Evaluation of atovaquone in the treatment of patients with uncomplicated Plasmodium falciparum malaria. J Antimicrob Chemother, 1995. 36(6): p. 1073-8.
54. Looareesuwan, S., et al., Clinical studies of atovaquone, alone or in combination with other antimalarial drugs, for treatment of acute uncomplicated malaria in Thailand. Am J Trop Med Hyg, 1996. 54(1): p. 62-6.
55. Shapiro, T.A., et al., Prophylactic activity of atovaquone against Plasmodium falciparum in humans. Am J Trop Med Hyg, 1999. 60(5): p. 831-6.
56. Cushion, M.T. and P.D. Walzer, Preclinical drug discovery for new anti-pneumocystis compounds. Curr Med Chem, 2009. 16(20): p. 2514-30.
57. Meneceur, P., et al., In vitro susceptibility of various genotypic strains of Toxoplasma gondii to pyrimethamine, sulfadiazine, and atovaquone. Antimicrob Agents Chemother, 2008. 52(4): p. 1269-77.
58. Vannier, E. and P.J. Krause, Update on babesiosis. Interdiscip Perspect Infect Dis, 2009. 2009: p. 984568.
59. Canfield, C.J., M. Pudney, and W.E. Gutteridge, Interactions of atovaquone with other antimalarial drugs against Plasmodium falciparum in vitro. Exp Parasitol, 1995. 80(3): p. 373-81.
60. Kelly, J.X., et al., Discovery of dual function acridones as a new antimalarial chemotype. Nature, 2009. 459(7244): p. 270-273.
61. Winter, R.W., et al., Evaluation and lead optimization of anti-malarial acridones. Experimental Parasitology, 2006. 114(1): p. 47-56.
62. Winter, R.W., et al., Antimalarial quinolones: synthesis, potency, and mechanistic studies. Exp Parasitol, 2008. 118(4): p. 487-97.
63. Dong, C.K., et al., Type II NADH dehydrogenase of the respiratory chain of Plasmodium falciparum and its inhibitors. Bioorg Med Chem Lett, 2009. 19(3): p. 972-5.
64. Ridley, R.G., et al., Haematin (haem) polymerization and its inhibition by quinoline antimalarials. Ann Trop Med Parasitol, 1997. 91(5): p. 559-66.
65. Slater, A.F. and A. Cerami, Inhibition by chloroquine of a novel haem polymerase enzyme activity in malaria trophozoites. Nature, 1992. 355(6356): p. 167-9.
66. Egan, T.J., D.C. Ross, and P.A. Adams, Quinoline anti-malarial drugs inhibit spontaneous formation of beta-haematin (malaria pigment). FEBS Lett, 1994. 352(1): p. 54-7.
67. Combrinck, J.M., et al., Insights into the role of heme in the mechanism of action of antimalarials. ACS Chem Biol, 2013. 8(1): p. 133-7.
68. Wellems, T.E. and C.V. Plowe, Chloroquine-Resistant Malaria. Journal of Infectious Diseases, 2001. 184(6): p. 770-776.
69. Sidhu, A.B., D. Verdier-Pinard, and D.A. Fidock, Chloroquine resistance in Plasmodium falciparum malaria parasites conferred by pfcrt mutations. Science, 2002. 298(5591): p. 210-3.
150
70. Haynes, R.K., et al., Considerations on the mechanism of action of artemisinin antimalarials: part 1--the 'carbon radical' and 'heme' hypotheses. Infect Disord Drug Targets, 2013. 13(4): p. 217-77.
71. Antoine, T., et al., Rapid kill of malaria parasites by artemisinin and semi-synthetic endoperoxides involves ROS-dependent depolarization of the membrane potential. J Antimicrob Chemother, 2014. 69(4): p. 1005-16.
72. Pandey, A.V., et al., Artemisinin, an endoperoxide antimalarial, disrupts the hemoglobin catabolism and heme detoxification systems in malarial parasite. J Biol Chem, 1999. 274(27): p. 19383-8.
73. Hong, Y.L., Y.Z. Yang, and S.R. Meshnick, The interaction of artemisinin with malarial hemozoin. Mol Biochem Parasitol, 1994. 63(1): p. 121-8.
74. Nosten, F. and N.J. White, Artemisinin-based combination treatment of falciparum malaria. Am J Trop Med Hyg, 2007. 77(6 Suppl): p. 181-92.
75. Dondorp, A.M., et al., Artemisinin resistance in Plasmodium falciparum malaria. N Engl J Med, 2009. 361(5): p. 455-67.
76. Carrara, V.I., et al., Malaria burden and artemisinin resistance in the mobile and migrant population on the Thai-Myanmar border, 1999-2011: an observational study. PLoS Med, 2013. 10(3): p. e1001398.
77. Foster, K.A., et al., Optical and pharmacological tools to investigate the role of mitochondria during oxidative stress and neurodegeneration. Prog Neurobiol, 2006. 79(3): p. 136-71.
78. MacRae, J.I., et al., Mitochondrial metabolism of sexual and asexual blood stages of the malaria parasite Plasmodium falciparum. BMC Biol, 2013. 11: p. 67.
79. Fry, M. and J.E. Beesley, Mitochondria of mammalian Plasmodium spp. Parasitology, 1991. 102 Pt 1: p. 17-26.
80. Uyemura, S.A., et al., Oxidative phosphorylation and rotenone-insensitive malate- and NADH-quinone oxidoreductases in Plasmodium yoelii yoelii mitochondria in situ. J Biol Chem, 2004. 279(1): p. 385-93.
81. Scheibel, L.W. and W.K. Pflaum, Carbohydrate Metabolism in Plasmodium-Knowlesi. Comparative Biochemistry and Physiology, 1970. 37(4): p. 543-&.
82. Barbrook, A.C., et al., Organization and expression of organellar genomes. Philos Trans R Soc Lond B Biol Sci, 2010. 365(1541): p. 785-97.
83. Verma, R., G.C. Varshney, and G.P. Raghava, Prediction of mitochondrial proteins of malaria parasite using split amino acid composition and PSSM profile. Amino Acids, 2010. 39(1): p. 101-10.
84. Bender, A., et al., Properties and prediction of mitochondrial transit peptides from Plasmodium falciparum. Mol Biochem Parasitol, 2003. 132(2): p. 59-66.
85. Torrentino-Madamet, M., et al., Microaerophilic respiratory metabolism of Plasmodium falciparum mitochondrion as a drug target. Curr Mol Med, 2010. 10(1): p. 29-46.
86. Pfanner, N. and A. Geissler, Versatility of the mitochondrial protein import machinery. Nat Rev Mol Cell Biol, 2001. 2(5): p. 339-49.

151
87. Allary, M., et al., Scavenging of the cofactor lipoate is essential for the survival of the malaria parasite Plasmodium falciparum. Mol Microbiol, 2007. 63(5): p. 1331-44.
88. Claros, M.G. and P. Vincens, Computational method to predict mitochondrially imported proteins and their targeting sequences. Eur J Biochem, 1996. 241(3): p. 779-86.
89. Emanuelsson, O., et al., Predicting subcellular localization of proteins based on their N-terminal amino acid sequence. J Mol Biol, 2000. 300(4): p. 1005-16.
90. Emanuelsson, O., et al., Locating proteins in the cell using TargetP, SignalP and related tools. Nat Protoc, 2007. 2(4): p. 953-71.
91. Read, M., et al., Dynamic subcellular localization of isoforms of the folate pathway enzyme serine hydroxymethyltransferase (SHMT) through the erythrocytic cycle of Plasmodium falciparum. Malar J, 2010. 9: p. 351.
92. Pornthanakasem, W., et al., Plasmodium serine hydroxymethyltransferase: indispensability and display of distinct localization. Malaria journal, 2012. 11: p. 387.
93. Okinaka, O. and K. Iwai, The biosynthesis of folic acid compounds in plants. 3. Distribution of the dihydropteroate-synthesizing enzyme in plants. J Vitaminol (Kyoto), 1970. 16(3): p. 196-200.
94. Neuburger, M., et al., Mitochondria are a major site for folate and thymidylate synthesis in plants. J Biol Chem, 1996. 271(16): p. 9466-72.
95. Pribat, A., et al., Nonflowering plants possess a unique folate-dependent phenylalanine hydroxylase that is localized in chloroplasts. Plant Cell, 2010. 22(10): p. 3410-22.
96. Toth, I., G. Lazar, and H.M. Goodman, Purification and immunochemical characterization of a dihydrofolate reductase-thymidylate synthase enzyme complex from wild-carrot cells. EMBO J, 1987. 6(7): p. 1853-8.
97. Luo, M., et al., Molecular cloning and analysis of a cDNA coding for the bifunctional dihydrofolate reductase-thymidylate synthase of Daucus carota. Plant Mol Biol, 1993. 22(3): p. 427-35.
98. Lazar, G., H. Zhang, and H.M. Goodman, The origin of the bifunctional dihydrofolate reductase-thymidylate synthase isogenes of Arabidopsis thaliana. Plant J, 1993. 3(5): p. 657-68.
99. Wang, M., S. Ratnam, and J.H. Freisheim, Cloning, nucleotide sequence and expression of the bifunctional dihydrofolate reductase-thymidylate synthase from Glycine max. Biochimica et biophysica acta, 1995. 1261(3): p. 325-36.
100. Cox, K., D. Robertson, and R. Fites, Mapping and expression of a bifunctional thymidylate synthase, dihydrofolate reductase gene from maize. Plant Mol Biol, 1999. 41(6): p. 733-9.
101. Gueiros-Filho, F.J. and S.M. Beverley, Selection against the dihydrofolate reductase-thymidylate synthase (DHFR-TS) locus as a probe of genetic alterations in Leishmania major. Mol Cell Biol, 1996. 16(10): p. 5655-63.
152
102. O'Neil, R.H., et al., Phylogenetic Classification of Protozoa Based on the Structure of the Linker Domain in the Bifunctional Enzyme, Dihydrofolate Reductase-Thymidylate Synthase. Journal of Biological Chemistry, 2003. 278(52): p. 52980-52987.
103. Spalding, M.D., et al., Validation of a modified method for Bxb1 mycobacteriophage integrase-mediated recombination in Plasmodium falciparum by localization of the H-protein of the glycine cleavage complex to the mitochondrion. Mol Biochem Parasitol, 2010. 172(2): p. 156-60.
104. Diaz, D.S., et al., Role of specific cytochrome P450 isoforms in the conversion of phenoxypropoxybiguanide analogs in human liver microsomes to potent antimalarial dihydrotriazines. Drug Metab Dispos, 2008. 36(2): p. 380-5.
105. Jones, K. and S.A. Ward, Biguanide-atovaquone synergy against Plasmodium falciparum in vitro. Antimicrob Agents Chemother, 2002. 46(8): p. 2700-3.
106. Bertilsson, L., Geographical/interracial differences in polymorphic drug oxidation. Current state of knowledge of cytochromes P450 (CYP) 2D6 and 2C19. Clin Pharmacokinet, 1995. 29(3): p. 192-209.
107. Kaneko, A., et al., Intrinsic efficacy of proguanil against falciparum and vivax malaria independent of the metabolite cycloguanil. J Infect Dis, 1999. 179(4): p. 974-9.
108. Ward, S.A., et al., Inter-subject variability in the metabolism of proguanil to the active metabolite cycloguanil in man. Br J Clin Pharmacol, 1989. 27(6): p. 781-7.
109. Schmidt, L.H., et al., Antimalarial activities of triazine metabolites of chlorguanide and dichlorguanide. Proc Soc Exp Biol Med, 1952. 80(2): p. 367-70.
110. Smith, C.C., J. Ihrig, and R. Menne, Antimalarial Activity and Metabolism of Biguanides: I. Metabolism of Chlorguanide and Chlorguanide Triazine in Rhesus Monkeys and Man. The American Journal of Tropical Medicine and Hygiene, 1961. 10(5): p. 694-703.
111. Fidock, D.A. and T.E. Wellems, Transformation with human dihydrofolate reductase renders malaria parasites insensitive to WR99210 but does not affect the intrinsic activity of proguanil. Proc Natl Acad Sci U S A, 1997. 94(20): p. 10931-6.
112. Fidock, D.A., T. Nomura, and T.E. Wellems, Cycloguanil and its parent compound proguanil demonstrate distinct activities against Plasmodium falciparum malaria parasites transformed with human dihydrofolate reductase. Mol Pharmacol, 1998. 54(6): p. 1140-7.
113. Foote, S.J., D. Galatis, and A.F. Cowman, Amino acids in the dihydrofolate reductase-thymidylate synthase gene of Plasmodium falciparum involved in cycloguanil resistance differ from those involved in pyrimethamine resistance. Proceedings of the National Academy of Sciences of the United States of America, 1990. 87(8): p. 3014-7.
114. Basco, L.K., et al., Point mutations in the dihydrofolate reductase-thymidylate synthase gene and pyrimethamine and cycloguanil resistance in Plasmodium falciparum. Molecular and biochemical parasitology, 1995. 69(1): p. 135-8.

153
115. Sucharit, F., et al., In vitro studies on the sensitivities of Plasmodium falciparum in Thailand to pyrimethamine and proguanil. Annals of tropical medicine and parasitology, 1985. 79(4): p. 375-7.
116. Looareesuwan, S., et al., Malarone (atovaquone and proguanil hydrochloride): a review of its clinical development for treatment of malaria. Malarone Clinical Trials Study Group. The American Journal of Tropical Medicine and Hygiene, 1999. 60(4): p. 533-41.
117. Fivelman, Q.L., et al., Malarone treatment failure and in vitro confirmation of resistance of Plasmodium falciparum isolate from Lagos, Nigeria. Malar J, 2002. 1: p. 1.
118. Korsinczky, M., et al., Mutations in Plasmodium falciparum cytochrome b that are associated with atovaquone resistance are located at a putative drug-binding site. Antimicrob Agents Chemother, 2000. 44(8): p. 2100-8.
119. Vaidya, A.B. and M.W. Mather, Atovaquone resistance in malaria parasites. Drug Resist Updat, 2000. 3(5): p. 283-287.
120. Hudson, A.T., et al., 566C80: a potent broad spectrum anti-infective agent with activity against malaria and opportunistic infections in AIDS patients. Drugs Exp Clin Res, 1991. 17(9): p. 427-35.
121. Vinetz, J.M., et al., eds. Chapter 49. Chemotherapy of Malaria. 12 ed. Goodman & Gilman's The Pharmacological Basis of Therapeutics, ed. L.L. Brunton, B.A. Chabner, and B.C. Knollmann2011, McGraw-Hill: New York.
122. Canfield, C.J., et al., PS-15: a potent, orally active antimalarial from a new class of folic acid antagonists. Am J Trop Med Hyg, 1993. 49(1): p. 121-6.
123. Hussein, Z., et al., Population pharmacokinetics of proguanil in patients with acute P. falciparum malaria after combined therapy with atovaquone. Br J Clin Pharmacol, 1996. 42(5): p. 589-97.
124. Srivastava, I.K. and A.B. Vaidya, A mechanism for the synergistic antimalarial action of atovaquone and proguanil. Antimicrob Agents Chemother, 1999. 43(6): p. 1334-9.
125. Kar, S., Control of malaria. Nat Rev Drug Discov, 2010. 9(7): p. 511-2. 126. Thapar, M.M., et al., Time-dependent pharmacokinetics and drug metabolism of
atovaquone plus proguanil (Malarone) when taken as chemoprophylaxis. European journal of clinical pharmacology, 2002. 58(1): p. 19-27.
127. Thapar, M.M., et al., Pharmacodynamic interactions among atovaquone, proguanil and cycloguanil against Plasmodium falciparum in vitro. Transactions of the Royal Society of Tropical Medicine and Hygiene, 2003. 97(3): p. 331-7.
128. Edstein, M.D., et al., Pharmacokinetics of proguanil in malaria patients treated with proguanil plus atovaquone. The Southeast Asian journal of tropical medicine and public health, 1996. 27(2): p. 216-20.
129. Edstein, M.D., et al., Lengthy Antimalarial Activity of Atovaquone in Human Plasma following Atovaquone-Proguanil Administration. Antimicrobial Agents and Chemotherapy, 2005. 49(10): p. 4421-4422.
154
130. Huang, X.Q. and W. Miller, A Time-Efficient, Linear-Space Local Similarity Algorithm. Advances in Applied Mathematics, 1991. 12(3): p. 337-357.
131. Kapuscinski, J., DAPI: a DNA-specific fluorescent probe. Biotech Histochem, 1995. 70(5): p. 220-33.
132. Morikawa, K. and M. Yanagida, Visualization of individual DNA molecules in solution by light microscopy: DAPI staining method. J Biochem, 1981. 89(2): p. 693-6.
133. Bazhulina, N.P., et al., Binding of Hoechst 33258 and its derivatives to DNA. J Biomol Struct Dyn, 2009. 26(6): p. 701-18.
134. Chazotte, B., Labeling mitochondria with MitoTracker dyes. Cold Spring Harb Protoc, 2011. 2011(8): p. 990-2.
135. Christensen, K.E. and R.E. MacKenzie, Mitochondrial one-carbon metabolism is adapted to the specific needs of yeast, plants and mammals. Bioessays, 2006. 28(6): p. 595-605.
136. Malmquist, N.A., J. Baldwin, and M.A. Phillips, Detergent-dependent kinetics of truncated Plasmodium falciparum dihydroorotate dehydrogenase. J Biol Chem, 2007. 282(17): p. 12678-86.
137. Baldwin, J., et al., Malarial dihydroorotate dehydrogenase. Substrate and inhibitor specificity. The Journal of biological chemistry, 2002. 277(44): p. 41827-34.
138. Waller, R.F., et al., Protein trafficking to the plastid of Plasmodium falciparum is via the secretory pathway. EMBO J, 2000. 19(8): p. 1794-802.
139. Rohrbach, P., et al., Quantitative calcium measurements in subcellular compartments of Plasmodium falciparum-infected erythrocytes. J Biol Chem, 2005. 280(30): p. 27960-9.
140. Uhlemann, A.C., et al., Mechanism of antimalarial action of the synthetic trioxolane RBX11160 (OZ277). Antimicrob Agents Chemother, 2007. 51(2): p. 667-72.
141. Tomlins, A.M., et al., Plasmodium falciparum ATG8 implicated in both autophagy and apicoplast formation. Autophagy, 2013. 9(10): p. 1540-52.
142. Deponte, M., et al., Wherever I may roam: protein and membrane trafficking in P. falciparum-infected red blood cells. Mol Biochem Parasitol, 2012. 186(2): p. 95-116.
143. Hain, A.U. and J. Bosch, Autophagy in , a multifunctional pathway? Comput Struct Biotechnol J, 2013. 8: p. e201308002.
144. Schindelin, J., et al., Fiji: an open-source platform for biological-image analysis. Nat Meth, 2012. 9(7): p. 676-682.
145. Pearson, K., Note on Regression and Inheritance in the Case of Two Parents. Proceedings of the Royal Society of London, 1895. 58(347-352): p. 240-242.
146. Manders, E.M.M., F.J. Verbeek, and J.A. Aten, Measurement of co-localization of objects in dual-colour confocal images. Journal of Microscopy, 1993. 169(3): p. 375-382.
155
147. Nkrumah, L.J., et al., Efficient site-specific integration in Plasmodium falciparum chromosomes mediated by mycobacteriophage Bxb1 integrase. Nature methods, 2006. 3(8): p. 615-21.
148. Nirmalan, N., et al., Transcriptional analysis of genes encoding enzymes of the folate pathway in the human malaria parasite Plasmodium falciparum. Molecular microbiology, 2002. 46(1): p. 179-190.
149. Nirmalan, N., P.F. Sims, and J.E. Hyde, Translational up-regulation of antifolate drug targets in the human malaria parasite< i> Plasmodium falciparum</i> upon challenge with inhibitors. Molecular and biochemical parasitology, 2004. 136(1): p. 63-70.
150. Auliff, A.M., et al., Functional analysis of Plasmodium vivax dihydrofolate reductase-thymidylate synthase genes through stable transformation of Plasmodium falciparum. PLoS One, 2012. 7(7): p. e40416.
151. Alifrangis, M., et al., Homology building as a means to define antigenic epitopes on dihydrofolate reductase (DHFR) from Plasmodium falciparum. Malar J, 2004. 3: p. 16.
152. Modest, E.J., Chemical and Biological Studies on 1,2-Dihydro-S-Triazines .2. 3-Component Synthesis. Journal of Organic Chemistry, 1956. 21(1): p. 1-13.
153. Yuthavong, Y., et al., Development of a lead inhibitor for the A16V+S108T mutant of dihydrofolate reductase from the cycloguanil-resistant strain (T9/94) of Plasmodium falciparum. J Med Chem, 2000. 43(14): p. 2738-44.
154. O'Neil, M.T., et al., A novel Plasmodium falciparum expression system for assessing antifolate resistance caused by mutant P. vivax dihydrofolate reductase-thymidylate synthase. J Infect Dis, 2007. 196(3): p. 467-74.
155. El Bissati, K., et al., The plasma membrane permease PfNT1 is essential for purine salvage in the human malaria parasite Plasmodium falciparum. Proc Natl Acad Sci U S A, 2006. 103(24): p. 9286-91.
156. Sullivan, J.S., et al., Adaptation of the AMRU-1 strain of Plasmodium vivax to Aotus and Saimiri monkeys and to four species of anopheline mosquitoes. J Parasitol, 1999. 85(4): p. 672-7.
157. O'Donnell, R.A., et al., A genetic screen for improved plasmid segregation reveals a role for Rep20 in the interaction of Plasmodium falciparum chromosomes. EMBO J, 2002. 21(5): p. 1231-9.
158. Deitsch, K., C. Driskill, and T. Wellems, Transformation of malaria parasites by the spontaneous uptake and expression of DNA from human erythrocytes. Nucleic Acids Res, 2001. 29(3): p. 850-3.
159. Hasenkamp, S., K.T. Russell, and P. Horrocks, Comparison of the absolute and relative efficiencies of electroporation-based transfection protocols for Plasmodium falciparum. Malar J, 2012. 11: p. 210.
160. Wu, Y., et al., Transfection of Plasmodium falciparum within human red blood cells. Proc Natl Acad Sci U S A, 1995. 92(4): p. 973-7.
156
161. Desjardins, R.E., et al., Quantitative assessment of antimalarial activity in vitro by a semiautomated microdilution technique. Antimicrob Agents Chemother, 1979. 16(6): p. 710-8.
162. Smilkstein, M.J., et al., A drug-selected Plasmodium falciparum lacking the need for conventional electron transport. Mol Biochem Parasitol, 2008. 159(1): p. 64-8.
163. Helsby, N.A., et al., The pharmacokinetics and activation of proguanil in man: consequences of variability in drug metabolism. Br J Clin Pharmacol, 1990. 30(4): p. 593-8.
164. Cowman, A.F., et al., Amino acid changes linked to pyrimethamine resistance in the dihydrofolate reductase-thymidylate synthase gene of Plasmodium falciparum. Proc Natl Acad Sci U S A, 1988. 85(23): p. 9109-13.
165. Wang, P., et al., Resistance to antifolates in Plasmodium falciparum monitored by sequence analysis of dihydropteroate synthetase and dihydrofolate reductase alleles in a large number of field samples of diverse origins. Mol Biochem Parasitol, 1997. 89(2): p. 161-77.
166. Charles, L.J., et al., The appearance of pyrimethamine resistance in Plasmodium falciparum following self-medication by a rural community in Ghana. Bull World Health Organ, 1962. 26: p. 103-8.
167. Chotivanich, K., et al., The effects of serum lipids on the in vitro activity of lumefantrine and atovaquone against Plasmodium falciparum. Malaria journal, 2012. 11: p. 177.
168. Fisher, N., et al., Cytochrome b mutation Y268S conferring atovaquone resistance phenotype in malaria parasite results in reduced parasite bc1 catalytic turnover and protein expression. J Biol Chem, 2012. 287(13): p. 9731-41.
169. Wenz, T., et al., Mutational analysis of cytochrome b at the ubiquinol oxidation site of yeast complex III. J Biol Chem, 2007. 282(6): p. 3977-88.
170. Vallieres, C., N. Fisher, and B. Meunier, Reconstructing the Qo site of Plasmodium falciparum bc 1 complex in the yeast enzyme. PLoS One, 2013. 8(8): p. e71726.
171. Bailey, C.J. and C. Day, Metformin: its botanical background. Practical Diabetes International, 2004. 21(3): p. 115-117.
172. Synthalin and Insulin. Science, 1927. 65(1684): p. x. 173. Rabinowitch, I.M., Observations on the Use of Synthalin in the Treatment of
Diabetes Mellitus. Can Med Assoc J, 1927. 17(8): p. 901-4. 174. Thomson, A.P., R.J. Gittins, and G. Thomas, Synthalin in the Treatment of
Diabetes. Br Med J, 1932. 1(3711): p. 322-5. 175. Sands, M., M.A. Kron, and R.B. Brown, Pentamidine: a review. Rev Infect Dis,
1985. 7(5): p. 625-34. 176. Ponnudurai, T., et al., The production of mature gametocytes of Plasmodium
falciparum in continuous cultures of different isolates infective to mosquitoes. Transactions of the Royal Society of Tropical Medicine and Hygiene, 1982. 76(2): p. 242-50.
177. Kafsack, B.F.C., et al., A transcriptional switch underlies commitment to sexual development in malaria parasites. Nature, 2014. 507(7491): p. 248-252.
157
178. Vaidya, A.B., et al., Unidirectional dominance of cytoplasmic inheritance in two genetic crosses of Plasmodium falciparum. Molecular and cellular biology, 1993. 13(12): p. 7349-57.
179. Furuya, T., et al., Disruption of a Plasmodium falciparum gene linked to male sexual development causes early arrest in gametocytogenesis. Proceedings of the National Academy of Sciences of the United States of America, 2005. 102(46): p. 16813-16818.
180. Silvestrini, F., et al., Genome-wide identification of genes upregulated at the onset of gametocytogenesis in Plasmodium falciparum. Mol Biochem Parasitol, 2005. 143(1): p. 100-10.
181. Udeinya, I.J., et al., Plasmodium falciparum: effect of time in continuous culture on binding to human endothelial cells and amelanotic melanoma cells. Exp Parasitol, 1983. 56(2): p. 207-14.
182. Salcedo-Sora, J.E., et al., The Molecular Basis of Folate Salvage in Plasmodium falciparum: CHARACTERIZATION OF TWO FOLATE TRANSPORTERS. Journal of Biological Chemistry, 2011. 286(52): p. 44659-44668.
183. Shallom, S., et al., Essential protein-protein interactions between Plasmodium falciparum thymidylate synthase and dihydrofolate reductase domains. J Biol Chem, 1999. 274(53): p. 37781-6.
184. Rathod, P.K., T. McErlean, and P.C. Lee, Variations in frequencies of drug resistance in Plasmodium falciparum. Proc Natl Acad Sci U S A, 1997. 94(17): p. 9389-93.
185. Watkins, W.M., et al., Antagonism of sulfadoxine and pyrimethamine antimalarial activity in vitro by p-aminobenzoic acid, p-aminobenzoylglutamic acid and folic acid. Mol Biochem Parasitol, 1985. 14(1): p. 55-61.
186. Wang, P., et al., Genetic and metabolic analysis of folate salvage in the human malaria parasite Plasmodium falciparum. Mol Biochem Parasitol, 2004. 135(1): p. 77-87.
187. Chen, G.X., et al., Kinetic and molecular properties of the dihydrofolate reductase from pyrimethamine-sensitive and pyrimethamine-resistant clones of the human malaria parasite Plasmodium falciparum. Mol Pharmacol, 1987. 31(4): p. 430-7.
188. Trager, W. and J.B. Jensen, Human malaria parasites in continuous culture. Science, 1976. 193(4254): p. 673-5.
189. Fiskum, G., et al., The cytoskeleton of digitonin-treated rat hepatocytes. Proceedings of the National Academy of Sciences of the United States of America, 1980. 77(6): p. 3430-4.
190. Bulusu, V., V. Jayaraman, and H. Balaram, Metabolic fate of fumarate, a side product of the purine salvage pathway in the intraerythrocytic stages of Plasmodium falciparum. The Journal of biological chemistry, 2011. 286(11): p. 9236-45.
191. Krungkrai, J., Purification, characterization and localization of mitochondrial dihydroorotate dehydrogenase in Plasmodium falciparum, human malaria parasite. Biochimica et biophysica acta, 1995. 1243(3): p. 351-60.
158
192. Hodges, M., et al., An iron regulatory-like protein expressed in Plasmodium falciparum displays aconitase activity. Molecular and biochemical parasitology, 2005. 143(1): p. 29-38.