localisation focus hall, emeritus professor ... reinhard schäler, director, localisation research...
TRANSCRIPT

VOL. 7 Issue 1
Localisation FocusTHE INTERNATIONAL JOURNAL OF LOCALISATION
The peer-reviewed and indexed localisation journal
ISSN 1649-2358

EDITORIAL BOARDAFRICAKim Wallmach, Lecturer in Translation and Interpreting, University of South Africa, Pretoria, South Africa; Translator and Project ManagerASIAPatrick Hall, Emeritus Professor of Computer Science, Open University, UK; Project Director, Bhasha Sanchar, Madan Puraskar Pustakalaya, NepalSarmad Hussain, Professor and Head of the Center for Research in Urdu Language Processing, NUCES, Lahore, PakistanOm Vikas, Director of the Indian Institute of Information Technology and Management (IIITM), Gwalior, Madhya-Pradesh, IndiaAUSTRALIA and NEW ZEALANDJames M. Hogan, Senior Lecturer in Software Engineering, Queensland University of Technology, Brisbane, AustraliaEUROPEBert Esselink, Solutions Manager, Lionbridge Technologies, Netherlands; authorSharon O'Brien, Lecturer in Translation Studies, Dublin City University, Dublin, IrelandMaeve Olohan, Programme Director of MA in Translation Studies, University of Manchester, Manchester, UKPat O'Sullivan, Test Architect, IBM Dublin Software Laboratory, Dublin, IrelandAnthony Pym, Director of Translation- and Localisation-related Postgraduate Programmes at the Universitat Rovira I Virgili, Tarragona, SpainHarold Somers, Professor of Language Engineering, University of Manchester, Manchester, UKMarcel Thelen, Lecturer in Translation and Terminology, Zuyd University, Maastricht, NetherlandsGregor Thurmair, Head of Development, linguatec language technology GmbH, Munich, GermanyAngelika Zerfass, Freelance Consultant and Trainer for Translation Tools and Related Processes; part-time Lecturer, University of Bonn,GermanyNORTH AMERICATim Altanero, Associate Professor of Foreign Languages, Austin Community College, Texas, USADonald Barabé, Vice President, Professional Services, Canadian Government Translation Bureau, CanadaLynne Bowker, Associate Professor, School of Translation and Interpretation, University of Ottawa, CanadaCarla DiFranco, Programme Manager, Windows Division, Microsoft, USADebbie Folaron, Assistant Professor of Translation and Localisation, Concordia University, Montreal, Quebec, CanadaLisa Moore, Chair of the Unicode Technical Committee, and IM Products Globalisation Manager, IBM, California, USASue Ellen Wright, Lecturer in Translation, Kent State University, Ohio, USASOUTH AMERICATeddy Bengtsson, CEO of Idea Factory Languages Inc., Buenos Aires, ArgentinaJosé Eduardo De Lucca, Co-ordinator of Centro GeNESS and Lecturer at Universidade Federal de Santa Catarina, Brazil
PUBLISHER INFORMATIONEditor: Reinhard Schäler, Director, Localisation Research Centre, University of Limerick, Limerick, IrelandProduction Editor: Karl Kelly, Manager Localisation Research Centre, University of Limerick, Limerick, IrelandPublished by: Localisation Research Centre, CSIS Department, University of Limerick, Limerick, Ireland
AIMS AND SCOPELocalisation Focus – The International Journal of Localisation provides a forum for localisation professionals and researchers to discuss andpresent their localisation-related work, covering all aspects of this multi-disciplinary field, including software engineering, tools and technologydevelopment, cultural aspects, translation studies, project management, workflow and process automation, education and training, and details ofnew developments in the localisation industry. Proposed contributions are peer-reviewed thereby ensuring a high standard of published material.Localisation Focus is distributed worldwide to libraries and localisation professionals, including engineers, managers, trainers, linguists, researchersand students. Indexed on a number of databases, this journal affords contributors increased recognition for their work. Localisation-related papers,articles, reviews, perspectives, insights and correspondence are all welcome.
To access previous issues online go to http://www.localisation.ie/resources/locfocus/pdf.htm and click on the issue you wish to download. Use thefollowing logon details - username: locfocsub and password: V711208
Members of The Institute of Localisation Professionals (TILP) receive Localisation Focus – The International Journal of Localisation as part oftheir membership benefits. Membership applications can be filed electronically from www.tilponline.org Change of address details should be sentto [email protected]
Subscription: To subscribe to Localisation Focus - The International Journal of Localisation visit www.localisationshop.com (subscriptions tab).For more information visit www.localisation.ie/lf
Copyright: © 2008 Localisation Research CentrePermission is granted to quote from this journal with the customary acknowledgement of the source.Opinions expressed by individual authors do not necessarily reflect those of the LRC or the editor.
Localisation Focus – The International Journal of Localisation (ISSN 1649-2358) is published and distributed annually and has been publishedsince 1996 by the Localisation Research Centre, University of Limerick, Limerick, Ireland. Articles are peer reviewed and indexed by major sci-entific research services.

Localisation Focus Vol.7 Issue 1The International Journal of Localisation
Localisation research is now firmly established as afield of academic and industrial research. A quarter ofa century after the first localisation service providersemerged, allowing multinational companies to trans-late and adapt their products to the requirements offoreign markets, and developing the techniques andtechnologies to manage the global information flow,academia and industry have recognised that under thecover of "applications" there are fundamental issueswaiting to be resolved by scientific research efforts.Years of persistent work to encourage new and estab-lished researchers to explore the underlying, princi-ple issues in localisation through the establishment ofacademic competitions (Best Thesis and Best ScholarAwards), collaborative projects, summer schools,conferences and this international journal have beenrewarded. Apart from the significant body of scientif-ic research that is now available, it is the establish-ment of the Centre for Next Generation Localisation(CNGL) that provides the conclusive evidence thatlocalisation is firmly on the scientific research agen-da: four Irish universities and nine Irish and interna-tional companies, supported by significant fundingfrom the Irish Government's Science Foundation,have brought together more than 100 researchersinvestigating the blueprint for next generation locali-sation paradigms. Localisation Focus - TheInternational Journal of Localisation will dedicate itsnext issue exclusively to report on the work of theCNGL.
Meanwhile, the current issue offers an insight intofour extremely challenging aspects of localisation,presented by researchers working both in industryand academia.
Martin Ørsted of Microsoft Ireland reports on hiscompany's strategy to systematically capture and fixlanguage, layout and functional problems arisingwhen a product is being localised into an everincreasing number of languages. He shows that pat-terns can be identified that enable the identificationof inconsistencies and issues across multiple versionsthat, with a single language approach, would havebeen very costly and difficult to identify and correct.As a consequence, the linear dependency between thenumber of languages a product is being localised intoand the total cost of defect correction can be broken.
3
FROM THE EDITOR
Few topics are currently being discussed as much asthe post-editing of machine translation. Bothmachine translated segments and matches from trans-lation memories are now often included in pre-processed content presented to translators. It is wide-ly assumed that this approach improves both produc-tivity and the quality of the end product. Yet, fewattempts have been made to prove this assumption.Ana Guerberof Arenas reports on the results of astudy she conducted and presents some surprisingresults.
There is a clear requirement to automate the post-editing of machine translated text to remove thisoften tedious and repetitive task from increasinglyfrustrated translators, and to increase the efficiencyof the post-editing process. Midori Tatsumi and YanliSun report on the results of their experiment thatcompared an automated statistical post-editingapproach for English text that was machine-translat-ed into Chinese and Japanese. In addition to efficien-cy, they also looked into issues closer to the heart ofthe eventual readers, namely fluency and adequacy.
Patrick Cadwell's contribution also looks at therequirements of the consumer of the localised mate-rial, examining the question whether controlled lan-guage can increase the readability of technical texts.Thus, he expands the coverage of controlled lan-guage in localisation beyond that of a useful pre-pro-cessing step for machine translation.
We would like to encourage you to submit contribu-tions to Localisation Focus - The InternationalJournal of Localisation and to encourage colleaguesto do likewise (for details see the back pages of thisedition). This would be an excellent way to showyour support for our continued efforts to developlocalisation as an exciting and interesting field ofacademic and industrial research.
Reinhard Schäler

Localisation Focus Vol.7 Issue 1The International Journal of Localisation
Systematic validation of localisation across all languagesMartin Ørsted
Microsoft [email protected]
AbstractAs software companies increase the number of markets and languages that they release their products in, it maybecome necessary to change the localisation process for these products. Quality assurance (QA) is often viewed asan area where processes could be streamlined through automation and one method for doing this would be throughthe design of a localisation verification system that can validate single resources across languages as well as checkfor generic issues across multiple resources and languages. This article outlines a graduated approach to systemi-cally capture and fix issues when a product is being localised into an increasing number of languages. By exam-ining multiple languages, patterns can be identified that enable the identification of inconsistencies and issues that,with a single language approach, would have been very costly and difficult to unearth.
Keywords: Localisation, Resources, Verification, Systematic, Multiple languages, Controlled language
4
IntroductionThe best place to address localisation issues isupstream. Much can be done here; the use of newerprogramming languages with more built-in errorchecking, the use of pseudo localisation1 upstream,educating developers, the use of controlled Englishand source reuse systems can all help. There are how-ever many reasons why the above options will neverbe implemented perfectly; deadlines, tradeoffs, theinadequacy of the development languages used, andso on. For these reasons systematic validation canimprove localisation and noticeably drive down costsfor multi-language releases so that the more lan-guages produced the better the return.
In most traditional localisation efforts languages aretreated rather independently, with little or no abilityto leverage the testing performed for one language onanother. The most common forms of leveraging arehighly manual or risk based2 or a combination ofboth. One way of leveraging is, for example, to notrun low priority test cases on certain languages;another is manual regression of bugs found in onelanguage against others. The use of pseudo localisa-tion is also gaining broad acceptance in the industryand serves many needs. Using pseudo localisationwith machine generated pseudo localised strings willallow for a fast check of the localisability ofresources and can in general find most types of local-
isability errors up front. In this context pseudo local-isation is often used to postpone the real localisationeffort until RTM or RTW (Release to manufacturingor web) or at least shorten the parallel effort, whichreduces resource churn and drives down localisationcost. Used in this way it also saves on developmentcosts as the faster an issue is found the cheaper it isto fix it.
There are several goals behind the systemic valida-tion of localisation across all languages. This articleuses practical work that has been carried out inMicrosoft over the years to map out how a methodol-ogy can be built around using systemic validationthat can achieve higher savings and better turnaroundtimes than the aforementioned approaches can deliv-er. The article will start by looking at the singleresource approach, where Microsoft's rules basedapproach is explained, and over the course of thissection it will show the kind of issues that one cansystematically fix. It will then generalise theapproach to a wider pool of resources. We will lookat other methods for bug avoidance, and finish up byanalysing how testing can systemically be reducedwhile quality is maintained, or improved, through theintroduction of the outlined methods. In this way wewill also look at how the traditional linear dependen-cy between the cost of the test effort and the numberof languages localised can be broken.
1 Pseudo localisation is localising strings by replacing the typically US characters with characters from other code pages, and adding tagging before and after the string.Open could for example become become \?p??$@#. Typically the pseudo localisation process is fully automated so it is fast and cheap.2 Risk based through the use of orthogonal arrays for example.

Localisation Focus Vol.7 Issue 1The International Journal of Localisation
The single resourceThere can be many reasons why the localisation of astring can cause a bug, be it user interface or func-tional. In the functional space bugs can be caused by:l Over-localisation: The string should not have
been translated. l Buffer limitation: The translation of the resource
should not be more than a given amount of characters, generally referred to as a string length limitation.
l Illegal characters: Certain characters may not beallowed in the string
l Dependency: Two resources may have to be translated as one, in effect one resource is dependent on the other, references the other.
l Backward compatibility: This is a special case ofdependency, basically where changing a string from one version to another could cause a loss of
backward compatibility.l Uniqueness: The string belongs to a group of
strings that all have to have unique names (translations), for example, a list of commands.
l Placeholder over-localised: Some localisable strings have placeholders in them. If the placeholder gets localised the program cannot drop the information into the placeholder and display it.
l Required string decoration: Some strings may have control characters in the beginning or end of the string that should not be localised
There are other more special cases, but the above listcaptures the majority. In many instances strings thatcan break because of any of the above causes couldhave been bullet-proofed by the developer, but it isnot always the case.
5
Below are a few examples of strings that would fall into these categories:
Rule US string Example loc Issue description
Over-localisation Common Files Might refer to a registry string. Rather than localising the string the program will look up the localised name in the registry
Placeholder The file %1 could %1 and %2 are placeholdersnot be opened because %2
Decoration \n\nOpen\n\n \n is a new-line character, sometimes used in command line applications
Placeholder The file %s was last On %d%d the file %s %s and %d are positional opened on %d %d was last opened placeholders, their position has to
be maintained, changing them as shown will cause an intermittent memory protection fault
In Microsoft the original approach we had to systematically fix issues once we identified them was LocVer, shortfor Localisation Verification. For us, LocVer is still an essential part of our strategy. With LocVer, we can createrules to describe the limitations for a given string, and we can then run the rule engine against all languages. Bydoing so, we can ensure that the issue, once found, is validated and if needed fixed for all languages.
3 LocVer is Microsoft patented and patent pending

Localisation Focus Vol.7 Issue 1The International Journal of Localisation
FIGURE 1: A GRAPHICAL REPRESENTATION OFLOCVER
Figure 1 shows a graphical representation of the idea.So as a hypothetical, practical example, the stringCurrent Accounts could be used in Microsoft Excel,perhaps it becomes part of a Pivot table, and let usassume that we have identified, through trial anderror, that the string cannot contain more than 30characters. At this point in time an engineer wouldoften have the choice of either transferring the bug tothe developer to increase the buffer or accepting thelimitation. We choose to accept the limitation and wecreate a LocVer rule: MaxLength=30 (meaning thatthe translation is not allowed to contain more than 30characters). Since we associate instructions with eachstring, the rule becomes an instruction for that partic-ular resource ID.
We have a master repository for instructions acrossall languages, and that is where our new instructionwill be added. The system is designed so that thelocalisation vendors frequently receive the latestinstructions and has been designed to run this type ofvalidation at each handoff, so in effect given a certainlapse time the rule will have migrated across to alllanguages, and for any language where the rule hasbeen broken an error will be returned and logged, sothat the issue can be resolved.
LocVer has been in use in Microsoft for many yearsnow and has developed from supporting simple ruleslike the one above to more complex scripting rules.As we progressed with this we realised that there wasa need for added functionality, such as the ability toconditionally apply a LocVer rule, perhaps the ruleshould only apply to a subset of languages, or maybe
a subset of languages should be excluded. You canhave strings that accept ANSI 1252 characters, butwhere Cyrillic characters may cause an issue, andhence you may lock translation for those. Or you mayhave a program where some advanced functionalityis available for a few main languages (speech recog-nition for example), but since it is not available forother languages the items should not be localised.There is a cost involved in this per resource basedinstruction approach. Whenever a resource changes,the associated instruction will have to be updated, sothe adding of rules and their maintenance can becomea serious effort. Measuring the return on investmentcan also be a little difficult, in effect how do youaccount for the bugs prevented?
Still, in many instances the individual instructions areoften the only viable way of dealing with per stringlimitations. However this is not always the case andthat is what the next section deals with.
Fixing systematically across a wider pool of stringresourcesThe previous section dealt with a per resourceapproach to the systematic validation of resources. Itworks, it is proven and we use it a lot. However, thecost involved means that we have had to considerwhether we could further develop the approach insuch a way that all the benefits of the above systemcan be retained but without the management over-head of dealing with the individual resources.
There are several different approaches that can beconsidered to reduce the management overhead. AtMicrosoft we have, in practical terms, at least threeconcurrent systems in place, each serving differentneeds. One way of approaching it is to see if we cancreate generic rules. Where this is possible we canthen remove many specific rules and rely on a fewgeneric rules instead. This turns out to be very appli-cable for certain placeholders. If for example %1, %2and %3 always denote placeholders, then we canremove the specific LocVer placeholder rules fromthe individual resources and create a generic rule thatstipulates that %1, %2 and %3 are always placehold-ers and that the translation has to mirror the source intheir usage. This is an approach that we use frequent-ly to avoid functional issues.
6

Localisation Focus Vol.7 Issue 1The International Journal of Localisation
FIGURE 2: A GENERIC PLACEHOLDER RULE WITH NOASSOCIATED ID
In terms of ensuring that certain keywords and copy-right text are correct it is possible to do somethingquite similar. As a case in point, in the old days weused placeholder rules to ensure that certain legal textwas kept across languages, but this is inappropriatefor several reasons, not least of which is the mainte-nance associated with this method. In parallel withthe generic rules we therefore keep a list of SQLqueries that we can run to ensure that copyright textand application names are treated consistently.
This approach can be used, for example, where aproduct is developed with a code name up to a verylate stage when the official product release name isdecided upon. So, for example, InfoPath was referredto as XDocs during the development phase, and itwas only very late in the process that it becameInfoPath. In this case a simple SQL query could berun against all languages to identify places wherelocalisers had "forgotten" to change the name.
We have built up a list of checks, either single lan-guage checks or relative to the US English sourcethat we can run in these situations. For example, inthe last release of Microsoft Office we might haverun checks to find strings where the US source had"Copyright" in the text but the localised text didn't, orthe US version had "2007" in the source but the trans-lation did not contain it, or the US version had"Microsoft Word" in the source but the translationdidn't.
There are many reasons why a more explicit perresource rule-based approach is not acceptable here.Firstly, it would involve far too many rules and drive
up cost. Secondly, there is an advantage to havingclear separation between the functional quality assur-ance and the legal/linguistic assurance. The function-al quality assurance process is ongoing and needs acontinuous focus. In general you expect very fewfalse positives, in effect rules misfiring. As opposedto those for linguistic/legal material the rules canmisfire frequently, and the linguistic quality issuesare not as time critical as the functional ones; thefunctional quality has to be high continuously. Thereason for this will be made apparent below.
A functional issue may block the testing of an area,and consequently the fixing of the functional issuemay in turn uncover more issues. As opposed to thata linguistic issue may often be benign, not an issue atall. The string "Microsoft Office Word could notopen the file %1" could, for example, in some lan-guages be translated to the equivalent of "The file%1 could not be opened" as a space saving meas-ure, and that would in many instances be quite OK.To complicate matters more, we would allow the useof the Cyrillic "i" instead of the Latin "i" for Cyrilliclanguages, hence the word Microsoft would not evenmatch up for Cyrillic languages in a comparisonbetween the language and US.
In terms of the legal/linguistic searches we find there-fore that there is a trade off point, after which it is notworthwhile. We would tend to run our queries a cou-ple of times during production and pay the localisa-tion vendor to review the results, calling out the onesthat need fixing and getting them fixed. Geopoliticalissues can be dealt with in a similar way. We maintainlists of words or phrases that are geopolitical on a perlanguage basis, and we can run them through thesame system that we use for legal quality.
Adding the language dimensionOver the last 10 years the amount of languages welocalise into at Microsoft has seen a dramaticincrease. When I started as a localiser in 1996 weprobably localised into around 15 languages, now weare getting closer to 100, if not exceeding this num-ber. This pattern seems to be repeating itself withinthe industry as a whole. The way we approach local-isation changes with the addition of more and morelanguages. Approaches that would previously havebeen too costly start to become viable. Likewise, cer-tain approaches become possible that before wouldhave been impossible. That is the topic of this sec-tion. We also, conveniently, enter the newer and mostexciting or promising areas of localisation innovationhere. Whereas there are innumerable examples relat-
7

Localisation Focus Vol.7 Issue 1The International Journal of Localisation
ing to the last two sections, here there are fewerexamples and, of the examples that there are, somemay be rather theoretical.
In the previous section I touched upon runningqueries against a target language and source language(US), to find product names and copyright issues.With the addition of the language dimension smarterqueries can be run that look across multiple lan-guages to find patterns. If nine out of ten languagesturn out to start or end with a certain sequence ofcharacters, or if for example the word Microsoftappears in nine out of ten, then there is good reasonto assume that it should be in the last language aswell, it becomes a pattern that triggers an exceptionfor evaluation. The return on investment (ROI) oncreating various different rules obviously goes upwith more languages added, so this is a space that isopen for creativity.
One thing you can systematically look for is truerepeated strings. Quite often, just because two USstrings are identical one cannot assume they carry thesame meaning, Open can be the imperative, as in thecommand Open the door. It can also be the infini-tive, to Open, and the two are translated differentlyfor most languages. But if the strings are the same forUS and nine out of ten localised languages, then thedeviation for the tenth language is probably an error.Going further, one could for all languages after, forexample, the tenth language simply remove identi-fied repeats and only have them translated once perlanguage.
Another effort that we have invested in is tweakingour pseudo localisation engine, so that it understandsand adheres to our LocVer rules. That means we onlyever find the same issue once, since the pseudolocalised strings won't break the rules we havealready added. Pseudo localisation on various differ-ent languages is therefore a key part of our strategy.The question becomes "what further testing needs tobe carried out on fully localised languages?" Figuringthis out involves analysing exactly what kind of test-ing needs to be performed on the actual languagesthemselves, and that means analysing the localisationmodel.
The localisation model in this context is the variousprocesses that are applied to get from the US Englishsource files to the localised files. Each process needsto be analysed to figure out what error sources theprocess can introduce and what error sources are sys-tematically prevented. For each error source identi-
fied that requires testing to revisit the various lan-guages, the challenge is to identify a solution that cansystematically fix the root cause of the issue so thatthe need to test the various languages is kept to aminimum or eliminated in certain instances. DAL(Dynamic Auto Layout of dialogs) for example may,implemented correctly, mean that it won't be neces-sary to review each localised dialog, but rather a sub-set, or just the pseudo dialog depending on confi-dence levels. These confidence levels are subjectiveand based on experience.
Similarly, we have introduced a systematic way ofassigning hotkeys, so that the assignment of hotkeysper language is really a matter of running a set ofscripts at a chosen moment. This is accomplished bybuilding up a list of all resources with hotkeys andwhere they appear. Building up that list is complicat-ed, it is partially populated through the use of auto-mated trawler tools that identify which resourcesbelong to which dialogs, but it can also be populatedor improved upon through manual entries. So theprocess is a bit costly. With the lists populated we canthen run a tool on a per language basis that knowswhich characters can be assigned hotkeys per lan-guage, and that can resolve hotkey conflicts includ-ing dealing with resources that appear in multipledialogs or menus.
Other concerns that need to be addressed are thebehaviour of the product with various code pages. Soone thing that is possible is to group languages underANSI code pages and test a representative from eachcode page exhaustively. Again, getting full Unicodefrom scratch would be an advantage of course, butfailing that this approach can drive down cost.
With all of the above implemented, or parts of it, onecan evaluate the approach to testing. Engineering arein a position to guarantee that testing only ever needsto find an issue once, and engineering can guaranteethat it will systematically be fixed across all lan-guages with no further test need for verification. Thatin turn can facilitate moving away from very specif-ic test cases to higher level Test DesignSpecifications. This is helped by the fact that thetesters, assuming you use the same testers for all lan-guages, gradually build up a better understanding ofthe tested product and the type of localisation bugsthat appear. So rather than executing very specifictest cases step by step, overall quality can beimproved at a reduced cost by having the testers testfeatures with some high level guidelines that leadthem through the features but are still much more
8

Localisation Focus Vol.7 Issue 1The International Journal of Localisation
abstract than specific test cases. The result will bethat the tester for each language will go through afeature based on his or her high level of understand-ing of this feature, and since the tester is not follow-ing a strict script we can count on a degree of varia-tion or randomness to be introduced in the ways thevarious languages are tested. The introduced random-ness that this brings adds value to the process,because through the testing of various languages,pseudo or real, the randomness introduced willensure better overall test coverage as compared tostrictly exercising the same test paths per language.
We saw an example of this in a recent Office releasecycle. We had a test case that stipulated the compari-son of two files, and included the two files as part ofthe test case. One tester chose to compare two filesthat were already on disk rather than take the twosupplied for this test case and as a result uncovered abug that for several languages had not been found.All of the above efforts should mean that the test andengineering cost per language can be reduced. In anideal world the cost of adding an extra languageshould get close to the cost of the pure translation;realistically in our case we have not achieved that,but we have definitely seen dramatic cost reductions.It is difficult to give exact savings numbers, due to anumber of factors such as the difficulty in calculatingthe savings of a bug that has been avoided and alsobecause we have introduced these efficiencies gradu-ally, and in some cases are still working on fullyintroducing them. But to give an idea of the impor-tance of this, the group that I work in is requested tomake serious savings version on version, and this isone of our favourite hunting areas for those savings.
Controlled English and Machine TranslationAnother benefit of localising into many languages isthat more structured approaches within the area ofcontrolled English and Machine Translation (MT)become feasible. So at some stage it makes sense touse controlled English or elements of controlledEnglish, starting with simple checks on sentencelength and verbs in passive tense and moving on fromthere.
Machine translation is trickier. There is no standardemerging in the MT space to automate translation inan intelligent way. Also, most MT engines go fromEnglish to another language, but much more can begained with an effort that translates between closelanguage pairs, for example Iberian Portuguese andBrazilian Portuguese, or Norwegian Bokmål andNorwegian Nynorsk. The localisation verificationmodels can ensure that rules are not broken and costcan be reduced, although an initial investment isneeded. As an alternative to full MT, automatedtransliteration can be considered from some lan-guages for language pairs that are closely related.
ConclusionThere is no substitute for a well engineered productin the first place. Any bullet-proofing that can bedone within the code is of course preferred. In thereal world there will however always be limitationsto the upstream efforts, and that is what we are look-ing at here.
FIGURE 3: EVOLUTION AND RETURN ON INVESTMENTOF VARIOUS APPROACHES
9

Localisation Focus Vol.7 Issue 1The International Journal of Localisation
Figure 3 illustrates the evolution and the return oninvestment of the various approaches. The further tothe right the greater the impact, but this doesn't meanthat single resource rules are not valuable, just thatthey are rather costly in comparison to the otherapproaches.
The above sections have outlined a graduatedapproach to systemically capture and fix issues whena product is being localised into an increasing num-ber of languages. We began by looking at approach-es to individual strings. This is often a necessaryapproach in functional bug fixing and prevention,and on the positive side it means that we only everhave to catch a specific issue once, and we can thensystematically ensure that, should the issue occur inother languages, an error will be raised and we candeal with the issue manually or automatically. Thedownside to this approach is that it necessitates eitheran inspection of all resources, where certain kinds ofissues cannot be found, or that the issue is identifiedas a bug at some stage in a language. The other down-side is the actual cost of running a system like this;depending on the thoroughness applied the cost canbe quite severe.
A system where the rules are generic is therefore pre-ferred, but will never be able to cover everything.The advantages of the generic rules are that they look
for identifiable patterns and automatically applywhen a pattern is identified. Therefore, new stringsthat conform to the same patterns, for example %1 asa placeholder, are automatically covered as soon asthey are added. String changes, the addition orremoval of placeholders, will automatically be cov-ered, and the management overhead is dramaticallyreduced in comparison to the single resource rules.Similar benefits of scale can be achieved in the legaland linguistic space through the use of SQL typequeries.
Finally, with the addition of multiple languages pat-tern recognition across languages becomes interest-ing. Certain types of errors become much easier todetect, and things like controlled English make itpossible to ensure a higher end localisation quality(because the localisable text is less ambiguous).
It is therefore possible to use the fact that a product islocalised into many languages to systematically dealwith some issues, to apply learning across the lan-guages that can help raise the overall quality of theproduct, and to drive down the cost of testing and bugfixing. This approach has the potential to break, whatis often, otherwise, a linear dependency between thenumber of languages you localise into and the totalcost of bug fixing and testing.
10

Localisation Focus Vol.7 Issue 1The International Journal of Localisation
11
Productivity and quality in the post-editing of outputs from translation memories and machine translation
Ana Guerberof ArenasPhD programme in Translation and Intercultural Studies
Universitat Rovira i Virgili, Tarragona, [email protected]
Abstract Machine-translated segments are increasingly included as fuzzy matches within the translation-memory systemsin the localisation workflow. This study presents preliminary results on the correlation between these two types ofsegments in terms of productivity and final quality. In order to test these variables, we set up an experiment witha group of eight professional translators using an on-line post-editing tool and a statistical-based machine transla-tion engine. The translators were asked to translate new, machine-translated and translation-memory segmentsfrom the 80-90 percent value range using a post-editing tool without actually knowing the origin of each segment,and to complete a questionnaire. The findings suggest that translators have higher productivity and quality whenusing machine-translated output than when processing fuzzy matches from translation memories. Furthermore,translators' technical experience seems to have an impact on productivity but not on quality.
Keywords: Translation memory, machine translation, post-editing, revision, productivity, quality, errors, editing,professional translators, experience, fuzzy match, processing speed, localisation
IntroductionNew technologies are creating new translationprocesses in the localisation industry, as well aschanging the way in which translation is paid for. Inthe past, translation involved precisely that, the trans-lation of entire software, documentation and helpmaterials into new target texts for the local markets.As localisation matured, translation memories (TM)were created and texts were recycled in different butrather similar projects. Productivity increased andconsequently prices of translations decreased. Sincethe 1980s, machine translation (MT) technology hasimproved significantly and has been incorporatedinto the localisation workflow as another type oftranslation aid, rather than attempting to have a fullyautomatic high-quality translation. It remains to beseen what effect this technological development willhave on pricing structures. Major software development companies now pre-translate source text using existing translation mem-ories and then automatically translate the remainingtext using a machine-translation engine. This"hybrid" pre-translated text is then given to transla-tors to post-edit. Following guidelines, the translatorscorrect the output from translation memories andmachine translation to produce different levels ofquality. Gradually this activity, post-editing, isbecoming a more frequent activity in localisation, as
opposed to the full translation of new texts.
In an industry that moves so rapidly, there is morefocus on finalising projects than on the process itself.Therefore these translation aids are used in the local-isation workflow with limited data to quantify theactual translation effort and the resulting quality afterpost-editing. Since productivity and quality have adirect impact on pricing, it is of capital importance toexplore that relationship in terms of productivity andquality of the post-editing of texts, coming fromtranslation-memory systems and machine-translatedoutputs, in relation to translating texts without anyaid.
In this context, it seems logical to think that if prices,quality and times are already established for TMsaccording to different level of fuzzy matches then weonly need to compare MT segments with TM seg-ments, rather than comparing MT output to humantranslation. Therefore, once the correlation is estab-lished, the same set of standards for time, quality andprice can be used for the two types of translation aid.
Preliminary premisesAfter a study by Sharon O'Brien (2006) where sheestablishes a correlation between MT segments andTM segments from the 80-90 percent category of

Localisation Focus Vol.7 Issue 1The International Journal of Localisation
fuzzy match, we formulated our initial hypothesis.This one was that the time invested in post-editingone string of machine translated text will correspondto the same time invested in editing a fuzzy matchedstring located in the 80-90 percent range. Thishypothesis is predicted on the assumption that theraw MT output is of reasonable quality according tothe Bleu Score (Papineni et al 2002, p. 311).
Measuring productivity on its own, as in our firsthypothesis does not make sense if it is not done inrelation to an equal level of final quality. If the timenecessary to review MT segments is greater than thetime necessary to review New or TM segments, theproductivity gain made during the translation andpost-editing phase would be offset by the reviewphase. Therefore, we claimed that the final quality ofthe target segments translated using MT is not differ-ent to the final quality of New or TM segments.
Localisation has a very strong technical componentbecause of the content as well as the tools required.On many occasions we associate technical compe-tence with speed, that is, the more tools we use themore automated the process becomes and the lesstime we spend completing a project. Therefore, ourthird hypothesis claimed that the greater the techni-cal experience of the translator, the greater the pro-ductivity in post-editing MT and TM segments.
MethodologyIn order to prove our hypotheses we carried out anexperiment with nine subjects. One subject carriedout the preliminary test and the remaining eight per-formed the actual pilot experiment. The translatorsused a web-based post-editing tool to post-edit andtranslate a text from English into Spanish. The texthad 791 words; 265 words of new segments (new textto translate), 264 words of translation-memory seg-ments (Trados was used to create the fuzzy matches)and 262 words of machine-translated segments(Language Weaver's statistical-base engine was usedto create the output). We selected a supply-chain soft-ware product for the corpus as we wanted to use typ-ical content from the localisation industry. At the endof their assignment, the subjects filled in a question-naire with information related to the pilot experimentand their own experience in the field. The final out-put was then revised, errors were counted and con-clusions drawn.
12
Experiment designTranslatorsWe contacted a group of nine professional transla-tors, five women and four men, with ages rangingfrom 22 to 46 years. They all have first degrees orMaster’s Degrees in Translation. Their experienceranges from 1 year to more than 10 years in the trans-lation industry and most have specific experience inlocalisation. They were contacted by email in allcases and they received no training to carry out thepilot experiment, only a set of instructions. The trans-lators were not paid for the work that they carried outand although they knew the work was for research,and they might have inferred from the tool that theresearch dealt with machine translation, they werenot given any specific information on the topic. Dueto the fact that they were professional translatorsworking for a short period of time and that they knewtheir work would be part of a research project, wewould assume they maintained their usual workingstandards.
Training the engineWe provided Language Weaver with a translationmemory containing 1.1 million words and a coreglossary. They then created a customized engineusing the relevant translation memories and a validat-ed terminology list. Finally, they uploaded these seg-ments into the post-editing tool.
Creating the translation memory segmentsFor our research we needed to create a file containingsegments in the 80-90 percent category to feed theselower fuzzy matches into the tool. To prepare the file,we pre-translated existing html files from a help proj-ect of the supply-chain software with a previousmemory in order to obtain fuzzy matches using theoption Pre-translate in SDL Trados (version 7.1). Wecreated ttxs files with different fuzzy match values.We then exported all segment pairs together withtheir corresponding fuzzy level (54, 75, 86 and so on)to Excel. This was done with a small tool createdspecifically for this purpose called Slicer.
Since we only needed a small number of words andnot all of the segments, we randomly selected a num-ber of segments from each category using the func-tion Random.between in Excel. This gave us thedesired number of segments in a random selection.
Post-editing toolThe translators were able to connect to the post-edit-ing tool online. They could then translate/post-edit

Localisation Focus Vol.7 Issue 1The International Journal of Localisation
the proposed segments of text without knowing theirorigin (MT, TM or New segments) and the tool meas-ured the time taken in seconds for each task. Thepost-editing tool required the translator to log on witha specific user name and password, so each translatorcould only see the text assigned to them. Once theyopened the task, they were presented with a screencontaining the actual task as seen in Figure 1.
FIGURE 1: WEB-BASED TOOL FOR POST-EDITINGTASKS
The Source window contained the source text inEnglish, and the Target window contained either ablank screen or a proposed text in Spanish. TheSpanish text was either a MT or TM segment. Oncefinished with a string, the translator had to click onthe Get Next button and proceed with the followingsegment until they had reached the end of the assign-ment.
QuestionnaireThe aim of the questionnaire was to define the trans-lators' experience in localisation, tools, subject matterand post-editing MT. The questionnaire consisted of17 questions that addressed these areas. It containeddichotomous questions, questions based on level ofmeasurement and filter questions. The main aim ofthe questionnaire was to describe the group of trans-lators and establish their experience in localisation,supply chain, knowledge of tools, and post-editingMT, as well as gather their views on MT. We matchedthe answers from the translators to the processingspeed from the tool and the number of errors in thefinal sample.
Quality of the samplesThe final target texts were checked to see the numberof final errors in each sample. This could give us anindication of productivity versus quality. If translat-
13
ing with an aid was faster than the human translation,but there were more errors, then more time would beneeded in a final review phase, thus altering the realtranslators' productivity.
We used LISA standards to measure and classify thenumber of errors. We classified the errors accordingto their source (New, MT or TM segments) to see ifeach category had similar number of errors. We clas-sified errors according to type to see their frequencyin each type of segment. Lastly, we matched theerrors with the productivity by means of a coefficientof error based on the average revised word perminute.
ResultsProductivity
Processing speedProcessing speed is the processing time in relation tothe words processed in that time, that is, words divid-ed by time. The number of words was almost identi-cal in the three categories, New (265 words), MT(262 words) and TM (264 words) consequently ourprocessing times and processing speeds were notnotably different. The results are given in Table 1. Wehave highlighted in bold the maximum and minimumvalues per segment category.
Translator New MT TMTR 1 12.12 18.69 14.52TR 2 10.76 10.28 10.75TR 3 22.08 21.21 16.40TR 4 8.55 9.79 10.22TR 5 5.85 12.04 8.18TR 6 8.11 9.12 8.08TR 7 20.03 20.77 18.48TR 8 7.42 8.96 10.47
TABLE 1: TRANSLATORS' PROCESSING SPEED INWORDS PER MINUTE PER SEGMENT CATEGORY
This table shows that four out of eight translators per-formed faster using MT (TR 1, TR 5, TR 6, and TR7), two were faster translating New segments (TR 2and TR 3), and two were faster processing TM seg-ments (TR 4 and TR 8). In total, six were faster usinga translation aid than translating without any aid.Only TR 2 shows the slowest processing speed whenusing MT by quite a small margin in comparison toNew or TM segments.

Let us have a look at the statistical summary:
Translator New MT TMMean 11.87 13.86 12.14Median 9.66 11.16 10.61Std. Deviation 6.02 5.40 3.87Max 22.08 21.21 18.48Min 5.85 8.96 8.08Range 16.23 12.25 10.411st Quartile 7.94 9.62 9.713rd Quartile 14.10 19.21 14.99Diff quartiles 6.16 9.59 5.28
TABLE 2: STATISTICAL SUMMARY OF PROCESSINGSPEED
Table 2 shows, in bold, that translators process, onaverage, more words per minute in MT than in TM orNew segments and that they process, in turn, morewords in TM than in New segments. All the same, thestandard deviation is extremely high, 6.02 for Newsegments, 5.4 for MT and 3.87 for TM. For example,the range of variation (seventh row) between themaximum and minimum values is 16.23 words inNew segments, 12.25 in MT segments and 10.41 inTM segments. Hence the mean, as a unique value is,not a fully representative number for the data shownhere. The median for all the values, in bold, tells usthat MT continues to be faster than human translation(approximately 16 percent) and faster than using TM(approximately 5 percent). The first quartile (eighthrow) shows that processing TM segments is fasterthan processing New or MT segments, only 1 percenthigher than MT, and in turn MT is faster than pro-cessing New segments, by approximately 21 percent.In this case, the quartile analysis shows that the trans-lators that process fewer words per minute have ahigher correlation between TM and MT than thegroup that processes more words. The second quar-tile, equivalent to the median, shows that MT is fasterthan New and TM segments, although the differencebetween MT and TM values is not very pronounced.In the third quartile, ninth row, we see that the speedfor New segments and TM is extremely close, whileMT is definitely faster. The difference between thefirst and third quartile, tenth row, shows us that thereare pronounced differences, especially in MT with9.59 words difference, then in New with 6.16 and inTM with 5.28 words.
Productivity gainThe productivity gain is the relationship between thenumber of words translated per minute per singletranslator without any aid and the number of words
Localisation Focus - The International Journal of Localisation Vol.6 Issue 1
14
translated per minute by the same translator with theaid of a tool, TM or MT. This value is expressed as apercentage value.
In Table 3 we see the statistical summary regardingproductivity gain:
Translator MT vs. New TM vs. NewMean 25% 11%Median 13% 10%Std. Deviation 37% 23%Max 106% 41%Min -4% -26%Range 110% 67%1st Quartile 2% -2%3rd Quartile 29% 25%Diff quartiles 27% 27%
TABLE 3: STATISTICAL SUMMARY OF PRODUCTIVITYGAIN
The mean values in MT and TM in relation to Newsegments show us that translators have a higher pro-ductivity gain if they use a translation aid. The gainwas higher in MT segments than in TM segments,with 25 and 11 percent respectively. Nonetheless, thestandard deviation is extremely high and the range ofvariation is very pronounced. The median value, inbold, shows that MT has a higher productivity gain(13 percent) but that the difference with TM is notvery pronounced (10 percent). In the first quartile,eighth row, the productivity gain provided by thetranslation aid, MT or TM, is not very pronounced,and relatively similar (4 percent variance). Still theproductivity gain for TM is negative, indicating adecrease in productivity. This quartile includes TR 2,TR 3, TR 7 and TR 6. In the third quartile, the pro-ductivity gain for both MT and TM is higher (29 and25 percent respectively). This quartile includes TR 4,TR 5, TR 8 and TR 1. The highest productivity gain,if we take the statistical values, never goes over 29percent (third quartile using MT). We should remarkthat the values in the quartiles correspond partly tothe faster and slower translators and this seems toindicate that faster translators take less advantage oftranslation aids than do slower translators.
Quality
Existing errors and changes in MT and TMBefore we looked at the errors found after the assign-ment was completed, we needed to look at the num-ber of errors and corrections existing in the MT andTM segments before the pilot took place. Otherwise,

Localisation Focus Vol.7 Issue 1The International Journal of Localisation
if we found that one category, MT or TM, containedmore errors than the other, it would have been logi-cal, although not necessarily true, to assume thatthere would be more errors after the assignment wascompleted in that same category. Similarly, we clas-sified the errors found using the LISA standard andwe had identified the number of changes that werenecessary to perform in the TM segments.
The TM segments contained 1 Mistranslation, 1Accuracy, 1 Terminology and 2 Language errors.These five errors came from the legacy material usedto build the translation memory and were thereforemade by human translators. There were 17 changesneeded in the text. These changes were text modifica-tions, insertions and deletions between the originalsource text and the new source text. This meant thatthere were 5 existing errors and 17 changes to makein the TM segments.
On the other hand, the MT segments contained 25Language and 2 Terminology errors, a total of 27existing errors in the MT segments. The typical errorsfound in MT output were wrong word order, gram-mar mistakes (concordance of verb and subject, con-cordance of genre) and inconsistent use of upper andlower cases. There were also a couple of cases wherethe MT engine chose the wrong term for the cotextgiven.
A priori, the number of existing errors and changes inTM versus the ones in the MT segments was verysimilar: 22 in the TM segments versus 27 in the MTsegments, and this meant that the source text shouldnot necessarily condition the final target text. Theactual process needed to correct the texts was differ-ent in our view. This was due to the fact that the TMsegments, on the one hand, needed insertions,changes and deletions where it was necessary to con-stantly refer to the source text, as well as 5 "standard"errors where the main reference was the target text.On the other hand, MT errors involved mainly lan-guage changes that were quite distinct and where aconstant reference to the target text was necessarybecause they involved changing the word order, useof verb tenses, use of upper and lower cases and con-cordance of number. This difference in the requiredpost-edit approach could mean different results in thefinal text depending on where the focus was whentranslators were working on the target text. It isimportant to mention at this point that translators didnot know the origin of the segments (MT or TM) andobviously if these segments were full (100 percent)or fuzzy matches (54-99 percent).
Error analysisWe used the LISA form in the eight samples and wecounted the errors according to its classification andaccording to the type of segment in order to comparethe results. The classification of errors was carriedout by the researcher mainly due to time and budgetlimitations and also because the researcher had exten-sive experience in reviewing these type of texts inthis language combination. The texts were correctedand then compared against each other to assure thatthe same classification criteria were followed in alltexts.
Table 4 shows the final number of errors per transla-tor according to the type of segment, and the totalnumber of errors. The table is sorted according toascending total errors. Totals are highlighted in bold.
Translator New MT TM TotalsTR 3 1 1 4 6TR 2 2 3 6 11TR 4 2 5 6 13TR 1 2 3 10 15TR 6 4 5 8 17TR 8 6 3 9 18TR 7 7 5 9 21TR 5 3 9 13 25Totals 27 34 65 126
TABLE 4: NUMBER OF ERRORS PER TYPE OFSEGMENT AND TRANSLATOR
Table 4 shows that all segment categories containerrors, and all translators have errors in all categories.There are a total of 126 errors in the final texts. Atotal of 27 errors are found in the New segments and99 in the combination of TM and MT segments.Translators did not have the possibility, when usingthe tool, to go back and correct their own work andthe segments have not been reviewed by a third party.We nevertheless see that in all eight cases there aremore errors in TM segments than in any other cate-gory. In five out of eight cases, there are more errorsin MT than in New segments (TR 1, TR 2, TR 4, TR5 and TR 6); in two cases (TR 7 and TR 8) there aremore errors in New than in MT segments; and in onecase there is an equal number of errors in both Newand MT (TR 3).
The first striking result is that the number of errors inTM segments (65) is 141 percent higher than that ofthe New segments (27) and 91 percent higher thanthat of the MT segments (34). MT segments, on theother hand, contain 26 percent more errors than New
15

Localisation Focus Vol.7 Issue 1The International Journal of Localisation
segments. We find that the number of errors in TMsegments is consistently higher in all eight caseswhile the errors for New and MT segments varyamong the subjects.
Errors per typeWe have analysed how errors are distributed accord-ing to the LISA standard to see if the typology oferrors varies depending on the type of source text, inorder to understand if the type of text has an effect onthe number of errors. We can see this analysis inTable 5:
Type of error New MT TM Totals % New % MT % TM % TotalMistranslation 10 2 8 20 8% 2% 6% 16%Accuracy 9 14 34 57 6% 11% 27% 44%Terminology 2 9 9 20 2% 7% 7% 16%Language 6 8 14 28 6% 6% 11% 23%Consistency 1 1 0% 1% 0% 1%Totals 27 34 65 126 21% 27% 52% 100%
TABLE 5: NUMBER AND PERCENTAGE OF ERRORS PERTYPE OF ERROR
There are 57 Accuracy errors that represent 44 per-cent of the total number of errors (almost half of theerrors), and 34 of them, that is 27 percent of all theerrors, are found in the TM segments. There are 9Accuracy errors in New segments and 14 in MT, rep-resenting 6 and 11 percent respectively. One possibleexplanation for this number of errors in the TM seg-ments could be that when translators are presentedwith a text that flows "naturally" like a human trans-lation they seem to pay less attention to how accuratethat sentence is. On the other hand, because errors inMT segments are so obviously wrong, the mistakesseem to be easier to detect. As we explained above,most of the changes in TM required the translator tolook at the source text and not just focus on the pro-posed target. The fact that the TM segments have somany errors could be explained by the fact that trans-lators possibly consulted the source text less thanthey would have if they had been translating a newtext with no aid. We have seen in previous studiesthat monolingual revision is less efficient than bilin-gual revision (Brunette et al. 2005), that there is atrend towards error propagation in the use of TMs(Ribas 2007), and that using TMs increased produc-tivity, but "translators using TMs may not be criticalenough of the proposals offered by the system"(Bowker 2005, p.138) and they left many errorsunchanged.
In our study there are 29 Language errors that repre-
sent 23 percent of the total number of errors: 14 ofthem, that is 11 percent, are found in TM segmentswhile 6 and 8 (6 percent) are found in New and MTsegments respectively. We see again in this case thatthe TM contains the most errors and, again, this couldbe due to the reasons explained above: when transla-tors are provided with a text that flows naturally theyseem to accept the segments as they are without ques-tioning the text correctness. It is true that some errorscould have been spotted on a second review, but wecan say that errors in TM were not as frequently spot-ted as the ones in the MT segments.
16
From the 20 mistranslation errors, 10 are found in theNew segments, representing 8 percent of the total, 8errors are found in TM and only 2 mistranslationerrors are found in MT representing 6 and 2 percentrespectively. The fact that there are so few mistrans-lation errors in MT segments might indicate thatusing MT helps translators clarify possibly difficultaspects of the source texts thus improving generalcomprehension of the text.
From the 20 Terminology errors, only 2 are found inthe New segments as opposed to 9 in both MT andTM segments. This seems to indicate that translatorstend to consult the existing glossaries more whenthey are presented with new texts, rather than ques-tioning the proposed terminology used in MT andTM. It might be logical not to check terminology in apre-translated text, but terminology is not always cor-rect in TM and MT outputs due to updates andchanges in existing terminology. This indicates thatinstructions should be provided to reviewers or trans-lators to specifically check glossaries or, alternative-ly, terminological changes need to be made directlyto the TM or MT before the translation processbegins.The consistency error found in the MT segments thatrepresent 1 percent of the total is related to the incon-sistent use of upper and lower cases and it is a reflec-tion of a known issue in MT output. We would ven-ture that if the translators had received specificinstructions on output error typology, this errorwould have been corrected.

Localisation Focus Vol.7 Issue 1The International Journal of Localisation
Errors vs. productivityWe have established that an increase in productivitycannot be considered in isolation from the quality ofthe samples. So how does the number of errors foundin the samples affect the overall productivity of thetranslators? Can we say that using MT or TMdecreases or increases the productivity of a translatortaking into account the final errors? To find ananswer to these questions, we decided to penalisetranslators in their processing speed according to thenumber of errors made. To do this, we calculated ageneral coefficient of error to be used as a form ofpenalty (or correction) in words per minute and thenwe applied this coefficient to the processing speed ofthe eight subjects in order to see the impact of errorson the productivity gain.
Calculation of the error coefficientWe realised that the best way to determine the errorcoefficient would be to measure the reviewing timeof these segments in a standard revision process by athird party. In this case, because the review is not partof the scope of this study, we took the metrics usedfor reviewers of localisation texts; approximately7500 words per day (this figure may be higher orlower depending on the metric used by each individ-ual localisation agency). With this figure in mind, weestablished that a reviewer reviews 0.26 words perminute (if we took a higher figure the value would beof course higher). We took the number of errors pertranslator and we applied the coefficient of error foreach source of error and then recalculated their pro-cessing speeds, thus obtaining a final figure thatreflected the impact of errors on their processingspeed.
Once we had the new processing speeds for all trans-lators, we recalculated the productivity gain compar-ing the different categories in order to see the impacton productivity that the errors might have had in aworking environment. Negative values are highlight-ed in bold.
Translator Total processing MT vs. New TM vs. Newspeed
TR 1 41.43 54% 3%TR 2 28.93 -7% -10%TR 3 58.53 -4% -30%TR 4 25.18 6% 8%TR 5 19.57 91% -5%TR 6 20.89 11% -15%TR 7 53.82 7% -11%TR 8 22.17 40% 39%
TABLE 6: TRANSLATORS' PRODUCTIVITY GAIN MINUSCOEFFICIENT OF ERROR
In Table 6, MT is still faster than translating with noaid in six out of eight subjects (TR 1, TR 4, TR 5, TR6, TR 7 and TR 8). The other two subjects (TR 2 andTR 3) have a negative value. This value has increasedfor TR 2 and remained stable for TR 3 (who made anequal number of errors in MT and TM categories),and in both cases the negative value is never below 7percent. TR 4, TR 6 and TR 7 show a positive valueof around 10 percent. On the other hand, TR 1, TR 5and TR 8 show a positive value above 40 percent.Even if errors are considered, using MT is still moreproductive than no aid at all.
If we look now at the productivity gain of TM, thechanges are more pronounced. Five out of eight caseshave a negative productivity when compared to Newsegments (TR 2, TR 3, TR 5, TR 6 and TR 7), and infour cases the negative value is equal to or belowminus 10 percent. In the case of TR 3, the value goesdown to minus 30 percent. In two other cases (TR 1and TR 4) TM brings a slight productivity increasewith 3 and 8 percent respectively. Only the remainingcase (TR 8) seems to have a pronounced productivi-ty increase, with 39 percent. If errors are considered,using TM fuzzy matches (80-90 percent) does notappear to be productive when compared with trans-lating without any aid.
In brief, if we consider errors when calculating theproductivity gain, we see that although MT seems toplay an important role in increasing productivity inmost cases, TM has the opposite effect. It is impor-tant to remark here that we are referring to segmentsthat belong to the 80-90 percent category of fuzzymatch and not TM segments that include all levels ofmatches. It could well be that this translation memo-ry as a whole provides a productivity increase fortranslators. But the 80 to 90 percent category of fuzzymatches does not appear to do so, and this is remark-able if we consider that these segments tend to bepaid at 60 percent of their value (the global priceincluding review), thus assuming a 40 percent pro-ductivity gain, and that this productivity was notachieved by any of our translators when errors areconsidered.
Table 7 shows the statistical summary of the new pro-ductivity gain. Mean and Median values are high-lighted in bold.
17

Localisation Focus Vol.7 Issue 1The International Journal of Localisation
Translator MT vs. New TM vs. NewMean 25% -3%Median 9% -8%Std. Deviation 34% 20%Max 91% 39%Min -7% -30%Range 98% 68%1st Quartile 3% -12%3rd Quartile 43% 4%Diff quartiles 40% 16%
TABLE 7: STATISTICAL SUMMARY OF PRODUCTIVITYGAIN MINUS COEFFICIENT OF ERROR
The correlation between MT and TM in relation toNew segments shows that translators have a higherproductivity gain if they use MT but a negative pro-ductivity gain if they use TM (80-90 percent match-es). The range of variation is very pronounced (TR 5has a value of 91 percent as opposed to TR 2 who has-7 percent). If we take the mean values, in bold, wesee that MT has a productivity gain of 25 percentwhile TM presents a negative value of minus 3 per-cent in comparison to the previous positive value of11 percent. The median values for both MT and TMhave changed from 13 to 9 percent in MT and from10 to minus 8 percent in TM. The first quartile showsthat the productivity gain provided by MT is smallwith just 3 percent and negative in the TM withminus 12 percent. In the third quartile, the productiv-ity gain for both MT and TM is positive (43 and 4percent respectively).
Technical experienceOur third hypothesis claimed that the greater thetechnical experience of the translator, the greater theproductivity in post-editing MT and TM segments.The first question that comes to mind is "What doestechnical experience mean?" We are aware that theterm embraces several aspects of a translator's com-petence. For the purpose of this study we havedefined technical experience as a combination ofexperience in localisation, in knowledge of tools, insubject matter (in this case supply chain), and in post-editing of machine translated output.
We obtained this data from the questionnaire that wasprovided to the translators at the end of the assign-ment. This data was then contrasted with the transla-tors processing speed and number of errors to see ifthere was a correlation between technical experience,processing speed and errors. We took the processingspeed as a result of the experiment without includingthe coefficient of error because we analyzed the
errors separately. We took the mean in the processingspeed as the number of subjects was smaller than inthe productivity section, in the sense that all subjectswere grouped according to experience thus decreas-ing the number of subjects per group, and the meanand median obtained were in most cases the samevalue.
The fact that the group was small and that the dataobtained in terms of processing speed was dispersedmade drawing final and general conclusions on anycorrelation between technical experience and produc-tivity difficult. Nevertheless, we think it was neces-sary to correlate the processing speed obtained fromthe post-editing tool, errors and the questionnaire,even if it served only to test our methodology.
Summary data on translators' experienceTo summarize: data that includes experience in local-isation, knowledge of tools, supply chain and post-editing, we singled out the translators that showedmore experience in all of the above sections. Thetranslators that declared having more experience inthe four areas were TR 3, TR 4, TR 5 and TR 7. Thetranslators with less experience were TR 1, TR 2, TR6 and TR 8. We took the mean value for each groupof translators in relation to the processing speed andnumber of errors. Table 8 shows these results:
Processing speed Number of errorsExperience New MT TM New MT TM
More 14.13 15.95 13.32 3.25 5.00 8.00
Less 9.60 11.76 10.95 3.50 3.50 8.25
TABLE 8: OVERALL EXPERIENCE VS. PROCESSINGSPEED AND NUMBER OF ERRORS
The table shows that experience has a clear effect onthe processing speed. The experienced group is fasterthan the group with less experience. We can see thatthe faster group is faster when working with MT thanwith New segments and TM (in this order). The slow-er group is also faster when working with MT seg-ments than with TM and finally with New segments.The translators with less experience seem to makebetter use of both translation aids than the ones withmore experience. Additionally, we see that the trans-lators with no experience have very similar process-ing speeds for MT and TM segments (as we claimedin our first hypothesis).
The total number of errors is slightly higher in theexperienced group than in the one with little experi-ence, by 1 error. The number of errors in MT is high-
18

Localisation Focus Vol.7 Issue 1The International Journal of Localisation
er in the experienced group by a small margin, 1.5errors when compared to New and TM segments.This could be due to the fact that translators withmore experience are more accustomed to MT outputand this familiarity prevents them from seeing veryvisible errors precisely due to this familiarisation.
Final conclusions
Conclusions on productivityConsidering the mean value, the processing speed forpost-editing MT segments is higher than that for TMand New segments. And post-editing TM segments,in turn, is faster than translating New segments. Thedata dispersion is nevertheless quite pronounced,with very high standard deviations and great differ-ences between maximum and minimum values. Thestandard deviation is higher for processing New seg-ments than for processing MT or TM segments whichmight indicate that using pre-translated segmentsslightly standardizes processing speed.
The fastest overall processing time results from trans-lating New segments without any aid, while thetranslator with slowest processing time took advan-tage of MT and TM. This low productivity is morepronounced for TM than for MT. If we look at theproductivity gains, the translators with lower pro-cessing speeds seem to take more advantage of thetranslation aids than the translators with higher pro-cessing speeds. We would need further research toconfirm this trend.
The productivity gain, when compared to New seg-ments, for translation aids is between 13 and 25 per-cent for MT segments, which is higher than the per-centage reported by Krings (2001) and lower than thefigures reported by Allen (2005) and Guerra (2003),and from 10 to 18 percent for TM segments.Our first hypothesis is thus not validated in ourexperiment since MT processing speed appears to behigher when compared to the processing speed in TMfuzzy matches. The correlation between MT and TMis quite close in the groups that processed fewerwords per minute. There exists, however, a pro-nounced difference in the groups that processed morewords per minute, where MT ranks higher. The devi-ation is high, nevertheless, and we cannot draw con-crete conclusions as productivity seems to be subjectdependant. Krings (2001) also found that in measur-ing processing speeds, the variance ranged from 1.55to 8.67 words per minute. Although O'Brien (2006)offers an average processing speed across four sub-jects without mentioning any deviation values she
highlights (2007) that there can be significant indi-vidual differences in post-editing processing speedin-line with these findings.
Conclusions on qualityOverall we can say that there are errors in all transla-tors' texts and errors are present in all three cate-gories: New, MT and TM. This seems to be logical,considering that the tool did not allow the translatorsto go back and revise their work, and that no revisionwork was done afterwards by a third party.
More than half the amount of total errors, 52 percent,can be found in the TM segments, 27 percent in MTsegments and 21 percent in New segments. The highnumber of errors in TM could be explained by thefact that the text flows more "naturally" and transla-tors do not go back and check the source text, theyjust focus on the target text, while the MT errors arerather obvious and easier to spot without having tocheck the source text.
The number of errors in TM is higher than in anyother category for all translators. On the other hand,the number of errors in MT is greater than in Newsegments in five out of eight cases. In two cases,there are more errors in the New than in the MT seg-ments and in one case there is equal number of errors.
Accuracy errors represent the highest number oferrors, 44 percent, and they represent the highestvalue in TM and MT. This seems to indicate thattranslators do not question the TM or MT proposaland do not check the source text sufficiently to avoidthis type of error. Mistranslation errors had the high-est value in New segments, but it is very low in MTsegments. This could indicate that MT clarifies diffi-cult aspects of the source texts, although more data isneeded to explore this trend. Terminology errors arelower in New than in MT and TM segments, indicat-ing that translators tend to accept the proposed termi-nology in MT and TM without necessarily checkingthe terms in the glossaries. This might lead to a rec-ommendation that terminological changes or updatesbe made before starting the translation process or thatthe translators be instructed to check the glossaryoften.
The four fastest translators account for 53 errorswhile the four slowest translators account for 73errors, which might indicate that the fastest transla-tors tend to make fewer errors and vice-versa,although this is not true for all cases. The reasonbehind this difference could be that some translators
19

Localisation Focus Vol.7 Issue 1The International Journal of Localisation
found the assignment more difficult than others, butat any rate this difference does not indicate animproved quality.
When a coefficient of error is applied, based on anaverage review speed per minute, to the processingspeed, productivity decreases for all segments and inparticular for TM segments. This is only applicable tomatches from the 80-90 percent category. MT, on theother hand, presents a productivity increase in rela-tion to translating New segments. The increase ishigher than 7 percent as was presented in Krings'study (2001), and it seems to be located between 9and 25 percent. Krings finds that when comparingexisting errors in the output with actual errors foundafter post-editing, the translators are rated at 3.38 (ina range from 1 to 5) covering almost 80 percent of allthe errors in MT. In our case the difference in errorsbetween New and MT segments is not very pro-nounced, but the errors are quite high in TM seg-ments. As far as we know, other research such asO'Brien (2006), Guerra (2003) and Allen (2003 and2005) does not offer a matrix of final errors and con-sequently we do not really know how increases inproductivity related to the final quality of their sam-ples. O'Brien (2007) mentions the issue of qualityand promises to address the topic in a follow-upstudy. The forthcoming article will be published inthe Journal of Specialised Translation (2009).
The pilot study thus indicates that using a TM with80 to 90 fuzzy matches produces more errors thanusing MT segments or human translation. The reasonbehind this could be that translators trust the contentthat flows naturally without necessarily criticallychecking accuracy against the source text.
Finally, our second hypothesis is not proven true bythe pilot study as our results show that the qualityproduced by the translators is notably different whenthey use no aid, MT or TM, although the number oferrors found in MT segments is closer to those foundin New segments.
Conclusions on translators' experienceIf we consider the results obtained we can say thatexperience has an incidence on the processing speed.Translators with experience perform faster if theaverage is considered. Similar to the findings byDragsted (2004) when comparing the processingspeed between students and professionals, translatorswith less experience in our pilot are slower than theones with more experience. The data on errors is not conclusive, as the difference
between experienced and less experienced translatorsis none or very small. In the summary data on trans-lators' experience, experienced translators have ahigher number of errors in MT and in New segmentswhen compared to the group with less experience.This could be explained by the small number of sub-jects, or the possibility that translators with moreexperience grow accustomed to MT type of errorsand they do not detect them as easily as a "newcom-er" to the field. The translators with less experiencehave more errors in TM but less in MT and New. We could say that our third hypothesis is partiallyproven because translators with greater technicalexperience do have higher processing speeds in bothMT and TM overall. It is important to point out aswell that experience does not seem to have an impacton the total number of errors.
There is a strong need to further explore how newtechnologies are shaping translation processes andhow these technologies are affecting productivity,quality and hence pricing. If translators and the trans-lation community as a whole acquire more knowl-edge about the actual benefits of the tools in realterms, we can be prepared to come into the negotiat-ing arena with the knowledge necessary to reachcommon ground with translation buyers.
ReferencesAllen, J. 2003. "Post-editing". In Computers andTranslation: A Translator's Guide. Harold Somers, ed.Amsterdam & Philadelphia: Benjamins. pp. 297-317.
Allen, J. (2005). "An introduction to using MT soft-ware". The Guide from Multilingual Computing &Technology. 69. pp. 8-12
Allen, J. (2005). "What is post-editing?" TranslationAutomation. 4: 1-5. Available fromwww.geocities.com/mtpostediting/.[Accessed June2008].
Bowker, L. (2005). "Productivity vs Quality? A pilotstudy on the impact of translation memory systems".Localisation Reader 2005-2006: pp. 133-140.
Brunette, L. Gagnon, C. Hine, J. (2005). "The GrevisProject. Revise or Court Calamity". AcrossLanguages and Cultures 6 (1). pp. 29-45
Dragsted, B. (2004). Segmentation in Translation andTranslation Memory Systems. PhD Thesis.Copenhagen. Copenhagen Business School.
20

Localisation Focus Vol.7 Issue 1The International Journal of Localisation
Gow, Francie. (2003). "Extracting useful informationfrom TM databases." Localisation Reader 2004-2005. pp.41-44.
Guerra Martínez, L. (2003). Human Translation ver-sus Machine Translation and Full Post-Editing ofRaw Machine Translation Output. MinorDissertation. Dublin. Dublin City University.
Krings, H. (2001). Repairing Texts: EmpiricalInvestigations of Machine Translation Post-editingProcesses. G. S. Koby, ed. Ohio. Kent StateUniversity Press.
Language Weaver. 2008. Homepage for the languageautomation provider. www.languageweaver.com/home.asp. [Accessed June 2008].
LISA. (2008). Homepage of the LocalisationIndustry Standards Association. www.lisa.org/prod-ucts/qamodel/. [Accessed June 2008].
O'Brien, S. (2006). "Eye-tracking and TranslationMemory Matches" Perspectives: Studies inTranslatology. 14 (3). pp. 185-205.
O'Brien, S. (2007). "An Empirical Investigation ofTemporal and Technical Post-Editing Effort".Translation and Interpreting Studies (tis). II, I
O'Brien, S. Fiederer, R. (2009). "Quality andMachine Translation: A Realistic Objective?".Journal of Specialised Translation, 11.
Papineni, K. Roukos, S. Ward, T. Zhu, W.J. (2002)."BLEU: A method for automatic evaluation ofmachine translation". In Proceedings of Associationfor Computational Linguistic. Philadelphia: 311-318.Also available fromhttp://acl.ldc.upenn.edu/P/P02/P02-1040.pdf.[Accessed June 2008].
Ribas, C. (2007). Translation Memories as vehiclesfor error propagation. A pilot study. MinorDissertation. Tarragona. Universitat Rovira i Virgili.
SDL. (2008). Homepage of SDL Trados 2007.www.sdl.com/en/products/products-index/sdl-tra-dos/default.asp. [Accessed June 2008].
21

Localisation Focus Vol.7 Issue 1The International Journal of Localisation
22
A Comparison of Statistical Post-Editing on
Chinese and Japanese
Midori Tatsumi Yanli Sun
School of Applied Languages and Intercultural Studies
Dublin City University
Dublin 9, Ireland
[email protected] [email protected]
Abstract - This paper analyses both quantitatively and qualitatively the results of a recent Statistical Post-edit-
ing (SPE) experiment on English to Chinese and English to Japanese translations. Quantitatively, it compares the
number of changes resulting from SPE between the two languages; qualitatively, a linguistic analysis of the
changes is conducted. It also investigates the effect of SPE on the fluency and adequacy of the translation as well
as the potential impact on human post-editing effort. Our study indicates that, in general SPE results in more
improvements than degradations in both languages although the linguistic changes are different between the two
languages. In addition, SPE could improve the fluency and adequacy of MT outputs and shorten human post-edit-
ing time in both languages.
Keywords: Statistical Post-Editing, RBMT, SMT, Chinese, Japanese
1 Introduction
None of the Machine Translation (MT) systems that are currently available are good enough to produce error-free
outputs, and as Allen & Hogan (2000) point out, MT errors are likely to recur throughout or across documents.
Therefore, post-editors are often dispirited by the need to make the same correction over and over again (Isabelle
et al 2007: p 255). In order to ease the burden placed on human post-editors, Allen & Hogan (ibid) proposed the
development of an automatic post-editing (APE) module that would automatically repair mistakes in raw MT out-
put by utilising the information on the changes that were made during the post-editing process from “parallel tri-
text (source texts, MT output, post edited texts)” (Allen & Hogan 2000: p 62). Elming (2006) presented the first
results of the use of an APE module to correct the output of a rule-based machine translation (RBMT) system and
it was noted that translation quality increased noticeably in terms of BLEU scores (an automatic machine transla-
tion evaluation metric) (Papineni et al 2002).
The advent of statistical machine translation (SMT) not only presented an entirely new method of machine trans-
lation, but also opened the door to the possibilities of combining two different MT systems to benefit from the
advantages of both. Knight & Chander (1994) proposed to use SMT techniques to learn the mapping between a
large corpus of “pre-postedited” (ibid, p 779) texts with aligned corresponding post-edited text. Simard et al.
(2007a, 2007b) tested and extended this proposal by using a statistical phrase-based MT system to post-edit the
output of an RBMT system. The basic mechanism of this kind of system, which is now often referred to as a sta-
tistical post-editing (SPE) module, is as follows: an SMT system is trained using a set of raw RBMT output and
its corresponding reference text, which is either human post-edited or human translated (training corpora). In this
way, SMT learns how to “translate” raw RBMT output to better quality text. Their experiments showed that this
SPE module could improve the quality of the RBMT output. However, a detailed analysis of the improvements
and degradations of SPE in the previous experiments had not been presented until Dugast et al. (2007) described
their experiment on a combination of Systran and SPE. They evaluated, qualitatively, the changes made by SPE
modules on the output of Systran, including some linguistic analysis such as improvements, degradations and

Localisation Focus Vol.7 Issue 1The International Journal of Localisation
23
equivalent effects. However, as with most of the previous studies, their study was only conducted on European
language pairs. Until recently, little research has been done on the effect of SPE on Asian languages such as
Chinese and Japanese.
One such instance of this research is an experiment conducted in 2008 by Systran and Symantec (Senellart &
Roturier forthcoming) to investigate the potential of SPE when used in combination with Systran, an RBMT sys-
tem. The general procedure of the SPE process used in the experiment was as follows: Systran 5.05 was used as
the RBMT system, and Moses (an open-source toolkit for statistical machine translation) (Dugast et al 2007,
Koehn 2004) was used as the SPE tool. All of the training and test resources were provided by Symantec, which
included translation memories (TM) and user dictionaries (UD), in the following language pairs: English to
French, German, Chinese, and Japanese. Four parallel corpora have been produced for each language: translation
by Systran without UD (referred to as Systran – Raw for the purposes of this paper), Systran translation with UD
(Systran - Customised), Systran translation without UD, combined with SPE (Systran - Raw & SPE), and Systran
with UD, combined with SPE (Systran – Customised & SPE).
The current paper analyses and compares, both quantitatively and qualitatively, the Japanese and Chinese output
of Systran – Customized and Systran – Customized & SPE. The experimental setting for these two languages is as
follows: Chinese (ZH) TM consisted of 529,822 translation units of English source texts and corresponding target
text, while Japanese (JA) TM consisted of 143,742 units. Both TMs were created based on human translation,
instead of human post-edited MT output due to insufficient post-edited data. The UD included Symantec-specific
user interface terms as well as general terms to which certain target language words had been assigned. The UD
contained 8,832 entries for Chinese and 6,363 for Japanese.
A preliminary classification and evaluation of the changes made by SPE on Chinese and Japanese is conducted in
Section 2. Sentence level human evaluation results are presented in Section 3. Finally, Section 4 concludes this
study and points out future work.
2 Classification and Evaluation of Changes
2.1 Evaluation setup
As mentioned earlier, in this study, the authors (one Japanese and one Chinese) have decided to carry out detailed
linguistic comparisons of the results from Systran - Customised and Systran - Customised & SPE, since Systran -
Customised is the standard MT translation method currently employed by Symantec, and we are interested in what
would happen if the SPE process was added to the current standard operating procedure. The aforementioned
experiment, by Senellart & Roturier (ibid), has shown that Systran - Customised & SPE outperformed Systran -
Customised for both Chinese and Japanese in terms of BLEU and GTM (Turian et al 2003) scores. The BLEU
score rose by about 6 points and 12 points, and the GTM score by about 10 points and 7 points for Chinese and
Japanese respectively. To reveal the detailed linguistic changes that have caused these improvements in perform-
ance, the authors randomly selected a sample of 100 translation segments from each of the Chinese and Japanese
test sets, and conducted a quantitative and a qualitative evaluation of the results, comparing the source text,
Systran output, SPE output, and the reference human translation to see how many and what types of improvements
and degradations had been made during the SPE process.
The quantitative evaluation was conducted using evaluation categories defined by the authors based on the Error
Classification suggested by Vilar et al. (2006). The classification was modified to make it more suitable for cate-
gorising changes rather than errors, and simplified to ensure applicability to both Chinese and Japanese. The
changes made during the SPE process were categorised into Words/Phrases Alteration/Deletion/Addition, Forms
(Tense or Voice, Formality, and Imperative), Translation of Fixed Expression, Word or Phrase Reordering, and
Punctuation. The number of improvements, degradations, and equivalent changes in each category was counted.
It was decided to adhere strictly to the reference translation when assessing each change in order to avoid the

Localisation Focus Vol.7 Issue 1The International Journal of Localisation
24
subjectivity of the authors and standardise the evaluation process. Therefore, when the translation of a word in
either MT output or SPE output did not match with the one in reference translation, it was regarded as an “equiv-
alent change” even if the change made during the SPE process seemed to have improved the quality of the trans-
lation.
The qualitative analysis was performed after the quantitative evaluation in an effort to explain some of the most
common changes made during the SPE process. Firstly, similarities and differences between the language pairs
were identified, and the factors responsible for these similarities and differences were studied.
2.2 Results and discussion
Below is the result of the quantitative evaluation of the changes that resulted in improvements, degradations, and
equivalent effects for Chinese (ZH) and Japanese (JA) respectively.
Table 1. Number of Improvements, Degradations and Equivalents in ZH and JA
As can be seen from the table, the number of improvements for Chinese text is noticeably higher than Japanese,
and the number of degradations for Japanese is noticeably higher than Chinese. Based on the evaluation that we
conducted in this research, it can clearly be seen that the SPE process has had a more positive impact on the
Chinese text than on the Japanese text.
Most notably, there have been numerous improvements in the choices of content words/phrases for Chinese, which
happened three times more often than in the Japanese text. For Japanese, the changes that were made to content
words/phrases have done as much harm as good. Another thing that is worth mentioning is the changes that were
made to punctuation, which have had an equally beneficial impact on both Chinese and Japanese.
Based on the quantitative analysis, we find that the most frequently changed categories are similar in Japanese and
Chinese, be they improvements or degradations, such as function words/phrases alteration and function
words/phrases deletion. On the other hand, there are also great differences between the two languages, for
instance, there have been no content word deletions in Chinese while there have been some in Japanese. A detailed
investigation on what constitutes those changes and whether the same category contains the same linguistic
changes in Japanese and Chinese has also been conducted.
Change CategoriesImprovement Degradation Equivalent
ZH JA ZH JA ZH JA
Word/Phrase
Alteration
Content Words 137 45 19 40 28 25
Function Words 38 45 6 9 17 30
Word/Phrase
Deletion
Content Words 0 9 0 2 0 1
Function Words 51 57 4 5 12 16
Word/Phrase
Addition
Content Words 4 0 3 2 2 0
Function Words 12 1 8 2 15 1
FormsTense or Voice 6 3 0 0 3 5
Formality 0 1 1 0 0 0
Imperative 0 8 0 0 0 2
Fixed Expression 8 0 0 0 0 1
Word/Phrase Reordering 9 1 3 3 0 1
Punctuation 31 47 4 9 0 4
Total 296 217 48 72 77 85

Localisation Focus Vol.7 Issue 1The International Journal of Localisation
25
2.2.1 Similar effects of SPE between the two languages
By “similar effects”, we mean those categories that share almost the same level of changes after SPE in Japanese
and Chinese. SPE had a similar effect on the following categories in Japanese and Chinese: function words/phras-
es (alteration or deletion) and punctuation.
Improvements in function words/phrases alteration
One of the most prominent similarities observed in this study is found in the changes made by SPE on function
words/phrases. The Improvement/Degradation rates for the Alteration of Function Words were 6.3:1 and 5:1 for
Chinese and Japanese respectively, and the rates for the Deletion of Function Words/Phrases were 12.7:1 and
11.4:1 respectively.
Some of the function words/phrases alterations have been made in a very similar manner for both Japanese and
Chinese. One example of this would be the changes to more appropriate translations for certain prepositions, such
as “to” and “about”. Another example of common types of function words/phrases alteration is the correction of
modal verb translations such as “can” or “must”. In Table 2 below, MT output refers to the output of Systran –
Customised while SPE output refers to the output of Systran – Customised & SPE as we mentioned in section 1.
Glosses are omitted due to the fact that SPE mostly makes subtle changes by using more appropriate or desired
words in the specific context, and the basic meaning often remains the same.
Table 2. Example of Function Words/Phrases Alteration
However, within the same categories, there have also been some differences in the types of alteration, presumably
mostly due to the language differences. A couple of examples for Japanese cases are shown in the table 3. The first
one is a stylistic change of character types from Kanji (ideograms) to Hiragana (phonetic characters), which could
also be handled by a simple global search and replace operation in any text editor. However, the second one may
be a good example of SPE-specific abilities, where the subjective postposition has been changed to one that is
more appropriate in the specific context.
Table 3. Example of unique alteration in JA
Specific changes in Chinese include translations for some of the relative pronouns, demonstrative pronouns, and
quantifiers being changed to more appropriate ones during the SPE process. For example, the translation of “this”
was changed from “此” to “该”. Although these two Chinese characters share the same meaning and their backtranslation is probably the same, the second one is the more commonly used word in the reference translations.
Improvements in function words/phrases deletion
One common improvement as a result of the Deletion of Function Words/Phrases among Chinese and Japanese
was the desirable omission of personal pronouns, such as “you” and “they”, which are commonly dropped both in
Chinese and Japanese. Yoshimi (2001) has suggested a method of eliminating or substituting unwanted pronouns
Source MT output SPE output
To maintain … JA: 保守するため… 維持するには…
Reverts to ZH: 恢 复 对 恢 复 到
must configure JA: 設定しなければなりません 設定する必要があります
You can … ZH: 您 能 您 可 以
Source MT output SPE output
(Imperative sentence ending) JA: して下さい してください
Messages are deleted JA:メッセージは削除されます メッセージが削除されます

Localisation Focus Vol.7 Issue 1The International Journal of Localisation
26
in English to Japanese machine translation without human intervention using a decision-tree learning method. In
his method, however, the corpora for statistical learning must be created by a human for generic purposes, where-
as the training corpora in the current research have been compiled automatically from the very specific domain
text, and have been proven to be effective. In Table 4, the underlined translation was omitted during SPE.
Table 4. Function Words/Phrases Deletion
Other than personal pronouns, there are no notable similarities in the types of deletions made to the two languages.
For Japanese, a number of improvements were made by the positive deletion of unnecessary prepositions, such as
“for” (ための), and unnecessary sentence endings caused by wrong part-of-speech parsing. For instance, “defin-
ition files” was originally translated as a sentence “定義はファイルします” [The definition files (something)],
which has been correctly changed to a noun phrase “ファイル定義” [definition file] during SPE. In Chinese, thedeletion of unnecessary translations for quantifiers is quite common, for example, the translation of “Provides a
more detailed explanation” [MT output: 提 供 一 个 详 细 说 明] is modified in SPE by deleting the translation
of “a’ [SPE output: 提 供 详 细 说 明].
Improvements in punctuation
Another notable similarity is found in the changes made to punctuation. The Improvement/Degradation rates were
7.5:1 and 5.1:1 for Chinese and Japanese respectively. In the case of Japanese, one of the major reasons for
improvement was the successful deletion of unnecessary hyphens that had been inserted during the RBMT
process. Another major positive impact was due to the alteration of the type of full stops to ones that are preferred
in the specific context of Symantec. In the case of Chinese, one improvement is the deletion of incorrectly gener-
ated commas in front of sentences as the first Chinese example in Table 5 shows. Another improvement is the cor-
rect alteration of regular commas into special Chinese enumeration commas when separating items constituting a
list, see the second Chinese example in Table 5.
Table 5. Punctuation changes in JA and ZH
2.2.2 Different effects of SPE between the two languages
Difference here refers to the fact that the influence of SPE is not universal for all categories within the two lan-
guages; certain categories in one language are influenced much more than those in the other.
Improvements and degradations in content words/phrases
The most notable difference between the results of the two languages might be the changes made to content words
and phrases. Caution must be exercised not to overestimate the number of improvements made by the content
Source MT output SPE output
the actions that you specify
for that ruleJA: あなたがその規則のために指定する処理 そのルールに指定する処理
After you configure your ZH: 在 您 配 置 您 的 配 置
Source MT output SPE output
MPE provides an option … JA: オプションを提供 します 。 オプションがあります .
Control Centre performance may
be diminished while the synchroniza-
tion is in progress.ZH: , 当 同 步 进 展 中 时… 同 步 处 理….
You can add, edit, copy, delete … ZH: 您 能 添 加 , 编 辑 , 复 制 , 删除 您 可 以 添 加 、编 辑 、复 制 、删 除

Localisation Focus Vol.7 Issue 1The International Journal of Localisation
27
words/phrases alteration for Chinese since there have been a large number of repeated identical changes in the
analysed Chinese segments. Nevertheless, the Improvement/Degradation rate of 7.2:1 is worth investigating espe-
cially considering the significantly low rate of 1.1:1 for Japanese.
For Chinese, there are several kinds of improvement. One improvement is the alteration of nouns, be it general
terms or domain-specific terms. Firstly, terms that were originally not translated have been translated after the SPE
module, for example “sub domains” which is not translated by RBMT, is translated into “子 域” as in the refer-ence translation; secondly, terms have been translated more appropriately. For example “scanner” whose transla-
tion is “扫 描 设 备” by RBMT, was changed to “扫 描 器”, the same as the reference translation. The appro-priate adaptation of verb translation is another major reason for improvement, for example, “recommend” was
translated into “推 荐” while the SPE module changed it into another, more desirable, translation “建 议”. Moreappropriate choices of adverbs and adjectives are the other reasons for the improvement, such as changing the
translation of “unchecked” from “未 经 检 查 的” to “未 经 选 中 的” etc.
Most of the alterations of content words/phrases have had a positive effect, however, there are cases where the
changes have had a negative effect, for example, “extra” is correctly translated by RBMT as “额 外 的”, howev-
er, SPE incorrectly changed it into “无 关 的 [unrelated] ”.
For Japanese, almost the same number of improvements and degradations have occurred. One of the notable rea-
sons for improvement was the correction of the part-of-speech parsing. For example, noun phrases, such as “fil-
tering rules” and “console commands”, which had originally been translated by RBMT as sentences, such as “フィルタは支配します [The filtering rules (something)]” and “コンソールは命じます [The console commands(something)]”, were properly converted back to noun phrases in Japanese as a result of the correction of mistrans-
lations of plural nouns as third person verbs by RBMT. Another reason for improvement was the achievement of
better collocation. For example, the translations of certain words, such as “grant” or “unwanted” need to be care-
fully selected depending on their collocations, and some of the incorrectly selected terms in RBMT output were
changed to words that were more appropriate in each circumstance. In addition, some of the translations of domain
specific terms, such as “rule” and “run” have been found to be translated into more appropriate Japanese words.
However, many of the degradations also resulted from the mistranslation of domain specific terms. For example,
the words “document”, “store”, and “alert”, which had originally been translated properly, conforming to the user
dictionaries, were incorrectly changed to different terms. Misinterpretation of general terms has also occurred. For
example, the word “number”, which had correctly been translated as “番号 [sequential number]”, was changed to
“数 [quantity]”. In addition, there has been an instance of case confusion, where a correctly translated instance of“it” was changed to “IT (Information Technology)”. Also, some of the correctly translated words have been
replaced with different words; for example, “バックアップ文書(backup document)” changed to “バックアップデータ (backup data)” or “バックアップファイル (backup file)”. Such degradations might be attributed to usinghuman translation as the training data of SPE, which may have included more variations in translating the same
English words than human post-edited MT text.
Function words/phrases addition
Another major difference was the addition of Function Words/Phrases. Since there are no inflections and deriva-
tions in Chinese, which means that Chinese is not a morphologically rich language compared to most European
languages, the Chinese language uses additional function words to express tense or voice. For example, “A
black dash indicates that it is disabled” is translated as “黑 色 破 折 号 表 明 它 禁 用”, the SPE correctly
modifies this into “黑 色 线 表 明 它 已 禁 用” by adding a word expressing the tense and voice. Also, someEnglish prepositions should be translated into circumpositions in Chinese, which require an additional character
placed after the phrase. For example, “on the Spim tab” is originally translated into “在 Spim 选 项 卡” and
later changed into “在 Spim 选 项 卡 上” with the underlined word added to express the full meaning of the
preposition “on”.

Localisation Focus Vol.7 Issue 1The International Journal of Localisation
Fixed expressions
Another difference between Chinese and Japanese is that fixed phrases in English have been translated into more
appropriate Chinese phrases as in the reference translation. For example, “In general” has been modified to “通
常 情 况 下” from “一 般 情 况 下”. This type of change has not happened at all in the Japanese text.
Words/phrases reordering
Word order is one of the most important factors for determining the meaning of a sentence in Chinese. Correct
order is vital in adequacy and fluency. There are cases where SPE has corrected some incorrect word order, such
as, “These threats are then…” is translated literally as “这 些 威 胁 然 后”, while SPE modified it into the cor-
rect order as in the reference translation “然 后, 这 些 威 胁” by putting “then” in font of the Chinese sen-tence. While words/phrases reordering happened frequently, and often with a positive impact in Chinese, it
occurred only a few times in the Japanese text and three occurrences resulted in ungrammatical sentences, for
example sentences that begin with an adverbial particle.
Form of Imperatives
One of the interesting differences may be the changes made to the sentence pattern, which happened relatively fre-
quently in Japanese but not at all in Chinese. Changes from the polite imperative form [して下さい] to the polite
basic form [します] occurred 10 times in the Japanese text, eight of which had positive effects. This change con-forms to the sentence pattern commonly preferred in user manuals.
2.2.3 Errors that have not been corrected by SPE
There have been similar errors produced by Systran in both languages outputs that were not corrected by SPE.
Firstly, long range word reordering rarely happened, thus when the MT system produced improper sentence struc-
tures, mainly due to misplacement of clauses or incorrect parsing of prepositional phrase attachments, they were
very rarely corrected. Secondly, intelligibility was rarely improved, even when local changes such as terms and
function words were altered. These examples may suggest that it may not be appropriate to expect that sentence
level correction can be achieved by SPE processes.
One error produced frequently by Systran in Chinese is the mistranslation of “and” conjunction phrases, which
were not corrected during the SPE process, whereas such a mistranslation was rarely observed for Japanese.
Secondly, some of the terms that should remain in English have been undesirably translated into Japanese, for
example, the translation of “OLE” to “オーレ”, which was not observed in the Chinese text and was not correct-ed in the SPE process. Finally, some of the user interface terms have been unnecessarily translated in the Japanese
text and remained incorrect during the SPE process. On the other hand, in Chinese, some of the user interface
terms that Systran failed to translate were successfully translated into the correct Chinese terms during the SPE
process. This may have been due to differences in the types of user dictionary entries or the training data provid-
ed between the two languages; in any case, further investigation may reveal useful information for the effective
use of SPE.
3 Sentence Level Evaluation
3.1 Evaluation setup
In addition to the aforementioned evaluation, we also conducted a pilot experiment evaluating the effect of SPE
at the sentence level using three criteria: Fluency, Adequacy, and Post-Editing (PE) time. Based on the definition
set by the Linguistics Data Consortium (LDC), fluency refers to the well-formedness based on the target lan-
guage grammar, and adequacy refers to how much of the information and meaning of the original source text has
been expressed in the target text (LDC 2005). These two criteria have been widely used (Papineni et al 2002,
Turian et al 2003, Callison-Burch et al 2007, Doddington 2002, Owczarzak 2008, Boitet et al 2006), etc.
28

Localisation Focus Vol.7 Issue 1The International Journal of Localisation
PE time here refers to the time needed to edit the output in order to raise the quality of the text so that it is
appropriate for publishing purposes. PE time is important as PE is one of the major elements of human efforts in
MT workflows and therefore reducing the PE time can have a significant impact on optimising the MT work-
flows.
Four evaluators for each language were recruited by Symantec. All four evaluators are native speakers of
Chinese and Japanese respectively, and all are professional translators. Their experience in translation varies
from three to twenty-two years, and the average is seven years. For each of the hundred segments, the English
source text, RBMT output, and SPE processed text were presented to the evaluators, and they were asked to
decide which target text is better than the other in terms of a) Fluency and b) Adequacy, and then decide which
text would need less time to post-edit (Less-PE time). They were asked to put their answers in the table columns
similar to Table 6 below. For each of the Fluency, Adequacy, and Less-PE columns, they were given three choic-
es, 1 stands for the first output, 2 stands for the second output, while E stands for the equivalent quality for the
two outputs. To avoid any bias on the part of the evaluators, the two target texts were presented in a mixed order,
that is, for a random half of the hundred segments, RBMT output texts were presented as Output 1, and the SPE
processed texts as Output 2, and the other way round for the rest of the segments. The four evaluators conducted
the evaluation individually, and had no discussions or any form of information exchange during the evaluation.
Table 6. Human Evaluation Sample with Japanese output
We have used this simple “choice between three” method for the evaluation mainly due to time restrictions.
Fluency and adequacy are normally evaluated in a scaled manner; for fluency, for instance, it is common that the
evaluators are given five choices: 1: Incomprehensible, 2: Disfluent English, 3: Non-native English, 4: Good
English, 5: Flawless English (Callison-Burch et al 2007, Boitet et al 2006), while we have given evaluators only
a relative choice between MT, SPE, and Equal. The same is true for PE time. A number of attempts have been
made to measure the post-editing effort using different methods (O’Brien 2007, Krings 2001), which have proved
that measuring the post-editing effort is not a straightforward task. We are aware that the method we have
employed here may put a restriction on supporting our findings.
3.2 Results and discussion
Table 7 shows the average results of the four evaluators for Chinese and Japanese. From the Chinese results, it can
be seen that fluency and adequacy are regarded as having been improved during the SPE process in fewer than 40
cases on average, while PE time is thought to be shortened in nearly 50 cases. In contrast, for Japanese, fluency,
adequacy, and PE time are considered to have been almost evenly improved in around 60 cases.
Table 7. Average results for each criterion
After aggregating the results, we applied the Kappa coefficient equation (Carletta 1996) to the results to ensure
inter-evaluator agreement, which showed another noticeable difference between the two languages. The following
table shows the result of Kappa coefficients, which are widely used for determining the level of agreement among
multiple evaluators (Callison-Burch et al 2007). According to the definition set by Landis & Koch (1977), 0.0 -
0.20 is regarded as having slight agreement, 0.21 - 0.40 fair agreement, 0.41 - 0.60 moderate agreement, 0.61 -
Source_EN Output 1 Output 2 Fluency Adequacy Less PE Time
Turns on or off the special
meaning of metacharactersオン/オフ回転メタ
文字の特別な意味。
有効または無効にメタ
文字の特別な意味します.1 or 2 or E 1 or 2 or E 1 or 2 or E
Language Chinese Japanese
Criteria Fluency Adequacy Less PE Time Fluency Adequacy Less PE Time
MT 12.75 15.50 15.00 14.50 8.00 9.75
SPE 37.75 38.00 48.25 59.25 61.50 62.50
Equal 49.50 46.50 36.75 26.05 30.50 27.75
Total 100.00 100.00 100.00 100.00 100.00 100.00
29

Localisation Focus Vol.7 Issue 1The International Journal of Localisation
- 0.80 substantial agreement, and 0.81 - 1.00 almost perfect agreement. Based on this definition, Japanese inter-
evaluator agreement is either at the higher level of moderate or the lower level of substantial agreement, while
Chinese inter-evaluator agreement is all at the middle level of fair agreement. The high score for Japanese might
be explained by the fact that the evaluation was conducted in a simple way by giving only three relative choices,
but it does not explain the rather large difference in values between the languages. It must also be noted that low
level of agreement might affect the generalisability of the findings.
Table 8. Kappa coefficient values for inter-evaluator agreement
3.2.1 Discussion on the Chinese results
The Chinese evaluators vary on their opinions; only 9 segments out of 100 gain unanimous judgements among the
four evaluators and 36 gain unanimous judgements among three of the four evaluators. For the rest of the seg-
ments, different evaluators share different opinions on which are better in adequacy and fluency as well as which
require less PE time.
Overall, the effect of SPE is obvious if we are looking for an incremental improvement in the translation quality.
Many more credits were assigned to the SPE output than to the MT output. This may correlate with the improve-
ments in different categories that we analyzed in section 2. Those improvements help to improve the adequacy,
fluency of the translation and reduce post-editing time. For example, among the 7 sentences in which the four eval-
uators agree that SPE output is better in terms of Fluency and Adequacy and needs less PE time, 6 of them have
at least one positive content words/phrases alteration.
However, degradation in those changes might also have a negative effect on adequacy and fluency and hence need
more post-editing time. For 15% of the sentences, the evaluators think that the original MT output is better in ade-
quacy and fluency and need less post-editing time. For example, for the three sentences which receive unanimous
agreement that MT is better in fluency and adequacy and need less PE time, the degradations within them are inap-
propriate content or function words/phrases addition and inappropriate function words/phrases deletion.
3.2.2 Discussion on the Japanese results
One of the most striking outcomes found in the Japanese results is that, on average, the evaluators have estimat-
ed that SPE output should require less PE time in over 60% of the cases. In fact, in 42 segments out of 100, all
four evaluators unanimously concluded that fluency, adequacy, and PE time have all been improved during the
SPE process. The evaluators’ opinions have varied in other cases where SPE time is considered to have been short-
ened. Therefore, it is not easy to conclude whether fluency improvement or adequacy improvement is likely to
result in shorter PE time. In any case, it might be fair to say that, in general, SPE had a considerably positive
impact on improving fluency, adequacy, and PE time.
On the other hand, there are eight segments where at least three evaluators have agreed that MT output should
require less PE time than SPE output. Having investigated the reasons for this by revisiting the analysis conduct-
ed in section 3, it was found that one or more content word alterations had caused degradation during the SPE
process in six out of eight cases. The remaining two cases consisted of one case where function word degradation
occurred and another case where Words/Phrases Reordering caused degradation. This might suggest that control-
ling the content word alteration may, to some extent, help prevent adverse effects of SPE.
Evaluation Criteria Chinese Japanese
Fluency
Adequacy
Less PE Time
0.276
0.288
0.284
0.598
0.582
0.624
30

Localisation Focus Vol.7 Issue 1The International Journal of Localisation
4 Conclusion and Future Research
In this study, we conducted a detailed investigation into the Chinese and Japanese results of a prior experiment car-
ried out by Systran and Symantec (Senellart & Roturier forthcoming). The first objective of the research was to
find out what linguistic changes SPE can and cannot make, and what their consequences are. The second objec-
tive was to research the effect of SPE in terms of fluency, adequacy, and reducing the subsequent human PE effort.
One of the notable findings from the linguistic analysis was that the most frequent changes made during the SPE
process for both Chinese and Japanese were content words/phrases alterations, function words/phrases alterations,
function words/phrases deletions, and punctuation changes. While content word alterations have resulted both in
improvements and degradations in both languages, function word alterations, function word deletions, and punc-
tuation changes have mostly resulted in improvements in both languages. It is an interesting finding that Chineseand Japanese share the same categories of changes, although the exact types of changes made within the same cat-
egory differ partly due to the language differences. It may also be worth pointing out that the changes made dur-
ing the SPE process are largely limited to the word level, and changes in the sentence structure or reordering of
the words or phrases in a long range seemed difficult to achieve with the current SPE system.
Sentence level evaluation was also conducted to shed light on the effect of SPE in terms of fluency, adequacy, and
PE time reduction. One of the most important findings from this evaluation is that the evaluators, on average, think
the text after the SPE process requires less time for post-editing in around 50% and 60% of the cases in Chinese
and Japanese respectively. This may suggest the potential of SPE in reducing the human effort in MT workflows,
which could result in productivity gains, although the results are not clear-cut considering the simple form of eval-
uation method that was applied. Another curious finding is that the results of the sentence level evaluation contra-
dict the results from the evaluation of changes conducted in Section 2. While SPE has a greater positive impact on
Chinese than Japanese in the evaluation in Section 2, the sentence level evaluation has contradicted this and a
noticeably better effect has been observed on the Japanese text. The result may be different if fluency and adequa-
cy had been evaluated on a scale rather than with the “choice between three” method, and if the post-editing had
been precisely timed, rather than subjectively assessed.
There are several limitations to the current study. Firstly, the conditions for two languages are not identical. Using
the same RBMT system for both languages does not necessarily mean that the MT output quality and error types
for the two languages are the same. By the same token, human translation in two different languages used for train-
ing SPE could not be guaranteed to have the same level quality. Moreover, the training and test materials used in
this experiment for Japanese and Chinese were not identical. Secondly, the resources were limited. A detailed
investigation was only carried out on a hundred sample segments, and only one native speaker of Japanese and
Chinese (the authors) respectively worked on the quantitative and qualitative evaluation of the changes made by
SPE in each language. In addition, although four evaluators participated in the sentence level evaluation in each
language, because we used “a choice between three” method, rather than the scaled evaluation metrics, the data
obtained is impressionistic. The evaluation for post-editing time is estimation rather than a strictly measured dura-
tion of editing time.
Nevertheless, this work may have revealed a number of possibilities and limitations of current SPE from a linguis-
tic point of view, especially on less investigated languages such as Chinese and Japanese. A similar but larger scale
research project could be conducted in the future using larger corpora with identical source text as well as using
more finely scaled evaluation metrics for fluency and adequacy, and actual timing of post-editing. Also, compar-
ison of the SPE text with the human post-edited text using some metrics to measure the textual differences, such
as Translation Edit Rate (TER) (Snover et al 2006), may provide us with an interesting opportunity for further
investigation of the correlation between the changes made during the SPE and their effects on PE effort.
31

Localisation Focus Vol.7 Issue 1The International Journal of Localisation
References
Allen, J. & Hogan, C. (2000) Toward the Development of a Postediting Module for Raw Machine Translation
Output: a Controlled Language Perspective. In: Proceedings of The Third International Workshop on Controlled
Language Applications (CLAW 2000), Seattle, Washington, pp. 62-71.
Boitet, C., Bey, Y., Tomokio, M., Cao, W. & Blanchon, H. (2006) IWSLT-06: Experiments with commercial MT
systems and lessons from subjective evaluations. In: Proceedings of International Workshop on Spoken
Language Translation: Evaluation Campaign on Spoken Language Translation [IWSLT 2006], Kyoto, Japan, pp.
8-15.
Callison-Burch, C., Fordyce, C., Koehn, P., Monz, C. & Schroeder, J. (2007) (Meta-) Evaluation of Machine
Translation. In: Proceedings of The Second Workshop on Statistical Machine Translation Association for
Computational Linguistics, , pp. 136-158.
Carletta, J. (1996) Assessing agreement on classification tasks: The kappa statistic. Computational Linguistics,
22, 2, 249-254.
Doddington, G. (2002) Automatic Evaluation of Machine Translation Quality Using N-Gram Co-Occurrence
Statistics. In: Proceedings of The Second International Conference on Human Language Technology, San Diego,
CA, pp. 138-145.
Dugast, L., Senellart, J. & Koehn, P. (2007) Statistical Post-Editing on SYSTRAN’s Rule-Based Translation
System. In: Proceedings of The Second Workshop on Statistical Machine Translation, Prague, pp. 220-223.
Elming, J. (2006) Transformation-based correction of rule-based MT. In: Proceedings of EAMT-2006: 11th
Annual Conference of the European Association for Machine Translation, Oslo, Norway, pp. 219-226.
Isabelle, P., Goutte, C. & Simard, M. (2007) Domain adaptation of MT systems through automatic post-editing.
In: Proceedings of MT Summit XI, Copenhagen, Denmark, pp. 255-261.
J. R. Landis, J. R. & Koch, G.G. (1977) The measurement of observer agreement for categorical data.
Biometrics, 33, 159-174.
Knight, K. & Chander, I. (1994) Automated Postediting of Documents. In: Proceedings of 12th National confer-
ence of the American Association for Artificial Intelligence (AAAI 1994), Seattle, Washington, USA.
Koehn, P. (2004) Statistical Significance Tests for Machine Translation Evaluation. In: Proceedings of
Conference on Empirical Methods in Natural G128 Language Processing (EMNLP), pp. 388-395.
Krings, H.P. (2001) Repairing Texts: Empirical Investigations of Machine Translation Post-Editing Processes.
The Kent State University Press, Kent, Ohio.
LDC (2005) Linguistic Data Annotation Specification: Assessment of fluency and adequacy in translations.
Report number: Revision 1.5.
O’Brien, S. (2007) An Empirical Investigation of Temporal and Technical Post-Editing Effort. Translation and
Interpreting Studies, 2, 1, 83-136.
Owczarzak, K. (2008) A novel dependency-based evaluation metric for machine translation, PhD edn, DCU.
32

Localisation Focus Vol.7 Issue 1The International Journal of Localisation
33
Papineni, K., Roukos, S., Ward, T. & Zhu, W. (2002) BLEU: a Method for Automatic Evaluation of Machine
Translation. In: Proceedings of 40th Annual Meeting of the Association for Computational Linguistics (ACL),
Philadelphia, pp. 311-318.
Senellart, J. & Roturier, J. (forthcoming) Automation of Post-Editing in Localization Workflows. Presented at
LISA Forum Europe 2008.
Simard, M., Goutte, C. & Isabelle, P. (2007a) Statistical Phrase-based Post-editing. In: Proceedings of NAACL-
HLT-2007 Human Language Technology: the conference of the North American Chapter of the Association for
Computational Linguistics, Rochester, NY, pp. 508-515.
Simard, M., Ueffing, N., Isabelle, P. & Kuhn, R. (2007b) Rule-based translation with statistical phrase-based
post-editing. In: Proceedings of ACL 2007: The Second Workshop on Statistical Machine Translation, Prague,
Czech Republic, pp. 203-206.
Snover, M., Dorr, B., Schwartz, R., Micciulla, L. & Makhoul, J. (2006) A Study of Translation Edit Rate with
Targeted Human Annotation. In: Proceedings of 7th Conference of the Association for Machine Translation in
the Americas, Cambridge, Massachusetts, USA, pp. 223-231.
Turian, J.P., Shen, L. & Melamed, I.D. (2003) Evaluation of Machine Translation and its Evaluation. In:
Proceedings of MT Summit IX, New Orleans, USA, pp. 386-393.
Vilar, D., Xu, J., D’Haro, L.F. & Ney, H. (2006) Error Analysis of Statistical Machine Translation Output. In:
Proceedings of LREC-2006: Fifth International Conference on Language Resources and Evaluation, Genoa,
Italy, pp. 697.
Yoshimi, T. (2001) Improvement of Translation Quality of Pronouns in an English-to-Japanese MT System. 自然言語処理, 8, 3, 87-106.

Localisation Focus Vol.7 Issue 1The International Journal of Localisation
Readability: Examining its usefulness in the field of controlled language
Patrick CadwellSchool of Applied Languages and Intercultural Studies
Dublin City UniversityDublin 9, Ireland
AbstractThis article is based on a survey of text-user attitudes. The survey aimed to discover: whether the concept of read-ability has merit in the field of controlled language; and whether readability is increased by applying controlled-language rules to a sample of technical texts. The article attempts to provide much-needed empirical data to a neg-lected area of controlled-language research, and to examine the concept of readability that appears to be misunder-stood, undervalued and misused. In particular, the paper examines issues concerning reader preference, the pre-dictability of readability formulas, and the variables that impact on readability as a whole. Moreover, though theparticipant samples in the study were too small to be generalised to larger populations, the trends identified hereindicate useful directions for future research.
Keywords: readability; controlled language; reader preference; empirical data.
1 IntroductionIn this article, the results of a survey carried out toexamine whether readability has merit in the field ofcontrolled language (CL), and whether it is increasedby applying CL rules to texts is described. The paperis based on a Masters-level dissertation completedearlier this year by the author: the full dissertationcan be viewed at http://www.localisation.ie/resources/Awards/Theses/Theses.htm.
This article focuses foremost on the theoretical issuesthat informed the study; only a very brief outline ofthe methodology is given, while placing focus onhow questions raised in the review of the literaturewere answered by empirical data.
The literature, in this case, is made up of three maingroups: Group 1 consists of papers submitted to thevarious International Workshops on ControlledLanguage Applications (CLAW), workshops thathave been running since 1998; Group 2 is made up ofscholarly works on the concept of readability, in par-ticular Klare (1963, 1974, 2000), Flesch (1948), Daleand Chall (1948), Fry (1958), Gunning (1952);Group 3 is comprised of articles from journals thatspecialise in technical writing, for example Journal ofTechnical Writing and Communication or ACMJournal of Computer Documentation.
The three groups speak to very different audiencesand represent different trends in research into docu-
34
ment production: Group 1 sees readability as interest-ing, but focuses its efforts on matters more directlylinked to machine translation; Group 2 defines andhelps us understand the concept of readability, but isweak at exemplifying its practical applications;Group 3 tends to be highly critical of readability as aconcept and focuses research on other areas of docu-ment analysis. In short, the literature is broad anddoes not generally examine a link between a clearunderstanding of what readability is and how it canbe practically and beneficially applied to the field ofCL. This is the gap that my study hoped to fill. Inparticular, I had three main motivations for carryingout my work:
1.1 Motivation: need for empirical researchEight years ago, Knops (2000, p.134) called out formore empirical data in the field of CL. He said:
Generally speaking, there is an urgent needfor facts and figures obtained in experimentalsituations and real-life production environ-ments and relating to the effects of particularCL standards, rules and rule sets on read-ability and translatability.
Since that time, researchers have answered that calland several empirical studies have been published inthe field of CL rules. However, these studies havefocused largely on more machine-oriented topics,such as translatability, comprehensibility, proof-read-

Localisation Focus Vol.7 Issue 1The International Journal of Localisation
ing effort, etc. More human-oriented analyses - suchas readability, usability, etc. - have been neglected.In fact, since Knops call I have found no major workthat outlines how readability and controlled languageinteract in a contemporary, commercial situation.According to Hayes, Maxwell and Schmandt (1996,pp.84-85), this may be because readability advan-tages are harder to quantify than those of translatabil-ity, comprehensibility, etc. I believe, however, thatthis may also be because few people have an under-standing of how readability is correctly defined;without such an understanding, how can anyonedetermine the advantages that applying readabilityguidelines may bring?
1.2 Motivation: assumptions held about readabilitySeveral under-tested and unchallenged assumptionsabout readability now hold firm. For example,"reducing the complexity of syntactic structures of atext increases its readability" (Spaggiiari, Beaujardand Canneson 2003, p.152). Similarly, Reuther(1998, p.174) claims that:
It is a well known and indisputable fact with-in the CL community that the use of aControlled Language (CL) in technical docu-mentation leads to quality improvement withrespect to readability, consistency and trans-latability.
In the literature, it is difficult enough to find a consis-tent definition for readability, let alone empirical evi-dence for such strong statements. My study intendedto show the ultimate value of readability in the fieldof CL: regardless of how easy a CL makes a docu-ment to translate or comprehend, these benefits willbe for nothing if the text is written in a way that caus-es the reader to discard it.
1.3 Motivation: lack of terminological rigourIn preparation for this study, I came across an abun-dance of terms used to describe how CL texts can beanalysed and evaluated (hereafter referred to as met-rics). Metrics in the field of CL include: readability;comprehensibility; translatability; usability; post-editing effort; consistency, legibility; acceptability;accessibility; learnability. Depending on the author,these terms can be treated as sharing many, all or nocharacteristics. Clearly, there is a need for a moresystematic and rigorous definition and treatment ofthese concepts.
2 Brief outline of the surveyFor this study, I was given access to various natural-
ly-occurring technical texts by the software publish-er, Symantec. An internal training document wasdeemed to be the most appropriate for use in the sur-vey. This type of document was chosen as it could beclaimed that the Symantec participants would all beexpert in, or at least familiar with, its contents.Moreover, it seemed long and varied enough to pro-vide different examples of writing styles and read-ability.
This training text was divided up into short, similarpassages and popular readability formulas wereapplied to the passages. Over 50 readability formu-las have been developed over the years, but, of these,six formulas are particularly influential: Flesch;Gunning Fog; Dale-Chall; Fry Graph; SMOG; andAutomated Readability Index (ARI). The formulasused in this study were Flesch Reading Ease, FleschKincaid Grade Level and Gunning Fog; they werechosen for their speed and ease of calculation, and forthe large number of times that they are cited in worksin the field of CL.
Of the short, similar passages, three individual pas-sages were finally selected to be experimented on.One received an extremely unfavourable readabilityprediction from all three formulas. It will henceforthbe referred to as the 'Norton' passage. One receivedan extremely favourable readability prediction fromall three formulas. It will be referred to as the'Shared' passage. The last passage received a predic-tion score midway between these two from all theformulas and will be referred to as the 'HijackThis'passage. Collectively these three naturally-occurringpassages with varied readability scores were termed'NCL' passages in the dissertation.
Next, these three passages were controlled for read-ability. Identifying the rules to apply to control forreadability was a long and difficult task, and will bedescribed in great detail in 3.3. Here, it will sufficeto say that once the author had edited the passages(termed "CL" passages in the study) so that they con-formed to the readability rules, the same readabilityformulas were applied to them: all three scoresimproved marginally. However, the relationshipbetween the three passages remained the same (i.e.the most difficult to read remained the most difficult,etc.).
With NCL and CL versions prepared, it was time tocarry out the survey. The survey used two samples ofrespondents: one sample was made up of Symantecstaff that had knowledge and practical experience of
35

Localisation Focus Vol.7 Issue 1The International Journal of Localisation
the technical domain from which the texts were taken(Symantec); the other sample was made up of partic-ipants without such domain knowledge and experi-ence (Control). The two groups, with 12 participantsin each group, were largely balanced for English abil-ity, gender, and educational profile.
The survey was done on a test / retest basis. Therewas a survey in Stage 1 and another similar survey inStage 2 to examine attitude variance depending onwhether a CL or NCL version was read. To counterany inherent bias, participants did not know whenthey received a CL version: for both groups, a tableof random numbers was used to randomly distributea CL version to half the participants in Stage 1 andhalf in Stage 2. At both stages, the subjects read thepassages and then filled out a questionnaire thatexamined their opinions as to the readability of thetexts.
3 Theoretical overviewThe survey outlined in Section 2 set out to discoverwhether readability has merit in the field of CL, andwhether it is increased by applying CL rules to thetraining texts under experimentation. However, todecide how to move from such broad goals to specif-ic survey questions required a lot of theoreticalpreparation. This preparation involved examiningreadability in isolation - how we define, measure,predict and produce readability - and examining read-ability in relation to other metrics used in the field ofCL.
3.1 Defining and measuring readabilityReadability is regularly mentioned in the CL litera-ture, but is rarely defined by the authors that use it.Perhaps this is because it is an idea that is prevalentin general language, and authors assume that readersunderstand the concept as "the ease with which writ-ten language can be read with understanding"(Crystal 1992, p.326). For this experiment, a moredetailed definition was needed to show how readabil-ity differed from other metrics, such as legibility,comprehensibility or clarity. At first, it was neces-sary to consult some fairly dated sources: theoreticalwork on readability began in the US in the 1940swhen literacy levels of the general population werestill low, but when the government needed to dissem-inate increasingly complex written documents in themedical, legal and financial fields. Key works byinfluential scholars at the time include Rudolf Flesch(1948), Edgar Dale and Jeanne Chall (1948), andRobert Gunning (1952). Dale and Chall (1949 inDuBay 2004, p.3) provided the detail lacking in more
general definitions. For them, readability is:
The sum total (including all the interactions)of all those elements within a given piece of printed material that affect the success agroup of readers have with it. The success isthe extent to which they understand it, read itat an optimal speed, and find it interesting.
Klare (1977 in Harkins and Plung 1982, p.149) con-curs with Dale and Chall in their definition, andstates that when we talk of readable writing, "...wemean that the intended readers are able to read itquickly, understand it clearly, and accept it readily(i.e. persevere in reading it)". In other words, it is thecombination of these three elements that differenti-ates readability from the other metrics. Flesch(1948), Dale and Chall (1948), Gunning (1952), Fry(1968) and Klare (1963) note that we make docu-ments readable to help readers understand them bet-ter, and to help them avoid making mistakes that theymight otherwise have made. Crucially, though, theyemphasise that we also make them readable to savethe readers time and effort, and to ensure that they donot give up on reading the document.
These definitions tell us how to go about measuringreadability. However, they do not explain how topredict whether one text is more readable than anoth-er. Nor do they instruct us how to produce readabletext.
3.2 Predicting readability: readability formulasAs was shown in 3.1, measuring what makes a docu-ment readable involves the detailed analysis of com-plex concepts such as the reader's understanding,reading speed, and perseverance. However, suchcomplex analysis may not always be possible. Thus,scholars have tried to develop formulas which usevariables in the text to predict how difficult that textmay be for a particular audience. Over 50 proceduresclaiming to compute how difficult a text is to readhave been devised over the last 80 years. Of these,six are particularly influential: Flesch; Dale-Chall;Fog; Fry Graph; SMOG; and Automated ReadabilityIndex (ARI). Others that are often utilized includeFORCAST, Lorge and Spache (Klare 1974, p.68).
Formulas do not define or explain readability; theydo not point to all the areas of a text that make it read-able or comprehensible (Davison and Kantor 1982,pp.189-190). The formulas are merely intended asindices or predictors of how difficult a text is likelyto be for an intended reader. To construct a formula,
36

Localisation Focus Vol.7 Issue 1The International Journal of Localisation
the researcher assembles large numbers of 'criterion'passages; these are usually texts taken from the USeducational system. Most formulas in use today orig-inated in research projects in the US and are based onthe study of American-English data. Moreover, theformulas are compiled with a view to making theEnglish spoken in that part of the world more read-able. This is a matter not usually considered by thosewho use these formulas in other geographic and lin-guistic settings. Readability formulas are construct-ed for other languages aside from English, but theirfeatures were not considered in this study.Nonetheless, comparing and contrasting the formulasused in different languages would surely be an inter-esting research theme in the future.
Once the 'criterion passages' have been chosen, lan-guage variables from these passages - typically worddifficulty and sentence length - are selected. Theresearcher then sees how these vary with the scoresthat readers have given the passages in terms of read-ing speed, reader preference, and comprehension, toname the three most common values. If a languagevariable and the readers' scores correlate closely, thevariable is said to be a characteristic of readable writ-ing and is combined statistically into a formula.These results are then further validated with otherscores for reliability (Klare 1977 in Harkins andPlung 1982, p.149).
To use a formula, a passage of at least 100 words isselected; such a length is necessary for the statisticalregressions used in most formulas to be valid. Then,a count is made of the language variables that havebeen identified as being characteristic of readability.These counts are entered into the formula, and anoverall score for the passage is given. This score willtypically be expressed in different ways: some for-mulas place the score on a graph (Fry); some expressthe score as the US grade-school level the readerneeds to have completed to be able to read the pas-sage (Flesch); some express the score on a simplescale from 0 to 100, with 0 being the most difficult,and 100 being the easiest (Flesch Reading Ease);while others express it as the number of years of for-mal education a reader needs to be able to read thepassage (Fog).
Crystal (1997, p.254) and DuBay (2004, p.54) bothemphasise the increasing significance and popularityof readability formulas in the field of educationalresearch. However, other authors criticise the formu-las for being unsophisticated and unsuited to use onany other texts than those intended for children in the
US school system: this is because the criterion pas-sages on which they are based have been selected andvalidated with schoolchildren in mind (Hargis 2000,p.105; Giles and Still 2005, p.66).
Now let us look at how readable writing can be pro-duced.
3.3 Producing readability: rules to conform toThis section describes the CL created by the authorfor this experiment: the rules outlined here are shownin the literature to have a positive impact on readabil-ity. These rules will be divided into four major cate-gories: textual / pragmatic; syntactic; grammatical;lexical.
Textual rules
Have no more than one idea per paragraph.According to Davison and Kantor (1982, pp.189-191), readability must take into account elements thatcontribute to a coherent and well-formed text. Theyemphasise that the inference and cognitive loadplaced on readers should not be too great.
Each paragraph should start with a topic sentence.Davison and Kantor (1982, pp.196-197) also foundthat reading time shortened and readability increasedif closely relevant context information was placed atthe beginning of each paragraph.
Give old information before new (theme-rheme pro-gression).Both Farrington (1996, p.16) and Reuther (2003,p.128) assert that human readers process texts betterwhen new and complex information is presentedslowly, in a logical progression, and without toomany new chunks at one time.
Use headings for paragraphs and leave sufficient'white space'.Dayananda (1986 in Crystal 1997, p.383) adviseswriting for the eye as well as the mind: using whitespace, combined with headings, subheadings, etc.,makes the organisation of ideas in the text clearer
Put long lists in bullet points.Hargis (2000, p.129) concurs with many CL authorsin recommending that long lists should be presentedin the form of bullet points.
Syntactic rules
In general, Klare (1977 in Harkins and Plung 1982,37

Localisation Focus Vol.7 Issue 1The International Journal of Localisation
38
pp.150-151) reminds us that correctly-punctuated'Simple Active Affirmative Declarative' sentences arethe most readable. However, to be more specific, asfar as syntax is concerned:
Sentences should not exceed 25 words.O'Brien (2003, p.110) explains that in CL the maxi-mum number of words allowed in a sentence variesfrom somewhere between 20 and 25 words.Generally, the lower limits are applied for proceduraltexts, and the higher limits for descriptive texts.
Have variety in the length of sentences within this 25-word limit.As was shown in 3.1, perseverance is a key pillar ofreadability. Klare (1977 in Harkins and Plung 1982,pp.150-151) underlines that if each sentence is uni-formly similar, the reader will become bored and giveup reading.
Have a maximum of two clauses per sentence.Bram (1978 in Harkins and Plung 1982, p.146)showed that to increase readability, there should onlybe one or two statements per sentence, with no addi-tional qualifying or explanatory information. In gen-eral, difficult texts have a longer more complex struc-ture and impose a greater cognitive load on the read-er.
Grammatical rules
Avoid using ambiguous constructs.Some linguistic constructs - for example the connec-tors 'like' and 'or', or the 'slash' - are ambiguous andrequire resolution by the reader. These increase read-ing time and complexity, and should be avoided(Nyberg and Mitamura 1996, p.80).
Avoid using the passive voice.Dayananda (1986 in Crystal 1997, p.383) states thatthe passive voice is less readable than the activevoice as it generates greater cognitive load.
Avoid ellipsis and pronominal reference.Klare (1977 in Harkins and Plung 1982, pp.150-151)states that leaving out parts of sentences and usingpronouns - even when the meaning can be understoodwithout the original noun or ellipted item - createsmore difficulty for the reader and should be avoided.
Lexical rules
According to Nyberg and Mitamura (1996, p.77), apre-approved vocabulary that is consistently used by
authors is vital to the success of a CL. However, thispredefined word list will vary depending on thedomain in which the texts are used: the list for writ-ing a school textbook will be very different to the oneused in writing an airplane maintenance manual. Noscholar has yet found a better multi-purpose lexicalrule for readability than 'the simple word should befavoured over the complex'. This, however, is notvery instructive. Without a vocabulary list specific tothis experiment, only one other lexical rule was iden-tified by the author. This was:
Ensure that all words are spelt correctly.Hargis (2000, p.129) reminds us that poor spellingcan increase processing time, misunderstanding andfrustration. Its impact on readability should not beunderestimated.
It must be stressed that the above rules should not beaccepted without challenge: many are severely criti-cised in the literature. For example, though bulletingis intuitively held by many to be easier to read,research done by Garrod (1998 in Grover et al. 2000,p.91) contests whether doing so actually works.Similarly, Davison and Kantor (1982, pp.192-195)claim that shortening sentences can just lead to thedilution of logical relations between clauses and sen-tences, which in turn leads to mistaken inferencesbeing made by the reader. Moreover, Hargis (2000,p.126) asserts that the break-up of sentences not onlyinterferes with understanding in this way, but alsoproduces a choppy, monotonous style that will boreand frustrate the reader. Despite these criticisms,however, the weight of evidence in the literature atpresent points to the above rules positively impactingon readability.
So far, only the linguistic variables impacting onreadability have been dealt with. However, severalextra-linguistic variables also have a strong influenceon readability and must not be neglected.
3.4 Extra-linguistic variablesMany variables outside the linguistic realm help orhinder readers in understanding, in reading morequickly, and in persevering with their reading. Theseinclude: motivation; reading ability; interest in thetopic; relevance of the topic; familiarity; prior knowl-edge; and testing conditions. DuBay (2004, p.39)points out that many experiments in the field of CLdo not achieve the expected results because they failto control for such variables. It is not difficult to cre-ate illustrative examples. Imagine the number ofreaders that neglect to sign a simple form, even

Localisation Focus Vol.7 Issue 1The International Journal of Localisation
though the instructions to do so are easy to under-stand and clearly presented: in such a case, it is like-ly that motivation or interest is lacking. Similarly,we can think of a document that would be complete-ly unreadable or incomprehensible to the averageperson, but that would be smoothly read and easilycomprehended by an expert with prior knowledge ofthe topic and familiarity with the text type.
Clearly, then, these variables can have an impact onreadability. For example, Klare (1977 in Harkins andPlung 1982, p.150) shows that:
Someone who is very highly motivated canread very difficult materials, where the mis-match between reading ability and readabili-ty is considerable.
He gives some examples: low-ability readers are ableto successfully complete a tax return or decipher acomplex medical chart when failure to do so wouldresult in serious negative consequences for thesereaders. Even though motivation and the other extra-linguistic variables are known to be critical, theirsubjectivity means that most experiments are unableto control for them.
3.5 Other metrics related to readabilityAn abundance of metrics in the CL literature has ledto conceptual confusion. Many of the metrics do not,in fact, deal with monolingual document production,as is the case with readability; they deal instead withthe work of translating a text from a source languageinto a target language. This is not to say that read-ability is of no interest to the field of translation; Iwould argue that an understanding of how to producereadable documents in English is vital to any transla-tor working into or out of English. However, the factthat many people in the field confuse essentiallymonolingual metrics like readability with translation-oriented metrics makes the need for terminologicalrigour all the more urgent. Some of the main metricswith which readability can be confused are detailedbelow.
3.5.1 ComprehensibilityAs pointed out by Roturier (2006, p.3), comprehensi-bility should be defined as the ease with which atranslation can be understood by its reader. However,in the literature, comprehensibility is often used syn-onymously with comprehension, understandabilityand understanding. Is comprehensibility the same asunderstanding? Few CL works explicitly define themetrics they use in their research and often use terms
interchangeably. The conceptual map of the fieldbecomes still more confused when translatability isintroduced.
3.5.2 TranslatabilityThis concept is generally taken to be the extent towhich a document is amenable to processing byeither a human translator or, more often, a machinetranslation system. However, Reuther (2003)declares readability to be a subset of translatability,while authors like Hargis (2000) reverse this positionentirely and see translatability as being just one levelof readability.
3.5.3 UsabilityAuthors like Redish (2000) and Schriver (2000) seeusability as a metric which completely excludes theneed for readability and comprehension. For them,the aim is to read to do, or to read to carry out a pro-cedure successfully. They see the reader's level ofunderstanding as unimportant, once the documenthas been 'used' effectively and the desired result hasbeen achieved.
3.5.4 OthersAside from these major concepts, other authors intro-duce even more 'similar-yet-different' ways to look atCL texts. For example, Puurtinen (1995, p.230)defines 'acceptability' as the readability and speaka-bility of a text as well as how well a text receiveraccepts a translated text as cohesive, coherent andcapable of utilization. She defines 'accessibility' asthe ease of comprehension due to the style of writing.Furthermore, Hargis (2000, p.123) sees conceptssuch as 'learnability' and 'doability' as being merelydifferent levels of readability.
Regardless of whether the above definitions are accu-rate, it is certain that conceptual organisation isrequired. How might we introduce such terminolog-ical rigour to the field?
3.6 Introducing terminological rigourThe various metrics are highly interrelated: as muchas some concepts can appear to contradict each other,others can be shown to be highly complementary.For example, O'Brien and Roturier (2007) were ableto show that many of the CL rules used in their sepa-rate studies had a high impact on both comprehensi-bility and post-editing effort, suggesting that theseconcepts complement each other.
Thus, a way of mapping CL metrics is required thataccounts for such interrelations, complementarities
39
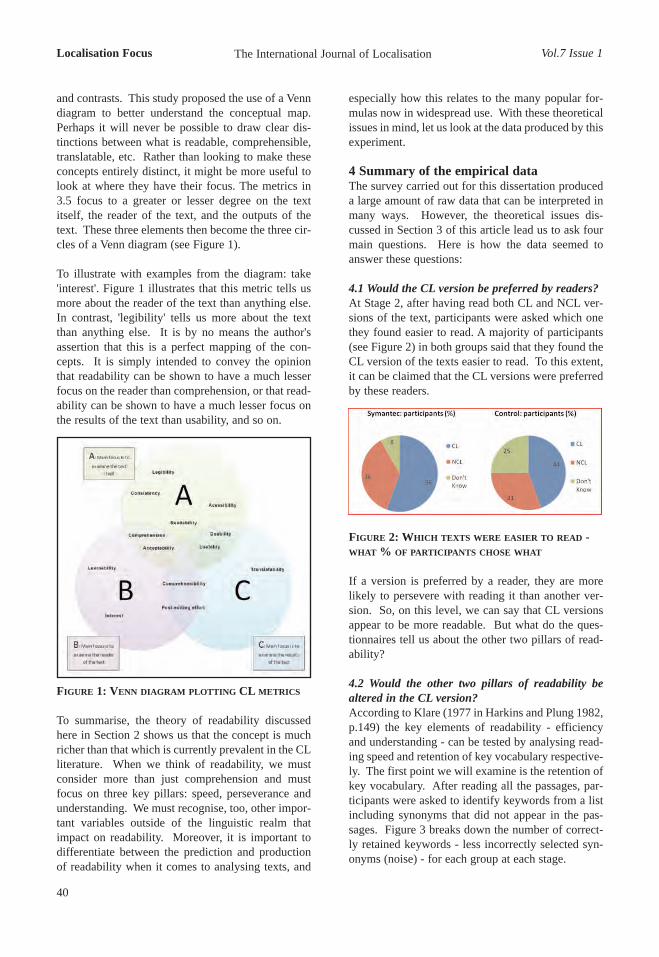
Localisation Focus Vol.7 Issue 1The International Journal of Localisation
and contrasts. This study proposed the use of a Venndiagram to better understand the conceptual map.Perhaps it will never be possible to draw clear dis-tinctions between what is readable, comprehensible,translatable, etc. Rather than looking to make theseconcepts entirely distinct, it might be more useful tolook at where they have their focus. The metrics in3.5 focus to a greater or lesser degree on the textitself, the reader of the text, and the outputs of thetext. These three elements then become the three cir-cles of a Venn diagram (see Figure 1).
To illustrate with examples from the diagram: take'interest'. Figure 1 illustrates that this metric tells usmore about the reader of the text than anything else.In contrast, 'legibility' tells us more about the textthan anything else. It is by no means the author'sassertion that this is a perfect mapping of the con-cepts. It is simply intended to convey the opinionthat readability can be shown to have a much lesserfocus on the reader than comprehension, or that read-ability can be shown to have a much lesser focus onthe results of the text than usability, and so on.
FIGURE 1: VENN DIAGRAM PLOTTING CL METRICS
To summarise, the theory of readability discussedhere in Section 2 shows us that the concept is muchricher than that which is currently prevalent in the CLliterature. When we think of readability, we mustconsider more than just comprehension and mustfocus on three key pillars: speed, perseverance andunderstanding. We must recognise, too, other impor-tant variables outside of the linguistic realm thatimpact on readability. Moreover, it is important todifferentiate between the prediction and productionof readability when it comes to analysing texts, and
40
especially how this relates to the many popular for-mulas now in widespread use. With these theoreticalissues in mind, let us look at the data produced by thisexperiment.
4 Summary of the empirical dataThe survey carried out for this dissertation produceda large amount of raw data that can be interpreted inmany ways. However, the theoretical issues dis-cussed in Section 3 of this article lead us to ask fourmain questions. Here is how the data seemed toanswer these questions:
4.1 Would the CL version be preferred by readers?At Stage 2, after having read both CL and NCL ver-sions of the text, participants were asked which onethey found easier to read. A majority of participants(see Figure 2) in both groups said that they found theCL version of the texts easier to read. To this extent,it can be claimed that the CL versions were preferredby these readers.
FIGURE 2: WHICH TEXTS WERE EASIER TO READ -WHAT % OF PARTICIPANTS CHOSE WHAT
If a version is preferred by a reader, they are morelikely to persevere with reading it than another ver-sion. So, on this level, we can say that CL versionsappear to be more readable. But what do the ques-tionnaires tell us about the other two pillars of read-ability?
4.2 Would the other two pillars of readability bealtered in the CL version?According to Klare (1977 in Harkins and Plung 1982,p.149) the key elements of readability - efficiencyand understanding - can be tested by analysing read-ing speed and retention of key vocabulary respective-ly. The first point we will examine is the retention ofkey vocabulary. After reading all the passages, par-ticipants were asked to identify keywords from a listincluding synonyms that did not appear in the pas-sages. Figure 3 breaks down the number of correct-ly retained keywords - less incorrectly selected syn-onyms (noise) - for each group at each stage.

Localisation Focus Vol.7 Issue 1The International Journal of Localisation
FIGURE 3: NUMBER OF KEYWORDS CORRECTLYRETAINED MINUS NOISE
Overall, this shows that more key vocabulary wascorrectly retained with less noise when the CL ver-sion was read. This result indicates that retention isbetter when a CL version is used, and that, on thislevel, the CL texts were more readable. However, aswe know from 3.1, readability is about more than justretention and perseverance. The last element to betested was reading speed.
Figures 4 and 5 show that in the majority of texts, forboth groups and at both stages, the CL versions actu-ally took longer to read. This was an unexpectedresult and was probably due to the fact that themethod of timing used was crude and inaccurate; inthe study, participants were asked to use a regularwall clock and note starting and finishing times onthe questionnaire sheet. This might be sufficient forvery long time periods, but in this study, with suchshort passages, accurate counting of seconds andeven milliseconds would have provided much richerdata. In this way, the use of eye-tracking software infuture work, with its accurate time measurement andcomplex reading-pattern display, would bring greatbenefits.
FIGURE 4: BREAKDOWN OF AVERAGE READINGSPEED PER WORD PER TEXT FOR SYMANTEC (SEC-ONDS)
FIGURE 5: BREAKDOWN OF AVERAGE READINGSPEED PER WORD PER TEXT FOR CONTROL (SEC-ONDS)
In summary, speed was not positively impacted byapplying CL rules, though retention and perseverancewere: therefore, it would seem that applying CL rulesto technical documents does increase readability.
4.3 Would the formulas' predictions correspond toreaders' opinions?Overall, it seemed that the predictions made by theformulas did not correspond to what readers thought.Figure 6 illustrates that for both groups the majorityof readers' ratings did not correctly correspond to thereadability formula predictions.
FIGURE 6: NO. OF TIMES READERS' RATINGSCORRECTLY CORRESPONDED TO FORMULA PREDIC-TIONS
The formulas chosen do not appear to be useful pre-dictive tools. However, there was another group ofdata that told a different story: participants wereasked in the questionnaire to underline any parts ofthe text that they found difficult to read. By verycrudely counting the number of texts in which partic-ipants underlined something for reading difficulty, itcan be shown that the formulas actually predicted therelationship between the three passages correctly.Thus, in Table 1 we see that in the naturally-occur-ring NCL versions, 'Norton' had the most responseswith underlined sections (17), 'Shared' had the least(11), and 'HijackThis' came in the middle (13). Thiscorresponds exactly to the ranking for difficulty thatthe formulas predicted in Section 2.
41
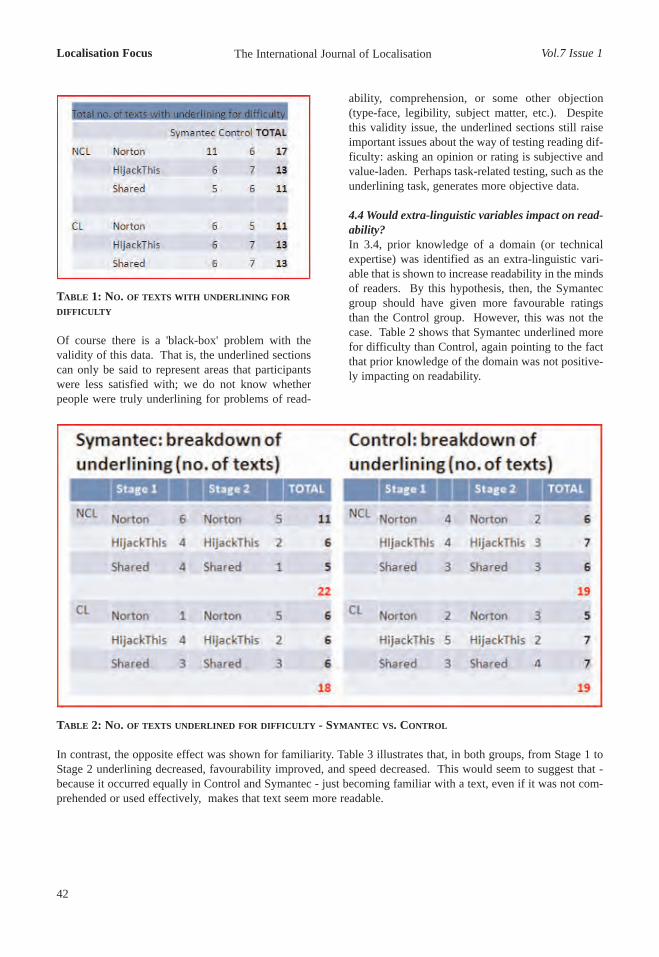
Localisation Focus Vol.7 Issue 1The International Journal of Localisation
TABLE 1: NO. OF TEXTS WITH UNDERLINING FORDIFFICULTY
Of course there is a 'black-box' problem with thevalidity of this data. That is, the underlined sectionscan only be said to represent areas that participantswere less satisfied with; we do not know whetherpeople were truly underlining for problems of read-
ability, comprehension, or some other objection(type-face, legibility, subject matter, etc.). Despitethis validity issue, the underlined sections still raiseimportant issues about the way of testing reading dif-ficulty: asking an opinion or rating is subjective andvalue-laden. Perhaps task-related testing, such as theunderlining task, generates more objective data.
4.4 Would extra-linguistic variables impact on read-ability?In 3.4, prior knowledge of a domain (or technicalexpertise) was identified as an extra-linguistic vari-able that is shown to increase readability in the mindsof readers. By this hypothesis, then, the Symantecgroup should have given more favourable ratingsthan the Control group. However, this was not thecase. Table 2 shows that Symantec underlined morefor difficulty than Control, again pointing to the factthat prior knowledge of the domain was not positive-ly impacting on readability.
42
TABLE 2: NO. OF TEXTS UNDERLINED FOR DIFFICULTY - SYMANTEC VS. CONTROL
In contrast, the opposite effect was shown for familiarity. Table 3 illustrates that, in both groups, from Stage 1 toStage 2 underlining decreased, favourability improved, and speed decreased. This would seem to suggest that -because it occurred equally in Control and Symantec - just becoming familiar with a text, even if it was not com-prehended or used effectively, makes that text seem more readable.

Localisation Focus Vol.7 Issue 1The International Journal of Localisation
TABLE 3: FAMILIARITY APPEARED TO HAVE ASTRONGLY POSITIVE IMPACT ON READABILITY
The final extra-linguistic variable that was tested bythis study was participant profile. In particular,native-English ability was shown to have a strongimpact on views of readability. By comparingFigures 7 and 8, it can be seen that non-native speak-ers found the CL versions easier to read, while nativespeakers tended to find the NCL versions easier toread. This is not a criticism of the non-native speak-ers' English ability: most rated themselves 8, 9 or 10,where 10 represented native-level fluency. This dif-ference most likely comes about because nativespeakers are much more familiar with, and tolerantof, the eccentricities and exceptions of naturally-occurring language.
FIGURE 8: NATIVE SPEAKERS FOUND NCL MOREREADABLE
5 Conclusions
In conclusion, therefore, this work has provided newempirical data, albeit limited in scope, to show thatCL versions are thought to be easier to read; areviewed more favourably; and encourage better reten-tion of keywords. In short, this data seems to suggestthat the application of CL rules increases readability.However, these are not the only conclusions thatshould be drawn from this experiment.
One such additional conclusion concerns readabilityformulas. Overall, this study appeared to show thatthe formulas made inaccurate predictions. Most criti-cisms of formulas probably arise because of peopleincorrectly using them in ways for which they werenot intended: as guidelines for writing or as tools forcorrection. If the formulas are used within theirrecognised limitations - as rough predictors of diffi-culty to prompt more detailed textual analysis - then
43
FIGURE 7: NON-NATIVE SPEAKERS FOUND CL MOREREADABLE

Localisation Focus Vol.7 Issue 1The International Journal of Localisation
they may have more merit.
An important conclusion that needs to be made, too,is that much work remains to be done on clarifyingthe many metrics that are used in the field of CL. Theideas presented in this study are a tentative first stepat disentangling the web. Rather than thinking thatone form of analysis is better or worse, any newapproach should encourage people just to considerthe appropriateness of each metric to their situation.
The final conclusion concerns recommendations forhow future studies might proceed. Clearly, morewidely-differing texts will produce more noticeabletrends in the data: the documents presented in thisstudy were all from the same original document andwere selected only based on the predictions of read-ability formulas. Future studies should incorporatenot only formulas, but also semantic assessments,expert advice from the users or authors of the texts,and other criteria to decide the difficulty of the pas-sages to be experimented on. Similarly, such testsshould try to incorporate extra-linguistic variablesinto their methodologies.
Hopefully this article has shown that analysing textsfor readability is a useful exercise in the field of CL.By making us consider key elements like readingspeed, reader perseverance and reader understanding,as well as influential external factors like motivationand familiarity, the study of readability can promotea comprehensive approach to the theory of documentproduction.
ReferencesCrystal, D. 1992. An encyclopedic dictionary of lan-guage and languages. Oxford, UK; Cambridge,Mass., USA: Blackwell.
Crystal, D. 1997. The Cambridge encyclopedia oflanguage. 2nd ed. Cambridge; New York: CambridgeUniversity Press.
Dale, E. and Chall, J.S. 1948. A formula for predict-ing readability: Instructions. Educational researchbulletin. 27 (2). pp.37-54.
Davison, A. and Kantor, R.N. 1982. On the failure ofreadability formulas to define readable texts. Readingresearch quarterly. 17 (2), pp.187-209.
DuBay, W.H. 2004. The principles of readability[Online]. Available from: http://www.impact-infor-mation.com/impactinfo/readability02.pdf [Accessed
2 September 2008].
Farrington, G. 1996. AECMA Simplified English: anoverview of the international aircraft maintenancelanguage. IN: Proceedings of the first controlled lan-guage application workshop, March 1996. Leuven:Centre for Computational Linguistics, pp.1-21.
Flesch, R. 1948. A new readability yardstick. Journalof applied psychology. 32 (3), pp.221-233.
Fry, E.B. 1968. A readability formula that saves time.Journal of reading. 11, pp.513-516 and pp.575-578.
Giles, T.D. and Still, B. 2005. A syntactic approach toreadability. Journal of technical writing and commu-nication. 35 (1), pp.47-70.
Grover, C., Holt, A., Klein, E. and Moens, M. 2000.Designing a controlled language for interactivemodel checking. IN: Proceedings of the third interna-tional workshop on controlled language applications.April 2000. Seattle: ANLP/NACLA, pp.90-104.
Gunning, R. 1952. The technique of clear writing.New York: McGraw-Hill.
Hargis, G. 2000. Readability and computer documen-tation. ACM journal of computer documentation. 24(3), pp.122-131.
Harkins, C. and Plung, D.L. 1982. A guide for writ-ing better technical papers. New York: IEEE Press.
Hayes, P., Maxwell, S. and Schmandt, L. 1996.Controlled English advantages for translated andoriginal English documents. IN: Proceedings of thefirst controlled language application workshop,March 1996. Leuven: Centre for ComputationalLinguistics, pp.84-92.
Klare, G.R. 1963. The measurement of readability.Ames, Iowa: Iowa State University Press.
Klare, G.R. 1974. Assessing readability. Readingresearch quarterly. 10 (1), pp.62-102.
Klare, G.R. 2000. Readable computer documentation.ACM journal of computer documentation. 24 (3),pp.148-168.
Knops, U. 2000. Efficient roll-in and roll-out of con-trolled language applications. IN: Proceedings of thethird international workshop on controlled language
44

Localisation Focus Vol.7 Issue 1The International Journal of Localisation
45
applications. April 2000. Seattle: ANLP/NACLA,pp.134-135.
Nyberg, E.H. and Mitamura, T. 1996. Controlled lan-guage and knowledge-based machine translation:principles and practice. IN: Proceedings of the firstcontrolled language application workshop, March1996. Leuven: Centre for ComputationalLinguistics, pp.74-83.
O'Brien, S. 2003. Controlling controlled English: ananalysis of several controlled language rule sets. IN:European association for machine translation: inter-national workshop, May 2003. Dublin: Dublin CityUniversity, pp.105-114.
O'Brien, S. and Roturier, J. 2007. How portable arecontrolled languages rules: a comparison of twoempirical MT studies [Online]. Available from:http://www.mt-archive.info/MTS-2007-OBrien.pdf[Accessed 2 September 2008].
Puurtinen, T. 1995. Linguistic acceptability in trans-lated children's literature. Joensuu: University ofJoensuu.
Redish, J. 2000. Usability testing reveals more thanreadability formulas reveal. ACM journal of comput-er documentation. 24 (3), pp.132-137.
Reuther, U. 1998. Controlling language in an indus-
trial application. IN: Proceedings of the second inter-national workshop on controlled language applica-tions. May 1998. Pennsylvania: Carnegie MellonUniversity, pp.174-184.
Reuther, U. 2003. Two in one - can it work?Readability and translatability by means of con-trolled language. IN: European association formachine translation: international workshop, May2003. Dublin: Dublin City University, pp.124-132.
Roturier, J. 2006. An investigation into the impact ofcontrolled English rules on the comprehensibility,usefulness and acceptability of machine-translatedtechnical documentation for French and Germanusers. PhD Thesis. Dublin City University.
Schriver, K. 2000. Readability formulas in the newmillennium: what's the use? ACM journal of comput-er documentation. 24 (3), pp.138-140.
Spaggiiari, L., Beaujard, F. and Canneson, E. 2003. Acontrolled language at airbus. IN: European associa-tion for machine translation: international workshop,May 2003. Dublin: Dublin City University, pp.151-159.

Localisation Focus Vol.7 Issue 1The International Journal of Localisation
46
Guidelines for AuthorsLocalisation Focus
The International Journal of LocalisationDeadline for submissions for VOL 8 Issue 1 is 15 June 2009
Localisation Focus -The International Journal of Localisation provides a forum for localisation professionals andresearchers to discuss and present their localisation-related work, covering all aspects of this multi-disciplinaryfield, including software engineering and HCI, tools and technology development, cultural aspects, translationstudies, human language technologies (including machine and machine assisted translation), project management,workflow and process automation, education and training, and details of new developments in the localisationindustry.
Proposed contributions are peer-reviewed therebyensuring a high standard of published material.
If you wish to submit an article to LocalisationFocus-The international Journal of Localisation,please adhere to these guidelines:
l Citations and references should conform to the University of Limerick guide to the Harvard Referencing Style
l Articles should have a meaningful titlel Articles should have an abstract. The abstract
should be a minimum of 120 words and be autonomous and self-explanatory, not requiring reference to the paper itself
l Articles should include keywords listed after the abstract
l Articles should be written in U.K. English. If English is not your native language, it is advisableto have your text checked by a native English speaker before submitting it
l Articles should be submitted in .doc or .rtf format,.pdf format is not acceptable
l Article text requires minimal formatting as all content will be formatted later using DTP software
l Headings should be clearly indicated and numbered as follows: 1. Heading 1 text, 2. Heading 2 text etc.
l Subheadings should be numbered using the decimal system (no more than three levels) as follows:
Heading1.1 Subheading (first level)1.1.1 Subheading (second level)1.1.1.1 Subheading (third level)
l Images/graphics should be submitted in separate files (at least 300dpi) and not embedded in the textdocument
l All images/graphics (including tables) should be annotated with a fully descriptive caption
l Captions should be numbered in the sequence theyare intended to appear in the article e.g. Figure 1, Figure 2, etc. or Table 1, Table 2, etc.
More detailed guidelines are available on request byemailing [email protected] or visiting www.localisation.ie

Localisation Focus Vol.7 Issue 1The International Journal of Localisation
47

Localisation FocusThe International Journal of Localisation
VOL. 7 Issue 1 (2008)
CONTENTS
EditorialReinhard Schäler …………………………………………………………………… 3
Research articles:
Systematic validation of localisation across all languagesMartin Orsted ………………………………………………...………………….... 4
Productivity and quality in the post-editing of outputs from translation memo-ries and machine translationAna Guerberof Arenas ……………………………………………………............. 11
A comparison of statistical post-editing on Chinese and JapaneseMidori Tatsumi & Yanli Sun ………………........................................................... 22
Readability: Examining its usefulness in the field of controlled languagePatrick Cadwell ……………………………………………………………............ 34