local structural characterisation (inorganic materials series) || solid-state nuclear magnetic...
TRANSCRIPT

1Solid-State Nuclear MagneticResonance Spectroscopy
Sharon E. Ashbrook, Daniel M. Dawson and John M. GriffinSchool of Chemistry, University of St Andrews, St Andrews, UK
1.1 OVERVIEW
Although solution-state nuclear magnetic resonance (NMR)spectroscopy is one of the most widely applied analytical tools inchemistry, providing a sensitive probe of local structure for systemsranging from small molecules to large proteins, it is only relativelyrecently that solid-state NMR has been able to provide information of asimilar quality. The anisotropic (i.e. orientation-dependent) interactionsaffecting NMR spectra, which ultimately provide valuable informationabout structure, symmetry and bonding, are averaged in solution by therapid tumbling motion of the molecules, resulting in simplified spectrafrom which information can be more easily obtained. In contrast, NMRspectra of solids remain broadened by these interactions, hindering theextraction of structural information. This broadening poses significantchallenges both in the acquisition of high-resolution NMR spectrafor solids and in their interpretation and analysis. However, in recentyears considerable developments in hardware (e.g. increasing magneticfield strengths) and in software (e.g. improvements in computationalsimulations and analysis packages) have enabled solid-state NMR to
Local Structural Characterisation, First Edition. Edited by Duncan W. Bruce,Dermot O’Hare and Richard I. Walton.© 2014 John Wiley & Sons, Ltd. Published 2014 by John Wiley & Sons, Ltd.

2 SOLID-STATE NUCLEAR MAGNETIC RESONANCE SPECTROSCOPY
develop to the point where it can play a central role in the atomic-levelunderstanding of materials as diverse as zeolites, glasses, polymers,energy materials, pharmaceuticals and proteins.
The ability of NMR spectroscopy to probe the local atomic-scaleenvironment, without any requirement for long- or short-range order,enables it to be used alongside more conventional diffraction-basedapproaches for the study of solids. The sensitivity of NMR to smallchanges in the local environment (and its element specificity) makesit an ideal approach for studying disorder in solids, be it positionalor compositional, resulting in numerous applications to the study ofglasses, gels and ceramics. NMR is also an excellent probe of dynamics,sensitive to motion over a wide range of timescales, depending uponthe exact experiment used. However, despite this wealth of information,the interpretation of solid-state NMR spectra and the extraction ofrelevant structural detail remain a challenge. In recent years there hasbeen growing interest in the use of computational methods alongsideexperimental measurement. While there has been a long tradition inquantum chemistry of the calculation of NMR parameters from firstprinciples, much of the development has been focused on molecules(either in vacuum or in solution), rather than on the extended andperiodic structures found in the solid state. Recent methods utilisingperiodic approaches to recreate the three-dimensional (3D) structurefrom a high-symmetry small-volume unit have found great favour withexperimentalists, and are currently being applied to a wide range ofdifferent systems, helping to interpret complex NMR spectra, improvestructural models and provide new insight into disorder and/or dynamics.
At first sight, the vast array of NMR experiments in the literaturecan seem daunting to the non-specialist; however they can be easilycategorised by their overall aim. Many experiments are designed toimprove resolution and/or sensitivity, typically through more efficientremoval of anisotropic broadening – an enduring theme in solid-stateNMR spectroscopy. Experiments have also been developed to measurethe magnitudes of individual interactions, providing information on localgeometry or symmetry, for example. Further experiments are concernedwith the transfer of magnetisation between different nuclei, probingtheir through-bond or through-space connectivity. In many cases, theexact experimental detail is not of vital importance; it is more useful tounderstand the type of information available from a particular NMRspectrum and how it can be extracted. In this chapter, we will give anoverview of solid-state NMR spectroscopy, focusing in particular uponits application to inorganic solids. We briefly introduce the theoretical

THEORETICAL BACKGROUND 3
basis of the technique and the interactions that affect NMR spectra (andultimately provide information). We describe the basic and routinelyused experimental techniques, and the information that is availablefrom solid-state NMR spectra. We then review the nuclear species mostcommonly studied and provide a range of examples of the applicationof NMR spectroscopy for a wide variety of materials, demonstrating theversatility and promise of the technique.
1.2 THEORETICAL BACKGROUND
A brief description of the theoretical basis of NMR spectroscopy isprovided here. For a detailed description, see references [1, 2].
1.2.1 Fundamentals of NMR
Atomic nuclei possess an intrinsic spin angular momentum, I, describedby the nuclear spin quantum number, I, which may take any positiveinteger or half-integer value. The projection of I onto a specified axis,arbitrarily the z-axis, is quantised in units of mI�, where mI is themagnetic quantum number, and takes values between +I and −I ininteger steps, leading to 2I + 1 degenerate spin states. Nuclei with I > 0possess a magnetic dipole moment, μ, related to I by the gyromagneticratio, γ , which is characteristic of a given nuclide. Therefore, μ isquantised along the (arbitrary) z-axis in units of γ mI�. When an externalmagnetic field, B0, is present, the axis of quantisation is defined andthe degeneracy of the nuclear spin states is removed. The field-inducedsplitting of nuclear energy levels is known as the Zeeman interaction,with the Zeeman energy of a state, mI, given by:
EmI= −γ mI � B0 (1.1)
as shown in Figure 1.1. Only transitions with �mI = ±1 are observablein NMR spectroscopy and, therefore, all observable transitions aredegenerate, with a frequency:
ω0 = −γ B0 (1.2)
where ω0 is the Larmor frequency, with units of rad s−1 (or v0 = ω0/2π ,in Hz). In a macroscopic sample at thermal equilibrium, nuclei occupyenergy levels according to the Boltzmann distribution. The equilibrium

4 SOLID-STATE NUCLEAR MAGNETIC RESONANCE SPECTROSCOPY
B0
(a) (b) (c)
mI = −1/2
mI = +1/2
ΔE = −γhB0
Figure 1.1 (a) In the absence of an external magnetic field, all orientations ofthe nuclear magnetic moment are degenerate. (b) An external magnetic field, B0,aligns the nuclear spins and lifts the degeneracy of the nuclear spin energy levelsthrough the Zeeman interaction. (c) For a nucleus with spin quantum number I (hereI = 1/2), this gives rise to 2I + 1 spin states of energy mI�γ B0, and 2I degeneratetransitions with frequency ω0.
population difference gives rise to a bulk nuclear magnetisation, whichmay be represented by a vector, M, aligned with the field. The magnitudeof M is exponentially dependent on ω0, so that, at a given field strength,M is much larger for nuclei with higher γ and, for a given nucleus,the magnitude of M will increase with field strength. Typically, there-fore, high magnetic field strengths are employed in NMR spectroscopy(usually between 4 and 24 T) to ensure sufficient sensitivity.
1.2.2 Acquisition of Basic NMR Spectra
In the simplest NMR experiment, a short 'pulse' of high-power radiofre-quency (rf) electromagnetic radiation is applied to the sample, excitingtransitions with energies corresponding to its frequency, ωrf. While allNMR experiments are performed in the static or 'laboratory' frame (i.e.a static Cartesian coordinate system); it is convenient to consider theeffects of a pulse in the rotating frame; a coordinate system in whichthe z-axis remains aligned with B0 and the xy-plane rotates around thez-axis at a frequency of ωrf. In the laboratory frame, the pulse appearsas two counter-rotating magnetic fields, with angular frequencies +ωrfand −ωrf. In the rotating frame, the first of these components appearsstatic and the second rotates at −2ωrf. The static component interactswith nuclear spins, while the rotating component has no effect.
The static field, B1, supplied by the pulse causes nutation of M aboutB1 at a frequency ω1 = −γ B1 for the duration of the pulse, τp. Pulses

THEORETICAL BACKGROUND 5
are generally described by a 'flip angle', β = ω1τp, the angle throughwhich M nutates during the pulse. The phase, φ, of a pulse indicates thedirection along which B1 lies in the rotating frame, and a pulse of flipangle β and phase φ is described using the notation βφ . The simplest(sometimes termed 'one-pulse') NMR experiment begins by applying a90◦ pulse to the system and so creating magnetisation in the transverse(xy) plane (as shown in Figure 1.2). After the pulse, M precesses aboutthe z-axis with a frequency Ω = ω0 − ωrf. This precession is recorded,typically by two orthogonal detectors in the xy-plane, leading to acomplex time-dependent signal, S(t), known as a free induction decayor FID. Fourier transformation of S(t) yields the frequency domainsignal, S(ω), or spectrum. In most NMR experiments, 'signal averaging'is carried out, with an experiment repeated N times, and the resultingFIDs co-added. As shown in Figure 1.3, this enables an improvementin the signal-to-noise ratio (SNR) of the resulting spectrum, as the truesignal increases linearly with N, whereas random noise increases with√
N, giving a√
N increase in the SNR. Signal averaging is extensivelyused in NMR, especially in cases where sensitivity is low.
FT
y
x
M
y
x
M
B1
y
x
M
β
Ω
Ω
S(t)
Mag
netis
atio
n
Time
(d)
S(ω)
Frequency0
z zz(a) (b) (c)
Figure 1.2 (a) Vector model representation of the bulk magnetisation vector, M,aligned along the z-axis of the rotating frame. (b) A pulse applied along the x-axiscauses nutation of M in the yz-plane. (c) M then undergoes free precession (andrelaxation) in the xy-plane at a frequency Ω. (d) Fourier transformation (FT) of theresulting time domain signal, S(t), yields the frequency domain spectrum, S(ω).

6 SOLID-STATE NUCLEAR MAGNETIC RESONANCE SPECTROSCOPY
Average signal
FIDs:Signal:
SNR:
413.14.1
16608.3
6424416.1
256100032.1
(a)
(b)
Figure 1.3 (a) Schematic representation of signal averaging. An NMR experimentis repeated several times, with the FIDs co-added to improve the SNR. (b) 2H NMRspectrum of H2O (natural abundance), acquired with signal averaging of 4, 16, 64and 256 FIDs. The relative integrated intensity (or 'signal') and SNR are indicated.
While it would be preferable to begin acquiring the FID immediatelyafter the pulse, for a short time any detected signal will contain remnantsof the pulse itself (called 'pulse ringing'), which cause distortion andartefacts in the spectrum; thus there must be a short delay or 'dead time'(τD) before the FID is acquired. However, this may lead to the loss ofimportant information, particularly when lines are broad (as is oftenthe case in solid-state rather than solution-state NMR). One simple wayto overcome this problem is to use a 'spin echo' experiment, in whicha 180◦
x pulse is applied a short time, τ , after an initial 90◦x pulse,
as shown in Figure 1.4.[3] This second pulse inverts the magnetisationabout the x-axis, with the result that, after a second τ period, M isonce again orientated along −y. By setting τ to be greater than τD, itis possible to obtain information that would otherwise have been lost ina one-pulse experiment. The spin echo is also an integral part of manyother NMR experiments.
90°
τ τ
90° 180°(a) (b)
Figure 1.4 Pulse sequences for (a) one-pulse and (b) spin echo experiments. Pulsesare shown as dark grey blocks and the dead time, τD, is marked in light grey. Byrefocusing the magnetisation at a time, τ (where τ > τD), after the 180◦ pulse, thespin echo experiment allows acquisition of the whole FID, including any informationthat would be lost during τD in a one-pulse experiment.

THEORETICAL BACKGROUND 7
1.2.3 Relaxation
In order for signal averaging to be successful, the nuclear spinpopulation must return to thermal equilibrium prior to acquisition ofsuccessive FIDs. The return of the magnetisation to equilibrium, termed'relaxation', is described by a time constant, T1 (the longitudinal relax-ation constant). It is often assumed that equilibrium has been restoredafter ∼5T1, and usually it is best to wait for this time between the acqui-sition of successive FIDs. Although T1 relaxation times in solution-stateNMR can be rapid (typically a few milliseconds), in the solid state theycan be much longer (typically a few seconds, but up to many minutesor even hours). Therefore, the acquisition of NMR spectra of solidscan be a time-consuming process, requiring, in some cases, very longexperiments to achieve an acceptable SNR. In addition to longitudinalrelaxation, various processes also attenuate the transverse magnetisa-tion. Transverse relaxation can have a number of different contributions,but is generally described by the time constant T2; typically, in solids,T1 � T2. Transverse relaxation can alter the width and shape of theline observed in the spectrum, with the shape dependent on the natureof the distribution of frequencies (usually described by a mixture ofGaussian and Lorentzian behaviour) and the width related to 1/T2.
1.2.4 Interactions in NMR Spectroscopy
NMR spectroscopy provides a valuable analytical tool, as, in additionto the Zeeman interaction, nuclear spins are also affected by a variety ofother interactions, either between two spins or between the spin and itslocal environment. These provide a sensitive probe of the local structure,symmetry and bonding in a molecule or a solid. Table 1.1 summarisesthese interactions, their origin and magnitude and the effect they haveupon NMR spectra of liquid and solid samples.
1.2.4.1 Chemical Shielding
Although the Larmor frequency, ω0, depends in principle only upon γ
and B0, in most NMR spectra multiple resonances are observed in thespectrum for any one nuclear species. This is a result of the circulation of

8 SOLID-STATE NUCLEAR MAGNETIC RESONANCE SPECTROSCOPY
Table 1.1 Summary of the interactions affecting NMR spectra of liquid and solidsamples.
Interaction Description Magnitude/Hz
Solution Solid
Zeeman Interaction of magneticdipole moments withexternal magneticfield
107 –109 yes yes
Shielding Alteration of localmagnetic field bysurrounding electrons
102 –105 isotropic anisotropic
Dipolarcoupling
Through-space magneticspin–spin coupling
103 –105 0 anisotropic
J coupling Spin–spin interactionmediated by thebonding electrons
1–103 isotropic anisotropic
Quadrupolar Interaction of nuclearquadrupole momentwith electric fieldgradient (EFG)
103 –107 0 anisotropic
Paramagnetic Interaction with isolatedunpaired electrons inthe sample
102 –105 isotropic anisotropic
Knight shift Interaction withelectrons at the Fermilevel in metals
103 –106 no anisotropic
electrons around the nucleus when in an atom or molecule, generatinga magnetic field, B′, proportional to B0. In isolated atoms, B′ willalways oppose B0 (i.e. it will 'shield' the nucleus from the externalmagnetic field), but in molecules, B′ may oppose or augment B0 (i.e.provide a shielding or deshielding effect[4]). The effective magnetic fieldexperienced by a nucleus, Beff, is given by:
Beff = B0 − B′ = B0(1 − σ ) (1.3)
where σ is a field-independent shielding constant. The effect of this localmagnetic field is to alter the observed precession frequency, ωobs, ofa spin:
ωobs = −γ Beff = −γ B0(1 − σ ) (1.4)
resulting in different resonances in the NMR spectrum for magneticallyinequivalent nuclei. As an example, Figure 1.5 shows a 13C NMR spec-trum of solid l-alanine, where the three distinct chemical environments

THEORETICAL BACKGROUND 9
300 250 200 150 100 50 0
* *
1
3
2
1 2 3
H
δ (ppm)
ONC
Figure 1.5 13C MAS NMR spectrum of solid l-alanine. Asterisks denote the'spinning sidebands' of C1 (see Section 1.3.1.1). Three resonances are observed,arising from the three inequivalent carbons in the molecule. The integrated intensityratio (1.02 : 1.02 : 1.00) matches that expected from the structure (1 : 1 : 1).
result in three resonances in the spectrum, with relative intensities of1 : 1 : 1, as expected. In practice, the absolute value of σ is hard tomeasure, and instead a chemical shift, δ, is measured relative to theknown frequency of a reference compound, ωref. As generally σ � 1, δis typically reported in parts per million (ppm):
δ = 106(ωobs − ωref)/ωref (1.5)
It should be noted that δ is opposite in sign to σ , so that while σ is ameasure of shielding and increases with increasing B′, δ is a measure ofdeshielding and increases with increasing Beff.
In general, the electron distribution around a nucleus is rarely perfectlyspherical and, therefore, rather than using the scalar constant, σ , theshielding must be described by a shielding tensor, σ (and correspondingshift tensor, δ). The observed chemical shift, δ, of a resonance can beshown to be:
δ = δ11 sin2θ cos2φ + δ22 sin2θ sin2φ + δ33 cos2θ (1.6)
where δ11, δ22 and δ33 are the three principal components of δ whenexpressed in its principal axis system (see reference [4] for furtherdetails), and the angles θ and φ describe the orientation of the tensorrelative to the external field B0. Equation 1.6 can be rewritten as:
δ = δiso + (�/2) [(3 cos2 θ − 1) + η (sin2 θ cos 2φ)] (1.7)

10 SOLID-STATE NUCLEAR MAGNETIC RESONANCE SPECTROSCOPY
showing that the chemical shift contains both an isotropic (i.e.orientation-independent) term and an anisotropic (i.e. orientation-dependent) part. The isotropic chemical shift, δiso, is given by theaverage of the three principal components ((δ11 + δ22 + δ33)/3), while� = δ33 − δiso and η = (δ22 − δ11)/� are the magnitude and asymmetryof the shielding tensor, respectively.a In the solution state, the rapidtumbling motion of the molecules averages the anisotropic componentof the chemical shift to zero, leaving just the average or isotropic value,δiso; however, the important consequence of Equation 1.7 for solid-stateNMR spectroscopy is that the chemical shift will vary with crystalliteorientation, as shown in Figure 1.6. For powdered samples, where
δ11 = δ22 = δ33 = δ iso
δ11 = δ22
δ33
δ22
δ33
δ11
δ isoδδ
(a) (b)
(c)
(d)
Figure 1.6 (a) The anisotropic nature of the shielding results in a single orientation-dependent resonance for a single crystallite, multiple resonances for chemically equiv-alent sites in different crystallites and a powder-pattern lineshape in a polycrystallinesample. (b–d) Powder-pattern lineshapes simulated for (b) spherical (� = 0, η = 0),(c) axially symmetric (� �= 0, η = 0) and (d) axially asymmetric (� �= 0, η �= 0)shielding tensors. In each case, the isotropic shielding ((δ11 + δ22 + δ33)/3) is marked.
a Note there are several (often confusing) conventions for shielding in the literature; seereference [4].

THEORETICAL BACKGROUND 11
crystallites have all possible orientations, the result is a broadened or'powder-pattern' lineshape, with the centre of gravity at δiso. The widthand shape of the line are determined primarily by Δ and η, respectively,providing information on local structure and symmetry. This can beseen in Figure 1.6, in which simulated lineshapes corresponding tosites with spherical, axially symmetric and axially asymmetric shieldingare shown.
1.2.4.2 Internuclear Interactions
In addition to the shielding effects of nearby electrons, the position ofa spectral resonance is often affected by interactions with other nuclei.Nuclear dipole moments may couple either directly through space, as inthe dipolar interaction, or indirectly (mediated by electrons), as in thethrough-bond scalar or J coupling.[5] In the dipolar interaction, one spinis affected by the small, localised magnetic fields resulting from another.For an isolated spin pair, this results in an orientation-dependent splittingin the spectrum, proportional to:
ωD = −μ0
4π
γIγS�
r3IS
12
(3 cos2θ − 1) (1.8)
where rIS is the internuclear distance between spins I and S and θ is theangle between the internuclear vector and the external magnetic field,as shown in Figure 1.7. Therefore, for a powdered sample, where allcrystallite orientations are present, the result is a 'Pake doublet' powder-pattern lineshape. However, in most solids there is a virtually infinitenumber of I − S dipolar interactions present, and the orientation anddistance dependence of ωD leads to a Gaussian-like broadening of thespectrum, as shown in Figure 1.7d. The dipolar interaction is strongestfor high-γ nuclei that are close in space, such as 1H and 19F, and cansignificantly broaden the spectral lines, often over many kHz in the solidstate. In solution, however, the dipolar interaction is averaged to zeroby the rapid molecular tumbling.
Unlike solution-state NMR spectroscopy, J coupling is rarely observedin solid-state NMR spectra, as it is typically much smaller than the otheranisotropic interactions, as shown in Table 1.1. However, as J couplingacts exclusively through regions of shared electron density (e.g. covalentor hydrogen bonds), transfer of magnetisation using this interaction canbe used to probe connectivity in solids, as discussed in Section 1.3.1.3.

12 SOLID-STATE NUCLEAR MAGNETIC RESONANCE SPECTROSCOPY
300 200 100 0
δ (ppm)δ
θ
ωD
δ isoδ
2ωDPAS
B0
I
S
rIS
ωDPAS
δ iso
(a) (b)
(c)(d)
Figure 1.7 (a) Schematic representation of the dipolar interaction between twospins I and S. (b–c) Schematic NMR spectrum for a dipolar-coupled heteronucleartwo-spin I = S = 1/2 system for (b) a single crystallite and (c) a powdered sample.(d) 13C NMR spectrum of 2[13C]-glycine, showing the Gaussian-like broadenedlineshape observed for many solids where a variety of different dipolar interactionsare present.
1.2.4.3 The Quadrupolar Interaction
Around 75% of NMR-active nuclei are quadrupolar (i.e. have spin quan-tum number I > 1/2), and their spectra are additionally broadened bythe anisotropic interaction of the nuclear quadrupole moment, Q, withthe surrounding electric field gradient (EFG). This interaction is usu-ally described by its magnitude, CQ = eQVzz/h, and its asymmetry (orshape), ηQ = (Vyy − Vxx/Vzz), where Vii are the principal components ofthe tensor describing the EFG (see reference [6] for further details). Thecoordinating atoms provide a large contribution to the EFG (althoughmore remote atoms do, of course, have an effect in real materials). Asthe surroundings vary from a highly symmetric environment, such as

THEORETICAL BACKGROUND 13
A+
B−
3
4
5
6
7
8
Coo
rdin
atio
n nu
mbe
r
1614121086420
CQ / MHz
Figure 1.8 Calculated CQ values for a number of different (idealised) coordinationgeometries using a point-charge model. After Koller et al. (1994) [7].
octahedral coordination where the EFG is spherically symmetrical andCQ is zero, to a less symmetric one, such as square planar, the valueof CQ shows a corresponding increase, as shown in Figure 1.8 for anumber of (idealised) coordination geometries.
In many cases, the quadrupolar interaction can be very large: some-times many MHz in magnitude. However, in most practically relevantcases it remains smaller than the Zeeman interaction, and its effect canbe treated as a perturbation to the Zeeman energy levels. A spin I nucleushas 2I + 1 allowed orientations of the nuclear magnetic moment withrespect to B0, giving rise to 2I + 1 Zeeman energy levels, as shown inFigure 1.9a for a spin I = 3/2 nucleus. This results in 2I degeneratetransitions at the Larmor frequency, ω0. The effect of the quadrupolarinteraction (to a first-order approximation) is to perturb the energylevels and lift the degeneracy of the transitions, resulting (for nucleiwith half-integer spin quantum number) in a central transition (CT)unaffected by the quadrupolar interaction and satellite transitions (STs)with transition frequencies that depend upon the quadrupolar splittingparameter:
ωQ = (ωQPAS/2) [(3 cos2θ − 1) + ηQ (sin2θ cos 2φ)] (1.9)

14 SOLID-STATE NUCLEAR MAGNETIC RESONANCE SPECTROSCOPY
ZeemanFirst-order
quadrupolarSecond-orderquadrupolar
mI = −3/2
ST
ST
CTCT
ST
ST
CT
ST
ST
CT
ST ST
CT
CT
Frequency
ω0
ω0
ω0
~2 kHz
~300 kHz
mI = −1/2
mI = +1/2
ω0−2ωQ
ω0
ω0+2ωQ
2ωQ 2ωQ
STs (×8)
mI = +3/2
(a)
(c)
(d)
(b)
Figure 1.9 (a) Perturbation of the Zeeman energy levels of a spin I = 3/2 nucleusby the quadrupolar interaction. (b–c) Resulting spectra showing the effect of thefirst-order quadrupolar interaction for (b) a single crystallite and (c) a powderedsample. (d) Anisotropic broadening of the central transition (CT) by the second-orderquadrupolar interaction.
where ωQPAS, in rad s−1, is given by:
ωQPAS = 3π CQ/(2I(2I − 1)) (1.10)
as shown in Figure 1.9. For a single crystal, this would result in 2Iresonances, as shown in Figure 1.9b. However, in a powdered samplethe orientation dependence of ωQ results in a broadened powder-patternlineshape for the STs, while the CT remains unaffected, as in Figure 1.9c.In many cases the STs are so broad that spectral acquisition is onlyconcerned with the CT. For larger EFGs, this first-order approximationis insufficient to describe the spectrum and a second-order perturbationmust also be considered. The second-order quadrupolar interactionaffects all transitions within the spectrum, as shown in Figure 1.9a, andis also orientation dependent (although the dependence is more complexthan that shown in Equation 1.10). This has the result that the CTlineshape is also anisotropically broadened, as shown in Figure 1.9d.In general, the second-order quadrupolar broadening is much smallerthan the first-order quadrupolar interaction (as it is proportional to(ωQ
PAS)2/ω0, rather than ωQPAS), and it often results in linebroadening
over tens of kHz. It should be noted that for integer spins there isno CT, and all transitions are affected by the first-order quadrupolarinteraction, resulting in broadened lineshapes that can be difficult toacquire experimentally, unless CQ is small.

BASIC EXPERIMENTAL METHODS 15
1.3 BASIC EXPERIMENTAL METHODS
1.3.1 Spin I = 1/2 Nuclei
While all of the anisotropic interactions discussed above are present insolution, rapid tumbling of the molecules averages these interactionsto their isotropic values. Such motional averaging is absent in mostsolids, and solid-state NMR spectra of polycrystalline samples containinformation on both the isotropic and the anisotropic componentsof all of the interactions present. This wealth of information leadsto very broad, often overlapping lines, from which very little usefulinformation can be obtained. Many of the basic experimental approachesin solid-state NMR spectroscopy are therefore concerned with improvingspectral resolution and sensitivity.[1,2]
1.3.1.1 MAS and Decoupling
One widely used approach to obtaining high-resolution (isotropic) spec-tra is to mimic the orientational averaging that occurs in solution. Asdescribed above, the anisotropic parts of the dipolar, chemical shielding,J coupling (and first-order quadrupolar) interactions all have a similarorientational dependence, of the form (3 cos2θ − 1)/2. These interac-tions will therefore have a magnitude of zero when θ = 54.736◦. It isobviously not practically possible in a powdered sample to orient allcrystallites at this angle simultaneously. However, a similar effect can beachieved using a physical rotation of the sample about an axis inclinedat an angle, χ , of 54.736◦ to B0, in a technique called magic anglespinning (MAS),[8–10] shown schematically in Figure 1.10a. While allpossible crystallite orientations (β) are still present, if sample rotation issufficiently rapid the average orientation for every crystallite is the same,i.e. aligned along the rotor axis at χ = 54.736◦. It is possible to describethis mathematically by:
〈(1/2) (3 cos2θ − 1)〉 = (1/2) (3 cos2χ − 1) × (1/2) (3 cos2β − 1)(1.11)
where χ is the angle of the axis about which the sample is rotated and〈 〉 denotes the average orientation. The dramatic effect of MAS uponthe 31P NMR spectrum of the aluminophosphate, SIZ-4,[11] is shown inFigure 1.10c.

16 SOLID-STATE NUCLEAR MAGNETIC RESONANCE SPECTROSCOPY
χ = 54.736°
B0
0-80 kHz
20 kHz MAS
40 20 0 −80
δ (ppm)
−40 −60−20 40 20 0 −80
δ (ppm)
−40 −60−20
1 mm1.32.53.247
(a)
(c)
(b)
Figure 1.10 (a) Schematic depiction of the MAS experiment, in which a polycrys-talline sample is rotated about an axis inclined at the magic angle, χ , of 54.736◦ toB0. (b) Rotors of varying outer diameters, as described in Table 1.2. (c) The effectof MAS (20 kHz) upon the 31P NMR spectrum of the aluminophosphate, SIZ-4,[11]
which contains three crystallographically distinct phosphorus environments.
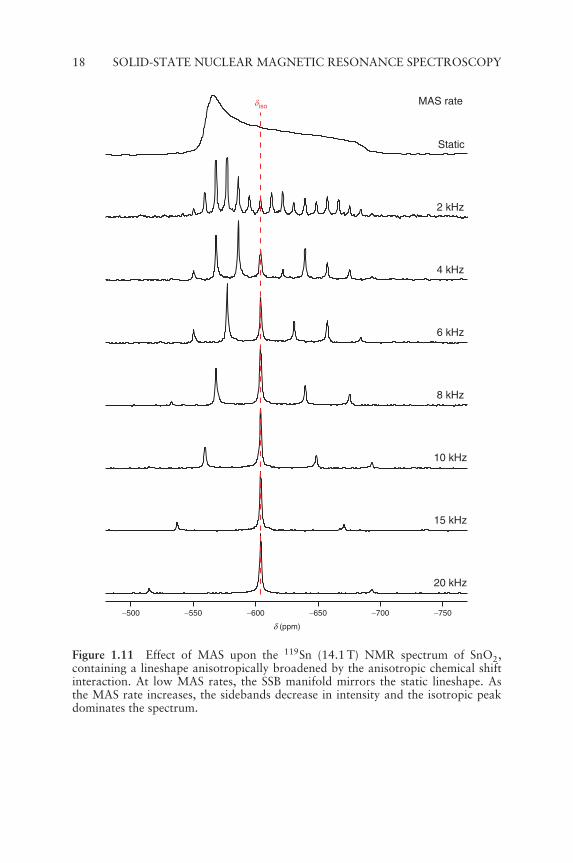
Practically, MAS is performed by packing the sample into a holderor 'rotor', typically machined from ZrO2 (a strong material that canwithstand the high forces associated with MAS), which is then rotated atrates of up to 80 kHz. Rotors of varying diameter are available, with themaximum possible MAS rate increasing as the rotor diameter decreases,as shown in Table 1.2 and Figure 1.10. The increase in rotation ratecomes with the compromise of sample volume and, therefore, sensitivity.However, in order for anisotropic interactions to be efficiently removed,the rotation must be 'fast' (relative to the magnitude of the interactionthat is to be removed).[9,10] Therefore, for 1H and 19F NMR, forexample, where the homonuclear dipolar interaction is large, it maybe desirable to spin at rapid rotation rates, i.e. 70–80 kHz, at theexpense of sample volume. If the rotation rate is not sufficiently fast, thepowder-pattern lineshape is broken into a series of 'spinning sidebands'(SSBs), separated by integer multiples of the spinning rate, ωR, from the

BASIC EXPERIMENTAL METHODS 17
Table 1.2 Practical considerations for experimentalimplementation of MAS NMR experiments.
Rotor diameter/mm
Maximum rotationrate/kHz
Sample volume/μl
14 ∼5 1000–30007 ∼7 300–5004 ∼15 50–90
3.2 ∼23 20–402.5 ∼35 ∼111.3 ∼65 ∼2
1 ∼80 0.8
isotropic peak. At slow MAS rates, the intensity of the SSB manifoldfollows the static lineshape, but at higher MAS rates this resemblance islost as the isotropic peak becomes more intense.[9,10] The effect of MASon a lineshape broadened by the chemical shielding anisotropy (oftenreferred to as the CSA) can be seen in Figure 1.11. For spin I = 1/2nuclei, the CSA is usually the dominant interaction, and it is relativelystraightforward to obtain information on the isotropic and anisotropiccomponents from the SSB intensities in a slow MAS NMR spectrum.MAS has the added benefit of partially removing the heteronucleardipolar coupling and anisotropic J interactions, increasing the resolutionand sensitivity of the spectrum.[9,10]
Rather than averaging crystallite orientations in real space, it is pos-sible to carry out averaging in 'spin space', i.e. by manipulating thenuclear spins using rf pulses. This approach, known as decoupling,[12,13]
is able to remove the dipolar coupling, which may, as we have seen, bea large interaction (and MAS rates may not be sufficient to remove itcompletely). Decoupling will also remove J couplings, although these aretypically much smaller. Heteronuclear decoupling,[12] i.e. the removalof the dipolar (or J) interaction between two different spins, I andS (e.g. 1H and 13C), is relatively straightforward and, at its mostbasic, takes the form of continuous rf irradiation at the Larmor fre-quency of S while the FID is acquired for I. In order to remove stronginteractions, high-power pulses are often required, although care mustbe taken to avoid excessive heating of the sample. Over the yearsa vast range of more complicated multiple-pulse decoupling schemeshas been developed in order to remove heteronuclear dipolar interac-tions with greater efficiency.[12] Figure 1.12 shows 13C NMR spectraof the carbonyl resonance in glycine, acquired without and with 1H
18 SOLID-STATE NUCLEAR MAGNETIC RESONANCE SPECTROSCOPY
Static
2 kHz
4 kHz
6 kHz
8 kHz
10 kHz
15 kHz
20 kHz
MAS rate
−500 −550 −600 −650 −700 −750
δ (ppm)
δ iso
Figure 1.11 Effect of MAS upon the 119Sn (14.1 T) NMR spectrum of SnO2,containing a lineshape anisotropically broadened by the anisotropic chemical shiftinteraction. At low MAS rates, the SSB manifold mirrors the static lineshape. Asthe MAS rate increases, the sidebands decrease in intensity and the isotropic peakdominates the spectrum.

BASIC EXPERIMENTAL METHODS 19
300 250 200 150 100 50 0
δ (ppm) δ (ppm)
160180
300 250 200 150 100 50 0
160180
** *
*
** *
*
(a) (c)
(d)(b)
Figure 1.12 Effect of MAS and 1H decoupling upon a 13C (9.4 T) NMR spectrumof the carbonyl resonance of 2[13C]-glycine (enriched to ∼99% in 13C). In (a),a broad, featureless lineshape is observed, while in (b) 1H decoupling reveals apowder-pattern lineshape as a result of the 13C CSA. The effect of MAS (6 kHz)upon the lineshapes in (a) and (b) can be seen in (c) and (d), respectively. SSBs aremarked with asterisks, and insets in parts (c) and (d) show the narrowing of theisotropic peak (here by a factor of ∼16) upon decoupling. The combination of MASand decoupling narrows the carbonyl resonance by a factor of ∼400.
decoupling. A featureless lineshape broadened by dipolar interactions(between 1H and 13C) is observed when no decoupling is applied,while 1H decoupling results in a characteristic CSA powder-patternlineshape. Decoupling cannot remove the CSA, and so to obtain trulyhigh-resolution spectra a combination of MAS and decoupling is oftenused. Figure 1.12 shows that the use of MAS significantly improvesthe resolution of the 13C spectrum of glycine, both without and withdecoupling. In favourable cases, the combination of MAS and decou-pling can lead to linewidths comparable to those obtained in the solutionphase.
Homonuclear decoupling,[13] i.e. the removal of dipolar interactionsbetween two I spins, is considerably more difficult, as it requires simul-taneous manipulation and observation of the I spins. This is usuallyachieved with 'windowed' acquisition schemes, where decoupling pulsesalternate with 'windows' in which decoupling is not applied, enablingacquisition of FID data points. As with heteronuclear decoupling, thereare a variety of different approaches, or sequences of pulses, that can
20 SOLID-STATE NUCLEAR MAGNETIC RESONANCE SPECTROSCOPY
be employed, and their efficiency depends upon the magnitude of thedipolar couplings, the MAS rate and the strength of the rf pulses.
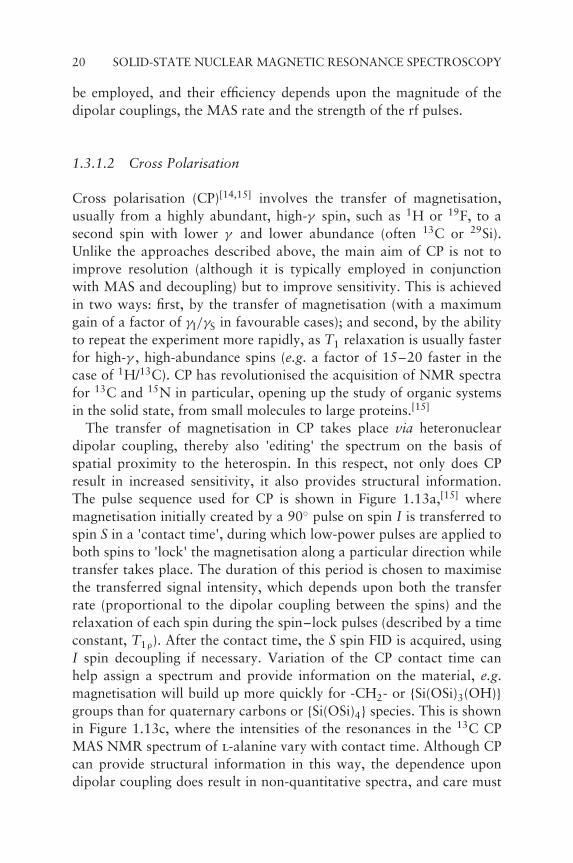
1.3.1.2 Cross Polarisation
Cross polarisation (CP)[14,15] involves the transfer of magnetisation,usually from a highly abundant, high-γ spin, such as 1H or 19F, to asecond spin with lower γ and lower abundance (often 13C or 29Si).Unlike the approaches described above, the main aim of CP is not toimprove resolution (although it is typically employed in conjunctionwith MAS and decoupling) but to improve sensitivity. This is achievedin two ways: first, by the transfer of magnetisation (with a maximumgain of a factor of γI/γS in favourable cases); and second, by the abilityto repeat the experiment more rapidly, as T1 relaxation is usually fasterfor high-γ , high-abundance spins (e.g. a factor of 15–20 faster in thecase of 1H/13C). CP has revolutionised the acquisition of NMR spectrafor 13C and 15N in particular, opening up the study of organic systemsin the solid state, from small molecules to large proteins.[15]
The transfer of magnetisation in CP takes place via heteronucleardipolar coupling, thereby also 'editing' the spectrum on the basis ofspatial proximity to the heterospin. In this respect, not only does CPresult in increased sensitivity, it also provides structural information.The pulse sequence used for CP is shown in Figure 1.13a,[15] wheremagnetisation initially created by a 90◦ pulse on spin I is transferred tospin S in a 'contact time', during which low-power pulses are applied toboth spins to 'lock' the magnetisation along a particular direction whiletransfer takes place. The duration of this period is chosen to maximisethe transferred signal intensity, which depends upon both the transferrate (proportional to the dipolar coupling between the spins) and therelaxation of each spin during the spin–lock pulses (described by a timeconstant, T1ρ). After the contact time, the S spin FID is acquired, usingI spin decoupling if necessary. Variation of the CP contact time canhelp assign a spectrum and provide information on the material, e.g.magnetisation will build up more quickly for -CH2- or {Si(OSi)3(OH)}groups than for quaternary carbons or {Si(OSi)4} species. This is shownin Figure 1.13c, where the intensities of the resonances in the 13C CPMAS NMR spectrum of l-alanine vary with contact time. Although CPcan provide structural information in this way, the dependence upondipolar coupling does result in non-quantitative spectra, and care must

BASIC EXPERIMENTAL METHODS 21
90° Spin lock Decoupling
I
S
MAS
CP MAS
3.0
2.0
1.0
0
1.5
0.5
2.5
0 2 4 6 8 1210 14
CP
MA
S in
tens
ity (
Rel
ativ
e to
MA
S)
Contact time / ms
*
1 2 3
200 150 100 50 0
δ (ppm)
3
2
1
3
2
1
H C N O
(b)
(c)
(a)
Figure 1.13 (a) Pulse sequence for a CP experiment transferring magnetisationfrom spin I to spin S. (b) 13C MAS and CP MAS NMR spectra of l-alanine (contacttime = 1 ms), showing the non-quantitative nature of CP; the asterisk denotes aSSB. (c) Plot of CP MAS peak intensities (relative to the MAS NMR spectrum) as afunction of contact time.
be taken when considering the relative intensities of resonances in a CPspectrum.
In the CP experiment, magnetisation transfer only occurs when therf fields applied during the contact time fulfil the Hartmann–Hahncondition:[16]
γIB1I = γSB1S (1.12)
This condition must be adapted if the experiment is performed underMAS conditions to:
γIB1I = γS B1S ± nωR (1.13)
where ωR is the MAS rate and n is an integer (typically 1 or 2). Any rffield strengths that satisfy these match conditions may, in principle, beused in the experiment. Practically, however, lower powers are preferred,in order to minimise detrimental effects on the hardware.

22 SOLID-STATE NUCLEAR MAGNETIC RESONANCE SPECTROSCOPY
1.3.1.3 Two-Dimensional NMR Spectra
Although a simple high-resolution NMR spectrum can reveal consider-able information about a system, for more detail it is often necessary toexploit the interactions between the nuclear spins, using two-dimensional(2D) experiments.[17,18] For example, in order to understand the con-nectivity of an aluminophosphate framework it is necessary not just toknow that Al and P are close in space but to know which Al are closeto which P species. In a general 2D NMR experiment,[18] as shownin Figure 1.14a, magnetisation is created (using some combination ofpulses) during a 'preparation' step, then evolves over a time t1. Thisis followed by a 'mixing' step (using a combination of pulses), duringwhich the magnetisation is transferred between spins, before the FID isacquired in time t2. The amplitude of the FID obtained in t2 is modulatedby the evolution in t1; if the t1 duration is systematically increased ina series of experiments, it is possible to indirectly follow the evolu-tion of the magnetisation during this period, point by point. Fouriertransformation of the resulting dataset (Figure 1.14b) leads to a 2Dspectrum showing between which spins magnetisation was transferred.For example, Figure 1.14c shows a schematic 2D spectrum for a systemwith three spins, A, B and C. In addition to the three peaks lying onthe diagonal (corresponding to magnetisation that was not transferredbetween spins), off-diagonal 'cross peaks' are observed. These reveal thatmagnetisation has been transferred between A and B and also betweenB and C, demonstrating the presence of an interaction or connectionbetween these spins. In contrast, there is no transfer between A and C,showing that these two spins do not have such an interaction.[18]
Correlation experiments can be typically classified into two types:heteronuclear (i.e. between two different nuclear species) and homonu-clear (i.e. between nuclear species of the same type). In the formercase, it is necessary to apply pulses to both species in order to enablemagnetisation to be transferred from one type of nucleus to the other.It is also possible to design 2D experiments (by careful choice of thepulses applied) such that the magnetisation transfer proceeds via eitherthrough-bond J coupling or through-space dipolar interaction; crosspeaks will then demonstrate that two spins are either connected bycovalent bonds or close in space, respectively. Note that although theJ coupling is typically very small and is often unresolved in solid-stateNMR spectra, it can still be exploited for the transfer of magnetisation.If this were the case in Figure 1.14c, it would indicate that A andB were connected by covalent bonds, as were B and C, but that the

BASIC EXPERIMENTAL METHODS 23
Preparation Mixing
t1 evolution
t1
δ1
δ 1 =
δ 2
δ 1 =
2δ 2
δC
δB
δA
δB
+ δ
C
δA
+ δ
C
δA
+ δ
B
δ1
δ1
δ2
δA
δB
δC
δ2
t2
t2 acquisition
2D FT
B
AC
(b)
(a) (c)
Figure 1.14 (a) Pulse sequence for a generic 2D experiment in which the t1 durationis incremented. (b) The 2D FID and spectrum resulting from Fourier transformation.(c) Schematic 2D homonuclear correlation spectra for a system with three spins,A, B and C, showing cross peaks (and interactions) between A and B and betweenB and C. No cross peaks are observed between A and C. The spectra result froma conventional 2D experiment (upper) and a 'double-quantum/single-quantum'experiment (lower).
number of bonds between A and C was too large for a J coupling tobe present. In some cases, the particular type of pulse(s) employed canresult in a 2D spectrum that looks very different but essentially containsthe same information. The theory behind these 'double-quantum/single-quantum' experiments in the solid state[19] is beyond the scope of thecurrent discussion, but they are widely used, and it is worthwhile toconsider the appearance of the resulting spectrum. Figure 1.14c alsoshows a schematic 'double-quantum/single-quantum' spectrum for the

24 SOLID-STATE NUCLEAR MAGNETIC RESONANCE SPECTROSCOPY
same three-spin system, ABC, described earlier. Cross peaks now appearas a pair of horizontal peaks linking the two frequencies in the directdimension, and at the sum of the two frequencies in the indirect dimen-sion. If we assume transfer here is through the J coupling, from thespectrum we can see cross peaks linking A and B and linking B and C,demonstrating covalent bonding between these spins. Again, no pair ofpeaks is observed for A and C, demonstrating that these two spins donot have a J coupling.
Through the inclusion of more than one evolution in the pulsesequence, it is possible to extend the principles of 2D NMR spectra tomultiple-dimensional spectroscopy, a technique of particular importancefor probing e.g. C–N bonding pathways in the backbones of proteins.
1.3.2 Spin I > 1/2 Nuclei
Except in cases of extremely high symmetry, or very small quadrupo-lar moments, the NMR spectra of nuclei with I > 1/2 are typicallydominated by the quadrupolar interaction.[6,20] When more than oneinequivalent site is present in a material, the NMR spectrum willconsist of multiple, overlapping quadrupolar-broadened lineshapes. Asquadrupolar nuclei account for over 75% of all NMR-active nuclidesin the Periodic Table, it is necessary to consider how the quadrupolarbroadening can be removed and high-resolution spectra obtained.[20]
1.3.2.1 MAS
As described previously, the orientation dependence of the first-orderquadrupolar interaction is similar to that of the CSA or dipolar coupling,and so is, in principle, removed by MAS. In practice, however, thisinteraction is often many hundreds of kHz or MHz in magnitude, and itis usually impossible to spin sufficiently rapidly. Therefore, the broad STlineshapes for nuclei with half-integer spin (and all lineshapes for nucleiwith integer spin) exhibit extensive sideband manifolds.[6,20] However,for nuclei with half-integer spin quantum number, the CT lineshapeis not affected by this large first-order quadrupolar interaction, but isbroadened by the much smaller second-order quadrupolar broadening.Unfortunately, the second-order quadrupolar interaction has a morecomplex angular dependence than the other interactions and cannot

BASIC EXPERIMENTAL METHODS 25
be removed completely by MAS. The resonance frequency (assumingηQ = 0 for simplicity) is given (under MAS) by:[6,21]
ω =(ωPAS
Q )2
ω0{A0 + A2d2
00(β)d200(χ) + A4d2
00(β)d400(χ)} (1.14)
where An are spin-dependent coefficients, given in the literature, and β
describes the orientation of the crystallite and χ the angle of the rotoraxis. Equation 1.14 shows that the second-order quadrupolar interactionconsists of an orientation-independent shift (proportional to A0) and twoanisotropic terms (proportional to A2 and A4, respectively). As:
d200(χ) = 1
2(3 cos2χ − 1) (1.15)
d400(χ) = 1
8(35 cos4χ − 30 cos2χ + 3) (1.16)
it can be seen that MAS will only remove one of these terms. The lastterm in Equation 1.14 is removed when χ = 30.56 or 70.12◦, but thereis no one angle about which the sample could be rotated that wouldremove all of the anisotropic broadening. Hence, for quadrupolar nuclei,MAS NMR spectra contain lines that are narrowed, but are not trulyhigh resolution, and are shifted away from the isotropic chemical shift,as shown in Figure 1.15a. In principle, these lineshapes can be fittedto extract δiso and the quadrupolar parameters, CQ and ηQ, providinginformation on the local environment or symmetry. However, if anumber of inequivalent species are present, the spectrum may containa number of overlapped quadrupolar lineshapes and it can once againbe difficult to extract any useful information. This can be seen inFigure 1.15b – the 17O MAS NMR spectrum of MgSiO3
[22] – where it isdifficult to obtain any information due to the presence of six overlappingbroadened lineshapes. It can be seen from Equation 1.14 that thequadrupolar broadening is reduced at high magnetic field strength (as itis proportional to 1/ω0); however, in most cases significant broadeningremains at the conventional B0 fields that are available. It is desirable,therefore, to develop methods by which to remove the quadrupolarbroadening completely and achieve truly isotropic spectra.
1.3.2.2 DOR and DAS
The earliest approaches to removing quadrupolar broadening usedcomposite sample rotation, i.e. rotation around two different angles.

26 SOLID-STATE NUCLEAR MAGNETIC RESONANCE SPECTROSCOPY
300 0 −150150
δ (ppm)
δ iso
δ (ppm)
−5050 0100
Static
60 kHz MAS
Mg
(SiO4)n
MAS
(a) (b)
Figure 1.15 (a) Effect of MAS (60 kHz) on the 71Ga (20.0 T) quadrupolar-broadened CT lineshape of GaPO4 berlinite. A powder-pattern lineshape is stillobserved (although it is narrowed in comparison to the static case), shifted from δisoby the isotropic quadrupolar shift. (b) 17O (9.4 T) MAS NMR spectrum of orthoen-statite (MgSiO3),[22] containing six distinct O sites and exhibiting a complicatedoverlapping lineshape. Reprinted with permission from Ashbrook et al. (2007) [22].Copyright (2007) American Chemical Society.
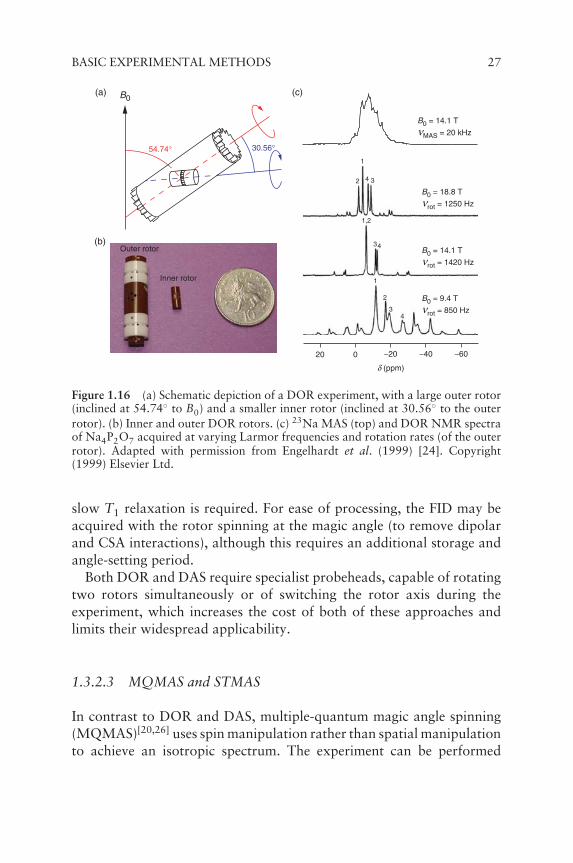
In double rotation (DOR),[20,23] the two rotations take placesimultaneously, with an inner rotor spinning inside a much largerouter rotor, as shown in Figure 1.16a. The outer rotor is inclined at54.74◦ to B0 i.e. the magic angle, in order to remove the broadeningproportional to d2
00(χ) (and also dipolar and CSA interactions), whilethe inner rotor spins at 30.56◦ to the outer rotor, in order to removethe anisotropic broadening proportional to d4
00(χ). In principle, thisenables the complete removal of all quadrupolar broadening in a simpleone-dimensional (1D) experiment, as shown in Figure 1.16c. A majorlimitation of DOR, however, is the restricted rotation rate (typically1–2 kHz) of the bulky outer rotor, producing a series of SSBs in somecases that may complicate spectral analysis.
Like DOR, dynamic angle spinning (DAS)[20,25] removes quadrupolarbroadening by spinning around two angles; however, this occurs sequen-tially rather than simultaneously. DAS is a 2D experiment, in which themagnetisation evolves in t1 with the rotor inclined at one angle andthen, before t2, the angle of the rotor is changed so that, after a certainlength of time, the first- and second-order quadrupolar broadening isrefocused and only the isotropic peak remains. Between t1 and t2, themagnetisation is 'stored' without evolution, meaning that reasonably
BASIC EXPERIMENTAL METHODS 27
Outer rotor
Inner rotor
B0
54.74° 30.56°
B0 = 14.1 T
νMAS = 20 kHz
1
2 34
1,2
34
1
2
34
B0 = 18.8 T
νrot = 1250 Hz
B0 = 14.1 T
νrot = 1420 Hz
B0 = 9.4 T
νrot = 850 Hz
20 0 −20 −40 −60
δ (ppm)
(a)
(b)
(c)
Figure 1.16 (a) Schematic depiction of a DOR experiment, with a large outer rotor(inclined at 54.74◦ to B0) and a smaller inner rotor (inclined at 30.56◦ to the outerrotor). (b) Inner and outer DOR rotors. (c) 23Na MAS (top) and DOR NMR spectraof Na4P2O7 acquired at varying Larmor frequencies and rotation rates (of the outerrotor). Adapted with permission from Engelhardt et al. (1999) [24]. Copyright(1999) Elsevier Ltd.
slow T1 relaxation is required. For ease of processing, the FID may beacquired with the rotor spinning at the magic angle (to remove dipolarand CSA interactions), although this requires an additional storage andangle-setting period.
Both DOR and DAS require specialist probeheads, capable of rotatingtwo rotors simultaneously or of switching the rotor axis during theexperiment, which increases the cost of both of these approaches andlimits their widespread applicability.
1.3.2.3 MQMAS and STMAS
In contrast to DOR and DAS, multiple-quantum magic angle spinning(MQMAS)[20,26] uses spin manipulation rather than spatial manipulationto achieve an isotropic spectrum. The experiment can be performed

28 SOLID-STATE NUCLEAR MAGNETIC RESONANCE SPECTROSCOPY
using a conventional MAS probehead and has therefore seen widespreadapplication in recent years. It is fair to say that this experiment hasrevolutionised the study of quadrupolar nuclei in solid-state NMR,and has opened up many interesting and exciting areas of potentialapplication.
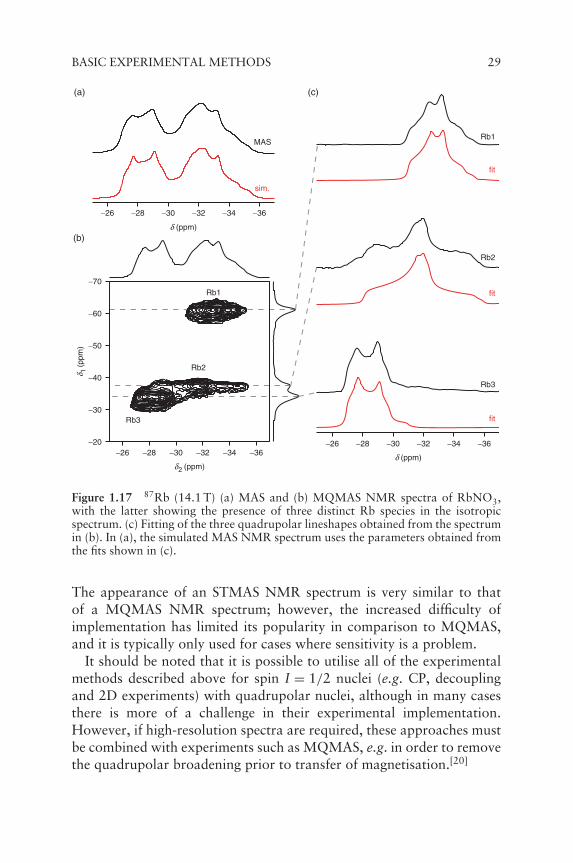
MQMAS is a 2D experiment, performed under MAS conditions, inwhich the CT (acquired in t2) is correlated with a multiple-quantum(usually triple-quantum, i.e. �mI = ±3) transition (acquired indirectlyin t1). The direct excitation of multiple-quantum magnetisation is for-mally 'forbidden' by the NMR selection rule, making the preparationstage much less efficient than for single-quantum excitation; indeed,this is perhaps the greatest disadvantage of MQMAS. A number ofexperimental approaches have been developed to increase the efficiencyof the experiment, but the sensitivity is still significantly lower thanthat obtained in conventional spectra. Fourier transformation of thedata yields a 2D spectrum containing (after appropriate processing)ridge-like lineshapes lying parallel to δ2. The δ1 dimension contains anisotropic, high-resolution spectrum, free from all quadrupolar broad-ening. This can be seen in the 87Rb MAS and MQMAS NMR spectraof RbNO3 shown in Figure 1.17. The three quadrupolar-broadenedlineshapes are overlapped in the MAS NMR spectrum, but can be sep-arated out in the 2D spectrum, producing a high-resolution spectrumcontaining three sharp, narrow resonances. In addition, it is also possibleto study each of the quadrupolar lineshapes individually, by extractingcross-sections parallel to δ2. Figure 1.17c shows how the three lineshapesin the MQMAS NMR spectrum of RbNO3 can be fitted to extract thequadrupolar parameters, CQ and ηQ. Information on the quadrupolarinteraction and the isotropic chemical shift can also be obtained fromthe position of the lineshape in the 2D spectrum.
The satellite transition magic angle spinning (STMAS) exper-iment[21,27] is conceptually very similar to MQMAS, in that the CTlineshape is correlated, in a 2D spectrum, with a spectrum correspondingto a different transition within the spin system. Rather than using aforbidden multiple-quantum transition, STMAS correlates the spectrumfrom the ST, increasing significantly the sensitivity of the experiment(typically by a factor of 4–8). However, as the STs are also affectedby the very large first-order quadrupolar broadening, the experiment istechnically more challenging to perform. It is important to ensure thatthe magic angle is accurately adjusted (to ±0.002◦), the rotation rateis very stable and the pulses applied are timed extremely accurately.
BASIC EXPERIMENTAL METHODS 29
MAS
sim.
δ 1 (p
pm)
δ2 (ppm)δ (ppm)
−20
−30
−40
−50
−60
−70
−26 −28 −30 −32 −34 −36
δ (ppm)
Rb1
Rb1
Rb2
Rb2
Rb3
Rb3
fit
fit
fit
−26 −28 −30 −32 −34 −36−26 −28 −30 −32 −34 −36
(a)
(b)
(c)
Figure 1.17 87Rb (14.1 T) (a) MAS and (b) MQMAS NMR spectra of RbNO3,with the latter showing the presence of three distinct Rb species in the isotropicspectrum. (c) Fitting of the three quadrupolar lineshapes obtained from the spectrumin (b). In (a), the simulated MAS NMR spectrum uses the parameters obtained fromthe fits shown in (c).
The appearance of an STMAS NMR spectrum is very similar to thatof a MQMAS NMR spectrum; however, the increased difficulty ofimplementation has limited its popularity in comparison to MQMAS,and it is typically only used for cases where sensitivity is a problem.
It should be noted that it is possible to utilise all of the experimentalmethods described above for spin I = 1/2 nuclei (e.g. CP, decouplingand 2D experiments) with quadrupolar nuclei, although in many casesthere is more of a challenge in their experimental implementation.However, if high-resolution spectra are required, these approaches mustbe combined with experiments such as MQMAS, e.g. in order to removethe quadrupolar broadening prior to transfer of magnetisation.[20]

30 SOLID-STATE NUCLEAR MAGNETIC RESONANCE SPECTROSCOPY
1.3.3 Wideline NMR Spectroscopy
Large anisotropic interactions, such as quadrupolar or paramagneticinteractions, can often lead to NMR lineshapes many MHz wide. Insuch cases, MAS is often not of any help, as the rotation rates availableare much smaller than the magnitude of the interactions one wishes toremove. Instead, it is often simplest to acquire a 'wideline' spectrum ofa static sample, using experiments based around spin echoes in orderto ensure undistorted lineshapes are acquired.[20,28] However, it is onlyreally feasible to extract detailed information from such spectra when thenumber of crystallographic species present is low, as multiple lineshapeswill be overlapped in the spectrum.
In order to overcome the considerable sensitivity issues associatedwith wideline NMR, a number of improvements to the experimentalapproach have been utilised. One of the most popular is the use of aCarr–Purcell–Meiboom–Gill (CPMG) echo train.[29] The application ofa series of 180◦ pulses during acquisition results in an FID that consistsof multiple echoes, and subsequent Fourier transformation yields aspectrum consisting of a series of 'spikelets', with intensities that reflectthe static lineshape; this therefore increases the peak-height signal andresults in significant increases in sensitivity. This is shown in Figure 1.18,where 71Ga spin echo and CPMG spectra of a static sample of GaPO4berlinite are shown. The integrated signal intensity in each spectrumis the same, but the peak-height sensitivity is vastly improved whenthe CPMG echo train is employed, as shown in Figure 1.18b. If, as isfrequently true in the case of wideline NMR, the linewidth exceeds theexcitation bandwidth (i.e. the frequency range that can be efficiently anduniformly excited by the rf pulses), the spectrum must be acquired in
CPMG
Spin echo
500 250 0 −500−250
δ (ppm) δ (ppm)
500 250 0 −500−250
(a) (b)
Figure 1.18 Static 71Ga (14.1 T) NMR spectra of GaPO4 berlinite acquired using(a) a spin echo pulse sequence and (b) a CPMG echo train with a spikelet spacing of2 kHz. In part (b), the spin echo spectrum is plotted on the same vertical scale as theCPMG spectrum.
CALCULATION OF NMR PARAMETERS 31
a stepwise fashion, varying the frequency offset of the transmitter andco-adding the individual subspectra to generate the final lineshape. Ithas also been recently shown that the use of so-called 'shaped' pulses,designed to excite over a much broader frequency range, and previouslyemployed in solution-state NMR, can be used in either a simple echoexperiment or a CPMG echo train in order to improve the excitationbandwidth. These can be implemented in a single experiment to acquire awhole spectrum in one step or can be combined with stepped acquisitionto reduce the number of different steps required to acquire very broadlineshapes (and hence the overall experimental time).[20]
1.4 CALCULATION OF NMR PARAMETERS
Unlike solution-state NMR, the assignment of solid-state NMR spectraposes a considerable challenge. This is a result of the lack of the exten-sive databases of parameters that exist for the solution state, and also aconsequence of the crystallographic inequivalence of chemically similarspecies resulting from crystal packing in the solid. Furthermore, for inor-ganic solids in particular, a variety of nuclides are typically studied and avast array of local and longer-range coordination environments is possi-ble, making database-based assignment methods extremely impractical.In recent years, there has been growing interest in the use of alternativetools to aid spectral assignment and interpretation, and first-principlescalculations provide one such option. Owing to the latest developmentsin hardware and software, these approaches may be applied to ever morecomplicated materials. While a full understanding of density functionaltheory (DFT) is beyond the scope of this chapter (see references [30,31] for more detail), we provide a brief introduction to the key stepsinvolved in calculating the parameters relevant to solid-state NMR.
1.4.1 Introduction to Density Functional Theory
Electronic structure calculations aim to provide a description of the prop-erties of a material using only the fundamental assumptions of quantummechanics (i.e. from 'first principles'), starting from the Schrodingerequation (Hψ = Eψ) for a system of electrons and nuclei. From thetotal energy, E, it is possible to derive all fundamental NMR parameters.

32 SOLID-STATE NUCLEAR MAGNETIC RESONANCE SPECTROSCOPY
However, the Schrodinger equation is too complicated to solve exactlyfor many-body systems. One approach to simplifying this problem isto treat part of the interaction between the electrons (termed their'correlation') in an average way. This 'Hartree–Fock' approach pro-vides an accurate answer, but any attempt to improve the treatmentof electron correlation quickly becomes computationally too costly toapply to extended solids.[30,31] An alternative approach, DFT, exploitsthe fact that the total energy is known to be a function of the electrondensity.[30,31] As this is simply a function of position, it is much simplerto calculate than a many-body wavefunction and, therefore, compu-tationally cheaper for larger systems. While most contributions to theenergy can be computed exactly, the form of the 'exchange correlation'energy, which describes the interaction between electrons, is not knownexactly. A number of simple approximations have been introduced toovercome this, including the local density approximation (LDA), whichassumes that, for a small unit of space, the electron density is constantand equal to that of a uniform electron gas. Despite its simple nature,LDA has been shown to provide a good approximation for the energyand structure of solids. For other properties, it is possible to improveaccuracy by adding terms based on the gradient of the density, i.e.the generalised gradient approximation (GGA). Although further adap-tations of GGA can result in increased accuracy for small molecules,application to solids generally proves too computationally expensive.
1.4.2 Basis Sets and Periodicity
Although there has been considerable application of the calculation ofNMR parameters in quantum chemistry, much of the effort has beenfocused on small isolated molecules, rather than the extended structuresfound for most solids. A solid, therefore, has to be approximated asa 'cluster', centred on the atom of interest with the termination ofany 'dangling' bonds, usually with H. The accuracy of the calculationsincreases with the size of the cluster used; however, this also increasesthe computational cost of the calculation. For solids, a more efficientapproach is to exploit the inherent translational symmetry, recreatingthe 3D structure from a small high-symmetry volume unit using peri-odic boundary conditions. This reduces the number of distinct atomsthat must be considered in the calculation to manageable levels, againdecreasing the cost.[31]

CALCULATION OF NMR PARAMETERS 33
Cal
cula
tion
time
/ h
0
4
8
12
431
432
433
434
0 20 40 60 80 100 120
σ iso
(pp
m)
Ecut / Ry
time
σiso
300
350
400
450
500
550
Cal
cula
ted
σ iso
(pp
m)
Experimental δ iso (ppm)
−250 −200 −150 −100 −50 0
σiso = −1.02δ iso + 312.64
R2 = 0.995
(a) (b)
Figure 1.19 (a) Plot showing the variation of the calculated 29Si isotropic shieldingof SiO2 coesite as a function of the plane wave cut-off energy, Ecut. The calculationtime or 'computational cost' as a function of Ecut is also shown, and continues toincrease above the 'converged' Ecut value of ∼45 Ry, with no improvement in theaccuracy of the calculation. (b) Comparison of 29Si calculated isotropic shieldingand experimental isotropic shifts for a series of simple inorganic solids. Analyticalfitting enables the value of the reference, σref, to be determined from the y intercept.
It is usual to express the wavefunction as a linear combination ofa group of simple functions, or 'basis set', for ease of calculation. Inquantum chemical calculations of molecules, atom-centred basis sets,consisting e.g. of Gaussian functions, are often employed. However,for the periodic systems of interest in the solid state, a more naturalchoice of basis set is plane waves,[31] which are inherently periodic. Inprinciple, the accuracy of the calculation will increase with the size ofthe basis set used, although in practice a finite number of functionsare usually chosen, such that the calculated results do not change orimprove significantly if more are added, i.e. the calculation is said to be'converged'. This is straightforward for a plane wave basis set, wherethe NMR parameters can be calculated as a function of the maximumenergy of the plane waves included (the cut-off energy, Ecut), as shownin Figure 1.19a for the 29Si isotropic shielding of SiO2 coesite. Here, anyincrease in Ecut past 45 Ry (612.3 eV) results only in an increase in cost,with no significant improvement in accuracy.
1.4.3 Reducing the Computational Cost of Calculations
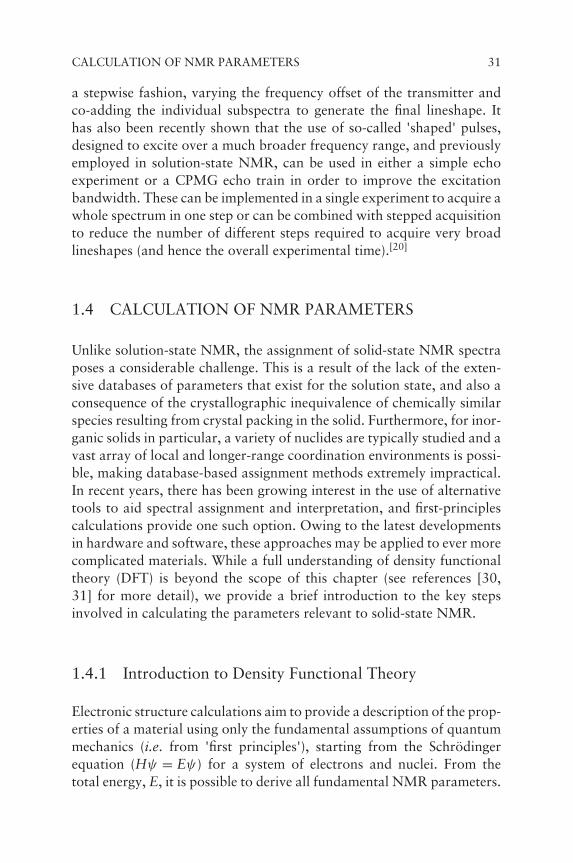
The explicit description of core electrons is computationally costly andgenerally unnecessary, as the valence electrons are responsible for mostchemical phenomena. It is possible to reduce computational cost by using
34 SOLID-STATE NUCLEAR MAGNETIC RESONANCE SPECTROSCOPY
a 'frozen-core' approximation, where electrons within a defined radiusof the nucleus, rcore, are treated as part of the static potential providedby the nuclei, while electrons outside rcore are treated explicitly.[31]
Furthermore, the oscillatory nature of the valence wavefunctions closeto the nucleus may require a large number of plane waves to reproduce.It is possible to reduce this cost by using a 'pseudopotential', where thewavefunction is artificially smoothed close to the nucleus, thus savingon both cost and time. However, many NMR parameters are cruciallydependent upon the electron density close to the nucleus; fortunately,this information can be easily recovered using schemes such as theprojected augmented wavefunction (PAW)[30] method or the gauge-including projected augmented wavefunction (GIPAW)[32] method (forproperties that involve the response of a system to magnetic field). Awide range of codes using a variety of different approaches are available,although the recent introduction of GIPAW into periodic codes hasproven particularly popular.
1.4.4 Application of First-Principles Calculations
The resurgence of interest in the calculation of NMR parameters inthe solid state has led to investigations in areas as diverse as biomate-rials, minerals, microporous frameworks, energy materials and organicsolids. In general, calculations provide support for the assignment ofspectra and confirmation of the NMR parameters for a system (par-ticularly important if sensitivity is poor). Calculations may also beused to predict spectra prior to experiment, in order to guide exper-imental acquisition for materials that are particularly challenging tostudy. For systems where the structure is unknown or under debate,calculations can enable the evaluation or validation of structural mod-els and predictions against an experimental observable. It is usual tocalculate both the EFG (and therefore the quadrupolar interaction)and the shielding; the former can be calculated in a fraction of thetime required for the latter. More recent code development has alsoenabled the calculation of J couplings.[33] The isotropic and anisotropiccomponents of all interactions are typically calculated, and the lattercan be particularly useful as it can be averaged either by the NMRmethods used or by dynamics in a system. It should be noted thatabsolute values of the shielding are calculated, and for comparison to

CALCULATION OF NMR PARAMETERS 35
experiment these generally have to be referenced in some way. Usuallyit is assumed that:
δcalciso = (–σ calc
iso + σref) (1.17)
where σref is a reference shielding, determined either by matching theexperimental and calculated data from a simple reference compound or(more usually) from a plot comparing experimental shifts and calculatedshieldings for a range of simple compounds. An example is shownin Figure 1.19b, where 29Si calculated shieldings and experimentalshifts are compared for a series of Si-containing inorganic compounds.Analytical fitting enables σref (312.64 ppm) to be determined from they intercept of the plot.
One crucial consideration when calculating NMR parameters is theaccuracy (or otherwise) of the initial structure or structural model.In many cases, structures are obtained from diffraction experiments,although many are generated from computational approaches. Forstructures determined from experiment, the quality of the data maybe variable depending upon the type of approach (e.g. laboratoryX-ray, synchrotron X-ray or neutron) and on whether a singlecrystal or powdered sample is available. In particular, the positionsof lighter atoms, such as hydrogen, can be difficult to determineaccurately from X-ray data, and even small errors in these positions,or those of other atoms, can significantly affect the calculated NMRparameters. Figure 1.20 shows an example from work on calcinedAlPO-14, a microporous aluminophosphate.[34] NMR parameterscalculated for the structure obtained directly from diffraction were inpoor agreement with those obtained experimentally. However, afterthe optimisation of the atomic positions using DFT and subsequentcalculation of the NMR parameters, much better agreement wasobserved. The structural changes are difficult to observe by visualinspection, as shown in Figure 1.20a, but result in a considerablechange in the 27Al and 31P calculated NMR parameters, as shown inFigure 1.20b.
As a consequence of the improvements in software, the calculationof NMR parameters from first principles is no longer the realm ofspecialists, and many experimentalists now utilise them almost routinelyalongside experiment to provide a detailed understanding of local struc-ture. The real power of this approach, however, has been demonstratedin more recent work, where calculations have been used to provideinsight into both disorder and dynamics in the solid state.

36 SOLID-STATE NUCLEAR MAGNETIC RESONANCE SPECTROSCOPY
Calculated(diffractionstructure)
Calculated(DFT-optimised
structure)
Experimental
27Al
*
*i
1.75 Å
1.86 Å
80 40 −40 −15 −20 −25 −30 −35 −400
δ (ppm) δ (ppm)
31P(a) (b)
Figure 1.20 (a) Structure of calcined AlPO-14 from diffraction (top) and aftergeometry optimisation of the atomic positions (bottom). (b) Experimental (14.1 T)27Al and 31P MAS NMR spectra for AlPO-14, and lineshapes simulated using theNMR parameters calculated with DFT prior to and post structural optimisation.Asterisks denote SSBs and i denotes a minor impurity phase observed in theexperimental spectrum. Reproduced (in part) with permission from Ashbrook et al.(2008) [34]. Copyright (2008) PCCP Owner Societies.
1.5 APPLICATIONS OF SOLID-STATE NMRSPECTROSCOPY
1.5.1 Local and Long-Range Structure
The local magnetic environment at a nucleus is determined by a varietyof structure-dependent interactions and NMR spectra therefore containa wealth of information on the structure of crystalline materials. As insolution, the number of isotropic resonances corresponds to the numberof distinct nuclei, and their relative intensities can be used to determinethe proportion of each species (care may have to be taken for morecomplex experiments, where intensities may be non-quantitative, butthis can be taken into account by appropriate spectral analysis). Formolecular solids, NMR can provide information on the number ofdistinct molecules in the asymmetric unit, while for extended solids itmay be possible to distinguish between two possible space groups of amaterial, or to rule out a proposed space group or model. NMR is alsoan excellent method for identifying or distinguishing between different

APPLICATIONS OF SOLID-STATE NMR SPECTROSCOPY 37
80 40 0120160
akimotoite
majorite
50 0100150 −50
100 50 0
o-enstatite
−50
200 100 0
perovskite
−100180
δ (ppm) δ (ppm)
2
3NH
5
101
67
89 14
1312
11
15
16
17
20
ONH
2223
25 24
CH3
O
18
19
203
1
2
5
17
14
22
9
1310
12
8
7
23, 24, 25
6
15
16 11
18
19
20
3 1
25
17 14
22
9
13
10
12
8 11
6,15,16
7
23, 24, 25
18
19
Form II
Form I
160 140 120 60 50 40 30 20 10 0
CH3
(b)(a)
Figure 1.21 (a) 13C CPMAS NMR spectra of two polymorphs of finasteride(Form I and Form II), with one and two distinct molecules in the asymmetricunit, respectively. Reproduced with permission from Othman et al. (1997) [36].Copyright (2007) John Wiley & Sons Inc. (b) 17O (9.4 T) MAS NMR spectra offour polymorphs of MgSiO3: orthoenstatite, akimotoite, majorite and perovskite.Reproduced with permission from Ashbrook et al. (2007) [22]. Copyright (2007)American Chemical Society.
polymorphic forms of a material, often aided by DFT calculations.Figure 1.21a shows the 13C CP MAS NMR spectra of two forms offinasteride, a molecular solid.[35,36] In Form I, the presence of one signalfor each carbon in the molecule confirms there is a single molecule in theasymmetric unit. However, for Form II, the splitting of each resonancereveals there are two distinct molecules, confirming a difference insymmetry between the two polymorphs. In Figure 1.21b, 17O MAS NMRspectra of four polymorphs of MgSiO3 are shown – all high-pressureminerals of importance in the inner Earth.[22] Although the second-orderquadrupolar broadening prevents the resolution of distinct species, thefour spectra are clearly very different, reflecting the different structures.The lineshapes are composed of six, one, six and two overlapping signalsfor orthoenstatite, akimotoite, majorite and perovskite, respectively.
Although, in general, multiple complex factors determine the exactvalues of the NMR parameters, in many cases a particularly strongdependence on one factor may enable structural information to be

38 SOLID-STATE NUCLEAR MAGNETIC RESONANCE SPECTROSCOPY
−80 −90 −100 −110 −120
Q4(4Al)0.3%
*
Al(IV) Al(V) Al(VI)
60 40 20 0 −20
δ (ppm) δ (ppm)
Q4(3Al)7.5%
Q4(2Al)46% Q4(1Al)
41%
Q4(0Al)5.2%
(b)(a)
Figure 1.22 (a) 27Al MAS (14.1 T) NMR spectrum of as-made AlPO-14, templatedby isopropylammonium.[34] The presence of charge-balancing hydroxyls attachedto the framework produces Al(IV), Al(V) and Al(VI) species. The asterisk denotesan impurity phase. (b) 29Si MAS NMR spectrum (and corresponding analytical fit)for analcime (NaxAlxSi3-xO6·H2O), containing one tetrahedrally-coordinated cationsite that can be occupied by either Si (dark grey) or Al (light grey). Assignmentsfor the five resonances are also shown. Reproduced with permission from Phillips(2009) [37]. Copyright (2009) John Wiley & Sons Ltd.
extracted from a single measurement, or from a series of measurementson related compounds. The isotropic chemical shift depends on theshielding effects of nearby electrons and, hence, on any factors affectingthe electron density at the atom. For example, coordination numbertypically has a large effect on chemical shift, an effect exploited in27Al MAS NMR,[2] where four-, five- and six-coordinate Al are easilydistinguished, as shown in Figure 1.22a, for as-made AlPO-14.[34] Thecharge on the structure-directing template (isopropylammonium) in thepores is balanced by hydroxyl groups that attach to the frameworkAl, increasing their coordination number. The spectrum shows thepresence of Al(IV), Al(V) and Al(VI) species (where the number inbrackets describes the coordination of the Al atom), and their relativeproportions can be used to gain insight into the position and orderingof the hydroxyls. Upon calcination, a purely tetrahedral framework isproduced, as previously shown by the 27Al MAS NMR spectrum inFigure 1.20.[34] Silicon chemical shifts are also very dependent upon thecoordination number, with very clear differences between tetrahedralSiO4 (−60 to −120 ppm) and octahedral SiO6 (−180 to −210 ppm)environments, a fact that has been widely exploited in the study ofsilicate minerals.[2]

APPLICATIONS OF SOLID-STATE NMR SPECTROSCOPY 39
In addition to the coordination number, the nature of the coordinatedatoms can also have a significant impact on the chemical shift. Forexample, for SiO4, SiN4 and SiC4 environments, chemical shifts are typ-ically −110, −50 and −20 ppm, respectively.[2] Similarly, the chemicalshift is also affected by the degree of condensation (or polymerisation)in the material, e.g. in phosphate and silicate chemistry. This is usuallyexpressed using the Qn nomenclature, where n is the number of otherQ units attached to the unit in question. It has been shown that, forboth 29Si and 31P, δiso becomes increasingly negative as the condensationincreases.[2] This sensitivity provides an excellent tool for probing thenetwork connectivity, particularly in glasses and minerals. The nature ofthe next-nearest neighbour (NNN) cations can also affect the isotropicchemical shift. This has been utilised in the study of aluminosilicates(both minerals and zeolites), enabling the distribution of Si and Al to beprobed (see Section 1.7 for a more detailed description). As Figure 1.22bshows for the aluminosilicate mineral analcime (NaxAlxSi3-xO6·H2O),there is a change in the 29Si chemical shift of ∼6 ppm for each NNN Alsubstituted.[37] This substitution is usually denoted by Qn(m Al), wherem represents the number of NNN Al species.
More subtle variations in the local environment can also influence theisotropic shift. For example, the isotropic shift of a number of nuclei hasbeen shown to depend on the detailed local geometry (i.e. bond lengthsor bond angles).[2] For a series of similar compounds (where otherstructural changes are inherently limited), the variation in chemicalshift can be used to measure the geometrical changes directly. This hasbeen shown to be particularly useful when probing phenomena such ashydrogen and halogen bonding,[20] where the shifts of the hydrogen-or halogen-bonded atoms are dependent on the geometry of the bondin question. DFT calculations can also provide an excellent tool forinvestiging the nature and magnitude of the dependence of the chemicalshift (and other NMR parameters) upon the detailed local environment,owing to the ease of structural manipulation.
In solids, of course, one is not restricted to considering the isotropicchemical shift and, as demonstrated by reference,[38] even when twonuclei have the same isotropic shift, their shielding anisotropies arenot necessarily identical. Measurement of the principal components ofthe shift tensor can often provide information that is not immediatelyapparent from the isotropic shift alone. It has already been shown inFigure 1.6 that the magnitude and asymmetry of the shielding tensordepends upon the local symmetry; however, smaller changes in local

40 SOLID-STATE NUCLEAR MAGNETIC RESONANCE SPECTROSCOPY
Sn6Sn5Ti1,2-Sn4Ti21,3-Sn4Ti21,4-Sn4Ti21,2,3-Sn3Ti31,2,4-Sn3Ti31,3,5-Sn3Ti31,2-Sn2Ti41,3-Sn2Ti41,4-Sn2Ti4SnTi5Ti6
700
600
500
400
300
200
100
2.242.202.18 2.22 2.26 2.302.28
Y-O8b bond length / Å
Ωca
lc,s
cale
d (pp
m)
Y SnTi
O8b
O48f
O8b
Figure 1.23 Plot showing the dependence of the 89Y span, Ω (calculated usingDFT), upon the average Y–O8b bond distance for a series of Y2(Sn, Ti)2O7pyrochlore materials. The inset shows the local environment, with Y located onthe eight-coordinate A site, with six bonds to 48f and two to 8b oxygens. Thesymbols indicate the exact distribution of Sn/Ti NNN on the surrounding B sites.Reproduced with permission from Mitchell et al. (2012) [39]. Copyright (2012)American Chemical Society.
geometry can also affect the shielding anisotropy. Figure 1.23 showsa recent example, where the 89Y shielding anisotropy (defined as the'span', Ω = δ11 − δ33) exhibits a clear dependence upon the averageY–O8b bond distance (where 8b indicates the Wyckoff position) ina series of pyrochlore materials, proposed for the encapsulation ofradioactive waste.[39]
For quadrupolar nuclei, small changes in δiso may be masked by thepresence of significant quadrupolar broadening in MAS NMR spectra.However, the use of high-resolution approaches (e.g. MQMAS or DOR)results in isotropic spectra in which the number of distinct species canbe identified. Figure 1.24 shows 23Na NMR spectra of two samplesof a perovskite, NaNbO3, prepared using molten salt and solid-statesynthetic approaches.[40] Although the two MAS NMR spectra lookvery similar, MQMAS reveals that the second sample contains twopolymorphs, with four, rather than the expected two, 23Na resonances.These were subsequently shown to be the Pbcm and P21ma polymorphs,which exhibit different tilting of the NbO6 octahedra, as shown inFigure 1.24a. The presence of this second (polar) phase has a significantimpact upon the physical properties of the material.
The quadrupolar interaction itself is, of course, an important source ofstructural information. It was shown in Figure 1.8 that, in simple cases,CQ might be largely determined by the nature and arrangement of thecoordinating atoms. This is widely exploited in 11B NMR spectroscopy,

APPLICATIONS OF SOLID-STATE NMR SPECTROSCOPY 41
a
b a
c
Molten salt
−30−20−1010 020 −40
−30−20−1010 020 −40
δ2 (ppm)
−30−20−1010 020 −40
δ2 (ppm)δ 1
(pp
m)
Solid state
NbO6
Na
−30−20−1010 020 −40
−10
−5
15
10
5
0
−15
20
−10
−5
15
10
5
0
−15
20
(b)(a)
(c)
Figure 1.24 Crystal structures of (a) Pbcm and (b) P21ma polymorphs of NaNbO3,showing different tilting modes of the NbO6 octahedra. (c) 23Na (9.4 T) MASand MQMAS NMR spectra of NaNbO3 prepared using two different syntheticapproaches. The sample prepared using a molten-salt method contains a singlepolymorph, Pbcm, but that prepared using a solid-state synthesis contains a mixtureof two polymorphs, Pbcm and P21ma, with four rather than the expected tworesonances present in the MQMAS NMR spectrum. Reproduced with permissionfrom Johnston et al. (2010) [40]. Copyright (2010) American Chemical Society.
where there is a large difference in CQ for tetrahedral (0.0–0.5 MHz) ver-sus trigonal (2.0–2.5 MHz) boron.[2] This is clearly seen in the 11BMAS NMR spectrum of lithium diborate (Li2B4O7) in Figure 1.25a,which shows the increased CQ (and increased linewidth) of the trigonalboron species. Care must be taken, however, as the magnitude of thequadrupolar interaction is also dependent upon the exact local geometryand distortions from ideal symmetry. For example, the 27Al MAS NMR

42 SOLID-STATE NUCLEAR MAGNETIC RESONANCE SPECTROSCOPY
B(III)
B(IV)
25 −10−505101520
δ (ppm) δ (ppm)
Al(V)
Al(VI)
−200−1000100
(b)(a)
Figure 1.25 (a) 11B (14.1 T) MAS NMR spectrum of lithium diborate (Li2B4O7),showing the differences in CQ values (and linewidth) for the trigonal and tetrahedralboron species. (b) 27Al (14.1 T) MAS NMR spectrum of andalusite (Al2SiO5) andassignment of the resonances for the five- and six-coordinate Al species.
spectrum of the mineral andalusite (Al2SiO5), shown in Figure 1.25b,exhibits two quadrupolar-broadened lineshapes, with CQ values of 5.8and 15.3 MHz.[2] However, the latter species is assigned to the six-, notthe five-coordinate Al species, as might be expected, due to a significantdistortion in the octahedral coordination environment. A number ofauthors have attempted to determine the dependence of CQ upon suchdistortions in the coordination environment (e.g. the shear strain or lon-gitudinal strain), with varied success.[2] It has been widely demonstrated,however, that for 17O NMR there is a strong dependence of CQ uponthe 'covalency' of the X–O bonds; a dependence that has been usedextensively in the study of silicates and glasses to distinguish between'bridging' (Si–O–Si) and 'nonbridging' (e.g. Si–O–Mg) oxygens, wheretypical CQ values are 4–6 and 2–3 MHz, respectively.[41]
In simple cases, the asymmetry of the quadrupolar interaction is alsoable to provide support for structural models, owing to its dependenceon both local and long-range symmetry. For example, if a nucleus lieson an n-fold rotation axis (with n = 3 − 6) in the structure, ηQ will bezero, due to the axial symmetry. For the anatase form of TiO2, Ti sitson a C4 rotation axis and ηQ = 0; however, in rutile the point symmetryat Ti is mmm, and this is reflected in the ηQ value of 0.19.[42] In manycases, it can be very difficult to predict the magnitude and asymmetry ofthe quadrupolar interaction accurately (owing to their dependence onlong-range structure) and DFT calculations can prove invaluable in theinterpretation and assignment of NMR spectra. For example, for the caseof andalusite, described above, the CQ values (calculated using a planewave periodic code) are 5.1 and 16.0 MHz for Al(V) and Al(VI) species,
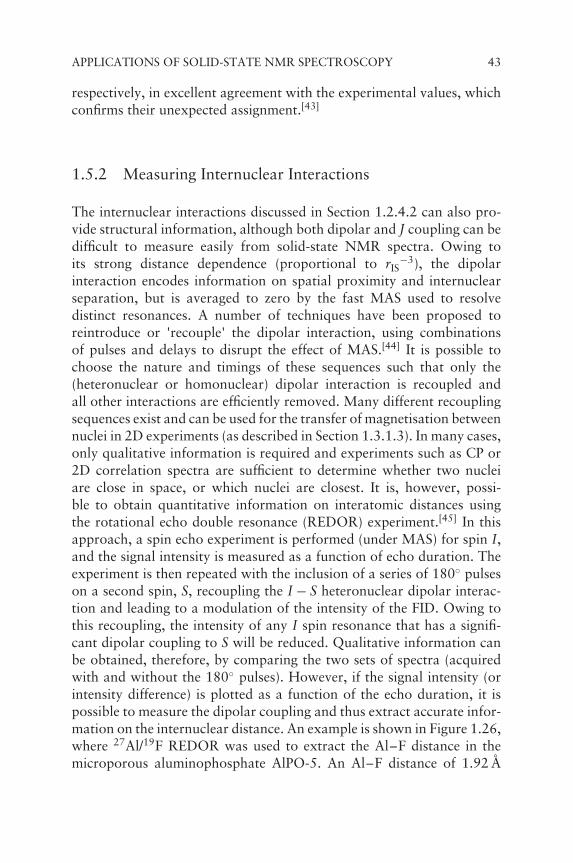
APPLICATIONS OF SOLID-STATE NMR SPECTROSCOPY 43
respectively, in excellent agreement with the experimental values, whichconfirms their unexpected assignment.[43]
1.5.2 Measuring Internuclear Interactions
The internuclear interactions discussed in Section 1.2.4.2 can also pro-vide structural information, although both dipolar and J coupling can bedifficult to measure easily from solid-state NMR spectra. Owing toits strong distance dependence (proportional to rIS
−3), the dipolarinteraction encodes information on spatial proximity and internuclearseparation, but is averaged to zero by the fast MAS used to resolvedistinct resonances. A number of techniques have been proposed toreintroduce or 'recouple' the dipolar interaction, using combinationsof pulses and delays to disrupt the effect of MAS.[44] It is possible tochoose the nature and timings of these sequences such that only the(heteronuclear or homonuclear) dipolar interaction is recoupled andall other interactions are efficiently removed. Many different recouplingsequences exist and can be used for the transfer of magnetisation betweennuclei in 2D experiments (as described in Section 1.3.1.3). In many cases,only qualitative information is required and experiments such as CP or2D correlation spectra are sufficient to determine whether two nucleiare close in space, or which nuclei are closest. It is, however, possi-ble to obtain quantitative information on interatomic distances usingthe rotational echo double resonance (REDOR) experiment.[45] In thisapproach, a spin echo experiment is performed (under MAS) for spin I,and the signal intensity is measured as a function of echo duration. Theexperiment is then repeated with the inclusion of a series of 180◦ pulseson a second spin, S, recoupling the I − S heteronuclear dipolar interac-tion and leading to a modulation of the intensity of the FID. Owing tothis recoupling, the intensity of any I spin resonance that has a signifi-cant dipolar coupling to S will be reduced. Qualitative information canbe obtained, therefore, by comparing the two sets of spectra (acquiredwith and without the 180◦ pulses). However, if the signal intensity (orintensity difference) is plotted as a function of the echo duration, it ispossible to measure the dipolar coupling and thus extract accurate infor-mation on the internuclear distance. An example is shown in Figure 1.26,where 27Al/19F REDOR was used to extract the Al–F distance in themicroporous aluminophosphate AlPO-5. An Al–F distance of 1.92 A

44 SOLID-STATE NUCLEAR MAGNETIC RESONANCE SPECTROSCOPY
Inte
nsity
1.2
0.8
0.4
0.0
1.20.80.40.0
Dephasing time / ms
Figure 1.26 27Al/19F REDOR signal as a function of echo duration (dephasingtime) for AlPO-5. The calculated curves correspond to internuclear distances of1.92 A (solid line) and 2.19 A (dotted line), with the latter being the distance inthe crystal structure proposed initially. Reproduced with permission from Gougeonet al. (2001) [46]. Copyright (2001) American Chemical Society.
was obtained, confirming the presence of an Al–F bond, correcting thestructure proposed from diffraction data.[46] REDOR generally worksbest for isolated spin pairs, i.e. where each I spin is only coupled toa single S spin. While this can be achieved in some cases by isotopiclabelling, this is not practically possible for many materials. However, inmost instances more complex analysis can lead to both qualitative andquantitative information in multiple-spin systems. In addition, althoughREDOR can be applied to quadrupolar nuclei, as in Figure 1.26, theanalysis of the resulting data is more complicated, and there are anumber of related techniques (e.g. REAPDOR and TRAPDOR) that arespecifically designed to probe dipolar couplings involving quadrupolarnuclei.[2,20]
In contrast to the dipolar interaction, the J coupling has an isotropiccomponent and so survives MAS. In principle, therefore, it should bemeasurable directly from the MAS NMR spectrum, and should pro-vide information on the covalent bonding in the system. In practice,for most solids the large dipolar interactions result in linewidths that,even under MAS, are too broad to enable simple measurement of J

APPLICATIONS OF SOLID-STATE NMR SPECTROSCOPY 45
Spin echo delay / ms
J = 10 Hz
J = 30 Hz
160 Hz
120 Hz
32 ms16 ms1 ms
δ (31P)
0 20 40 60 80 120100
H C N O Na P
7080 75
149 Hz
100 60
δ (ppm)
4080 20 0
(b)(a)
Figure 1.27 (a) 13C (14.1 T) CP MAS NMR spectrum of monosodium alendronate,showing the presence of a 149 Hz one-bond J coupling to 31P. Two-bond J couplingsare not resolved due to the inherent linewidths observed. (b) Plot of the 31P spin echosignal intensity for (MoO2)2P2O7 as a function of the echo duration, demonstratingthe presence of two different 31P/31P homonuclear J couplings, of 10 and 30 Hz.This information was used to investigate structure and phase transitions in thismaterial. Reproduced with permission from Apperley et al. (2012) [1]. Copyright(2012) Momentum Press LLC. From original data in Lister et al. (2010) [47].
couplings, unless they are particularly large, as is the case in Figure1.27a, where the one-bond 13C/31P J coupling in monosodium alen-dronate (NaC4H18NO10P2) is 149 Hz: substantially larger than thelinewidth (∼40 Hz). However, it is not possible to resolve any two-bondcouplings in this spectrum. It is possible to measure J couplings indi-rectly using a spin echo experiment, as the change in signal intensity asa function of the echo duration is modulated by any homonuclear orheteronuclear J couplings present. This is illustrated in Figure 1.27b formolybdenum pyrophosphate, (MoO2)2P2O7, in which 31P/31P J cou-plings of 10 and 30 Hz are observed, despite spectral linewidths thatare of an order of magnitude larger.[1,47] It is possible to extend thisapproach and perform a Fourier transform of the oscillating signal, inorder to obtain lineshapes in the indirect dimension of a 2D (J resolved)experiment from which the couplings (or their distribution, in morecomplex materials) can be measured directly. Despite not being resolvedin many cases, it is possible to utilise J coupling for magnetisationtransfer within 2D correlation experiments, as described previously,enabling through-bond, rather than through-space, connectivities to beinvestigated.

46 SOLID-STATE NUCLEAR MAGNETIC RESONANCE SPECTROSCOPY
1.5.3 Disordered Materials
The determination of the structure of well-ordered crystalline solidswith regular, periodic arrays of known atomic species is usually straight-forward when using approaches based on Bragg diffraction. However,while the understanding of such materials is important, it is often thedeviations from this periodic structure (i.e. compositional, positionaland temporal disorder) that produce the physical and chemical proper-ties of greatest industrial or commercial interest. The sensitivity of NMRto the local environment makes it an extremely powerful tool for pro-viding insight into disordered materials. As described above, the effectof many interactions in solid-state NMR spectra can make it difficult toextract the detailed information required, and this is particularly truefor disordered materials. In recent years, however, great progress hasbeen made through the use of DFT calculations alongside experiment inhelping spectral interpretation and assignment.
The presence of disorder in a material can have a range of possibleeffects upon the NMR spectrum. If the environment changes substan-tially (e.g. a change in coordination number) there are usually significantdifferences in the chemical shift, and resonances will be well separatedin the spectrum. This is seen in the 89Y CPMG MAS NMR spectrum ofY2Zr2O7 shown in Figure 1.28a, where anion disorder of oxygen (eachposition 7/8 occupied) results in three resonances assigned to six-, seven-and eight-coordinate Y. The relative (integrated) intensities of each ofthese resonances can be used to provide insight into the nature of theanion disorder.
If the changes to the structural environment are less marked, thespectral resonances may not be completely resolved but instead overlap,producing a complex lineshape. Providing the components are suffi-ciently resolved, it is usually possible to deconvolute the lineshape andobtain information on each of the various contributions. An exampleof this can be seen in Figure 1.28b, an 89Y MAS NMR spectrum ofthe pyrochlore, Y2Ti1.2Sn0.8O7, displaying resonances corresponding todifferent numbers of Sn/Ti on the six NNN B sites.[39] Once again, it ispossible to extract information on cation disorder, i.e. the distributionof Sn/Ti throughout the material, from the relative spectral intensities(see Section 1.7.1). A similar composite lineshape is observed in the 29SiMAS NMR spectrum of analcime in Figure 1.22b, with five overlappedresonances present, corresponding to 0–4 NNN Al. There has beenconsiderable work over many years on the analysis of 29Si NMR spectra

APPLICATIONS OF SOLID-STATE NMR SPECTROSCOPY 47
SiO2 glass
Quartz
−80 −100 −120
δ (ppm) δ (ppm)
Y(VI)
Y(VII)
Y(VIII)
400 300 200 100 0
Al(IV)
Al(VI)
100 75 50 25 −500 −25
TiSn5
Ti2Sn4
Ti3Sn3
Ti4Sn2
Ti5Sn
Ti6
250 200 150 100 −500
(b)(a)
(c) (d)
Figure 1.28 (a) 89Y (14.1 T) CPMG MAS NMR spectrum of Y2Zr2O7, with six-,seven- and eight-coordinate Y, resulting from anion disorder in the defect fluoritestructure. (b) 89Y (14.1 T) MAS NMR spectrum of Y2Ti1.2Sn0.8O7 pyrochlore, withdistinct resonances resulting from different numbers of NNN Sn/Ti. Reproducedwith permission from Mitchell et al. (2012) [39]. Copyright (2012) AmericanChemical Society. (c) 29Si (8.45 T) MAS NMR spectra of crystalline (quartz) andglassy SiO2. The increased linewidth can be related to a distribution in bondangles. Reproduced with permission from High-resolution 23Na, 27Al, and 29SiNMR Spectroscopy of Framework Aluminosilicate Glasses by R. Oestrike et al.,Geochimica et Cosmochimica Acta, 51, 2199–2209. Copyright (1987) Elsevier Ltd.(d) 27Al (14.1 T) MAS NMR spectrum of γ -Al2O3, with the resonances attributedto Al(IV) and Al(VI) species exhibiting lineshapes characteristic of a distribution ofquadrupolar parameters.
of aluminosilicate minerals and zeolites in order to extract informationon the Si/Al ratio and the cation order/disorder. The latter is particularlydifficult to achieve using X-ray diffraction, owing to the similar formfactors of Si4+ and Al3+. It has long been assumed that Al–O–Al link-ages in aluminosilicates are disfavoured; if 'Lowenstein’s rule'[48] holds(i.e. such linkages are completely absent), it is possible to determine theSi/Al ratio from 29Si MAS NMR spectra by:
(SiAl
)=
∑m
I(Q4(m))
0.25∑
m
m I(Q4(m))(1.18)

48 SOLID-STATE NUCLEAR MAGNETIC RESONANCE SPECTROSCOPY
where I(Q4(m)) represents the intensity of the resonance correspondingto Q4 species surrounded by m Al. The relative intensities of the spectralresonances can be used to probe the cation disorder and determineany deviation from a random arrangement of Si/Al. For the analcimespectrum in Figure 1.22b, it can be shown that Si/Al = 2.55 and thatthere is some short-range order, i.e. the spectral intensities do not matchthose expected from a random distribution of Si/Al.[37]
In some cases, chemically similar species (i.e. with the same coor-dination number and NNN environment) may exhibit a variation inthe local geometry, e.g. of bond lengths and bond angles. This is oftenthe case for amorphous systems, glasses, clays or gels. In this case, abroadening of the spectral resonances is observed, corresponding to asmall distribution in chemical shift, but with generally no resolution ofindividual components. An example of this is shown in Figure 1.28c,where the 29Si MAS NMR spectra of crystalline (quartz) and glassy SiO2are compared. The considerable increase in linewidth for the glass canbe related to a variation in the Si–O–Si bond angles, from 130 to 170◦
in this material.[49]
For quadrupolar nuclei, disorder results not only in a distribution ofchemical shifts from the changes in the structural environment but alsoin a distribution in the quadrupolar parameters. In some cases thesedistributions are correlated, i.e. changes in one parameter are directlyrelated to changes in the others, while in others the distributions appearto be independent. The resulting spectral lineshapes are broadened,but usually display an asymmetry, with a characteristic 'tail' to lowfrequency. The 27Al MAS NMR spectrum of γ-Al2O3, shown in Figure1.28d, has two distinct resonances, from Al(IV) and Al(VI) species, bothexhibiting such asymmetric lineshapes, indicating a distribution of NMRparameters. In many cases it is possible to gain further insight into themagnitude and nature of the distributions either from analytical fittingof the lineshapes (preferably at more than one B0 field strength) or byanalysis of lineshapes in resulting 2D (e.g. MQMAS) spectra.[20]
In some materials there may be underlying periodicity or order, butone or more components of the material may not conform to thisand may exhibit disorder. In Bragg-based diffraction, these componentsare either not refined at all or may be placed in the unit cell witha 'general' atom type or with fractional occupancy. In microporousmaterials, for example, the framework structure is ordered but thetemplate, water or guest molecules incorporated within the pores areoften disordered. Figure 1.29a shows 13C CP MAS NMR spectra of thealuminophosphate framework SIZ-4, with 1-methyl-3-ethylimidazolium

APPLICATIONS OF SOLID-STATE NMR SPECTROSCOPY 49
BQNB
Al(IV)
Al(V)
*80 40 −400
H C N
***
*
+Al2
Al1
Al2Al1
0150 100 50
δ (ppm) δ (ppm)
(b)(a)
Figure 1.29 (a) 13C CP MAS NMR spectra of as-made SIZ-4 templated with1-methyl,3-ethylimidazolium and 1,3-dimethylimidazolium cations. In one case,the template appears disordered in the material, while in the other, only a singleresonance is observed for each distinct carbon, indicating a more ordered material.Reproduced with permission from Griffin et al. (2012) [11]. Copyright (2012) RoyalSociety of Chemistry. (b) 27Al (14.1 T) MAS NMR spectrum of as-made STA-2(prepared with a BQNB template). The charge-balancing hydroxyls that attach tothe framework are disordered; however, the relative intensities of the Al(IV) andAl(V) resonances reveal the hydroxyls are bridging rather than terminal. Reproducedwith permission from Castro et al. (2010) [50]. Copyright (2010) American ChemicalSociety. In both parts, asterisks denote SSBs.
and 1,3-dimethylimidazolium templates.[11] In the former case, there aremany resonances corresponding to each carbon in the template molecule,revealing its disordered nature. However, the latter template appearsconsiderably more ordered in the material, with only one resonanceper chemically distinct carbon, indicating that all template moleculesare crystallographically equivalent. The charge-balancing anions (e.g.F− or [OH]−) often attached to the framework atoms in microporousmaterials are not always ordered with the same symmetry or period-icity as the framework. Even if disorder is present, NMR spectra canstill provide information on local structure, as in the 27Al MAS NMRspectrum of the aluminophosphate STA-2 (Figure 1.29b).[50] STA-2 con-tains a disordered array of [OH]− anions, balancing the charge of thedicationic 1,4-bis-N-quinuclidiniumbutane (BQNB) template. Integrat-ing the intensities of the Al(IV) and Al(V) resonances (1.5 : 1) reveals thatthe [OH]− species are bridging, rather than terminal (i.e. Al–OH–Alrather than Al–OH). In some cases, it is possible to determine moredetailed information on the ordering of different components of a

50 SOLID-STATE NUCLEAR MAGNETIC RESONANCE SPECTROSCOPY
material – as was recently demonstrated very successfully by Martineauet al. for AlPO cloverite, where the nonperiodic F− subnetwork wasinvestigated, in addition to the periodic framework.[51]
The discussion here has focused on 'static' disorder, i.e. a variation incomposition or position that does not change over time. Many materialsexhibit 'dynamic' disorder, where the position of an atom or moleculeis time dependent. It can be difficult to distinguish between these twocases using diffraction, where the 'average' position is typically refined.However, NMR spectroscopy is very sensitive to dynamics (as describedin the next section) and can usually provide insight into the nature ofdisorder in these cases.
1.5.4 Studying Dynamics
NMR spectroscopy is a sensitive probe of dynamics over timescalesspanning 15 orders of magnitude, as shown in Figure 1.30. Fast motion(i.e. correlation times, τc, of 10−12 to 10−9 seconds) is usually detectedby changes in relaxation processes, which rely on fluctuations in the spininteractions induced by motion. To affect T1 relaxation, any motion musthave a correlation time of ∼1/ω0, and information on the exact timescalecan be obtained from the dependence of T1 upon temperature. Motionon the correct timescale can have a dramatic effect, as demonstrated bythe 13C T1 relaxation times of diamond (∼24 hours) and adamantane(∼5 seconds).[1] The latter is a so-called 'plastic crystal', in whichthe molecules are fixed on lattice points but exhibit isotropic motionaround them, providing efficient relaxation. A detailed description ofrelaxation theory is beyond the scope of this chapter, however (seereferences [1, 2] for more detail).
10−12 10−9 10−6 10−3 1031
Fast Intermediate Slow
Relaxation, δ iso Lineshapes Exchange
~ω0−1Approximate timescale
Affected phenomena
Motion regime
Timescale (τc = k−1) / s
~ωQ−1, ~ωD
−1, ~νR−1, ~Ω −1 ~T1
Figure 1.30 Schematic plot showing the sensitivity of NMR to dynamics over arange of timescales.

APPLICATIONS OF SOLID-STATE NMR SPECTROSCOPY 51
Slow motion is usually measured by 2D exchange experiments, inwhich 'mixing times' (typically 10−1 to 103 s) can be introduced tomeasure the physical motion of an atom. This results in a change infrequency for a particular spin, due to the change in local environment,which can be detected either as a cross peak in MAS-based experiments(if the motion exchanges different spins) or by analysis of a 2D lineshape(typically for static samples) in order to determine the geometry of amotional jump.[1,2,20]
Dynamic processes with a timescale intermediate to these two extremescan also be investigated using NMR, owing to the presence of anisotropicinteractions. Motion typically results in a change in orientation and,therefore, in the anisotropic shielding or dipolar or quadrupolar cou-pling. The resulting changes in lineshapes or linewidths can then befollowed as a function of temperature to provide information on thetype and rate of the motional process. The timescales that can be probedare determined by the inverse of the magnitude of the interaction thatis varied, e.g. 10−7 to 10−3 s for the quadrupolar interaction. Theeffect of motion upon solid-state NMR lineshapes can be understoodby first considering a single spin that can hop between two positions,leading to two resonances in the NMR spectrum (labelled A and Bin Figure 1.31a). If exchange between the two positions is slow, twodistinct resonances will be observed. As the rate of exchange increases(with increased temperature), the two lines broaden and eventually coa-lesce. In the limit of fast exchange, a single, narrow line is observed atthe average of the two resonance positions. In a powdered solid, suchexchange-broadened 'pairs' must be averaged over all possible crystal-lite orientations to obtain the corresponding powder-pattern lineshapes.The lineshape contains information on the geometry, i.e. the change inorientation, of the dynamic process and on τc (and the rate constantk = 1/τc). For example, Figure 1.31b shows a quadrupolar-broadened2H (I = 1) lineshape simulated as a function of k, for a nucleus under-going a 180◦ jump (e.g. around the C2 axis of a water molecule). Whenreorientation is slow, a typical Pake doublet lineshape is observed. Asthe rate increases, there are changes to the shape and width of theline, until an averaged lineshape is observed in the limit of fast motion.For different jumps (e.g. around a C3 or C6 axis), different lineshapesand widths will be observed. For isotropic motion, there will be fullaveraging of the interaction and a sharp, narrow line will be observed(in the fast motion limit).[1,2,20]
If experiments are performed under MAS, the timescale of rotation(typically 10–100 μs) is also relevant. If motion occurs during the

52 SOLID-STATE NUCLEAR MAGNETIC RESONANCE SPECTROSCOPY
(a)
k = 0 s–1
104 s–1
× 5
× 4
× 4
Incr
easi
ng k
(b) (c)
kHz200 100 0 −100 −200 200 100 0 −100 −200
× 5
× 5
A B
νA νav νB
× 5
105 s–1
106 s–1
107 s–1
108 s–1
Figure 1.31 Simulated lineshapes showing the effect of dynamic exchange for (a) asingle crystal and (b,c) a powder distribution of crystallites for a 2H (I = 1) nucleusundergoing a 180◦ rotation around the C2 axis of a water molecule, as a function ofthe rate constant, k. In (b), the sample is static, whereas in (c), a MAS rate of 25 kHzis used.
time it takes for the sample to rotate, with a corresponding change inthe magnitude or orientation of the shielding, dipolar or quadrupolarinteractions, this will affect the averaging that MAS endeavours toachieve. The incomplete averaging manifests itself as a broadening ofthe SSBs, as shown in Figure 1.31c. At slow rates, sharp sidebands areobserved with a manifold that mirrors the static lineshape (in Figure1.31b). As the rate increases, a broadening of the sidebands is observed,until at one point they are wider than their separation, with very littlesignal in the NMR spectrum. In the fast motion regime, sharp sidebandsare again present, now with intensities that reflect the averaged lineshape.As an example, Figure 1.32a shows both 1H and 2H MAS NMR spectraof deuterated oxalic acid dihydrate.[52] Each spectrum contains tworesonances (one from the hydroxyl and one corresponding to water);however, in the 2H spectrum the resonance from D2O is broadened asa result of molecular reorientation and the corresponding change in thequadrupolar interaction. Such a change is not observed for 1H (I = 1/2).In many cases it is possible to measure the dependence of the NMRlinewidth on temperature and extract information on the activationenergy, EA. This can be seen in Figure 1.32b, where a temperature-dependent linewidth is observed in the 2H MAS NMR spectrum of a

APPLICATIONS OF SOLID-STATE NMR SPECTROSCOPY 53
366 K358 K349 K340 K331 K323 K314 K
375 K
20 10 0 −10
25 −15−10−520 15 10 5 0
δ (ppm) 1/T / K−1
3.5
4.0
5.0
4.5
5.5
0.0027 0.0028 0.0029 0.0030 0.0031 0.0032
ln(Δ
ν / H
z)
(a) (b)
O1H
μs dynamics
1H2O
O2H
2H2O
H C O
EA = 40 kJmol−1
Figure 1.32 (a) 1H and 2H (14.1 T) MAS NMR spectra of α-oxalic acid dihy-drate d6, D2C2O4 · 2D2O, exhibiting two lineshapes. In the 2H spectrum, the D2Oresonance is broadened by motional reorientation on the microsecond timescale,leading to a variation in the quadrupolar interaction. (b) Variable-temperature2H (9.4 T) MAS NMR spectra of clinohumite, 4Mg2SiO4 · Mg(OD)2, and corre-sponding Arrhenius plot of the natural log of the linewidth, �v, against 1/T. Anactivation energy of 40 ± 4 kJ mol−1 can be extracted from the gradient of the plot.Reproduced with permission from Griffin et al. (2010) [53]. Copyright (2010) RoyalSociety of Chemistry.
hydrous silicate mineral (clinohumite, 4Mg2SiO4 · Mg(OH)2), and thecorresponding Arrhenius plot shows EA to be 40 ± 4 kJ mol−1.[53] Whilediffraction measurements indicate a disordered material (each of the twopossible H sites has an occupancy of 0.5), there is no indication thatthere is anything other than a 'static' disorder of the hydroxyls. However,the sensitivity of NMR to dynamics enables this picture to be revised,revealing dynamic disorder, with exchange of H between the two sitesoccurring on the microsecond timescale (see also Section 1.7.3).
For quadrupolar nuclei, we have seen that resolution of distinct speciesmay be difficult in simple MAS NMR spectra, and 2D experiments areoften required to improve resolution. Although both the MQMAS andSTMAS approaches discussed earlier result in similar spectra for crys-talline materials, they exhibit significant differences when dynamics arepresent. For STMAS, the satellite transitions used in the experimentare broadened by the large first-order quadrupolar interaction, and anymotion on the microsecond timescale results in a broadening of the

54 SOLID-STATE NUCLEAR MAGNETIC RESONANCE SPECTROSCOPY
−10
0
10
20
30
−10
0
10
20
30
δ2 (ppm)
Al1
Al4
Al3
Al2
MQMAS STMAS
50 40 30 20 10 0 −10 −20
δ2 (ppm)
δ 1 (
ppm
)
50 40 30 20 10 0 −10 −20
(a) (b)
Figure 1.33 27Al (14.1 T) (a) MQMAS and (b) STMAS NMR spectra of as-madeAlPO-14 prepared with an isopropylammonium template. In the MQMAS NMRspectrum, the four sharp resonances correspond to the four distinct Al species, whilethe corresponding resonances in the STMAS NMR spectrum are broadened bymicrosecond-timescale dynamics of the template within the pores. After Antonijevicet al. (2006) [54].
spectral resonances in an analogous manner to that in Figure 1.32.[20,21]
However, MQMAS NMR spectra are not sensitive to dynamics onthis timescale and the resonances remain unaffected. Differential line-broadening in STMAS and MQMAS NMR spectra can be used todetect dynamics, and changes with temperature to measure the rateconstant and activation energy for the motional processes. Figure 1.33shows 27Al MQMAS and STMAS NMR spectra of as-made AlPO-14,with the MQMAS NMR spectrum showing four sharp resonances,corresponding to the four distinct Al species. However, the STMASNMR spectrum displays motionally broadened resonances as a result ofmicrosecond-timescale dynamics of the nearby template (isopropylam-monium) molecules.[54]
1.5.5 Challenging Nuclei and Systems
As all elements with stable isotopes in the periodic table (with theexception of Ce and Ar) have at least one NMR-active isotope, NMRwould appear to be a widely applicable technique. However, while

APPLICATIONS OF SOLID-STATE NMR SPECTROSCOPY 55
acquisition of solid-state NMR spectra is straightforward in many cases,in others it can be a considerable challenge. The intrinsic sensitivity of anNMR experiment is proportional to γ 3, making observation of so-called'low-γ ' nuclei a particular problem. For example, 89Y has a receptivity∼10 000 times lower than that of 1H, despite having 100% naturalabundance.[1,2] For quadrupolar nuclei, the problems are intensified bythe dependence of the (second-order) quadrupolar broadening upon1/γ , resulting in a further reduction in sensitivity. In general, relaxationprocesses are also typically less efficient for low-γ nuclei, adding to thedifficulty and timescale of experiments.[2,20] Many conventional probesare also unable to tune to the low Larmor frequencies of low-γ nuclei,and specialist equipment or adaptation is required. (This latter point hasresulted in the common definition of 'low' γ as being a nucleus with aLarmor frequency below that of 15N (60.8 MHz at 14.1 T), the typicallower end of the tuning range of most probes.) One final challengefor the study of low-γ nuclei is the low rf field strengths (ω1 = −γ B1)typically available; this can have an impact upon complex NMR pulsesequences, resulting in problems not only with sensitivity but also in theaccuracy of the information extracted. Other sensitivity challenges areposed by nuclei with low natural abundance, e.g. 15N (0.364%) or 17O(0.037%), and by samples that either have a very small volume (e.g.high-pressure materials, or proteins) or contain very little of the spinunder study (e.g. dopant elements in minerals or semiconductors).
There are a number of possible solutions to the problems outlinedabove. Perhaps the simplest (and yet not always the most convenientin practice) is to acquire spectra at the highest available magneticfield strength. This improves the absolute sensitivity for any spin, andhas the additional effect of reducing any second-order quadrupolarbroadening and narrowing lines. It is also possible to build or modifyprobes to have optimal performance at low frequencies, improving bothsensitivity and B1 field strength. A number of sensitivity enhancementtechniques are also available, including CP (if a suitable high-γ , high-abundance nucleus is available for magnetisation transfer). CP is ableto improve sensitivity for nuclei with low γ , long relaxation times andlow natural abundance.[14,15] As shown in Figure 1.18, CPMG can alsoovercome some of the challenges associated with poor sensitivity, longexperimental times and long relaxation times. For quadrupolar nuclei,if high-resolution spectra are required, the use of STMAS rather thanMQMAS[20,21] will also result in increased sensitivity. For example,STMAS has been successfully applied to obtain high-resolution NMRspectra at a moderate magnetic field strength (9.4 T) for both 25Mg
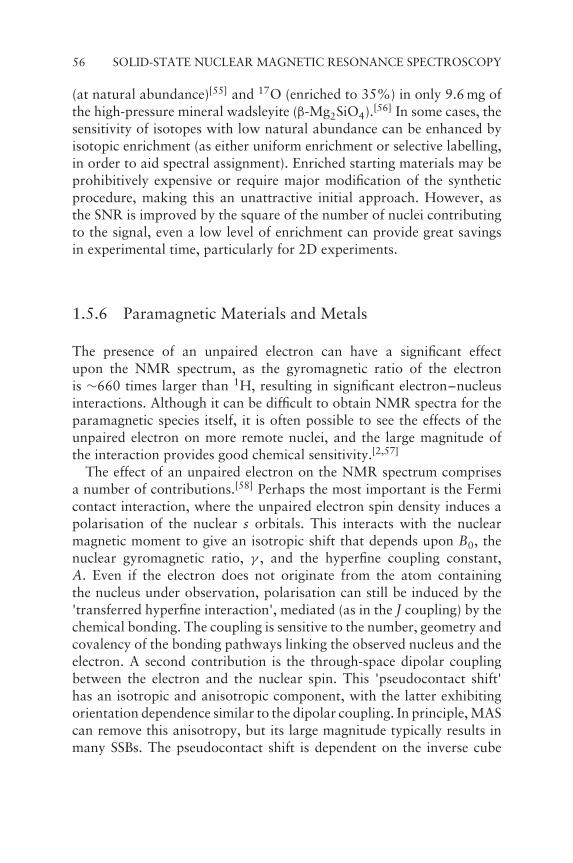
56 SOLID-STATE NUCLEAR MAGNETIC RESONANCE SPECTROSCOPY
(at natural abundance)[55] and 17O (enriched to 35%) in only 9.6 mg ofthe high-pressure mineral wadsleyite (β-Mg2SiO4).[56] In some cases, thesensitivity of isotopes with low natural abundance can be enhanced byisotopic enrichment (as either uniform enrichment or selective labelling,in order to aid spectral assignment). Enriched starting materials may beprohibitively expensive or require major modification of the syntheticprocedure, making this an unattractive initial approach. However, asthe SNR is improved by the square of the number of nuclei contributingto the signal, even a low level of enrichment can provide great savingsin experimental time, particularly for 2D experiments.
1.5.6 Paramagnetic Materials and Metals
The presence of an unpaired electron can have a significant effectupon the NMR spectrum, as the gyromagnetic ratio of the electronis ∼660 times larger than 1H, resulting in significant electron–nucleusinteractions. Although it can be difficult to obtain NMR spectra for theparamagnetic species itself, it is often possible to see the effects of theunpaired electron on more remote nuclei, and the large magnitude ofthe interaction provides good chemical sensitivity.[2,57]
The effect of an unpaired electron on the NMR spectrum comprisesa number of contributions.[58] Perhaps the most important is the Fermicontact interaction, where the unpaired electron spin density induces apolarisation of the nuclear s orbitals. This interacts with the nuclearmagnetic moment to give an isotropic shift that depends upon B0, thenuclear gyromagnetic ratio, γ , and the hyperfine coupling constant,A. Even if the electron does not originate from the atom containingthe nucleus under observation, polarisation can still be induced by the'transferred hyperfine interaction', mediated (as in the J coupling) by thechemical bonding. The coupling is sensitive to the number, geometry andcovalency of the bonding pathways linking the observed nucleus and theelectron. A second contribution is the through-space dipolar couplingbetween the electron and the nuclear spin. This 'pseudocontact shift'has an isotropic and anisotropic component, with the latter exhibitingorientation dependence similar to the dipolar coupling. In principle, MAScan remove this anisotropy, but its large magnitude typically results inmany SSBs. The pseudocontact shift is dependent on the inverse cube
APPLICATIONS OF SOLID-STATE NMR SPECTROSCOPY 57
(i.e. r−3) of the distance between the electron and the nucleus, but isindependent of any bonding pathway between the two. In general, thefast relaxation of the electron spins results in a collapse of any couplinginto a single line. However, the difference in energy of the electron spinstates is appreciable in comparison to the thermal energy, kBT, resultingin a population-weighted average shift of the resonance. The NMRresonances for paramagnetic materials are, therefore, often significantlyshifted from those found for diamagnetic analogues, and can display aconsiderable sensitivity to temperature.
In addition to isotropic and anisotropic shifts, the interaction withunpaired electrons usually leads to rapid T1 and T2 relaxation, typicallydominated by the electron–nuclear dipolar interaction. This can beadvantageous, reducing the time required to acquire spectra, althoughany broadening of the spectral lines reduces sensitivity. Doping ofdiamagnetic materials with very small amounts of paramagnetic ions(e.g. Co2+, Mn2+) in order to increase the rate of T1 relaxation formaterials where this is prohibitively slow is common for ceramics,oxides and minerals. For microporous zeolites and phosphates, thepresence of paramagnetic O2 within the pores of the material can alsolead to more rapid relaxation.
Overall, the effects of localised unpaired electrons in solid-state NMRcan be separated into three distinct regimes: (i) the paramagnetic atomitself is rarely visible in the spectrum, owing to extreme shifts, significantbroadening and rapid relaxation; (ii) nearby nuclei may be visible, butresonances will typically be broadened and shifted, and relaxation maybe too rapid to allow some conventional NMR techniques to be applied,requiring different experimental approaches; and (iii) for remote nuclei,there may be negligible changes in isotropic shift, but line broaden-ing and rapid relaxation may still be evident. Figure 1.34 shows 13CNMR spectra of the copper(II)-based metal-organic framework (MOF),HKUST-1.[59] When the MAS rate is relatively slow, the spectrum dis-plays a considerable number of SSBs, owing to the large anisotropyassociated with the electron–nuclear interaction. At faster MAS rates,more efficient removal of the anisotropy results in fewer sidebands andthe observation of an isotropic resonance at 227 ppm, correspondingto C3 in the linker molecule. However, two further resonances arealso now clear, at −50 and 853 ppm, which were not easily observedwhen the rotation was slower. These resonances are much broader,reflecting a closer proximity to Cu, and can be assigned as C2 and

58 SOLID-STATE NUCLEAR MAGNETIC RESONANCE SPECTROSCOPY
(b)
(c)
(a)
Figure 1.34 (a) Structure of HKUST-1 (a copper(II)-based MOF) and of the benzenetricarboxylate organic linker. (b,c) 13C (14.1 T) MAS NMR spectra (acquired usinga spin echo) of HKUST-1, with MAS rates of (b) 10 and (c) 60 kHz. The 'normal'range of 13C chemical shifts is highlighted by the dashed box and SSBs are denotedby asterisks.
C1, respectively.[60] Note that all three resonances are shifted outsideof the 'normal' range expected for 13C chemical shifts (0–220 ppm, asshown in Figure 1.34). Furthermore, for all resonances, T1 relaxationis very rapid (∼20 ms), and despite the addition of 262 144 transientsbeing required to obtain this natural-abundance (∼1%) 13C spectrum,the total experimental time is only 7.3 hours.
For conducting solids, the electron–nucleus interactions are morecomplicated, as the delocalised electronic band structure has the effectthat every nucleus in the structure effectively interacts with many elec-trons, and their collective influence must be considered. This results inthe 'Knight shift', first observed for Cu in 1949.[61] As the Knight shiftdepends upon the wavefunction at the nucleus, the effect is dominatedby the s electrons. The Knight shift is very large (generally >0.1%) andalways positive when the valence band is composed only of s electrons.When p or d electrons are present, the situation is more complicated,and the Knight shift may be smaller or negative. For noncubic materials,the interaction is anisotropic (described by a tensor, K, and its principalcomponents, Kxx, Kyy and Kzz), resulting in both a shift and a broadeningof the spectral resonances.
COMMONLY STUDIED NUCLEI 59
1.6 COMMONLY STUDIED NUCLEI
In order to be NMR active, a nucleus must have I > 0; however,many other factors influence the ease with which NMR spectra can beacquired. Of key importance are fundamental properties such as thespin quantum number (I), natural abundance (N) and gyromagneticratio (γ ). This information can be combined in a 'receptivity' (given byγ 3N(I(I + 1)), usually quoted relative to a specific nuclide (e.g. 1H). Forquadrupolar nuclei, the relative magnitude of the quadrupole moment,Q, also has a significant impact upon the magnitude of the quadrupolarbroadening and the sensitivity of NMR spectra. Also of practical impor-tance for experiments are the magnitude of the interactions that affect aspectrum and the typical relaxation rates; however, these properties varysignificantly for different materials. Table 1.3 gives nuclear properties(for the full table, see reference [62]), and Figure 1.35 shows a log–logplot of the relative receptivities and Larmor frequencies for a range ofisotopes, reflecting the general ease or otherwise of acquisition. Keyaspects for some of the most commonly studied nuclei are describedbelow.[2,20]
1.6.1 Hydrogen
Hydrogen is present in organic crystals, minerals, microporous frame-work materials, polymers and energy-related materials. 1H (I = 1/2) hashigh natural abundance (99.99%) and very high γ , making 1H NMRvery sensitive, although very fast MAS or homonuclear decoupling isoften required to achieve high-resolution spectra, due to large dipolarinteractions. A significant background signal is often observed, arisingfrom protons in the rotor or probehead, and additional approaches maybe required to remove this, particularly if there are relatively few protonsin the sample. CP from 1H can significantly improve the sensitivity ofNMR experiments for many other nuclei, most notably 13C. 2H (I = 1)has a low natural abundance (0.01%), moderate γ and small quadrupolemoment, making natural-abundance 2H NMR much less sensitive – butoften higher resolution under MAS – than the corresponding 1H NMRspectrum. Typical 2H CQ values are on the order of a few hundred kHz,enabling variable-temperature 2H NMR to be used as a sensitive probe

60 SOLID-STATE NUCLEAR MAGNETIC RESONANCE SPECTROSCOPY
Table 1.3 Properties of selected NMR-active nuclei[62].
Isotope Spinquantumnumber,
I
Naturalabundance,
%
Gyro-magneticratio, γ/
107 rad s−1
T−1
Larmorfrequency(14.1 T)a/
MHz
Quad-rupole
moment,Q/fm2
Relativereceptivityb
1H 1/2 99.9885 26.752 600.130 1.002H 1 0.0115 4.106 92.124 0.2860 1.11 × 10⁻⁶
6Li 1 7.59 3.937 88.316 −0.0808 6.46 × 10⁻⁴
7Li 3/2 92.41 10.397 233.233 −4.01 2.71 × 10⁻¹
11B 3/2 80.10 8.585 192.546 4.059 1.32 × 10⁻¹
13C 1/2 1.07 6.728 150.903 1.70 × 10⁻⁴
14N 1 99.636 1.934 43.367 2.044 1.01 × 10⁻³
15N 1/2 0.364 −2.713 60.834 3.80 × 10⁻⁶
17O 5/2 0.038 −3.628 81.356 −2.588 1.11 × 10⁻⁵
19F 1/2 100 25.162 564.686 8.33 × 10⁻¹
23Na 3/2 100 7.081 158.746 10.4 9.28 × 10⁻²
25Mg 5/2 10.00 −1.639 36.738 19.94 2.69 × 10⁻⁴
27Al 5/2 100 6.976 156.375 14.66 2.08 × 10⁻¹
29Si 1/2 4.685 −5.319 119.229 3.68 × 10⁻⁴
31P 1/2 100 10.839 242.938 6.66 × 10⁻²
33S 3/2 0.75 2.056 46.066 −6.78 1.70 × 10⁻⁶
35Cl 3/2 75.76 2.624 58.800 −8.165 3.58 × 10⁻³
37Cl 3/2 24.24 2.184 48.9500 −6.435 6.61 × 10⁻⁴
39K 3/2 93.258 1.250 28.004 5.85 4.75 × 10⁻⁴
43Ca 7/2 0.135 −1.803 40.389 −4.08 8.69 × 10⁻⁶
45Sc 7/2 100 6.509 145.782 −22.0 3.03 × 10⁻¹
47Ti 5/2 7.44 −1.511 33.833 30.2 1.56 × 10⁻⁴
49Ti 7/2 5.41 −1.511 33.842 24.7 2.04 × 10⁻⁴
51V 7/2 99.750 7.046 157.852 −5.2 3.83 × 10⁻¹
59Co 7/2 100 6.332 142.393 42 2.79 × 10⁻¹
67Zn 5/2 4.102 1.677 37.549 15.0 1.18 × 10⁻⁴
71Ga 3/2 39.892 8.181 183.020 10.7 5.71 × 10⁻²
77Se 1/2 7.63 5.125 114.454 5.37 × 10⁻⁴
81Br 3/2 49.31 7.250 162.074 25.4 4.91 × 10⁻²
87Rb 3/2 27.83 8.786 196.365 13.35 4.94 × 10⁻²
89Y 1/2 100 −1.316 29.408 1.19 × 10⁻⁴
93Nb 9/2 100 6.567 146.889 −32 4.89 × 10⁻¹
109Ag 1/2 46.161 −1.252 27.927 4.94 × 10⁻⁵
119Sn 1/2 8.59 −10.032 223.792 4.53 × 10⁻³
125Te 1/2 7.07 −8.511 189.340 2.28 × 10⁻³
129Xe 1/2 26.4006 −7.452 166.897 5.71 × 10⁻³
131Xe 3/2 21.2324 2.209 49.474 −11.4 5.98 × 10⁻⁴
133Cs 7/2 100 3.533 78.714 −0.343 4.84 × 10⁻²
183W 1/2 14.31 1.128 25.004 1.07 × 10⁻⁵
207Pb 1/2 22.1 5.577 125.551 2.01 × 10⁻³
aLarmor frequency at 14.1 T.bReceptivity (γ 3 N(I(I + 1))), quoted relative to 1H.

COMMONLY STUDIED NUCLEI 61lo
g 10 r
ecep
tivity
(re
lativ
e to
1H
)
0
−1
−2
−3
−4
−5
−6
−7−1.5 −1.0 −0.5
1H
1/213/25/2
37/29/25
2H57Fe
* = 159Tb, 231Pa* = 151Eu
67
17O
127I *
187Os
41K
75As 79Br
*
191Ir
193Ir197Au
235U
Key to spin I
0
log10 (γ (X)/γ (1H))
19F
205TI
203TI31P
87Rb71Ga
11B
7Li141Pr
27AI55Mn
43Ca59Co
115In
93Nb51V
165Ho209Bi
139La133Cs
181Ta175Lu
123Sb
85Rb 153Eu9Be
3He
115Sn123Te13C
15N
21Ne43Ca
33S
119Sn117Sn
125Te
183W
179Hf
129Xe
113In65Cu
69Ga185Re
187Re
121Sb 23Na63Cu
81Br
155Gd
103Rh107Ag
61Ni
50V138La
195Pt
113Cd207Pb
199Hg111Cd
77Se29Si
10B35Cl
171Yb6Li
167Er
145Nd157Gd
109Ag53Cr
67Zn
137Ba
91Zr176Lu14N
169Tm135Ba189Os
131Xe37Cl
161Dy
149Sm73Ge
95Mo97Mo201Hg49Ti
25Mg
39K 143Nd101Ru
47Ti
163Dy
173Yb
89Y99Ru
87Sr
105Pd177Hf
83Kr147Sm
Figure 1.35 A log–log plot of receptivity (relative to 1H) as a function of γ relativeto that of 1H for NMR-active isotopes.
of microsecond-timescale dynamics, particularly given the possibility ofselective deuteration of many materials.
1.6.2 Lithium
Lithium is present in many ceramics and energy materials. 7Li (I = 3/2)has a 92.4% natural abundance, relatively high γ and, typically, fairlylow CQ values. The chemical shift range for lithium in diamagneticmaterials is relatively small (just a few ppm), but significant shifts of theCT are observed for paramagnetic materials. 6Li (I = 1) has low naturalabundance (7.59%), moderate γ and a very small quadrupole moment,enabling direct observation despite the lack of a CT. Lithium NMRcan also be used to probe dynamics (of particular interest for batterymaterials) by following the linewidth or chemical shift as a function oftemperature.
62 SOLID-STATE NUCLEAR MAGNETIC RESONANCE SPECTROSCOPY
1.6.3 Boron
Boron is present in many potential hydrogen storage materials, glasses,zeotypes and carboranes. 11B (I = 3/2) has 80.1% natural abundanceand a relatively high γ , making it easy to study by NMR. However,some types of probehead contain boron nitride, which gives rise toa broad background signal that must be removed (typically using aspin echo experiment). The sensitivity of the chemical shift and CQ tocoordination number (see Figure 1.25) makes 11B NMR an excellentprobe of local structure, even in disordered or amorphous materials.The second NMR-active isotope, 10B, has a lower natural abundanceand integer spin (I = 3) and a larger quadrupole moment, resulting inextremely broad spectral lineshapes, and its study is generally limited.
1.6.4 Carbon
Carbon is present in organic crystals, MOFs, biomaterials, polymers,carbonaceous nanomaterials, as-synthesised zeotypes and drug-deliverymaterials. 13C (I = 1/2) has only 1.07% natural abundance and mod-erate γ , meaning that CP from 1H is almost always required to acquirespectra on a reasonable timescale. As in the solution state, the 13Cchemical shift is a sensitive probe of the local chemical environment,and 13C shifts in paramagnetic MOFs can act as indirect probes of theadjacent metal centres where binding of guest molecules can take place.High-power decoupling is generally required in order for many mate-rials to remove the heteronuclear dipolar coupling to 1H and improvespectral resolution.
1.6.5 Oxygen
Oxygen is a ubiquitous element in most inorganic compounds, and 17ONMR should have a range of applications that includes geochemistry,materials science, biochemistry and catalysis. However, the extremelylow natural abundance (0.037%) has limited its study. For routine obser-vation, isotopic enrichment (involving both significant cost and effort)is, therefore, usually necessary, and this has hindered the development

COMMONLY STUDIED NUCLEI 63
of 17O solid-state NMR. An additional problem is the quadrupolarbroadening (I = 5/2), which usually requires the use of MQMAS, DORor another high-resolution approach. However, recent developmentsin methodology have enabled a much wider application, and 17O hasbeen shown to be an excellent probe of detailed local structure, withvariations in both chemical shift and quadrupolar parameters linked tocoordination number, covalency, nearest-neighbour coordinating atomsand local geometry.
1.6.6 Fluorine
Fluorine is present in many minerals, synthetic zeotypes and fluoropoly-mers. 19F (I = 1/2) has 100% natural abundance and very high γ ,making it easy to study, although as with 1H, fast MAS rates may berequired to overcome large CSA and homonuclear dipolar interactions.The large shift range, dipole moment and large J couplings mean that 19Fcan act as a very sensitive probe of coordination environment, disorderand bond connectivities and lengths. A number of different chemicalshift references have been used for 19F in the literature, so care must betaken when comparing spectra. As [OH]− and F− appear almost iden-tical when using X-ray diffraction techniques, 19F NMR has frequentlybeen used to investigate cases of [OH]−/F− disorder in materials suchas minerals and zeotypes.
1.6.7 Sodium
Sodium is present in many inorganic materials, minerals, clays, ceramics,zeotypes and biomaterials. With 100% natural abundance, moderate γ
and quadrupole moment, 23Na (I = 3/2) is relatively straightforwardto study using solid-state NMR, although MQMAS NMR spectra areoften required to resolve distinct Na sites, owing to sodium’s smallchemical shift range. The sensitivity of 23Na quadrupolar parametersto the local environment allows 23Na NMR to provide information onpolymorphism, as previously shown in Figure 1.24, and 23Na NMRplays an important role in understanding local structure and disorder inmany glasses.

64 SOLID-STATE NUCLEAR MAGNETIC RESONANCE SPECTROSCOPY
1.6.8 Aluminium
Aluminium is present in minerals, zeotypes, MOFs, clays and glasses.27Al (I = 5/2) has 100% natural abundance, moderate γ and quad-rupole moment, making 27Al NMR relatively straightforward. In manycases, experiments such as MQMAS are used to improve spectral res-olution. As both δiso and CQ are very sensitive to the coordinationnumber and local geometry (as shown in Figures 1.22 and 1.25), 27AlNMR experiments have been widely used to provide information oncoordination number, structure and bonding, particularly in glasses andzeolites.
1.6.9 Silicon
After oxygen, silicon is the most abundant element in the Earth’s crust,and is an integral component of many zeotypes, glasses, minerals andsemiconductors. 29Si (I = 1/2) has a low natural abundance (4.7%)and typically very long T1 relaxation times, making 29Si NMR straight-forward but time-consuming. The large shift range and sensitivity tolocal structure (e.g. bond angles and lengths), coordination number andnext-nearest-neighbour type (as discussed in Section 1.5.1) make 29SiNMR a sensitive probe of the local structure in many materials. 29SiNMR is a vital tool in the study of silicate glasses, disorder in zeolitesand catalysts, and has been widely applied for the study of naturalminerals.
1.6.10 Phosphorus
The high γ and 100% natural abundance of 31P (I = 1/2) make it readilyobservable by solid-state NMR, leading to a range of applications in thestudy of glasses, zeotypes and biomaterials. 31P exhibits a large chemicalshift range, and the isotropic shift is very sensitive to the local geometry(i.e. bond lengths and angles), coordination number and condensationand NNN substitutions. Furthermore, as J and dipolar couplings to 31Pare often relatively large, longer-range structures and connectivites canbe easily probed using a range of 1D and 2D NMR experiments.

NMR OF MATERIALS 65
1.6.11 Xenon
While not itself a solid, xenon gas is an informative probe of catalyticallyactive surfaces, clathrates and other porous materials. 129Xe (I = 1/2)has moderate natural abundance (26.4%) and γ , making 129Xe NMRrelatively straightforward. 129Xe chemical shifts and T1 relaxation areextremely sensitive to the local environment (e.g. the composition of thesurface on which Xe is physisorbed) and partial pressure of Xe (e.g.the number of Xe atoms per pore of a zeolite). Furthermore, significantchanges are observed in the shielding anisotropy and NMR lineshapewhen Xe is in contact with a surface or within a pore. 131Xe (I = 3/2)is also NMR active, but its lower γ and natural abundance (21.2%),combined with its quadrupole moment, make it less attractive for study.
1.7 NMR OF MATERIALS
Over the years, NMR spectroscopy has helped to answer a range ofstructural questions in areas of chemistry, biology, materials science andgeochemistry. Clearly, it is not possible in this brief overview to describein detail its wide variety of applications. However, in this section wedescribe some of the main aspects associated with the study of someimportant types of material, provide some key examples and direct thereader to more detailed descriptions and reviews in the literature.
1.7.1 Simple Ionic Compounds and Ceramics
NMR has been widely used to study many simple compounds, includ-ing oxides, fluorides and phosphates. In many cases, the informationprovided can be straightforward, e.g. information about the number ofdistinct sites in the asymmetric unit, space groups or the polymorph(s)present, as shown in Figure 1.24. NMR spectroscopy is a useful toolfor the identification and quantification of impurity phases, providingimportant information concerning the properties or processing of a bulkmaterial. For series of related compounds, many studies into the depen-dence of NMR parameters upon local geometry and upon neighbouringatoms have been performed.[2]

66 SOLID-STATE NUCLEAR MAGNETIC RESONANCE SPECTROSCOPY
For ordered crystalline compounds, NMR is often used alongsideBragg diffraction, in some cases to provide confirmatory evidence orsupport for a structural model. However, for materials where thereis disorder (either in the position of atoms or in the nature of theatom occupying a particular crystallographic site), the sensitivity ofNMR to the atomic-scale environment provides a vital structural probe.In recent years, first-principles calculations have been used to helpto interpret and assign the complex NMR spectra that result fromdisordered materials, such as many important functional ceramics. Forexample, DFT calculations were used to assign the resonances observedin the 89Y and 119Sn MAS NMR spectra of Y2(Ti, Sn)2O7 pyrochlores(of interest for the encapsulation of radioactive waste), an example ofwhich was shown in Figure 1.28b.[63,64] As it is not generally possible tocarry out calculations on truly disordered materials (as an impracticallylarge number of atoms would be required to ensure all possible localenvironments were present), a simplified, systematic approach was used(shown in Figure 1.36a), in which the NNN environment of just one ofthe cations was altered to include all possible numbers and arrangementsof Sn/Ti on the six surrounding B sites. The calculated chemical shifts,plotted in Figure 1.36b, show that for 89Y, a systematic change of∼18 ppm was observed as Ti substituted onto the surrounding B sites.However, for 119Sn, although there was a change in shift when Tiwas substituted into Sn-rich NNN environments, as the Ti content ofthe B sites increased this change became smaller and the chemical shiftspredicted for differing environments overlapped. These calculations wereused to assign the distinct resonances in the 89Y MAS NMR spectra,and to explain the broad, overlapping resonances observed for 119Sn.It was shown that both sets of spectra were consistent with a randomdistribution of B-site cations.[63,64]
A particularly elegant example of the application of NMR spec-troscopy in simple oxides is a recent study of ZrW2O8, in which the17O NMR spectrum contains three resonances for the four distinctoxygens.[65] At higher temperatures, the peaks broaden and coalesceinto a single, Lorentzian-like line, indicating that all the oxygen sites areinvolved in the exchange process, as shown in Figure 1.37a. To providemore detail, variable-temperature 2D exchange spectroscopy (EXSY)experiments were performed, showing exchange between sites throughthe appearance of cross peaks linking the isotropic peaks on the diagonal(Figure 1.37b). The 2D spectra were able to discriminate unambiguouslybetween two possible models for the dynamic process.

NMR OF MATERIALS 67
Sn6
1,3,5-Sn3Ti3
Sn5Ti
1,2-Sn2Ti4
1,2-Sn4Ti2
1,3-Sn2Ti4
1,3-Sn4Ti2
1,4-Sn2Ti4
1,2,3-Sn3Ti3
Ti6
1,4-Sn4Ti2
SnTi5
Sn
Ti
1,2,4-Sn3Ti3
n S
n N
NN
5
4
3
2
1
0
200 180 160 140 120 100 80 60 40 20 −565 −570 −575 −580 −585 −590 −5950
89Y
δ calc (ppm)
isoδ
calc (ppm) iso
Sn6Sn5Ti1,2-Sn4Ti21,3-Sn4Ti21,4-Sn4Ti21,2,3-Sn3Ti31,2,4-Sn3Ti31,3,5-Sn3Ti31,2-Sn2Ti41,3-Sn2Ti41,4-Sn2Ti4SnTi5Ti6
119Sn
New unit cellCentral cluster 1,3,5-Sn3Ti3Y2Sn2O7 unit cell
(b)
(a)
Figure 1.36 (a) Schematic showing the computational approach employed for DFTcalculations of the Y2(Ti, Sn)2O7 pyrochlore solid solution, with the modification ofthe local environment of just one of the cations within the unit cell to all possiblearrangements of Sn/Ti on the six NNN B sites. (b) Plots showing the calculated89Y and 119Sn isotropic chemical shifts as a function of the number of Sn NNN.Reproduced with permission from Reader et al. (2009) [63]. Copyright (2009)American Chemical Society.
For a more detailed discussion of the application of NMR to oxidesand ceramics, see references [2, 41].
1.7.2 Microporous Materials
Microporous materials consist of frameworks that contain pores andchannels of similar sizes to small- and medium-sized molecules, enablingchemistry to take place at the internal surfaces of the pores.[66] Thishas resulted in a variety of applications, including gas storage and

68 SOLID-STATE NUCLEAR MAGNETIC RESONANCE SPECTROSCOPY
1000
O4 O3 O1/O2
800 600 400 200 0
δ (ppm)
* * * * ** * * * * *
229 °C220 °C
201 °C183 °C
164 °C
146 °C
129 °C
112 °C
69 °C
28 °C
δ2(ppm)
*
*
750 600700 650 550 500 450 400
O1/O2
O4
O1/O2
↔
O3
O3
O4
O1/
O2
O3
O4
O4 O3 O1/O2
↔↔
* *
δ 1
(b)(a)
Figure 1.37 17O (11.7 T) (a) variable-temperature MAS NMR spectra and (b) 2DEXSY NMR spectrum (57 ◦C) of ZrW2O8, showing exchange between all of theoxygen species, confirming the type of dynamics present (i.e. a 'ratcheting' modelrather than an 'SN2' model). Reproduced (in part) with permission from Hampsonet al. (2004) [65]. Copyright (2004) Royal Society of Chemistry.
separation, selective adsorption, catalysis and drug delivery. The maintypes of such materials include aluminosilicate zeolites, phosphate-based frameworks and MOFs. Solid-state NMR is a valuable tool forthe study of microporous materials, as many of the components of theframeworks are NMR active, e.g. 27Al/29Si/17O for zeolites, 27Al/31P/17Ofor phosphates and 1H/13C for MOFs. Furthermore, NMR can be used tostudy the cations (H+/Na+/Mg2+/K+/Ca2+) typically found in zeolites,the extra-framework charge-balancing anions ([OH]−/F−) in phosphatesand many of the guest molecules or templates found within the poresof each type of material. Although framework structures can oftenbe studied by diffraction (unless significant compositional disorder ispresent), the extra-framework anions, metal cations, water and guestmolecules rarely possess the long-range order necessary for diffraction,or else (in many cases) are dynamic.
Zeolites are composed of corner-sharing SiO4 and AlO4 tetrahedralunits, with any net framework charge balanced by cations (typically Na+
or H+) in the channels.[66] For high-silica zeolites, the most useful pieceof information NMR can provide is the number of crystallographicallydistinct species and their occupancies. For example, ZSM-5 undergoes a
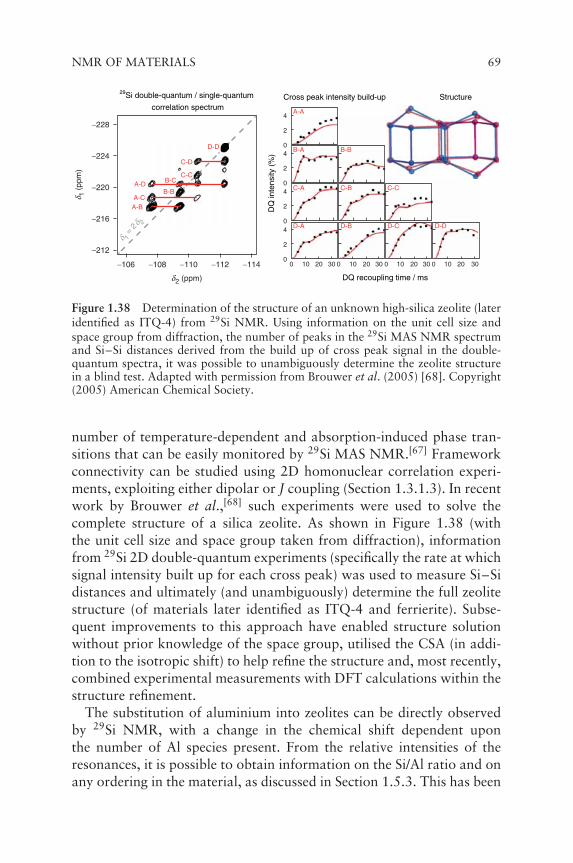
NMR OF MATERIALS 69δ 1
(pp
m)
δ2 (ppm)
D-D
C-D
A-DC-C
B-C
B-BA-C
A-B
−228
−224
−220
−216
−212
−106 −108 −110 −112 −114
A-A
B-A
C-A
D-A D-B
C-B
B-B
C-C
D-C D-D
DQ
inte
nsity
(%
)
4
2
0
DQ recoupling time / ms
20100 30
4
2
04
2
04
2
020100 30 0 2010 30 20100 30
29Si double-quantum / single-quantum
correlation spectrumCross peak intensity build-up Structure
δ 1 =
2δ 2
Figure 1.38 Determination of the structure of an unknown high-silica zeolite (lateridentified as ITQ-4) from 29Si NMR. Using information on the unit cell size andspace group from diffraction, the number of peaks in the 29Si MAS NMR spectrumand Si–Si distances derived from the build up of cross peak signal in the double-quantum spectra, it was possible to unambiguously determine the zeolite structurein a blind test. Adapted with permission from Brouwer et al. (2005) [68]. Copyright(2005) American Chemical Society.
number of temperature-dependent and absorption-induced phase tran-sitions that can be easily monitored by 29Si MAS NMR.[67] Frameworkconnectivity can be studied using 2D homonuclear correlation experi-ments, exploiting either dipolar or J coupling (Section 1.3.1.3). In recentwork by Brouwer et al.,[68] such experiments were used to solve thecomplete structure of a silica zeolite. As shown in Figure 1.38 (withthe unit cell size and space group taken from diffraction), informationfrom 29Si 2D double-quantum experiments (specifically the rate at whichsignal intensity built up for each cross peak) was used to measure Si–Sidistances and ultimately (and unambiguously) determine the full zeolitestructure (of materials later identified as ITQ-4 and ferrierite). Subse-quent improvements to this approach have enabled structure solutionwithout prior knowledge of the space group, utilised the CSA (in addi-tion to the isotropic shift) to help refine the structure and, most recently,combined experimental measurements with DFT calculations within thestructure refinement.
The substitution of aluminium into zeolites can be directly observedby 29Si NMR, with a change in the chemical shift dependent uponthe number of Al species present. From the relative intensities of theresonances, it is possible to obtain information on the Si/Al ratio and onany ordering in the material, as discussed in Section 1.5.3. This has been

70 SOLID-STATE NUCLEAR MAGNETIC RESONANCE SPECTROSCOPY
one of the major applications of NMR in zeolites, owing to the difficultyof studying framework disorder by diffraction. NMR has also been usedto determine the presence of guest molecules within the pores of zeolites,to follow in situ adsorption and subsequent chemical reaction and toinvestigate the dynamics of guest molecules (typically using 2H NMRor relaxation measurements). For example, 13C MAS NMR was usedto directly observe the selective adsorption of o- and p-xylene in ZSM-5and to determine the other minor species adsorbed.[67]
Aluminophosphate (AlPO) frameworks are formed from alternatingcorner-sharing AlO4 and PO4 tetrahedra.[66] Many different structureshave been observed, including a number that do not have zeolite ana-logues. Although the AlPO framework itself is neutral, materials aretypically prepared using a structure-directing agent or template. Theseare usually positively charged amine bases, so charge balancing in as-made materials is achieved by the incorporation of extra-frameworkanions (F− or [OH]−), which bond to Al. As can be seen in Figures1.20 and 1.22a, the 27Al MAS NMR spectra clearly show the coordina-tion number of Al in both as-made and calcined forms of AlPO-14.[34]
Both 31P and 27Al NMR of AlPOs are used to provide informationon the number and intensities of the species present, although, as 27Alis quadrupolar, high-resolution experiments such as MQMAS may berequired to separate the distinct resonances. As the extra-frameworkanions may be disordered or have a different periodicity to that ofthe framework itself, the structures of as-made AlPOs can be difficultto solve from powder diffraction, and NMR can provide many use-ful contributions. Framework connectivity can be investigated using2D 27Al/31P heteronuclear or 31P/31P dipolar homonuclear correlationexperiments.
Water plays a significant role in the structure of both calcined andas-made materials, with many of the former readily absorbing waterfrom the atmosphere, causing a change in their structure that can befollowed by 31P and 27Al NMR. Many as-made materials also containwater (often disordered over multiple crystallographic positions). Ingeneral, variation of the water content for as-made AlPOs is muchrarer, although this has been observed in situ by 27Al and 31P NMRfor AlPO-53(A), as shown in Figure 1.39.[69] This material contains twomethylamine template molecules and two water molecules within eachpore. Under MAS (at a rate of 30 kHz), the 27Al and 31P MAS NMRspectra undergo a significant change in appearance. It has been shownthat this is the result of a facile dehydration process (which occursdue to the frictional heating of the sample under MAS), which can be
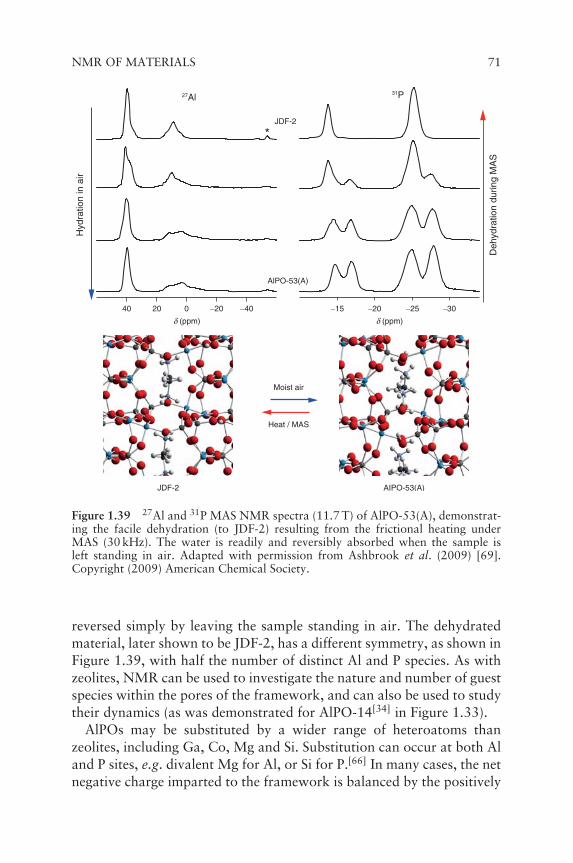
NMR OF MATERIALS 71
*
27Al
Hyd
ratio
n in
air
Deh
ydra
tion
durin
g M
AS
20 −20
δ (ppm) δ (ppm)
−40 −15 −20 −25 −300
Moist air
Heat / MAS
JDF-2 AIPO-53(A)
AlPO-53(A)
JDF-2
31P
40
Figure 1.39 27Al and 31P MAS NMR spectra (11.7 T) of AlPO-53(A), demonstrat-ing the facile dehydration (to JDF-2) resulting from the frictional heating underMAS (30 kHz). The water is readily and reversibly absorbed when the sample isleft standing in air. Adapted with permission from Ashbrook et al. (2009) [69].Copyright (2009) American Chemical Society.
reversed simply by leaving the sample standing in air. The dehydratedmaterial, later shown to be JDF-2, has a different symmetry, as shown inFigure 1.39, with half the number of distinct Al and P species. As withzeolites, NMR can be used to investigate the nature and number of guestspecies within the pores of the framework, and can also be used to studytheir dynamics (as was demonstrated for AlPO-14[34] in Figure 1.33).
AlPOs may be substituted by a wider range of heteroatoms thanzeolites, including Ga, Co, Mg and Si. Substitution can occur at both Aland P sites, e.g. divalent Mg for Al, or Si for P.[66] In many cases, the netnegative charge imparted to the framework is balanced by the positively
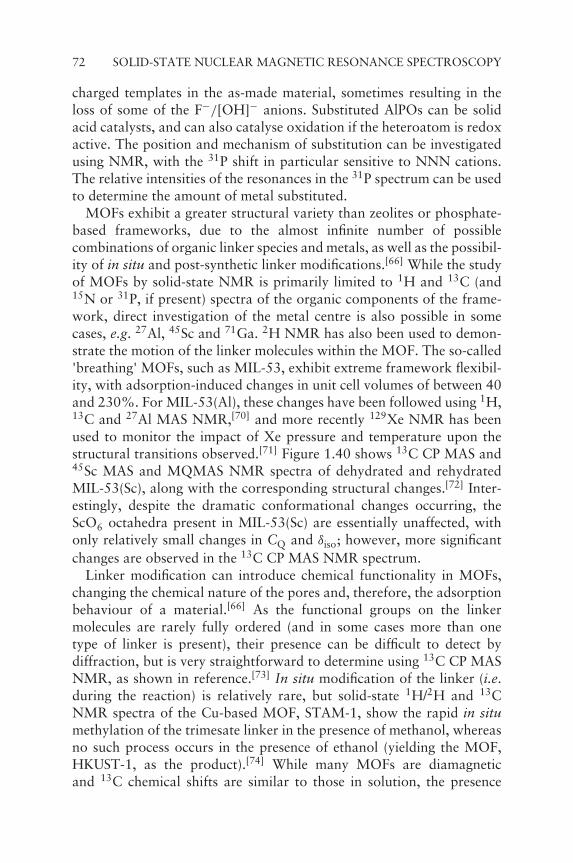
72 SOLID-STATE NUCLEAR MAGNETIC RESONANCE SPECTROSCOPY
charged templates in the as-made material, sometimes resulting in theloss of some of the F−/[OH]− anions. Substituted AlPOs can be solidacid catalysts, and can also catalyse oxidation if the heteroatom is redoxactive. The position and mechanism of substitution can be investigatedusing NMR, with the 31P shift in particular sensitive to NNN cations.The relative intensities of the resonances in the 31P spectrum can be usedto determine the amount of metal substituted.
MOFs exhibit a greater structural variety than zeolites or phosphate-based frameworks, due to the almost infinite number of possiblecombinations of organic linker species and metals, as well as the possibil-ity of in situ and post-synthetic linker modifications.[66] While the studyof MOFs by solid-state NMR is primarily limited to 1H and 13C (and15N or 31P, if present) spectra of the organic components of the frame-work, direct investigation of the metal centre is also possible in somecases, e.g. 27Al, 45Sc and 71Ga. 2H NMR has also been used to demon-strate the motion of the linker molecules within the MOF. The so-called'breathing' MOFs, such as MIL-53, exhibit extreme framework flexibil-ity, with adsorption-induced changes in unit cell volumes of between 40and 230%. For MIL-53(Al), these changes have been followed using 1H,13C and 27Al MAS NMR,[70] and more recently 129Xe NMR has beenused to monitor the impact of Xe pressure and temperature upon thestructural transitions observed.[71] Figure 1.40 shows 13C CP MAS and45Sc MAS and MQMAS NMR spectra of dehydrated and rehydratedMIL-53(Sc), along with the corresponding structural changes.[72] Inter-estingly, despite the dramatic conformational changes occurring, theScO6 octahedra present in MIL-53(Sc) are essentially unaffected, withonly relatively small changes in CQ and δiso; however, more significantchanges are observed in the 13C CP MAS NMR spectrum.
Linker modification can introduce chemical functionality in MOFs,changing the chemical nature of the pores and, therefore, the adsorptionbehaviour of a material.[66] As the functional groups on the linkermolecules are rarely fully ordered (and in some cases more than onetype of linker is present), their presence can be difficult to detect bydiffraction, but is very straightforward to determine using 13C CP MASNMR, as shown in reference.[73] In situ modification of the linker (i.e.during the reaction) is relatively rare, but solid-state 1H/2H and 13CNMR spectra of the Cu-based MOF, STAM-1, show the rapid in situmethylation of the trimesate linker in the presence of methanol, whereasno such process occurs in the presence of ethanol (yielding the MOF,HKUST-1, as the product).[74] While many MOFs are diamagneticand 13C chemical shifts are similar to those in solution, the presence
NMR OF MATERIALS 73
(e)
(f)
(a)
(b) (d)
(c)
204060
14
16
18
12
180 160
δ (ppm)
δ 1 (p
pm)
140 120200 100
180 160
δ (ppm)
140 120200 100180 160 140 120200 100
δ2 (ppm)
204060
14
16
18
12
δ 1 (
ppm
)
δ2 (ppm)
Figure 1.40 (a,b) Structural models and (c,d) 13C (14.1 T) CP MAS and (e,f) 45Sc(20.0 T) MAS/MQMAS NMR spectra of (a,c,e) dehydrated and (b,d,f) rehydratedMIL-53(Sc), showing the 'breathing' of the structures. Reproduced (in part) fromSpringuel-Huet et al. (2010) [71]. Copyright (2010) American Chemical Society.
of paramagnetic ions in many MOFs of interest can complicate 13CNMR spectra. While relatively few 13C NMR spectra have so far beenreported for paramagnetic MOFs,[75] it is clear that the most significanteffect of the paramagnetic ions is the large shift range (over 1500 ppm).In many cases, fast MAS (i.e. above 50 kHz) is required to achievehigh-resolution spectra. Owing to the large positive and negative shiftsobserved, assignment of these spectra is nontrivial. Furthermore, the factthat the paramagnetic ions are connected in an infinite network meansthat assignments based on relaxation measurements and distances tometal ions are often ambiguous.
As with zeolites and phosphates, solid-state NMR is perhaps of thegreatest use in MOFs for the study of guest species. As examples, 31PMAS NMR has been used to confirm that the H3PMo12O40 poly-oxometalate cluster remained intact when loaded into the pores ofMIL-100(Fe),[76] and 13C MAS or CP MAS NMR has been used tostudy a variety of drug species.[77] It is interesting to note that the major-ity of work to date has been carried out for diamagnetic guests withinparamagnetic MOFs. The 13C isotropic shifts of the guests (mainlydrug species) are shifted slightly by pseudocontact shifts (0–15 ppm),but are generally distinguishable from the framework resonances, whichare typically of greater intensity (owing to sub-stoichiometric guest

74 SOLID-STATE NUCLEAR MAGNETIC RESONANCE SPECTROSCOPY
loading) and, in the case of paramagnetic MOFs, experience far largerparamagnetic contributions to their isotropic shifts. In many cases, the13C shifts of the MOFs are also sensitive to the location of guest speciesbound to the metal centres.
For a more detailed discussion of the application of NMR to microp-orous materials, see references [66, 78–80].
1.7.3 Minerals and Clays
As most of the minerals in the Earth’s crust and mantle (i.e. downto depths of ∼3000 km) are silicates and aluminosilicates, these mate-rials have generally formed the focus of most NMR studies in geo-chemistry.[2,20,37] The principal use of NMR spectroscopy has been theinvestigation of Al/Si disorder in the framework aluminosilicates thataccount for over 90% of the crust, exploiting the sensitivity of the29Si chemical shift to NNN composition. The stability of these phasesdepends not only on the composition, i.e. upon the Al/Si ratio, but alsoon the local order. As described in Section 1.5.3, the number of relativelyhigh-energy Al–O–Al linkages is often minimised (Lowenstein’s rule),and the relative intensity of the resonances in the 29Si MAS NMR spec-trum can provide information on both composition and any short-rangeordering (see Figure 1.22b).[37]
Clay minerals are (hydrous) layered aluminosilicates, containing 2Dtetrahedrally and/or octahedrally coordinated silicate sheets.[20,37] Thematerials lack long-range order (and so are difficult to investigate byconventional diffraction), but the short-range (Al/Si) order can be easilyquantified using 29Si NMR, as described above. The exact distributionof Al within such layered materials determines the charge on the layers,which ultimately plays a significant role in their physical and chemicalproperties. The sensitivity of the 27Al chemical shift to the coordinationnumber enables NMR to provide an accurate measurement of theAl(IV)/Al(VI) ratio. Recent work has also utilised 17O NMR (MASand MQMAS) to probe the distribution of the T–O–T (T = Si or Al)linkages.
NMR spectroscopy has also been utilised for the study of anion dis-order in many rock-forming minerals, where the substitution of F− for[OH]− is relatively common.[37] It has long been known that in manytypes of material the anion distribution is rarely random, but that F−
often has a strong preference to be located closer to particular cations.

NMR OF MATERIALS 75
For layered silicates, both 1H and 19F NMR can be used to determinethe local environment (i.e. the number and nature of the cations in closeproximity), as the chemical shifts of both nuclei are sensitive to thesechanges. In the humite series of minerals, nMg2SiO4·Mg(OH, F)2, ithad been suggested from diffraction measurements that F− substitutionpreferentially forms F . . . HO hydrogen bonds, and minimises the numberof HO . . . OH pairs (and therefore dynamics in the system;[53] see Section1.5.4). However, the 19F MAS NMR spectrum of a 50% fluorinatedclinohumite (4Mg2SiO4 · Mg(OH)F), shown in Figure 1.41, reveals fourdistinct fluorine resonances, and DFT calculations are able to assignthese to specific local environments, demonstrating the presence of con-siderably more disorder in the material than was previously anticipated,with both F-rich and OH-rich regions.[81]
Many minerals undergo phase transitions with changes in either tem-perature or pressure. In the former case, the transitions can often befollowed in situ using variable-temperature NMR, and generally resultfrom structural rearrangement rather than the destruction or creationof chemical bonds. Transitions are indicated by changes in 29Si and17O MAS NMR spectra, or by differences in relaxation rates. Whilechanges with pressure are currently much more difficult to followin situ, there can be significant changes in the NMR spectrum for
(a) (b)
OH−
F−
F−...HO bonds
F−-rich regions
−165 −170
δ (ppm)
−175
Figure 1.41 (a) A F . . . HO hydrogen bond formed by F substitution in clinohumite.(b) 19F (14.1 T) MAS NMR spectrum of 50% fluorinated clinohumite 4Mg2SiO4 ·Mg(OH)F, showing the presence of four distinct F resonances. DFT calculationswere used to assign the four environments (which differ in the nature of the anionson the two closely spaced sites). The spectrum reveals the presence of considerablymore disorder in the material than was previously anticipated, with both F-richand OH-rich regions. Reproduced with permission from Griffin et al. (2010) [81].Copyright (2010) American Chemical Society.

76 SOLID-STATE NUCLEAR MAGNETIC RESONANCE SPECTROSCOPY
phases synthesised under pressure. An example of this was shown inFigure 1.21b for MgSiO3 phases synthesised at 1 GPa/1100 ◦C (orthoen-statite), 19.5 GPa/1400 ◦C (akimotoite), 19.5 GPa/1950 ◦C (majorite)and 23 GPa/1650 ◦C (perovskite).[22] High-pressure magnesium silicatesare of considerable interest as they constitute the majority of the Earth’smantle. Studying these materials by NMR can be challenging, since thehigh-pressure synthesis, usually in a multi-anvil apparatus, often pro-duces only small amounts of material. For example, in the synthesis ofperovskite described above, only ∼4 mg of sample was produced. Thisnecessitates the use of sensitivity-enhancing techniques, such as CPMG,or the use of STMAS rather than MQMAS to acquire high-resolutionspectra of quadrupolar nuclei. While most experiments have focusedon 29Si and 17O NMR, 27Al NMR has also been used to investigatethe position(s) of Al substitution in these materials, providing insightinto the mechanism by which the substitution is charge balanced.[20,37]
Current and future effort may well be focused on the 'hydration' of thenominally anhydrous high-pressure silicates in the mantle. The incorpo-ration of hydrogen into these materials has important implications forthe physical and chemical properties of the inner Earth and is difficultto study by diffraction as the protons are generally disordered and oftenincluded only at ppm levels. Most recent work has utilised 1H and 2HNMR, but it would appear that 17O NMR will play a significant role infuture investigation.
For a more detailed discussion of the application of NMR to geo-chemistry, see references [20, 37].
1.7.4 Energy Materials
Growing environmental concerns have resulted in an increased interestin the design of materials that are able to produce and store energyefficiently and economically. The study of such materials focuses notonly on the determination of local structure but also on the investigationof dynamic processes, and solid-state NMR has played a significantrole in both of these areas.[82] NMR has been particularly useful inthe study of lithium ion batteries, which are of interest due to theirhigh energy density and their role in energy storage. Investigations havefocused primarily on 6Li and 7Li NMR. Although both are quadrupolar,with relatively small chemical shift ranges, the large paramagnetic shifts(often up to 1600 ppm) that can be observed provide considerable

NMR OF MATERIALS 77
chemical sensitivity. These shifts can often be directly related to the localgeometry of the overlap between the paramagnetic centres and the Li 2sorbitals. Although much of the early work focused on basic structuralcharacterisation (often by comparison to model compounds and knownphases), recent work by Grey and co-workers[82,83] has transformed theuse of NMR spectroscopy in this field. As shown in Figure 1.42a, thestructural changes that occur upon discharge can be followed (usingstatic 7Li experiments) in situ, i.e. under realistic operating conditionsduring the NMR experiment.[83] For example, it has been demonstratedthat for lithium ion batteries containing silicon, the first discharge occursvia the lithiation of Si to form isolated Si and Si–Si clusters. The clustersare then destroyed to form isolated Si ions and eventually a crystallinephase. A number of phases were thus observed that were not presentin ex situ measurements, highlighting the need for direct, real-timeobservation. 6Li/7Li NMR can also be used to study dynamics in amaterial, usually through the use of variable-temperature measurementsof linewidths or T1. 2D EXSY experiments have also been employed toidentify the dynamic Li species and to provide quantitative informationon the mobility. Figure 1.42b shows variable-temperature 7Li NMRspectra of a composite polymer electrolyte, where the line narrowing
3.0 3.5
1000/T / K−14.0 4.5
E-V10E0E-V8E2E-V6E4
0.6
0.4
0.2
0.8
010
δ (ppm)δ (ppm)
−10 −20
1000
4000
Cap
acity
/ m
Ah
g−1
Cap
acity
/ m
Ah
g−1
3000
2000
100 50 −50 −1000
230 K 240 K245 K 250 K
260 K
280 K
300 K
320 K
340 K
270 K
290 K
310 K
330 KIntensity
1000
4000
3000
2000
1.0 0.5 0.00
Voltage / V
(a) (b)
20
−13
In τ
c / s
−15
−14
−12
Figure 1.42 (a) Contour plot of in situ 7Li (4.7 T) static NMR spectra and(inset) electrochemical profile of the first discharge of an actual crystalline Si vsLi/Li+ battery (the colour bar shows the relative intensity scale for the spectra).Reproduced with permission from Key et al. (2009) [83]. Copyright (2009) AmericanChemical Society. (b) Variable-temperature 7Li (7.05 T) NMR spectra for a polymerelectrolyte, and the corresponding correlation time for Li dynamics. Reproducedwith permission from Jeon and Kwak (2006) [84]. Copyright (2006) AmericanChemical Society.

78 SOLID-STATE NUCLEAR MAGNETIC RESONANCE SPECTROSCOPY
can be directly related to the correlation time and the activation energyof the ionic transport.[84]
The use of oxide ion conductors in a range of devices, includingsolid oxide fuel cells, has also resulted in an increase in their study.[82]
In many cases, and unlike the cationic dynamics described above,anionic conductivity often occurs at relatively high temperatures, e.g.800 ◦C and above. There have been many investigations of materialswith perovskite-, pyrochlore- and fluorite-like structures, the majorityfocusing on variable-temperature 17O NMR to identify the speciesresponsible for conduction and provide insight into the mechanism.Such materials can typically be enriched in 17O relatively easily, owingto the dynamics of the anion lattice. An example of an investigation intooxygen dynamics was discussed in Section 1.7.1 (Figure 1.37).[65]
Another field of intense research is boron-based hydrogen storagematerials, which release hydrogen gas via a complicated series of decom-position pathways. Understanding which decomposition mechanismsare active in the presence of various additives could lead to a moreefficient release of hydrogen at lower temperature. As the 11B chemicalshift is sensitive to the number of B–H bonds present, and the CQ is sen-sitive to the overall coordination number of B (Section 1.5.1), 11B MASNMR spectra can be particularly valuable in understanding the amor-phous decomposition products of hydrogen release from borohydridematerials. This process was recently studied by Doroodian et al.[85] fora series of methylguanidinium borohydrides, with DFT calculations onmodel clusters confirming the spectral assignments and highlighting thedifferences between decomposition of the hydrogen storage material inthe presence of different catalysts.
For a more detailed discussion of the application of NMR to energymaterials, see reference [82].
1.7.5 Glasses
Although they possess macroscopic properties associated with thesolid state, amorphous materials, such as glasses, lack the long-rangestructural order exhibited by crystalline solids. This poses a num-ber of challenges when determining the structure of these materials,which NMR – as a sensitive probe of the atomic-scale environment – isuniquely placed to address.[86] These include understanding the exactcomposition of the glass, determining the polymerisation of the network,

NMR OF MATERIALS 79
determining the NNN composition and ordering, understanding thedistribution of network modifiers and investigating the distribution oflocal geometries present. Furthermore, it is also important to under-stand the structural role water plays in glasses and, additionally, tounderstand the influence of the preparation/processing of the materialupon the ultimate structure and the properties observed. The majorityof NMR investigation has focused on silicate-based glasses, as a resultboth of the sensitivity of 29Si NMR to the local environment and of theimportant role these materials play in nature. However, research intoborate, phosphate and chalcogenide glasses is steadily increasing.
Glassy SiO2 retains the corner-sharing tetrahedral silicate networkfound in many crystalline silicates, but the variation in local geometry, i.e.the Si–O–Si bond angle, provides an intrinsic structural disorder. Thishas been studied using 29Si NMR spectroscopy (see Figure 1.28c),[49]
and more recently 17O NMR (where both δiso and CQ can be probed),along with support from DFT calculations, demonstrating that the mostprobable bond angle lies between 142 and 151◦.[86] Incorporation ofadditional elements into silica can result in more favourable physi-cal/chemical properties, either during the processing and handling of thematerial or in terms of its ultimate end use. The elements incorporatedtend to fall into three distinct categories: (i) network formers (e.g. B, Ge);(ii) network modifiers (e.g. Ca, Pb, Na, K), typically present as ions; and(iii) intermediates (e.g. Al, Mg, Zr), which can act either as modifiers oras formers, depending upon the glass composition. The incorporation ofa modifier leads to depolymerisation and the formation of nonbridgingoxygen (NBO) species. This process (generally followed as a function ofthe amount of modifier incorporated) has been investigated using 29Si,NMR (as the chemical shift is very sensitive to the degree of conden-sation, Qn) and 17O NMR (as bridging oxygens and NBOs have verydifferent CQ and δiso). Figure 1.43a shows the compositional dependenceof the 29Si MAS NMR spectra of an Na2O–SiO2 glass, demonstratingthat the incorporation of increasing amounts of Na2O results in the for-mation of less polymerised networks. The relative intensities of the peaksobtained can be compared to those predicted using various structuralmodels.[87]
The introduction of alumina into silicate or alkali silicate glasses canimprove mechanical and thermal stability, and aluminosilicate glassesare used in a variety of applications. 29Si NMR can in principle beused to probe the incorporation of Al into the framework, i.e. theNNN environment, although resonances can often be overlapped forthe more complex glass compositions. 27Al MAS NMR is often more

80 SOLID-STATE NUCLEAR MAGNETIC RESONANCE SPECTROSCOPY
useful, providing a simple measurement of the Al coordination num-ber and, therefore, its role within the network. The type of structureproduced generally depends upon the exact composition of the glass,specifically the Si/Al and M/Al ratios. 17O NMR can also provide usefulinformation, particularly for more complex compositions in which theresolution obtained using 29Si NMR is poor. For bridging oxygens,the different X–O–X’ linkages exhibit different CQ and δiso as, ofcourse, do NBOs.[86] In many cases, MQMAS is required to resolve thebroad, overlapping resonances, as in Figure 1.43b, which shows the 17OMQMAS NMR spectrum of a calcium-containing boroaluminosilicateglass. NBOs on Si and B can be clearly resolved, and Al–O–Si, Si–O–Siand B–O–Si linkages can also be identified.[88] From their various pro-portions (corrected for any non-uniform efficiency), it is possible tounderstand the ordering within the framework and whether there is anyclustering or avoidance of the various network formers.
Although there has been less study of borate glasses, borosilicateglasses are widely used for the encapsulation of radioactive waste (as
Al-O-Si
Si-O-Si
B-O-Si
Si-NBO
B-NBO
0
50
100
150
2000
55.6
50.0
44.4
Na2O mol%
42.9
40.0
36.4
33.3
28.6
25.0
20.0
Q1
−60
−25 −50 −75 −100
−80 −100 −120
(a) (b)
δ (ppm)
δ1 (ppm)
δ 2 (p
pm)
Q2 Q3 Q4
−50
Figure 1.43 (a) Compositional dependence of 29Si MAS NMR spectra ofNa2O–SiO2, demonstrating the decrease in polymerisation with increasing Nacontent. Reproduced with permission from Maekawa et al. (1991) [87]. Copyright(1991) Elsevier Ltd. (b) 17O (14.1 T) MQMAS NMR spectrum of calcium-containingboroaluminosilicate glass, in which NBOs on Si and B are clearly resolved, as arethe different types of bridging oxygen. Reproduced with permission from Du andStebbins (2005) [88]. Copyright (2005) Elsevier Ltd.

NMR OF MATERIALS 81
the incorporation of B2O3 improves the thermal properties of the glass,without compromising its chemical durability).[86,89] In both types ofmaterial, 11B offers a sensitive probe of the B coordination environment,with both CQ and δiso changing significantly for trigonal and tetrahedralboron. The ratio of three- and four-coordinate boron provides infor-mation on the role of network modifiers and the number of NBOs. Ina recent example, 11B NMR was used to demonstrate the difference inglass structure between a melt (Na2O–B2O3 –SiO2) quenched at ambi-ent pressure and at 5 GPa.[90] For the ambient sample, four-coordinateboron accounted for 62% of the boron in the sample, whereas in thesample quenched under pressure it accounted for 85%, indicating theincreased density of the network.
For phosphate-based glasses, 31P NMR is widely used, with thechemical shift sensitive to the polymerisation (Qn speciation).[86] The100% natural abundance of 31P also enables 2D heteronuclear andhomonuclear correlation experiments to be used, in order to probethrough-bond and through-space connectivity in glassy materials. Inaddition to 29Si and 31P NMR of chalcogenide glasses (typical based onSiS2, SiSe2 or phosphorus–selenium compositions), 77Se (spin I = 1/2)NMR has also been employed. Although the chemical shift is verysensitive to the local environment, this method does suffer from poorsensitivity, owing to the low natural abundance (∼7.9%) of 77Se andthe typically large CSA, resulting in a considerable number of SSBs.[86]
For a more detailed discussion of the application of NMR to glasses,see references [86, 89, 91].
1.7.6 Polymers
Many polymeric materials are semicrystalline, with similar amountsof amorphous and crystalline regions, and can therefore be difficult tostudy using conventional diffraction approaches. Furthermore, dynamics(either of functional groups or of sections of the polymer chain itself) alsoplay an important role in the microscopic behaviour of polymeric mate-rials. NMR spectroscopy is well placed to provide both structural anddynamic information on these systems, with the majority of work using13C, 1H/2H and 19F NMR.[92] Basic MAS (and CP MAS) experimentscan be used to resolve chemically distinct species, although lines are oftenrelatively broad due to the local disorder. Identification of the numberand proportions of different species can be of particular importance to
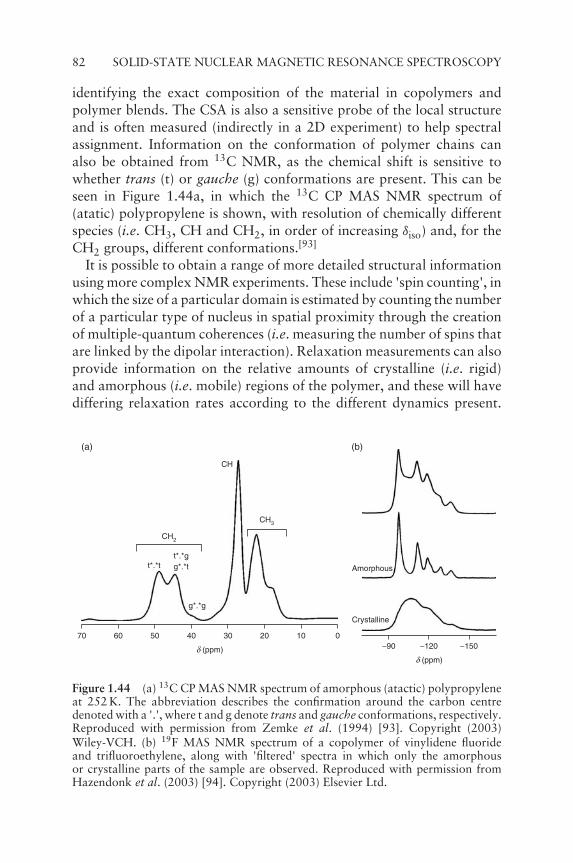
82 SOLID-STATE NUCLEAR MAGNETIC RESONANCE SPECTROSCOPY
identifying the exact composition of the material in copolymers andpolymer blends. The CSA is also a sensitive probe of the local structureand is often measured (indirectly in a 2D experiment) to help spectralassignment. Information on the conformation of polymer chains canalso be obtained from 13C NMR, as the chemical shift is sensitive towhether trans (t) or gauche (g) conformations are present. This can beseen in Figure 1.44a, in which the 13C CP MAS NMR spectrum of(atatic) polypropylene is shown, with resolution of chemically differentspecies (i.e. CH3, CH and CH2, in order of increasing δiso) and, for theCH2 groups, different conformations.[93]
It is possible to obtain a range of more detailed structural informationusing more complex NMR experiments. These include 'spin counting', inwhich the size of a particular domain is estimated by counting the numberof a particular type of nucleus in spatial proximity through the creationof multiple-quantum coherences (i.e. measuring the number of spins thatare linked by the dipolar interaction). Relaxation measurements can alsoprovide information on the relative amounts of crystalline (i.e. rigid)and amorphous (i.e. mobile) regions of the polymer, and these will havediffering relaxation rates according to the different dynamics present.
Amorphous
Crystalline
CH2
CH3
CH
t*.*tt*.*gg*.*t
70 60 3050 40 20−90 −120 −150
10 0
(a) (b)
δ (ppm)δ (ppm)
g*.*g
Figure 1.44 (a) 13C CP MAS NMR spectrum of amorphous (atactic) polypropyleneat 252 K. The abbreviation describes the confirmation around the carbon centredenoted with a '.', where t and g denote trans and gauche conformations, respectively.Reproduced with permission from Zemke et al. (1994) [93]. Copyright (2003)Wiley-VCH. (b) 19F MAS NMR spectrum of a copolymer of vinylidene fluorideand trifluoroethylene, along with 'filtered' spectra in which only the amorphousor crystalline parts of the sample are observed. Reproduced with permission fromHazendonk et al. (2003) [94]. Copyright (2003) Elsevier Ltd.

CONCLUSION 83
It is possible to design 'filters' (i.e. series of pulses and/or delays) to selectonly mobile or rigid parts of the material, resulting in spectra containingsignals only from these parts. This can be seen in Figure 1.44b, where the19F spectrum of a copolymer of vinylidene fluoride and trifluoroethyleneis shown, along with 'filtered' spectra where only the amorphous andcrystalline parts of the sample are observed.[94] This is useful not onlyfor quantifying these various regions but also for improving the spectralresolution by reducing the overlap from different resonances.
The dynamics in polymers, including rotational motions (e.g. of CH3or phenyl groups) in crystalline regions, chain diffusion in both crys-talline and amorphous regions and chain motion close to the glasstransition temperature can be followed using a variety of NMR experi-ments. The simplest include the acquisition of MAS, CP MAS and filteredspectra at varying temperatures or temperature-dependent relaxationmeasurements. Analysis of the lineshapes in 2D exchange experiments,typically for 2H (but also 13C), is also able to provide information on thegeometry of any rotational motion (as described in Section 1.5.4).[95]
For a more detailed discussion of the application of NMR to polymers,see references [92, 95].
1.8 CONCLUSION
This chapter has demonstrated just a few of the many applications ofsolid-state NMR to the study of inorganic materials, from solving thecrystal structure of zeolites to studying the dynamics in amorphousregions of polymers and hydrated minerals. However, we hope that thisshows the scope of solid-state NMR as a powerful tool for investigatingstructure, disorder and dynamics from an atomic-scale viewpoint.
While the range of information available from NMR is impressive,there are still areas of materials science that pose a considerable chal-lenge. In particular, these include the study of extremely dilute species(e.g. surface species in porous silicas or on nanoparticles), nuclei withvery broad lines or poor sensitivity (e.g. most of the halogens, except19F, and many important metals) and phases occurring at very highor low temperatures (particularly under MAS). At the time of writing,much effort is being directed towards tackling all of these issues. Tech-niques such as dynamic nuclear polarisation (transfer of magnetisationfrom unpaired electrons to nuclei by microwave irradiation), leading to'surface-enhanced NMR', with vast enhancement (one or two orders ofmagnitude) of the signals of surface species, are being actively developed.

84 SOLID-STATE NUCLEAR MAGNETIC RESONANCE SPECTROSCOPY
Broadband excitation pulse sequences (generally in combination withsensitivity-enhancing methods) are constantly being improved in orderto enable rapid acquisition of very broad resonances, and laser-heatedMAS probes capable of reaching temperatures of ∼1000 K are nowcommercially available. In tandem with this improved experimentalcapability, computational techniques (both analytical line-fitting soft-ware and quantum-chemical predictions) can only increase in speed,accuracy and capability, providing more rigorous theoretical support tothe interpretation of the experimental data. Of course, it is not just hard-ware and software that are important to understanding a material, butalso the mindset of the experimentalists who interpret the data. Recentyears have seen advances in this aspect of materials science, with thefield of 'NMR crystallography' seeking to combine simultaneously datafrom calculations, crystallography and NMR in a single, highly-detailedmodel of a material, rather than publishing several datasets for the samematerial, but with conflicting interpretations.
As solution-phase NMR spectroscopy has grown to become an integralpart of all molecular chemistry, it seems that solid-state NMR will inthe near future come to play a similarly crucial role in materials science,providing a probe of all aspects of materials, from their structures andmotional behaviour to their properties and applications.
REFERENCES
[1] D. C. Apperley, R. K. Harris and P. Hodgkinson, Solid State NMR Basic Principlesand Practice, Momentum Press, New York, 2012.
[2] K. J. D. MacKenzie and M. E. Smith, Multinuclear Solid-State NMR of InorganicMaterials, Pergamon Press, Oxford, 2002.
[3] E. L. Hahn, Phys. Rev., 80, 580 (1950).[4] D. M. Grant, ‘Chemical Shift Tensors’ in Encyclopedia of Magnetic Resonance,
Eds-in-chief R. K. Harris and R. E. Wasylishen, John Wiley: Chichester. Publishedonline 15 Mar 2007.
[5] R. E. Wasylishen, ‘Dipolar and Indirect Coupling Tensors in Solids’ in Encyclopediaof Magnetic Resonance, Eds-in-chief R. K. Harris and R. E. Wasylishen, John Wiley:Chichester. Published online 15 Mar 2007.
[6] A. J. Vega, ‘Quadrupolar Nuclei in Solids’ in Encyclopedia of Magnetic Resonance,Eds-in-chief R. K. Harris and R. E. Wasylishen, John Wiley: Chichester. Publishedonline 15 Mar 2010.
[7] H. Koller, G. Engelhardt, A. P. M. Kentgens and J. Sauer, J. Phys. Chem., 98, 1544(1994).
[8] E. R. Andrew, A. Bradbury and R. G. Eades, Nature, 182, 223 (1958).[9] E. R. Andrew, ‘Magic Angle Spinning’ in Encyclopedia of Magnetic Resonance,
Eds-in-chief R. K. Harris and R. E. Wasylishen, John Wiley: Chichester. Publishedonline 15 Mar 2007.

REFERENCES 85
[10] A. Samoson, ‘Magic-Angle Spinning Extensions’ in Encyclopedia of MagneticResonance, Eds-in-chief R. K. Harris and R. E. Wasylishen, John Wiley: Chichester.Published online 15 Mar 2007.
[11] J. M. Griffin, L. Clark, V. R. Seymour, D. W. Aldous, D. M. Dawson, D. Iuga, R. E.Morris and S. E. Ashbrook, Chem. Sci., 3, 2293 (2012).
[12] P. Hodgkinson, Prog. Nucl. Magn. Reson. Spectrosc., 46, 197 (2005).[13] P. K. Madhu, Solid State Nucl. Magn. Reson., 35, 2 (2009).[14] A. Pines, J. S. Waugh and M. G. Gibby, J. Chem. Phys., 56, 1776 (1972).[15] D. P. Burum, ‘Cross Polarization in Solids’ in Encyclopedia of Magnetic Resonance,
Eds-in-chief R. K. Harris and R. E. Wasylishen, John Wiley: Chichester. Publishedonline 15 Mar 2007.
[16] S. R. Hartmann and E. L. Hahn, Phys. Rev., 128, 2042 (1962).[17] R. R. Ernst, Chimica, 29, 179 (1975).[18] G. A. Morris and J. W. Emsley, ‘Multidimensional NMR: an Introduction’ in Ency-
clopedia of Magnetic Resonance, Eds-in-chief R. K. Harris and R. E. Wasylishen,John Wiley: Chichester. Published online 15 Sept 2011.
[19] A. Lesage, C. Auger, S. Caldarelli and L. Emsley, J. Am. Chem. Soc., 119, 7867(1997).
[20] R. E. Wasylishen, S. E. Ashbrook and S. Wimperis, NMR of Quadrupolar Nucleiin Solid Materials, John Wiley & Sons, Ltd, Chichester, 2012.
[21] S. E. Ashbrook and S. Wimperis, Prog. Nucl. Magn. Reson. Spectrosc., 45, 53(2004).
[22] S. E. Ashbrook, A. J. Berry, D. J. Frost, A. Gregorovic, C. J. Pickard, J. E. Readmanand S. Wimperis, J. Am. Chem. Soc., 129, 13 213 (2007).
[23] A. Samoson, E. Lippmaa and A. Pines, Mol. Phys., 65, 1013 (1988).[24] G. Engelhardt, A. P. M. Kentgens, H. Koller and A. Samoson, Solid State Nucl.
Magn. Reson., 15, 171 (1999).[25] A. Llor and J. Virlet, Chem. Phys. Lett., 152, 248 (1988).[26] L. Frydman and J. S. Harwood, J. Am. Chem. Soc., 117, 5367 (1995).[27] Z. Gan, J. Am. Chem. Soc., 122, 3242 (2000).[28] A. W. MacGregor, L. A. O’Dell, R. W. Schurko, J. Magn. Reson., 208, 103 (2011).[29] S. Meiboom and D. Gill, Rev. Sci. Instrum., 29, 688 (1958).[30] R. M. Martin, Electronic Structure: Basic Theory and Practical Methods, Cambridge
University Press, Cambridge 2004.[31] J. R. Yates and C. J. Pickard. ‘Computations of Magnetic Resonance Parameters
for Crystalline Systems: Principles’ in Encyclopedia of Magnetic Resonance, Eds-in-chief R. K. Harris and R. E. Wasylishen, John Wiley: Chichester. Published online15 Mar 2008.
[32] C. J. Pickard and F. Mauri, Phys. Rev. B, 63, 245 101 (2001).[33] J. R. Yates, Magn. Reson. Chem., 48, S23 (2010).[34] S. E. Ashbrook, M. Cutajar, C. J. Pickard, R. I. Walton and S. Wimperis, Phys.
Chem. Chem. Phys., 10, 5754 (2008).[35] D. H. Brouwer, in NMR Crystallography, R. K. Harris, R. E. Wasylishen and M. J.
Duer (Eds), John Wiley & Sons, Ltd, Chichester, 2009.[36] A. Othman, J. S. O. Evans, I. Radosavljevic Evans, R. K. Harris and P. Hodgkinson,
J. Pharm. Sci., 96, 1380 (1997).[37] B. L. Phillips, in NMR Crystallography, R. K. Harris, R. E. Wasylishen and M. J.
Duer (Eds), John Wiley & Sons, Ltd, Chichester, 2009.
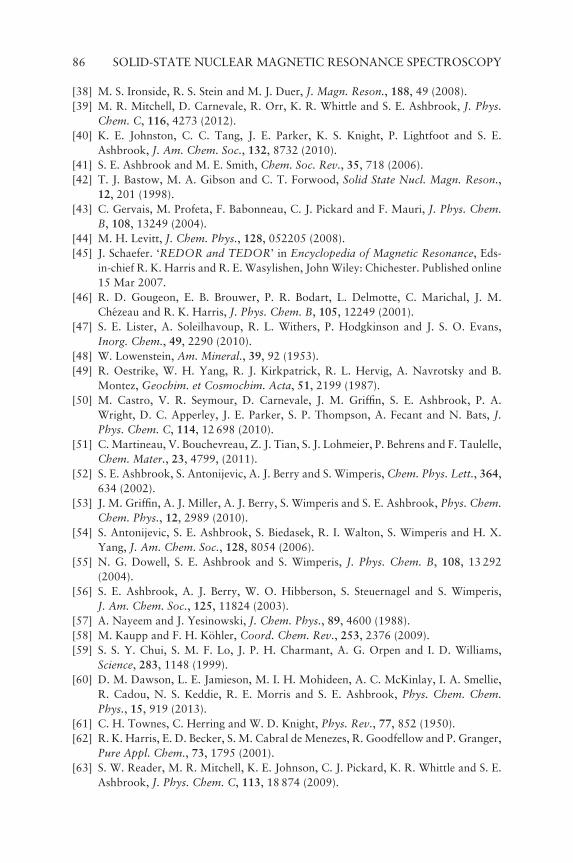
86 SOLID-STATE NUCLEAR MAGNETIC RESONANCE SPECTROSCOPY
[38] M. S. Ironside, R. S. Stein and M. J. Duer, J. Magn. Reson., 188, 49 (2008).[39] M. R. Mitchell, D. Carnevale, R. Orr, K. R. Whittle and S. E. Ashbrook, J. Phys.
Chem. C, 116, 4273 (2012).[40] K. E. Johnston, C. C. Tang, J. E. Parker, K. S. Knight, P. Lightfoot and S. E.
Ashbrook, J. Am. Chem. Soc., 132, 8732 (2010).[41] S. E. Ashbrook and M. E. Smith, Chem. Soc. Rev., 35, 718 (2006).[42] T. J. Bastow, M. A. Gibson and C. T. Forwood, Solid State Nucl. Magn. Reson.,
12, 201 (1998).[43] C. Gervais, M. Profeta, F. Babonneau, C. J. Pickard and F. Mauri, J. Phys. Chem.
B, 108, 13249 (2004).[44] M. H. Levitt, J. Chem. Phys., 128, 052205 (2008).[45] J. Schaefer. ‘REDOR and TEDOR’ in Encyclopedia of Magnetic Resonance, Eds-
in-chief R. K. Harris and R. E. Wasylishen, John Wiley: Chichester. Published online15 Mar 2007.
[46] R. D. Gougeon, E. B. Brouwer, P. R. Bodart, L. Delmotte, C. Marichal, J. M.Chezeau and R. K. Harris, J. Phys. Chem. B, 105, 12249 (2001).
[47] S. E. Lister, A. Soleilhavoup, R. L. Withers, P. Hodgkinson and J. S. O. Evans,Inorg. Chem., 49, 2290 (2010).
[48] W. Lowenstein, Am. Mineral., 39, 92 (1953).[49] R. Oestrike, W. H. Yang, R. J. Kirkpatrick, R. L. Hervig, A. Navrotsky and B.
Montez, Geochim. et Cosmochim. Acta, 51, 2199 (1987).[50] M. Castro, V. R. Seymour, D. Carnevale, J. M. Griffin, S. E. Ashbrook, P. A.
Wright, D. C. Apperley, J. E. Parker, S. P. Thompson, A. Fecant and N. Bats, J.Phys. Chem. C, 114, 12 698 (2010).
[51] C. Martineau, V. Bouchevreau, Z. J. Tian, S. J. Lohmeier, P. Behrens and F. Taulelle,Chem. Mater., 23, 4799, (2011).
[52] S. E. Ashbrook, S. Antonijevic, A. J. Berry and S. Wimperis, Chem. Phys. Lett., 364,634 (2002).
[53] J. M. Griffin, A. J. Miller, A. J. Berry, S. Wimperis and S. E. Ashbrook, Phys. Chem.Chem. Phys., 12, 2989 (2010).
[54] S. Antonijevic, S. E. Ashbrook, S. Biedasek, R. I. Walton, S. Wimperis and H. X.Yang, J. Am. Chem. Soc., 128, 8054 (2006).
[55] N. G. Dowell, S. E. Ashbrook and S. Wimperis, J. Phys. Chem. B, 108, 13 292(2004).
[56] S. E. Ashbrook, A. J. Berry, W. O. Hibberson, S. Steuernagel and S. Wimperis,J. Am. Chem. Soc., 125, 11824 (2003).
[57] A. Nayeem and J. Yesinowski, J. Chem. Phys., 89, 4600 (1988).[58] M. Kaupp and F. H. Kohler, Coord. Chem. Rev., 253, 2376 (2009).[59] S. S. Y. Chui, S. M. F. Lo, J. P. H. Charmant, A. G. Orpen and I. D. Williams,
Science, 283, 1148 (1999).[60] D. M. Dawson, L. E. Jamieson, M. I. H. Mohideen, A. C. McKinlay, I. A. Smellie,
R. Cadou, N. S. Keddie, R. E. Morris and S. E. Ashbrook, Phys. Chem. Chem.Phys., 15, 919 (2013).
[61] C. H. Townes, C. Herring and W. D. Knight, Phys. Rev., 77, 852 (1950).[62] R. K. Harris, E. D. Becker, S. M. Cabral de Menezes, R. Goodfellow and P. Granger,
Pure Appl. Chem., 73, 1795 (2001).[63] S. W. Reader, M. R. Mitchell, K. E. Johnson, C. J. Pickard, K. R. Whittle and S. E.
Ashbrook, J. Phys. Chem. C, 113, 18 874 (2009).
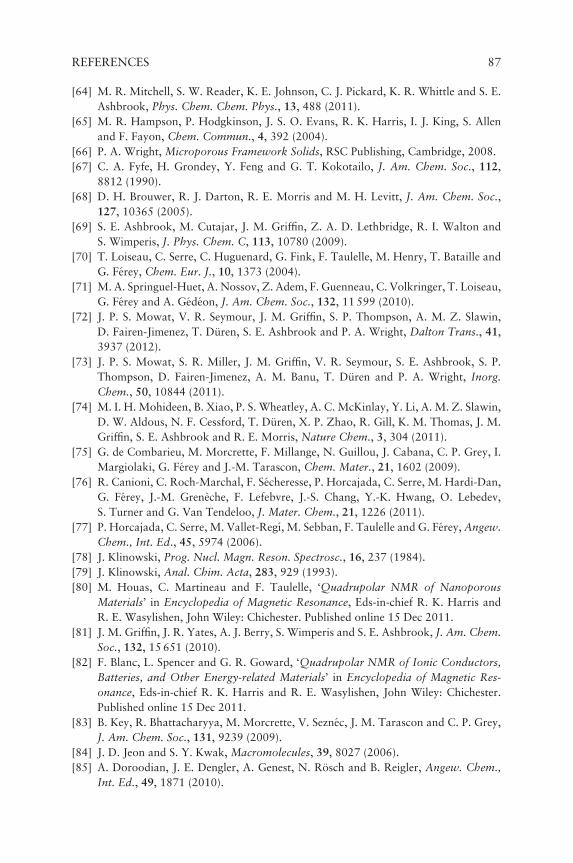
REFERENCES 87
[64] M. R. Mitchell, S. W. Reader, K. E. Johnson, C. J. Pickard, K. R. Whittle and S. E.Ashbrook, Phys. Chem. Chem. Phys., 13, 488 (2011).
[65] M. R. Hampson, P. Hodgkinson, J. S. O. Evans, R. K. Harris, I. J. King, S. Allenand F. Fayon, Chem. Commun., 4, 392 (2004).
[66] P. A. Wright, Microporous Framework Solids, RSC Publishing, Cambridge, 2008.[67] C. A. Fyfe, H. Grondey, Y. Feng and G. T. Kokotailo, J. Am. Chem. Soc., 112,
8812 (1990).[68] D. H. Brouwer, R. J. Darton, R. E. Morris and M. H. Levitt, J. Am. Chem. Soc.,
127, 10365 (2005).[69] S. E. Ashbrook, M. Cutajar, J. M. Griffin, Z. A. D. Lethbridge, R. I. Walton and
S. Wimperis, J. Phys. Chem. C, 113, 10780 (2009).[70] T. Loiseau, C. Serre, C. Huguenard, G. Fink, F. Taulelle, M. Henry, T. Bataille and
G. Ferey, Chem. Eur. J., 10, 1373 (2004).[71] M. A. Springuel-Huet, A. Nossov, Z. Adem, F. Guenneau, C. Volkringer, T. Loiseau,
G. Ferey and A. Gedeon, J. Am. Chem. Soc., 132, 11 599 (2010).[72] J. P. S. Mowat, V. R. Seymour, J. M. Griffin, S. P. Thompson, A. M. Z. Slawin,
D. Fairen-Jimenez, T. Duren, S. E. Ashbrook and P. A. Wright, Dalton Trans., 41,3937 (2012).
[73] J. P. S. Mowat, S. R. Miller, J. M. Griffin, V. R. Seymour, S. E. Ashbrook, S. P.Thompson, D. Fairen-Jimenez, A. M. Banu, T. Duren and P. A. Wright, Inorg.Chem., 50, 10844 (2011).
[74] M. I. H. Mohideen, B. Xiao, P. S. Wheatley, A. C. McKinlay, Y. Li, A. M. Z. Slawin,D. W. Aldous, N. F. Cessford, T. Duren, X. P. Zhao, R. Gill, K. M. Thomas, J. M.Griffin, S. E. Ashbrook and R. E. Morris, Nature Chem., 3, 304 (2011).
[75] G. de Combarieu, M. Morcrette, F. Millange, N. Guillou, J. Cabana, C. P. Grey, I.Margiolaki, G. Ferey and J.-M. Tarascon, Chem. Mater., 21, 1602 (2009).
[76] R. Canioni, C. Roch-Marchal, F. Secheresse, P. Horcajada, C. Serre, M. Hardi-Dan,G. Ferey, J.-M. Greneche, F. Lefebvre, J.-S. Chang, Y.-K. Hwang, O. Lebedev,S. Turner and G. Van Tendeloo, J. Mater. Chem., 21, 1226 (2011).
[77] P. Horcajada, C. Serre, M. Vallet-Regı, M. Sebban, F. Taulelle and G. Ferey, Angew.Chem., Int. Ed., 45, 5974 (2006).
[78] J. Klinowski, Prog. Nucl. Magn. Reson. Spectrosc., 16, 237 (1984).[79] J. Klinowski, Anal. Chim. Acta, 283, 929 (1993).[80] M. Houas, C. Martineau and F. Taulelle, ‘Quadrupolar NMR of Nanoporous
Materials’ in Encyclopedia of Magnetic Resonance, Eds-in-chief R. K. Harris andR. E. Wasylishen, John Wiley: Chichester. Published online 15 Dec 2011.
[81] J. M. Griffin, J. R. Yates, A. J. Berry, S. Wimperis and S. E. Ashbrook, J. Am. Chem.Soc., 132, 15 651 (2010).
[82] F. Blanc, L. Spencer and G. R. Goward, ‘Quadrupolar NMR of Ionic Conductors,Batteries, and Other Energy-related Materials’ in Encyclopedia of Magnetic Res-onance, Eds-in-chief R. K. Harris and R. E. Wasylishen, John Wiley: Chichester.Published online 15 Dec 2011.
[83] B. Key, R. Bhattacharyya, M. Morcrette, V. Seznec, J. M. Tarascon and C. P. Grey,J. Am. Chem. Soc., 131, 9239 (2009).
[84] J. D. Jeon and S. Y. Kwak, Macromolecules, 39, 8027 (2006).[85] A. Doroodian, J. E. Dengler, A. Genest, N. Rosch and B. Reigler, Angew. Chem.,
Int. Ed., 49, 1871 (2010).

88 SOLID-STATE NUCLEAR MAGNETIC RESONANCE SPECTROSCOPY
[86] H. Eckert, ‘Amorphous Materials’ in Encyclopedia of Magnetic Resonance, Eds-in-chief R. K. Harris and R. E. Wasylishen, John Wiley: Chichester. Published online15 Mar 2007.
[87] H. Maekawa, T. Maekawa, K. Kamura and T. Yowokawa, J. Non-Cryst. Solids,127, 53 (1991).
[88] L. S. Du and J. F. Stebbins, J. Non-Cryst. Solids, 351, 3508 (2005).[89] S. Kroeker, ‘Nuclear Waste Glasses: Insights from Solid-State NMR’ in Encyclopedia
of Magnetic Resonance, Eds-in-chief R. K. Harris and R. E. Wasylishen, John Wiley:Chichester. Published online 15 Dec 2011.
[90] L. S. Du, J. R. Allwardt, B. C. Schmidt and J. F. Stebbins, J. Non-Cryst. Solids, 337,196 (2004).
[91] A. Ananthanarayanan, G. Tricot, G. P. Kothiyal and L. Montagne, Crit. Rev.Solid-State and Mater. Sci., 36, 229 (2011).
[92] H. W. Spiess, ‘Polymer Dynamics and Order from Multidimensional Solid StateNMR’ in Encyclopedia of Magnetic Resonance, Eds-in-chief R. K. Harris and R. E.Wasylishen, John Wiley: Chichester. Published online 15 Mar 2007.
[93] K. Zemke, K. Schmidt-Rohr and H. W. Spiess, Acta Polym., 45, 148 (1994).[94] P. Hazendonk, R. K. Harris, S. Ando and P. Avalle, J. Magn. Reson., 162, 206
(2003).[95] E. R. deAzevedo, T, J. Bonagamba and D. Reichert, Prog. Nucl. Magn. Reson.
Spectrosc., 47, 137 (2005).