local skewness attribute as a seismic phase · 2014-02-15 · local skewness attribute as a seismic...
TRANSCRIPT

Local skewness attribute as a seismic phase
detectora
aPublished in Interpretation, 2, no. 1, SA49-SA56, (2014)
Sergey Fomel∗ and Mirko van der Baan†
ABSTRACT
We propose a novel seismic attribute, local skewness, as an indicator of local-ized phase of seismic signals. The proposed attribute appears to have a higherdynamical range and a better stability than the previously used local kurtosis.Synthetic and real data examples demonstrate the effectiveness of local skew-ness in detecting and correcting time-varying, locally-observed phase of seismicsignals.
INTRODUCTION
Wavelet phase is an important characteristic of seismic signals. Physical causal sys-tems exhibit minimum-phase behavior (Robinson and Treitel, 2000). For purposesof seismic interpretation, it is convenient to deal with zero-phase wavelets with mini-mum or maximum amplitudes centered at the horizons of interest because it leads tothe highest resolution as well as more accurate estimates of both reflection times andspacings (Schoenberger, 1974). Zero-phase correction is therefore a routine procedureapplied to seismic images before they are passed to the interpreter (Brown, 1999).
It is important to make a distinction between phases of propagating and locallyobserved wavelets (Van der Baan et al., 2010b,a). The former is the physical waveletthat propagates through the Earth, thereby sampling the local geology. It is subjectto geometric spreading, attenuation, and concomitant dispersion. The latter is thewavelet as observed at a certain point in space and time. Its immediate shape resultsfrom its interaction (convolution) with the reflectivity of the Earth and the currentshape of the propagating wavelet. For instance, a thin layer with a positive change inseismic impedance has opposite polarities of seismic reflectivities at the top and thebottom interface, which make it act like a derivative filter and generate a wavelet withthe locally observed phase subjected to a 90◦ rotation (Zeng and Backus, 2005). Inthe absence of well log information, it is usually difficult to separate unambiguouslythe locally observed phase from the phase of the propagating wavelet. Nevertheless,measuring the local phase can provide a useful attribute for analyzing seismic data(Van der Baan and Fomel, 2009; Fomel and van der Baan, 2010; Van der Baan et al.,2010a; Xu et al., 2012).

Fomel & van der Baan 2 Local skewness
Levy and Oldenburg (1987) proposed a method of phase detection based on max-imization of the varimax norm or kurtosis as an objective measure of zero-phaseness.By rotating the phase and measuring the kurtosis of seismic signals, one can de-tect the phase rotations necessary for zero-phase correction (Van der Baan, 2008).Van der Baan and Fomel (2009) applied local kurtosis, a smoothly nonstationarymeasure (Fomel et al., 2007), and demonstrated its advantages in measuring phasevariations as compared with kurtosis measurements in sliding windows. Local kurto-sis is an example of a local attribute (Fomel, 2007a) defined by utilizing regularizedleast-squares inversion.
In this paper, we revisit the problem of phase estimation and propose a novelattribute, local skewness, as a phase detector. Analogous to local kurtosis, localskewness is defined using local similarity measurements via regularized least squares.This attribute is maximized when the locally observed phase is close to zero. Ad-vantages of the new attribute are a higher dynamical range and a better stability,which make it suitable for picking phase corrections. Using synthetic and field-dataexamples, we demonstrate properties and applications of the proposed attribute.
LOCALIZED PHASE ESTIMATION
Our goal is to estimate the time-variant, localized phase from seismic data. Whatobjective measure can indicate that a certain signal has a zero phase? One classicmeasure is the varimax norm or kurtosis (Wiggins, 1978; Levy and Oldenburg, 1987;White, 1988). Varimax is defined as
φ[s] =
NN∑
n=1
s4n(
N∑n=1
s2n
)2 , (1)
where s = {s1, s2, . . . , sN} represents a vector of seismic amplitudes inside a windowof size N . Varimax is simply related to kurtosis of zero-mean signals.
The statistical rationale behind the Wiggins algorithm and its variants is thatconvolution of any filter with a time series that is white with respect to all statisticalorders makes the outcome more Gaussian. The optimum deconvolution filter is there-fore one that ensures the deconvolution output is maximally non-Gaussian (Donoho,1981). The constant-phase assumption made by Levy and Oldenburg (1987) andWhite (1988) reduces the number of free parameters to one, thereby stabilizing per-formance compared with the Wiggins method. Wavelets derived in seismic-to-wellties often have a near-constant phase, thus justifying this assumption.

Fomel & van der Baan 3 Local skewness
Noticing that the correlation coefficient of two sequences an and bn is defined as
γ[a,b] =
N∑n=1
an bn√√√√ N∑n=1
a2n
N∑n=1
b2n
(2)
and the correlation of an with a constant is
γ[a,1] =
N∑n=1
an√√√√N N∑n=1
a2n
, (3)
Fomel et al. (2007) interpreted the kurtosis measure in equation 1 as the inverseof the squared correlation coefficient between s2
n and a constant, φ[s] = 1/γ2[s2,1].Well-focused or zero-phase signals exhibit low correlation with a constant and corre-spondingly higher kurtosis (Figure 1). This provides an alternative interpretation tothe goal of making the deconvolution outcome maximally non-Gaussian for desiredphase estimation. Note that equation 2 is usually applied to zero-mean sequences aand b. This is neglected in the derivation of expression 3.
Figure 1: (a) Squared 0◦-phase Ricker wavelet compared with a constant. (b) Squared90◦-phase Ricker wavelet compared with a constant. The 90◦-phase signal has a highercorrelation with a constant and correspondingly a lower kurtosis.
In this paper, we suggest a different measure, skewness, for measuring the apparentphase of seismic signals. Skewness of a sequence sn is defined as (Bulmer, 1979)
κ[s] =
1
N
N∑n=1
s3n(
1
N
N∑n=1
s2n
)3/2. (4)

Fomel & van der Baan 4 Local skewness
Figure 2: (a) 0◦-phase Ricker wavelet compared with its square. (b) 90◦-phase Rickerwavelet compared with its square. The 0◦-phase has a stronger correlation with itssquare and correspondingly a higher skewness.
In statistics, skewness is used for measuring asymmetry of probability distributions.Simple algebraic manipulations show that skewness squared can be represented as
κ2[s] =
(N∑
n=1
s2n · sn
)2
N∑n=1
s4n
N∑n=1
s2n
N∑n=1
s4n
N∑n=1
12
(N∑
n=1
s2n
)2 =γ2[s2, s]
γ2[s2,1]= φ[s] γ2[s2, s] . (5)
In other words, squared skewness is equal to the kurtosis measure modulated bythe squared correlation coefficient between the signal and its square. Zero-phasesignals tend to exhibit higher correlation with the square and correspondingly higherskewness (Figure 2). Following experiments with synthetic and field data, we find itadvantageous to use sometimes the inverse skewness
1
κ2[s]=γ2[s2,1]
γ2[s2, s]. (6)
Unlike kurtosis which measures non-Gaussianity, skewness is related to asymme-try. Whereas convolution of two non-Gaussian sequences makes the outcome moreGaussian, convolution of two asymmetric series becomes more symmetric. Both phe-nomena are a consequence of the central limit theorem. A zero-phase wavelet is morecompact than a nonzero phase one (Schoenberger, 1974), and therefore also moreasymmetric. Skewness-based criteria can thus detect the appropriate wavelet phaseby applying a series of constant phase rotations to the data and then evaluating theangle that produces the most skewed distribution.
The two measures do not necessarily agree with one another, which is illustrated inFigures 3 and 4. For an isolated positive spike convolved with a compact zero-phase

Fomel & van der Baan 5 Local skewness
wavelet, the two measures agree in the picking of the zero-phase result as havingboth a high kurtosis and a high skewness (Figure 3). For a slightly more complexcase of a double positive spike convolved with the same wavelet (Figure 4), the twomeasures disagree: kurtosis picks a signal rotated by 90◦ whereas skewness picks theoriginal signal. Note that, in both examples, skewness exhibits a significantly higherdynamical range, which makes it more suitable for picking optimal phase rotations.
a b
c
Figure 3: (a) Ricker wavelet rotated through different phases. (b) Skewness (solidline) and kurtosis (dashed line) as functions of the phase rotation angle. (c) Inverseskewness (solid line) and inverse kurtosis (dashed line) as functions of the phaserotation angle. The two measures agree in picking the signal at 0◦ and 180◦. Notethe higher dynamical range of skewness.
DEFINING SKEWNESS AS A LOCAL ATTRIBUTE
The method of local attributes (Fomel, 2007a) is a technique for extending stationaryor instantaneous attributes to smoothly varying or nonstationary attributes by em-ploying a regularized least-squares formulation. In particular, the scalar correlationcoefficient γ in equation 2 is replaced with a vector, c, defined as a componentwiseproduct of vectors c1 and c2, where
c1 =[λ2 I + S
(AT A− λ2 I
)]−1SAT b , (7)
c2 =[λ2 I + S
(BT B− λ2 I
)]−1SBT a . (8)
In equations 7-8, a and b are vectors composed of an and bn, respectively; A and Bare diagonal matrices composed of the same elements; and S is a smoothing operator.

Fomel & van der Baan 6 Local skewness
a b
c
Figure 4: (a) Ricker wavelet convolved with a double impulse and rotated throughdifferent phases. (b) Skewness (solid line) and kurtosis (dashed line) as functionsof the phase rotation angle. (c) Inverse skewness (solid line) and inverse kurtosis(dashed line) as functions of the phase rotation angle. The two measures disagreeby 90◦ in picking the optimal phase. The skewness attribute picks a better focusedsignal.

Fomel & van der Baan 7 Local skewness
We use triangle smoothing (Claerbout, 1992) controlled by specifying the smoothingradius, which can be different in vertical and horizontal directions.
Regularized inversion appearing in equations 7 and 8 is justified in the method ofshaping regularization (Fomel, 2007b). The corresponding local similarity attributehas been used previously to align multicomponent and time-lapse images (Fomel,2007a; Fomel and Jin, 2009; Kazemeini et al., 2010; Zhang et al., 2013), to detectfocusing of diffractions (Fomel et al., 2007), to enhance stacking (Liu et al., 2011a,2009), to create time-frequency distributions (Liu et al., 2011b), and to perform zero-phase correction with local kurtosis (Van der Baan and Fomel, 2009). In this paper,we apply it to zero-phasing seismic data using local skewness.
a b
c
Figure 5: (a) Input synthetic trace with variable-phase events. (b) Inverse localskewness as a function of the phase rotation angle. Red colors correspond to highinverse similarity. (c) Synthetic trace after non-stationary rotation to zero phase usingpicked phase.
We illustrate the proposed zero-phase correction procedure in Figure 5. The inputsynthetic trace contains a set of Ricker wavelets with a gradually variable phase(Figure 5a). We start with a number of phase rotations with different angles, eachtime computing the local skewness. The result of this step is displayed in Figure 5band shows a clear high-similarity trend. After picking the trend, adding 90◦ to it,and performing the corresponding nonstationary trace rotation, we end up with thephase-corrected trace, shown in Figure 5c. All the original phase rotations are clearlydetected and removed. The radius of the regularization smoothing in this examplewas 100 samples or 0.4 s.

Fomel & van der Baan 8 Local skewness
APPLICATION EXAMPLE
Figure 6: Stratigraphic column of the Fort Worth Basin where the Boonsville datasetis located, after Pollastro et al. (2007). Karstification in the Ellenburger Carbonateshas caused local sags in the overlying Barnett and Bend Conglomerate formations,creating reservoir compartmentalization.
.
The input dataset for our field-data example is the Boonsville dataset from theFort Worth Basin in North-Central Texas, USA (Hardage et al., 1996a,b). The for-mations of interest are the Ellenburger Carbonates, the Barnett Shale and the BendConglomerates (see Figure 6 for a stratigraphic column). The Ellenburger Carbonatesare of Ordovician age. Their karstification due to post-Ellenburger carbonate disso-lution and subsequent cavern collapses has created sags in the overlying formations,affecting sedimentation patterns and structures in the overlying Barnett Shales andBend Conglomerates. The collapse features look like vertical chimneys with roughly

Fomel & van der Baan 9 Local skewness
Figure 7: Input data: a section of the Boonsville dataset

Fomel & van der Baan 10 Local skewness
Figure 8: Inverse local skewness as a function of the phase rotation angle, withapplication to the section from Figure 7. Red colors correspond to high inversesimilarity.

Fomel & van der Baan 11 Local skewness
circular cross-sections, extending up to 600-760 m above the Ellenburger Carbonates(Hardage et al., 1996a), sometimes even reaching into the Strawn Group above theBend Conglomerates.
The Barnett Shales are of Mississippian age. They are the target of much cur-rent exploitation in Texas as these are tight-shale reservoirs (Pollastro et al., 2007).Zones with karst-induced cavern collapses form a drilling and completion hazard forthe mainly horizontal drilling programs in these tight-shale reservoirs and mustbe mapped. They may affect local fracture densities and thus permeabilities andreservoir drainage positively but can also lead to fluid barriers due to reservoir com-partmentalization.
The shallower clastic Bend Conglomerates are of Middle Pennsylvanian (Atokan)age. The formation has a thickness of 300-360 m in this area with depths between1370 to 1830 m. It was targeted throughout the 1980s and 1990s as it containsseveral gas and oil-bearing reservoirs in a stacked fashion. Hardage et al. (1996a,b)describe how the karstification has greatly impacted the system tracts and sedimenta-tion patterns in the Bend formation which were characterized by low accommodationspace. Resulting reservoir compartmentalization is a significant challenge for thisformation and has also affected the reflector character. Reflection near the base ofthis formation display both reflector weakening and sometimes even polarity reversalsin areas depressed due to local sagging. Acquisition and processing of this datasetare described by Hardage et al. (1996a). A stacked section is shown in Figure 7. Azero-phase correction has been applied to the data but has left regions with variablelocalized phase.
Our processing sequence is similar to the one used in Figure 5. First, we apply anumber of phase rotations with different angles and compute local skewness for eachrotation. The regularization lengths in this examples were 500 samples or 0.5 s in timeand 50 traces in space. The result is displayed in Figure 8. Next, we apply automaticpicking with the algorithm described by Fomel (2009) to extract the nonstationaryphase rotation that maximizes the local skewness. Finally, the phase correction isapplied to the data, with the result displayed in Figure 9. A zoomed-in comparisonshows the effects of non-stationary phase correction: rotating major seismic eventsto zero degrees and improving their continuity. These effects can be useful both forimproving structural interpretation and for improved matching of seismic data andwell logs.
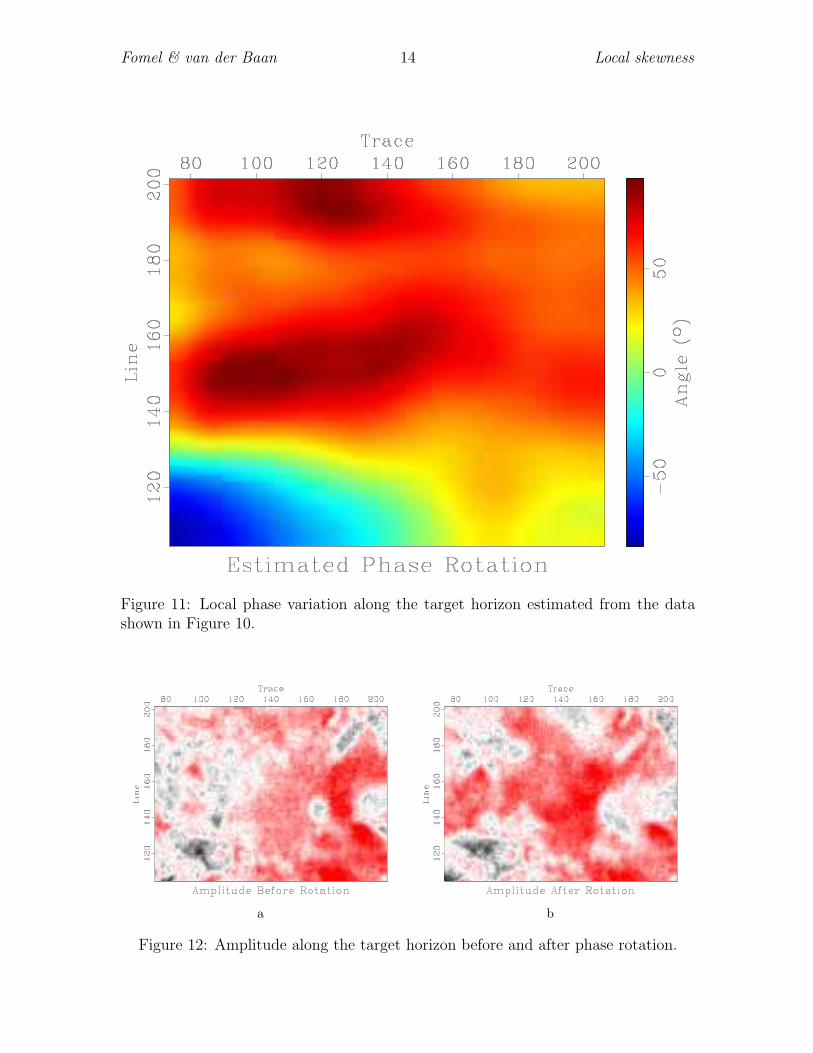
We applied the local phase detection to the 3-D volume in a window centered onthe target horizon (Figure 10). The estimated local phase variation along the targethorizon is shown in Figure 11. Comparing the amplitude before and after phasecorrection (Figure 12), we observe a noticeable improvement in event continuity. Oncethe processing and interpretation are done on the zero-phase-corrected volume, it iseasy to restore the original phase by applying the inverse phase rotation.

Fomel & van der Baan 12 Local skewness
Figure 9: Zoomed-in comparison of the data before phase correction (a) and afterphase correction (b). Nonstationary phase correction helps in identifying significanthorizons and increasing their resolution in time.

Fomel & van der Baan 13 Local skewness
Figure 10: Boonsville dataset windowed around the target horizon.
Fomel & van der Baan 14 Local skewness
Figure 11: Local phase variation along the target horizon estimated from the datashown in Figure 10.
a b
Figure 12: Amplitude along the target horizon before and after phase rotation.

Fomel & van der Baan 15 Local skewness
DISCUSSION
The data example as well as the previous case studies by Van der Baan et al. (2010b)underline how analysis of the local phase can be used as a complementary attributeto spectral decomposition to highlight variations in wavelet character. There are twocomplimentary applications, namely analysis of the propagating and locally observedwavelets. The targeted wavelet type is determined by the chosen regularization length:the propagating wavelet is estimated by using long temporal regularization lengths,and the locally observed one from shorter lengths. The underlying assumption isthat, for long regularization lengths, variations in the local geology are averaged out,revealing only the propagating wavelet. In this paper, we used relatively short regu-larization lengths as the aim is to highlight changes in the local reflection character.
Well-log analyses have demonstrated that the Earth’s reflectivity series is non-Gaussian (Walden and Hosken, 1986) and, to first order, white (Walden and Hosken,1985). In addition, impedances tend to increase with depth, hence positive reflec-tion coefficients are slightly more likely than negative one, producing an asymmetricreflectivity distribution. Statistically, the skewness-based criterion assumes that theEarth’s reflectivity series are white and asymmetric. This is in contrast to kurtosisused previously by Van der Baan and Fomel (2009), which assumes a non-Gaussianreflectivity series. Both the non-Gaussianity and asymmetry assumptions seem war-ranted but may fail if the local reflectivity series becomes respectively purely Gaussianor symmetric.
The local skewness attribute has the advantage over kurtosis because of its higherdynamic range, which facilitates picking. Variance is the second statistical order,skewness is the third one, and kurtosis is related to the fourth order. Estimationvariances increases with the order of a moment (Mendel, 1991). In other words,less samples are needed to estimate skewness with the same accuracy as kurtosis.We hypothesize that this contributes to the higher dynamic range of the skewnesscriterion.
CONCLUSIONS
We have presented a novel approach to nonstationary identification of apparent (lo-cally observed) phase. Our approach is based on a new attribute, local skewness. Insynthetic and field-data examples, local skewness exhibits a tendency to pick focusedsignals and a higher dynamical range than the previously used local kurtosis. Its com-putation involves a local similarity between the input signal and its square. Practicalapplications of using local skewness for zero-phase correction of seismic signals shouldbe combined with well-log analysis in order to better separate the locally-observedphase from the propagating-wavelet phase.

Fomel & van der Baan 16 Local skewness
ACKNOWLEDGMENTS
We thank Milo Backus, Guochang Liu, Mike Perz, and Hongliu Zeng for stimulatingdiscussions.

Fomel & van der Baan 17 Local skewness
REFERENCES
Brown, A. R., 1999, Interpretation of three-dimensional seismic data: AAPG andSEG.
Bulmer, M., 1979, Principles of statistics: Dover Publications.Claerbout, J. F., 1992, Earth Soundings Analysis: Processing Versus Inversion: Black-
well Scientific Publications.Donoho, D., 1981, On minimum entropy deconvolution, in Applied time series analysis
II: Academic Press, 565–608.Fomel, S., 2007a, Local seismic attributes: Geophysics, 72, A29–A33.——–, 2007b, Shaping regularization in geophysical-estimation problems: Geo-
physics, 72, R29–R36.——–, 2009, Velocity analysis using AB semblance: Geophysical Prospecting, 57,
311–321.Fomel, S., and L. Jin, 2009, Time-lapse image registration using the local similarity
attribute: Geophysics, 74, A7–A11.Fomel, S., E. Landa, and M. T. Taner, 2007, Post-stack velocity analysis by separation
and imaging of seismic diffractions: Geophysics, 72, U89–U94.Fomel, S., and M. van der Baan, 2010, Local similarity with the envelope as a seismic
phase detector, in 80th Ann. Internat. Mtg: Soc. of Expl. Geophys., 1555–1559.Hardage, B. A., D. L. Carr, D. E. Lancaster, J. L. Simmons Jr, R. Y. Elphick, V. M.
Pendleton, and R. A. Johns, 1996a, 3-D seismic evidence of the effects of carbonatekarst collapse on overlying clastic stratigraphy and reservoir compartmentalization:Geophysics, 61, 1336–1350.
Hardage, B. A., D. L. Carr, D. E. Lancaster, J. L. Simmons Jr, D. S. Hamilton, R. Y.Elphick, K. L. Oliver, and R. A. Johns, 1996b, 3-D seismic imaging and seismicattribute analysis of genetic sequences deposited in low-accommodation conditions:Geophysics, 61, 1351–1362.
Kazemeini, S. H., C. Juhlin, and S. Fomel, 2010, Monitoring CO2 response on surfaceseismic data; a rock physics and seismic modeling feasibility study at the CO2
sequestration site, Ketzin, Germany: Journal of Applied Geophysics, 71, 109–124.Levy, S., and D. W. Oldenburg, 1987, Automatic phase correction of common-
midpoint stacked data: Geophysics, 52, 51–59.Liu, G., S. Fomel, and X. Chen, 2011a, Stacking angle-domain common-image gathers
for normalization of illumination: Geophysical Prospecting, 59, 244–255.——–, 2011b, Time-frequency analysis of seismic data using local attributes: Geo-
physics, 76, P23–P34.Liu, G., S. Fomel, L. Jin, and X. Chen, 2009, Stacking seismic data using local
correlation: Geophysics, 74, V43–V48.Mendel, J. M., 1991, Tutorial on higher-order statistics (spectra) in signal processing
and system theory: Proc. IEEE, 79, 278–305.Pollastro, R. M., D. M. Jarvie, R. J. Hill, and C. W. Adams, 2007, Geologic framework
of the Mississipian Barnett Shale, Barnett-Paleozoic total petroleum system, Bend-arch–Fort Worth Basin, Texas: AAPG Bulletin, 91 (4), 405–436.
Robinson, E. A., and S. Treitel, 2000, Geophysical signal analysis: Society Of Explo-

Fomel & van der Baan 18 Local skewness
ration Geophysicists.Schoenberger, M., 1974, Resolution comparison of minimum-phase and zero-phase
signals: Geophysics, 39, 826–833.Van der Baan, M., 2008, Time-varying wavelet estimation and deconvolution using
kurtosis maximization: Geophysics, 73, V11–V18.Van der Baan, M., and S. Fomel, 2009, Nonstationary phase estimation using regu-
larized local kurtosis maximization: Geophysics, 74, A75–A80.Van der Baan, M., S. Fomel, and M. Perz, 2010a, Nonstationary phase estimation:
A tool for seismic interpretation?: The Leading Edge, 29, 1020–1026.Van der Baan, M., M. Perz, and S. Fomel, 2010b, Nonstationary phase estimation for
analysis of wavelet character, in 72nd Conference and Exhibition: EAGE, D020.Walden, A. T., and J. W. J. Hosken, 1985, An investigation of the spectral properties
of primary reflection coefficients: Geophys. Prospect., 33, 400–435.——–, 1986, The nature of the non-gaussianity of primary reflection coefficients and
its significance for deconvolution: Geophys. Prospect, 34, 1038–1066.White, R. E., 1988, Maximum kurtosis phase correction: Geophysical Journal, 95,
371–389.Wiggins, R., 1978, Minimum entropy deconvolution: Geoexploration, 16, 21–35.Xu, Y., P. Thore, and S. Duchenne, 2012, The reliability of the kurtosis-based wavelet
estimation, in SEG Technical Program Expanded Abstracts 2012: Society of Ex-ploration Geophysicists.
Zeng, H., and M. M. Backus, 2005, Interpretive advantages of 90◦-phase wavelets.Part 1: Modeling: Geophysics, 70, C7–C15.
Zhang, R., X. Song, S. Fomel, M. K. Sen, and S. Srinivasan, 2013, Time-lapse seismicdata registration and inversion for CO2, sequestration study at Cranfield: Geo-physics, 78, B329–B338.